![Untitled-1 [] · 2020. 9. 28. · TMR INFRA PRIVATE LIMITED Corporate Office: 313 to 316, 3rd Floor, 3rd Block, West Wing, White House, Kundanbagh, Begumpet, Hyderabad - 500016. info@tmrinfra.com](https://static.fdocuments.in/doc/165x107/611158a33f31404d2d274332/untitled-1-2020-9-28-tmr-infra-private-limited-corporate-office-313-to.jpg)
RIGHT TO FOOD IN INDIAwp_50.pdf · RIGHT TO FOOD IN INDIA S. Mahendra Dev CENTRE FOR ECONOMIC AND...
77
RIGHT TO FOOD IN INDIA S. Mahendra Dev CENTRE FOR ECONOMIC AND SOCIAL STUDIES Begumpet, Hyderabad-500016 Working Paper No. 50 August, 2003
Transcript of RIGHT TO FOOD IN INDIAwp_50.pdf · RIGHT TO FOOD IN INDIA S. Mahendra Dev CENTRE FOR ECONOMIC AND...

RIGHT TO FOOD IN INDIA
S. Mahendra Dev
CENTRE FOR ECONOMIC AND SOCIAL STUDIES Begumpet, Hyderabad-500016
Working Paper No. 50August, 2003

RIGHT TO FOOD IN INDIA
S. Mahendra Dev
Abstract
The objective of this paper is to examine right to food in the Indian context. We analyse the
right to food in terms of availability, accessibility, adequacy and sustainability. These are
examined in terms of equity and justiciability. The study is different from the earlier studies
on food security as it is based on human rights approach. The issue of food is approached from
the rights perspective. Specifically, the paper addresses the following questions:
(a) What are the definitions, contents and obligations of right to food?
(b) How far India progressed in fulfilling right to food?
(c) What are the programmes and policies India followed in achieving right to food?
(d) What should be done to achieve right to food to all citizens of India?
Progress is examined in terms of availability, accessibility (physical and economic). policies
and Programmes are scrutinized in terms of obligation to respect, protect and fulfill (facilitate
and provide).
India is signatory to many international treaties involving right to food. Indian Constitution
also indirectly refers to right to food. Therefore, there is an obligation for the Indian Government
(Centre and states) to fulfill the right to food of the people. In spite of many programmes,
there are concerns regarding food and malnutrition. Some of the worst violations of the right
to food can be seen in India today. We examined the problems of various welfare programmes.
In order to realise right to provide, the following programmes have to be strengthened and
implemented effectively.
(a) Public Distribution system and Annapurna schemes; (b ) Extending Antyodaya Anna
Yojana to all the destitutes in the country.; (c) Nutrition programmes for education (mid-day
meal schemes) and Integrated child development schemes (ICDS); (d) Extending Maharashtra’s
Employment Guarantee Scheme (EGS) throughout India. Part of the wages can be paid as
food; (e) Gender aspects of food security should be given importance in realizing right to food.
Women’s economic and social empowerment not only improves intra-household food distribution
and health related matters but also improves the working of food and nutrition programmes.
i

We also examined the market reforms needed for achieving higher and sustainable growth in
agriculture and right to food for the poor. All the things have to be based on rights based
framework of equality, non-discrimination, transparency, accountability and participation
(ENTAP). Better monitoring systems have to be developed at Central, state, district and village
levels to realize right to food. Justiciability is one aspect of right to food. In this context,
recent Supreme Court Orders and the Right to Food to campaign are in the right direction.
However, one (particularly the poor) cannot go to court every time right to food is violated. It
is the responsibility of citizens and NGOs to organize campaigns for better functioning of the
programmes. Also there is a need for better delivery systems by the government with transparency
and public accountability. Other rights such as right to health and education, right to information
etc are equally important to realize right to food. We have to focus more on demand side
(social mobilization, accountability etc.) in the rights approach. Finally, the paper argues that
right to employment is crucial for achieving right to food.
This paper was written as part of the project on ‘Right to Development in India’ of the Centrefor Development and Human Rights (CDHR), New Delhi and FXB Centre for Health and HumanRights , Harvard School of Public Health, Boston, U.S.A. Earlier drafts of this paper have beenpresented and discussed at two workshops organized by CDHR at New Delhi in 2002 and 2003and a seminar at Centre for Economic and Social Studies. Thanks are due to participants fortheir observations at these meetings. The author is grateful particularly to Arjun Sengupta,N.J.Kurian, Stephen Marks, Jean Dreze and Jos Mooij for their comments on the earlier drafts.
ii
RIGHT TO FOOD IN INDIA
S.Mahendra Dev
1. INTRODUCTION
Right to food is part of an overall goal of achieving right to development. The adoption
by the United Nations in 1986 of the Declaration on the Right to Development was
the culmination of a long process of international deliberation on human rights which
were perceived from the very beginning as an integrated whole of all civil, political,
economic, social and cultural rights1 . The Declaration says “ The Right to Development
is an inalienable human right by virtue of which every human person and all peoples
are entitled to participate in and contribute to and enjoy economic, social, cultural,
and political development in which all human rights and fundamental freedoms can
be fully realized” (Article 1, Paragraph 1). Because of its association with justice
and equity, the Right to development is fundamentally different from conventional
policies and progress for development, whether seen as increasing the growth of
GNP, supplying basic needs, or improving the index of human development. The
rights based approach imposes additional constraints on the development process,
such as maintaining transparency, accountability, equity and non-discrimination in
all the programmes. The individuals must have equal opportunity of access to the
resources for development and receive fair distribution of the benefits of development.
1 See Sengupta (2000, 2000a, 2002), Marks (2000) and Franciscans International (1999-
2002). The right to development , as adopted by the Declaration and reaffirmed in the
Vienna Declaration of 1993, reunified all these rights into an integrated and interde-
pendent set of human rights, identified with a process of development. Osmani (2000)
deals with a set of issues related to the human rights to food, health and education. He
elucidates the philosophical underpinning of these rights, by using the conceptual
framewok of capabilities developed by Amartya Sen. In this context, the notion of
‘capability rights as goal rights’ is elaborated and contrasted with a popular version of
libertarian rights. In this context see Sen (1982 and 1985).
1
Another important thing is that the right to development approach confers unequivocal
obligation on duty-holders: individuals in the community, states at the national level,
and states at the international level2 . Nation states have the responsibility to help
realize the process of development through appropriate development policies.
Although all rights are important, right to food plays a pivotal role in the rights based
approach to development. The objective of this paper is to examine right to food in
the Indian context. We analyse the right to food in terms of availability, accessibility,
adequacy and sustainability. These will be examined in terms of equity and justiciability.
The study is different from the earlier studies on food security because it is based
on human rights approach. The issue of food is approached from the rights perspective.
Specifically, the paper addresses the following questions:
(a) What are the definitions, contents and obligations of right to food? (Section 2)
(b) How far India progressed in fulfilling right to food? (Section 3)
(c) What are the programmes and policies India followed in achieving right to food?
(Section 4)
(d) What should be done to achieve right to food to all citizens of India? (Section 5)
2. DEFINITION, CONTENTS AND OBLIGATIONS OF RIGHT TO FOOD
In order to analyse right to food it is important to be clear about the definition,
contents and obligations. This section covers these aspects.
2.1. Definition
The evolution of the human right to food derives from the larger human right to an
adequate standard of living given in the Universal Declaration of Human Rights
(UDHR), 1948. Article 25 (1) of the UDHR asserts that ‘everyone has the right to a
standard of living adequate for the health and well-being of himself and his family
including food, clothing, and housing..’. In several other international instruments,
the right to food is recognized as part of the right to an adequate standard of living,
focusing especially on the need for freedom from hunger. The Preamble to the
Constitution of the Food and Agricultural Organisation (FAO) 1965, declared that
‘ensuring humanity’s freedom from hunger’ is one of its basic purposes.
2. See Sengupta (2000a)
2

The right to food, and the measures that must be taken, are laid out quite clearly in
article 11 of the International Covenant on 3 Economic, social and cultural rights.
Paragraph 1 calls on States to “recognize the right of everyone to an adequate
standard of living for himself and his family, including adequate food… and the
continuous improvement of living conditions”. Paragraph 2 is more precise, as it
demands that States guarantee the fundamental right of everyone to be free from
hunger, and asks them to take “individually and through international co-operation,
the measures, including specific programmes, which are needed : (a) to improve
methods of production, conservation and distribution of food by making full use of
technical and scientific knowledge, by disseminating knowledge of the principles of
nutrition and by developing or reforming agrarian systems in such a way as to achieve
the most efficient development and utilization of natural resources; (b) taking into
account the problems of both food-importing and food exporting countries, to ensure
an equitable distribution of world food supplies in relation to need”. The UN Convention
on the Rights of the Child (CRC), 1989, goes beyond hunger and addresses the
issue of child nutrition.
Towards the late 1990s, work on the human right to adequate food at the global level
centred on a mandate from the World Food Summit (WFS) held in Rome in 1996. The
summit adopted a Plan of Action aimed at reducing the number of undernourished
people to half their number by 2015. The Plan of Action contained seven commitments
that were to act as guiding principles to all those involved in formulating the policies
to implement the Plan at the national and international levels and spelt out objectives
and actions for the implementation of these commitments. Objective 7.4 (under
commitment 7) stipulates the need ‘ to clarify the content of the right to adequate
food and the fundamental right of everyone to be free from hunger…’. It also called
upon UN commissioner for Human Rights ‘to better define the rights related to food
in Article 11 of the Covenant and to propose ways to realize these rights’
The operational concept of right to food as used by FAO is that of food security
which says ‘food security exists when all people, at all times have physical and
economic access to sufficient, safe and nutritious food to meet their dietary needs
and food preferences for an active and healthy life.
3. More on this see Ziegler (2002), Osmani (2000)
3
During the World Food Summit at Rome, the plenary of the parallel NGO forum
proposed a Code of Conduct (CoC) on the Right to Adequate Food. The Code of
Conduct (CoC) discusses the normative content of the Right to Adequate Food, the
corresponding obligations of state and non-state actors, the role of civil society and
the means and methods of implementation.
Article 4 of the Normative Content states that “The right to adequate food means
that every man, woman, and child alone and in community with others must have
physical and economic access at all times to adequate food or by using a resource
base appropriate for its procurement in ways consistent with human dignity.” Article
4 further states that the realization of the right to adequate food requires: (a) the
availability of food, free from adverse substances and culturally acceptable, in a
quantity and quality which will satisfy the nutritional and dietary needs of individuals;
(b) the accessibility of such food in ways that do not interfere with the enjoyment of
other human rights and that is sustainable.
The CoC specified that the ultimate objective of the right to adequate food is the
achievement of nutritional well being. It, therefore, states that the right to food needs
to be understood in a much broader sense as the right to adequate food and nutrition.
The CoC was recognized by the Office of the UN High Commissioner for Human
Rights (OHCHR) and a series of expert consultations, conferences, studies steadily
clarified the meaning of the human right to food. This finally culminated in the publication
in May 1999 by the UN Committee on Economic, social and Cultural Rights of its
General Comment 12 (GC12), considered to be the most authoritative interpretation
of the right to adequate food. While reaffirming the definition of the CoC, it added –
“the right to adequate food shall, therefore, not be interpreted in a narrow or restrictive
sense which equates it with a minimum package of calories, proteins and other
specific nutrients. The right to adequate food will have to be realized progressively”.
2.2. The Content of Right to Food
The General Comment 12 (GC12) says that the core content of the right to food is
availability and accessibility. The availability also includes adequacy and acceptability.
2.2.1 Availability
The notion of availability as set out in GC 12 is as follows:
(a) Feeding oneself directly from the productive land or other natural resources
4

(b) a well-functioning processing and distribution system that can move food from
the site of production to where it is needed in accordance with demand.
According to Asjborn Eide, senior fellow of the Norwegian Institute of Human Rights,
it is not enough for the foodstuffs to be physically available. They also have to
satisfy the following criteria in order to qualify as adequate:
(a) satisfy the dietary needs (energy and nutrients including the micronutrients like iron,
vitamin and iodine);
(b) be culturally acceptable (fit in with prevailing food or dietary culture);
(c) be safe (free of toxic elements and contaminants); and
(d) be of good quality (in terms of, for example taste and texture)
2.2.2. Accessibility
The notion of accessibility in GC12 incorporates both physical and economic
accessibility
Economic accessibility implies that the personal or household financial cost
associated with the acquisition of food for an adequate diet should not be so high as
to compromise on other basic needs. As the resources available to an individual or
household are limited, an increase in the cost of acquisition of food for an adequate
diet could lead to a cutting back on other items of essential expenditure. However,
socially vulnerable groups such as landless persons and other impoverished segments
of the population may need attention through special programmes to facilitate
economic accessibility.
Physical accessibility means that adequate food must be accessible to everyone.
The sections of the population deserving special attention and priority consideration
in this respect have been identified as the physically and mentally vulnerable which
may include infants and young children, elderly people, the physically disabled, the
terminally ill and people with persistent medical problems. The victims of natural
disasters or people living in disaster-prone areas and other disadvantaged groups
have also been identified as deserving special attention.
The right to food also contains an element of sustainability. Adequate food must
also be accessible in ways that are sustainable, that is, the long-term availability as
well as accessibility of food must be ensured.
5
2.3. Obligations of the State
The enjoyment of the right to food depends on several factors, ranging from access
to land to sufficient income-earning opportunities. The Committee on Economic,
Social and Cultural Rights (ICESCR) has entrusted national governments with the
primary responsibility of ensuring the right to food. Under the right to food, there are
three different levels of obligation – the obligations to respect, protect and fulfill the
right to food.
The obligation to respect, as set out in Para 15 of General Comment 12, means that
State parties should not take measure that would hinder the access to adequate
food. In other words, States must not interfere with individual’s livelihoods. Or, as
Asjborn Eide explains, the States should, at the primary level, “respect the resources
owned by the individual and the individual’s freedom” to find:
(a) a job of his or her preference,
(b) make optimal use of his or her own knowledge
(c) take necessary actions and use necessary resources (alone or in association with others)
to satisfy her or his needs.
The obligation to protect means that the state has to ensure that non-state actors
(enterprises or individuals) do not deprive other individuals or group of their access
to adequate food. So, rather than passively acknowledging the rights and freedoms
of individuals, the state has to take due account of and action against any negative
interference of a third party in the efforts of the individuals or groups to satisfy their
needs. As Eide argues, the State at the secondary level is also obliged to provide
active protection against other more assertive or aggressive subjects, in particular
against more economic interests. These sections could be exercising fraud, displaying
unethical behaviour in trade and contractual relations, or be involved in marketing
and dumping of hazardous or dangerous products and unfair market practices, such
as ‘withholding price information or creating monopolies’.
The obligation to fulfill includes the obligation to facilitate and the obligation to provide.
The obligation to facilitate means that the State must be proactive in strengthening
people’s access to food and utilization of resources and means to access to food.
The obligation to provide means that States must fulfill the right directly whenever
an individual or group is unable, for reasons beyond their control, to enjoy the right to
6

adequate food with the means at their disposal.
Eide maintains that the facilitation may take the form of improving measures of
production, conservation and distribution of food through complete utilization of
technical and scientific knowledge and by developing or reforming the agrarian system.
He has also identified the situations in which states must undertake direct provision
of food or resources (through direct food aid or social security):
(a) emergencies like severe drought or floods, armed conflict or the collapse of
economic activities within a particular region of a country;
(b) normal circumstances like unemployment on account of economic recession,
old age infirmity, disability, marginalisation of a section of population (e.g. due to
structural transformation in the economy and production).
The core obligation in the case of the right to food relates to the State taking the
necessary action to mitigate and alleviate hunger as provided for in Article 11 (2) of
the ICESCR which recognizes the ‘fundamental right of everyone to be free from
hunger’ even in times of natural and other disasters.
Violation of right to food
General Comment No.12 also refers to violations of the right to food, which occur
when the state fails to ensure the satisfaction of, at the very least, the minimum
essential level required to be free from hunger. Moreover, if a State claims it is
unable to fulfill its obligation for reasons beyond its control (e.g. resource constraints),
it has to demonstrate to CESCR that ‘it has done everything in its power to ensure
access to food, including appealing for support from the international community’.
Violation of the right to food includes discrimination in the access to food as well to
means and entitlements for its procurement ‘on the grounds of race, colour, sex,
language, age, religion, political or other opinion, national or social origin, property,
birth or other status’ in a manner that impedes the exercise of economic, social and
cultural rights.
Implementing the right to food
Since the means of implementing the right to food vary across nations, GC 12
requires State parties to develop a national strategy to ensure food and nutrition
security for all, based on human rights principles. At the international level, States
are required to recognize the essential role of international cooperation and to comply
7

with their commitment to take joint and separate action to achieve the full realization
of the right to adequate food.
3. PROGRESS ON RIGHT TO FOOD
As mentioned above, the content of right to food refers to availability, accessibility,
adequacy and sustainability. We will examine the progress in the indicators relating
to the contents of right to food in India. Availability, Accessibility and sustainability
are not separate phenomena - they overlap. Food production is linked to livelihood
access, food access and food consumption. Livelihood access in turn influences
the demand for food and better prices and incentives for production. Better livelihood
access also leads to better education, better living standards, better sanitation, and
better knowledge of nutrition, better absorption and better health. For achieving
accessibility it is also important that the poor have sufficient means to purchase
food. The purchasing power of the poor to buy food can be ensured in two ways. One
way is Government directly providing food or income support in the form of foodgains
at subsidised prices, nutrition programmes, employment programmes. The other
way is to increase purchasing power by facilitating creation of productive employment
through sectoral development. Here right to employment or livelihood is important.
3.1. Availability
3.1.1Foodgrain production
One achievement of India is that it achieved self sufficiency of food grains at the
national level. After remaining a food deficit country for about two decades after
independence, India has not only become self sufficient in foodgrains but now has a
surplus of foodgrains (GOI, 2003). The situation improved gradually after the mid-
1960s with the introduction of high yielding varieties (HYVs) of crops, and the
development of agriculture infrastructure for irrigation, input supply, storage and
marketing. The era of all-round development on the agriculture front has been called
the Green Revolution. The foodgrains production increased from about 50 million
tonnes in 1950-51 to around 211 million tonnes in 2001-02. The production of oilseeds,
cotton, sugarcane, fruits, vegetables and milk also increased appreciably.
However, in spite of the spectacular achievements, various constraints and disturbing
trends continue to hamper the requisite growth of the agricultural sector. During the
1990s (1989-90 to 1999-00), the growth of agriculture decelerated as compared to
the 1980s (1979-80 to 1989-90). The growth rate of foodgrains production declined to
8

1.92% per annum from 3.54% per annum. The growth rate of productivity in foodgrains
decelerated to 1.32% in the 1990s as compared to 3.3% in the 1980s. The overall
growth rate of crop production declined from 3.72% to 2.29% and productivity from
2.99% to 1.21% per annum.
3.1.2 Per capita Availability
The per capita net availability of foodgrains increased only about 10 per cent over
the last 50 years (see Table 1). During the same period, per capita availability of
pulses declined significantly. On the other hand, per capita availability of sugar and
edible oils has increased over time. In the 1990s, per capita availability of foodgrains
has not increased because of 60 million tonnes accumulation of foodgrains by the
government and due to exports.
Table 1. Net Availability of Cereals and Pulses
Year Per capita net availability Edible oil Vanaspati Sugarper day (grams) (Kg.) (Kg.) (Nov.-Oct.)
(Kg.)Cereals Pulses Total
Foodgrains
1951 334.2 60.7 394.9 2.5* 0.7* 5.0*1961 399.7 69.0 468.7 3.2 0.8 4.81971 417.6 51.2 468.8 3.5 1.0 7.41981 417.3 37.5 454.8 3.8 1.2 7.31990 435.3 41.1 476.4 5.3 1.1 12.31991 468.5 41.6 510.1 5.5 1.0 12.71992 434.5 34.3 468.8 5.4 1.0 13.01993 427.9 36.2 464.1 5.8 1.0 13.71994 434.0 37.2 471.2 6.1 1.0 12.51995 457.6 37.8 495.4 6.3 1.0 13.21996 443.4 32,8 476.2 7.0 1.0 14.11997 468.2 37.3 505.5 8.0 1.0 14.61998 417.3 33.0 450.3 6.2 1.0 14.51999 433.5 36.9 470.4 8.5 1.3 14.92000 426.0 32.0 458.0 9.1 1.3 15.6
2001(P) 390.6 26.4 417.0 8.0 1.4 15.8
* Pertains to the year 1955-56.
(P) Provisional.
Source: Economic Survey 2001-2002, Government of India.
9

3.1.2. Changes in Consumption Patterns and demand for non-cereal food
In spite of increase in per capita real expenditures during the period 1972-73 to 1999-
00, the per capita cereal intake declined in both rural and urban areas. However, the
fall in cereal consumption was offset by increase in the consumption of non-cereal
food. It is now widely recognised that the food basket is more diversified and dramatic
changes in food consumption patterns have taken place in India in the post-green
revolution period. For example, at the all India level, cereal consumption declined
from 15.3 kilograms per capita per month in 1972-73 to 12.7 kgs per capita per
month in 1999-00 in rural areas4 . This is true for all classes (rich and poor). The
cereal shares have seen a dramatic decline of more than 10 percentage points
(between 1972-73 to 1993-94) in most regions – in both rural and urban India. Similarly,
the share of meat and milk products, and vegetables and fruits has increased over
time. Table 2 shows the following trends.
(a) Cereal consumption has declined for all the classes
(b) Rice consumption has not declined for the bottom 30%
(c) Wheat consumption has been stagnant for the bottom 30%
(c) Coarse cereal consumption has declined for all the classes
(d) Budget share of non-cereal food has increased for all classes; the consumption of
non-cereal food increased in constant prices even for the bottom 30%.
(e) Budget share of non-food has increased for all classes
It may be noted that changes in consumption patterns may reflect substitution away
from cereals to other food items as income rise. Deaton and Dreze (2002) with the
help of data collected by National Nutrition Monitoring Bureau (NNMB) show the
substitution from cereals towards other food items with rising per capita incomes.
According to some projections, the household demand for foodgrains would increase
from 155 mt. in 2000 to 240 mt. In 2020; for milk and milk products from 64 mt. to 166
mt. and fruits and vegetables from 48 mt. to 113 mt. (Radhakrishna, 2002). The per
capita availability of fruits was 58 grams per day and 179 grams per day for vegetables.
Table 2 provides per capita availability and deficit of milk, egg and meat. It shows
the need for increase in availability of non-cereal food. In terms of per capita
availability non-cereal food like fruits, vegetables, milk, meat and fish India
has not achieved self sufficiency.
4. For more details on changing consumption patterns, see Rao, CHH (2000)
10

Table 2: Changes in Consumption Patterns: 1972-73 to 1999-00
Rice (Kg/month)
Decile Group 1972-73 1977-78 1983 1987-88 1993-94 1990-00
Lowest 30% 4.82 5.17 4.44 5.74 6.10 6.60Middle 40% 6.91 7.57 7.01 7.42 7.54 7.02Top 30% 7.93 8.48 8.32 7.83 7.28 6.64All 6.59 7.12 6.63 7.04 7.02 6.78
Wheat (kg/month)
Decile Group 1972-73 1977-78 1983 1987-88 1993-94 1990-00Lowest 30% 2.09 2.33 3.40 3.71 3.38 3.44Middle 40% 3.58 3.73 4.18 4.70 4.17 4.47Top 30% 6.08 6.20 5.90 6.49 5.73 5.76All 3.88 4.05 4.46 4.94 4.40 4.55
Other Cereals (kg/month)
Decile Group 1972-73 1977-78 1983 1987-88 1993-94 1990-00
Lowest 30% 4.45 3.92 4.11 2.82 2.28 1.41Middle 40% 4.83 3.94 3.61 2.44 1.90 1.45Top 30% 5.07 4.41 3.43 2.23 1.76 1.30All 4.79 4.08 3.71 2.49 1.98 1.39
Total Cereals (kg/month)
Decile Group 1972-73 1977-78 1983 1987-88 1993-94 1990-00
Lowest 30% 11.36 11.42 11.95 12.27 11.76 11.44Middle 40% 15.32 15.24 14.80 14.56 13.61 12.95Top 30% 19.08 19.09 17.65 16.55 14.77 13.69All 15.26 15.25 14.80 14.47 13.40 12.72
Budget Share of Food
Decile Group 1972-73 1977-78 1983 1987-88 1993-94 1990-00
Lowest 30% 81.22 79.50 75.94 74.21 69.76 62.71Middle 40% 78.36 76.01 72.27 70.74 66.82 60.14Top 30% 66.61 57.38 59.37 57.32 53.86 51.92All 72.76 66.38 66.29 64.38 60.77 56.60
Expenditure on Non-cereal food (Rs. 0.00) /month 1990-91 prices
Decile Group 1972-73 1977-78 1983 1987-88 1993-94 1990-00
Lowest 30% 29.64 30.30 32.58 34.77 36.20 34.74Middle 40% 35.41 35.55 37.33 39.45 40.40 40.16Top 30% 38.74 34.86 38.38 39.41 38.76 41.60All 36.26 34.43 37.16 38.71 38.91 39.95
Source: NSS Consumer Expenditure Surveys
11
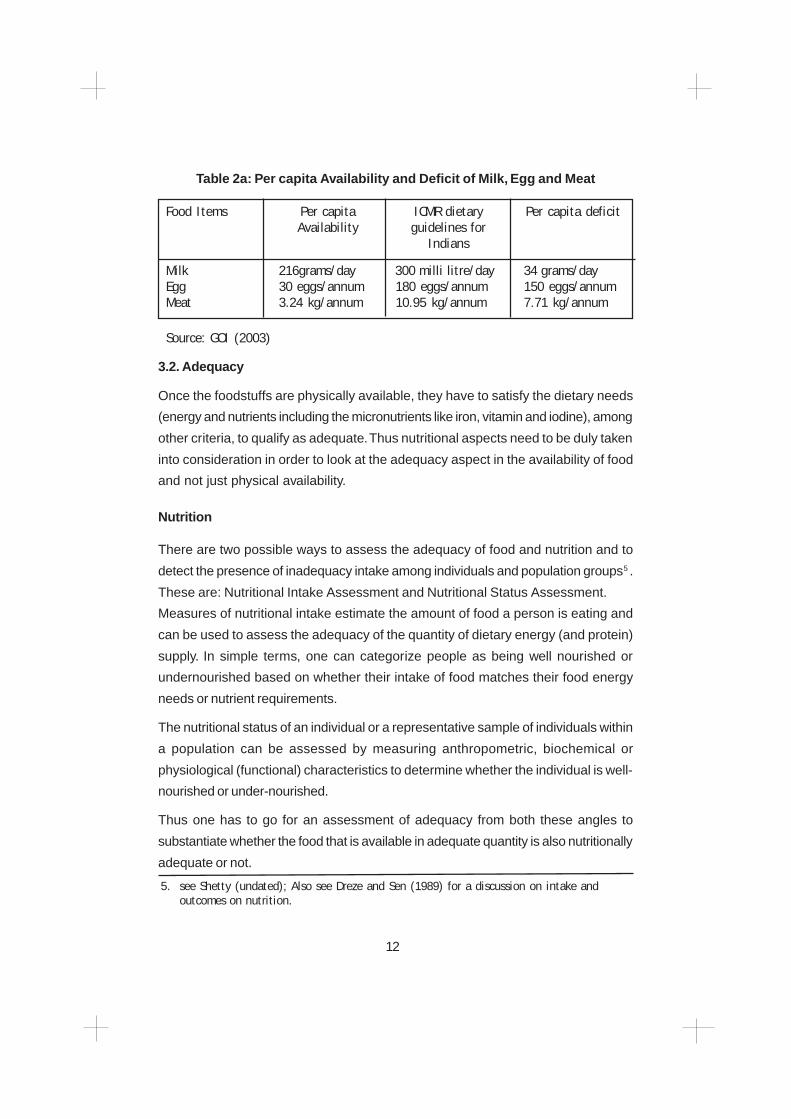
Table 2a: Per capita Availability and Deficit of Milk, Egg and Meat
Food Items Per capita ICMR dietary Per capita deficitAvailability guidelines for
Indians
Milk 216grams/day 300 milli litre/day 34 grams/dayEgg 30 eggs/annum 180 eggs/annum 150 eggs/annumMeat 3.24 kg/annum 10.95 kg/annum 7.71 kg/annum
Source: GOI (2003)
3.2. Adequacy
Once the foodstuffs are physically available, they have to satisfy the dietary needs
(energy and nutrients including the micronutrients like iron, vitamin and iodine), among
other criteria, to qualify as adequate. Thus nutritional aspects need to be duly taken
into consideration in order to look at the adequacy aspect in the availability of food
and not just physical availability.
Nutrition
There are two possible ways to assess the adequacy of food and nutrition and to
detect the presence of inadequacy intake among individuals and population groups5 .
These are: Nutritional Intake Assessment and Nutritional Status Assessment.
Measures of nutritional intake estimate the amount of food a person is eating and
can be used to assess the adequacy of the quantity of dietary energy (and protein)
supply. In simple terms, one can categorize people as being well nourished or
undernourished based on whether their intake of food matches their food energy
needs or nutrient requirements.
The nutritional status of an individual or a representative sample of individuals within
a population can be assessed by measuring anthropometric, biochemical or
physiological (functional) characteristics to determine whether the individual is well-
nourished or under-nourished.
Thus one has to go for an assessment of adequacy from both these angles to
substantiate whether the food that is available in adequate quantity is also nutritionally
adequate or not.
5. see Shetty (undated); Also see Dreze and Sen (1989) for a discussion on intake andoutcomes on nutrition.
12

Nutritional Intake Assessment
Calories and Protein
The per capita calorie intake for rural population declined from 2364 kcal per day in
1987-88 to 2030 kcal per day in 1999-00 (Table 3). For the bottom 30% of the
population, the calorie intake increased up to 1993-94 and declined in 1999-00. In
the year 1999-00, the calorie intake was 1626 kcal per day for the bottom 30% of
population. This level is much below the norm of 2400 calories in rural areas. However,
there is a controversy over the minimum calorie consumption per consumer unit per
diem. Sukhatme (1982) and Minhas (1991) have questioned the sanctity of calorie
norms widely used by nutritionists and consider them to be exaggerated. The NNMB
data in 1996-97 shows that about 48 per cent of the households consumed more
than adequate amount of both proteins and calories, while 20 per cent of households
consumed inadequate amounts of both the nutrients.
Table 3: Average Per Capita Calorie Intake (kcal/day): Rural
Decile Group 1972-73 1977-78 1983 1993-94 1990-00
Lowest 30% 1504 1630 1620 1678 1626
Middle 40% 2170 2296 2144 2119 2009
Top 30% 3161 3190 2929 2672 2463
All 2268 2364 2222 2152 2030
Soucre: NSS Consumer Expenditure Surveys
The NSS data shows that the average protein intake in rural India remained at 62
grams per consumer unit per day until 1983 but declined by 2 grams in 1993-94.
There are some states where the average protein intake has been declining
continuously since 1972-73. These are Assam, Himachal Pradesh, Punjab, Tamil
Nadu and Uttar Pradesh. In Kerala, Orissa and West Bengal, protein intake has
increased. On the whole at the average level protein energy malnutrition is not apparent
in any of the states. This, however, does not rule out the possibility of protein energy
malnutrition in the lower expenditure groups (MS Swaminathan Research Foundation,
2001).
Micro nutrient deficiencies
Goitre due to iodine deficiency, blindness due to Vitamin A deficiency, dry and wet
beriberi and pellagra were the major public health problems in pre-independent India.
13
Sustained dietary changes resulted in the elimination of beriberi and pellagra. However,
there has not been any decline in the prevalence of anemia due to iron and folic acid
deficiency; the decline in Vitamin A deficiency and iodine deficiency disorders has
been very slow. Diet surveys have shown that the intake of Vitamin A is significantly
lower than the recommended dietary allowance in young children, dietary adolescent
girls and pregnant women. In these vulnerable sub-groups multiple nutritional problems
coexist including inadequate intake of energy as well as of micronutrients other than
Vitamin A (GOI, 2003).
Access to Drinking water
While empirical evidence tends to suggest a positive association between the calorie
intake and nutritional status, the responsiveness is likely to be affected by the
factors relating to health and environment. For example, safe drinking water is
important for proper absorption of food. Around 23 per cent of the households get
water from tap sources in rural areas (Table 4). Another 49 per cent of households
get water from tube well/hand pump. But, there are considerable regional disparities
in the major source of drinking water.
14
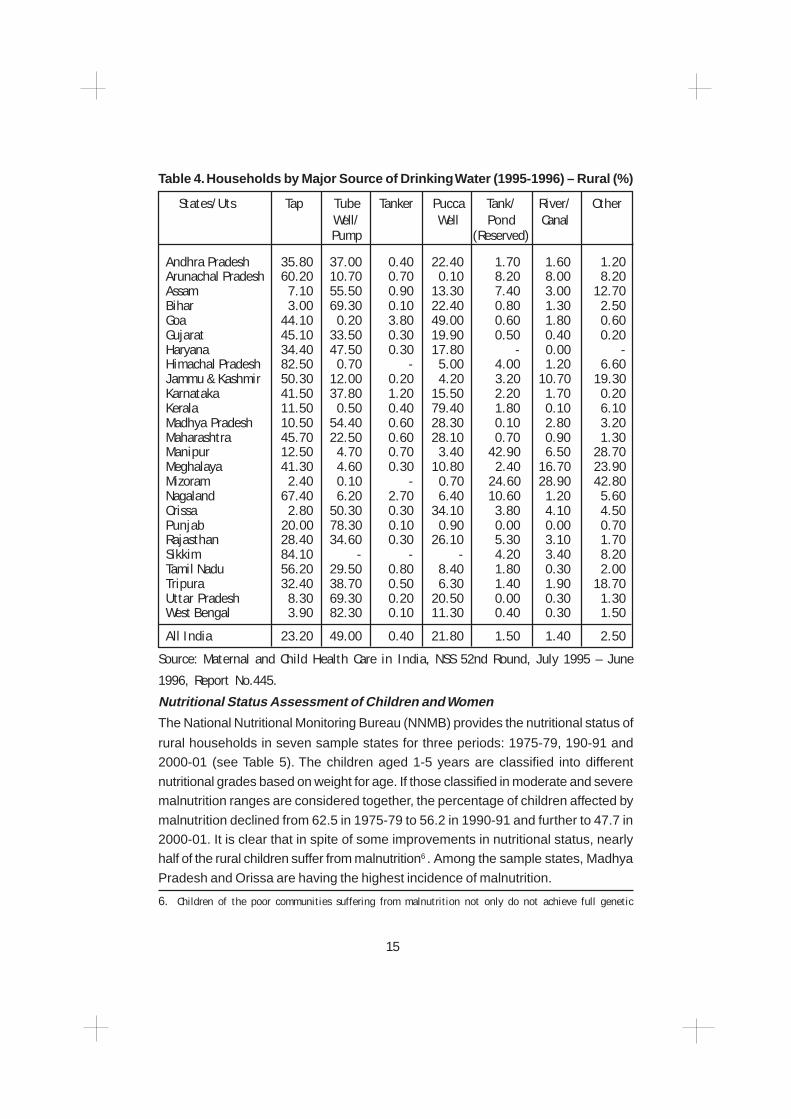
Table 4. Households by Major Source of Drinking Water (1995-1996) – Rural (%)
States/Uts Tap Tube Tanker Pucca Tank/ River/ OtherWell/ Well Pond CanalPump (Reserved)
Andhra Pradesh 35.80 37.00 0.40 22.40 1.70 1.60 1.20Arunachal Pradesh 60.20 10.70 0.70 0.10 8.20 8.00 8.20Assam 7.10 55.50 0.90 13.30 7.40 3.00 12.70Bihar 3.00 69.30 0.10 22.40 0.80 1.30 2.50Goa 44.10 0.20 3.80 49.00 0.60 1.80 0.60Gujarat 45.10 33.50 0.30 19.90 0.50 0.40 0.20Haryana 34.40 47.50 0.30 17.80 - 0.00 -Himachal Pradesh 82.50 0.70 - 5.00 4.00 1.20 6.60Jammu & Kashmir 50.30 12.00 0.20 4.20 3.20 10.70 19.30Karnataka 41.50 37.80 1.20 15.50 2.20 1.70 0.20Kerala 11.50 0.50 0.40 79.40 1.80 0.10 6.10Madhya Pradesh 10.50 54.40 0.60 28.30 0.10 2.80 3.20Maharashtra 45.70 22.50 0.60 28.10 0.70 0.90 1.30Manipur 12.50 4.70 0.70 3.40 42.90 6.50 28.70Meghalaya 41.30 4.60 0.30 10.80 2.40 16.70 23.90Mizoram 2.40 0.10 - 0.70 24.60 28.90 42.80Nagaland 67.40 6.20 2.70 6.40 10.60 1.20 5.60Orissa 2.80 50.30 0.30 34.10 3.80 4.10 4.50Punjab 20.00 78.30 0.10 0.90 0.00 0.00 0.70Rajasthan 28.40 34.60 0.30 26.10 5.30 3.10 1.70Sikkim 84.10 - - - 4.20 3.40 8.20Tamil Nadu 56.20 29.50 0.80 8.40 1.80 0.30 2.00Tripura 32.40 38.70 0.50 6.30 1.40 1.90 18.70Uttar Pradesh 8.30 69.30 0.20 20.50 0.00 0.30 1.30West Bengal 3.90 82.30 0.10 11.30 0.40 0.30 1.50
All India 23.20 49.00 0.40 21.80 1.50 1.40 2.50
Source: Maternal and Child Health Care in India, NSS 52nd Round, July 1995 – June
1996, Report No.445.
Nutritional Status Assessment of Children and Women
The National Nutritional Monitoring Bureau (NNMB) provides the nutritional status of
rural households in seven sample states for three periods: 1975-79, 190-91 and2000-01 (see Table 5). The children aged 1-5 years are classified into different
nutritional grades based on weight for age. If those classified in moderate and severemalnutrition ranges are considered together, the percentage of children affected by
malnutrition declined from 62.5 in 1975-79 to 56.2 in 1990-91 and further to 47.7 in2000-01. It is clear that in spite of some improvements in nutritional status, nearlyhalf of the rural children suffer from malnutrition6 . Among the sample states, Madhya
Pradesh and Orissa are having the highest incidence of malnutrition.
6. Children of the poor communities suffering from malnutrition not only do not achieve full genetic
15

Table 5 Per cent Distribution of Children (Aged 1-5 Years)by Nutritional Grade in Rural Areas of Selected States
State Period Normal Mild Moderate Severe
Kerala 1975-79 7.5 35.7 46.5 10.31991-92 17.6 46.7 29.6 6.02000-01 20.8 50.4 26.9 1.9
Tamil Nadu 1975-79 6.2 34.2 47.0 12.61991-92 8.0 39.7 41.7 5.72000-01 10.5 50.6 35.3 3.7
Karnataka 1975-79 4.6 31.1 50.0 14.31991-92 3.6 33.6 54.5 8.32000-01 7.2 45.2 45.2 2.4
Andhra Pradesh 1975-79 6.1 32.4 46.1 15.41991-92 9.9 39.2 41.9 8.92000-01 11.5 48.6 35.8 4.1
Maharashtra 1975-79 3.2 25.4 49.5 21.91991-92 4.5 33.3 44.9 17.32000-01 8.2 39.6 48.0 7.2
Gujarat 1975-79 3.8 28.1 54.3 13.81991-92 2.4 34.9 50.8 11.82000-01 7.4 43.7 40.0 8.9
Madhya Pradesh 1975-79 8.4 30.3 45.1 16.22000-01 5.8 30.4 49.2 14.7
Orissa 1975-79 7.5 35.9 41.7 14.91991-92 6.0 38.2 42.5 13.32000-01 6.7 38.9 47.2 7.2
All states* 1975-79 5.9 31.6 47.5 15.01991-92 7.2 36.3 41.1 11.12000-01 9.0 43.3 41.3 6.4
Notes: Based on National Centre for Health Statistics (NCHS), standards
* Pooled estimates for Kerala, Tamil Nadu, Karnataka, Andhra Pradesh, Maharashtra, Gujarat,Madhya Pradesh and Orissa.
Source: National Nutritional Monitoring Bureau, Report of the Repeat Surveys – Rural, 2001,
National Institute of Nutrition, Hyderabad. Quoted in Radhakrishna (2002)
National Family Health Surveys (NFHS I and NFHS II) provide information on
undernourishment of women and children (Table 6). Comparison of Body Mass Index
(BMI), which is essentially a measure of weight for height, brings this out clearly the
undernourishment of women. At the all India level, 36 per cent of women were suffering
from undernourishment in 1998-99. The malnutrition (weight for age) for children
declined from 53.4 per cent in 1992-93 to 47 per cent in 1998-99 at all India level
16

(Table 6). But, the levels are still high. Inter-state disparities can be seen from Table
6. In Bihar, Madhya Pradesh, Orissa, Rajasthan and Uttar Pradesh, the incidence of
malnutrition was more than 50 per cent in 1998-99. Malnutrition of women is also
high in these states as shown by the body mass index.
Table 6 : Anthropometric Measures – Women and Children (%)
States/Uts Women BMI Children below – 2 SD#
<18.5Kg/m2 Weight-for-age Height-for-age Weight-for-height
1998-99 1992- 1998- 1992- 1998- 1992- 1998-93 99 93 99 93 99
Andhra Pradesh 37.4 49.1 37.7 ## 38.6 ## 9.1Arunachal Pradesh 10.7 39.7 24.3 53.9 26.5 11.2 7.9Assam 27.1 50.4 36.0 52.2 50.2 10.8 13.3Bihar 39.3 62.6 54.4 60.9 53.7 21.8 21.0Goa 27.1 35.0 28.6 32.5 18.1 15.3 13.1Gujarat 37.0 50.1 45.1 48.2 43.6 18.9 16.2Haryana 25.9 37.9 34.6 46.7 50.0 5.9 5.3Himachal Pradesh 29.7 47.0 43.6 ## 41.3 ## 16.9Jammu & Kashmir 26.4 44.5 34.5 40.8 38.8 14.8 11.8Karnataka 38.8 54.3 43.9 47.6 36.6 17.4 20.0Kerala 18.7 28.5 26.9 27.4 21.9 11.6 11.1Madhya Pradesh 38.2 57.4 55.1 ## 51.0 ## 19.8Maharashtra 39.7 54.2 49.6 48.5 39.9 20.2 21.2Manipur 18.8 30.1 27.5 33.6 31.3 8.8 8.2Meghalaya 25.8 45.5 37.9 50.8 44.9 18.9 13.3Mizoram 22.6 28.1 27.7 41.3 34.6 2.2 10.2Nagaland 18.4 28.7 24.1 32.4 33.0 12.7 10.4Orissa 48.0 53.3 54.4 48.2 44.0 21.3 24.3Punjab 16.9 45.9 28.7 40.0 39.2 19.9 7.1Rajasthan 36.1 41.6 50.6 43.1 52.0 19.5 11.7Sikkim 11.2 - 20.6 - 31.7 - 4.8Tamil Nadu 29.0 48.2 36.7 ## 29.4 ## 19.9Tripura - 48.8 - 46.0 - 17.5 -Uttar Pradesh 35.8 59.0 51.7 59.5 55.5 16.1 11.1West Bengal 43.7 56.8 48.7 ## 41.5 ## 13.6
All India 35.8 53.4 47.0 52.0 45.5 17.5 15.5
Note:1. Includes percentage of ever-married women with BMI below 18.5 kg./m2.. Body Mass Index
is the ratio of the weight in kilograms to the square of the height in meters (kg/m2 ). Thedata exclude women who are Pregnant and women who gave birth in the preceding twomonths.
2. The index for children is expressed in standard deviation units (SD) from the median of theInternational Reference Population Figures are for children born 1-47 months prior to survey.
3. #: includes children who are below-3 SD from the International Reference Population. 4. ##: Not available as children’s height not measured 1992-93 figure for Jammu & Kashmir
covers only the Jammu region.Source: National Family Health Survey (NFHS-1 & 2), 1998-99, October, 2000, Table 7.5, page 246and Table 7.17, page 270. For 1992-93 Table 10.10 page 286.
Some indicators on anemia of women and children based on NFHS data are given in
17

Table 7. It shows that more than 50 per cent of women and more than 70 per cent of
children have anemia. Considerable regional disparities can be noticed in these
indicators.
Table 7. Percentage of Women and Children with Anemia : 1998-99
States Percentage of Women Percentage of children with any anemia with anaemia
Andhra Pradesh 49.8 72.3Assam 69.7 63.2Bihar 63.4 81.3Gujarat 46.3 74.5Haryana 47.0 83.9Karnataka 42.4 70.6Kerala 22.7 43.9Madhya Pradesh 54.3 75.0Maharashtra 48.5 76.0Orissa 63.0 72.3Punjab 41.4 80.0Rajasthan 48.5 82.3Tamil Nadu 56.5 69.0Uttar Pradesh 48.7 73.9West Bengal 62.7 78.3
India 51.8 74.3
Source: National Family Health Survey (NFHS-2), 1998-99
3.2. Accessibility
3.2.1.Physical accessibility
Availability or physical access of foodgrains at the national level is not a problem.
However, it is a problem for North Eastern states and other remote and tribal areas.
Also, it is a problem for vulnerable groups such as old age population, pregnant and
lactating women, children, tribals etc. As shown below, Government has programmes
to take care of the problems of physical access in remote areas and vulnerable
groups.
Intra-household Distribution of Food consumption
One important dimension of physical accessibility is intra-household disparity in
consumption. It is widely believed that in India, particularly among the rural poor,
18
food distribution is not based on ‘need’. The breadwinner gets sufficient food, the
children get the next share and the women take the remains. In times of scarcity, the
dietary intake of women and children are likely to be most adversely affected. Among
children, boys are given preference to girls in distribution of food. Several micro
studies in different states have reported that intra-household distribution of food
follows this traditional pattern even today. However, the empirical evidence shows
that the intra-household discrimination is found in some areas only.
Haddad et al (1996) provide a review of the literature on intrahousehold bias for
different countries. Food allocation is the most studied dimension of intra-household
inequality. In general, the adjustment for body weight and activity tends to support
gender neutrality of intra-household, although a slight pro-male bias persists. Boys
may be favoured in India by being given first priority in breast-feeding and in food
supplementation (Pettigrew 1986). In India, upper-middle caste groups favour sons
more in food allocation than lower status groups and tribal groups (Warrier 1992).
Miller (1981) found pro-male bias in North India while there was no sex preference in
South India. Using village level studies of ICRISAT Behrman and Deolalikar (1990)
do not find any evidence of gender discrimination in food intake.
An analysis of household expenditures on goods consumed exclusively by adults
(an ‘adult good’) has been used as a parsimonious technique for examining
discrimination within households. The basic idea is, do parents reduce expenditures
on these adult goods more severely for an extra girl than for an extra boy?
Subramanian and Deaton (1990) employ a representative sample of some 11,000
households from the state of Maharashtra, collected in 1983. They find some evidence
of discrimination against girls under five years of age who live in rural households,
but only in one (tobacco and paan) of the two identified adult goods (the other being
alcohol).
Another way is to look at the outcomes (nutritional status ) based on anthropometric
measures. Sen and Sengupta (1983) studied the question of undernourishment of
boys and girls in two villages of West Bengal. Based on weight-for-age indicator,
they found bias to boys over girls. Sen (2001) cautions about the interpretation of
causal process. The lower level of nourishment of girls may not relate directly to
their being underfed vis-à-vis boys. ‘Often enough, the differences may particularly
arise from the neglect of health care of girls compared with what boys get’ (Sen,
2001).
19

While comparisons of percentages of underweight girls and boys (1-5 years old) at
the all India level show insignificant differences in the rates of malnutrition (i.e. ratio
close to 1), disaggregated state level data from recent studies by Department of
Women and Child Development (1995/96) and the NNMB (1994) show a distinct
trend of higher percentage of girls than boys who are severely underweight. Notably,
while Tamil Nadu, Mizoram and Manipur record some of the lowest rates of severely
malnourished children, a disproportionate share of them are girl children. Their ratios
are 1.91, 1.58 and 2.10 respectively (World Bank, 2001). It may be noted that these
gender discrepancies are likely higher to be if child mortality rates are accounted
for. The National Family Health Survey 1992/93 of 25 states found that girl child
mortality (ages 1-4) is 43 per cent higher than boys. Post-neonatal mortality of girls
is 13 per cent higher than boys. If these girls had been alive, they would almost
certainly have added to the prevalence of female malnutrition7 .
3.2.2Economic Accessibility
Hunger
India has made significant progress in reducing the problem of hunger. Estimates of
hunger (two square meals a day) based on self perception from NSS data show that
less than 10 per cent of people suffer from hunger. However, in poorer states like
Bihar and Orissa the per cent of people suffering from hunger is much higher. One of
the major achievements of India in terms of food is that it averted famines since
independence8 . The last one was the Bengal Famine of 1943. But, chronic poverty
is still high in the country. This is because lack of economic access (purchasing
power) to food .
Poverty Ratios
The expenditure on food (calorie intake) with some allowance for non-food expenditure
is mostly used as a basis for determining the poverty line. Thus, the incidence of
poverty in a region may give some indication of the extent to which food is accessible
to households. India is perhaps the only developing country, which has the longest
time series of national household surveys starting from the early 1950s. Till 1973-74,
National Sample Survey (NSS) data were available annually. Between 1972-73 and
7. By contrast, there are a few states (Karnataka 0.87, Gujarat 0.77, Goa –0.66 and Daman andDiu 0.70) where boys appear to be fairing worse than girls. In some states where studies ofurban areas were conducted, a similar trend prevails.
8. More on this see Dreze and Sen (1989)
20

1999-00, six quinquennial surveys have been carried out with a large sample size of
ten households per sample village. The official poverty ratios for all India and major
states are given in Table 8. It shows that the rural poverty declined by about 10
percentage points in the 1990s while urban poverty declined by 9 percentage points
during the same period. In almost all the states, poverty declined in the 1990s.
However, rural poverty was above 40 per cent in three states viz., Orissa, Bihar,
Assam and in three states (M.P., U.P, and West Bengal) it was above 30 per cent. In
the case of urban poverty, states such as Orissa, M.P., Bihar, U.P. showed higher
incidence in 1999-2000. Thus, although income poverty declined significantly at the
all India level, regional disparities are quite high.
Table 8 Incidence of Poverty Across States
States Rural Urban Total
1973-74 1993-94 1999-00 1973-74 1993-94 1999-00 1973-74 1993-94 1999-00
A.P. 48.41 15.92 11.05 50.61 38.33 26.63 48.86 22.19 15.77Assam 52.67 45.01 40.04 36.92 7.73 7.47 51.21 40.86 36.09Bihar 62.99 58.21 44.30 52.96 34.50 32.91 61.91 54.96 42.60Guj. 46.35 22.18 13.17 52.57 27.89 15.59 48.15 24.21 14.07Har. 34.23 28.02 8.27 40.18 16.38 9.99 35.36 25.05 8.74Karn. 55.14 29.88 17.38 52.53 40.14 25.25 54.4 33.16 20.04Ker. 59.19 25.76 9.38 62.74 24.55 20.27 59.79 25.43 12.72M.P. 62.66 40.64 37.06 57.65 48.38 38.44 61.78 42.52 37.43Mah. 57.71 37.93 23.72 43.87 35.15 26.81 53.24 36.86 25.02Orissa 67.28 49.72 48.01 55.62 41.64 42.83 66.18 48.56 47.15Punj. 28.21 11.95 6.35 27.96 11.35 5.75 28.15 11.77 6.16Raj. 44.76 26.46 13.74 52.13 30.49 19.85 46.14 27.41 15.28T.N. 57.43 32.48 20.55 49.40 39.77 22.11 54.94 35.03 21.12U.P. 56.53 42.28 31.22 60.09 35.39 30.89 57.07 40.85 31.15W.B. 73.16 40.80 31.85 34.67 22.41 14.86 63.43 35.66 27.02India 56.44 37.27 27.09 49.01 32.36 23.62 54.88 35.97 26.10
Source: Economic Survey 2001-02, Government of India
Alternative Estimates of Poverty: The official estimates of poverty are based on the
Lakdawala Committee’s methodology. If one notices the numbers in table 8, the
urban poverty was higher than rural poverty in 9 states. This is unusual. Deaton and
Dreze(2002) estimated alternative poverty ratios based on the unit prices generated
from NSS data. They have also ‘adjusted ‘ for the non-comparability of 1999-00 NSS
data. The alternative poverty estimates are given in Table 9. It shows that the rural
21

poverty was lower by around 2 percentage points while urban poverty for all India
was considerably lower in the alternative estimates as compared to official estimates.
It also shows that in all the states, urban poverty was lower than rural poverty.
Table 9 Alternative Estimates on Incidence of Poverty: 1999-2000
States Rural Urban
Official Alternativ Official Alternativ
Andhra Pradesh 11.05 26.2 26.63 10.8Assam 40.04 35.5 7.47 11.8Bihar 44.30 41.1 32.91 24.7Gujarat 13.17 20.0 15.59 6.4Haryana 8.27 5.7 9.99 4.6Karnataka 17.38 30.7 25.25 10.8Kerala 9.38 10.0 20.27 9.6Madhya Pradesh 37.06 31.3 38.44 13.9Maharashtra 23.72 31.9 26.81 12.0Orissa 48.01 43.0 42.83 15.6Punjab 6.35 2.4 5.75 3.4Rajasthan 13.74 17.3 19.85 10.8Tamil Nadu 20.55 24.3 22.11 11.3Uttar Pradesh 31.22 21.5 30.89 17.3West Bengal 31.85 21.9 14.86 11.3
India 27.09 26.3 23.62 12.0
Source: Economic Survey 2000-01 and Deaton and Dreze (2002)
Based on growth in average per capita consumer expenditure (APCE) during 1993-
94 to 1999-00, Deaton and Dreze (2002) show a striking regional pattern : “except for
Jammu and Kashmir, the low growth states from one contiguous region made up of
the eastern states (Assam, Orissa and West Bengal), the so-called BIMARU states
(Bihar, Madhya Pradesh, Rajasthan and Uttar Pradesh) and Andhra Pradesh. The
high growth states, for their part, consist of the southern states (except Andhra
Pradesh), the western states (Gujarat and Maharashtra) and the North western region
(Punjab, Haryana and Himachal Pradesh). Further, it is interesting to note that this
pattern is reasonably consistent with independent data on growth rates of per capita
‘state domestic product’ (SDP)”.
22
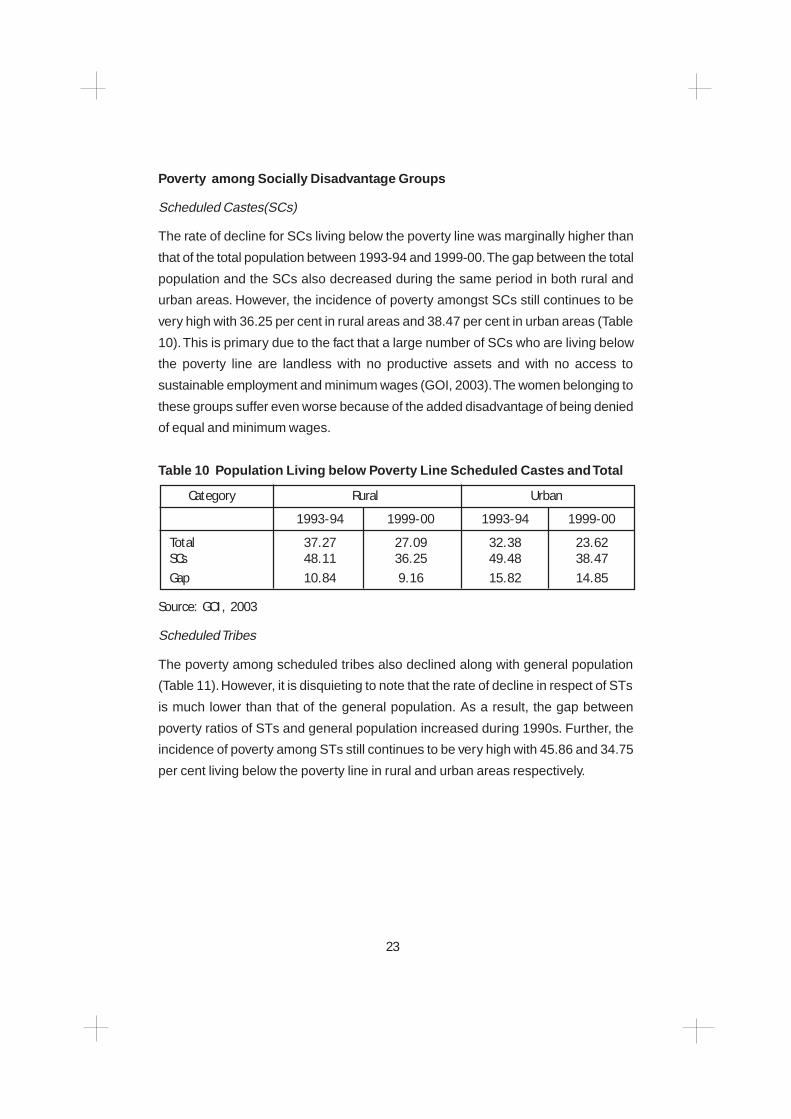
Poverty among Socially Disadvantage Groups
Scheduled Castes(SCs)
The rate of decline for SCs living below the poverty line was marginally higher than
that of the total population between 1993-94 and 1999-00. The gap between the total
population and the SCs also decreased during the same period in both rural and
urban areas. However, the incidence of poverty amongst SCs still continues to be
very high with 36.25 per cent in rural areas and 38.47 per cent in urban areas (Table
10). This is primary due to the fact that a large number of SCs who are living below
the poverty line are landless with no productive assets and with no access to
sustainable employment and minimum wages (GOI, 2003). The women belonging to
these groups suffer even worse because of the added disadvantage of being denied
of equal and minimum wages.
Table 10 Population Living below Poverty Line Scheduled Castes and Total
Category Rural Urban
1993-94 1999-00 1993-94 1999-00
Total 37.27 27.09 32.38 23.62SCs 48.11 36.25 49.48 38.47Gap 10.84 9.16 15.82 14.85
Source: GOI, 2003
Scheduled Tribes
The poverty among scheduled tribes also declined along with general population
(Table 11). However, it is disquieting to note that the rate of decline in respect of STs
is much lower than that of the general population. As a result, the gap between
poverty ratios of STs and general population increased during 1990s. Further, the
incidence of poverty among STs still continues to be very high with 45.86 and 34.75
per cent living below the poverty line in rural and urban areas respectively.
23

Table11: Population Living below Poverty Line
Scheduled Tribes and Total
Category Rural Urban
1993-94 1999-00 1993-94 1999-00
Total 37.27 27.09 32.38 23.62STs 51.94 45.86 41.14 34.75
Gap 14.67 18.77 7.48 11.13Source: GOI, 2003
Employment Growth
As mentioned above, creation of employment is one way of ensuring right to food.
With increase in purchasing power, the poor can increase their food consumption.
Therefore, it is useful to know about the overall employment growth rates in the
Indian economy. The growth rate of rural employment was around 0.5 percent per
annum between 1993-94 and 1999-00 as compared to 1.7 percent per annum between
1983 and 1993-94. The daily status unemployment rate in rural areas has increased
from 5.63% in 1993-94 to 7.21% in 1999-00. As shown in Table 12, the overall
employment growth declined from 2.04 percent during 1983-94 to 0.98% during 1994-
2000. Much of the decline in the growth was due to developments in two sectors
viz., agriculture and community social& personal services. These two sectors
accounting for 70% of the total employment have not shown any growth during the
1990s. Similar trends can be seen for growth rates of employment based on current
daily status.
24

Table 12: Growth of Employment : Usual Status and
Current Daily Status
Industry Usual Status: Principal and Current Daily StatusSubsidiary (% per annum) (% per annum)
1983 to 1993-94 to 1983 to 1993-94 to1993-94 1999-00 1993-94 1999-00
Agriculture 1.51 -0.34 2.23 0.02Mining & quarrying 4.16 -2.85 3.68 -1.91Manufacturing 2.14 2.05 2.26 2.58Electricity, gas & water supply 4.50 -0.88 5.31 -3.55Construction 5.32 7.09 4.18 5.21Trade 3.57 5.04 3.80 5.72Transport, Storage & Commn. 3.24 6.04 3.35 5.53Financial Services 7.18 6.20 4.60 5.40Community social & per. services 2.90 0.55 3.85 -2.08
Total Employment 2.04 0.98 2.67 1.07
Source: Planning Commission, GOI (2001) for Usual status estimates and PlanningCommission, GOI, (2002) for Current Daily Status
Real Wages
Another indicator of purchasing power is agricultural wages. At the all India level, the
growth of real agricultural wages declined from about 5 per cent per annum in the
1980s to 2.5 per cent per annum in the 1990s. Table 13 provides growth rates of real
agricultural wages for different states. Deaton and Dreze (2002) say that a healthy
growth of real agricultural wages appear to be a sufficient condition for significant
reduction in poverty in rural areas. In all the states where real wages have grown
more than 2.5 per cent (Gujarat, Karnataka, Kerala, Tamil Nadu) have experienced
sharp reduction in rural poverty. On the other hand, entire Eastern region (Assam,
Orissa, West Bengal and Bihar), Andhra Pradesh and Madhya Pradesh experienced
low growth in agricultural wages and lower reduction in poverty.
25
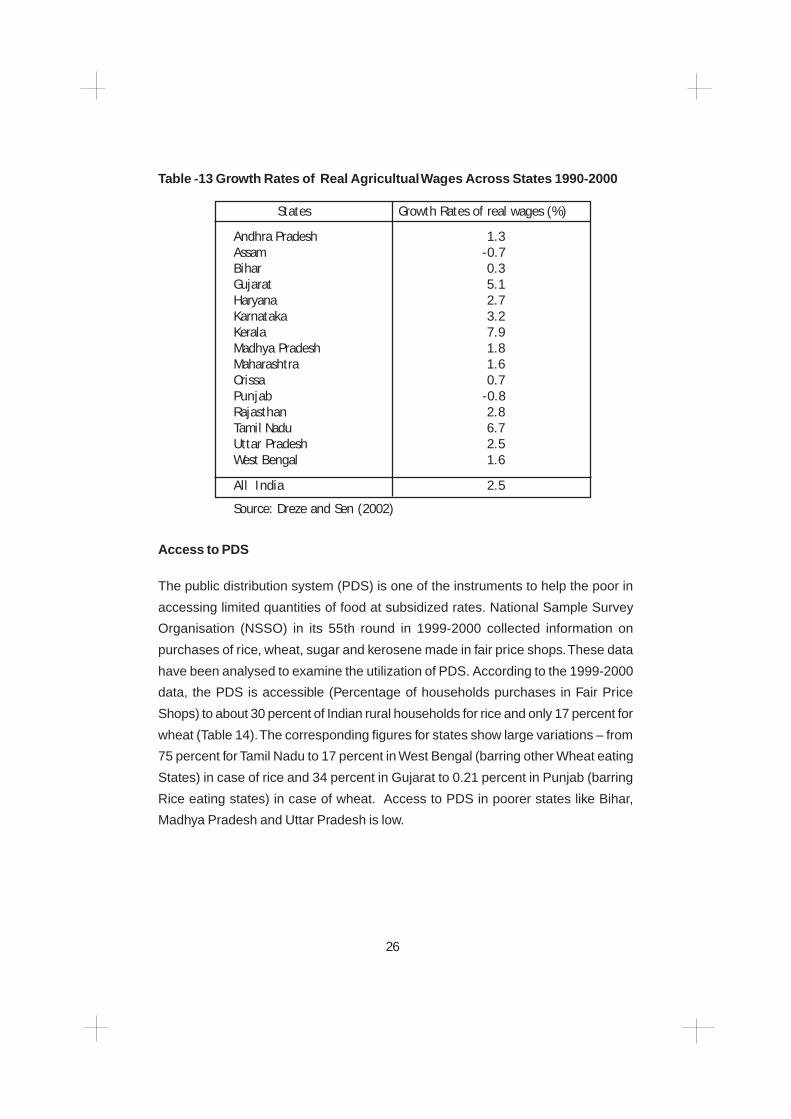
Table -13 Growth Rates of Real Agricultual Wages Across States 1990-2000
States Growth Rates of real wages (%)
Andhra Pradesh 1.3Assam -0.7Bihar 0.3Gujarat 5.1Haryana 2.7Karnataka 3.2Kerala 7.9Madhya Pradesh 1.8Maharashtra 1.6Orissa 0.7Punjab -0.8Rajasthan 2.8Tamil Nadu 6.7Uttar Pradesh 2.5West Bengal 1.6
All India 2.5
Source: Dreze and Sen (2002)
Access to PDS
The public distribution system (PDS) is one of the instruments to help the poor in
accessing limited quantities of food at subsidized rates. National Sample Survey
Organisation (NSSO) in its 55th round in 1999-2000 collected information on
purchases of rice, wheat, sugar and kerosene made in fair price shops. These data
have been analysed to examine the utilization of PDS. According to the 1999-2000
data, the PDS is accessible (Percentage of households purchases in Fair Price
Shops) to about 30 percent of Indian rural households for rice and only 17 percent for
wheat (Table 14). The corresponding figures for states show large variations – from
75 percent for Tamil Nadu to 17 percent in West Bengal (barring other Wheat eating
States) in case of rice and 34 percent in Gujarat to 0.21 percent in Punjab (barring
Rice eating states) in case of wheat. Access to PDS in poorer states like Bihar,
Madhya Pradesh and Uttar Pradesh is low.
26

Table 14: Percentage of Household Accessing PDS : 1999-00
States Rural Urban
Rice Wheat Rice Wheat
1 2 3 4 5
Andhra Pradesh 62.93 1.84 29.34 15.86Assam 37.22 1.74 22.28 1.25Bihar 5.40 8.98 2.30 4.66Gujarat 43.98 34.32 17.54 12.78Haryana 0.72 2.16 0.35 1.34Himachal 34.90 20.08 17.23 10.98J&K 36.55 21.44 42.89 26.13Karnataka 68.24 61.96 40.19 37.49Kerala 68.52 37.08 59.99 39.88Madhya Pradesh 16.10 10.90 6.81 3.45Maharashtra 44.26 43.43 15.17 14.75Orissa 51.38 4.98 29.76 17.72Punjab 0.24 0.21 0.14 0.10Rajasthan 0.61 5.46 0.28 2.41Tamil Nadu 75.21 15.09 52.59 30.32Uttar Pradesh 8.07 7.34 3.29 2.93West Bengal 17.49 16.06 6.87 18.36
All India 32.38 16.59 20.28 15.12
Source: Estimated from NSSO 1999-2000 consumer expenditure dataAccess indicates the percentage of households reporting purchases from PDS.
Some Recent Examples of Violation of Right to Food
The country’s food stocks have increased to more than 65 million tonnes in recent
years and the food subsidy is nearing Rs.30,000 crores. Yet hunger and malnutrition
continue in the country. Half of India’s women and 70 per cent of children suffer from
anemia. This is the phenomenon of ‘hunger amidst plenty”9 . In this respect, India
has violated right to food in its worst form.
Various micro studies have documented about the prevalence of hunger and starvation
deaths in many parts of the country. A public hearing on hunger and the right to food
held in Manatu block of Palamau district of Jharkhand following starvation deaths
reveals gross irregularities in food related programmes and a disastrous level of
public services (Bhatia and Dreze, 2002). Thousands of hunger-affected people
9. On this see Dreze and Sen (2002)
27

assembled for a public hearing on hunger and the right to food. A widow who testified
at the public hearing in Manatu, had not eaten for three days and was too weak to
stand up. A team comprising members of the Gram Swaraj Abhiyan and the Right to
Food campaign visited Kusumatand village in Manatu. The fact-finding committee
went to investigate three starvation deaths in the village, but found that the entire
village lived in a condition of permanent semi-starvation. Despite wide media coverage,
the government had not taken any serious steps to help the villagers. The main
conclusions of the fact finding committee are the following10 :
❑ The people of Kusumatand (block Manatu, district) live in abject poverty. Many
people are in the state of permanent semi-starvation. They drink highly polluted
water. They are also deprived of proper facilities such as primary education, health
care, and the public distribution system.
❑ Lack of food and clean water has created a horrendous trail of illness and death. The
recent starvation deaths in the village are directly related to the lack of food and
drinking water.
❑ The government has taken no serious action to address the problem. Development
works are standstill. There are no drought relief programmes even though the area
has affected by drought. Even after the hunger deaths occurred and received wide
media attention, the government remained passive. Instead of taking the action to
help the people of the village, the government dismissed the reports as ‘baseless
stories’ attempted to muzzle those who have reported.
❑ Recent Supreme Court orders relating to the right to food (PUCL vs. Union of India
and ORS) being grossly violated in Kusumatand and the surrounding villages. For
instance, the PDS is non-functional and no mid-day meals are being given in the
local schools. No attempts have been made to prevent hunger deaths.
In November, 2001, The Supreme Court ordered all state and Union territories to
introduce mid-day meals in all government and government aided primary schools.
Most states were resisting the order. Bihar, Uttar Pradesh and Jarkhand are violating
the order of the Supreme Court completely. Karnataka and Chattisgarh are complying
partly. The grain quality of the foodgrains is also hampering the scheme in Rajasthan.
There have been starvation deaths in many other places such as in Kashipur in
Orissa and Anathapur in Andhra Pradesh. The KBK (Kalahandi-Bolangir-Koraput)
10. See website www.geocities.com/righttofood
28

region in Orissa is one of the highly food insecure region in the country11 . In village
after village, poor people survive on a spartan diet (e.g. rice and salt), drink unsafe
water and there are no access to health care. Diarrhoea is a common cause of
death. Real wages are incredibly low. Massive environmental degradation clearly
contributed to the crisis. In many villages, forests have been decimated and economic
activities based on forests declined. In some areas, labour migration is the surviving
strategy. Another major reason for backwardness in KBK region is rampant exploitation
and corruption.
4 POLICIES AND PROGRAMMES FOR REALISING RIGHT TO FOOD
India has many international obligations to fulfill the right to food with respect to
children as well as adults. India became a party in 1986 to the International Covenant
on Economic, social and cultural rights, which is the most important human rights
instrument for the right to food as it enshrines the right to food and the right to be free
from hunger in its article 11. Another major step taken in the case of food was the
convention on the Rights of the Child. The Government of India has also committed
itself to the Convention on the Rights of the Child in 1990. This convention asserted
the right of every child to adequate food and nutrition. The world community has
finally committed it self to eliminate the hunger of children with the ratification of this
convention. India was also part of the World Food Summit held at Rome in 1996.
Regarding national level obligations, poverty alleviation has been on the policy agenda
for more than 50 years. As early as 1938, the Indian National Congress constituted
a National Planning Committee (NPC) headed by Jawaharlal Nehru, which had declared
that the social objective should be “to ensure an adequate standard of living for the
masses, in other words, to get rid of the appalling poverty of the people”. The
Constitution of India has a number of fundamental rights in Part III of the Constitution
and are classified under seven broad groups as given below12 .
Right to Equality (Articles 14-18)
Right to particular freedoms (Arts. 19-22)
Rights against exploitation (Arts. 23-24)
Right to Freedom of Religion (Arts.23-24)
Cultural and educational rights (Arts. 29-30)
11. see Dreze (2003) for the situation in KBK region in Orissa
12. See CDHR (2002)
29

Part IV (Arts. 36 to 51) of the Constitution contains the Directive Principles of State
Policy. The Directives, however, differ from the Fundamental Rights as they are not
enforceable in the Courts and do not create any justiciable rights in favour of the
individuals. Although there is no explicit provision for the ‘right to food’ in the
Constitution of India, the comparable human right provisions in the Constitution of
India are found in few Articles of Fundamental Rights as well as Directive Principles
of State Policy. Article 21 of the Indian constitution provides the fundamental right
to protection of life and personal liberty. The Directive Principles implicitly incorporates
the right to food either in the form of non-justiciable right of the citizens (Arts. 39, 41)
or in the form of directives in the nature of ideals of the state (Art.47) and these are:
Right to adequate means of livelihood (Art. 39 a)
Right of both sexes to equal pay for equal work (Art. 39 d)
Right against economic exploitation ( Art. 39 e-f)
Right to work (Art. 41)
Right to public assistance in case of unemployment, old age, sickness, and other cases
of undeserved want (Art.41)
The State shall endeavor to raise the level of nutrition and standard of living and to
improve public health (Art.47)
The importance of reduction in poverty and provision of basic needs has been
emphasized in all the five year plans since independence particularly since the 5th
Five-Year Plan. But, there has been no legal backing for the right to food in India.
Only in recent years, Supreme Court has been giving Orders on right to food and
right to work. In practice, the Supreme Court started entertaining petitions regarding
not only violations of civil and political rights, but also of economic and social rights.
In May 2001, the People’s Union for Civil Liberties (Rajasthan) submitted a petition
in the Supreme Court, demanding that the country’s gigantic food stocks should be
used without delay to prevent hunger and starvation. Expressing serious concerns
over the starvation deaths in some states, the Supreme Court (SC) observed in
August 2001, that it was the primary responsibility of the Central and State
Governments to ensure that the food grains overflowing in FCI godowns reached the
starving people and not wasted by being dumped in the sea or eaten by rats. In
September, the SC has directed 16 states, which had not identified the people below
the poverty line (BPL) to do so within two weeks to enable the governments to
distribute food to them under the public distribution system (PDS). In November
30

2001, SC gave interim order directing all State governments to introduce cooked
mid-day meals in primary schools within six months of the order. Supreme Court
hearings have led to a larger “right to food campaign”. The foundation statement of
the campaign says “The Right to Food campaign is an informal network of
organizations and individuals committed to the realization of the right to food in
India. Realising the right to food requires not only equitable and sustainable food
systems, but also entitlements relating to livelihood security such as the right to
work, land reform and social security. We consider that the primary responsibility for
guaranteeing these entitlements rests with the state”. So far, the Right to food
campaign has focused mainly on the implementation of SC orders relating to the
right to food.
4.1. Analysing programmes and Policies in terms Of Obligations of State
A useful framework to discuss policies and programmes for right to food is provided
by three level obligations of the state – obligation to respect, obligation to protect
and obligation to fulfill13 .
4.1.1.Obligation to Respect: Under this obligation State should not deny food to
any individual or any segment of society. Particularly during floods and droughts,
some sections may be denied food as the rich corner the relief money or commodities.
This is true of normal food security programmes for the poor. In many of the
programmes, non-poor corner some of the benefits as compared to the poor.
4.1.2.Obligation to Protect : Land Ownership and Tenancy
One of the important obligations of the state with regard to any right is the obligation
to protect. The obligation to protect in case of food implies ensuring the right to land
and security of tenure. Agricultural land in India is overwhelmingly privately owned
and operated with over 10 million holdings of which 63 per cent are in the small and
marginal category. In this way the Government fulfils its obligation to respect in
terms of privately owned land. It also protects in terms of ownership although land
record system is not satisfactory. However, land ownership and operation is regulated
by policies which place ceiling on agricultural land, restrict leasing, regulate rents
and provide security of tenure. This regulation is deemed to be in the interest of both
equity and growth (Srivastava et al, 2003). Abolition of Zamindari system (landlordism)
13. See Osmani et al (2003)
31

was one of the achievements immediately after independence. The policy of
redistribution of excess land (above the ceiling limit) to the poor, however, has not
been successful. There is no security for tenants except in West Bengal. There are
gender inequalities in the ownership of land. The experience of past policies and the
agrarian changes which have occurred in the last few decades, called into question
some of these set of policies particularly on tenancy and womens’ rights on land.
4.1.3. Obligation to fulfill
Under obligation to fulfill, government has to facilitate and provide benefits to the
poor. Pro-poor growth strategy falls under obligation to facilitate. In the case of obligation
to provide, the Government has several programmes see Table 15. The Central and
State Governments of India implement a broad package of programmes to improve
accessibility and adequacy of food and nutrition for the poor and vulnerable groups.
They include Public Distribution System (PDS) and its sub-programmes (Annapurna
Scheme and the Anthodaya Anna Yojana, a foodgrain price stabilization programme,
food-for-work programmes such as the Jawahar Gram Samriddhi Yojana/Jawahar
Rojgar Yojana (JGSY/JRY) and the Employment Assurance Scheme (EAS), The
mid-meals programme and a number of direct nutrition programmes – Integrated
Child Development Services, Balwadi Nutrition Programme, Day Care Centres
Scheme, and Vitamin A and Iron Distribution programmes that are linked with the
ICDS (World Bank, 2001)14 .
14. More on these programmes, see Mahendra Dev (2000), Mahendra Dev and Ravi (2000) andMahendra Dev et al (2003a)
32
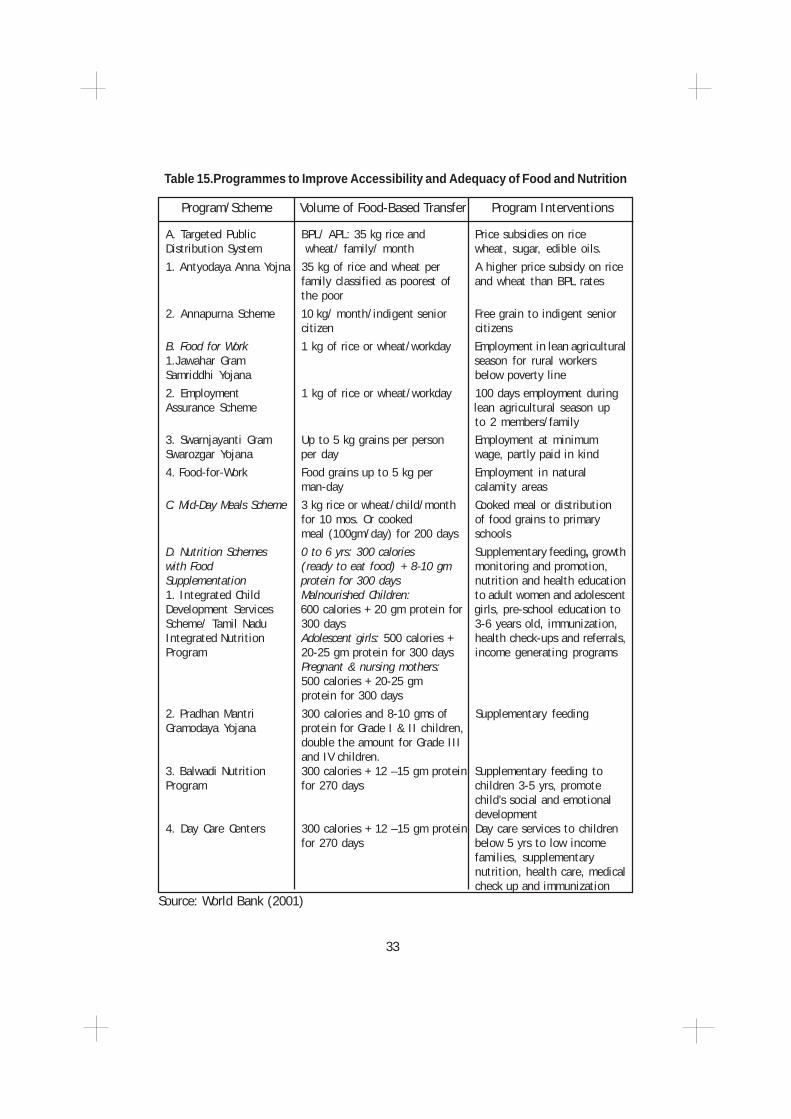
Table 15.Programmes to Improve Accessibility and Adequacy of Food and Nutrition
Program/Scheme Volume of Food-Based Transfer Program Interventions
A. Targeted Public BPL/ APL: 35 kg rice and Price subsidies on riceDistribution System wheat/ family/ month wheat, sugar, edible oils.
1. Antyodaya Anna Yojna 35 kg of rice and wheat per A higher price subsidy on ricefamily classified as poorest of and wheat than BPL ratesthe poor
2. Annapurna Scheme 10 kg/ month/indigent senior Free grain to indigent seniorcitizen citizens
B. Food for Work 1 kg of rice or wheat/workday Employment in lean agricultural1.Jawahar Gram season for rural workersSamriddhi Yojana below poverty line
2. Employment 1 kg of rice or wheat/workday 100 days employment duringAssurance Scheme lean agricultural season up
to 2 members/family
3. Swarnjayanti Gram Up to 5 kg grains per person Employment at minimumSwarozgar Yojana per day wage, partly paid in kind
4. Food-for-Work Food grains up to 5 kg per Employment in naturalman-day calamity areas
C. Mid-Day Meals Scheme 3 kg rice or wheat/child/month Cooked meal or distributionfor 10 mos. Or cooked of food grains to primarymeal (100gm/day) for 200 days schools
D. Nutrition Schemes 0 to 6 yrs: 300 calories Supplementary feeding, growthwith Food (ready to eat food) + 8-10 gm monitoring and promotion,Supplementation protein for 300 days nutrition and health education1. Integrated Child Malnourished Children: to adult women and adolescentDevelopment Services 600 calories + 20 gm protein for girls, pre-school education toScheme/ Tamil Nadu 300 days 3-6 years old, immunization,Integrated Nutrition Adolescent girls: 500 calories + health check-ups and referrals,Program 20-25 gm protein for 300 days income generating programs
Pregnant & nursing mothers:500 calories + 20-25 gmprotein for 300 days
2. Pradhan Mantri 300 calories and 8-10 gms of Supplementary feedingGramodaya Yojana protein for Grade I & II children,
double the amount for Grade IIIand IV children.
3. Balwadi Nutrition 300 calories + 12 –15 gm protein Supplementary feeding toProgram for 270 days children 3-5 yrs, promote
child’s social and emotionaldevelopment
4. Day Care Centers 300 calories + 12 –15 gm protein Day care services to childrenfor 270 days below 5 yrs to low income
families, supplementarynutrition, health care, medicalcheck up and immunization
Source: World Bank (2001)
33

Details, Accessibility and Adequacy under the Programmes: Obligation to
Provide
Public Distribution System
Public Distribution System (PDS) is one of the instruments for improving food security
at the household level in India. PDS ensures availability of essential commodities
like rice, wheat, edible oils and kerosene to the consumers through a network of
outlets or fair price shops. They are supplied at below market prices to consumers,
the access to the system till 1997 was universal. During the first few decades of its
existence, the PDS had actually never operated as an anti-poverty programme but
merely as an instrument of price stabilization. Till the late 1970s, the PDS was
mainly restricted to urban areas and food deficit regions. The main emphasis was on
price stabilization and as an alternative channel to private trade. Since the Sixth
Five Year Plan, however, the welfare importance of the PDS has been recognized.
Rural areas have also been covered in many states in the 1980s. In the 1990s, the
government has decided to restructure the PDS in the form of Revamped PDS
(RPDS) and Targeted PDS (TPDS). The PDS has been effective during drought
years e.g. 1979-80 and 1987-8815 . It is also effective in transferring foodgrains from
surplus areas to few deficit regions like Kerala. However, present system of public
distribution has many problems. The problems regarding access of PDS to poor are
discussed below.
(a) There has been significant diversion of PDS Commodities. A study was conducted by
the Tata Economic Consultancy Services to know how much of PDS supplies were diverted
from the system. At the national level, it was found, there was a diversion of 36% of
wheat supplies, 31% of rice and 23% sugar. The diversion is more in Northern, Eastern
and North Eastern regions; it is comparatively less in Southern and Western regions.
(b) The overall impact of PDS on the poor seems to be less. Few studies have measured
the welfare gains due to operation of the PDS. Parikh (1994) says that ‘‘the cost
effectiveness of reaching the poorest 20 per cent of households through pds cereals is
very small. For every rupee spent less than 22 paise reach the poor in all states, excepting
in Goa, Daman and Diu where 28 paise reach the poor. This is not to suggest that pds
does not benefit the poor at all, but only to emphasize that this support is provided at
high cost’’. A study by Radhakrishna et al (1997) concludes that the ‘potential benefits
15. See Tendulkar et al (1993)
34

from the PDS to the poor could not be realized cost-effectively due to weak targeting
and leakages. The cost of income transfer was high mainly because the programme was
open ended and never targeted’ (p.49). The study also says that approaches other than
quantity rationing, including self-targeting and other alternatives such as food stamps,
need to be considered in order to deliver food transfers to the needy cost-effectively16 .
(c) Poor states have not benefited much from PDS. The relationship between poverty and
PDS off-take is weak across Indian states. Radhakrishna et al (1997) provides the following
conclusions on regional disparities: (1) there is a regional mistargeting in the distribution
of foodgrains through PDS. The off-take by states like Kerala and Andhra Pradesh, which
are implementing subsidized food scheme, is high. On the other hand, the off-take by
the poorer states like Bihar, Orissa and Madhya Pradesh is low ; (2) there has been poor
targeting and access in majority of the states. The access of the poor to PDS is still
limited even after four decades of PDS operations. Data for the year 1995 based on
selected village surveys reconfirm the poor’s limited access in Bihar and Uttar Pradesh
found from the large household data set for 1986-87; (3) Empirical evidence for urban
bias seems to be weak. Urban bias was severe only in two states viz., Jammu & Kashmir
and West Bengal ; (4) In states like Andhra Pradesh and Kerala, the access of the poor is
much better. However, even in these states, per capita monthly PDS cereal purchases
tended to be regressive.
(d) Targeted public distribution system (TPDS) has undergone changes over time and it
has some problems. TPDS was introduced in 1997 by issuing special cards to families
below poverty line (BPL). Separate issue price is fixed for above poverty population
(APL). There are problems with targeting of PDS. The Government’s approach of TPDS
relates to income based means test. It is known that it is difficult to identify poor
through income-based means test. It should be avoided and some other indicators should
be used for targeting. Targeting also leads to exclusion and inclusion errors17 . The former
error refers to exclusion of poor while the latter error refers to inclusion of non-poor.
Both the errors seem to be high under TPDS. The challenge is to minimise the errors with
innovative programmes.
16. See Ramaswamy (2002)
17. See Cornia and Stewart (1995), Sen (1995)
35

A recent study by Mahendra Dev et al (2003) based on NSS 1999-00 data shows
that the income gains for rural poor have increased as compared to 1986-87. However,
the gains due to PDS as per cent of per capita monthly expenditure are very low
(Table 16).
Table 16. Income gain per month due to PDS: All India
1986-87 and 1999-00
Rural Urban
Income gain (Rs.) % of gain to Mean Income gain (Rs.) % of gain to Mean(current prices) per capita exp. (current prices) per capita exp.
(MPCE) (MPCE)
1986-7 1999-0 1986-7 1999-0 1986-7 1999-0 1986-7 1999-0
Poor 2.01 15.31 2.7 5.83 3.40 7.65 3.2 2.52Non-poor 2.47 7.30 1.4 1.29 3.86 10.10 1.5 1.09AllClasses 2.30 9.48 1.6 1.95 3.68 9.87 1.7 1.16
Note: Income gain includes gains from all purchases of rice, wheat, sugar and kerosenemade in fair price shops. Income gain for a given commodity is defined as
IG = (PM –PD)*QD, where IG is income gain, PM and PD are open market and fair price of thecommodity and QD is the quantity purchased in fair price shop.
Source: Mahendra Dev et al (2003)
Annapurna Scheme
This programme is linked to the Targeted PDS. It provides 10 kgs of foodgrains per
month for free to indigent senior citizens living alone. Approved during the 1999/
2000 budget, it is now being operationalized. It is targeted at those who are eligible
for old age pension, but do not receive them and who do not live with their children in
the same village. The Ministry of Rural Development is charged with its
implementation, with an annual foodgrain requirement estimated at 166,000 tonnes,
issued by FCI at economic costs. The evaluation of this scheme is not readily
available.
Antyodaya Anna Yojana
This programme was introduced in early 2001 is addressed to the poorest of the
poor, as identified by gram panchayats and gram sabhas. Antodaya households
have special ration cards and are entitled to 35 kg of grain a month at highly subsidized
36

prices (Rs. 2 a kg for wheat and Rs.3 kg for rice). In a survey of destitution in five
states (Andhra Pradesh, Chattisgarh, Jharkand, Rajasthan and Uttar Pradesh)
indicates that the programme is doing well, in contrast, with other components of the
PDS18 . The selection of Antyodaya households appears to be quite fair: among the
450 Antyodaya households living in the sample villages, a majority of them turned
out to be poor. The programme has, however, some problems. In some areas, the
survey found that many Antyodaya households had been deprived of their
entitlements. Rationshop dealers took advantage of their powerlessness. Another
major limitation of the scheme is its restricted coverage. It is less than 5 per cent of
the rural population. The problems and limitations can be sorted out easily as this
programme has lot of promise. In the budget 2003-04, an additional allocation of
Rs.507 crores has been provided. With this expansion, 25 per cent of the population
below the poverty line is to be covered in the fiscal year 2003-04.
Wage Employment Programmes
India has a long experience in experimenting with labour intensive public works.
After independence in 1947, many schemes were sponsored by the Central
Government, beginning with the Rural Manpower programme in 196019 . The
Employment Guarantee Scheme (EGS) of Maharashtra has received acclaim from
several sources. It is particularly interesting example because of its unprecedented
feature of guaranteed rural employment which makes it a model for other states in
India and throughout the developing world20 . At the national level, Jawahar Rojgar
Yojana (JRY) and Employment Assurance Scheme (EAS) are the important
programmes in rural areas. Food-for-work programme was started in 2000-01 as a
component of the EAS in eight notified drought-affected states of Chattisgarh, Gujarat,
Himachal Pradesh, Madhya Pradesh, Orissa, Rajasthan, Maharashtra and
Uttaranchal. In terms of person days of employment created, India’s rural public
works programmes are the largest in the world. The JRY reached around a billion
person days in recent years. JRY’s share is quite high in the social sector expenditure.
Recently JRY was revamped and named as JGSY(Jawahar Grameen Samriddhi
Yojana). Given the complementarity of the JGSY, EAS and Food for Work Programme,
18. See Dreze (2002)19. From the fourth century BC when the ancient Indian political economist, Kautilya, wrote his
Arthasastra, there has been emphasis on public relief works, particularly at times of famine.20. The EGS is commended by the UNDP’s Human Development Report (1993) as one of the
largest public works programmes in the developing world.
37

all of which aim at the creation of employment opportunities in the rural areas, they
were revamped and merged under the Sampoorna Gramin Rozgar Yojana (SGRY)
scheme from September 2001.
Despite its implementation difficulties, evaluations of the longer running Maharashtra
Employment Guarantee Scheme (MEGS)indicate that it played an important role in
combating seasonal malnutrition among poor rural households. There are many direct
and indirect benefits due to public works programmes. EGS has reduced
unemployment in Maharashtra; increased the incomes of many participating
households; acted as an insurance mechanism; impacted on agricultural growth and
agricultural wages; organized the rural poor into a political force and has had a
considerable impact on women (Dev, 1996). The national programmes JRY and EAS
are, however, not as successful as Maharashtra EGS. The findings of the report of
the concurrent evaluation (1993-94) are as follows.
(i) About 77.18 per cent of the works, the panchayat functionaries were the executing
agency and only 2.02 per cent of works were executed by the contractors; (ii) A substantial
amount of JRY funds has been spent on roads and buildings; (iii) wage and non-wage
ratio has been 53:47; (iv) 47 per cent of employment is generated for SC/ST and 36 per
cent for landless labourers; (v) Quality of majority of assets were found to be good and
only 0.41 per cent of assets were not useful. 86 per cent of assets were reported to be
durable; (vi) 70 per cent of the assets created were maintained by the panchayats.
However, 13 per cent of the assets were not maintained at all; (vii) On an average
employment generated under JRY in 30 days preceding the date of survey has been 11
days (GOI, 2001).
Other evaluations show that the resources were spread thinly so as to increase the
coverage of areas/ beneficiaries without any concern for duration of employment.
Projects selected bore no relationship to the local needs or the agricultural
development strategy. A study on U.P. reports that the timing of works coincided
with peak agricultural season and that the selection of works was not done in the
gram sabha as required (GOI, 2000). Wage employment programmes, by effectively
intervening in the labour markets, were expected to exert upward pressure on the
market wages. This could not happen because of insufficient employment provided
by these programmes. The share of women in employment generated under the
programme was only 17 per cent. JRY and similar public works programmes have
38

tended to breed corruption. The fudging of muster rolls and of measurement books is
very common resulting in huge loss of funds that could otherwise have been invested
in building rural infrastructure.
Notwithstanding some of the problems mentioned above, there are two positive
aspects of the programme (GOI, 2000). Fitrst, the programme did succeed in creating
durable community assets in rural areas. It is true that some assets built have poor
quality. Second, the programme led to empowerment of panchayats as the funds
were placed at their disposal along with power to get the works executed through line
departments.
4.3. Nutrition Programmes
ICDS
Malnutrition among children and women is severe in India. Integrated Child
Development Services (ICDS) is one of the main programmes for providing nutrition.
ICDS is perhaps the largest of all the food supplementation programmes in the
world. It was initiated in 1975 with the following objectives:
(i) To improve the health and nutrition status of children 0-6 years by providing
supplementary food and by coordinating with state health departments to ensure
delivery of required health inputs; (ii) To provide conditions necessary for psychological
and social development of pre-school children through early stimulation and education;
(iii) to provide pregnant and lactating women with food supplements; (iv) to enhance
the mother’s ability to provide proper child care through health and nutrition education;
(v) To achieve effective coordination of policy and implementation among the various
departments to promote child development.
Under universalisation of ICDS, world bank assistance is being received for expansion
of the ICDS programme since 1990-91. The WB-ICDS project I (1991-97) covered
301 ICDS projects in the states of Andhra Pradesh and Orissa while WB-ICDS
project II (1997-2000) covered 454 projects in the states of Bihar and M.P. This
project has been extended upto 2002. The WB-ICDS project III (1998-2004) started
in 1998-99 aims at covering 461 priojects in the states of Andhra Pradesh, Kerala,
Madhya Pradesh, Maharashtra, Rajasthan and Uttar Pradesh. The World Bank
assisted ICDS programme in A.P. is being implemented in 257 blocks as part of the
total programme of Andhra Pradesh Economic Reconstruction Programme (APERP).
39

The scheme was operational in 4384 blocks in 2000. By the end of 2001-02, 5171
blocks/urban areas are proposed to be covered which implies a 90 per cent coverage
of blocks by the end of the Ninth Plan. Along with the expansion of this scheme the
allocation of central government for this scheme have also increased. During the
Ninth Plan a sum of Rs.4960 crore for ICDS scheme has been allocated against
which Rs.2,159 crores were spent during the first three years.
During the Ninth Plan ICDS programme in Orissa and Andhra Pradesh were evaluated
by the National Institute of Nutrition. The World Bank and Government of India have
reviewed the ICDS programme in 1997. The findings are:
(a) ICDS services were much in demand but there are problems in delivery, quality
and coordination. The programme might perhaps be improving food security at
household level, but failed to effectively address the issue of prevention, detection
and management of undernourished child/mother; (b) Children in 6-24 months age
group and pregnant and lactating women did not come to the Anganwadi nor did they
get food supplements ; (c) Available food was shared between mostly 3-5 year old
children irrespective of their nutritional status; (d) There was no focused attention on
management of severely undernourished children; (e) No attempt was made to provide
ready mixes that could be given to 6-24 month child 3-4 times a day; nor was nutrition
education focused on meeting these children’s need from the family pot (f) childcare
education of the mother was poor or non-existent; (g) there were gaps in workers
training, supervision, and community support; (h) inter-sectoral coordination was
poor (GOI, 2000).
Efforts are underway to rectify some of these problems. Closer collaboration between
the ICDS and the health functionaries at all levels is being attempted.
NPNSPE
The National Programme for Nutritional Support to Primary Education (NPNSPE)
aims to promote improved nutrition and attendance of primary school children in the
whole country. The programme, more popularly known as the Mid-Day Meals
Programme, seeks to attract children to enroll themselves in primary school,
encourage regular attendance by providing supplementary feeding and improve their
nutritional status. The NPNSPE programme expanded rapidly in the 1990s, but
implementation problems hamper its effectiveness in achieving its intended goals.
A recent survey of school level participation in the mid-day-meal programme found
40
that in 6 states distributing foodgrains, on average only 66 per cent of households
with enrolled primary school children reported receiving their foodgrain allocations.
The programme is plagued with some critical implementation problems21 .
Supreme Court Orders
In recent years, the campaigns on right to food have given some dividends. Supreme
Court (SC) has given interim orders in response to the writ petition filed by PUCL in
April 200122 . The petition demanded the immediate utilization of the country’s food
stocks for drought relief and the prevention of hunger. The scope of the petition is not
restricted to drought situations. It also focuses on the general need to uphold the
“right to food” which flows from the right to life (Article 21).
In July 23, 2001 the SC directed the states to see that all the PDS shops, if closed,
start functioning within one week from today and regular supplies made. In 20th
August, 2001 hearing, the SC stated that it is the prime responsibility of the government
to prevent hunger and starvation. In 3rd September in the same year, the SC asked
the 16 states which had not identified beneficiaries for the Antyodaya Anna Yojana
scheme to do so within two weeks. The 28th November hearing concluded with an
important “interim Order” (valid for the duration of the proceedings). This interim
order has three significant components: (1) It covers the benefits of eight nutrition-
related schemes (PDS, Antyodaya, mid-meals, ICDS, Annapurna, old-age persons,
NMBS and NFBS)into legal entitlements; (2) it directs all state governments to begin
cooked mid-day meals for all children in government and government-assisted
schools; and (3) it directs the state and central governments to adopt specific
measures to ensure public awareness and transparency of these programmes. The
court also gave a time frame for implementation and asked the respondents to file
compliance reports before 11th February 2002, when the next hearing was scheduled.
On May 8, 2002, an interim order was passed by Supreme Court that deals with
various aspects of governance and implementation of the food and employment
schemes. (a) The order directs the states not to divert central funds meant for food
and employment schemes for other purposes. (2) The gram Sabha i.e. the village
councils have been authorized to conduct social audits over all food and employment
schemes implemented in their area. (3) Dr. N.C. Saxena and Mr. S.R. Sankaran are
21. More on this see World Bank (2001)22. See the website of the Right to Food Campaign (www.geocities.com/righttofood/) for the
Supreme Court interim orders.
41

appointed as commissioners who are authorized to monitor the implementation of
the schemes and redress complaints arising therein on behalf of the court. As
mentioned earlier, many state governments have violated the interim orders. However,
the Supreme Court directives have been putting pressure on the governments.
To sum up, the impact of the programmes under obligation to provide by the State is
mixed. Whatever the reasons, diversion of resources at such a massive scale suggests
serious failure on the part of government’s part to discharge its obligation to provide.
5. HOW TO PROGRESSIVELY REALISE RIGHT TO FOOD?
5.1. Supply Side and Demand Side
In the food security discussions, the analysis generally focuses on supply side. In
the rights approach, one has to go beyond supply side and focus more on demand
side. Supply of food and nutrition is important but as a right demand side is more
important. Unless citizens demand right to food, the governments may not fulfill
their obligations.
While the State is the primary duty holder, the Declaration puts the responsibility for
fulfilling rights on everyone – individuals, national governments and the international
community. But States have the primary duty to create national and international
conditions favourable for the realization of the right. In this context, the five principles
of rights based approach i.e. ENTAP (Equity, Non-discrimination, Transparency,
Accountability and Participatory) should be respected. In this section, we discuss
how to progressively realize right to food in India keeping in view the State’s
obligations. We also discuss in this section on financial and institutional issues for
realizing right to food.
Before going to these issues, we briefly document here the approach of Tenth Five
Year Plan (2002-07) on improving food and nutrition.
5.2 Tenth Five Year Plan Approach
Similar to MDGs (millennium development goals) at international level, Tenth Plan
for the first time sets monitorable targets for the Tenth Plan period (2002-07) and
beyond (see Box). All the targets directly or indirectly are important for right to food
also. The direct ones are those relating to poverty, gainful employment, potable
drinking water and forest cover.
42

Box 1
Monitorable targets for the Tenth Plan and Beyond
● Reduction in poverty ratio by 5 percentage points by 2007 and 15 percentage points by2012
● Providing gainful and high-quality employment at least to addition to the labour force overthe Tenth Plan period
● All children in school by 2003; all children to complete 5 years of schooling by 2007● Reduction in gender gap in literacy and wage rates by at least 50 per cent by 2007● Reduction in the decadal rate of population growth between 2001 and 2011 to 16.2 per
cent● Increase in literacy rates to 75 per cent within the plan period● Reduction of infant mortality rate (IMR) to 45 per 1000 live births by 2007 and to 28 by
2012● Reduction of maternal mortality rate (MMR) to 2 per 1000 live births by 2007 and to 1 by
2012● Increase in forest and tree cover to 25 per cent by 2007 and 33 per cent by 2012● All villages have sustained access to potable drinking water within the plan period● Cleaning of all major polluted rivers by 2007 and other notified stretches by 2012
Source: Planning Commission, GOI (2003)
For nutrition, however, specific goals are given. The goals set for Tenth Plan are:
● Intensify nutrition and health education to improve infant and child feeding and caringpractices so as to
❑ bring down the prevalence of underweight children under three years from the currentlevel of 47 per cent to 40 per cent
❑ reduce prevalence of severe undernutrition in children in the 0-6 years age group by50 per cent
● reduce prevalence of anemia by 25% and that of moderate/severe anemia by 50 per cent● eliminate vitamin A deficiency as a public health problem; and● reduce prevalence of IDD in the country to less than 10 per cent by 2010
Initiatives in the Tenth Plan for improving food and nutrition
There will be a paradigm shift from:
Household food security and freedom from hunger to nutrition security for the
family and the individual;
Untargeted food supplementation to screening of all the persons from vulnerable
groups, identification of those with various grades of under-nutrition and
appropriate management;
Lack of focused interventions on the prevention of over-nutrition to the promotion
of appropriate lifestyles and dietary intakes for the prevention and management of
over-nutrition and obesity.
43

Interventions will be initiated to achieve:
Adequate availability of foodstuffs by:
Ensuring production of cereals, pulses and seasonal vegetables to meet the
nutritional needs;
(a) Making them available throughout the year at affordable cost through reduction
in post harvest losses and appropriate processing;
(b) More cost-effective and efficient targeting of the PDS to address macro and
micronutrient deficiencies. This may include providing coarse grains, pulses
and iodized/double-fortified salt to below poverty line (BPL) families through
the targeted PDS (TPDS);
(c) Improving people’s purchasing power through appropriate programmes including
food for work schemes.
Prevention of under-nutrition through nutrition education aimed at:
(a) Ensuring appropriate infant feeding practices (universal colostrums feeding,
exclusive breast feeding up to six months, introduction of semisolids at six
months);
(b) Promoting appropriate intra-family distribution of food based on requirements’
(c) Dietary diversification to meet the nutritional needs of the family.
(d) Operationalising universal screening of all pregnant women, infants, preschool
and school children for under-nutrition.
Operationalisation of nutrition interventions for the management of under-nutrition
through:
(a) Targeted food supplementation and health care for those with under-nutrition;
(b) Effective monitoring of these individuals and their families;
(c) Utilization of the panchayati raj institutions (PRIs) for effective inter-sectoral
coordination and convergence of services and improving community
participation in planning and monitoring of the ongoing interventions.
Prevention, early detection and appropriate management of micronutrient deficiencies
and associated health hazards through:
44
(a) Nutrition education to promote dietary diversification to achieve a balanced
intake of all micronutrients;
(b) Universal access to iodised/double fortified salt;
(c) Early detection of micronutrient deficiencies through screening of all children
with severe under-nutrition, pregnant women and school children;
(d) Timely treatment of micronutrient deficiencies.
Nutrition monitoring and surveillance to enable the country to track changes in the
nutritional and health status of the population to ensure that:
(a) The existing opportunities for improving nutritional status are fully utilized; and
(b) Emerging problems are identified early and corrected expeditiously.
Research efforts will be directed towards:
(a) Review of the recommended dietary intake of Indians;
(b) Building up of epidemiological data on:
(c) Relationship between birth weight, survival, growth and development in childhood
and adolescence;
(d) Body mass index norms of Indians and health consequences of deviation from
these norms.
In view of the massive inter-state (and, perhaps even inter-district) variations in the
access to nutrition related services and nutritional status, state specific goals to be
achieved by 2007 have been worked out taking the current status into account.
National goals have been drawn taking into account the state specific goals (Table
17).
The approach of Tenth Plan is in the right direction. However, it is not clear how the
targets set in the plan will be achieved. The mechanisms for raising the resources
and the monitoring mechanisms are also not clear. It is not directly based on rights
based approach.
5.3. Realising Right to Food
For realizing right to food, three things may be necessary23 . One is the process of
formulation of policies. Second is the progressive realization of right and concern
for disadvantaged. Third is monitoring and accountability. The process of formulation
of policies should be participatory. Then only the policy makers come to know of the
23. More on this see Osmani (2003)
45
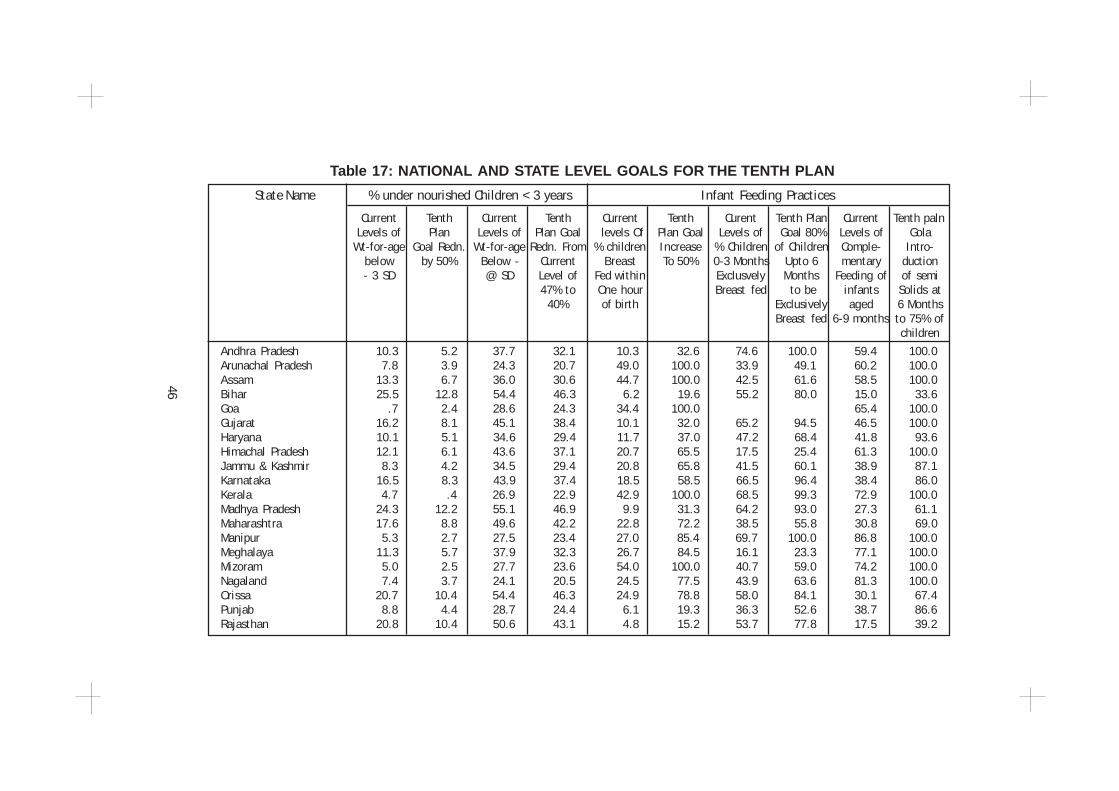
Table 17: NATIONAL AND STATE LEVEL GOALS FOR THE TENTH PLAN
State Name % under nourished Children < 3 years Infant Feeding Practices
Current Tenth Current Tenth Current Tenth Curent Tenth Plan Current Tenth palnLevels of Plan Levels of Plan Goal levels Of Plan Goal Levels of Goal 80% Levels of Gola
Wt-for-age Goal Redn. Wt-for-age Redn. From % children Increase % Children of Children Comple- Intro-below by 50% Below - Current Breast To 50% 0-3 Months Upto 6 mentary duction- 3 SD @ SD Level of Fed within Exclusvely Months Feeding of of semi
47% to One hour Breast fed to be infants Solids at40% of birth Exclusively aged 6 Months
Breast fed 6-9 months to 75% ofchildren
Andhra Pradesh 10.3 5.2 37.7 32.1 10.3 32.6 74.6 100.0 59.4 100.0Arunachal Pradesh 7.8 3.9 24.3 20.7 49.0 100.0 33.9 49.1 60.2 100.0Assam 13.3 6.7 36.0 30.6 44.7 100.0 42.5 61.6 58.5 100.0Bihar 25.5 12.8 54.4 46.3 6.2 19.6 55.2 80.0 15.0 33.6Goa .7 2.4 28.6 24.3 34.4 100.0 65.4 100.0Gujarat 16.2 8.1 45.1 38.4 10.1 32.0 65.2 94.5 46.5 100.0Haryana 10.1 5.1 34.6 29.4 11.7 37.0 47.2 68.4 41.8 93.6Himachal Pradesh 12.1 6.1 43.6 37.1 20.7 65.5 17.5 25.4 61.3 100.0Jammu & Kashmir 8.3 4.2 34.5 29.4 20.8 65.8 41.5 60.1 38.9 87.1Karnataka 16.5 8.3 43.9 37.4 18.5 58.5 66.5 96.4 38.4 86.0Kerala 4.7 .4 26.9 22.9 42.9 100.0 68.5 99.3 72.9 100.0Madhya Pradesh 24.3 12.2 55.1 46.9 9.9 31.3 64.2 93.0 27.3 61.1Maharashtra 17.6 8.8 49.6 42.2 22.8 72.2 38.5 55.8 30.8 69.0Manipur 5.3 2.7 27.5 23.4 27.0 85.4 69.7 100.0 86.8 100.0Meghalaya 11.3 5.7 37.9 32.3 26.7 84.5 16.1 23.3 77.1 100.0Mizoram 5.0 2.5 27.7 23.6 54.0 100.0 40.7 59.0 74.2 100.0Nagaland 7.4 3.7 24.1 20.5 24.5 77.5 43.9 63.6 81.3 100.0Orissa 20.7 10.4 54.4 46.3 24.9 78.8 58.0 84.1 30.1 67.4Punjab 8.8 4.4 28.7 24.4 6.1 19.3 36.3 52.6 38.7 86.6Rajasthan 20.8 10.4 50.6 43.1 4.8 15.2 53.7 77.8 17.5 39.2
46

Sikkim 4.2 2.1 20.6 17.5 31.4 99.4 16.3 23.6 87.3 100.0Tamil Nadu 10.6 5.3 36.7 31.2 50.3 100.0 48.3 70.0 55.4 100.0Tripura NA 3..9 NA 24.9 NA 100.0 NA 70.0 NA 100.0Uttar Pradesh 21.9 11.0 51.7 44.0 6.5 20.6 56.9 82.5 17.3 38.7West Bengal 16.3 8.2 48.7 41.4 25.0 79.1 48.8 70.7 46.3 100.0A & N Islands NA - NA - NA - NA - NA -Chandigarth NA 4.7 NA 27.0 NA 28.5 NA 60.0 NA 90.0Dadra & Nagar Haveli NA 8.8 NA 42.2 NA 72.2 NA 55.8 NA 69.0Daman & Diu NA 8.1 NA 38.4 NA 32.0 NA 94.5 NA 100.0Delhi 10.1 5.1 34.7 29.5 23.8 75.3 13.2 19.1 37.0 82.8Lakshadweep NA 2.4 NA 22.9 NA 100.0 NA 99.3 NA 100.0Pondicherry NA 5.3 NA 31.2 NA 100.0 NA 70.0 NA 100.0All India 18.0 9.2 47.0 40.0 15.8 50.0 55.2 80.0 33.5 75.0
Source for Current Level: NFHS 1998-99
Notes: 1. NFHS was not conducted in States with a * mark, in these the values have been estimated. 2. Current status for children in 0-3 years age-group is taken as representing status for children in 0-6 years age-group 3. As NFHS data for Chattisgarh, Jharkhand and Uttaranchal are not available, goals laid down are for undivided states.
4. As NFHS data for A&N islands was not available, no goals have been set.
47

problems of the poor. Also one has to take care of the disadvantaged persons in
providing food and nutrition. Monitoring and public accountability are important
instruments for realization of right to food.
5.4. Obligation to Respect and Protect: Land Issues
Owning or operation of land is one of the instruments for availability and accessibility
of food. The State has to respect and protect both ownership and security of tenancy.
There is some consensus that although there is no case for relaxation of agricultural
land ceiling, a greater liberalization of tenancy market is required. There are two
arguments in favour of liberalization of tenancy market. One is that poor will get
access to operation of land. Second one is that it increases access to credit for
small and marginal farmers once tenancy is legalized. Another change needed is in
the case of gender inegalitarian land laws and foster land ownership among women24
including widows. Similarly, the legal and implementation framework is still biased
against tribals and this could be one of the reasons for slow decline in poverty
among them.
5.5. Improving adequacy and accessibility
There is a need for reforms in the food and nutrition based programmes in order to
improve adequacy and accessibility. The reforms needed in the programmes are
given below.
Procurement and Buffer stock Policies : Needed Reforms
(a) Involvement of private sector: FCI inefficiency also led to increase in economic
costs of buffer stocks and which in turn led to increase in issue price. There is a
need to involve private sector in storage and distribution of foodgrains. The inefficiency
of FCI is known25 . This is also responsible for increasing economic costs of food
subsidy. Private sector has to be involved in handling the grains particularly storage
and distribution26 . Some studies have shown that private sector costs are lower than
those of FCI in handling the grains.
(b) Freeze minimum support prices for a few years: In order to control the rise in
minimum support prices, Commission for Agricultural Costs and Prices (CACP)
suggested freezing of MSP for a few years. It may be noted farmers are interested
24. More on gender and land rights see Agarwal (1994)25. See Gulati et al (1996)26. See World Bank, 1999 for some suggestions.
48

in the total net income (yield x price) from crops rather than only in price.
(c) Decentralized procurement: The Union Budget 2001-02 indicated enlarged role
for the state governments in both procurement and distribution of foodgrains for
PDS in an attempt to economise on procurement costs. It proposed that instead of
giving subsidized foodgrains, funds would be provided to the state governments to
enable them to procure and distribute foodgrains. Decentralised procurement already
started in Uttar Pradesh, Madhya Pradesh and West Bengal. Decentralised
procurement of foodgrains is intended to benefit both the farmers and consumers
while simultaneously improving the financial position of the Government. However,
state governments such as Punjab, Haryana, Andhra Pradesh and Kerala opposed
the decentralized procurement because of the lack of infrastructure and resources
with the states. These problems have to be solved before implementing the
decentralized procurement.
(d) Need for diversification of crops: The changing consumption patterns have
implications for food demand projections and need for more focus on non-cereal
food crops and allied agricultural activities . Some forecasts on cereal demand show
that 224 million tonnes (193.5 for food and 30.1 for feed) would be enough by 2020
(Dyson and Hanchate 2000). Even other forecasts show that it would be around 250
million tonnes. Thus there appears to be no case for concern over cereal demand
outstripping cereal supply in the Indian context. Slow down in population growth and
changing consumption patterns away from cereals would be responsible for slowdown
in cereal demand in future. It also indicates the need to take care of the supply side
factors for non-cereal food crops and allied agricultural activities (e.g. dairy). Public
and private investment in infrastructure and research is needed for these activities.
The minimum support policy has to be modified to encourage changes in cropping
pattern.
(f) Buffer stock levels: The FCI role should be restricted to price stabilization and
PDS operations may be left to states. FCI should procure only the required amounts
in the open market. Various committees have suggested the optimal size of buffer
stock which varies from 15 to 25 million tonnes depending on the season in a year.
The Expenditure Reforms commission recommended 17 million tonnes as the total
average stocks to be maintained for distribution and buffer stock. The private sector
has to be involved in storage and handling the grains. Restrictions on storage may
have to be removed.
49
Reforms in the Public Distribution System and other Programmes
Inspite of spending Rs.25,000 Crores on food subsidy, many of the poor are not
benefiting from the system. There is a need to have methods to reduce costs and
reach the poor.
(a) Geographical targeting is better. As mentioned above, there is a need to have
innovative programmes to minimize the errors of targeting. In this context, some
studies have shown geographical targeting is better than income based targeting27 .
In fact, the limited evidence on RPDS (revamped PDS) in Andhra Pradesh and
Madhya Pradesh suggest that the performance of PDS in RPDS villages was much
better than that in non-RPDS villages with similar socio-economic characteristics.
(b) Cost Effectiveness: Because of ineffective targeting, some estimates show that
Rs.6 are needed to give Rs.1 to the poor under PDS. There are three principal reasons
why the PDS does not deliver food subsidies efficiently (Ramaswami, 2002). These
are: (a) targeting errors i.e. income transfer to non-target groups; (b) excessive costs
of procurement, storage and distribution (relative to the private sector) and; (c)
leakages or fraud, i.e. illegal diversions of subsidized grain to the open market. Our
estimates show that out of around Rs.7000 crores consumer subsidy on wheat and
rice, only Rs.1000 crores reach the poor (see Mahendra Dev etal , 2003).
(b) Food coupon system or food credit card system could also be tried. A food
coupon system for distribution of rice and kerosene through PDS was introduced in
Andhra Pradesh in 1998-99. The scheme was aimed at improving the delivery system
of these two commodities. Under the scheme mere possession of card was not
adequate to draw PDS rice. Physical presence of the cardholder whose photo was
affixed on the card was insisted upon for obtaining the coupons. This has reduced
the scope of diversion of rice and kerosene to a great extent, if not totally eliminated
it. Another alternative is food credit card system which can be used by the customers
to buy subsidized foodgrains from the market and the retailers can claim the subsidy
from the government. However, private sector has to be ensured that they get
reimbursements from the government without delay
(c) Recommendations of High Level Committee on long term grain policy: The
committee has given short term and long term recommendations. Social Security
programmes with some food component in India broadly fall into three groups :
27. Bigman and Srinivasan (2001) Jha and Srinivasan (2001)
50

employment programmes for the able bodied, welfare programmes or social
assistance for specific vulnerable groups (including infants, pregnant and lactating
women, disabled and old age persons) and programmes for basic education and
nutrition of children. Once the current stocks are reduced, the committee recommends
that the resultant savings should be used for these programmes. They recommend
a food-based employment programme for the short run. The fiscal commitment should
continue after stocks have returned to normal. This should be in the form of a food-
linked employment guarantee component in the SGSY which is purely self-targeted.
Linkage with food in such cases could be through the existing PDS system (by
issuing coupons, or other food entitlement as wages). Expand the existing Antyodaya
scheme of food support to become a food security system for the entire destitute
population. Central support should be given to the extent of 50 per cent for moving to
a cooked Mid-day meal scheme for all school-going children. Support and strengthen
the programmes like ICDS to help women and children. On PDS, The committee
recommends that a system of universal PDS be introduced28 . .
(d) Effective implementation of Food for work programmes (FFW) can improve food
accessibility. As mentioned above public works programmes have many direct and
indirect benefits to the poor . In public works we can have two components. One is
how to utilise the available excess stocks effectively for FFW. Second one is that
we should also improve the effectiveness of cash for work programmes like SGRY
in order to increase purchasing power for the unskilled workers. With the increase in
purchasing power they can buy foodgrains in PDS or in the market. Therefore, food
accessibility does not mean that we should deal with only foodgrains. We should
also deal with increase in purchasing power. Another question is how to link it with
PDS. One thing is to ensure that subsidized foodgrains under PDS are reached to
the workers working in FFW. They will get double benefits (under FFW and PDS).
Recently announced Prime Minister’s Sampoorna Rojgar Yojana (Rs.10,000 crores)
is supposed to provide full assistance for the states to implement FFW.
(e) Improve the Effectiveness of ICDS and other nutritional programmes. ICDS has
been effective but there are some gaps in implementation as shown by several
evaluations. Tamil Nadu Integrated Nutrition Programme (TINP) is effective in
improving nutrition of children and enrolment in schools.
28. On the advantages of universal PDS, see Swaminathan (2000)
51

How different is TINP29 ?
● The percentage of expenditure on nutrition in total revenue expenditure is highest
in TN.
● Reduction in severe malnutrition among 6-60 months old children in 5 years during
TINP-I.
● TINP-II showed systematic improvements in severe and moderate malnutrition
reductions with increase in normal and mild malnourished categories for the children
and reductions in low birth weights.
● Regular growth monitoring and selective feeding based on this information were
identified as the main causes of success.
● Immunization of children and mothers was regular with (universal) coverage of 90%
and massive doses of micronutrient supplementation like Vitamin A, iron and folic
acids with a coverage rate varying from 35 to 60 percent.
● Better targeting of the schemes due to decentralization.
● Better management of the schemes leading to low level of leakage.
● Good coordination with health services in the later stages of the program.
● The nutrition centers in rural areas had two workers, one looking after the needs of
the 0-3 year olds and the other to take care of pres-school education and nutrition
of the 3-6 year olds. This resulted in good impacts for both the age groups unlike the
experience in ICDS areas which favored the 3-6 year olds.
● Calorie-protein content of the food supplement is clearly stated with regular surveillance
of the quality. Few deviations form quality had been observed.
● Some success seems to have been achieved in changing permanent nutritional behavior.
● Institutional sustainability is apparent as the program is now being completely managed
by the staff as the World Bank input has come to an end.
● Strong political commitment to implement and improve the nutrition schemes.
● A recent policy note by the state government indicates a plan for (a) making the
state malnutrition free along the United Nations advocated approach of “nutrition
throughout the life-cycle” (b) change in focus of the programs from management to
prevention of malnutrition (c) convergence of health and nutrition services under
one department (d) focusing on nutrition and education of the adolescent girls and
(e) economic empowerment of women.
29. This is based on Viswanathan (2003)
52

It is not clear why this has not been tried effectively in other states.
(f) Focus on women and other vulnerable groups: Women’s agency is important in
realizing food. Widows and single woman should be given special attention.
Women’s empowerment in terms of active economic, social and political roles is
important for not only improving intra-household distribution but also improving
the government and NGO programmes.
(g) Regionally Differentiated Strategy: Uniform policies at the national level may not
be applicable at state level because the requirements of availability, accessibility
of food and nutrition differ from state to state. For example, Kerala is a deficit
state in foodgrains. Food availability is as important as food access. There are
many surplus states in foodgrains (Punjab, Haryana, Madhya Pradesh, West
Bengal). In Bihar, seasonal hunger is a problem than availability in a year.
Right to Food campaign proposals
The Right to Food Campaign has been advocating for programmes of employment
for the able and food entitlements for the destitute as shown below.
(a) Expanding the Employment Guarantee through the country: An application has
been made to the Supreme Court arguing that the Maharashtra’s successful
Employment Guarantee Scheme should be expanded through the country. The
scheme guarantees unskilled manual labour for any able bodied person who presents
himself or herself for work. Each person is entitled to up to 100 days of employment.
The greatest success of the scheme lies in the selection of the right beneficiaries.
The Supreme Court has asked the respondents to reply to this application. The
states have been filing their applications and the hearings are going on.
(b) A Social Security System for the Destitute: Some of the most vulnerable people
to hunger are the destitute including widows & old without family support, and
physically and mentally disabled. These are people who would find it difficult to find
an employment especially when the going gets tough. They would not be able to
avail of employment opportunities even if employment were to become a right. To
these people, The Right to Food Campaign argues for having direct food entitlement
as a right. The application is being prepared arguing for a scheme that gives direct
food entitlement for the destitute. The scheme should be universal in nature (covering
all destitute, as are defined). They argue for the adoption of the many of the features
of the Antyodaya Anna Yojana for this scheme.
53

Apart from the above, there is a need to promote grain bank schemes and food
credit schemes30 .
5.6. WTO Agreement and Food Security
India does not have to reduce its subsidies due to WTO. It has to be vigilant regarding
imports from other countries and change tariffs based on circumstances. India has
submitted its proposals for the current negotiations on the Agreement on Agriculture
in the areas of market access, domestic support, export competition and food security
to the WTO in January, 2001. The guiding principles on which these are based are:
Food & livelihood security of our people, protection of the interest of domestic farmers
and maximising export opportunities for Indian agricultural products.
Implementation of the WTO agreement on Agriculture since 1995 has brought out
the inadequacies inherent in the agreement. The ongoing negotiations in the WTO on
the AOA provide an opportunity for India to rectify these inadequacies and inequalities.
India would therefore do well to use this occasion to lay stress on the implementation
of Uruguay round agreements to reduce subsidies and other distortions by developed
countries.
5.7. Employment and Livelihoods: Labour Intensive Pattern of Growth
As mentioned above, right to fulfill includes right to facilitate. Productive employment
is crucial for achieving right to food. One of the reasons for accumulation of over 60
million tonnes of food stocks with FCI is attributed to low purchasing power of the
poor. Two factors could be responsible for the low purchasing power in the 1990s.
First, high relative prices of food due to high procurement prices could have reduced
the capacity of the poor to purchase more food grains. Second factor could be
decline in employment opportunities inspite of high GDP growth. The solution to
food security and reduction in poverty is to improve economic access through
employment. Diversification and promotion of rural non-farm employment are needed
to create productive employment. Therefore, right to employment is crucial for
achieving right to food. As shown above, the experience of the1990s in employment
creation is not very encouraging.
30. On grain banks in Andhra Pradesh, see Satish (2000). On food credit scheme see Gopal andRanjan (2002)
54
How to create more employment opportunities and improve their quality? There are
mainly two approaches. One is through sectoral programmes and the other is through
direct employment programmes. There is some overlapping in both the approaches.
The elasticity of employment to GDP shows that for the entire economy it was 0.53
in the period 1977-83 and declined to 0.41 in the period 1983-94. The elasticity
declined sharply to 0.15 in the during 1993-2000. Employment elasticities in agriculture
and community social and personal services were zero during the same period. In
the case of manufacturing it was 0.26 while in the case of services it was more than
0.50 during this period.
Agriculture still contributes 60% of the total employment in the country. In the decade
1983-94, agriculture contributed 50% of the additional employment. On the other
hand, there was an absolute decline in agricultural employment between 1993-94
and 1999-00. In the process of economic development, the workers in agriculture
are supposed to shift to non-agriculture. However, underemployment can be removed
with higher agricultural growth. Also, agriculture has still potential of absorbing workers
in regions with higher incidence of rural poverty such as Orissa, Bihar, Assam,
M.P., West Bengal, Uttar Pradesh.
Within agriculture and allied activities, there seems to be some diversification towards
non-cereal crops. Diversification to fruits and vegetables, fisheries, animal husbandry
is expected to promote employment. For example, in Maharashtra, the requirement
of person days per hectare per crop season for wheat is 143 while for vegetables it
is 200. The corresponding numbers for fruits and grapes are 855 and 2,510 respectively.
Thus, fruits in general require nearly six times and grapes in particular over seventeen
times the person days required per hectare as compared with wheat. However, risk
and uncertainty is associated with diversification. Technology, infrastructure and
market have to be improved in order to shift the farmers to non-foodgrain crops.
Development of wastelands will also increase lot of employment opportunities.
Currently, there are about 24 million hectares of land that are categorized as culturable
wasteland and permanent fallows, which is feasible to be developed and brought
into cultivation. There can be two alternatives here. First, one can think of distributing
these lands to panchayats and small and marginal farmers. Another alternative is to
give it to corporate sector on long lease of say 20 years. Panchayats and corporate
sector can develop the waste land by raising resources in the market. However, one
has to make sure that corporate sector does not occupy the fertile land.
55

Growth in Rural non-farm employment (RNFE) can improve rural wages and also be
an escape route for agricultural workers leading to an improvement in their purchasing
power. The importance of the rural non-farm sector in poverty alleviation and promotion
of livelihoods is being increasingly recognised. Increase in rural non-farm employment
is one of the main factors responsible for the reduction in poverty in the 1980s. The
percentage of RNFE in total rural employment in India increased from 16.6 per cent
in 1977-78 to 18.4 per cent in 1983, to 21.6 per cent in 1993-94 and to 23.8 per cent
in 1999-2000. The growth rate (compound) in RNFE during 1977-83 was 4.06 per
cent per annum while it was 3.28 per cent per annum and 2.14 per cent per annum
during 1983-94 and 1993-2000 respectively. In other words, during the reform period
(’93-94 to ’99-00) the growth rate of employment in RNFE was lower than the pre-
reform period. This is a matter of concern. However, this has to be seen in the
context of the low overall growth of employment (around 1 per cent per annum)
during the reform period. At the same time the expected growth in non-agriculture
due to economic reforms does not seem to have materialised. As compared to the
East Asian experience, the growth in RNFE in India has been much slower.
One of the challenges of the reforms now is to improve the quality of employment
and incomes in the rural non-farm sector. A three- pronged strategy is needed for
enhancement in the livelihoods of the rural poor. First, the Government should have
policies to improve education and skills of the workers. Second, they should have
several policies to increase employment for the unskilled workers. Third, the incomes
of the women have to be improved by creating opportunities in the higher productivity
sectors. Most of the women are confined to agriculture. There was only 0.7 per cent
increase in the share of RNFE during the reform period. For the above three strategies,
pro-poor growth engines have to be identified at sub-sectoral level rather than at the
level of broad sectors. Public investment in agriculture and rural non-agriculture has
to be improved significantly to improve the quality of RNFE. In order to improve rural
non-farm sector, there is a need to look at issues such as, rural-urban linkages,
sectoral and sub-sector potentials, markets, regulations and promotional policies,
human capital, training, entrepreneurship, skills and finally infrastructure and
technology. Rigidities in these factors have to be removed to promote rural non-farm
sector. Allowing the poor to contribute to and benefit from increased growth rates will
pose particular challenges as employment in India is largely in the unorganised
sector.
Thus, right to employment becomes crucial for the success of right to food.
56

5.8. Sustainability of Right to Food
It is important to have sustainability as one of the important elements of right to
food. Long term availability and accessibility of food has to be ensured. Technological
improvements in agriculture, infrastructure and environment friendly agricultural
practices are important for ensuring sustainable food production. Similarly, the food
and nutrition programmes have to be cost effective and delivery systems have to be
improved. Also, creation of productive or quality employment is needed for
sustainability of right to food.
5.9. Costs of Realizing Right to Food
It is difficult to estimate costs for employment creation through sectors as we need
to estimate required investments in different sectors. However, we can have some
idea about the costs for different programmes for realizing right to food.
Methodology for estimating the costs: The cost of ensuring that the poor eat
cereals as per the norms is estimated using the NSSO, 1999-2000 data ( Table 18).
We take two alternative norms. The ICMR norm prescribes minimum quantity intake
for cereal for adult men, women and children. An average norm is worked out using
the population proportions of NSSO data. The average norm estimated was 157.00
Kg per capita per annum. The second norm is the 143.00 kgs per capita per annum.
This norm is prescribed by NIN. The average per capita cereal consumption of poor
is 131.87 kg. For the poor the cereal consumption is 25.13 kgs lower than the ICMR
norm (157.00 kgs). We assume that this gap will be filled by rice and whet supplies
through PDS. With an estimated 221.65 million poor, the total quantity of rice and
wheat required to be supplied would be 5.57 million tones. From the PDS utilization
data of 1999-2000 we have estimates of total PDS supplies of rice and wheat to poor
as well as to all the consumers. In 1999-2000 the total aggregate supply to all the
poor was 2.64 mt and for all the consumers it was 12.03 mt. For the same year the
total central Government spending on the PDS was 73161 million rupees. This implies
that to transfer a kg of rice/wheat to poor under present system, it cost the central
Government Rs. 27.70. For all the consumers the cost was Rs. 6.08/kg. Under perfect
targeting this would be the cost. Given the cost of transferring one kg of rice and
wheat/rice, the total additional costs required to supply the additional quantities are
worked out. To ensure that the poor consume cereals as per ICMR norm the additional
amount required would be Rs. 154297 millions under the present system (Table 18).
If there is perfect targeting, the cost would be Rs. 74027 millions.
The costs for NIN norms are similarly worked out (Table 18).
57

Table 18: Cost of Ensuring Dietary Intake of Norms of Cereals to Poor
1 Population a) Rural Millions 713.34 b) Urban Millions 283.69 c) Total Millions 997.02
2 Percentage of Poor a) Rural % 26.30
b) Urban % 12.00 c) Total % 22.23
3 Number of Poor a) Rural Millions 187.61 b) Urban Millions 34.04 c) Total Millions 221.65
4 Percapita per annum PDS Purchase of Rice+wheat by poor a) Rural Kg 12.12 b) Urban Kg 10.8
5 Percapita per annum PDS Purchase of Rice+wheat by all a) Rural Kg 12.48 b) Urban Kg 11.04
7 Aggregate annual PDS supply of Rice+Whear -All India a) Poor MT 2.64 b) All MT 12.03
8 Total Annual Spending on the PDS (Rice +Wheat) Rs. Million 73161
9 Cost of transfer of one kg Rice+Wheat to poor (8/7a) Rs 0.00 27.70
10 Cost of transfer of one kg Rice + Whear) to all (8/7b) Rs 0.00 6.08
11 Average cereal consumption of poor (per annum) a) Rural (11.23 kg*12) Kg 134.76 b) Urban (9.66kg*12) Kg 115.92 c) All India Kg 131.87
12 NIN Norm for cereal consumption Kg 157
13 Additional Aggregate Cereal quantity required to meet NIN norm MT 5.57
14 Costs Required for supplying additional rice+wheat(in the existing system) (15a*9*1000) Millions 154297
15 Costs Required for supplying additional rice +wheat(in perfect Targeting) (15b*10*1000) Millions 74027
58
ALTERNATIVE NORM DERIVED FROM ICMR12 NIN Norm for cereal consumption Kg 143.0013 Additional Aggregate Cereal quantity required to meet NIN norm
a) For poor MT 2.47b) For all MT -
14 Costs Required for supplying additional rice+wheat(in the existing system) Millions 68350
15 Costs Required for supplying additional rice +wheat(in perfect Targeting) Millions 15002
Note: The norm is taken as the weighted average of norms specified for men, women andchildren using population weights. In case of rural areas the average norms undersedentary, moderate work and heavy work is taken, while in urban areas the norm takenis for sedentary work.
Source: Estimated by the author.
The report of Tenth Five Year Plan provides some estimates of gaps in requirement
of funds for nutrition. These are given in Table 19. It shows that around Rs.2050
crores are needed to provide double the ration to all severely under nourished children
and pregnant women. State level requirements can be seen from the table.
The high level Committee on Long-term grain Policy indicates that the proposals
suggested in the report would ‘release enough resources not only for support to
farmers and better rural infrastructure, but also can make a real dent on malnutrition
and hunger. It advocates enlargement of Antyodaya to all the destitute, a guaranteed
employment of 30 days of employment for agricultural labourers, cooked meals in
all schools and making ICDS more effective.
According to the Committee, very large fiscal resources of around Rs.10,000 crore
annually will become available as the stocks are reduced to normal levels. It
recommends expansion of SGRY by increasing cash component by at least Rs.5000
crore annually. Another recommendation is extension of 50 per cent Central support
to states for moving to a cooked Mid-day Meal scheme for all school-going children.
In terms of resources, presently the Central Government spends lot of resources on
existing programmes. In 2001-02, government spent Rs.25,000 crores on food subsidy
and about Rs.10,000 crores on other programmes. It comes to around 1.6 per cent
of GDP and 10 per cent of total government expenditure. Main problem seems is to
improve the effectiveness of the programmes.
59

Table 19:Gaps in Requirement of Funds for Nutrition
Sl. State Funds available for Requirement of funds forNo. Name Supplementary Nutrition Supplementary Nutrition
State PMG Total I* II* III* IV*Plan Y
01. Andhra Pradesh 31.50 21.31 52.81 54.32 95.36 54.80 75.0902. Arunachal Pradesh 9.28 10.23 19.51 2.28 1.03 0.86 7.2303. Assam 30.00 26.94 56.94 55.67 44.69 31.82 27.6304. Bihar 32.92 43.09 76.01 244.13 295.41 227.69 92.8205. Goa 0.50 0.12 0.62 0.22 0.71 0.37 2.8806. Gujarat 129.50 9.72 139.22 34.96 92.58 61.19 84.0307. Haryana 3.50 2.52 6.02 10.17 27.76 18.10 30.1808. Himachal Pradesh 9.40 10.59 19.99 2.13 7.96 5.12 19.2909. Jammu & Kashmir 8.25 25.74 33.99 1.72 10.01 6.53 26.1610. Karnataka 47.34 11.27 58.61 48.82 92.06 61.95 84.4511. Kerala 0.30 10.36 10.66 16.35 16.52 9.44 43.4712. Madhya Pradesh 51.25 17.07 68.32 142.43 189.26 141.91 90.4513. Maharashtra 57.47 14.87 72.34 115.84 181.14 127.65 107.0714. Manipur 8.29 7.28 15.57 3.10 1.46 0.91 8.6715. Meghalaya 6.15 6.09 12.24 5.39 3.97 2.84 5.2816. Mizoram 4.15 6.06 10.21 0.92 0.62 0.39 3.2117. Nagaland 6.17 6.17 12.34 3.00 1.43 1.14 6.6318. Orissa 54.79 14.78 69.57 87.04 87.01 58.98 67.7419. Punjab 9.00 6.06 15.06 6.71 20.61 14.79 25.8620. Rajasthan 25.69 14.46 40.15 56.76 161.41 119.56 62.6421. Sikkim 4.21 4.22 8.43 0.99 0.26 0.18 1.3522. Tamil Nadu 93.87 15.72 109.59 51.55 62.69 39.75 119.3723. Tripura 8.72 7.62 16.34 5.0324. Uttar Pradesh 63.77 52.34 116.11 340.75 495.73 367.04 164.6725. West Bengal 97.47 25.17 122.64 105.05 147.70 99.81 103.3826. A & N Islands 1.54 1.54 3.08 0.33 0.9327. Chandigarth 0.73 0.68 1.41 0.22 0.7528. Dadra & Nagar Haveli 067 0.20 0.87 0.24 0.3329. Daman & Diu 0.28 0.16 0.44 0.03 0.2130. Delhi 25.17 1.66 26.83 5.51 12.90 10.69 8.8531. Lakshadweep 0.28 0.27 0.55 0.05 0.1532. Pondicherry 6.46 0.72 7.18 0.86 1.77
All India 828.62 375.03 1203.65 1402.59 2050.27 1463.51 1280.55
I*. To provide nutrition @ Rs. 1/- per day for 300 days in an year to all pregnant women andchildren upto 6 years in the BPL families (by Planning Commission)
II*. To provide double the ration to all severely under nourished children and pregnant women(by Planning Commission)
III*. To provide double the ration to all severely under nourished children only (by PlanningCommission)
IV*. To provide nutrition @ Rs.1/- per day for 300 days in an year to beneficiaries (72 in no.)as per ICDS norms of 1999 (by Department of WCD)
Source: GOI (2003)
60

5.10. Role of the Government in Implementing the Right to Food
The primary responsibility in implementing the right to food lies with the government
(center and states). In order to fulfil the obligations all levels of government and
public sector organizations must coordinate their actions. This coordination should
be not only among themselves, but also with other parties within the country including
NGOs, individuals and other national institutions, as well as with other countries and
international organizations. Such coordination, or at least the existence of a functioning
coordination mechanism, would be essential for effective implementation of right to
food. But the absence of coordination can not justify the non-fulfillment of an obligation.
The government has the obligation to provide food to the poor and vulnerable groups.
Effective implementation of the programmes mentioned above (PDS, nutrition
programmes, direct employment programmes, Antodaya programme etc.) will partly
satisfy the obligation to provide under right to food. The state also has the obligation
of provide direct provision of food or resources during emergencies like severe drought
or floods or armed conflict. The role of government as a facilitator is also important.
The measures mentioned by us for creation of employment through labour intensive
growth fall under the obligation to facilitate. It includes improving measures for
development of sectors like agriculture and non-agriculture.
What are the constraints for implementing the right to food? Resource constraints,
the usual problems of governance and institutions, lack of political will have been
acting as constraints for implementing right to food. In the Indian case resources in
terms of availability of foodgrains do not seem to be a problem. We have more than
50 million tones of foodgrains with the government. It is true that most of the state
governments are having fiscal problems. However, it is the lack of political will rather
than resources is the problem. Unfortunately, the institutional structures that could
undertake appropriate delivery systems have eroded over the years, and there is an
urgent need to reinvent them along appropriate levels.
At the national level, 20 countries in the world have constitutions that more or less
explicitly refer to the right to food or a related norm. India’s name figures in the list of
these countries. However, there is no framework for achieving right to food. Enforce
mechanisms are also weak or non-existent as a consequence of both the fact that
national legislation is inadequate and the fact that economic, social and cultural
rights are generally not considered to be justiciable, by their very nature. It is therefore
not possible to bring a complaint before a court of law. However, there is now very
61

visible progress being made on the justiciability of the right to food. As jurisprudence
builds up, it will also become increasingly clear how the right to food can be justiciable.
There are already a number of cases of national jurisprudence that show clearly that
the right to food or other economic, social and cultural rights can be considered
justiciable. Although enforcement mechanisms are generally weak, there has been
some encouraging progress. The PUCL’s (People’s Union for Civil Liberties) petition
and the subsequent Supreme Court interim orders on right to food are in the right
direction. The Supreme Court reminded Government’s obligation of right to food and,
at the very least, the people are not exposed to malnutrition, starvation and other
related problems.
Monitoring mechanisms should be developed in order to fulfill the obligation of right
to food. It is necessary to identify appropriate indicators and benchmarks to monitor
the status of realization of right to food. The indicators or benchmarks have to represent
not only the quantitative progress in providing a particular service to a population but
also the qualitative manner the service is provided. The base line indicators should
cover levels and trends of food security in its multiple dimensions – availability,
economic access and absorption and other dimensions such as vulnerability, social
exclusion, and acute destitution. India has a wealth of information on food security
indicators. A baseline of key indicators can be developed even at the district level.
Particular effort will have to be made to identify differences in trends in urban and
rural outcomes and gender dimensions. The baseline exercise will not only lay out
the facts (levels and recent trends in food security indicators and the efforts towards
fulfilling right to food) but also identify some of the key policy challenges in reaching
these goals. As noted above, the challenges are likely to be different between urban
and rural areas and in different regions.
5.11. Ensuring and monitoring Five principles of Rights Based Approach
There is a need to ensure and monitor the five principles (ENTAP) of rights based
approach.
Equity: Monitoring mechanisms should be adopted to help the poor and vulnerable
groups. The latter category include children, pregnant women, widows, single women,
old age population, destitute, disabled persons, socially disadvantage sections like
scheduled castes and scheduled tribes. Also inequalities across and within states
should be reduced. Production and distribution policies have to be sensitive to the
local problems in ensuring food and nutrition.
62

Non-discrimination: Gender discrimination should be avoided and intra-household
distribution should be improved. Similarly, as mentioned above, poverty among SCs
and STs is high and they should not be discriminated while ensuring right to food. In
other words, social exclusion should be avoided while identifying the beneficiaries
under the programmes.
Transparency, Accountability and Participation: Right to information as demanded in
Rajasthan would help transparency, accountability and participation in government
programmes. Involvement of good NGOs make these rights based principles possible.
On participation, decentralization of administration and involvement of Panchayats
would help increase participation.
As Dreze and Sen (2002) mention, the losers due to corruption and other non-
transparent methods have to be mobilized. They give the illustration of the work of
Mazdoor Kisan Shakti Sangathan (MKSS) in Rajasthan. ‘It has been noted, for
instance, that drought relief programmes in Rajasthan in 2000-01 have been
remarkably ‘corrupt-free (at least in comparison with the situation that prevailed in
earlier droughts) largely due to greater public vigilance as well as the improved
accessibility of official records – both of which are closely related to the ‘right to
information’ movement (p.367)31 .
In order to achieve the goals of Tenth Plan and beyond on food and nutrition in a
rights based perspective, effective monitoring system has to be introduced at different
levels i.e. Centre, state, district and village levels. While the functions of the State in
India have steadily increased, capacity to deliver has declined over the years due to
administrative cynicism, rising indiscipline, and a growing belief widely shared among
the political and bureaucratic elite that state is an arena where public office is to be
used for private ends.
The working of public distribution system (PDS) illustrates the weak monitoring system
in many of the programmes. The officials at the Ministry of Food at the Centre are
aware that the numbers reported by the states are often unreliable, but they see no
possibility for efficient checks of the provided information. The agencies seem to
keep their bookkeeping straight. But these numbers, based on household survey do
not reflect the reality in the villages, where only a fraction of the supply chain reaches
the card holders. The supervision by the supply inspector on the block and village
31. More on transparency and corruption, accountability and countervailing power, see Drezeand Sen (2002).
63

level is in general weak. The vigilance committees of the PRIs comprise some of the
same government officials who are supposed to be supervised by these committees.
Field reports on UP show that in localities visited, there were no functioning vigilance
committee on the district or block level32 . There is also inadequate transparency
regarding the beneficiaries’ access to information about quantity, quality, prices, and
times of supply was limited in several of the villages visited.
5.12. Conditions for Success
Political Will: In order to implement the programmes, political will is important. The
Southern states in India have done well in terms of political will as compared to
some of the Northern and Eastern states.
Resources: Resources are important for undertaking some of the programmes in
realizing right to food. Growth of the economy and resources are important for
sustainability of the programmes.However, resource availability can not be a pre-
condition for fulfilling rights.
Effective Implementation: Providing resources is only one part of the story. Effective
implementation of the programmes is important in order to reach the benefits to the
poor.
Right to Information: As mentioned above, right to information would empower the
poor regarding their rights in terms of government programmes and leads to
accountability.
Social Mobilisation: Mobilisation of poor and other vulnerable groups and putting
pressures on bureaucracy and politicians would enhance public accountability.
Decentralisation: Decentralisation is also important for accountability. It is also more
participatory. The lower strata of society will have a chance to participate in local
governance. It may be noted that women in panchayats are relatively doing well in
solving people’s problems. One can expect better delivery systems in PDS and
other programmes if panchayats are involved.
5.13. Role of NGOs and International Organisations
NGOs in particular and civil society in general have to play a major role in fulfilling
the right to food. They can help in two ways. First, NGOs themselves can organize
32. See Kriesel and Zaidi (1999)
64
innovative programmes for raising food security of the poor. Grain bank at local level
is an example of NGOs innovative programmes. Secondly, they can help the
government in fulfilling the obligation of right to food. NGOs have a major role to play
in applying the principles of accountability, transparency and participation in
implementing the right to food. NGOs can play a very effective role in the
implementation of the rights. When the right to food has to be realized in a participatory
manner, with participation of the beneficiaries in the decision making and benefit-
sharing, with accountability, transparency and in a widely decentralized process,
NGOs may have to play an even more crucial role in monitoring the programmes
and delivering the services and sometimes may have to replace the existing
bureaucracy. The human rights NGO People’s Union for Civil Liberties and the Right
to Food Campaign have played important role ,in recent years, in highlighting the
obligation of fulfilling the right to food by the government. However, there has been a
proliferation of NGOs in India. The issues of funding, the identities and the
commitments of NGOs are quite complex. There is a need for transparency and
accountability for NGOs.
The charter of the United Nations recognized the obligation of international cooperation,
by virtue of which the international community and multinational organisations are
expected to cooperate with nation states to enable them to fulfil the human rights of
the individual level. At one level, the developed countries can increase the target of
at least 0.7 per cent of GNP to official development assistance (ODA). In practice,
however, there is no big support from developed countries in fulfilling right to food in
developing countries.
6. CONCLUDING OBSERVATIONS
The objective of this paper is to examine right to food in the Indian context. We
analysed the right to food in terms of availability, accessibility, adequacy and
sustainability. These were examined in rights based perspective. Specifically, the
paper addressed the following questions:
(a) What are the definitions, contents and obligations of right to food? (Section 2)
(b) How far India progressed in fulfilling realising to food?
(c) What are the programmes and policies India followed in realising right to food?
(d) What should be done to realise right to food to all citizens of India?
65

Progress is examined in terms of availability, accessibility (physical and economic).
Programmes and policies are scrutinized in terms of obligation to respect, protect
and fulfill (facilitate and provide).
India is signatory to many international treaties involving right to food. Indian
Constitution also indirectly refers to right to food. Therefore, there is an obligation for
the Indian Government (Centre and states) to fulfill the right to food of the people.
Inspite of many programmes, there are concerns regarding food and malnutrition.
Some of the worst violations of the right to food can be seen in India today. On the
undernutrition levels are among the highest in the world. The problem of malnutrition
is acute and widespread. It is extremely serious among women and children. The
proportion of pregnant women with anemia is as high as 88 per cent. At the all India
level, more than 50 per cent of the children under five are underweight in 1998-99.
The percentage of malnutrition is much higher in poorer states like Bihar, Uttar Pradesh
and Madhya Pradesh. On the other hand, India has accumulated more than 50
million tones of rice and wheat in public warehouses – largest accumulation in world
history.
We examined the problems in various welfare programmes. In order to realise right
to provide, the following programmes have to be strengthened and implemented
effectively
(a) Public Distribution system and Annapurna schemes
(b ) Extending Antyodaya Anna Yojana to all the destitutes in the country.
(c) Nutrition programmes for education (mid-day meal schemes) and Integrated child
development schemes (ICDS).
(d) Extending Maharashtra’s Employment Guarantee Scheme (EGS) throughout India.
Part of the wages can be paid as food.
(e) Gender aspects of food security should be given importance in realizing right to
food. Women’s economic and social empowerment not only improves intra-
household food distribution and health related matters but also improves the
working of food and nutrition programmes.
We also examined the market reforms needed for achieving higher and sustainable
growth in agriculture and right to food for the poor. As mentioned above, we have a
paradoxical situation of large accumulation of foodgrain stocks along with 260 million
66

population below poverty line. Continuous increase in procurement prices have led
to accumulation of stocks much above the levels required for buffer stock. The
steep rise in the procurement prices have discouraged the holding of stocks by the
private sector, made exports uncompetitive and reduced the domestic consumption
of food grains, particularly by the poor. Procurement system has to be decentralised.
Private sector may have to be involved in storage and handling the grains. In the
case of PDS, cost effective methods have to be tried in order to reach the poor
effectively. In the case of agricultural policies, there is a need to have faster reforms
in agriculture in order to have win-win-situation for farmer, worker and consumer.
Supply side factors such as irrigation, infrastructure, technology, research and
extension and, marketing have to be improved to have higher and sustainable growth.
A multi-dimensional reform agenda has to be developed by improving incentives,
rationalizing subsidies, promoting investments and protecting the poor. WTO provides
opportunities and challenges for Indian agriculture. The expected gains since 1995
due to WTO i.e. reduction of agricultural subsidies by developing countries have not
materialised. There is a need for extreme vigilance so as to take timely measures
within the existing tariff bindings to restrict imports, which affect our producers’
livelihoods. The viability of Indian agriculture depends on internal factors like public
investment in infrastructure and research. Cost-reducing technology has to be
promoted to compete in the world markets and to achieve food security for the poor.
The accumulation of foodgrains also indicates that there is a need for crop
diversification in agriculture sector. This will also improve employment opportunities.
Similarly, reforms should be undertaken for the growth of rural non-farm sector. The
rigidities for increasing rural non-farm employment have to be removed in order to
have rural transformation.
All the above things have to be based on rights based framework of equality, non-
discrimination, transparency, accountability and participation (ENTAP). Basically we
have to go beyond supply side and focus on demand side. Social pressures are
needed for public action. Better monitoring systems have to be developed at Central,
state, district and village levels to realize right to food. Justiciability is one aspect of
right to food. In this context, recent Supreme Court Orders and the Right to Food to
campaign are in the right direction. However, one (particularly the poor) can not go to
court every time right to food is violated. It is the responsibility of citizens and NGOs
to organize campaigns for better functioning of the programmes. Also there is need
67

for mechanisms for better delivery systems by the government with transparency
and accountability. Public accountability is crucial for the success of right to food.
Other rights such as right to health and education, right to information, right to water
etc. are equally important for realization of right to food. It may be noted that health
facilities and drinking water would improve the food absorption by people and in turn
nutrition.
Finally, the paper argues that right to employment is crucial for achieving right to
food. As Amartya Sen and others argued that food availability is not a major problem
at the national or local level. It is the economic access at the household level which
is responsible for low accessibility of food. In this context, creating purchasing power
through employment is crucial. The Government can facilitate labour intensive growth
and provide direct programmes to generate productive employment which in turn
can ensure right to food.
68

References
Agarwal, Bina (1994), ‘A Field of one’s oen:Gender and Land Rights in South Asia’,Cambridge University Press, Cambridge
Bhatia, Bela and Jean Dreze (2002), “Starving still in Jharkhand” Frontline, Volume 19,Issue 16, August 3-16, 2002
Bigman, D. and P.V. Srinivasan, 2001, Geographical targeting of Poverty AlleviationPrograms: Methodology and Applications in Rural India, Indira Gandhi Institute ofDevelopment Research, mimeo.
Behrman, J.R. and A.B.Deolalikar, (1990), ‘The intrahousehold demand for nutrients inrural South India, Journal of Human Resources, Vol.25, No.4
CDHR(2002), “Right to Food”, Centre for Development and Human Rights, New Delhi,mimeo
Cornia, G.A. and F.Stewart (1995) “ Two Errors of Targeting” in van de Walle and Need(eds.) “Public Spending and the Poor: Theory and Evidence”, Johns Hopkins UniversityPress and World Bank, Baltimore
Deaton, Angus and Jean Dreze (2002), “Poverty and Inequality in India: AReexamination”, Economic and Political Weekly, Vol.37, No.36
Dreze, Jean (2002), “Ending Destitution”, The Hindu, July, 2002
Dreze, Jean (2003), “Reflections on Food Security and the Right to Food”, in Mahendra
Dev, S. et al (2003), ‘Towards a Food Insecure India: Issues and Policies’
Dreze, J and A.Sen (1989), ‘Hunger and Public Action’, Oxford University Press, New York
Dreze, Jean and A.Sen (2002), “India: Development and Participation”, Oxford UniversityPress
Dyson, Tim and A. Hanchate (2000), “India’s Demographic and Food Prospects: StateLevel Analysis”, Economic and Political Weekly, November 11
FAO (2002), “What is Right to Food”, http//www.fao.org/legal/Rtf/rtfood-e.htm
Franciscans International (1999-2002), Four Reports of the Independent Expert on Rightto Development, Mr. Arjun Sengupta, Geneva, Switzerland
Government of India, 1991, Report on the Operations of the Food Corporation of India,Bureau of Industrial Costs and Prices, Ministry of Industry, New Delhi
GOI, 2000, Report on Food Security, Chairman: K.P. Geethakrishnan, former FinanceSecretary, Expenditure Reforms Commission Government of India.
GOI (2002), “Report of the High Level Committee on Long-term Grain Policy”,
Department of Food & Public Distribution System, Ministry of Consumer Affairs, Food &Public Distribution, Government of India
GOI (2003), “Tenth Five Year Plan: 2002-2007” Volumes I, II, III, Planning Commission,Government of India
69

Gopal, K.S. and J. Ranjan (2002), “Addressing Hunger in Drought prone areas: The A.P.model for achieving Food Assurance”, Centre for Environment Concerns, mimeo
Government of India, 2000a, Mid-Term Appraisal of Ninth Five Year Plan (1997-2002),Planning Commission, New Delhi.
Gulati, A., P.K. Sharma and Satu Kähkönen, 1996, The Food Corporation Of India: SuccessesAnd Failures In Indian Foodgrain Marketing, August, IRIS -India Working paper No. 18,IRIS Center, University of Maryland, College Park, USA.
Haddad, L. et al (1996), “Food Security and Nutrition Implications of IntrahouseholdBias:A Review of Literature”, FCND discussion paper no.19, IFPRI, Washington D.C.
Jha, Shikha and P.V. Srinivasan, 2001, Taking the PDS to the poor: Directions for furtherreform, Economic and Political Weekly, September 29, 3779-3786.
Mahendra Dev, S.(1996) “Experience of India’s (Maharashtra) Employment Guarantee
Scheme: Lessons for Development Policy”, Development Policy Review, Vol.14, No.3,Blackwell Publishers.
Mahendra Dev, S.(2000), “Food Security with Emphasis on PDS vs. EGS: A Tale ofTwo States”, Economic and Political Weekly, August 9
Mahendra Dev, S. and C.Ravi (2002), “Food Security and Child Work in South India:Determinants and Policies” in Ramachandran, Nira and L. Massun ( eds., 2002), “Comingto Grips with Rural Child Work: A Food Security Approach”, Institute for Human Developmentand UN World Food Programme, New Delhi
Mahendra Dev, S., P.Antony, V.Gayatri and R.P.Mamgain (2001), Social and EconomicSecurity in India, Institute for Human Development, New Delhi
Mahendra Dev, S et al (2003), ‘Trade Liberalisation and Household Food Security’,International Food Policy Research Institute’, Washington DC, mimeo
Mahendra Dev, S., K.P. Kannan and Nira Ramachandran (2003a), “Toward a Food SecureIndia : Issues and Policies”, Institute for Human Development and Centre for Economicand Social Studies.
Marks, Stephen P. (2000), “The Human Rights Framework for Development: FiveApproaches”, working paper no.6, Francois-Xavier Bagnoud Center for Health and HumanRights, Harvard school of Public Health, Harvard University, Boston, USA
Miller, B. (1981), “The endangered sex: Neglect of Female Children in Rural North India”
Minhas, B.S. (1991), ‘on Estimating the Inadequacy of Energy Intakes: Revealed Food
Consumption Behaviour versus Nutritional Norms’, The Journal of Development Studies,vol.28, no.1
MS Swaminathan Research Foundation (2001), “Food Insecurity Atlas of Rural India”,published by UN World Food Programmes and MS Swaminathan Research Foundation
Osmani, Siddiqur Rahman (2000), ‘Human Rights to Food, Health and Education”, UNDPJournal of Human Development’, Vol.1, No.2 (USA: Carfax Publishing)
70

Osmani, S.R., O.H.Chowdhury, M.K.Mujeri and Q.Shahabuddin (2003), “The Implementingthe Right to Development: The Bangladesh Experience”, paper presented
Parikh, K.S., 1994, Who Gets How Much from PDS: How Effectively Does it Reach thePoor? Sarvekshana, 17(3), January-March.
Parikh, K.S. (1998), ‘Food Security: Individual and National’, in Ahluwalia, IJ and IMD
Little (eds.)”India’s Economic Reforms and Development: Essays for Manmohan Singh”,Oxford University Press
Pettigrew, J. (1986), “Child Neglect in rural Punjab Families’, Journal of ComparativeFamily Studies, Vol.17 No.1:63-85
Radhakrishna, R., and Subbarao, K., with Indrakant, S., and Ravi, C., 1997, India’s publicdistribution system: A national and international perspective, World Bank DiscussionPaper No. 380, The World Bank, Washington D.C.
Radhakrishna, R (2002), ‘ Food and Nutrition Security’, in Parikh, K and R Radhakrishna(eds.,2002), India Development Report 2002, Oxford University Press
Ramachandran, Nira and L. Massun (2002), “Coming to Grips with Rural Child Work: AFood Security Approach”, Institute for Human Development and UN World Food Programme,New Delhi
Rao, CHH (2000), “Declining Demand for Foodgrains in Rural India: Causes andImplications”, Economic and Political Weekly, January 22
Rao, CHH (2002), “Food grain Surpluses: Causes and Policy Implications”, Fifth Dr. C.D.Deshmukh Memorial Lecture, March 16, 2002, Hyderabad
Ramaswamy, Bharat (2002), “Efficiency and Equity of Food Market Interventions”, Economicand Political Weekly, Vol. 37, No.12
Satheesh (2000), “Food Security for Dryland Communities: Local Control is the key”,paper presented at the conference on ‘Food Security “ organized by CESS and IHD atCentre for Economic and Social Studies, Hyderabad, March 16-18, 2000
Sengupta, Arjun (2002), “Implementing the Right to Development”, Centre for Developmentand Human Rights (CDHR), New Delhi, mimeo.
Sengupta, Arjun (2000), “Realizing the Right to Development”, Development and Change,Vol 31, No.3
Sengupta, Arjun (2000a), “ Right to Development as a Human Right”, Working paperno.7, Francois-Xavier Bagnoud Center for Health and Human Rights, Harvard school ofPublic Health, Harvard University, Boston, USA
Shetty, P. (undated), “Measures of nutritional status from anthropometric survey data’,Nutritional planning assessment and evaluation service, food and nutrition division,FAO, Rome, Italy
Sharma, P., A. Mehta and Pedro Medrano (2002), “Investing in the Poor: A Food CreditScheme for Rural Households”, Ramachandran, Nira and L. Massun ( eds., 2002), “Comingto Grips with Rural Child Work: A Food Security Approach”, Institute for Human Developmentand UN World Food Programme, New Delhi
71
Sukhatme, P.V. (1982), ‘Poverty and Malnutrition’ in P.V. Sukhatme (ed.), Newer Conceptsin Nutrition and their Implications for Policy, Maharashtra Association for the Cultivationof Science, Pune
Sen, A. (1982), ‘How is India Doing’, New York Review of Books
Sen, A. (1985), ‘Well-being, Agency and Freedom: The Dewey Lectures 1984, Journal ofPhilosophy, 82
Sen, A. (1995), ‘The Political Economy of Targeting’ Chapter 2 in van de Walle, D. andK.Nead (eds.) “Public Spending and the Poor: Theory and Evidence”, Johns HopkinsUniversity Press and World Bank, Baltimore.
Sen, A. (2001), “Many Faces of Gender Equality”, Front Line, Vol.18, Issue 22, Oct27-Nov9, 2001
Sen, A. and S.Sengupta (1983), “Malnutrition of Rural Indian Children and the Sex Bias”,Economic and Political Weekly, vol.19
Srivastava, R., N.C. Saxena and S.K. Thorat (2003), “Land Institutions, Policy and Reformsin India’, paper presented at ‘Dragon and Elephant’, JNU-IFPRI Workshop, India HabitatCentre, New Delhi, March 25-26, 2003
Subramanian, S. and A. Deaton (1990), “Gender effects in Indian Consumption Patterns”,Research Progra in Development Studies Discussion paper 147, Princeton 147, PrincetonUniversity
Swaminathan, M. (2000), “Weakening Welfare: The Public Distribution of Food in India’,Left word books, New Delhi
Tendulkar, S.D., K.Sundaram and L.R.Jain (1993) Poverty in India, 1970-71 to 1988-89,ARTEP Working Papers, ILO-ARTEP, New Delhi.
UNHCHR (2002), “The Right to Food: Achievements and Challenges”, Report by MaryRobinson, the High Commissioner for Human Rights, World Food Summit: Five YearsLater, Rome, Italy, 8-10 June 2002.
Viswanathan, B. (2002), “Hosehold Food Security and Integrated Child DevelopmentServices in India”, A report prepared for CESS-IFPRI project on food security at householdlevel.
World Bank, (1999), India – Foodgrain marketing policies: Reforming to meet securityneeds, Rural Development Unit, South Asia Region, Working Paper, Report No. 18329,May 27.
World Bank (2001), India: Improving Household Food and Nutrition Security, RuralDevelopment Sector Unit, South Asia Region.
Ziegler, Jean (2002), “Report by the special Rapporteur on the right to food”, submittedin accordance with commission on human rights resolution 2001/25 Commission onHuman Rights, Economic and Social Council, United Nations.
Warrier, S. (1992), ‘Patriachy and daughter disfavour in West Bengal, India”, Ph.ddissertation draft, Syracuse University, Syracuse, N.Y., USA.
CENTRE FOR ECONOMIC AND SOCIAL STUDIES BEGUMPET, HYDERABAD - 500 016, ANDHRA PRADESH - INDIA
Telephones: 040-23402789, 040-23416780, Director’s Ph : 55570480
Website: www. cess.ac.in, E-mail: [email protected]
FAX: 040-23406808
Rs. 25/-
Current Working Papers
Working Paper Paper No.
Costs of Resource Degradation Externalities:A Study of Groundwater Depletion in Andhra Pradesh --- 49V. Ratna Reddy
Perceptions on Safe Motherhood : An Analysis ofResults From Rural Andhra PrdeshG. Rama Padma --- 48
Gender Differentials in Adult Mortality in India –With Notes on Rural-Urban ContrastsN. Krishnaji and K.S. James --- 47
Energy and Labour Use in Andhra Pradesh IndustryBy. Deepita Chakravarthy --- 46
Causes of Fertility Decline in India and BangladeshThe role of CommunityBy. S. Mahendra Dev, K.S. James and Binayak Sen --- 45
The Telengana surpluses-A Case StudyBy. B.P.R.Vithal --- 44
Social Sector Expenditures and Budgettingan Analysis of Patterns and the Budget making process inIndia in the 1990sBy. S. Mahendra Dev and Jos Mooij --- 43
Working Organization and Employment ContractsBy. Deepita Chakravarty --- 42
Economic Reform and Political InterpretationsBy. Jos Mooij --- 41
Killing Fields Lifesavers and externalities : A Study of the Impact ofIndustrial Pollution on Rural Communities in A.P.By. Bhagirath Behera and V. Ratna Reddy --- 40
Kerala’s Development Experience : Economic Growth and Human DevelopmentBy. S. Mahendra Dev --- 39


![[XLS] · Web viewCOLLEGE RD RAIGARH CHHATTISGARH 496001 IN30154918071389 ASHISH PATI MAGUS CUSTO M AND R DIALOG PVT LTD VARUN TOWERS I 2ND FLOOR BEGUMPET HYDERABAD 500016 IN30189510671814](https://static.fdocuments.in/doc/165x107/5aab9f4b7f8b9ac55c8c1bca/xls-viewcollege-rd-raigarh-chhattisgarh-496001-in30154918071389-ashish-pati-magus.jpg)