RIETKLOOF WIND FARM FACILITY SOCIAL IMPACT …
37
Tony Barbour ENVIRONMENTAL CONSULTING AND RESEARCH 10 Firs Avenue, 7708, South Africa (Tel) 27-21-761 2355 - (Fax) 27-761 2355- (Cell) 082 600 8266 (E-Mail) [email protected] RIETKLOOF WIND FARM FACILITY SOCIAL IMPACT ASSESSMENT: ADDENDUM ASSESSENT OF REVISED PROJECT DESCRIPTION FOR THE PROPOSED 140MW RIETKLOOF WIND ENERGY FACILITY SEPTEMBER 2018 Prepared for WSP ENVIRONMENT AND ENERGY AFRICA By Tony Barbour and Schalk van der Merwe
Transcript of RIETKLOOF WIND FARM FACILITY SOCIAL IMPACT …

Tony BarbourENVIRONMENTAL CONSULTING AND RESEARCH
10 Firs Avenue, 7708, South Africa(Tel) 27-21-761 2355 - (Fax) 27-761 2355- (Cell) 082 600 8266(E-Mail) [email protected]
RIETKLOOF WIND FARM FACILITY
SOCIAL IMPACT ASSESSMENT: ADDENDUM
ASSESSENT
OF
REVISED PROJECT DESCRIPTION FOR THEPROPOSED 140MW RIETKLOOF WIND ENERGY
FACILITY
SEPTEMBER 2018
Prepared for
WSP ENVIRONMENT AND ENERGY AFRICA
By
Tony Barbour and Schalk van der Merwe

TABLE OF CONTENTS
1. INTRODUCTION AND BACKGROUND TO REPORT ........................................... 12. PROJECT DESCRIPTION .............................................................................. 13. APPROACH TO STUDY ................................................................................ 14. ASSUMPTIONS AND LIMITATIONS ............................................................... 2
4.1 Assumptions ................................................................................... 24.2 Limitations ...................................................................................... 2
5. SPECIALIST DETAILS ................................................................................. 26. DECLARATION OF INDEPENDENCE............................................................... 37. UPDATED KEY POLICY AND LAND USE PLANS ............................................... 38. IMPLICATIONS FOR SOCIAL IMPACT ASSESSMENT ........................................ 3ANNEXURE A ................................................................................................... 5ANNEXURE B ................................................................................................... 6ANNEXURE C ................................................................................................... 7ANNEXURE D ................................................................................................... 8ANNEXURE E ................................................................................................. 27

1
1. INTRODUCTION AND BACKGROUND TO REPORT
WSP Environment, Energy Africa was appointed by G7 Renewable Energies in 2018 tomanage the Basic Assessment (BA) process for the proposed Rietkloof 140 MW WindEnergy Facility (WEF) proposed by the Rietkloof Wind Farm (Pty) Ltd. The proposed facilityis located within the Komsberg Renewable Energy Development Zone (REDZ), one of theeight REDZ formally gazetted in South Africa for the purpose of development of solar andwind energy generation facilities. In line with the gazetted process for projects locatedwithin REDZ, the Rietkloof WEF will be subject to a Basic Assessment (BA) process insteadof a full Environmental Impact Assessment (EIA) process in terms of the NationalEnvironmental Management Act (Act 107 of 1998) (NEMA) as amended, EIA Regulations2014 (as amended in 2017).
EOH Coastal and Environmental Services were previously appointed by Rietkloof WindFarm (Pty) Ltd to manage the Environmental Impact Assessment (EIA) process for theproposed Rietkloof WEF. Tony Barbour was appointed by EOH Coastal and EnvironmentalServices to undertake the specialist Social Impact Assessment (SIA) as part of the EIAprocess. The findings of the SIA for the Rietkloof WEF are contained in the SIA Reportsubmitted to EOH Coastal and Environmental Services on 18 July 2016 (Barbour and vander Merwe, 2016). Based on the findings of the EIA process 9 turbines out of the total of60 were approved by DEA.
Rietkloof Wind Farm (Pty) Ltd has decided to apply for the 51 turbines not authorised inorder to develop a 140MW WEF. The focus of the Basic Assessment process is thereforeto assess the potential impact (positive/negative) associated with the proposed 51 windturbines.
2. PROJECT DESCRIPTION
The 51 turbines are located in the same position as the 2016 layout assessed as part ofthe EIA process managed by EOH Coastal and Environmental Services. The location of the51 turbines was informed by the findings of the specialist studies undertaken as part ofthe EIA process undertaken by EOH Coastal and Environmental Services. In this regardthe total number of wind turbines was reduced from 70 to 60 as part of the EIA process.
The only change to the previous project design is a change to the technical specificationsfor the wind turbines. In this regard the following technical design specifications have beenchanged:
· The capacity of each wind turbine will increase to between 2MW and 5MW comparedto 1.5 to 4MW; ,
· The rotor diameter will increase to 160m compared to 140m previously· The hub height of each wind turbine will increase to 125m compared to the 120m
previously.
In addition, Rietkloof Wind Farm (Pty) Ltd has committed to the implementation ofadditional mitigation measures to be included in the Environmental Management Plan(EMP). These measures are aimed at improving erosion control, management of alienvegetation, fire control and protection and management of watercourses.
3. APPROACH TO STUDY
The approach to preparing the Addendum Report is based on the Western CapeDepartment of Environmental Affairs and Development Planning Guidelines for Social

2
Impact Assessment (DEADP, 2007). These guidelines are based on international bestpractice. The key activities included:
· Reviewing and up-dating key policy and land use planning documents for the studyarea
· Site visit and interviews with the affected landowners and requesting comment on theproposed project. Annexure A contains a list of the affected landowners interviewed;
· A review of the findings of the SIA undertaken in 2016 (Barbour and van der Merwe,2016) and comment on the findings of the SIA in relation to the proposed changes tothe technical specifications listed above;
· Comment on the potential socio-economic benefits associated with the implementationof additional mitigation measures to be included in the Environmental ManagementPlan (EMP).
4. ASSUMPTIONS AND LIMITATIONS
4.1 Assumptions
Findings of SIA undertaken in 2016It is assumed that the key findings of the SIA undertaken in 2016 remain valid.
Socio-economic baseline dataThe baseline socio-economic data included in the 2016 SIA is based on the 2011 Censusdata. This data is sufficient for the purposes of assessing the potential impact of the revisedRietkloof WF project.
Fit with planning and policy requirementsLegislation and policies reflect societal norms and values. The legislative and policy contexttherefore plays an important role in identifying and assessing the potential social impactsassociated with a proposed development. In this regard a key component of the SIAprocess is to assess the proposed development in terms of its fit with key planning andpolicy documents. As such, if the findings of the study indicate that the proposeddevelopment in its current format does not conform to the spatial principles and guidelinescontained in the relevant legislation and planning documents, and there are no significantor unique opportunities created by the development, the development cannot besupported.
However, the study recognises the strategic importance of wind energy and the technical,spatial and land use constraints required for wind energy facilities. The site is also locatedwithin the Komsberg REDZ, which was formally gazetted1 subsequent to the 2016 socialimpact assessment. The area has therefore been identified as suitable for theestablishment of renewable energy facilities, specifically wind farms.
4.2 Limitations
LimitationsBased on the experience of the consultant there are no limitations that have a materialbearing on the study.
5. SPECIALIST DETAILS
Tony Barbour is an independent specialist with 25 years’ experience in the field ofenvironmental management. In terms of SIA experience Tony Barbour has undertaken inthe region of 230 SIAs and is the author of the Guidelines for Social Impact Assessments
1 GN 113 and GN114 of 2018

3
for EIA’s adopted by the Department of Environmental Affairs and Development Planning(DEA&DP) in the Western Cape in 2007. Annexure B contains a copy of Mr Barbour’s CV.
6. DECLARATION OF INDEPENDENCE
This confirms that Tony Barbour, the specialist consultant responsible for undertaking thestudy and preparing the Addendum Report, is independent and does not have any vestedor financial interests in the proposed WEF being either approved or rejected. A signeddeclaration is contained in Annexure C.
7. UPDATED KEY POLICY AND LAND USE PLANS
As part of the amendment a review of relevant policy and land use planning documents,specifically Integrated Development Plans (IDPs) and Spatial Development Frameworks(SDF’s) for the area, was undertaken to ensure that the most recent documents arereferred to in the amendment application. A review of the following documents wasundertaken:
· Laingsburg Municipality Integrated Development Plan (IDP)(2017-22);· Laingsburg Municipality Spatial Development Framework (SDF)(2017);· Central Karoo District Municipality Spatial Development Framework (2013);· District Growth and Development Strategy (2007– 2022).
In addition, a review of the Renewable Energy Programme in South Africa and internationalstudies on the potential impacts on property values and tourism was undertaken.
The review of the Renewable Energy Programme highlights the significant socio-economicbenefits associated with the programme, including the benefits for rural communities. Interms of tourism, the most comprehensive study appears to be a review undertaken byProfessor Cara Aitchison from the University of Edinburgh in 2012 which formed part ofthe Renewable Energy Inquiry by Scottish Government. The research by Aitchison foundthat previous research from other areas of the UK has demonstrated that wind farms arevery unlikely to have any adverse impact on tourist numbers (volume), tourist expenditure(value) or tourism experience (satisfaction) (Glasgow Caledonian University, 2008;University of the West of England, 2004). In addition, to date, there is no evidence todemonstrate that any wind farm development in the UK or overseas has resulted in anyadverse impact on tourism.
From a property value perspective, the most relevant study is the Urbis study (2016). Theauthors of the study found that appropriately located wind farms within rural areas,removed from higher density residential areas, are unlikely to have a measurable negativeimpact on surrounding land values. Annexure D contains the findings of the reviews.
In addition, of relevance, on 17 February 2016, the Cabinet of the Republic of South Africa(Cabinet) approved the gazetting of Renewable Energy Development Zones (REDZs). 8REDZs and 5 Power Corridors have been identified. The REDZs are located in Overberg(Western Cape), Komsberg (Western Cape), Cookhouse (Eastern Cape), Stormberg(Eastern Cape), Kimberley (Free State/Northern Cape), Vryburg (North West), Upington(Northern Cape) and Springbok (Northern Cape). The outcome of the gazetting processmeans that wind and solar PV activities within the 8 Renewable Development Zones andelectricity grid expansion within the 5 Power Corridors will be subjected to a BasicAssessment and not a full EIA process. This reduces not only the process timeframe, butalso the review and decision-making timeframe from 107 to 57 days.
8. IMPLICATIONS FOR SOCIAL IMPACT ASSESSMENT
4
As indicated above, the only change to the previous project design is a change to thetechnical specifications of the proposed 51 wind turbines. The remainder of thecomponents of the proposed WEF, specifically the location of the turbines, remain thesame as the components assessed by the SIA undertaken in 2016 as part of the EIAprocess managed by EOH Coastal and Environmental Services. Based on a review of theavailable information and the author’s experience of the study area, the revised technicalspecifications will not have a bearing on the findings of the Social Impact Assessmentdated July 2016. The findings of the SIA Report (July 2016) therefore remain valid for andapply to the proposed 51 wind turbines. The findings are not affected by the changes tothe technical specification. The Executive Summary which summarises the key findings ofthe 2016 SIA is contained in Annexure E.
In addition, based on the follow-up interviews with affected landowners, the inclusion ofadditional mitigation measures in the Environmental Management Plan (EMP) to addresserosion control, management of alien vegetation, fire control and protection andmanagement of watercourses will benefit both the local farmers and broader society as awhole. The improved management of the area would also support the proposedestablishment of a northern bio-diversity corridor including Karookop and the KomsbergeMountains that can eventually link to the Karoo National Park as identified in theLaingsburg LM SDF. At the local, landowner level, the implementation of the mitigationmeasures would improve veld conditions, which in turn, would increase resilience toclimate change impacts. This would benefit farming operations. In addition, the mitigationmeasures would create an opportunity for eco-tourism in the area, which would, in turnrepresent a positive benefit for local farmers and the surrounding area as a whole. All ofthe farmers interviewed supported the implementation of mitigation measures to beincluded in the EMP.
Tony BarbourTony Barbour Environmental Consulting and Research26 September 2018

5
ANNEXURE A
INTERVIEWS
· Du Toit, Mr Johan (telephonic 20-06-2018). Die Libanon (Hartjieskraal 1/77).· Gouws, Mr Ryno (telephonic 20-06-2018). 1/88 Rietkloof Annexe.· Kriel, Mr. Johan (telephonic 20-06-2018). Vogelstruisfontein 81.· Le Roes, Mr. Jaco (telephonic 20-06-2018). Snyders Kloof 1/80.· Loots, Mr. Ziegfried (telephonic 20-06-2018). Nuwerus RE/ 284.· Marais, Mr. Ernst (telephonic 21-06-2018). Hartjieskraal RE/77.· Matthee, Mr. Christo (telephonic 20-06-2018). Barendskraal 1/76.· Terblanche, Dr. Jaco (telephonic 20-06-2018). Snyders Kloof RE/ 80.· Theron, Mr Willem (telephonic 20-06-2018). Wilgehout Fontein RE/87.

6
ANNEXURE B
Tony BarbourENVIRONMENTAL CONSULTING AND RESEARCH
10 Firs Avenue, Claremont, 7708, South Africa(Tel) 27-21-761 2355 - (Fax) 27-21-761 2355 - (Cell) 082 600 8266(E-Mail) [email protected]
Tony Barbour’s experience as an environmental consultant includes working for ten years as a consultant in theprivate sector followed by four years at the University of Cape Town’s Environmental Evaluation Unit. He hasworked as an independent consultant since 2004, with a key focus on Social Impact Assessment. His other areasof interest include Strategic Environmental Assessment and review work.
EDUCATION· BSc (Geology and Economics) Rhodes (1984);· B Economics (Honours) Rhodes (1985);· MSc (Environmental Science), University of Cape Town (1992)
EMPLOYMENT RECORD· Independent Consultant: November 2004 – current;· University of Cape Town: August 1996-October 2004: Environmental Evaluation Unit (EEU), University of
Cape Town. Senior Environmental Consultant and Researcher;· Private sector: 1991-August 2000: 1991-1996: Ninham Shand Consulting (Now Aurecon, Cape Town). Senior
Environmental Scientist; 1996-August 2000: Steffen, Robertson and Kirsten (SRK Consulting) – AssociateDirector, Manager Environmental Section, SRK Cape Town.
LECTURING· University of Cape Town: Resource Economics; SEA and EIA (1991-2004);· University of Cape Town: Social Impact Assessment (2004-current);· Cape Technikon: Resource Economics and Waste Management (1994-1998);· Peninsula Technikon: Resource Economics and Waste Management (1996-1998).
RELEVANT EXPERIENCE AND EXPERTISETony Barbour has undertaken in the region of 200 SIA’s, including SIA’s for infrastructure projects, dams,pipelines, and roads. All of the SIAs include interacting with and liaising with affected communities. In additionhe is the author of the Guidelines for undertaking SIA’s as part of the EIA process commissioned by the WesternCape Provincial Environmental Authorities in 2007. These guidelines have been used throughout South Africa.
Tony was also the project manager for a study commissioned in 2005 by the then South African Department ofWater Affairs and Forestry for the development of a Social Assessment and Development Framework. The aimof the framework was to enable the Department of Water Affairs and Forestry to identify, assess and managesocial impacts associated with large infrastructure projects, such as dams. The study also included thedevelopment of guidelines for Social Impact Assessment, Conflict Management, Relocation and Resettlementand Monitoring and Evaluation.
Countries with work experience include South Africa, Namibia, Angola, Botswana, Zambia, Lesotho, Swaziland,Ghana, Mozambique, Mauritius, Kenya, Ethiopia, Oman, South Sudan and Sudan.

7
ANNEXURE C
The specialist declaration of independence in terms of the Regulations_
I, Tony Barbour , declare that --
General declaration:
I act as the independent specialist in this application;I will perform the work relating to the application in an objective manner, even if this results inviews and findings that are not favourable to the applicant;I declare that there are no circumstances that may compromise my objectivity in performingsuch work;I have expertise in conducting the specialist report relevant to this application, includingknowledge of the Act, Regulations and any guidelines that have relevance to the proposedactivity;I will comply with the Act, Regulations and all other applicable legislation;I have no, and will not engage in, conflicting interests in the undertaking of the activity;I undertake to disclose to the applicant and the competent authority all material information in mypossession that reasonably has or may have the potential of influencing - any decision to be takenwith respect to the application by the competent authority; and - the objectivity of any report, planor document to be prepared by myself for submission to the competent authority;all the particulars furnished by me in this form are true and correct; andI realise that a false declaration is an offence in terms of regulation 48 and is punishable in termsof section 24F of the Act.
Signature of the specialist:Tony Barbour Environmental Consulting and Research
Name of company (if applicable):
26 September 2018Date:

8
ANNEXURE D
1. LAINGSBURG MUNICIPALITY IDP
The purpose of the IDP review 2017/18 is to:
· Ensure its relevance as the municipality’s strategic plan;· Inform other components of the municipal business process including institutional and
financial planning and budgeting; and· Inform the cyclical inter-governmental planning and budgeting cycle.
The IDP review lists the municipal strategic focus areas, namely:
· Focus Area 1: Environmental and Spatial Development;· Focus Area 2: Local Economic Development;· Focus Area 3: Basic Service Delivery;· Focus Area 4: Social and Community Development;· Focus Area 5: Institutional Transformation; and· Focus Area 6: Financial Viability.
Focus Area 2, Local Economic Development, is the most relevant for the proposed WFproject. In terms of alignment with National and Provincial Strategies, Focus Area 2 refersto Project Khulisa (“to grow”) and the importance of renewables and the transition of alow carbon economy as referred to in the National Development Plan Priorities (2030Vision).
The IDP also identifies seven Strategic Objectives (SOs) of focus areas. Of relevance tothe proposed WF are:
· SO 2: Promote local economic development· SO3: Improve the living environment of all people in Laingsburg· SO 4: Provision of Infrastructure to deliver improved services
A SWOT analysis was also undertaken as part of the IDP review process. The IDP notesthat there was strong agreement that poverty and its attendant conditions pose a keyexternal threat to the municipality. Of relevance to the proposed WF, Green Energy andEco-Tourism were identified as an opportunity or the local municipality (LM).
2. LAINGSBURG MUNICIPALITY SDF
The SDF links the development objectives taken from the Integrated Development Plan(IDP) and the Budget of a particular municipality. Therefore, the SDF becomes the spatialpresentation of the IDP objectives that guide projects funded through the budget of thelocal municipality.
Section 2.4.2 identifies projects of strategic importance to the Karoo basin and how thepotential impacts can be managed and mitigated. Renewable energy projects are identifiesas a strategic project.
Renewable Energy projectsThe section notes that renewable sources of energy are becoming more prominent on theglobal and national landscape and makes reference to the Strategic EnvironmentalAssessment commissioned in 2013 by the Department of Environmental Affairs and theidentification of Renewable Energy Development Zones (REDZs) where renewable energyinitiatives are most appropriate in South Africa. The section also notes that two of theeight REDZs, which are both specific to wind energy, fall within the Western Cape Province,

9
including the Komsberg REDZ which is largely located within the Central Karoo DistrictMunicipal area.
Impact of Climate Change (Section 3.2.7.9)The SDF highlights the threat posed by climate change to the LM, specifically given thedependency on agriculture as its economic base. The likelihood of an increase intemperature and variability in precipitation will pose a threat to both rain-fed and irrigatedagricultural production. Animal production will also be adversely affected. This will in turnimpact on employment and food security. In terms of management measures that SDFidentifies the need to implement good veld management practises to improve biodiversityand increase stock carrying capacity.
Spatial objectives (Section 5.1)The SDF identified three main attributes on which the LM can build its future, namely;agriculture, transport and tourism. Agriculture, although declining in economic growth andemployment terms, remains the most important sector in the municipal economy. Itcomprises almost exclusively extensive farming (grazing) except for small patches ofirrigable land in the river valleys which should be protected at all costs. Intensiveagriculture (dryland and irrigation farming) provide high intensity low skilled employment.In terms of rural areas the key objectives are to:
· Sustain long term carrying capacity of the land and water and in the extensivefarming areas – maintain and improve veld carrying capacity and species diversity;
· Ensure adequate infrastructure support for economy;· Increase access to economic activities for Historically Disadvantaged Individuals
(HDI);· Promotes tourism and agri-tourism.
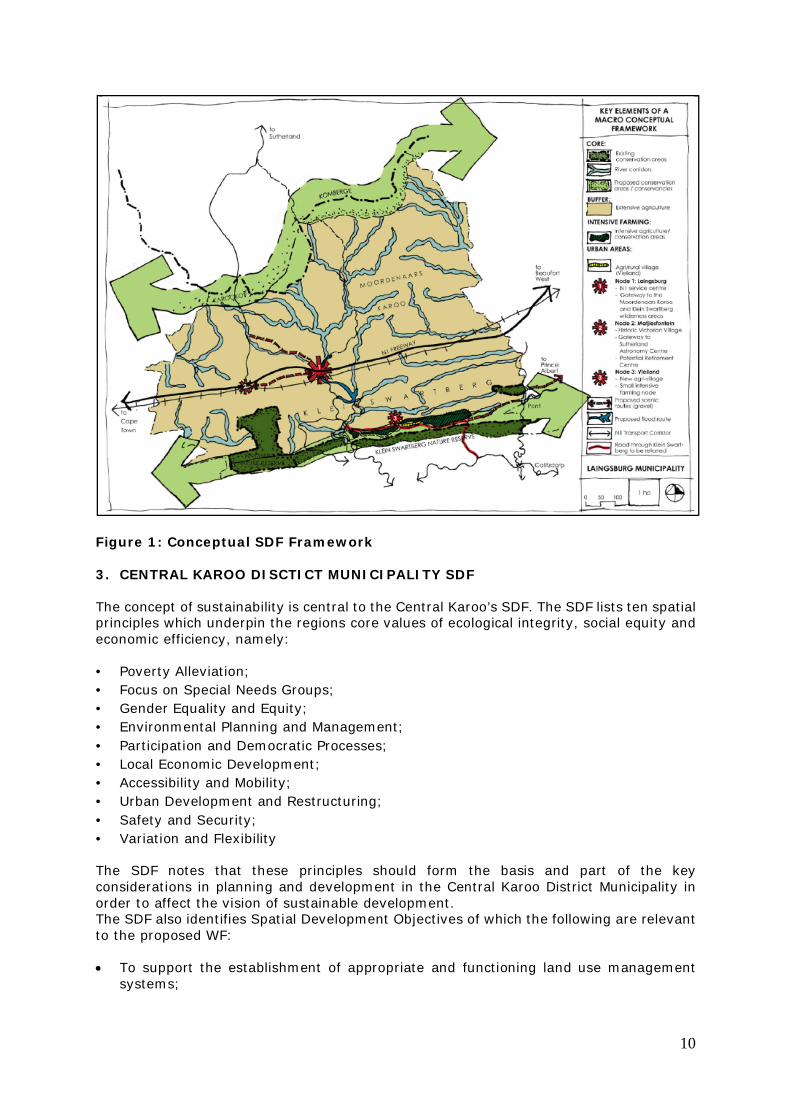
Conceptual Framework (Section 5.3)The conceptual framework is based on bio-regional planning categories for Land UseManagement outside of the Urban Nodes. The section comments of conservation areas,and of relevance notes that the development of a northern bio-diversity corridor includingKarookop and the Komberge mountains that can eventually link to the Karoo National Parkto the east should be promoted (Figure 1). The section also notes that rates rebates forprivately owned land set aside for bio-diversity conservation purposes should beconsidered.
10
Figure 1: Conceptual SDF Framework
3. CENTRAL KAROO DISCTICT MUNICIPALITY SDF
The concept of sustainability is central to the Central Karoo’s SDF. The SDF lists ten spatialprinciples which underpin the regions core values of ecological integrity, social equity andeconomic efficiency, namely:
• Poverty Alleviation;• Focus on Special Needs Groups;• Gender Equality and Equity;• Environmental Planning and Management;• Participation and Democratic Processes;• Local Economic Development;• Accessibility and Mobility;• Urban Development and Restructuring;• Safety and Security;• Variation and Flexibility
The SDF notes that these principles should form the basis and part of the keyconsiderations in planning and development in the Central Karoo District Municipality inorder to affect the vision of sustainable development.The SDF also identifies Spatial Development Objectives of which the following are relevantto the proposed WF:
· To support the establishment of appropriate and functioning land use managementsystems;

11
· To protect and preserve environmentally sensitive areas and areas of significantbiodiversity;
· To provide a framework for sustainable, strategic and accelerated land, infrastructureand economic development;
· To establish effective linkages for access to and mobility between settlements andlocations of important economic, social and tourist interest.
Linked to the Spatial Development Objectives are a set of Spatial Development Strategies.The following strategies are of relevance to the proposed WF:
· Implement alternative energy use plans and support alternative and sustainableenergy sources;
· Provide, protect and encourage the sustainable use of scarce and quality waterresources;
· Support land reform initiatives that strengthen the agricultural sector in order to enableeconomic and employment growth;
· Achieve synergy with veld management programmes that will improve bothbiodiversity conservation and stock carrying capacity.
In terms of settlement the SDF identifies Laingsburg as being a primary investment nodeand Matjiesfontein as being a secondary investment node in the district. Of relevance tothe proposed WF project the SDF notes that:
· The current Protected Areas network is under representative of the District’sbiodiversity and should be expanded by 180,000 hectares to meet national targets;
· Areas and landscapes subject to severe climate change conditions need to beprotected;
· The district comprises largely of poor soil conditions with extremely scarce arable landfor intensive agricultural activities. Crop production is primarily found in the PrinceAlbert municipal area and along river systems and the mountains to the south ofLaingsburg;
· All arable land for crop farming should be protected from all other uses and activities;· In order to increase stock carrying capacity and improve biodiversity, proper and
sustainable veld management practices need to be promoted on farms;· Existing protected areas should be enlarged where appropriate particularly in respect
of riverine areas for the protection of water resources.
Three Bioregions are identified in this municipal area, namely, Witteberg, MoordenaarsKaroo and the Koup.
4. CENTRAL KAROO DISTRICT GROWTH AND DEVELOPMENT STRATEGY
The District Growth and Development Strategy (2007 – 2022) provides a more detailedview of development and growth potential at a district level and is the overarching policyframework and strategy for realising shared growth and integrated development in theCKDM. With regard to the study area the Central Karoo District Growth and DevelopmentStrategy identifies wind energy as a key strategy for the Laingsburg Municipality.
5. OVERVIEW OF RENEWABLE ENERGY SECTOR IN SOUTH AFRICA
The section below provides an overview of the potential benefits associated with therenewable energy sector in South Africa. Given that South Africa supports the developmentof renewable energy at national level, the intention is not to provide a critical review ofrenewable energy. The focus is therefore on the contribution of renewable energy,specifically in terms of supporting economic development.
12
The following documents were reviewed:
· Independent Power Producers Procurement Programme (IPPPP): An Overview (30 June2017), Department of Energy, National Treasury and DBSA;
· Green Jobs Study (2011), IDC, DBSA Ltd and TIPS;· Powering the Future: Renewable Energy Roll-out in South Africa (2013), Greenpeace
South Africa;· WWF SA, Renewable Energy Vision 2030, South Africa, 2014· Jacqueline M. Borel-Saladin, Ivan N. Turok, (2013). The impact of the green economy
on jobs in South Africa, ), South African Journal of Science, Volume 109 |Number 9/10,September/October 2013;
· The potential for local community benefits from wind farms in South Africa, Louise Tait(2012), Master’s Thesis, Energy Research Centre University of Cape Town
· Market Intelligence Report: Renewable Energy (2014). Mike Mulcahy, Greencape.
5.1 Independent Power Producers Procurement Programme (IPPPP): AnOverview
The document presents an overview of the Renewable Energy Independent PowerProducer Procurement Programme (REIPPPP) undertaken by the Department of Energy,National Treasury and the Development Bank of South Africa in June 2017. By the end ofJune 2017, the REIPPPP had made the following significant impacts:
Energy supplyIn terms of renewable energy 6 422 MW2 of electricity had been procured from 112 REIndependent Power Producers (IPPs) in seven bid rounds to date. Of this 3 162 MW ofelectricity generation capacity from 57 IPP projects has been connected to the nationalgrid. To date 16 991 GWh of energy has been generated by renewable energy sourcesprocured under the REIPPPP since the first project became operational (making a 15%contribution to morning and evening system peak periods).
InvestmentThe document notes that the REIPPPP has attracted significant investment in thedevelopment of the REIPPs into the country. The total investment (total project costs),including interest during construction, of projects under construction and projects in theprocess of closure is R201.8 billion (this includes total debt and equity of R200.4 billion,as well as early revenue and VAT facility of R1.4 billion).
The REIPPPP has attracted R48.8 billion in foreign investment and financing in the sevenbid windows (BW1 – BW4, 1S2 and 1S2). This is more than double the inward FDI attractedinto South Africa during 2015 (R22.6 billion).
South African citizen shareholdingIn terms of local equity shareholding, 48% (R31.5 billion) of the total equity shareholding(R66.7 billion) was held by South African’s across BW1 to BW4, BW1S2 and 1S2. Thisequates to substantially more than the 40% requirement. Foreign equity amounts toR35.8 billion and contributes 52% of total equity.
The REIPPPP also contributes to Broad Based Black Economic Empowerment and thecreation of black industrialists. In this regard Black South Africans own, on average, 31%of projects that have reached financial close, which is slightly above the 30% target.
The REIPPPP has also ensured that black people in local communities have ownership inthe IPP projects that operate in or nearby their vicinities. On average, black localcommunities own 11% of projects that have reached financial close. This is well above
2 6323 MW from 92 largescale RE + 99MW from 20 small scale REIPPs.

13
the 5% target. In addition, an average of 18% shareholding by black people inengineering, procurement and construction (EPC) contractors has been attained in projectsthat have reached financial close under the REIPPPP. This is slightly below the 20% target.The shareholding by black people in operating companies of IPPs has averaged 20%(against a targeted 20%) for the 57 projects in operation (i.e. in BW 1, 2 and 3). Thetarget for shareholding by black people in top management has been set at 40%, with anaverage 61% achieved to date. The target has therefore been significantly exceeded.
Community shareholding and community trustsThe regulations require a minimum ownership of 2.5% by local communities in IPP projectsas a procurement condition. This is to ensure that a substantial portion of the investmentshas been structured and secured as local community equity. An individual community’sdividends earned will depend on the terms of each transaction corresponding with therelevant equity share. To date all shareholding for local communities have been structuredthrough the establishment of community trusts. For projects in BW1 to BW4, 1S2 and 2S2,qualifying communities will receive R29.3 billion net income over the life of the projects(20 years). The report notes that the bulk of the money will however only start flowinginto the communities from 2028 due to repayment obligations in the preceding years(repayment obligations are mostly to development funding institutions). However, despitethe delay this represents a significant injection of capital into mainly rural areas of SouthAfrica.
Income to all shareholders only commences with operation of the facility. With only 57IPPS currently operational over a short period of time the revenue generated has beenlimited to R 36.3 billion.
Procurement spendThe total projected procurement spend for BW1 to BW4, 1S2 and 2S2 during theconstruction phase was R75 billion, more than the projected operations procurementspend over the 20 years operational life (R72 billion). The combined (construction andoperations) procurement value is projected as R147.6 billion of which R50.1 billion hasbeen spent to date. For construction, of the R46.4 billion already spent to date, R36.6billion is from the 57 projects which have already been completed. These 57 projects hadplanned to spend R33.6 billion. The actual procurement construction costs have thereforeexceeded the planned costs by 9% for completed projects.
The majority of the procurement spend to date has been for construction purposes. Of theR46.6 billion spent on procurement during construction, R41.1 billion has reportedly beenprocured from BBBEE suppliers, achieving 89% of total procured. Actual BBBEE spendduring construction for BW1 and BW2 alone was R25.5 billion. The R 41.1 billion spent onBBBEE during construction already exceeded the R34.8 billion that had originally beenanticipated by IPPs.
Local Content3
The report notes that the REIPPP programme represents the country’s mostcomprehensive strategy to date in achieving the transition to a greener economy. Localcontent minimum thresholds and targets were set higher for each subsequent bid window.The report notes that for a programme of this magnitude, with construction procurementspend alone estimated at R75 billion, the result is a substantial stimulus for establishinglocal manufacturing capacity. Actual local content spend reported for IPPs that havestarted construction amounts to R38.1 billion against a corresponding project value (asrealised to date) of R75.8 billion. This means 50% of the project value has been locallyprocured, exceeding the 45% commitment from IPPs and the thresholds for BW1 – BW4(255-45%).
3 Local content is expressed as a % of the total project value and not procurement or total projectcosts.

14
The report also notes that the strategy has prompted several technology and componentmanufacturers to establish local manufacturing facilities. The report also notes that thiswill improve with greater certainty relating to subsequent bid windows and furtherdeterminations will continue to build on these successes.
For the 57 projects that have reached commercial operations date (COD), local contentspend has been R 29 billion, which represents 97% of planned local spend of R 29.9 billion.
Preferential procurementThe share of procurement that is sourced from Broad Based Black Economic Empowered(BBBEE) suppliers, Qualifying Small Enterprises (QSE), Exempted Micro Enterprises (EME)and women owned vendors are tracked against commitments and targeted percentages.The IA target requirement for BBBEE is 60% of total procurement spend. However, theactual share of procurement spend by IPPs from BBBEE suppliers for construction andoperations combined is currently reported as 88%, which is significantly higher than thetarget of 60%, but also the 73% that had been committed by IPPs. BBBEE, as a share ofprocurement spend for projects in construction, is also reported as 89% with operationsslightly lower at 78%. However, these figures have not been verified and the report notesthat they are reported with caution.
Total procurement spend by IPPs from QSE and EMEs has amounted to R16.4 billion(construction and operations) to date, which exceeds commitments by 24% and is 33%of total procurement spend to date (while the required target is 10%). QSE and EME’sprocurement spend for construction is achieving 34% of total procurement to date andoperations is less at 22%, however this is still well above the 10% target. QSE and EMEshare of construction procurement spend totals R15.5 billion, which is almost 3 times thetargeted spend for construction of R5.0 billion during this procurement phase. However,procurement from women owned vendors is lagging, with only 3%f or construction and5% for operations achieved to date against a target of 5%.
Nonetheless, the fact that the REIPPPP has raised employment opportunities for blackSouth African citizens and local communities beyond planned targets, indicates theimportance of the programme to employment equity and the drive towards more equalsocieties.
Leveraging employment opportunitiesTo date, a total of 32 532 job years4 have been created for South African citizens, of which29 046 job years were in construction, 40% higher than the planned 20 689, and 3 486in operations. These job years should rise further past the planned target as more projectsenter the construction phase. By the end of June 2017, 57 projects had successfullycompleted construction and moved into operation. The projects had planned to deliver 14639 job years during the construction phase, but had achieved 23 987. This was 64%more than planned.
The report notes that employment thresholds and targets were consistently exceededacross the entire portfolio. The average share of South African citizens of total SouthAfrica based employees for BW1 – BW3.5 was 89% during construction (against a targetof 80%), while it was 96% during operations for BW1 – BW3 (against a target of 80%).The report notes that the construction phase offers a high number of opportunities overshorter durations, while the operations phase requires fewer people, but over an extendedoperating period.
4 The equivalent of a full time employment opportunity for one person for one year

15
In terms of benefits for local communities, significantly more people from localcommunities were employed during construction than was initially planned. Theexpectation for local community participation was 6 772 job years. To date 16 376 jobyears have been realised (i.e. 142% greater than initially planned), with 16 projects, whichhave reached financial close, still to reach COD. The number of black SA citizens employedduring construction also exceeded the planned numbers by 83%.
Black South African citizens, youths and rural or local communities have been the majorbeneficiaries during the construction phases, as they respectively represent 80%, 41%and 52% of total job opportunities created by IPPs to date. However, woman and disabledpeople could still be significantly empowered as they represent a mere 8% and 0.5% oftotal jobs created to date, respectively. Nonetheless, the fact that the REIPPPP has raisedemployment opportunities for black South African citizens and local communities beyondplanned targets, indicates the importance of the programme to employment equity andthe drive towards more equal societies.
The share of black citizens employed during construction (80%) and the early stages ofoperations (82%) has significantly exceeded the 50% target and the 30% minimumthreshold. Likewise, the share of skilled black citizens (as a percentage of skilledemployees) for both construction (67%) and operations (77%) has also exceeded the 30%target and is at least 3.5 times more than the minimum threshold of 18%. The share oflocal community members as a share of SA-based employees was 50% and 67% forconstruction and operations respectively – at least 4 times more than the minimumthreshold of 12% and more than 2.5 times more than the target of 20%.
Socio-economic development (SED) contributionsAn important focus of the REIPPPP is to ensure that the build programme securessustainable value for the country and enables local communities to benefit directly fromthe investments attracted into the area. In this regard IPPs are required to contribute apercentage of projected revenues accrued over the 20 year project operational life towardSED initiatives. These contributions accrue over the 20 year project operation life and areused to invest in housing and infrastructure as well as healthcare, education and skillsdevelopment. The minimum compliance threshold for SED contributions is 1% of therevenue with 1.5% the targeted level over the 20 year project operational life. For thecurrent portfolio of projects the average commitment level is 2.2%, which is 125% higherthan the minimum threshold level. Therefore, based on current projects averagecommitment level is 2.2% or 125% more than the minimum compliance threshold. Todate (across seven bid windows) a total contribution of R20.6 billion has been committedto SED initiatives. Assuming an even, annual revenue spread, the average contributionper year would be R1.03 billion. Of the total commitment, R16.5 billion is specificallyallocated for local communities where the IPPs operate. With every new IPP on the grid,revenues and the respective SED contributions will increase.
To date, with the limited number of operational IPPs (57), the SED contribution amountsto R 403.7 million. The province with the highest SED contribution has been the NorthernCape Province, followed by the Eastern Cape and Western Cape. However, the report doesnote that SED contributions are concentrated in the communities in the immediate vicinityof the IPPs. As such there is a lack of equity considerations across geographical areas, i.e.some communities benefit more than others.
Enterprise development contributionsThe target for IPPs to spend on enterprise development is 0.6% of revenues over the 20year project operational life. However, for the current portfolio, IPPs have committed anaverage of 0.7% or 11% more than the target. Enterprise development contributionscommitted for BW1 to BW4, 1S2 and 2S2 amount to R6.4 billion. Assuming an equaldistribution of revenue over the 20 year project operational life, enterprise developmentcontributions would be R320 million per annum.

16
Of the total commitment, R4.9 billion is specifically committed directly within the localcommunities where the IPPs operate, contributing significantly to local enterprisedevelopment. Up until the end of June 2017 a total of R 129.8 had been contributed toenterprise development by the 57 operating IPPs.
5.2 Green Jobs Study
The study notes that South Africa has one of the most carbon-intensive economies in theworld, therefore making the greening of the electricity mix a national imperative. Withinthis context the study notes that the green economy could be an extremely importanttrigger and lever for enhancing a country’s growth potential and redirecting itsdevelopment trajectory in the 21st century. The attractiveness of wind and solartechnologies is not only supported by local conditions, but also by the relatively maturestage of their technological development.
The aim of the Green Jobs study was to provide information on the net direct job creationanticipated to emerge in the formal economy across a wide range of technologies/activitiesthat may be classified as green or contributing to the greening of the economy. The studylooked at the employment potential for a number of green sectors, including powergeneration, over three consecutive timeframes, namely, the short term (2011 – 12),medium term (2013 – 17) and long term (2018 – 25). The analysis attempts to estimatethe employment potential associated with: building, construction and installationactivities; operations and maintenance services; as well as the possible localisation spin-offs for the manufacturing sector as the domestic production of equipment, parts andcomponents benefits from preferential local procurement.
It is also worth noting that the study only considered direct jobs in the formal economy.Multiplier effects were not taken into account. As a result the analysis only captures aportion of the potential employment impact of a greening economy. International studieshave indicated that there are considerable backward and forward linkages through variousvalue chains of production, as well as of indirect and induced employment effects. Theemployment figures can therefore be regarded as conservative.
The analysis reveals the potential of an unfolding green economy to lead to the creationof approximately 98 000 new direct jobs, on average, in the short term, almost 255 000in the medium term and around 462 000 employment opportunities in the formal economyin the long term. The number of jobs linked to the power generation was estimated to be~ 12 500 in the short term, 57 500 in the medium term and 130 000 in the long term.Power generation jobs therefore account for 28% of the employment opportunities createdin the long term. However, the report notes that the contribution made by a progressivelyexpanding green energy generation segment increases from 14% of the total in the shortterm, or just over 13 500 jobs, to more than 28% in the long term (166 400) (Table 1).
The study also found that energy generation is expected to become an increasinglyimportant contributor to green job creation over time, as projects are constructed orcommissioned.
The international wind power industry employed almost half a million workers worldwidein 2009 – a figure that is expected to grow to over a million in five years from now,according to forecasts by the Global Wind Energy Council.
Table 1: Net direct employment potential estimated for the four broad types ofactivity and their respective segments in the long term, and an indication of theroll-out over the three timeframes

17
Notes:
· VH = very high (total employment potential > 20 000 direct jobs; manufacturingemployment potential > 3 000 direct jobs);
· H = high (total employment potential > 8 000 but < 20 000; manufacturingemployment potential > 1 000 but < 3 000);
· M = medium (total employment potential > 3 000 but < 8 000; manufacturingemployment potential > 500 but < 1 000);
· L = low (total employment potential > 1 000 but < 3 000; manufacturing employmentpotential > 150 but < 500);
· VL = very low (total employment potential > 0 but < 1 000; manufacturingemployment potential > 0 but < 150);
18
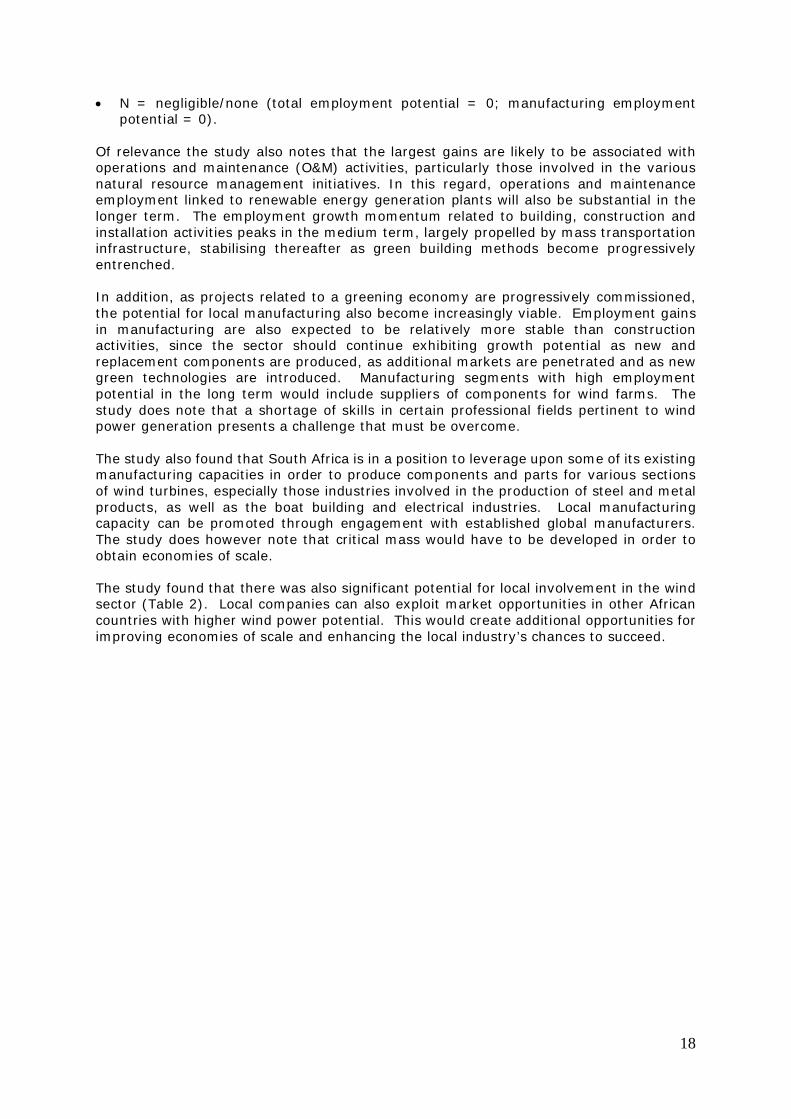
· N = negligible/none (total employment potential = 0; manufacturing employmentpotential = 0).
Of relevance the study also notes that the largest gains are likely to be associated withoperations and maintenance (O&M) activities, particularly those involved in the variousnatural resource management initiatives. In this regard, operations and maintenanceemployment linked to renewable energy generation plants will also be substantial in thelonger term. The employment growth momentum related to building, construction andinstallation activities peaks in the medium term, largely propelled by mass transportationinfrastructure, stabilising thereafter as green building methods become progressivelyentrenched.
In addition, as projects related to a greening economy are progressively commissioned,the potential for local manufacturing also become increasingly viable. Employment gainsin manufacturing are also expected to be relatively more stable than constructionactivities, since the sector should continue exhibiting growth potential as new andreplacement components are produced, as additional markets are penetrated and as newgreen technologies are introduced. Manufacturing segments with high employmentpotential in the long term would include suppliers of components for wind farms. Thestudy does note that a shortage of skills in certain professional fields pertinent to windpower generation presents a challenge that must be overcome.
The study also found that South Africa is in a position to leverage upon some of its existingmanufacturing capacities in order to produce components and parts for various sectionsof wind turbines, especially those industries involved in the production of steel and metalproducts, as well as the boat building and electrical industries. Local manufacturingcapacity can be promoted through engagement with established global manufacturers.The study does however note that critical mass would have to be developed in order toobtain economies of scale.
The study found that there was also significant potential for local involvement in the windsector (Table 2). Local companies can also exploit market opportunities in other Africancountries with higher wind power potential. This would create additional opportunities forimproving economies of scale and enhancing the local industry’s chances to succeed.

19
Table 2: Potential contribution capacity of local industries
The study also identifies a number of advantages associated with wind power as a sourceof renewable energy with a large ‘technical’ generation potential. In this regard windenergy does not emit carbon dioxide (CO2) in generating electricity and is associated withexceptionally low lifecycle emissions. The construction period for a wind farm is muchshorter than that of conventional power stations, while an income stream may in certaininstances be provided to local communities through employment and land rental. Thestudy also notes that the greenhouse gases (GHG) associated with the construction phaseare offset within a very short period of time compared with the project’s lifespan. Windpower therefore provides an ideal means for reaching emission reduction targets in arelatively easy manner. In addition, and of specific relevance to South Africa, wind as anenergy source is not dependent on water (as compared to the massive water requirementsof conventional power stations), has a limited footprint and therefore does not impact onlarge tracts of land, poses limited pollution and health risks, specifically when comparedto coal and nuclear energy plants.
Of relevance, the study also notes that the case for wind power is enhanced by the positiveeffect on rural or regional development. Wind farms located in rural areas create anopportunity to benefit the local and regional economy through the creation of jobs and taxrevenues. In Denmark, one of the world’s most advanced countries with respect to windpower generation, a significant portion of wind turbines are owned by local communities.The Green Jobs study indicated that a drawback for wind energy is that, due to the naturalvariation in wind power on a daily and/or seasonal basis, back-up base-load generationcapacity is imperative to provide stability to the energy supply. Furthermore, as with otherrenewable energy sources, wind power has relied on incentive measures throughout theworld for its development, although its relative competitiveness has been improvingcontinuously. This position has however changed since the study was completed in 2011.Renewable energy, including wind, is now competitive with other conventional sources,such as coal.
5.3 Powering the Future: Renewable Energy Roll-out in South Africa
The study notes that South Africa has higher CO2 emissions per GDPppp (2002 figures)from energy and cement production than China or the USA (Letete, T et al). Energyaccounts for 83% of the total GHG emissions (excluding land use, land use change and

20
forestry) with fuel combustion in the energy industry accounting for 65% of the energyemissions of South Africa (DEA, 2011).
Within a broader context of climate change, coal energy does not only have environmentalimpacts, it also has socio-economic impacts. Acid mine drainage from abandoned minesin South Africa impacts on water quality and poses the biggest threat to the country’slimited water resources. Huge volumes of water are also required to wash coal and cooloperating power stations. Eskom uses an estimated 10 000 litres of water per second dueto its dependency on coal (Greenpeace, 2012).
The report notes that the concerns relating to whether South Africa can afford renewableenergy arise out of the perception that renewable energy (RE) is expensive while fossiland nuclear technologies are cheap. The premise also ignores life cycle costing of thetechnologies which is favourable to renewable technologies where the sources of fuel arefree or cheap.
In terms of costs, onshore wind energy costs are expected to drop by 12% since 2011 dueto lower cost equipment and gains in output efficiency. The report refers to BloombergNew Energy Finance, which noted that the average wind farm could reach grid parity by20165. In Australia, unsubsidised renewable energy is now cheaper than electricity fromnew-build coal- and gas-fired power stations. A BNEF study indicated that electricity canbe supplied from a new wind farm at a cost of R747.32/MWh (AUS$80), compared to R1335.82/MWh (AUS$143) from a new coal plant or R1 083.06 /MWh (AUS$116) from a newbase-load gas plant, including the cost of emissions under the Australian government’scarbon pricing scheme. Based on this the chief executive of Bloomberg New EnergyFinance, Michael Liebreich, noted that “The fact that wind power is now cheaper than coaland gas in a country with some of the world’s best fossil fuel resources showing that cleanenergy is a game changer which promises to turn the economics of power systems on itshead,” (Paton, 2013).
Within the South African context, a presentation by the South African Wind EnergyAssociation (SAWEA) at the NERSA hearings in February 2013 indicated that in the secondround of (REIPPPP) the bidding price for wind was 89c/kWh. The estimates for nominalnew Eskom coal power range from NERSA’s 97c/kWh to Standard Bank’s estimate thatKusile will cost R1.38/kWh in 2019. In addition to being more expensive, coal-fired powerstations have fewer job creation possibilities than RE, carry future expenses due to climatechange impacts, and have health expense issues due to pollution.
The Greenpeace study notes that it is not only local manufacturers and rural farmers thatbenefit from RE, but large scale renewable utilities as well. The report notes that the LakeTurkana Wind Power Project (LTWP), which has a capacity of 310MW and consists of 365turbines of 850kW, is the largest wind farm in Sub-Saharan Africa. The project isequivalent to 20% of the current installed capacity in Kenya and is the largest singleprivate investment in Kenya’s history (LTWP, 2012). At the proposed 9.9 US cents perkWh it will be the cheapest electricity in Kenya (Kernan, 2012). Wind energy thereforecreates significant opportunities for investment and the production of affordable energywithout the significant environmental and socio-economic impacts associated with coaland nuclear energy options.
5 A CSIR study undertaken in 2016 found that new power from solar PV and wind is at least 40%cheaper than that from new baseload coal today. https://www.dailymaverick.co.za/article/2016-10-18-comparative-analysis-the-cost-of-new-power-generation-in-south-africa/#.Wzx2vLh9iUk

21
5.4 WWF SA, Renewable Energy Vision 2030
In its vision the WWF motivated for a more ambitious plan, suggesting that the IRP shouldprovide for an 11-19% share of electricity capacity by 2030, depending on the country’sgrowth rate over the next fifteen years. The vision is to increase renewable energy at theexpense of new coal-fired and nuclear capacity. The report notes that in addition to theobvious environmental benefits of this scenario, it will enable South Africa to add flexibilityto energy supply capacity on an on-demand basis.
The report notes that Renewable Energy Independent Power Producer ProcurementProgramme (REIPPPP) introduced in 2011, has by all accounts been very successful inquickly and efficiently delivering clean energy to the grid. Increasingly competitive biddingrounds have led to substantial price reductions. In this regard the study indicates that inthree years, wind and solar PV have reached pricing parity with supply from new coal-firedpower stations from a levelised cost of electricity (LCOE) perspective.
In bidding window 3 of August 2013, the average tariffs bid for wind and solar PV wereR0,66/kWh and R0.88/kWh respectively, well below the recent estimates of R1.05/kWhfor supply from the coal-fired Medupi and Kusile power stations (Papapetrou 2014). In2013, the average levelised cost of electricity supplied to the grid was R0.82/kWh(Donnelly 2014), so wind-generated power has already achieved pricing parity with thegrid.
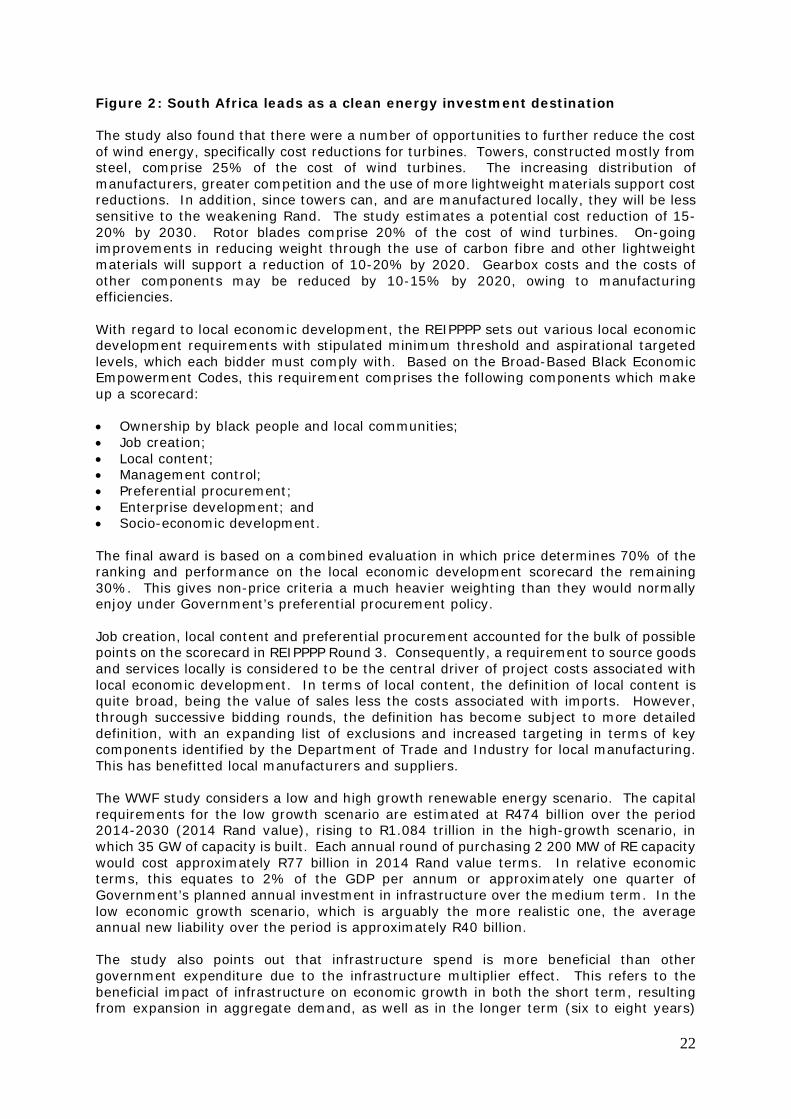
The report also notes that the REIPPPP has several contracting rounds for new renewablessupply. A robust procurement process, extension of a 20-year sovereign guarantee onthe power purchase agreement (PPA) and, especially, ideal solar power conditions, havedriven the investment case for RE in South Africa. In this regard South Africa has beenidentified as one of the worlds’ leading clean energy investment destinations (Figure 2).
22
Figure 2: South Africa leads as a clean energy investment destination
The study also found that there were a number of opportunities to further reduce the costof wind energy, specifically cost reductions for turbines. Towers, constructed mostly fromsteel, comprise 25% of the cost of wind turbines. The increasing distribution ofmanufacturers, greater competition and the use of more lightweight materials support costreductions. In addition, since towers can, and are manufactured locally, they will be lesssensitive to the weakening Rand. The study estimates a potential cost reduction of 15-20% by 2030. Rotor blades comprise 20% of the cost of wind turbines. On-goingimprovements in reducing weight through the use of carbon fibre and other lightweightmaterials will support a reduction of 10-20% by 2020. Gearbox costs and the costs ofother components may be reduced by 10-15% by 2020, owing to manufacturingefficiencies.
With regard to local economic development, the REIPPPP sets out various local economicdevelopment requirements with stipulated minimum threshold and aspirational targetedlevels, which each bidder must comply with. Based on the Broad-Based Black EconomicEmpowerment Codes, this requirement comprises the following components which makeup a scorecard:
· Ownership by black people and local communities;· Job creation;· Local content;· Management control;· Preferential procurement;· Enterprise development; and· Socio-economic development.
The final award is based on a combined evaluation in which price determines 70% of theranking and performance on the local economic development scorecard the remaining30%. This gives non-price criteria a much heavier weighting than they would normallyenjoy under Government’s preferential procurement policy.
Job creation, local content and preferential procurement accounted for the bulk of possiblepoints on the scorecard in REIPPPP Round 3. Consequently, a requirement to source goodsand services locally is considered to be the central driver of project costs associated withlocal economic development. In terms of local content, the definition of local content isquite broad, being the value of sales less the costs associated with imports. However,through successive bidding rounds, the definition has become subject to more detaileddefinition, with an expanding list of exclusions and increased targeting in terms of keycomponents identified by the Department of Trade and Industry for local manufacturing.This has benefitted local manufacturers and suppliers.
The WWF study considers a low and high growth renewable energy scenario. The capitalrequirements for the low growth scenario are estimated at R474 billion over the period2014-2030 (2014 Rand value), rising to R1.084 trillion in the high-growth scenario, inwhich 35 GW of capacity is built. Each annual round of purchasing 2 200 MW of RE capacitywould cost approximately R77 billion in 2014 Rand value terms. In relative economicterms, this equates to 2% of the GDP per annum or approximately one quarter ofGovernment’s planned annual investment in infrastructure over the medium term. In thelow economic growth scenario, which is arguably the more realistic one, the averageannual new liability over the period is approximately R40 billion.
The study also points out that infrastructure spend is more beneficial than othergovernment expenditure due to the infrastructure multiplier effect. This refers to thebeneficial impact of infrastructure on economic growth in both the short term, resultingfrom expansion in aggregate demand, as well as in the longer term (six to eight years)

23
due to enhanced productive capacity in the economy. A recent USA study on highwayexpenditure revealed the infrastructure multiplier to be a factor of two on average, andgreater during economic downturns (Leduc & Wilson 2013). This means that one dollarspent on infrastructure raises GDP by two dollars. If the same were to hold true, as similaranalysis suggests it would (Kumo 2012, Ngandu et al 2010), this indicates that theconstruction of renewable energy plants could be a valuable economic growth driver at atime when fears of recession abound.
The report concludes that the WWF is optimistic that South Africa can achieve a muchmore promising clean energy future than current plans allow for. With an excellent solarresource and several very good wind-producing pockets, the country is an ideal candidatefor a renewable energy revolution.
The report indicates that the levelised cost of producing renewable energy alreadycompetes favourably with the three main alternatives, namely coal, gas and nuclear. Inaddition, renewable energy would contribute to a more climate-resilient future and insulateSouth Africa from dependence on expensive and unreliable fuel sources priced in dollars.Critical from a planning perspective, the report notes that renewable energy can alsoprovide added flexibly on an ‘as needed’ basis, as electricity demand grows. This is vitalin a highly uncertain environment.
5.5 The impact of the green economy on jobs in South Africa
The paper notes that greening the economy is particularly important in South Africa fortwo basic reasons: (1) the exceptional level of unemployment that the country isexperiencing and (2) the high carbon impact of the economy.
In terms of employment, the paper refers to the IDC Green Jobs Report (2011). Insummary, the short-term (next 2 years) estimate of total net employment potential is 98000 jobs, and the long-term (next 8 years) employment potential is 462 567 jobs. 16Natural resource management is predicted to lead to the greatest number of these at 232926 long-term jobs. Green energy generation is estimated to produce 130 023 long-termjobs, with energy and resource efficiency measures adding another 67 977 long-term jobs.
The paper notes that the Green Jobs Report was prepared by 17 primary researchers fromthree prominent organisations, namely the IDC, the Development Bank of South Africa,and Trade and Industrial Policy Strategies. Many role players from other organisationswere also consulted, including the World Wide Fund for Nature, the Green Building Council,the Economic Development Department and private companies involved in greenindustries.
Despite questions surrounding the employment estimates contained in the Green JobsReport, green economic activity does appear to generate more local jobs than fossil-fuel-based industries. Some of the estimates also indicate the potential for significantemployment. The paper concludes that the figures represent a promising starting pointthat warrants further research and policy involvement in greening the economy in SouthAfrica.
5.6 The potential for local community benefits from wind farms in South Africa
In her thesis, Tait notes that the distributed nature of renewable energy generation caninduce a more geographically dispersed pattern of development. As a result RE sites canbe highly suited to rural locations with otherwise poor potential to attract local inwardinvestment therefore enabling to target particularly vulnerable areas.
In her conclusion, Tait notes that the thesis has found positive evidence for theestablishment of community benefit schemes in the wind sector in South Africa. The

24
BBBEE requirements for developers as set out in the DoE’s IPPPP for renewables is theprimary driver for such schemes. The procurement programme, in keeping with theobjective of maximising the economic development potential from this new sector,includes a specific focus on local communities in which wind farms are located.
The procurement programme, typical of all Government tendering processes, includes aBBBEE scorecard on which wind projects are evaluated. However the renewablesscorecard appears to play an important part in a renewed focus on the broad-basedAspects of the legislation, as enforced by a recent national review of the BBBEE Act. Inthis regard the renewables scorecard includes specifications for local communities inrespect of broad-based ownership schemes, socio-economic development and enterprisedevelopment contributions. This approach to legislating social responsibilities of businessin all sectors definitely has a South African flavour, borne out of the political history of thecountry and the imperatives for social transformation laid out in the constitution.
While Tait notes that it is still early days for the development of this sector and one cannotdetermine the impact that such benefit schemes may have, it is clear though that targeteddevelopment expenditure will be directed to multiple rural communities and there seemsto be a strong potential to deliver socio-economic benefits.

25
6. IMPACT OF WIND FARMS ON TOURISM
A review of international literature in the impact of wind farms was undertaken as part ofthe SIA. Three articles were reviewed, namely:
· Atchison, (April, 2012). Tourism Impact of Wind Farms: Submitted to RenewablesInquiry Scottish Government. University of Edinburgh
· Glasgow Caledonian University (2008). The economic impacts of wind farms onScottish tourism. A report prepared for the Scottish Government
· Regeneris Consulting (2014). Study into the Potential Economic Impact of Wind Farmsand Associated Grid Infrastructure on the Welsh Tourism Sector
The most comprehensive appears to be a review undertaken by Professor Cara Aitchisonfrom the University of Edinburgh in 2012 which formed part Renewable Energy Inquiry byScottish Government. The research by Aitchison found that previous research from otherareas of the UK has demonstrated that wind farms are very unlikely to have any adverseimpact on tourist numbers (volume), tourist expenditure (value) or tourism experience(satisfaction) (Glasgow Caledonian University, 2008; University of the West of England,2004). In addition, to date, there is no evidence to demonstrate that any wind farmdevelopment in the UK or overseas has resulted in any adverse impact on tourism. Inconclusion, the findings from both primary and secondary research relating to the actualand potential tourism impact of wind farms indicate that there will be neither an overalldecline in the number of tourists visiting an area nor any overall financial loss in tourism-related earnings as a result of a wind farm development. The study by the GlasgowCaledonian University (2008) found that only a negligible fraction of tourists will changetheir decision whether to return to Scotland as a whole because they have seen a windfarm during their visit.
The study also found that 51.0% of respondents indicated that they thought wind farmscould be tourist attractions. In this regard the visitor centre at the Whitelee Wind Farm ineast Ayrshire Scotland run by ScottishPower Renewables has become one of the mostpopular ‘eco-attractions’ in Scotland, receiving 200 000 visitors since it opened in 2009.
7. IMPACT ON WIND FARMS ON PROPERTY VALUES
The literature review undertaken as part of the SIA does not constitute a propertyevaluation study and merely seeks to comment on the potential impact of wind farms onproperty values based on the findings of studies undertaken overseas. The literaturereviewed was based on an attempt by the authors of the SIA to identify what appear tobe “scientifically” based studies that have been undertaken by reputable institutions. Inthis regard it is apparent that there are a number of articles available on the internetrelating to the impact of wind farms on property values that lack scientific vigour. Theliterature review also sought to identify research undertaken since 2010. The literaturereview does not represent an exhaustive review. In total five articles were identified andreviewed namely:
· Stephen Gibbons (April, 2014): Gone with the wind: Valuing the Visual Impacts ofWind turbines through house prices. London School of Economics and Political Sciences& Spatial Economics Research Centre, SERC Discussion Paper 159;
· Review of the Impact of Wind Farms on Property Values, Urbis Pty Ltd (2016):Commissioned by the Office of Environment and Heritage, NSW, Australia;
· Yasin Sunak and Reinhard Madlener (May 2012): The Impact of Wind Farms onProperty Values: A Geographically Weighted Hedonic Pricing. School of Business andEconomics / E.ON Energy Research Center, RWTH Aachen University. Model WorkingPaper No. 3/2012;
26
· Martin D. Heintzelman and Carrie M. Tuttle (March 3, 2011): Values in the Wind: AHedonic Analysis of Wind Power Facilities. Economics and Financial Studies School ofBusiness, Clarkson University;
· Ben Hoen, Jason P. Brown, Thomas Jackson, Ryan Wiser, Mark Thayer and PeterCappers (August 2013): A Spatial Hedonic Analysis of the Effects of Wind EnergyFacilities on Surrounding Property Values in the United States. Ernest OrlandoLawrence Berkeley National Laboratory.
Three of the articles indicate that wind farms have the potential to impact on propertyvalues, while two indicate that the impacts are negligible and or non-existent. In termsof the proposed project the most relevant study is the Urbis study (2016). The authors ofthe study found that appropriately located wind farms within rural areas, removed fromhigher density residential areas, are unlikely to have a measurable negative impact onsurrounding land values. The author expects this finding to correlate with the Rietkloofwind farm which is located in a rural setting and unlikely to impact significantly on localtourism.

27
ANNEXURE E
EXECUTIVE SUMMARY (EXTRACTED FROM 2016 REPORT)
INTRODUCTION AND LOCATION
Rietkloof Wind Farm (Pty) Ltd (the applicant), a subsidiary of G7 Renewable Energies (Pty)Ltd (G7), proposes to develop a 140 megawatt (MW) wind energy facility (WEF) nearMatjiesfontein and Laingsburg in the Western Cape Province of South Africa. The closesttowns to the site are the small railway siding at Matjiesfontein, situated 30km south of theproject area, and Laingsburg, which is located a further 30km east of Matjiesfontein, alongthe N1 national road. The proposed WEF is located in the Laingsburg Local Municipality,which fall within the Central Karoo District Municipality.
EOH Coastal and Environmental Services were appointed by Rietkloof Wind Farm (Pty) Ltdto manage the Environmental Impact Assessment (EIA) process for the proposed WEF.Tony Barbour was appointed by EOH Coastal and Environmental Services to undertake aspecialist Social Impact Assessment (SIA) as part of the EIA process. This report containsthe findings of the SIA undertaken as part of the EIA process.
PROJECT DESCRIPTION
Please refer to the revised project description as presented in the 2018 BasicAssessment report as prepared by WSP.
APPROACH TO THE STUDY
The approach to the SIA study is based on the Western Cape Department of EnvironmentalAffairs and Development Planning Guidelines for Social Impact Assessment (February2007). These guidelines are based on international best practice. The key activities in theSIA process embodied in the guidelines include:
· Collection and review of baseline socio-economic data;· Review of relevant planning and policy frameworks for the area;· Site specific information collected during the site visit to the area and interviews with
key stakeholders;· Review of information from similar projects; and· Identification of social issues associated with the proposed project.
SUMMARY OF KEY FINDINGS
The key findings of the study are summarised under the following sections:
· Fit with policy and planning;· Construction phase impacts;· Operational phase impacts;· Cumulative Impacts;· Decommissioning phase impacts; and· No-development option.
Policy and planning
The findings of the review indicated that renewable energy is strongly supported at anational, provincial and local level. At a national level the White Paper on Energy Policy(1998) notes:

28
· Renewable resources generally operate from an unlimited resource base and, as such,can increasingly contribute towards a long-term sustainable energy future; and
· The support for renewable energy policy is guided by a rationale that South Africa hasa very attractive range of renewable resources, particularly solar and wind and thatrenewable applications are in fact the least cost energy service in many cases; moreso when social and environmental costs are taken into account.
The IRP 2010 also allocates 43% of energy generation in South Africa to renewables. Thedevelopment of and investment in renewable energy is also supported by the NationalDevelopment Plan (NDP), New Growth Path Framework and National Infrastructure Plan,which all make reference to renewable energy. At a provincial level the development ofrenewable energy is supported by the Northern Cape Provincial Growth and DevelopmentStrategy, Northern Cape Provincial Spatial Development Framework, White Paper onSustainable Energy for the Western Cape, Climate Change Strategy and Action Plan forthe Western Cape and Western Cape Growth and Development Strategy. With regard tolocal level policy documents, the Namakwa DM and Laingsburg IDP make positivereference to the potentially viable development of renewable energy sources. In addition,economic diversification, employment creation and skilling are identified in both theHoogland Karoo and Laingsburg IDPs as urgent, crucial needs.
The findings of the review of the relevant policies and documents pertaining to the energysector therefore indicate that the renewable energy is supported at a national, provincialand local level. It is therefore the opinion of the authors that the establishment of theproposed wind energy facility is supported by relevant policies and planning documents.
The provincial and local policy and planning documents also make reference to theimportance of tourism and the region’s natural resources. Care therefore needs to be takento ensure that the development of large renewable energy projects, such as the proposedfacility, does not impact on the region’s natural resources and the tourism potential of theProvince. However, it should be noted that the proposed Rietkloof WEF is located in anarea that has been identified as a Renewable Energy Development Zone by the CSIR underthe DEAs SEA process. The area has therefore been identified as an area where renewableenergy should be concentrated.
Construction Phase
The key social issues associated with the construction phase include:
Potential positive impacts· Creation of employment and business opportunities, and opportunity for skills
development and on-site training;· Benefits associated with providing technical advice on wind energy to local farmers and
municipalities;· Improved cell phone reception.
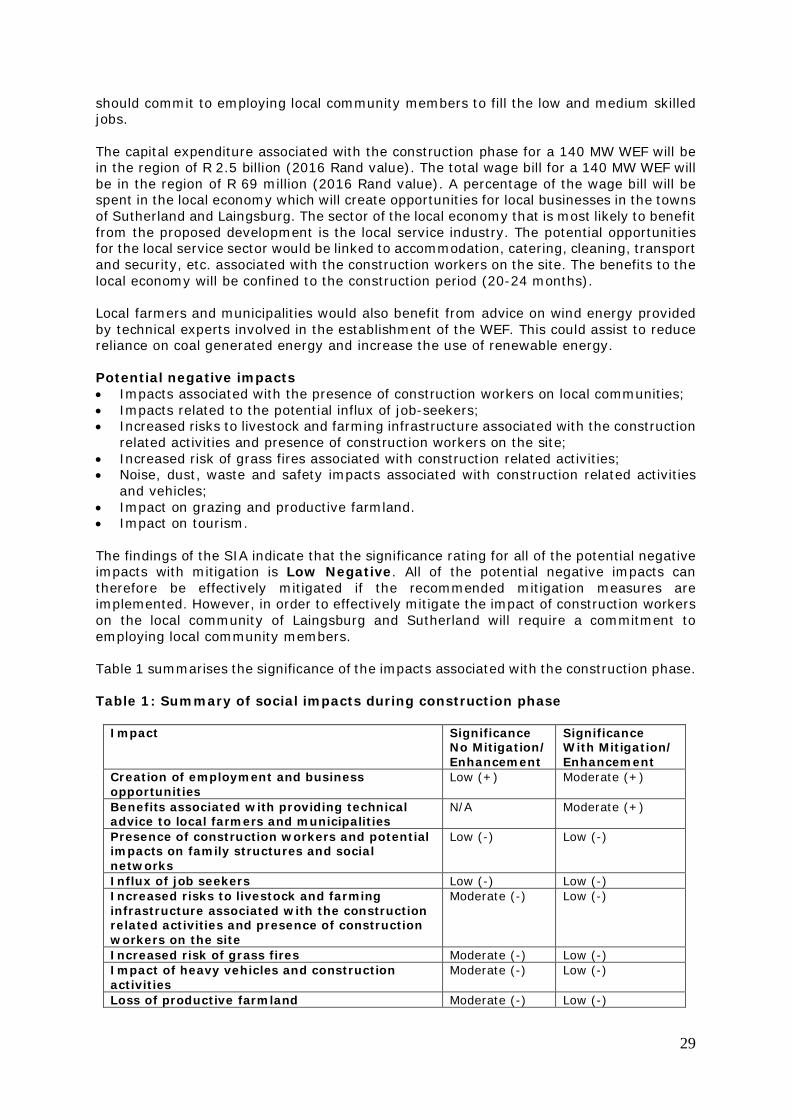
The construction phase for a single 140 MW WEF is expected to extend over a period of20-24 months and create approximately ~ 250 (full-time equivalent) employmentopportunities. It is anticipated that approximately 55% (136) of the employmentopportunities will be available to low skilled workers (construction labourers, security staffetc.), 30% (76) to semi-skilled workers (drivers, equipment operators etc.) and 15% (38)for skilled personnel (engineers, land surveyors, project managers etc.). The majority ofthe low and semi-skilled employment opportunities will be available to local residents inthe area, specifically residents from Sutherland and Laingsburg. The majority of thebeneficiaries are likely to be historically disadvantaged (HD) members of the community.This would represent a significant positive social benefit in an area with limitedemployment opportunities. In order to maximise the potential benefits the developer
29
should commit to employing local community members to fill the low and medium skilledjobs.
The capital expenditure associated with the construction phase for a 140 MW WEF will bein the region of R 2.5 billion (2016 Rand value). The total wage bill for a 140 MW WEF willbe in the region of R 69 million (2016 Rand value). A percentage of the wage bill will bespent in the local economy which will create opportunities for local businesses in the townsof Sutherland and Laingsburg. The sector of the local economy that is most likely to benefitfrom the proposed development is the local service industry. The potential opportunitiesfor the local service sector would be linked to accommodation, catering, cleaning, transportand security, etc. associated with the construction workers on the site. The benefits to thelocal economy will be confined to the construction period (20-24 months).
Local farmers and municipalities would also benefit from advice on wind energy providedby technical experts involved in the establishment of the WEF. This could assist to reducereliance on coal generated energy and increase the use of renewable energy.
Potential negative impacts· Impacts associated with the presence of construction workers on local communities;· Impacts related to the potential influx of job-seekers;· Increased risks to livestock and farming infrastructure associated with the construction
related activities and presence of construction workers on the site;· Increased risk of grass fires associated with construction related activities;· Noise, dust, waste and safety impacts associated with construction related activities
and vehicles;· Impact on grazing and productive farmland.· Impact on tourism.
The findings of the SIA indicate that the significance rating for all of the potential negativeimpacts with mitigation is Low Negative. All of the potential negative impacts cantherefore be effectively mitigated if the recommended mitigation measures areimplemented. However, in order to effectively mitigate the impact of construction workerson the local community of Laingsburg and Sutherland will require a commitment toemploying local community members.
Table 1 summarises the significance of the impacts associated with the construction phase.
Table 1: Summary of social impacts during construction phase
Impact SignificanceNo Mitigation/Enhancement
SignificanceWith Mitigation/Enhancement
Creation of employment and businessopportunities
Low (+) Moderate (+)
Benefits associated with providing technicaladvice to local farmers and municipalities
N/A Moderate (+)
Presence of construction workers and potentialimpacts on family structures and socialnetworks
Low (-) Low (-)
Influx of job seekers Low (-) Low (-)Increased risks to livestock and farminginfrastructure associated with the constructionrelated activities and presence of constructionworkers on the site
Moderate (-) Low (-)
Increased risk of grass fires Moderate (-) Low (-)Impact of heavy vehicles and constructionactivities
Moderate (-) Low (-)
Loss of productive farmland Moderate (-) Low (-)

30
Impact on tourism Low (-) Low (-)
Operational Phase
The key social issues affecting the operational phase include:
Potential positive impacts· Creation of employment and business opportunities. The operational phase will also
create opportunities for skills development and training;· Generation of income for local landowners and farmers;· Benefits associated with the establishment of a Community Trust; and· The establishment of renewable energy infrastructure.
The total number of permanent employment opportunities associated with a 140 MW WEFwould be ~ 20. Of this total ~ 4 are low skilled workers, 10 semi-skilled and 6 skilled. Theannual wage bill for the operational phase will be ~ R 2 million (2016 Rand value). Themajority of the beneficiaries are likely to be historically disadvantaged (HD) members ofthe community. Given the location of the proposed facility the majority of permanent staffis likely to reside in Sutherland and or Laingsburg.
The proposed WEF will also generate revenue for the local farmers on whose land theturbines are located. This will represent a valuable source of income for these landowners,specifically given the challenges faced by farming in the area.
The establishment of a Community Trust also creates an opportunity to support localeconomic development in the area. Community Trusts provide an opportunity to generatea steady revenue stream that is guaranteed for a 20 year period. The revenue from theproposed WEF can be used to support a number of social and economic initiatives in thearea, including:
· Creation of jobs;· Education;· Support for and provision of basic services;· School feeding schemes;· Training and skills development; and· Support for SMME’s.
The long term duration of the revenue stream associated with a WEF linked CommunityTrust also enables local municipalities and communities to undertake long term planningfor the area. Experience has however also shown that Community Trusts can bemismanaged. This issue will need to be addressed in order to maximise the potentialbenefits associated with the establishment of a Community Trust.
The proposed development also represents an investment in infrastructure for thegeneration of clean, renewable energy, which, given the challenges created by climatechange, represents a positive social benefit for society as a whole.
Potential negative impacts· Loss of productive agricultural land;· The visual impacts and associated impact on sense of place; and· Potential impact on tourism.
The findings of the SIA indicate that the significance of the majority of potential negativeimpacts with mitigation were Low Negative. The majority of potential negative impactscan therefore be effectively mitigated if the recommended mitigation measures areimplemented. The significance of the visual impact was rated Medium Negative. Thevisual impacts on landscape character associated with large renewable energy facilities,

31
such as WEFs, are highlighted in the research undertaken by Warren and Birnie (2009).In the South African context, many South Africans have a strong connection with andaffinity for the large, undisturbed open spaces that are characteristic of the South Africanlandscape. The impact of large, WEFs on the landscape is therefore likely to be a key issuein South Africa, specifically given South African’s strong attachment to the land and thegrowing number of renewable energy applications. However, it should be noted that theproposed Rietkloof WEF is located in an area that has been identified as a RenewableEnergy Development Zone by the CSIR under the DEAs SEA process. The area hastherefore been identified as an area where renewable energy should be concentrated.Table 2 summarises the significance of the impacts associated with the operational phase.
Table 2: Summary of social impacts during operational phase
Impact SignificanceNo Mitigation/Enhancement
SignificanceWith Mitigation/Enhancement
Creation of employment and businessopportunities
Low (+) Moderate (+)
Generation of income for landowners Low (+) Moderate (+)Establishment of Community Trust Moderate (+) High (+)Promotion of renewable energy projects Moderate (-) Moderate (+)Visual impact and impact on sense of place Moderate (-) Moderate (-)6
Impact on tourism Low (-) Low (-)
Cumulative Impacts
Cumulative impact on sense of placeIn the region of 18 renewable energy projects, including 14 WEFs, are proposed in theKomsberg REDZ area. The potential for cumulative impacts associated with combinedvisibility (whether two or more wind energy facilities will be visible from one location) andsequential visibility (e.g. the effect of seeing two or more renewable energy facilities alonga single journey, e.g. road or walking trail) is therefore high. However, this should beviewed within the context of the identification of the area as a renewable energydevelopment zone. The area has therefore been identified as an area where renewableenergy should be concentrated.
In addition, due to the proximity of the different sites the various WEFs could be viewedas a single large WEF as opposed to a number of separate WEFs. While viewing theseWEFs as a single large facility, as opposed to separate facilities, does not reduce the overallvisual impact on the scenic character of the area, it does reduce the potential cumulativeimpact on the landscape. Viewing each of the proposed WEFs as a single, large WEF hasthe potential to reduce the cumulative impacts associated with combined visibility(whether two or more wind farms will be visible from one location) and sequential visibility(e.g. the effect of seeing two or more wind farms along a single journey, e.g. road orwalking trail). The proximity of the WEFs also has the benefit of concentrating the visualimpacts on the areas sense of place in to one area as opposed to impacting on a numberof more spread out areas. Despite this the cumulative impact on the areas sense of placeis rated as Moderate Negative. This significance rating should be viewed within thecontext of the proposed Rietkloof WEF location within an area that has been identified asa Renewable Energy Development Zone by the CSIR under the DEAs SEA process. Thearea has therefore been identified as an area where renewable energy should beconcentrated.
Cumulative impact on services
6 The significance should be viewed within the context of area being identified as a renewable energydevelopment area.
32
The establishment of the proposed Rietkloof WEF and the other renewable energy facilitiesin the Komsberg REDZ will place pressure on local services in the townsw of Sutherlandand Laingsburg, specifically medical, education and accommodation. This pressure will beassociated with the influx of workers to the area associated with the construction andoperational phases of the renewable energy projects proposed in the area, including theproposed Rietkloof WEF. The potential impact on local services can be mitigated byemploying local community members. The presence of non-local workers during both theconstruction and operation phase will also place pressure on property prices and rentals.As a result, local residents, such as government officials, such as municipal workers, schoolteachers and the police, may no longer be able to buy or afford to rent accommodation intowns such as Sutherland and Laingsburg. With effective mitigation the impact is rated asLow Negative.
However, as indicated below, this impact should also be viewed within the context of thepotential positive cumulative impacts for the local economy associated with theestablishment of a renewable energy hub in the area. These benefits will createopportunities for investment in Laingsburg and Sutherland, including the opportunity toup-grade and expand existing services and the construction of new houses. In this regardthe establishment of a renewable energy hub will create a unique opportunity for thesetowns to develop. In should also be noted that it is the function of national, provincial andlocal government to address the needs created by development and provide the requiredservices. The additional demand for services and accommodation created by theestablishment of development renewable energy projects in the Komsberg REDZ shouldtherefore be addressed in the Integrated Development Planning process undertaken bythe KHLM and LLM.
Cumulative impact on local economiesIn addition to the potential negative impacts, the establishment of the proposed WEF andother renewable energy projects in the area also has the potential to create a number ofsocio-economic opportunities for the Karoo Hoogland Local Municipality (KHLM) andLaingsburg Local Municipality (LLM), which, in turn, will result in a positive social benefit.The positive cumulative impacts include creation of employment, skills development andtraining opportunities, creation of downstream business opportunities. This benefit is ratedas High Positive with enhancement.
Power lines and substations
With the exception of two substations sites, namely one located approximately 600m tothe north east of Hartjieskraal farmstead (Alternative 7), and one 1.4 km to the south ofFortuin (Alternative 1), the remaining five substation sites are proposed on the moreinaccessible portions of farms, at some distance from the relevant farmsteads. While noneof the owners – including those of Hartjieskraal or Fortuin –raised any concerns or issueswith regard to the proposed location of turbines or substations, it is recommended thatsubstation site should not be located near existing dwellings. Alternative 1 and 7 aretherefore not supported. In terms of access Alternative 2 appears to be the best option.
Based on the findings of the SIA the potential social impacts associated with the overheadpower lines and substations will be limited, specifically within the context of theestablishment of the wind turbines associated with the proposed WEF. In addition themajority of the power lines are confined to the site. The connection to the Eskom grid formpart of separate Basic Assessment process and it not assessed as part of the SIA.
The final route selection of the power lines and location of the substation should beinformed by current location of farm dwellings on the site and the findings of the VIA, andthe botanical and agricultural assessments.
Access roads and construction camps

33
Three access road alternatives, namely alternative 1, 2 and 3, and 13 construction campalternatives, namely alternative 1-4 and 6-14, have been identified. Based on the findingsof the SIA none of the local farm owners raised any concerns regarding the proposedaccess road alternatives. However, Access Road Alternative 1 is the preferred access forthe Brandvalley WEF. In addition Alternative 1 also provides access for the sharedconstruction camp proposed by Mr le Roux, the owner of Fortuin as discussed below.
The location of construction camps was however raised as a key concern by a number oflandowners. Concerns were raised by the owners of Fortuin (Andries le Roux),Hartjieskraal (Ernst Marais) and Nuwerus (Ziegfried Loots). The relevant owners indicatedthat the proposed sites are too close to the farm yard (Fortuin), would damage goodgrazing areas (Nuwerus) or damage a potential cropping area (Hartjieskraal). All threeowners proposed alternative locations. This site is located near the intersection of the R354and the Ou Mure Road and corresponds to Alterative 3 associated with the BrandvalleyWEF. The proposal by Mr le Roux is also supported by the owner of Nuwerus, Mr Loots.Based on this information Construction Camp Alternative Areas 4, 6, 7, 8, 9 and 10 arenot supported by the findings of the SIA.
The owner of Hartjieskraal, Mr Marais, indicated that Alternative 1 and 14 would damagethe best potential cropping area on his property. Mr Marais has proposed a site located tothe west of the Barendkloof River, on slightly uneven terrain. This area corresponds toAlternative 11.
Based on the findings of the SIA it would appear that Construction Camp Alternative Areas2, 3, 11 and 13 are suitable site alternatives. However, Alternative 12 is located adjacentto the R 354 and has the potential to create visual impacts for passing motorists. Theoption of establishing a shared site with the Brandvalley WEF near the intersection of theR354 and the Ou Mure Road that corresponds to Alterative 1 associated with theBrandvalley WEF should be considered. The disturbance associated with the establishmentof a construction camp for the proposed Brandvalley and Rietkloof WEFs projects wouldtherefore be confined to a single area.
Potential health impacts
The potential health impacts typically associated with WEFs include, noise, shadow flickerand electromagnetic radiation. As indicated above, the findings of a literature reviewundertaken by the Australian Health and Medical Research Council published in July 2010indicate that there is no evidence of wind farms posing a threat to human health. Theresearch also found that wind energy is associated with fewer health effects than otherforms of traditional energy generation (WHO, 2004). Based on these findings it is assumedthat the significance of the potential health risks posed by the proposed WEF is of LowNegative significance. A noise impact assessment is being undertaken to inform the EIAand will assess the significance of noise impacts.
No-Development Option
The No-Development option would represent a lost opportunity for South Africa tosupplement is current energy needs with clean, renewable energy. Given South Africa’sposition as one of the highest per capita producer of carbon emissions in the world, thiswould represent a High negative social cost. The no-development option also representsa lost opportunity in terms of the employment and business opportunities (constructionand operational phase) associated with the proposed Rietkloof WEF, and the benefitsassociated with the establishment of a Community Trust. This also represents a negativesocial cost.

34
However, at a provincial and national level, it should be noted that the proposed WEF isnot unique. In this regard, a significant number of renewable energy developments,including WEFs, are currently proposed in the Western Cape and South Africa. Foregoingthe development of the proposed Rietkloof WEF would therefore not necessarilycompromise the development of renewable energy facilities in the Western Cape and orSouth Africa. However, the socio-economic benefits the local communities in the KHLMand LLM would be forgone. The significance of this opportunity cost to the localcommunities is rated as Moderate Negative.
Decommissioning Phase
Typically, the major social impacts associated with the decommissioning phase are linkedto the loss of jobs and associated income. This has implications for the households whoare directly affected, the communities within which they live, and the relevant localauthorities. After 20-25 years of operations, the WEF would either be decommissionedand the area rehabilitated or the structures would be replaced with more moderntechnology (referred to as refurbishment or re-powering). Both options would createtemporary employment opportunities. In the case of refurbishment the permanent jobswould be retained. There would therefore be no job losses. In the case of decommissioningthe 20 permanent jobs associated with the operational phase would be lost.
The potential impacts associated with the decommissioning phase can however beeffectively managed with the implementation of a retrenchment and downscalingprogramme. With mitigation, the impacts are assessed to be Low Negative. Theproponent should also investigate the option of establishing an EnvironmentalRehabilitation Fund to cover the costs of decommissioning and rehabilitation of disturbedareas. The Fund should be funded by a percentage of the revenue generated from the saleof energy to the national grid over the 20-25 year operational life of the facility. Therationale for the establishment of a Rehabilitation Trust Fund is linked to the experienceswith the mining sector in South Africa and failure of many mining companies to allocatesufficient funds during the operational phase to cover the costs of rehabilitation andclosure. Alternatively, the funds from the sale of the WEF as scrap metal should beallocated to the rehabilitation of the site.
CONCLUSIONS AND RECOMMENDATIONS
The findings of the SIA indicate that the development of the proposed Rietkloof WEF willcreate employment and business opportunities for locals during both the construction andoperational phase of the project. The establishment of a Community Trust will also benefitthe local community. The enhancement measures listed in the report should beimplemented in order to maximise the potential benefits. The proposed development alsorepresents an investment in clean, renewable energy infrastructure, which, given thechallenges created by climate change, represents a positive social benefit for society as awhole. In addition, the majority of the potential negative impacts, including the impactsassociated with construction workers and the influx of job seekers, can be effectivelymitigated. It is therefore recommended that the Rietkloof WEF be supported, subject tothe implementation of the recommended mitigation measures and management actionscontained in the SIA report. In this regard it is recommended that the Western andNorthern Cape Provincial Governments, in consultation with the KHLM and LLM and theproponents involved in the development of renewable energy projects in the KomsbergREDZ, consider the establishment of a Development Forum to co-ordinate and managethe development and operation of renewable energy projects in the Komsberg REDZ, withthe specific aim of mitigating potential negative impacts and enhancing opportunities.
In terms of preferred layout alternatives, the alternative with the lowest potential visualimpact on adjacent farms is regarded as the preferred alternative. The placement of

35
turbines should therefore be informed by the findings of the other specialist studies,specifically the VIA and agricultural assessment.
IMPACT STATEMENT
The findings of the SIA undertaken for the proposed Rietkloof WEF indicate that thedevelopment will create employment and business opportunities for locals during both theconstruction and operational phase of the project. The establishment of a Community Trustwill also benefit the area. It is therefore recommended that the Rietkloof WEF besupported, subject to the implementation of the recommended mitigation measures andmanagement actions contained in the report and other key specialist studies, specificallythe VIA and agricultural assessments.