Richard Montgomery Elementary School #5 Boundary Advisory...
47
Richard Montgomery Elementary School #5 Boundary Advisory Committee Meeting 3 April 5, 2017 www.montgomeryschoolsmd.org/departments/planning/rmes.aspx 1
Transcript of Richard Montgomery Elementary School #5 Boundary Advisory...

Richard Montgomery Elementary School #5
Boundary Advisory Committee
Meeting 3
April 5, 2017
www.montgomeryschoolsmd.org/departments/planning/rmes.aspx
1

Agenda
• Review feedback from meeting 2.• Review follow up materials. • Review boundary options• Discuss boundary options.• Discuss next steps and fill out feedback forms.• Address questions and comments from
observers.
2

Ground Rules
1. Be true to the charge
2. Share openly
3. Participate enthusiastically
4. Give and receive constructive feedback
5. Appreciate everyone’s ideas
6. Suspend judgment
7. Limit discussions to the topic
8. Do homework and be prepared
9. Abide by decisions made by the facilitators
10. Turn off cell phones, set to vibrate, or answer on first ring
11. Start and end meetings on time
12. Step up, step back.
3

Meeting 2 Feedback
This session was most helpful at:
Laying out the options Explaining changes Explaining the zone map Showing zones and boundaries
4

This session was least helpful at:
• Providing numbers for each zone• Showing impact of development- past and present• Rationale behind the options• More of a written summary of the options
Suggestions for future sessions:
• Provide materials and numbers of students
• Show development
• Come prepared with summaries in writing
5

Follow Ups Requested by Committee
• Post information to website• Specific development yields and projection accuracy for
pupil generation rates • Suggested modifications to zones• Developments by zone • Transportation information
6

Yields
7
SDATProperty Info
MCPSPupil Information
# Stories(LiDAR)
Building footprintTypical unit size
Yield Rate
Yields
8
Congressional Villages198 HalpineYield 0.093 ES per unit
Countywide 0.203Upcounty 0.193
Congressional TowersCongressional LaneYield 0.171 ES per unit
Countywide 0.071Upcounty 0.084
The Alaire1101 Higgins PlaceYield 0.026 ES per unit
Countywide 0.071Upcounty 0.084

DevelopmentAnticipated in six year CIP period
9
School and Zones Housing Developments Planned Units Rate Potential ES
Beall
B5 41 Maryland Ave 117 MFHR 0.084 10
B5 Duball Phase II (Rockville Town Center) 400 MFHR 0.084 34
B5 Kettler (The Metropolitan) 275 MFHR 0.084 23
B5 Tower Oaks SFD 30SF 0.215 6
B3 Tower Oaks (Preserve Pkwy) Towns 225 TH 0.253 57
B3 Tower Oaks (Preserve Pkwy) Apt 120 MFHR 0.084 10
B5 Upton & Cambria (Duball 196 Phase 1) Occupied 0.084 22
College Gardens
CG 4 Quality Suites/Flats Shady Grove Occupied 0.052 11
CG 4 Rockivlle Mews 83 Towns Resubmittal 0.253 15
Ritchie Park
RP3 Park Potomac (Fortune Parc) Towns Occupied 0.253 38
RP3 Park Potomac (Fortune Parc) Apt Occupied 0.084 38
Twinbrook
T1 Avalon Bay Twinbrook Station 240 MF high rise 0.084 20

Number of Students per Zone
• Some zones may contain numbers of students that are smaller than 5 which could identify individual students. By law, MCPS may not release data that could identify individual students to community members to protect the identity of those students.
• As described in Regulation FAA-RA Long-range Educational Facilities Planning, the role of the committee members is to develop criteria to assist MCPS staff in the development of the options.
• If committee members were provided zone data, committee members would have the ability to develop options which is outside the scope of the committee member role as described in regulation FAA-RA.
10

Tran
sp
orta
tio
n
info
rm
ati
on
11
Option ZoneCurrent
Bus TimeProposed Bus Time Option Zone
Current Bus Time
Proposed Bus Time
1 B3 9 5 3 B3 9 5
1 B7 9 12 3 B7 9 12
1 RP6 7 5 3 RP6 7 5
1 T3 12 11 3 T2 5 10
1 CG3 6 6 3 T2 9 14
2 B3 9 5 3 CG3 6 6
2 B7 9 12 4 B3 9 5
2 RP6 7 5 4 B5 12 13
2 CG3 6 6 4 B6 10 15
4 CG2 8 11

12

Committee Criteria
• Minimize splits to community identity, subdivisions, and civic association areas
• Minimize travel time
• Keep schools below 100% utilization and eliminate relocatable classrooms
• Give consideration to community support mechanisms such as community centers
• Promote a diverse student body
• Minimize relocation of students out of their home school
• Reserve space and room for growth for approved plan development
• Consider overcapacity at schools with future shell build out capability
• Minimize a domino effect
• Maximize walkers
• Minimize displacement of home school students by the Chinese Immersion program
• Consider stability of school assignments over time for immersion students
13
14
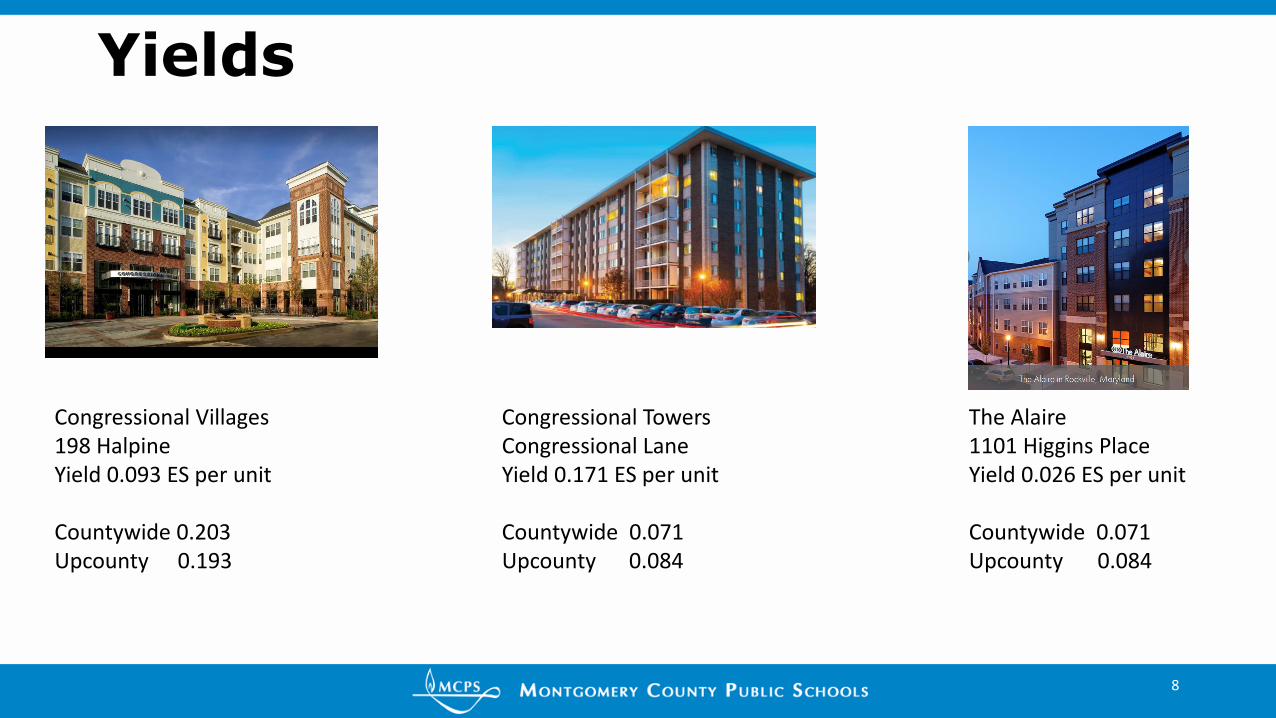
Option # 1 B2, B3, and B7 from Beall Elementary to Richard Montgomery
Cluster Elementary #5.
CG3 from College Gardens Elementary to Beall Elementary.
Chinese Immersion is moved from College Gardens Elementary
to Richard Montgomery Cluster Elementary #5.
RP2 and RP6 from Ritchie Park Elementary to Richard
Montgomery Cluster Elementary #5.
T3 from Twinbrook Elementary to Richard Montgomery Cluster
Elementary # 5.
15
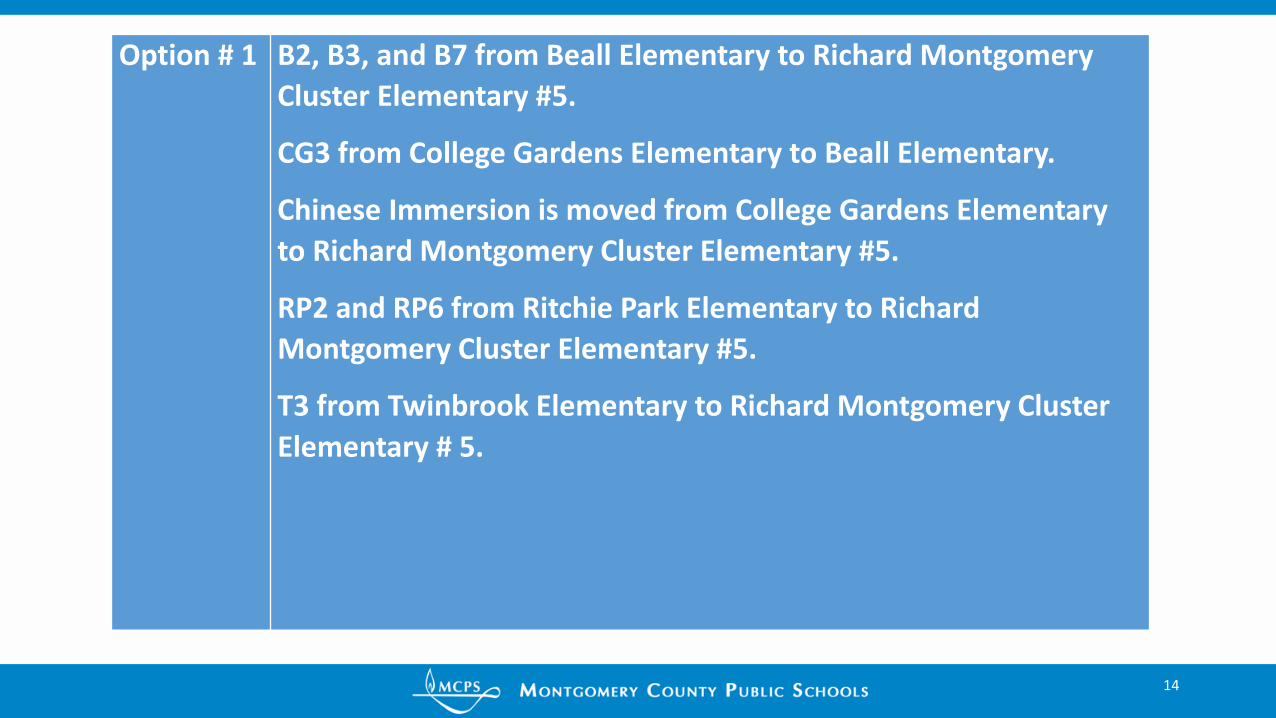
• B2, B3, and B7 from Beall to
RM ES #5.
• CG3 from College Gardens to
Beall.
• Chinese Immersion is moved
from College Gardens to RM ES
#5.
• RP2 and RP6 from Ritchie Park
to RM ES #5.
• T3 from Twinbrook to RM ES #
5.

16
Option 12016–2017
Projected Number of Students Race/Ethnic Composition
Boundary
Implement
ed % Afr. % % % % % %
2017–2018 2018–2019 2019–2020 2020–2021 2021–2022 2022–2023 Amer. Asian Hispanic White 2 or More FARMS ESOL
Beall Elementary School
Maximum Number of Seats = 638 0
No Change:
Number of Students 813 849 855 865 872 871
Percent of Building Occupied 127% 133% 134% 136% 137% 137% 12.1% 24.1% 22.0% 35.4% 6.4% 25.0% 15.4%
Available Seats (175) (211) (217) (227) (234) (233)
Reassign zones B2, B3, and B7 to
Richard Montgomery Cluster ES #5.
Zone CG3 received from College
Gardens ES.
With Change:
Number of Students 813 643 659 660 676 703
Percent of Building Occupied 127% 101% 103% 103% 106% 110% 13.6% 17.4% 17.9% 42.7% 8.5% 18.2% 12.0%
Available Seats (175) (5) (21) (22) (38) (65)

17
Option 12016–2017
Projected Number of Students Race/Ethnic Composition
Boundary
Implement
ed % Afr. % % % % % %
2017–2018 2018–2019 2019–2020 2020–2021 2021–2022 2022–2023 Amer. Asian Hispanic White 2 or More FARMS ESOL
College Gardens Elementary SchoolMaximum Number of Seats= 693
No Change:
Number of Students 879 881 851 848 839 846
Percent of Building Occupied 127% 127% 123% 122% 121% 122% 17.9% 22.2% 14.4% 38.2% 7.3% 14.5% 14.8%
Available Seats (186) (188) (158) (155) (146) (153)
Zone CG3 is reassigned to Beall ES.
Chinese Immersion is moved to
Richard Montgomery Cluster ES #5.
With Change:
Number of Students 879 650 649 662 658 653
Percent of Building Occupied 127% 94% 94% 96% 95% 94% 18.4% 24.0% 14.9% 35.4% 7.3% 16.2% 19.4%
Available Seats (186) 43 44 31 35 40

18
Option 12016–2017
Projected Number of Students Race/Ethnic Composition
Boundary
Implement
ed % Afr. % % % % % %
2017–2018 2018–2019 2019–2020 2020–2021 2021–2022 2022–2023 Amer. Asian Hispanic White 2 or More FARMS ESOL
Richard Montgomery Cluster ES #5
Maximum Number of Seats= 602
No Change:
New
School
Opens
Number of Students 0 0 0 0 0
Percent of Building Occupied 0% 0% 0% 0% 0%
Available Seats 602 602 602 602 602
Richard Montgomery Cluster ES #5
attending area is comprised of RP2,
RP6, B2, B3, B7, T3, and Chinese
Immersion
With Change:
Number of Students 0 574 590 594 582 596
Percent of Building Occupied 0% 95% 98% 99% 97% 99% 10.2% 30.4% 28.7% 26.2% < 5 % 29.7% 19.8%
Available Seats 0 28 12 8 20 6

19
Option 12016–2017
Projected Number of Students Race/Ethnic Composition
Boundary
Implement
ed % Afr. % % % % % %
2017–2018 2018–2019 2019–2020 2020–2021 2021–2022 2022–2023 Amer. Asian Hispanic White 2 or More FARMS ESOL
Ritchie Park Elementary SchoolMaximum Number of Seats= 387
No Change:
Number of Students 506 514 501 490 503 501
Percent of Building Occupied 131% 133% 129% 127% 130% 129% 12.6% 22.2% 18.1% 41.1% 5.9% 23.0% 11.3%
Available Seats (119) (127) (114) (103) (116) (114)
Reassign zones RP2 and RP6 to
Richard Montgomery Cluster ES #5.
With Change:
Number of Students 506 373 379 375 379 379
Percent of Building Occupied 131% 96% 98% 97% 98% 98% 10.5% 19.6% 12.3% 50.5% 7.1% 11.9% 6.9%
Available Seats (119) 14 8 12 8 8

20
Option 12016–2017
Projected Number of Students Race/Ethnic Composition
Boundary
Implement
ed % Afr. % % % % % %
2017–2018 2018–2019 2019–2020 2020–2021 2021–2022 2022–2023 Amer. Asian Hispanic White 2 or More FARMS ESOL
Twinbrook Elementary SchoolMaximum Number of Seats= 553 0
No Change:
Number of Students 575 593 587 599 596 581
Percent of Building Occupied 104% 107% 106% 108% 108% 105% 10.7% 13.5% 61.0% 11.4% < 5 % 68.7% 50.1%
Available Seats (22) (40) (34) (46) (43) (28)
Reassign zone T3 to Richard
Montgomery Cluster ES # 5.
With Change:
Number of Students 575 513 506 512 514 523
Percent of Building Occupied 104% 93% 92% 93% 93% 95% 11.2% 13.6% 60.9% 10.3% < 5 % 60.1% 45.0%
Available Seats (22) 40 47 41 39 30

21
Option # 2 B2, B3, and B7 from Beall Elementary to Richard Montgomery
Cluster Elementary #5.
CG3 is reassigned from College Gardens Elementary to Beall
Elementary.
Chinese Immersion is moved from College Gardens Elementary to
Richard Montgomery Cluster Elementary #5.
RP2 and RP6 from Ritchie Park Elementary to Richard
Montgomery Cluster Elementary #5.

22
• B2, B3, and B7 from Beall
Elementary to Richard
Montgomery Cluster
Elementary #5.
• CG3 is reassigned from College
Gardens Elementary to Beall
Elementary.
• Chinese Immersion is moved
from College Gardens
Elementary to Richard
Montgomery Cluster
Elementary #5.
• RP2 and RP6 from Ritchie Park
Elementary to Richard
Montgomery Cluster
Elementary #5.

23
Option 2
2016–2017
Projected Number of Students Race/Ethnic Composition
Boundary
Implement
ed % Afr. % % % % % %
2017–2018 2018–2019 2019–2020 2020–2021 2021–2022 2022–2023 Amer. Asian Hispanic White 2 or More FARMS ESOL
Beall Elementary SchoolMaximum Number of Seats = 638 0
No Change:
Number of Students 813 849 855 865 872 871
Percent of Building Occupied 127% 133% 134% 136% 137% 137% 12.1% 24.1% 22.0% 35.4% 6.4% 25.0% 15.4%
Available Seats (175) (211) (217) (227) (234) (233)
Reassign zones B2, B3, and B7 to
Richard Montgomery Cluster ES #5.
Zone CG3 is received from College
Gardens ES.
With Change:
Number of Students 813 643 659 660 676 703
Percent of Building Occupied 127% 101% 103% 103% 106% 110% 13.6% 17.4% 17.9% 42.7% 8.5% 18.2% 12.0%
Available Seats (175) (5) (21) (22) (38) (65)

24
Option 2
2016–2017
Projected Number of Students Race/Ethnic Composition
Boundary
Implement
ed % Afr. % % % % % %
2017–2018 2018–2019 2019–2020 2020–2021 2021–2022 2022–2023 Amer. Asian Hispanic White 2 or More FARMS ESOL
College Gardens Elementary SchoolMaximum Number of Seats= 693
No Change:
Number of Students 879 881 851 848 839 846
Percent of Building Occupied 127% 127% 123% 122% 121% 122% 17.9% 22.2% 14.4% 38.2% 7.3% 14.5% 14.8%
Available Seats (186) (188) (158) (155) (146) (153)
Zone CG3 is reassigned to Beall ES.
Chinese Immersion is moved to
Richard Montgomery Cluster ES #5.
With Change:
Number of Students 879 650 649 662 658 653
Percent of Building Occupied 127% 94% 94% 96% 95% 94% 18.4% 24.0% 14.9% 35.4% 7.3% 16.2% 19.4%
Available Seats (186) 43 44 31 35 40

25
Option 2
2016–2017
Projected Number of Students Race/Ethnic Composition
Boundary
Implement
ed % Afr. % % % % % %
2017–2018 2018–2019 2019–2020 2020–2021 2021–2022 2022–2023 Amer. Asian Hispanic White 2 or More FARMS ESOL
Richard Montgomery Cluster ES #5
Maximum Number of Seats = 602 0
No Change:
New
School
Opens
Number of Students 0 0 0 0 0
Percent of Building Occupied 0% 0% 0% 0% 0%
Available Seats 602 602 602 602 602
Richard Montgomery Cluster ES #5
attending area is comprised of RP2,
RP6, B2, B3, B7, and Chinese
Immersion.
With Change:
Number of Students 530 542 549 536 550
Percent of Building Occupied 88% 90% 91% 89% 91% 11.9% 33.2% 22.5% 26.8% 5.7% 29.9% 19.6%
Available Seats 72 60 53 66 52

26
Option 2
2016–2017
Projected Number of Students Race/Ethnic Composition
Boundary
Implement
ed % Afr. % % % % % %
2017–2018 2018–2019 2019–2020 2020–2021 2021–2022 2022–2023 Amer. Asian Hispanic White 2 or More FARMS ESOL
Ritchie Park Elementary SchoolMaximum Number of Seats= 387
No Change:
Number of Students 506 514 501 490 503 501
Percent of Building Occupied 131% 133% 129% 127% 130% 129% 12.6% 22.2% 18.1% 41.1% 5.9% 23.0% 11.3%
Available Seats (119) (127) (114) (103) (116) (114)
Reassign zones RP2 and RP6 to
Richard Montgomery Cluster ES #5.
With Change:
Number of Students 506 373 379 375 379 379
Percent of Building Occupied 131% 96% 98% 97% 98% 98% 10.5% 19.6% 12.3% 50.5% 7.1% 11.9% 6.9%
Available Seats (119) 14 8 12 8 8

27
Option 2
2016–2017
Projected Number of Students Race/Ethnic Composition
Boundary
Implement
ed % Afr. % % % % % %
2017–2018 2018–2019 2019–2020 2020–2021 2021–2022 2022–2023 Amer. Asian Hispanic White 2 or More FARMS ESOL
Twinbrook Elementary SchoolMaximum Number of Seats= 553 0
No Change:
Number of Students 575 593 587 599 596 581
Percent of Building Occupied 104% 107% 106% 108% 108% 105% 10.7% 13.5% 61.0% 11.4% < 5% 68.7% 50.1%
Available Seats (22) (40) (34) (46) (43) (28)
No Boundary Change
With Change:
Number of Students 575 593 587 599 596 581
Percent of Building Occupied 104% 107% 106% 108% 108% 105% 10.7% 13.5% 61.0% 11.4% < 5% 68.7% 50.1%
Available Seats (22) (40) (34) (46) (43) (28)

28
Option # 3 B2, B3, and B7 from Beall Elementary to Richard Montgomery
Cluster Elementary #5.
CG3 is reassigned from College Gardens Elementary to Beall
Elementary.
Chinese Immersion is moved from College Gardens Elementary
to Twinbrook ES.
RP2 and RP6 from Ritchie Park Elementary to Richard
Montgomery Cluster Elementary #5.
T2 from Twinbrook Elementary to Richard Montgomery Cluster
Elementary # 5.

29
• B2, B3, and B7 from BeallElementary to Richard Montgomery Cluster Elementary #5.
• CG3 is reassigned from College Gardens Elementary to Beall Elementary.
• Chinese Immersion is moved from College Gardens Elementary to Twinbrook ES.
• RP2 and RP6 from Ritchie Park Elementary to Richard Montgomery Cluster Elementary #5.
• T2 from TwinbrookElementary to Richard Montgomery Cluster Elementary # 5.

30
Option 3
2016–2017
Projected Number of Students Race/Ethnic Composition
Boundary
Implement
ed % Afr. % % % % % %
2017–2018 2018–2019 2019–2020 2020–2021 2021–2022 2022–2023 Amer. Asian Hispanic White 2 or More FARMS ESOL
Beall Elementary SchoolMaximum Number of Seats = 638 0
No Change:
Number of Students 813 849 855 865 872 871
Percent of Building Occupied 127% 133% 134% 136% 137% 137% 12.1% 24.1% 22.0% 35.4% 6.4% 25.0% 15.4%
Available Seats (175) (211) (217) (227) (234) (233)
Reassign zones B2, B3, and B7 to
Richard Montgomery Cluster ES #5.
Zone CG3 is received from College
Gardens ES.
With Change:
Number of Students 813 643 659 660 676 703
Percent of Building Occupied 127% 101% 103% 103% 106% 110% 13.6% 17.4% 17.9% 42.7% 8.5% 18.2% 12.0%
Available Seats (175) (5) (21) (22) (38) (65)

31
Option 3
2016–2017
Projected Number of Students Race/Ethnic Composition
Boundary
Implement
ed % Afr. % % % % % %
2017–2018 2018–2019 2019–2020 2020–2021 2021–2022 2022–2023 Amer. Asian Hispanic White 2 or More FARMS ESOL
College Gardens Elementary SchoolMaximum Number of Seats= 693
Zone CG3 is reassigned to Beall ES.
Chinese Immersion is moved to
Twinbrook Elementary 0
No Change:
Number of Students 879 881 851 848 839 846
Percent of Building Occupied 127% 127% 123% 122% 121% 122% 17.9% 22.2% 14.4% 38.2% 7.3% 14.5% 14.8%
Available Seats (186) (188) (158) (155) (146) (153)
Zone CG3 is reassigned to Beall ES.
Chinese Immersion is moved to
Twinbrook Elementary
With Change:
Number of Students 879 650 649 662 658 653
Percent of Building Occupied 127% 94% 94% 96% 95% 94% 18.4% 24.0% 14.9% 35.4% 7.3% 16.2% 19.4%
Available Seats (186) 43 44 31 35 40

32
Option 3
2016–2017
Projected Number of Students Race/Ethnic Composition
Boundary
Implement
ed % Afr. % % % % % %
2017–2018 2018–2019 2019–2020 2020–2021 2021–2022 2022–2023 Amer. Asian Hispanic White 2 or More FARMS ESOL
Richard Montgomery Cluster ES #5
Maximum Number of Seats = 602 0
No Change:
New
School
Opens
Number of Students 0 0 0 0 0
Percent of Building Occupied 0% 0% 0% 0% 0%
Available Seats 602 602 602 602 602
Richard Montgomery Cluster ES #5
attending area is comprised of RP2,
RP6, B2, B3, B7, and T2
With Change:
Number of Students 495 506 513 504 515
Percent of Building Occupied 82% 84% 85% 84% 86% 11.1% 29.0% 34.0% 21.5% < 5% 43.5% 31.7%
Available Seats 107 96 89 98 87

33
Option 3
2016–2017
Projected Number of Students Race/Ethnic Composition
Boundary
Implement
ed % Afr. % % % % % %
2017–2018 2018–2019 2019–2020 2020–2021 2021–2022 2022–2023 Amer. Asian Hispanic White 2 or More FARMS ESOL
Ritchie Park Elementary SchoolMaximum Number of Seats= 387
No Change:
Number of Students 506 514 501 490 503 501
Percent of Building Occupied 131% 133% 129% 127% 130% 129% 12.6% 22.2% 18.1% 41.1% 5.9% 23.0% 11.3%
Available Seats (119) (127) (114) (103) (116) (114)
Reassign zones RP2 and RP6 to
Richard Montgomery Cluster ES #5.
With Change:
Number of Students 506 373 379 375 379 379
Percent of Building Occupied 131% 96% 98% 97% 98% 98% 10.5% 19.6% 12.3% 50.5% 7.1% 11.9% 6.9%
Available Seats (119) 14 8 12 8 8

34
Option 3
2016–2017
Projected Number of Students Race/Ethnic Composition
Boundary
Implement
ed % Afr. % % % % % %
2017–2018 2018–2019 2019–2020 2020–2021 2021–2022 2022–2023 Amer. Asian Hispanic White 2 or More FARMS ESOL
Twinbrook Elementary SchoolMaximum Number of Seats= 553 0
No Change:
Number of Students 575 593 587 599 596 581
Percent of Building Occupied 104% 107% 106% 108% 108% 105% 10.7% 13.5% 61.0% 11.4% < 5% 68.7% 50.1%
Available Seats (22) (40) (34) (46) (43) (28)
Zone T2 is reassigned to Richard
Montgomery Cluster ES #5 and
Chinese Immersion is assigned to
Twinbrook ES.
With Change:
Number of Students 575 592 590 593 592 604
Percent of Building Occupied 104% 107% 107% 107% 107% 109% 11.7% 18.5% 47.5% 17.3% 5.1% 46.0% 32.3%
Available Seats (22) (39) (37) (40) (39) (51)
35
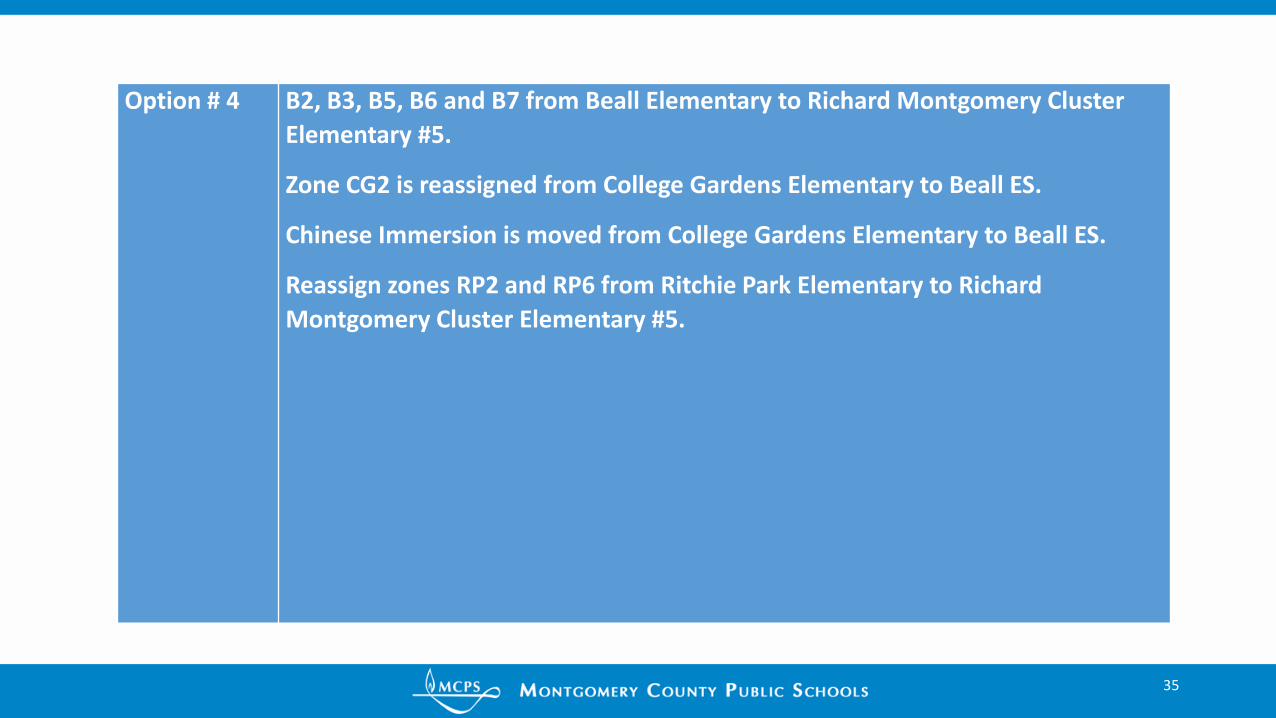
Option # 4 B2, B3, B5, B6 and B7 from Beall Elementary to Richard Montgomery Cluster
Elementary #5.
Zone CG2 is reassigned from College Gardens Elementary to Beall ES.
Chinese Immersion is moved from College Gardens Elementary to Beall ES.
Reassign zones RP2 and RP6 from Ritchie Park Elementary to Richard
Montgomery Cluster Elementary #5.

36
• B2, B3, B5, B6 and B7 from BeallElementary to Richard Montgomery Cluster Elementary #5.
• Zone CG2 is reassigned from College Gardens Elementary to Beall ES.
• Chinese Immersion is moved from College Gardens Elementary to Beall ES.
• Reassign zones RP2 and RP6 from Ritchie Park Elementary to Richard Montgomery Cluster Elementary #5.

37
Option 4
2016–2017
Projected Number of Students Race/Ethnic Composition
Boundary
Implement
ed % Afr. % % % % % %
2017–2018 2018–2019 2019–2020 2020–2021 2021–2022 2022–2023 Amer. Asian Hispanic White 2 or More FARMS ESOL
Beall Elementary SchoolMaximum Number of Seats = 638 0
No Change:
Number of Students 813 849 855 865 872 871
Percent of Building Occupied 127% 133% 134% 136% 137% 137% 12.1% 24.1% 22.0% 35.4% 6.4% 25.0% 15.4%
Available Seats (175) (211) (217) (227) (234) (233)
Reassign zones B2, B3, B5, B6, and B7
to Richard Montgomery Cluster ES #5.
Zone CG2 is received from College
Gardens ES. Chinese Immersion is
assigned to Beall ES.
With Change:
Number of Students 813 594 593 583 587 601
Percent of Building Occupied 127% 93% 93% 91% 92% 94% 15.4% 21.8% 17.1% 35.6% 10.0% 24.2% 13.4%
Available Seats (175) 44 45 55 51 37
38
Option 4
2016–2017
Projected Number of Students Race/Ethnic Composition
Boundary
Implement
ed % Afr. % % % % % %
2017–2018 2018–2019 2019–2020 2020–2021 2021–2022 2022–2023 Amer. Asian Hispanic White 2 or More FARMS ESOL
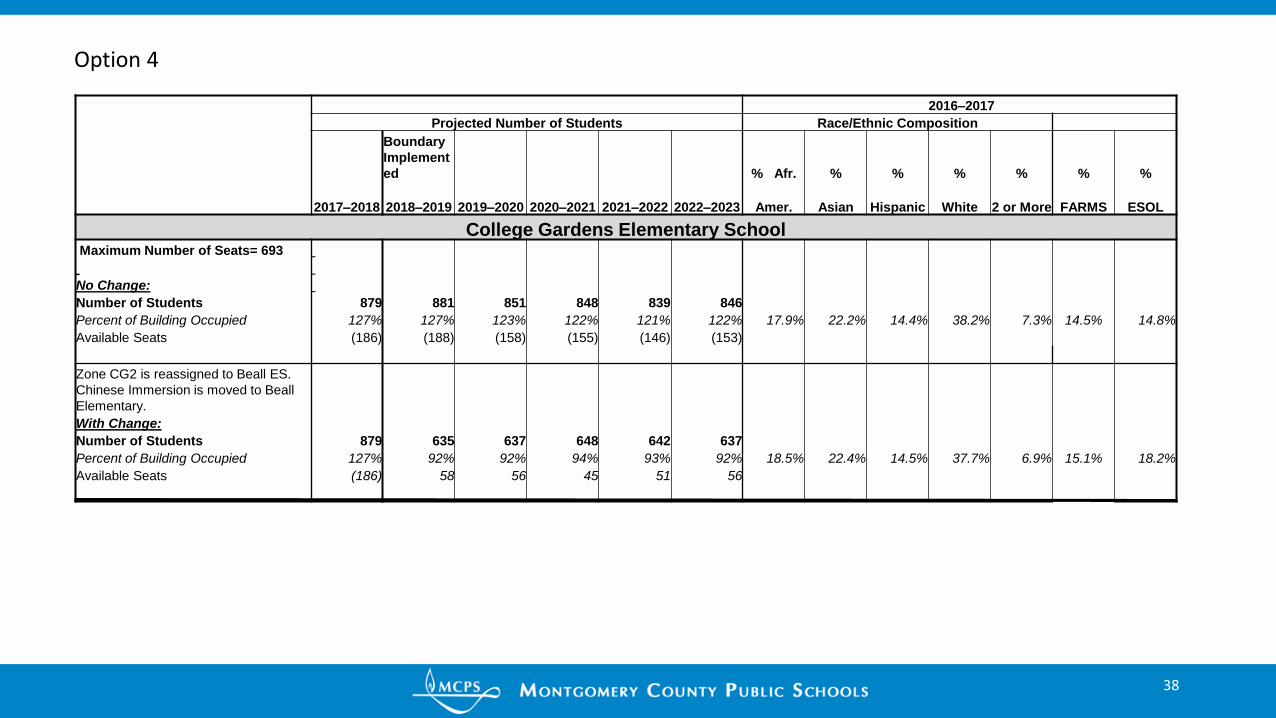
College Gardens Elementary SchoolMaximum Number of Seats= 693
No Change:
Number of Students 879 881 851 848 839 846
Percent of Building Occupied 127% 127% 123% 122% 121% 122% 17.9% 22.2% 14.4% 38.2% 7.3% 14.5% 14.8%
Available Seats (186) (188) (158) (155) (146) (153)
Zone CG2 is reassigned to Beall ES.
Chinese Immersion is moved to Beall
Elementary.
With Change:
Number of Students 879 635 637 648 642 637
Percent of Building Occupied 127% 92% 92% 94% 93% 92% 18.5% 22.4% 14.5% 37.7% 6.9% 15.1% 18.2%
Available Seats (186) 58 56 45 51 56

39
Option 4
2016–2017
Projected Number of Students Race/Ethnic Composition
Boundary
Implement
ed % Afr. % % % % % %
2017–2018 2018–2019 2019–2020 2020–2021 2021–2022 2022–2023 Amer. Asian Hispanic White 2 or More FARMS ESOL
Richard Montgomery Cluster ES #5
Maximum Number of Seats = 602 0
No Change:
New
School
Opens
Number of Students 0 0 0 0 0
Percent of Building Occupied 0% 0% 0% 0% 0%
Available Seats 602 602 602 602 602
Richard Montgomery Cluster ES #5
attending area is comprised of RP2,
RP6, B2, B3, B5, B6, B7
With Change:
Number of Students 594 620 640 641 668
Percent of Building Occupied 99% 103% 106% 106% 111% 10.3% 30.3% 23.4% 31.2% 5.0% 27.1% 20.2%
Available Seats 8 (18) (38) (39) (66)

40
Option 4
2016–2017
Projected Number of Students Race/Ethnic Composition
Boundary
Implement
ed % Afr. % % % % % %
2017–2018 2018–2019 2019–2020 2020–2021 2021–2022 2022–2023 Amer. Asian Hispanic White 2 or More FARMS ESOL
Ritchie Park Elementary SchoolMaximum Number of Seats= 387
No Change:
Number of Students 506 514 501 490 503 501
Percent of Building Occupied 131% 133% 129% 127% 130% 129% 12.6% 22.2% 18.1% 41.1% 5.9% 23.0% 11.3%
Available Seats (119) (127) (114) (103) (116) (114)
Reassign zones RP2 and RP6 to
Richard Montgomery Cluster ES #5.
With Change:
Number of Students 506 373 379 375 379 379
Percent of Building Occupied 131% 96% 98% 97% 98% 98% 10.5% 19.6% 12.3% 50.5% 7.1% 11.9% 6.9%
Available Seats (119) 14 8 12 8 8

41
Option 4
2016–2017
Projected Number of Students Race/Ethnic Composition
Boundary
Implement
ed % Afr. % % % % % %
2017–2018 2018–2019 2019–2020 2020–2021 2021–2022 2022–2023 Amer. Asian Hispanic White 2 or More FARMS ESOL
Twinbrook Elementary SchoolMaximum Number of Seats= 553
No Change:
Number of Students 575 593 587 599 596 581
Percent of Building Occupied 104% 107% 106% 108% 108% 105% 10.7% 13.5% 61.0% 11.4% < 5% 68.7% 50.1%
Available Seats (22) (40) (34) (46) (43) (28)
No Boundary Change
With Change:
Number of Students 575 593 587 599 596 581
Percent of Building Occupied 104% 107% 106% 108% 108% 105% 10.7% 13.5% 61.0% 11.4% < 5% 68.7% 50.1%
Available Seats (22) (40) (34) (46) (43) (28)

Cluster Demographics
42

Review of Options 1-4
43

Next Steps
44

Questions?
- Committee questions- Observer questions
45

Committee Schedule All meetings will be held from 7:00 p.m. to 9:00 p.m. at College Gardens ES
Feb 28 First Community-wide meeting to present process and timeline
1 Mar 15 Committee charge, overview of process, timeline, review of zones to build
options, development of criteria to evaluate options
2 Mar 23 Staff presents first set of options
3 Apr 5 Feedback on first set of options
4 Apr 25 If needed, staff presents a second set of options.
5 May 3 Feedback on second set of options and draft committee report.
May 9 Second Community-wide meeting to present options and get feedback.
6 May 17 Committee members submit option evaluations and schools submit positionpapers
www.montgomeryschoolsmd.org/departments/planning/rmes.aspx
46

Thank you for attending.Please complete a feedback form.
All materials will be posted on the following website:
www.montgomeryschoolsmd.org/departments/planning/rmes.aspx
47