Richard Lieberman Chief Data Scientist Mile High ... · Mile High Healthcare Analytics 2016 Quality...
49
Copyright © 2015 Oracle and/or its affiliates. All rights reserved. | Richard Lieberman Chief Data Scientist Mile High Healthcare Analytics 2016 Quality Improvement Trends Free Webinar Series: January 7, 2016
-
Upload
duongtuyen -
Category
Documents
-
view
214 -
download
0
Transcript of Richard Lieberman Chief Data Scientist Mile High ... · Mile High Healthcare Analytics 2016 Quality...

Copyright © 2015 Oracle and/or its affiliates. All rights reserved. |
Richard Lieberman
Chief Data Scientist
Mile High Healthcare Analytics
2016 Quality Improvement Trends
Free Webinar Series: January 7, 2016
TODAY’S AGENDA
• 30 Days in 30 Seconds
• Industry Performance Overview
• How are plans handling Star ratings
• Changes to selected measures
• Quality measurement in Medicaid and on the Exchanges

RELEVANT BIO FOR RICHARD LIEBERMAN
• One of the nation's leading experts on financial modeling and risk adjustment in the managed
care industry
• Combines unique expertise in provider profiling, risk adjustment, case-mix measurement, and
provider reimbursement strategies
• Developer of integrated decision-support platforms coalescing quality measurement, risk
adjustment, and utilization reporting
• Actively involved in the development of risk adjustment systems for over 20 years
– Johns Hopkins ACG Development Team, 1991-2005
– Designed the risk-adjusted payment system for Maryland Medicaid
• 3
“30 DAYS IN 30 SECONDS”
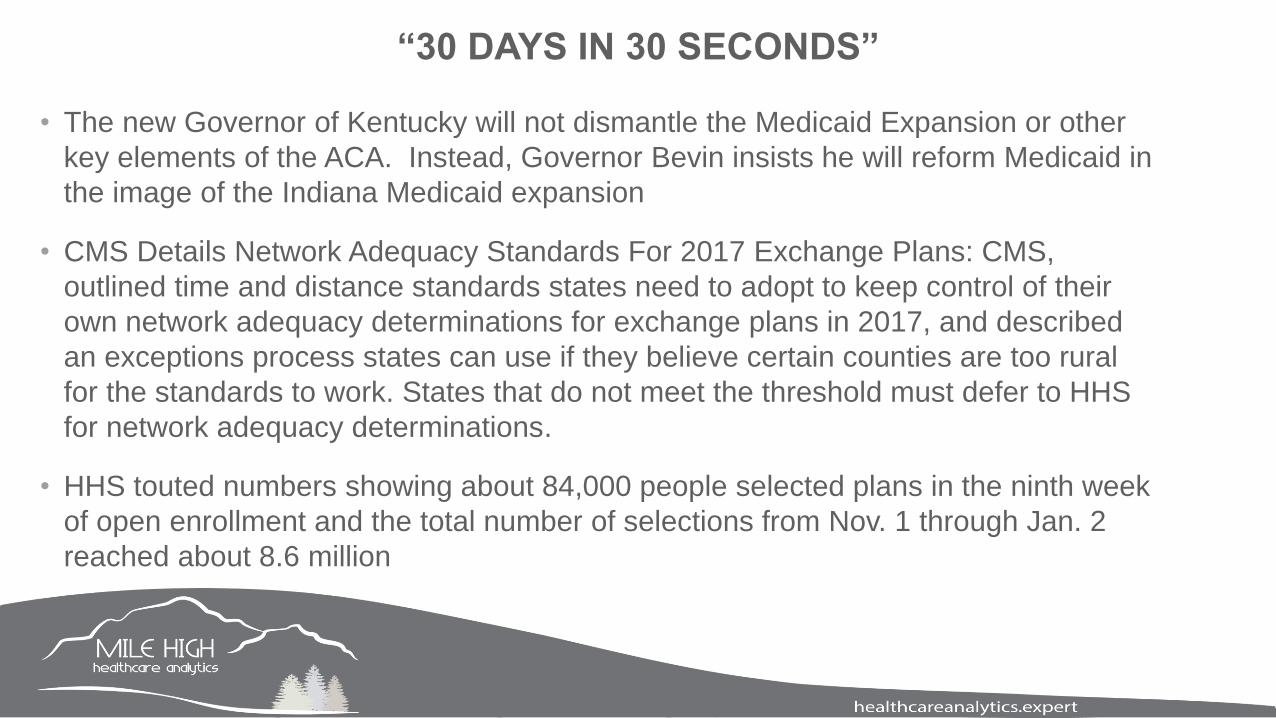
• The new Governor of Kentucky will not dismantle the Medicaid Expansion or other
key elements of the ACA. Instead, Governor Bevin insists he will reform Medicaid in
the image of the Indiana Medicaid expansion
• CMS Details Network Adequacy Standards For 2017 Exchange Plans: CMS,
outlined time and distance standards states need to adopt to keep control of their
own network adequacy determinations for exchange plans in 2017, and described
an exceptions process states can use if they believe certain counties are too rural
for the standards to work. States that do not meet the threshold must defer to HHS
for network adequacy determinations.
• HHS touted numbers showing about 84,000 people selected plans in the ninth week
of open enrollment and the total number of selections from Nov. 1 through Jan. 2
reached about 8.6 million

“30 DAYS IN 30 SECONDS”
• CMS has released an RFI describing its initial proposal for Medicare-Advantage
RACs!
• The White House Office of Management and Budget entered 2016 with 10 CMS
rules and notices under its review, ranging from Medicaid home health face-to-face
requirements to revised benchmarking methodology for Accountable Care
Organizations.
• The past year was an active one for Medicaid expansion, with both Montana and
Michigan expanding their programs in the last few months and joining 29 other
states that have already done so. Alaska has had 7,700 people enroll in its Medicaid
expansion program that started on September 1st.

“30 DAYS IN 30 SECONDS”
• CMS finalized its proposal to relax the two-midnight hospital admissions policy and
recognize some hospital stays shorter than two-midnights as legitimate inpatient
stays
• CMS is lowering Medicare physician pay rates next year, instead of paying doctors a
0.5 percent pay increase as called for in the law that replaced the Sustainable
Growth Rate formula
• Quiet bipartisanship continues in Congress- changes are being made to the ACA,
even by avowed opponents of the ACA
• Will the gubernatorial election in Kentucky this week mean that people will have
health care benefits taken away from them?

THE FINANCIAL STATUS OF THE INDUSTRY
• Based on a (2015) report from MedPAC (derived from plan
BPT submissions), MA plans in 2012 had a margin of 4.9
percent.
• About 91 percent of enrollment was in companies reporting
a positive margin.
– Employer group plans had higher margins than plans for
individual Medicare beneficiaries
– For-profit plans had higher margins than nonprofit plans
– Special needs plans (SNPs) had higher margins than non-SNP
plans, except that nonprofit SNP plans reported a slight
negative margin.
7
Source: Medicare Payment Advisory Commission. Report to Congress: Medicare Payment Policy. March 2015.

THE ACA IS IMPACTING THE COST-EFFECTIVENESS OF MA
• MedPAC estimates that 2015 MA benchmarks (including quality bonuses):
– Benchmarks will average 107 percent of fee-for-service (FFS)
– Bids will average 94 percent of FFS
– Payments to MA Plans will be at 102 percent of FFS spending
8

THE STICKINESS OF MEMBER ENROLLMENT
• CMS data show that in 2012, about 10 percent of
beneficiaries voluntarily changed their MA plan
– Of that number, 80 percent chose another MA plan
– The remaining 20 percent went to FFS Medicare
• Only 2 percent of MA enrollees left MA for FFS
• Among the switchers who faced changes in plan premiums,
the large majority switched to a plan with a lower premium
9
Source: Medicare Payment Advisory Commission. Report to Congress: Medicare Payment Policy. March 2015.

SPECIAL NEEDS PLANS CONTINUE TO GROW
• Between January 2015 and December 2015 (not
including results from 2016 AEP), SNP plans grew
by 7.8 percent
– Currently (December 2015) there are 2.15 million MA
members in SNPs, up from 1.99 million in January
2015
– We do not have 2016 AEP results available to us yet
10

STARS PERFORMANCE MEASUREMENT CONTINUES TO EVOLVE
• The number of measures comprising Stars continues to fall
– There are now 47 measures
– All of the dropped measures have been 1x-weighted, accentuating the
role of the 3x-weighted measures on the overall Star-rating
– Expect to see some promotions from “AAA” (aka the Display
Measures)
• While the bonuses for achieving 4-Stars in Medicare-Advantage
are substantial, no other line of business will incorporate financial
incentives
– Commercial and Medicaid are adopting a public reporting paradigm
– Plans will compete on quality in exchange for recognition and
presumably market share

QUALITY MEASUREMENT CONTINUES TO EVOLVE
• There is a shift toward composite measures
– The “improvement score” now has the highest weight (5.0)
• Drive toward higher performance
– Elimination of fixed 4-star thresholds
• CMS will be harmonizing measure sets across sites and providers
– There will be roughly a 50 percent overlap between Medicare-
Advantage and commercial
– Medicaid is following commercial’s lead
STABILITY/INSTABILITY OF STAR RATINGS OVER TIME
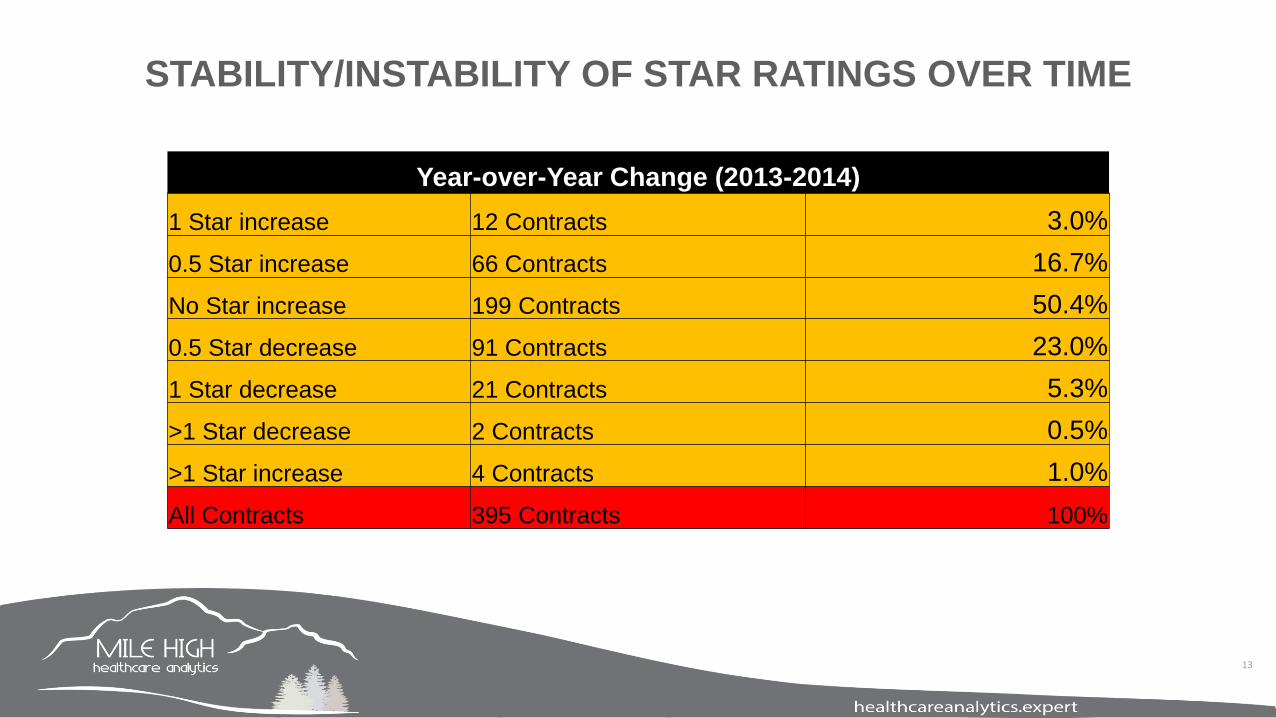
Year-over-Year Change (2013-2014)
1 Star increase 12 Contracts 3.0%
0.5 Star increase 66 Contracts 16.7%
No Star increase 199 Contracts 50.4%
0.5 Star decrease 91 Contracts 23.0%
1 Star decrease 21 Contracts 5.3%
>1 Star decrease 2 Contracts 0.5%
>1 Star increase 4 Contracts 1.0%
All Contracts 395 Contracts 100%
13

PERFORMANCE IMPROVEMENT: DO NOT REST ON YOUR LAURELS
14
• Among the contracts that were below 4-stars last
year (2014), 53 of them increased to at least 4-stars
this year
• But….. 32 contracts that were at or above 4-stars
last year, dropped below the 4-star threshold this
year
• The financial implications of being below 4-stars are
tremendous

NO FAIR! CMS KEEPS MOVING THE CHEESE!
• CMS has eliminated all of the fixed 4-star cut
points
– In reality, most of the measures no longer had a
fixed 4-star cut point
– CMS’ research indicates that quality improves faster
in the absence of the fixed cut points
• It’s never as bad as it seems:
– 4-Star threshold for Statin Use went from 76-83% in
2014 to 73-79% in 2015
– 5-Star threshold decreased from 83% to 79%
compliance
INDUSTRY-WIDE PERFORMANCE ON HEDIS MEASURESMeasure Name Compliance
Rate
Percent
Change
2014 2013
Osteoporosis Management in Women who had a
Fracture
35% 27% 8%
Care for Older Adults – Functional Status
Assessment
75% 70% 5%
Controlling Blood Pressure 70% 65% 5%
Care for Older Adults – Pain Assessment 86% 82% 4%
Colorectal Cancer Screening 67% 64% 3%
Adult BMI Assessment 92% 89% 3%
Care for Older Adults – Medication Review 85% 83% 2%
Diabetes Care – Kidney Disease Monitoring 92% 91% 1%
Diabetes Care – Eye Exam 69% 69% 0%
Rheumatoid Arthritis Management 78% 78% 0%
Plan All-Cause Readmissions 10% 10% 0%
Annual Flu Vaccine 72% 73% -1%
Diabetes Care – Blood Sugar Controlled 75% 76% -1%
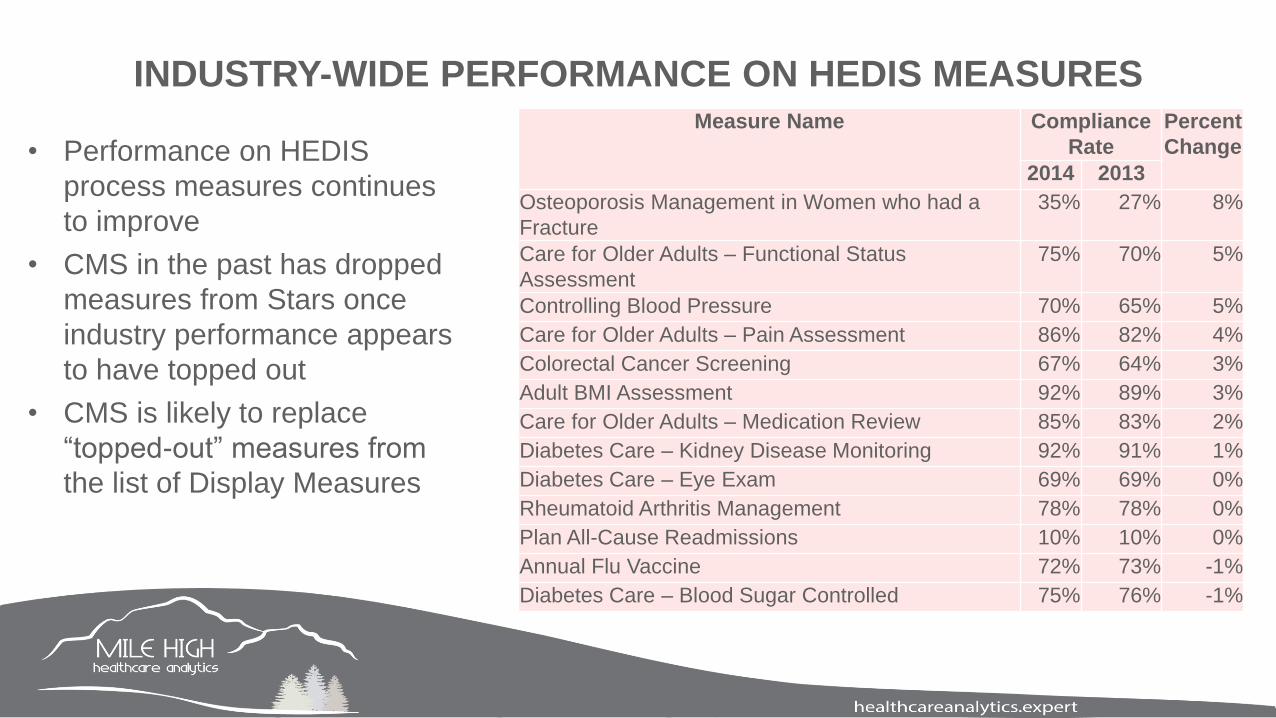
• Performance on HEDIS
process measures continues
to improve
• CMS in the past has dropped
measures from Stars once
industry performance appears
to have topped out
• CMS is likely to replace
“topped-out” measures from
the list of Display Measures

INDUSTRY-WIDE PERFORMANCE ON MEDICATION USE MEASURES
Measure Name Compliance
Rate
Percent
Change
2014 2013
High Risk Medication 7% 11% 4%
Medication Adherence for Hypertension (RAS
(RAS antagonists)
79% 78% 1%
Medication Adherence for Cholesterol (Statins) 75% 74% 1%
Medication Adherence for Diabetes
Medications
77% 77% 0%
• Much different results for the
medication use measures
• High-risk medication use is
improving nationwide
• Other measures are barely
changing
• Have they topped out?
• Impact of guideline
change on the use of
statins

NEW AHA/ACC GUIDELINES ON STATIN USE
• Historically, the clinical objective for patients with high
serum cholesterol was to reduce LDL-C to < 100 mg/dL
• In 2013, the ACC/AHA changed the standard to focus on
treating everyone with a statin who met certain clinical
criteria
– “2013 ACC/AHA Guideline on the Treatment of Blood
Cholesterol to Reduce Atherosclerotic Cardiovascular Risk
in Adults: A Report of the American College of
Cardiology/American Heart Association Task Force on
Practice Guidelines”

WHO IS SUPPOSED TO GET A STATIN PRESCRIPTION NOW?
• Clinical ASCVD, including acute coronary syndromes, history of MI,
stable or unstable angina, coronary or other arterial revascularization,
stroke, TIA, or peripheral arterial disease presumed to be of
atherosclerotic origin
• Primary Prevention, LDL-C ≥190 mg/dL
• Patients with diabetes 40–75 years of age and LDL-C 70–189 mg/dL
• Patients without diabetes 40–75 years of age and LDL-C 70–189
mg/dL
– Estimate 10-y ASCVD risk using the Risk Calculator
• ≥7.5% 10-y ASCVD risk: Moderate- or high-intensity statin
• 5 to <7.5% 10-y ASCVD risk: Consider moderate-intensity statin
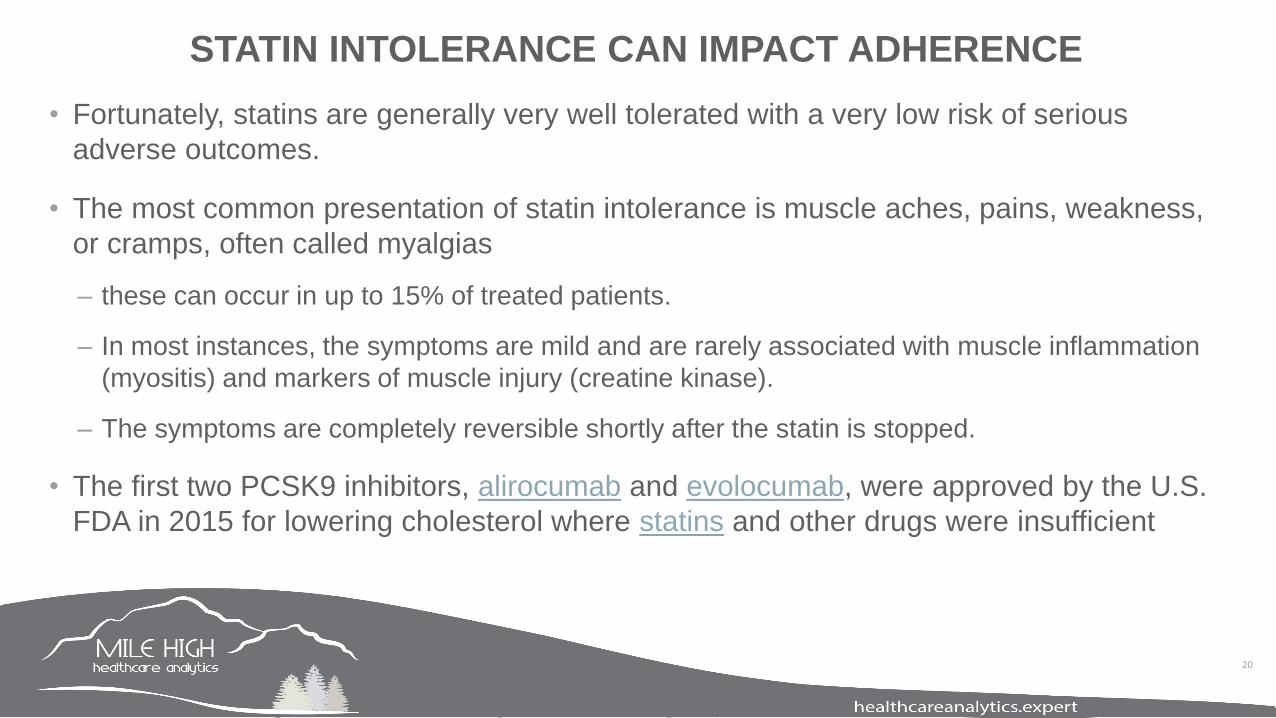
STATIN INTOLERANCE CAN IMPACT ADHERENCE
• Fortunately, statins are generally very well tolerated with a very low risk of serious
adverse outcomes.
• The most common presentation of statin intolerance is muscle aches, pains, weakness,
or cramps, often called myalgias
– these can occur in up to 15% of treated patients.
– In most instances, the symptoms are mild and are rarely associated with muscle inflammation
(myositis) and markers of muscle injury (creatine kinase).
– The symptoms are completely reversible shortly after the statin is stopped.
• The first two PCSK9 inhibitors, alirocumab and evolocumab, were approved by the U.S.
FDA in 2015 for lowering cholesterol where statins and other drugs were insufficient
20

LIKELY GOOD NEWS FOR 2017
• The High Risk Medication (HRM) measure
will be removed from Star ratings
• Conceptually, an HRM measure is a good
idea. But in practice, many of the
prescription drugs on the list were not
intended to be avoided in all instances
– Elavil (Amitriptyline) is indicated for use in the
elderly in small doses
• CMS has proposed removing the HRM
measure for 2017
21

IMPACT OF NEW AHA/ACC GUIDELINES ON QUALITY MEASUREMENT
• NCQA has retired all measures that required achievement of a numerical threshold
for LDL-C
– Cholesterol Management for Patients With Cardiovascular Conditions (CMC)
– Comprehensive Diabetes Care: NCQA removed two indicators of quality from this
measure: LDL-C Screening, LDL-C Control (<100 mg/dL)
• These aforementioned three measures were all single-weighted (1x) Star-rating
measures
• As CMS continues to drop the low-weighted (1x) measures, the triple-
weighted measures have a greater impact on overall Star ratings

IMPACT OF NEW AHA/ACC GUIDELINES ON A KEY PART D MEASURE
• The Part D measure, Medication Adherence for Cholesterol (Statins) is even more
important
– Percent of plan members with a prescription for a cholesterol medication who fill their prescription
often enough to cover 80% or more of the time they are supposed to be taking the medication
• Overall performance by MA Plans improved from 2013 to 2014:
– 2013 Statin compliance: 74% (3.3 Stars)
– 2014 Statin compliance: 75% (4.0 Stars)

MEMBER EXPERIENCE COMPONENTS OF STARS (PART C)
• C20 – Getting Needed Care
• C21 - Getting Appointments and Care Quickly
• C22 - Customer Service
• C23 - Rating of Health Care Quality
• C24 - Rating of Health Plan
• C25 - Care Coordination
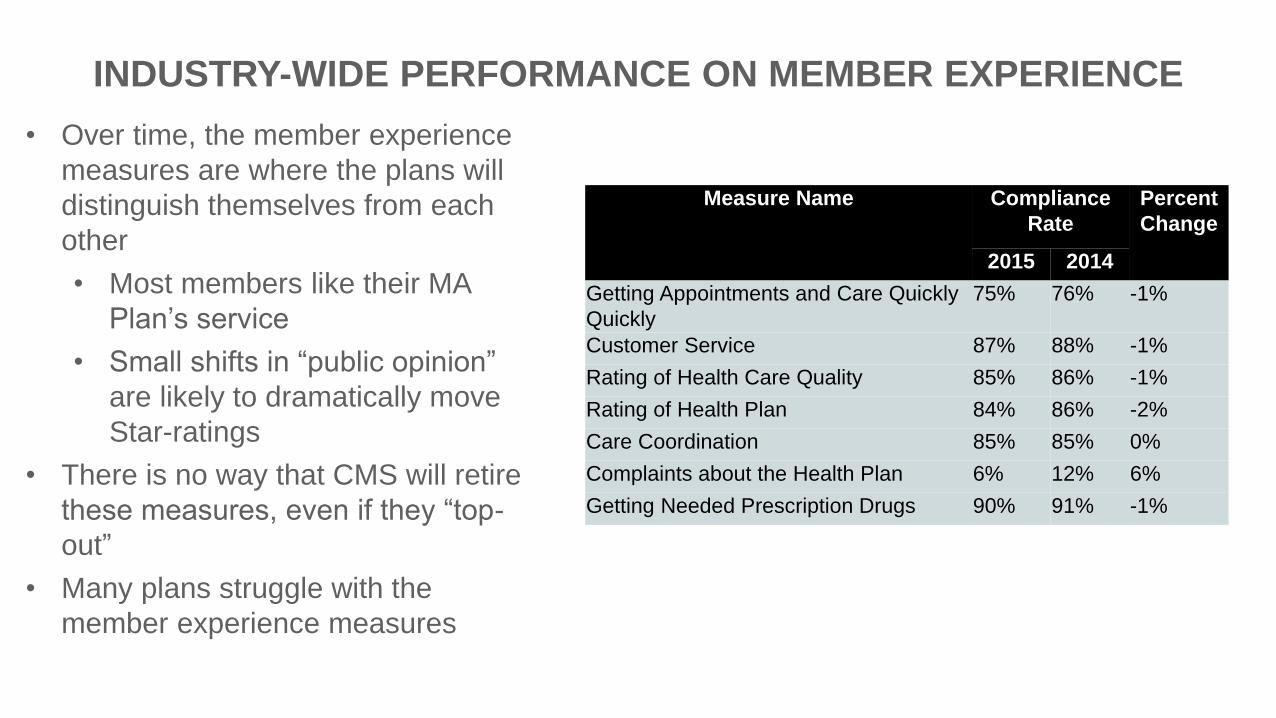
INDUSTRY-WIDE PERFORMANCE ON MEMBER EXPERIENCE
Measure Name Compliance
Rate
Percent
Change
2015 2014
Getting Appointments and Care Quickly
Quickly
75% 76% -1%
Customer Service 87% 88% -1%
Rating of Health Care Quality 85% 86% -1%
Rating of Health Plan 84% 86% -2%
Care Coordination 85% 85% 0%
Complaints about the Health Plan 6% 12% 6%
Getting Needed Prescription Drugs 90% 91% -1%
• Over time, the member experience
measures are where the plans will
distinguish themselves from each
other
• Most members like their MA
Plan’s service
• Small shifts in “public opinion”
are likely to dramatically move
Star-ratings
• There is no way that CMS will retire
these measures, even if they “top-
out”
• Many plans struggle with the
member experience measures

A HOT TOPIC: THE IMPACT OF SOCIO-ECONOMIC VARIATION
• Multiple Medicare Advantage (MA) organizations and
Prescription Drug Plan (PDP) sponsors believe that
enrollment of a high percentage of dual eligible (DE)
enrollees and/or enrollees who receive a low income
subsidy (LIS) disadvantages their plan’s ability to
achieve high MA or Part D Star Ratings
• CMS has been trying to provide the scientific evidence
as to whether MA or Part D sponsors that enroll a
disproportionate number of vulnerable beneficiaries
are systematically disadvantaged by the Star Ratings
26

WHERE THE NATIONAL QUALITY FORUM OPINION LIES
• The National Quality Forum (NQF) recommends assessing performance measures to
determine if they should be adjusted for socio-demographic factors, including socio-
economic status (SES), particularly when used for accountability and payment
applications.
– Medicare Consumer Assessment of Healthcare Providers and Systems (CAHPS) and Health
Outcomes Survey (HOS) are already adjusted for SES characteristics of patients, including
education, LIS, DE, and health status.
27

EVIDENCE OF STAR RATING ISSUES FOR DUALS
• The research to-date has provided scientific evidence that there exists an
LIS/Dual/Disability effect for a small subset of the Star Ratings measures. The size of
the effect is small in most cases and not consistently negative.
• CMS is exploring two options for possible interim analytical adjustments to address the
LIS/DE/disability effect revealed in our research:
– Categorical Adjustment Index (CAI)
– Indirect Standardization (IS)
28

• Adult BMI Assessment
• Rheumatoid Arthritis Management
• Breast Cancer Screening
• Controlling Blood Pressure
• Diabetes Care – Blood Sugar Controlled
• Diabetes Care – Eye Exam
• Diabetes Care – Kidney Disease Monitoring
• Colorectal Cancer Screening
• Osteoporosis Management in Women who had a Fracture
• Plan All-Cause Readmissions
• Annual Flu Vaccine
• Monitoring Physical Activity
• Reducing the Risk of Falling
• Medication Adherence for Diabetes Medications
• Medication Adherence for Hypertension
• Medication Adherence for Cholesterol.
29
16 CANDIDATE MEASURES FOR POTENTIAL ADJUSTMENT

THE STATE OF MEDICAID MANAGED CARE
• There are currently 275 Medicaid Managed Care Organizations (MCOs) in the United
States
• As of March 2015, 39 states had Medicaid contracts with comprehensive MCOs
• Tracking enrollment in Medicaid managed care is complicated because we are reliant
on public reporting by states
30

EVOLUTION OF QUALITY MEASUREMENT PARADIGM
• Quality measurement for government-regulated health plans and issuers began with
Medicare-Advantage Stars
– Significant bonus payments (5 percent premium increase) to encourage plans to invest
– Public reporting limited to beneficiary website used during open enrollment
– Demonstration program in first three years that gave bonus to > 90 percent of plans
• Quality measurement in the Marketplaces
– No payments for quality measurement or improvement
– Quality measurement is a requirement of participation
– Significant public reporting requirement
31

ELEMENTS OF THE MEDICAID MANAGED CARE QUALITY PARADIGM
• Transparency
– Public reporting on information of quality of care
• On State Medicaid websites
– Common set of measures, aligned with Medicare-Advantage and Marketplace
• Alignment with other systems of care
– Aligning, where appropriate, quality standards for Medicaid managed care with that of MA and the
Marketplace would result in a simplified and integrated approach to quality measurement and
improvement
• Consumer and Stakeholder Engagement
– Useful tool is consumer participation in the development of state strategies for improving care and
quality of life
32

CMS’ ROLE IN MEDICAID QUALITY IMPROVEMENT
• The Center for Medicaid and CHIP Services partners with states to share best practices
and provide technical assistance to improve the quality of care.
• CMS’s efforts are guided by the overarching aims of the CMS Quality Strategy: better
health, better care, lower cost through improvement.
• The CMS Quality Strategy is built on the foundation of the CMS Strategy and the HHS
National Quality Strategy.
• Working with states and other partners to eliminate disparities and improve patient
safety are key aspects of achieving these aims.
33

THE PROPOSED MEDICAID “MEGA-RULE”
• On May 26, 2015, CMS issued the first regulatory changes to Medicaid managed care
in 13 years
• The proposed rule seeks to:
– Support states’ efforts to encourage delivery system reform initiatives within managed care
programs that aim to improve health care outcomes and beneficiary experience while
controlling costs; and
– Strengthen the quality of care provided to beneficiaries by strengthening transparency
and measurement, establishing a quality rating system, and broadening state quality
strategies and consumer and stakeholder engagement;
– Improving consumer experience in the areas of enrollment, communications, care
coordination, and the availability and accessibility of covered services
• We expect the rule to be finalized in the Spring of 2016
34
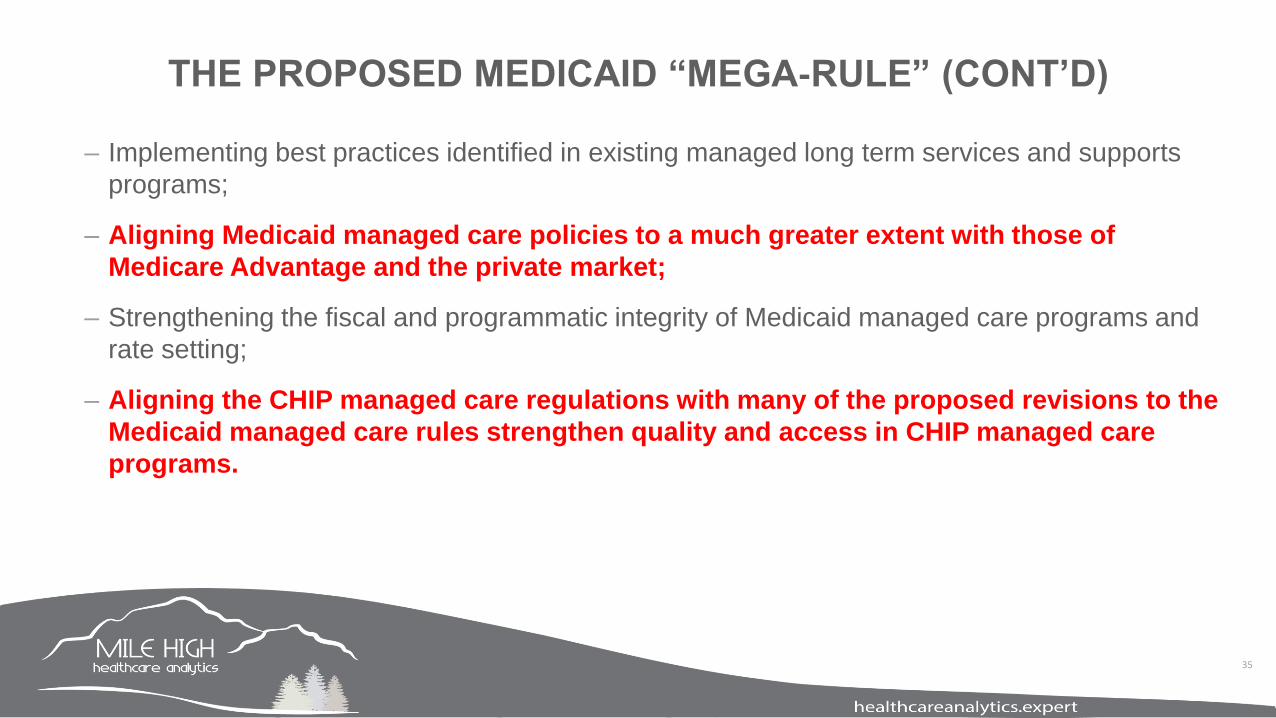
THE PROPOSED MEDICAID “MEGA-RULE” (CONT’D)
– Implementing best practices identified in existing managed long term services and supports
programs;
– Aligning Medicaid managed care policies to a much greater extent with those of
Medicare Advantage and the private market;
– Strengthening the fiscal and programmatic integrity of Medicaid managed care programs and
rate setting;
– Aligning the CHIP managed care regulations with many of the proposed revisions to the
Medicaid managed care rules strengthen quality and access in CHIP managed care
programs.
35

QUALITY IMPROVEMENT REPORTING IS NOT SUFFICIENTLY ACTIONABLE
• Most plans and issuers have some variation on a quality measurement scorecards
– For the Stars measures, most entities can tabulate and report on members eligible
(denominators), members compliant (numerators), and compliance rates
• Oftentimes, too many measures are reported, but only Star-rating measures
– Quality scorecards should be limited to the measures that need the provider’s focus
– Dynamic scorecards– the measure composition varies by provider, based on compliance
status
• Now that CMS has eliminated the fixed 4-Star cut points, Star rating thresholds will float
from year-to-year
– It is harder to hold providers or plans accountable for Star-rating improvements if the cut points
can change somewhat arbitrarily
36

MEASURES COMMON TO COMMERCIAL AND MEDICAID
Measure ProgramAdolescent Well-Care Visits QRS and Medicaid
Adult BMI Assessment QRS, MA-Stars, and Medicaid
Annual Monitoring for Patients on Persistent MedicationsQRS, MA-Stars, and Medicaid
Antidepressant Medication Management QRS, MA-Stars, and Medicaid
Breast Cancer Screening QRS, MA-Stars, and Medicaid
Cervical Cancer Screening . QRS, MA-Stars, and Medicaid
Childhood Immunization Status QRS and Medicaid
Chlamydia Screening in Women QRS and Medicaid
Controlling High Blood Pressure QRS, MA-Stars, and Medicaid
Diabetes Care: Hemoglobin A1c (HbA1c) Control QRS, MA-Stars, and Medicaid
Diabetes Care: Hemoglobin A1c Testing Medicaid Only
Follow-Up Care for Children Prescribed ADHD
MedicationQRS and Medicaid
Follow-Up After Hospitalization for Mental Illness: 7 daysQRS, MA-Stars, and Medicaid
37

MEASURES COMMON TO COMMERCIAL AND MEDICAID (CONT’D)
Measure ProgramHPV Vaccination for Female Adolescents QRS and Medicaid
Immunizations for Adolescents QRS and Medicaid
Medication Management for People With Asthma QRS and Medicaid
Plan All-Cause Readmissions QRS, MA-Stars, and Medicaid
Prenatal and Postpartum Care: Postpartum Care QRS and Medicaid
Prenatal and Postpartum Care: Timeliness of Prenatal Care QRS and Medicaid
Weight Assessment and Counseling for Nutrition and Physical
Physical Activity for Children and AdolescentsQRS and Medicaid
Well-Child Visits in the Third, Fourth, Fifth, and Sixth Years of LifeQRS and Medicaid
38

SELECTED MEASURES SPECIFIC TO COMMERCIAL
Measure ProgramColorectal Cancer Screening QRS and MA-Stars
Diabetes Care: Eye Exam (Retinal) Performed QRS and MA-Stars
Annual Dental Visit QRS only
Appropriate Testing for Children With Pharyngitis QRS only
Avoidance of Antibiotic Treatment in Adults with Acute Bronchitis
Bronchitis QRS only
Relative Resource Use for People with Cardiovascular Conditions
ConditionsQRS only
Relative Resource Use for People with Diabetes—Inpatient Facility
FacilityQRS only
Use of Imaging Studies for Low Back Pain QRS only
Adults’ Access to Preventive and Ambulatory Health Services QRS and MA-Display
39

COMMON DEFICIENCIES IN QUALITY REPORTING
• Most reporting shows “year-to-date” measurement, e.g., how many members are
compliant as of the date the report was generated
– Some reports also show the compliance rate for the last year
– Beware of specification changes that can make year-over-year comparisons difficult to
interpret
• In recent years, Breast Cancer Screening and Osteoporosis Management populations have been
redefined
– Prior year data should be run against current year NCQA specifications
• But there are more useful metrics to report:
– Compliance rates for the same time interval, but one year earlier
• This captures the temporal nature of compliance– some measures are more likely to “close” at
different times of the year
40

QISim OverviewPowerful Tool for Strategic Planning

QISim: SCENARIOS REVIEW
• Flexible Grids: user can work with up to 4
different scenarios easily comparing them.
Columns can be easily added as a copy of
previous one and removed
• Save scenarios: Any changes in scenarios are
stored immediately. This approach helps user to
concentrate on data, without distractions. After
playing with numbers, user can review all the
versions, and save best ones
• Inline details: By clicking on row, user will get more
details that stand behind the scenes. This will help to
understand what efforts needed to get one more star
42

QISim : MEASURES
• Application provides set of features that help user to
manage a long list of measures, so you can quickly
find the important information
• Collapse groups: each group of measures can be
collapsed, but still have summary scores visible.
This helps to see the high-level view of the
scenarios
• Quick Filter: there are lots of important information
presented on screen, and sometimes it is difficult to
find some piece. This filter will help to figure out
• Emphasis: sometimes not all measures can be
improved at the moment. With checkboxes user can
emphasize those that have higher priority
43

QISim : SNAPSHOTS
• In addition to automatic saving of any
scenario, QISim provides the ability to
take a snapshot of the whole system state
• Checked rows
• Selected scenarios
44

POPULATING QISim
• MHHA has an NCQA-certified quality measures engine
that calculates compliance rates for all measures
– Can be run in real-time
• Static data can be also be used
– CMS-supplied HEDIS public use files
– NCQA’s Quality Compass data
• Users can also populate the application directly using
their own numerator and denominator counts
45

SO WHAT IS THE “NEXT GENERATION?”
• With regards to quality measurement, some skeptics may argue that absent
financial incentives that quality measurement will ramp up very slowly
• But quality measurement, along with risk adjustment and utilization measurement
are the key elements of the migration toward value-based payments
• The next generation is utilization reporting merged with multiple years of quality
profiling and multiple years of risk score profiles
• The key to achieving this kind of reporting is:
– good data governance
– Comprehensive ETL process
– Reporting across the silos, not within them
46

NEXT WEBINAR• Mile High Healthcare Analytics will continue our free
webinar series. We will continue to present key risk
adjustment and performance improvement topics to
health plans and provider groups.
• Our next three webinars will be held on:
– Thursday February 11, 2016: PARTICIPANT’S CHOICE!
– Thursday, March 3, 2016: the 45-Day Notice
– Thursday April 7, 2016: the Final Notice for MA Plans
• Please watch http://www.healthcareanalytics.expert/news-
and-events/free-webinar-series/ to learn about our
webinar topics

CONTACT INFORMATION
Richard Lieberman
720-446-7785 (voice)
www.healthcareanalytics.expert

THANK YOU FOR JOINING US!!
Our website continues to evolve. Please visit us
at:
www.healthcareanalytics.expert