Richard A. Becker Ph.D., DABT American Chemistry Council for Risk/Workshop/Becker_2010_12_SR… ·...
26
The Case For Both Individual And Population Toxicity Thresholds Richard A. Becker Ph.D., DABT American Chemistry Council December, 2010
Transcript of Richard A. Becker Ph.D., DABT American Chemistry Council for Risk/Workshop/Becker_2010_12_SR… ·...

The Case For Both Individual And Population Toxicity Thresholds
Richard A. Becker Ph.D., DABTAmerican Chemistry Council
December, 2010

Thresholds?The practical difficulty in establishing a “no‐effect” level for a particular compound using a manageable number of experimental animals and the more complex problem of extrapolating a safe level for humans must not be permitted to obscure the fact that thresholds do exist.” Rozman, Doull and Hayes in Handbook of Pesticide Toxicology
Agent Release
Exposure/ Contact
Transport/ Transformation
Entry & Distribution in
Body = “Dose”
Effect
Altered Structure/ Function
Adverse Health OutcomesMortality Morbidity
Exposure Monitoring Indicators
Health Outcome Indicators
Biomon –itoring
Indicators
No Health Effects
Dose Below Threshold or Homeostatic Response
Exposure/Effect Discontinuum

Toxicity Pathway“Exposure‐ Effect Discontinuum”
Toxicant Interaction with macromolecules
Cellular Responses Effects Organism Responses
Protein bindingDNA BindingReceptor Binding
Chemical Properties
Gene ExpressionProtein ProductionAltered Signaling
Dose Below Threshold No Adverse Outcomes
Higher Dose Elicits Homeostatic Response
No Adverse Outcome
Higher Dose Leads to Altered Physiology: Adaptive Response
No Adverse Outcomes
Higher Dose Leads to Altered Organ Structure / Function
No Adverse Outcomes
Adverse Health Outcome
Increasing Dose
Respon
se
Homeostasis
Adaptive Responses
Higher Dose Leads to Altered Organ Structure / Function
Response is Dependent on Dose: Not All Exposures Will Produce Adverse Effects
Toxicity Pathway

Exposure – Effect Discontinuum: Illustrated in Graphic from NRC “Toxicity Testing in the 21st Century” 2007
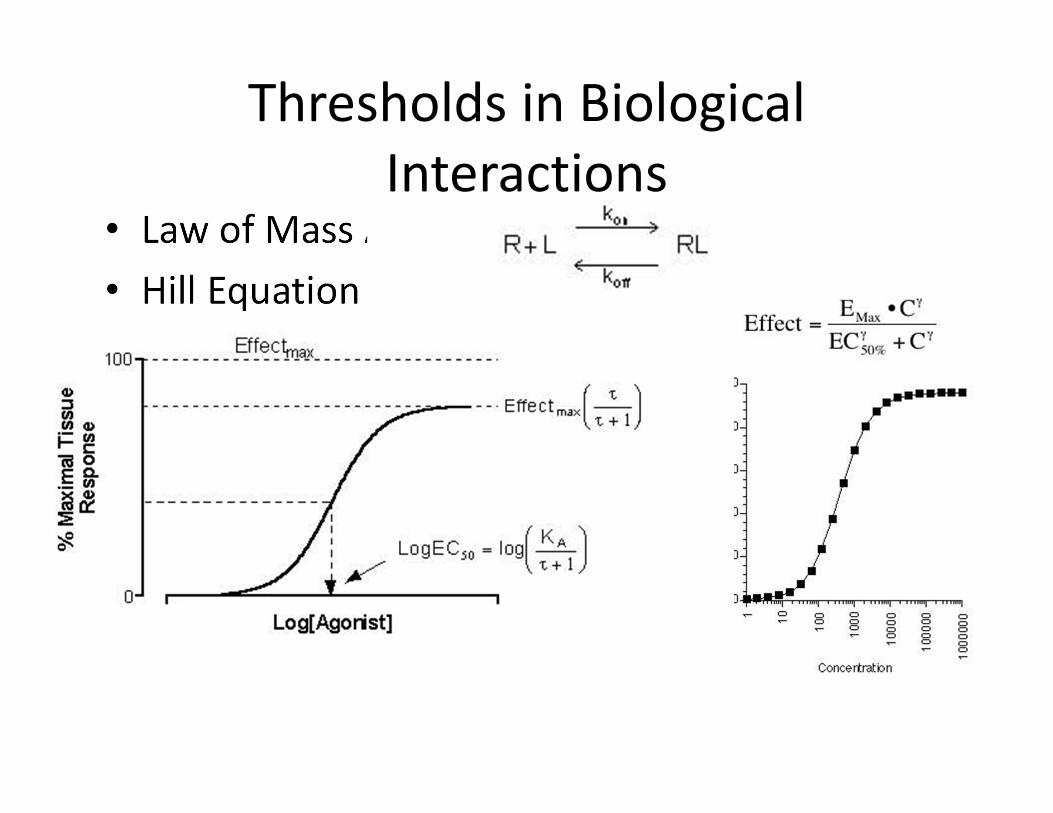
• Law of Mass Action• Hill Equation
Thresholds in Biological Interactions

Thresholds in Biological Responses
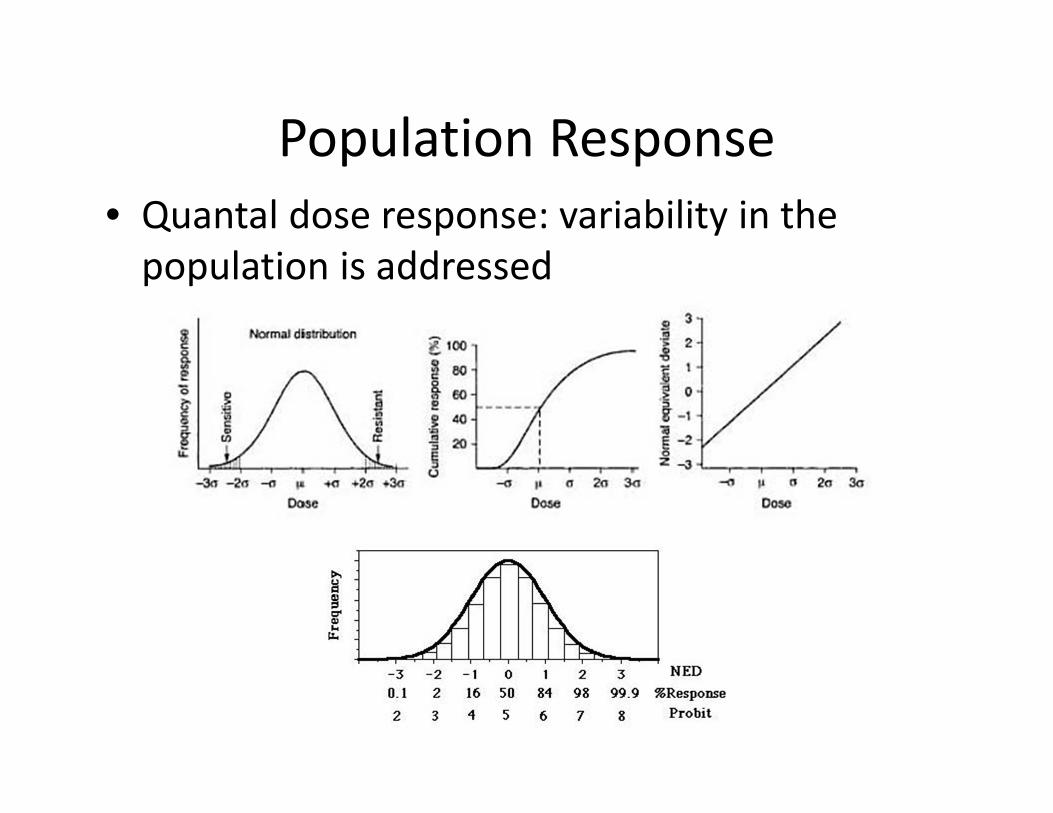
Population Response• Quantal dose response: variability in the population is addressed

NRC Silver Book

What is the hypothesis?• Two components of Conceptual Model 1:
– Threshold individual• There is a threshold dose at the individual level. No response will be observed at doses below the threshold.
– Linear population• Due to variability in the population, even if there is a threshold at the individual level, there will be no apparent threshold at the population level

How to Evaluate this Hypothesis?• Statistical evaluations will not provide the answers– Signal to noise within experimental data– Resolution between shallow linear, non‐linear and zero slopes problematic
• MUST USE KNOWLEDGE OF BIOLOGICAL BASIS OF TOXICITY

Inflammation Fibrosis Cirrhosis
Case Study: Ethanol‐induced Cirrhosis in Humans
Rick Becker1, Sean Hays2

From: Management strategies in alcoholic liver disease. Herbert Tilg and Christopher P Day. Nature Clinical Practice Gastroenterology & Hepatology (2007) 4, 24-34doi:10.1038/ncpgasthep0683


Methods : Mortality• Benchmark dose (BMD) modeling of a meta‐analysis of mortality
relating to liver cirrhosis (Rehm et al., 2010) – BMD was conducted for data on males and females, separately. – A 1.5% excess risk was chosen as the benchmark response (BMR);
Both BMD and BMDL (benchmark dose lower limit – 95% confidence limit) were calculated
– BMDLs for males (25.7 g/day) and females (27.2 g/day) – Assume dose response relationship is linear– Calculate dose associated with a 1e‐5 excess risk level (the level of
response recommended in the NRC report)– Ethanol dose at 1e‐5 excess risk of liver cirrhosis mortality in US
population “predicted to be”0.018 g/day (0.3 mg/kg‐day).
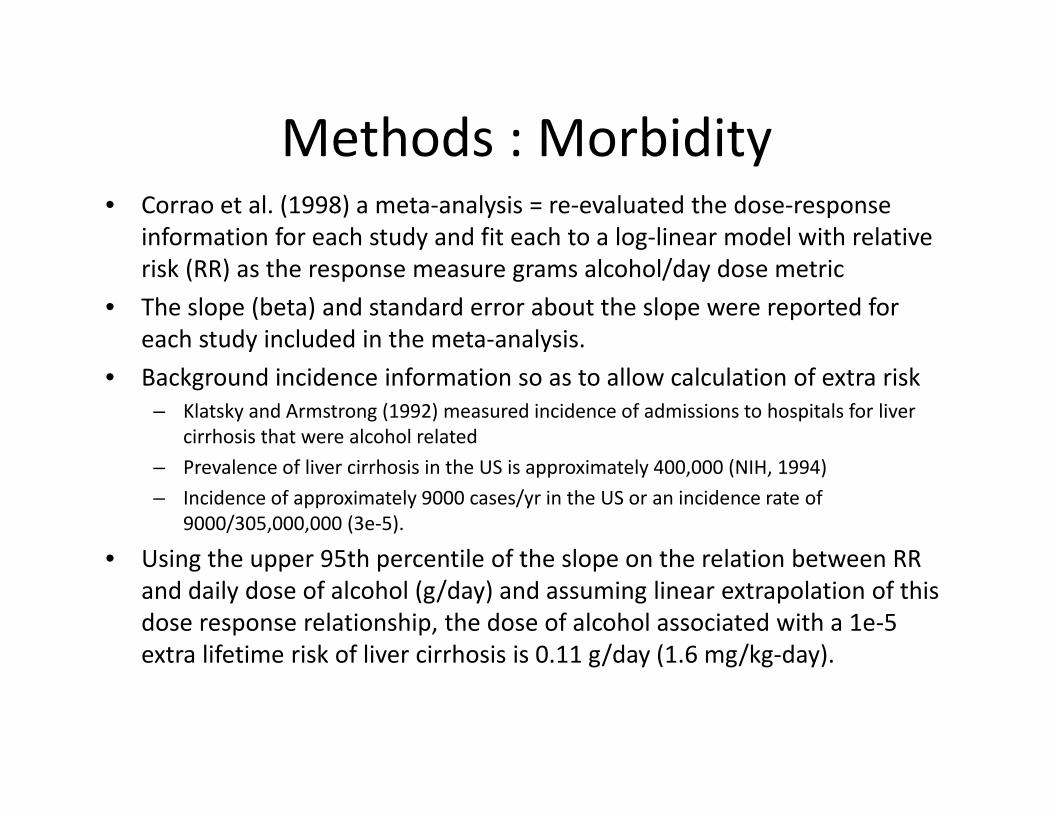
Methods : Morbidity• Corrao et al. (1998) a meta‐analysis = re‐evaluated the dose‐response
information for each study and fit each to a log‐linear model with relative risk (RR) as the response measure grams alcohol/day dose metric
• The slope (beta) and standard error about the slope were reported for each study included in the meta‐analysis.
• Background incidence information so as to allow calculation of extra risk– Klatsky and Armstrong (1992) measured incidence of admissions to hospitals for liver
cirrhosis that were alcohol related – Prevalence of liver cirrhosis in the US is approximately 400,000 (NIH, 1994)– Incidence of approximately 9000 cases/yr in the US or an incidence rate of
9000/305,000,000 (3e‐5).
• Using the upper 95th percentile of the slope on the relation between RR and daily dose of alcohol (g/day) and assuming linear extrapolation of this dose response relationship, the dose of alcohol associated with a 1e‐5 extra lifetime risk of liver cirrhosis is 0.11 g/day (1.6 mg/kg‐day).
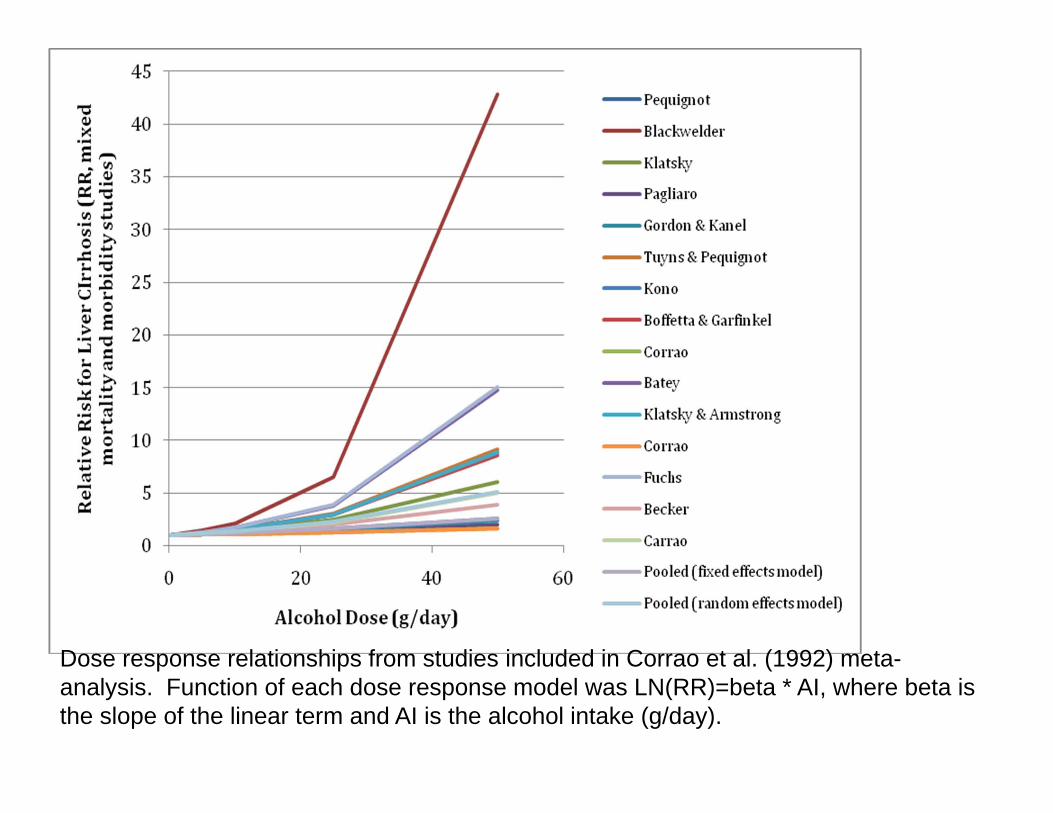
Dose response relationships from studies included in Corrao et al. (1992) meta-analysis. Function of each dose response model was LN(RR)=beta * AI, where beta is the slope of the linear term and AI is the alcohol intake (g/day).

Dose‐Response ModelStudy Klatsky & Armstrong, 1992beta 0.0358SE 0.004
Background Incidence of Liver CirrhosisCases per 100,000 hospital visits 26Hospital admissions/yr in US 34667000Background incidence of cirrhosis cases/yr 9013US population 305000000Background Incidence rate 2.96E‐05
Extra RiskLifetime Rate 2.07E‐03Tolerable extra cases 1.00E‐05Target cases 2.08E‐03Target RR 1.004834
Dose @ Target RR (g/day) 0.11
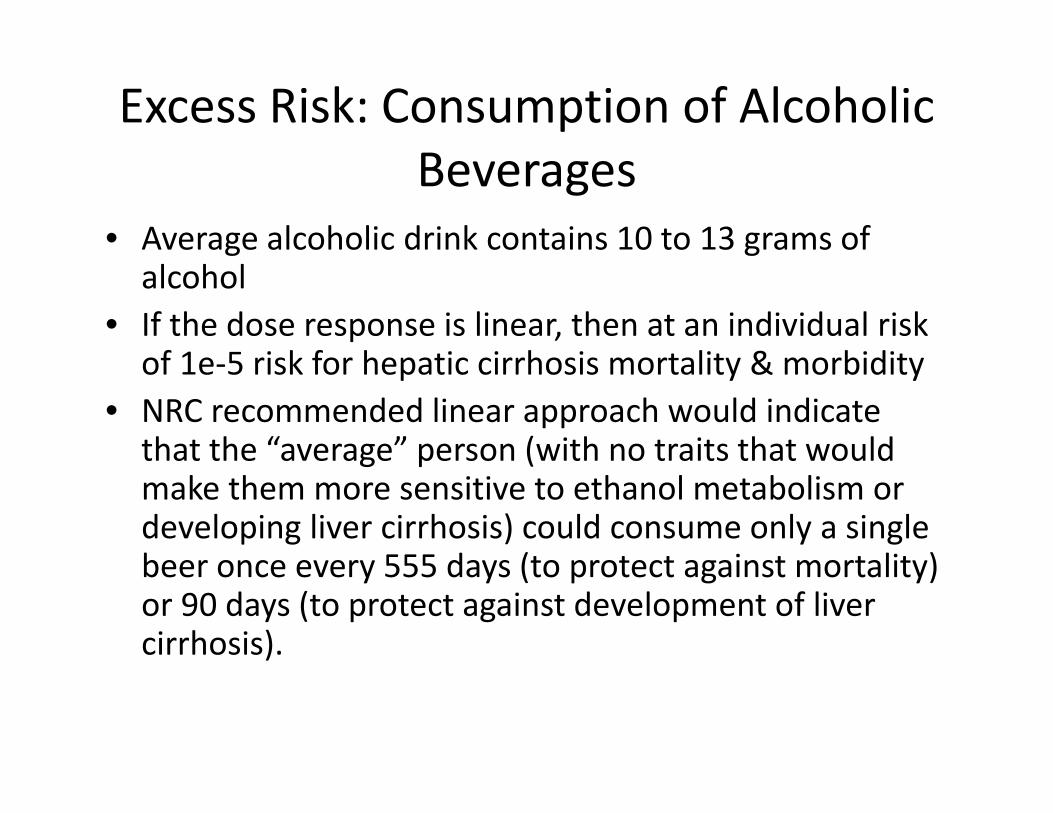
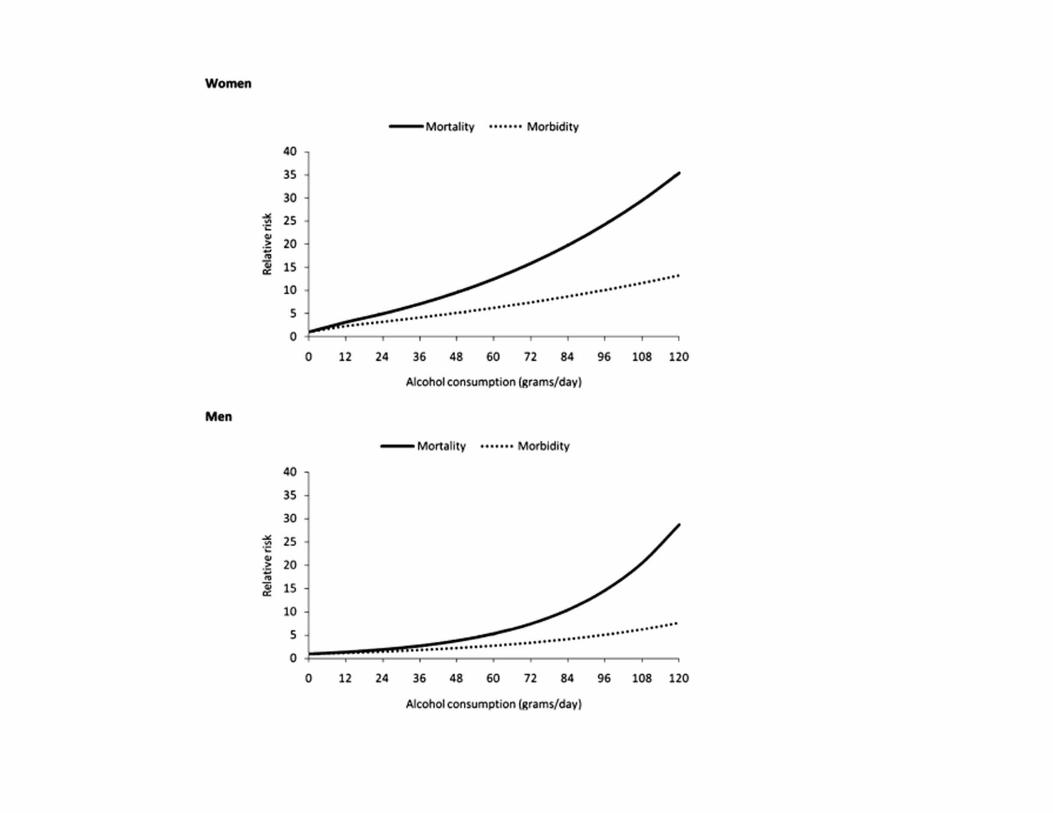
Excess Risk: Consumption of Alcoholic Beverages
• Average alcoholic drink contains 10 to 13 grams of alcohol
• If the dose response is linear, then at an individual risk of 1e‐5 risk for hepatic cirrhosis mortality & morbidity
• NRC recommended linear approach would indicate that the “average” person (with no traits that would make them more sensitive to ethanol metabolism or developing liver cirrhosis) could consume only a single beer once every 555 days (to protect against mortality) or 90 days (to protect against development of liver cirrhosis).
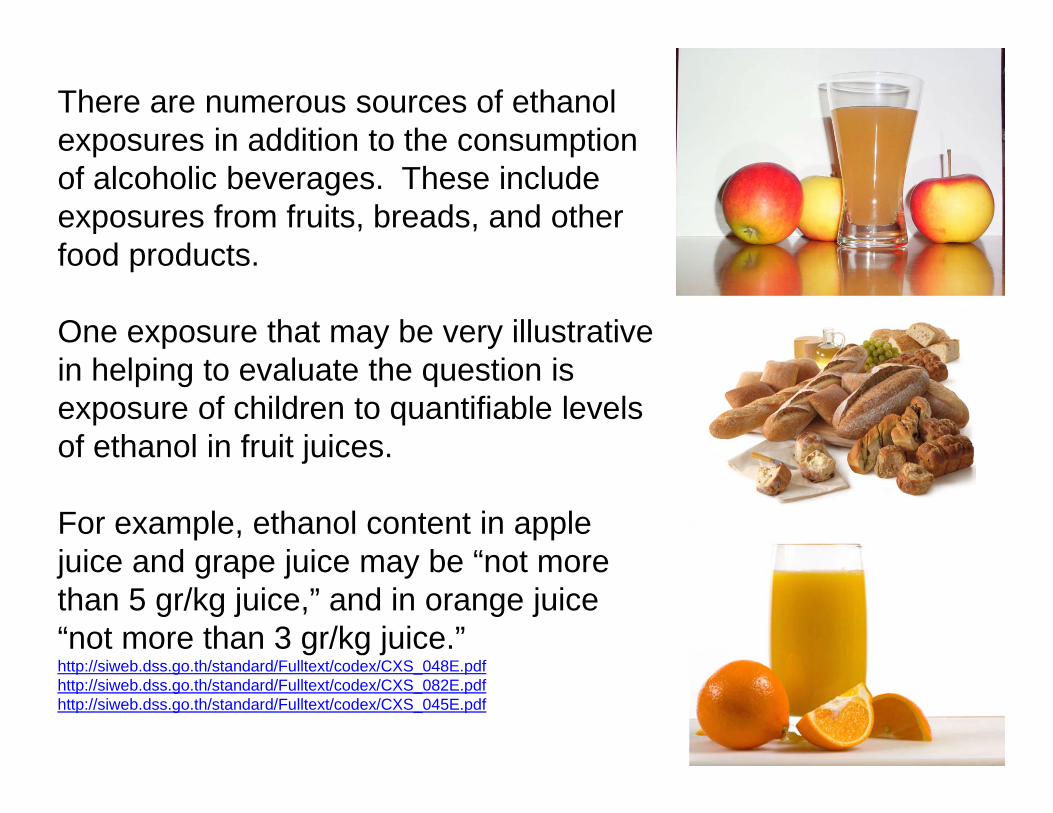
There are numerous sources of ethanol exposures in addition to the consumption of alcoholic beverages. These include exposures from fruits, breads, and other food products.
One exposure that may be very illustrative in helping to evaluate the question is exposure of children to quantifiable levels of ethanol in fruit juices.
For example, ethanol content in apple juice and grape juice may be “not more than 5 gr/kg juice,” and in orange juice “not more than 3 gr/kg juice.” http://siweb.dss.go.th/standard/Fulltext/codex/CXS_048E.pdfhttp://siweb.dss.go.th/standard/Fulltext/codex/CXS_082E.pdfhttp://siweb.dss.go.th/standard/Fulltext/codex/CXS_045E.pdf

Excess Risk: Low Level Exposures via Consumption of Fruit Juice
• Typical doses of ethanol from fruit juices have been calculated to be approximately 0.35 grams/day per individual
• If the dose response is linear, then for hepatic cirrhosis mortality and morbidity, linear population response would:– “predict” approximately 3e‐5 “risk” of developing alcoholic liver
cirrhosis simply from consumption of fruit juices (0.35/0.11 grams/day).
– For alcohol‐induced mortality from hepatic cirrhosis, the linear extrapolation method would “predict” a 20e‐5 “risk” of mortality from cirrhosis solely from consumption of fruit juices (0.35/0.018 grams/day)
• WHAT DOES THIS ANALYSIS INDICATE RE: THE HYPOTHESIS OF LOW DOSE LINEAR IN THE POPULATION?
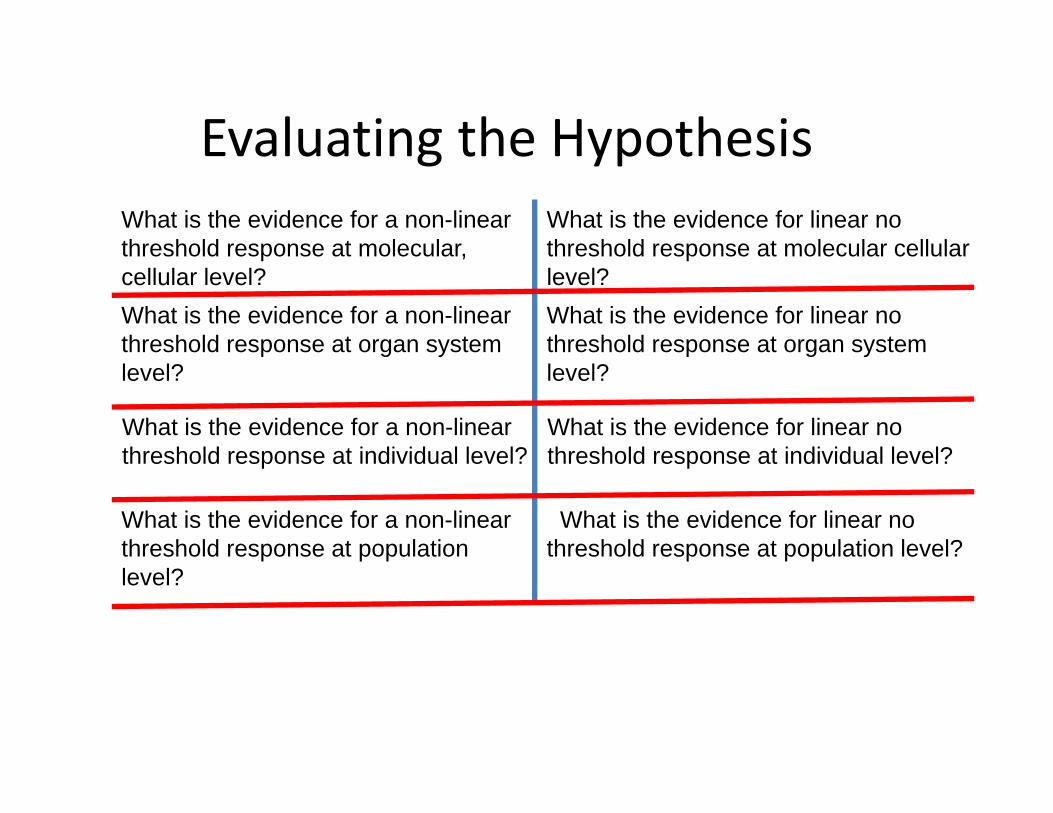
Evaluating the Hypothesis What is the evidence for a non-linear threshold response at molecular, cellular level?
What is the evidence for linear no threshold response at molecular cellular level?
What is the evidence for a non-linear threshold response at organ system level?
What is the evidence for linear no threshold response at organ system level?
What is the evidence for a non-linear threshold response at individual level?
What is the evidence for linear no threshold response at individual level?
What is the evidence for a non-linear threshold response at population level?
What is the evidence for linear no threshold response at population level?

Conclusions• Can’t address this issue with statistics alone• Need to apply knowledge of processes of chemical interactions with biological systems
• Need to employ a systematic, structured evaluative process = KEDRF (ILSI)/Hypothesis‐based WoE (Rhomberg)
• ARA “Beyond Science and Decisions: From Issue Identification to Dose‐Response Assessment”
http://www.allianceforrisk.org/ARA_Dose‐Response.htm

ARA “Beyond Science and Decisions
Participating Orgs / Sponsors