BBA (Hons) Project Internet Users’ Attitudes and Beliefs About

RICE UNIVERSITY
Varying Icon Spacing Changes Users’ Visual Search Strategy:Evidence From Experimental Data, Cognitive Modeling, and Eye-
Tracking
by
Sarah P. Everett
A THESIS SUBMITTEDIN PARTIAL FULFILLMENT OF THEREQUIREMENTS FOR THE DEGREE
Master of Arts
APPROVED, THESIS COMMITTEE:
____________________________________Michael Byrne, Assistant ProfessorPsychology
____________________________________David Lane, Associate ProfessorPsychology
____________________________________Jim Dannemiller, Lynette S. Autrey ProfessorPsychology
HOUSTON, TEXAS
MAY 2005

ABSTRACT
Varying Icon Spacing Changes Users’ Visual Search Strategy:
Evidence From Experimental Data, Cognitive Modeling, and Eye-Tracking
by
Sarah P. Everett
Users of modern GUIs routinely engage in visual searches for control items such
as buttons and icons. The current research is intended to deepen our understanding of
how the spacing between icons affects search times. Two experiments based on previous
icon sets (Fleetwood & Byrne, 2002) were conducted in which the spacing between icons
was systematically manipulated, and for which there was a computational cognitive
model that predicted performance. Although the model’s prediction that larger spacing
would lead to slower search times was supported, there was an unanticipated finding:
users were substantially slower than in similar experiments that employed consistent
smaller spacing. The results were better fit with a model that employed a fundamentally
different, less efficient search strategy. Eye-tracking data from a third experiment
confirmed the effect of spacing on users’ visual search behavior, but the system could not
provide adequate information to explain the change in search behavior.

In the graphical user interfaces (GUIs) of modern computers, icons are often used
to represent computer files, commands, and objects. Icons are so commonly used today
that most computer users are dependent on them to issue commands or find files. The
task of searching for an icon and its associated file name is one with which computer
users have become highly familiar. Icons are especially useful in handheld devices such
as personal digital assistants and cellular phones. These devices have much smaller
screens than typical desktop computers, and hence it is important to conserve available
screen space. Icons help alleviate this problem because they can potentially convey more
information or represent many commands in a minimum amount of space. Icons may
differ in size, shape, color, and motion, whereby, some, none, or all of these aspects can
be used to provide information to users. Because iconic representation has become
widespread, more research is needed to examine how people search for icons.
The adoption of icons means that a memory task (e.g., recalling file names) is
replaced with a visual search task (e.g., finding an icon that represents a desired file). In
order for a person to use an icon, they must first, of course, be able to locate it. The
process of visual search is important because it affects several crucial aspects of target
selection: time needed to find the target, whether the target will be correctly identified as
such, and whether the target will be found at all. When icons are used, the cost of such
file representation must be examined. This cost includes both the time spent completing a
task and associated errors. Further research could help reduce this cost as better-designed
icons could represent information more effectively.
Though the cost in user time of “bad” icons may seem small—a second here, a
second there—the importance of such small effects becomes more salient in non-desktop

applications. As GUIs begin to be used in places such as automobiles and hospital
emergency rooms, the importance of small differences in time and/or accuracy of visual
search is enormously magnified. Consider the case of on-board displays in automobiles,
or mobile phone use in an automobile. A car traveling at 55 mph moves approximately 80
feet in one second. Thus, a display that takes one second longer to search is an extra 80
feet in which the driver is not watching the road or monitoring the actions of other
drivers.
As Byrne (1993) and McDougal, de Bruijn, and Curry (2000) have shown, all
icons are not equal. Simple icons can act as much better search guides than can complex
ones, especially as the number of icons displayed increases. Although details in icons
may help users recognize an icon, too much detail can be distractive and add unnecessary
clutter. It is better to simplify icons by including only those details needed for an icon to
be distinguishable and, therefore, useful (Horton, 1996). As McDougal et al. (2000) have
shown, icon concreteness can be separated from complexity even though increased
concreteness usually leads to greater complexity. However, the concreteness of icons is
primarily useful when novice users are first learning new interfaces and do not contribute
to the long-term effectiveness of an icon. Thus the quality of an icon can be judged by its
distinctiveness and complexity. Fleetwood and Byrne (2002; in press) and Fleetwood
(2001) (from here referred to as F&B) found that different quality icons produce different
types of visual search strategies. With high-quality icons, people can identify clusters of
icons preattentively. People tend to search first within such groups and not conduct a
general search using a simple strategy such as a left-to-right search.
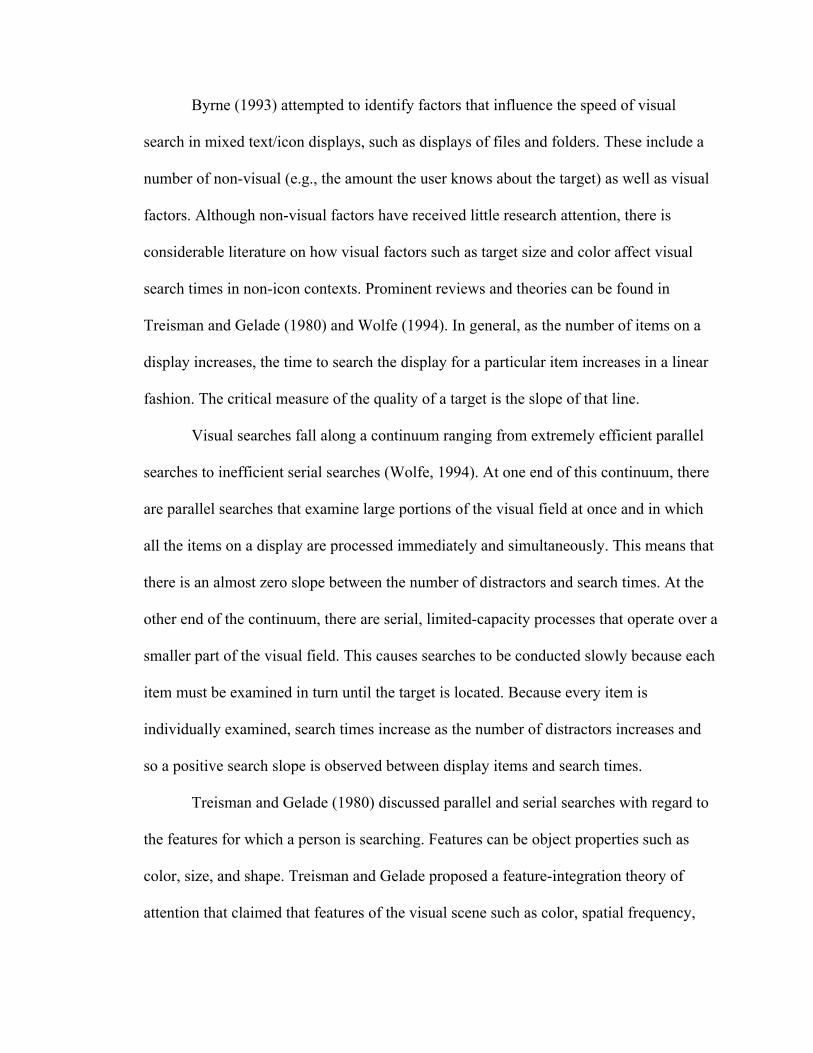
Byrne (1993) attempted to identify factors that influence the speed of visual
search in mixed text/icon displays, such as displays of files and folders. These include a
number of non-visual (e.g., the amount the user knows about the target) as well as visual
factors. Although non-visual factors have received little research attention, there is
considerable literature on how visual factors such as target size and color affect visual
search times in non-icon contexts. Prominent reviews and theories can be found in
Treisman and Gelade (1980) and Wolfe (1994). In general, as the number of items on a
display increases, the time to search the display for a particular item increases in a linear
fashion. The critical measure of the quality of a target is the slope of that line.
Visual searches fall along a continuum ranging from extremely efficient parallel
searches to inefficient serial searches (Wolfe, 1994). At one end of this continuum, there
are parallel searches that examine large portions of the visual field at once and in which
all the items on a display are processed immediately and simultaneously. This means that
there is an almost zero slope between the number of distractors and search times. At the
other end of the continuum, there are serial, limited-capacity processes that operate over a
smaller part of the visual field. This causes searches to be conducted slowly because each
item must be examined in turn until the target is located. Because every item is
individually examined, search times increase as the number of distractors increases and
so a positive search slope is observed between display items and search times.
Treisman and Gelade (1980) discussed parallel and serial searches with regard to
the features for which a person is searching. Features can be object properties such as
color, size, and shape. Treisman and Gelade proposed a feature-integration theory of
attention that claimed that features of the visual scene such as color, spatial frequency,
brightness, and direction of movement are registered early, automatically, and
simultaneously. According to Beck and Ambler (1972), the slope of a line is another
stimulus property that can be processed in parallel. On the other hand, Treisman and
Gelade noted that the identification of objects requires focused attention and occurs later
and separately for each object in a visual display. When a target can be identified on the
basis of a single feature (i.e., yellow, or square), a parallel visual search occurs. Parallel
searches do not require focused attention and, thus, are very little affected by the number
of distractors simultaneously displayed with target. However when a conjunction of
features is needed to identify a target (i.e., a blue triangle among a display of red triangles
and blue squares), the search for such an object is serial. According to the feature-
integration theory, this type of search can only happen after the features have been
combined to form one complete representation of an object, which can only occur later in
the perceptual process and on an individual basis.
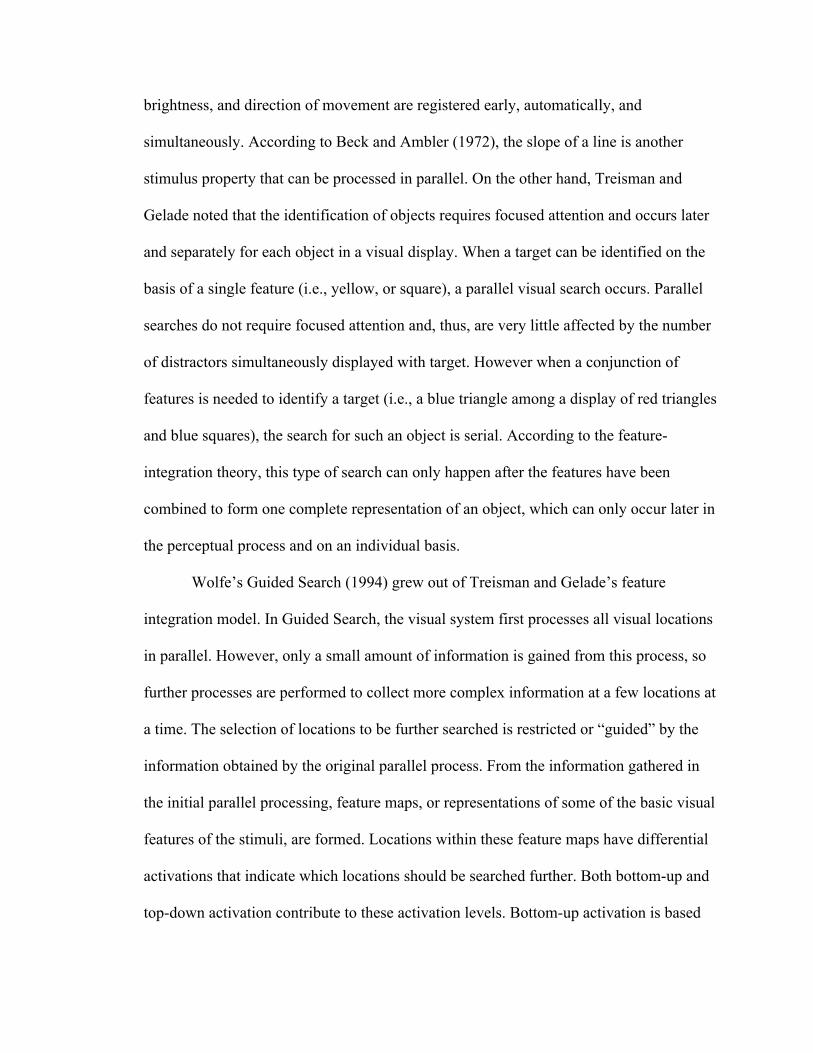
Wolfe’s Guided Search (1994) grew out of Treisman and Gelade’s feature
integration model. In Guided Search, the visual system first processes all visual locations
in parallel. However, only a small amount of information is gained from this process, so
further processes are performed to collect more complex information at a few locations at
a time. The selection of locations to be further searched is restricted or “guided” by the
information obtained by the original parallel process. From the information gathered in
the initial parallel processing, feature maps, or representations of some of the basic visual
features of the stimuli, are formed. Locations within these feature maps have differential
activations that indicate which locations should be searched further. Both bottom-up and
top-down activation contribute to these activation levels. Bottom-up activation is based

on the differences between one location and those around it, and thus identifies those
objects that are distinctive. Top-down activation is obtained by identifying locations that
are likely to contain target features by selecting the output of only one channel per
feature, such those for a particular color and a particular orientation.
To be able to identify objects or select an object based on information about more
than one feature, activation maps are needed. These maps guide attention to locations
likely to contain the target and are based on both bottom-up and top-down activation
information from all possible target locations. In an unlimited capacity parallel search,
the target object always has the highest activation and often seems to “pop-out.” In a
serial search, however, the target does not have the highest activation and so attention
continues to be directed to the location with the next highest activation until the target is
found. In Guided Search 2.0 (GS2) after a location has been unsuccessfully searched, it is
removed from further consideration (Wolfe, 1994).
In GS2, a search ends when the searcher either finds the target or becomes
convinced that the target will not be found. Because serial search continues from one
location to another in order of decreasing activation, eventually a point will be reached
when the activation of other locations is so small that it is very unlikely that they will
contain the target. This leads to the possibility of an activation threshold below which
locations would not be considered for search. In GS2, searches can also be terminated
when it is determined that successful searches almost never take this long (Wolfe, 1994).
Although Treisman and Gelade’s feature integration theory (1980) and Wolfe’s
Guided Search (1994) are generally accepted in the visual search research field, some
researchers question the existence of two distinct processes in visual search. Instead,

Deco, Pollatos, and Zihl (2002), for example, put forth a model which works across the
visual field in parallel, but due to the different latencies of its dynamics, can show both
parallel and serial types of visual attention. This model requires neither the assumption of
a spotlight or saliency maps for visual search tasks.
Overall, however, what the visual literature has shown is that visual search can be
“guided” by certain visual features such as color. In fact, color is one of the most
powerful features used to make objects easily distinguishable or to pop-out. Many studies
have focused on the use of color in visual search tasks and concluded that even small
differences between colors can be important. Smallman and Boynton (1990) showed that
effective color coding in visual search tasks may be possible using up to twelve colors.
Motter and Belky (1998b) found that color but not other target features such as
orientation can be used to guide selectively visual search for a target.
As discussed above, when a target can be differentiated from distractors by a
single visual feature, it is possible to find the target in constant time regardless of the
number of distractors. For example, if the target is green and all the distractors are red,
the number of red distractors does not matter, so the search slope is zero. For more
complex searches, such as searches of real computer displays, the slope will be nonzero.
However, better icon design, informed by knowledge of visual search processes, should
yield shallower slopes, as shown in (Byrne, 1993; Fleetwood, 2001; Fleetwood & Byrne,
2002, in press).
F&B took this notion one step further and constructed computational cognitive
models to simulate users performing searches of mixed icon/text displays. F&B modeled
their experiments using ACT-R 4.0, a cognitive architecture for simulating and

understanding human cognition that combines a model of cognition with perceptual-
motor capabilities (Anderson et al., 2004). It is a production system theory in which there
are two types of knowledge representation. The first type is declarative knowledge which
consists of things remembered or perceived, knowledge which we are aware we have.
The second type is procedural knowledge, the information necessary to complete a task
but which we cannot readily describe. Units of declarative memory are represented in
chunks and procedural memory is represented as productions, or condition-action pairs in
which the action will be taken if the condition is met.
In F&B’s model, ACT-R simulates the preattentive visual search process in which
people can parafoveally identify an icon with a feature matching that of the target icon.
Use of this preattentive process means that people will not examine the icons when the
target icon shares few features with the distractor icons. Attention is only directed to the
icon itself after the target has been identified, and users must attend to the icon to be able
to click on it. In the model, an icon that is a potential match to the target is located, but
attention is focused directly on the file name, or text label, located beneath the icon and
the icon picture itself is not attended. Once the model realizes that the current location on
which attention is focused does not contain the target, it will look for the one nearest to
the current icon that has the same features as the target icon. Attention is only directed to
an icon picture after it has been identified as the target and must be selected. Using this
model, F&B were able to obtain predictions that closely matched their experimental data
(R2 = 0.98, mean absolute error = 3.19%).
This model is obviously highly dependent on ACT-R’s visual system, a feature-
based attentional system that includes EMMA (Eye Movements and Movement of

Attention). EMMA is an eye-movement model based on Reichle, Pollatsek, Fisher, and
Rayner’s (1998) E-Z Reader model that integrates eye movements, visual attention, and
cognitive processes (Salvucci, 2001). EMMA uses the following equation to predict the
time Tenc needed to encode an object i:
€
Tenc = K •[− log f i ] • ekε i
where fi is the frequency of the object represented with a probability between 0 and 1; ei
is the eccentricity of the object, measured in units of visual angle as the distance between
the current eye position and the object; and K and k are constants.
This is relevant because the F&B model, based on the EMMA equation above,
predicts that the spacing between objects should affect how rapidly they can be searched.
This model predicts that smaller spacing should yield shorter search times, because wider
spacing will cause longer encoding time for individual visual objects as a byproduct of
larger inter-item eccentricities.
Experimental results relevant to this prediction have been mixed. Counter to this
prediction, increasing the screen density (the proportion of the screen displaying
information) has been shown to increase search times in some laboratory studies (Cohen
& Ivry, 1991; Thacker, 1986; Treisman, 1982). In Cohen and Ivry’s study, search times
for a conjunctively defined target were longer when the space between distractors was
smaller. They proposed that this occurred because there are two feature integration
mechanisms that operate at different speeds. The fast mechanism codes an object’s coarse
location information with the initial registration of its visual features. This mechanism

cannot operate when objects are located close to each other and so a slower focal
attention mechanism must be used (Cohen & Ivry, 1991).
Another study that counters the predictions of F&B’s model about spacing is
Hornof (2001). Here, the effects of the physical structure of a computer screen layout on
visual searches were examined. Hornof looked at two different layout structures: labeled
visual hierarchies and unlabeled visual hierarchies. Labeled visual hierarchies produced
much faster search times than did the unlabeled ones because the labels directed attention
to the group most likely to contain the target. Hornof also found that people use slower
and more accurate strategies to select a target when distractors are present. Additionally,
people are more careful when selecting the target if there are other objects near the target,
indicating that reducing the spacing between items may cause slower performance in
visual search and selection tasks.
Other studies, however, have shown that decreasing screen density by spreading
out display objects does not always lead to better performance, especially when
presenting large amounts of information. Staggers (1993) found that in a hospital
information system, user performance was best when all relevant information could be
seen on one screen. In a simulated power plant control system, Burns (2000) found that
problems were detected more quickly and accurately using a one-screen, dense display.
The advantage gained in both of these studies, however, may not apply to general visual
searches because the advantage was preventing the need to look at multiple pages of
information.
In another visual search experiment, Motter and Belky (1998a) manipulated
stimulus spacing by displaying many objects on a computer screen using varying degrees

of distance between objects. They recorded eye positions of their experimental subjects,
two highly trained rhesus monkeys and concluded that there is a restricted area around
the point of fixation within which targets are detected with a high probability. They
claimed that this conspicuity area is controlled by stimulus spacing and, as such, if a
target is outside this restricted area, it will not be detected on the current fixation. This
leads to the prediction that as the spacing between visual objects increases, it should be
harder and more time-consuming to detect targets.
Previous studies have examined the effects of grouping of visually presented
objects on visual searches. Tullis (1997) gives guidelines for how information should be
arranged into groups. As previously mentioned, Hornof (2001) looked at the effects of
visual hierarchies and concluded that appropriate labels for groups improve search times.
Treisman (1982) studied perceptual grouping effects on searches for targets identified by
one separate feature or by a conjunction of features. This study looked at whether objects
in the display could be preattentively separated into distinct groups. Searches for single
features were not affected by perceptual grouping, suggesting that these features had been
identified preattentively. However, in conjunction searches participants scanned serially
between groups, not individual items, when there was not the possibility of an illusory
target within a group. This suggested that the grouping had occurred preattentively. This
study showed the important impact that perceptual grouping can have on visual searches.
So, although a variety of spatial effects have been studied, the mixed results of
those experiments and the indirect mapping of those results to mixed icon/text displays
points to the need for further study. Experiment 1 was designed to explicitly assess the

F&B model’s ability to predict accurately the effects of spacing, that is, the distance
between the icons on the display.
EXPERIMENT 1
Method
Participants
Participants were 46 undergraduates at Rice University who received course
credit for their participation. There were 29 female participants and 17 male participants
ranging in age from 18-23. These participants had at least some prior computer
experience and many were experienced users.
Design
The experiment was a within-subjects design and had four independent variables.
These were set size, icon quality, spacing, and block. Set size had four levels with 6, 12,
18, or 24 icons displayed in the search task window.
Icon quality had three levels: good, fair, and poor. “Good” quality icons were
solid circles or triangles shown in red, blue, green, yellow, brown, and black. “Poor”
icons consisted of many shapes and lines combined to form complex images and were
hard to distinguish from each other. These icons were presented in grayscale. “Fair” icons
were relatively simple images that represented some identifiable object. These icons were
also shown in grayscale. Figure 1 gives examples of icons used in the study. Icon labels
were randomly selected from a list of 750 words of comparable length. These icons were
the same as those used in the F&B work, and in terms of the ACT-R model differed in
the amount of overlap between primitive features. For example, “green triangle” is

perfectly predictive in the “good” icon condition because no other icons contained green
triangles. However, “gray rectangle” is a very common feature within the “poor” set, so
using that feature to guide visual search will often direct attention towards a non-target
icon.
Figure 1. Examples of Icons in Three Qualities: Good, Fair, and Poor.
Spacing had three levels: small, medium, and large. In the small condition, icons
were 32 pixels apart. Participants were approximately 15 inches from the screen. At this
distance, the 32 pixels between icons in the small condition translated into a visual angle
(VA) of 1.6°. Figure 2 shows an example of icons displayed in this arrangement. In the
medium condition the icons were 64 pixels apart (VA = 3.2°) and in the large condition
the icons were 96 pixels apart (VA = 4.8°). Figure 3 gives an example of icons displayed
with large spacing.
Figure 2. Example of Icons Displayed in the Small Spacing Condition.

Figure 3. Example of Icons Displayed in the Large Spacing Condition.
Each independent variable was examined at every level of the other independent
variables, yielding 36 trials per block (3 x 4 x 3 = 36). The order of presentation within a
block was randomized. There were 5 blocks: one practice block and four experimental
blocks.
Response time was the primary dependent variable, measured from when the
participant clicked the “Ready” button to the time when the participant clicked on an icon
in the display.
Materials
The computers used to run the experiment were Apple Macintosh iMac personal
computers. Display resolutions were set at 600x800. Icons were standard size icons (32
pixels x 32 pixels).
The “Ready” button was set to appear in a location calculated to be the average
center of all the icon display windows.

Procedure
Participants were presented with instructions and then a practice block to allow
them to become comfortable with the task. After the practice block, participants
completed four experimental blocks of trials.
In each trial, participants were presented with one icon and a randomly selected
word as the file name (the target). Shortly thereafter, a “Ready” button appeared on the
screen. Once they felt they had sufficiently examined the target icon, participants clicked
the “Ready” button to proceed to the next phase of the trial. Participants were then
presented with a window containing 6, 12, 18, or 24 icons in a grid pattern. Icons in the
smallest set size condition were laid out in 2 rows of 3 icons. This increased to 3 rows of
4 icons for the 12 icon set size, then to 3 rows of 6 icons for the 18 set size condition, and
to 4 rows of 6 icons in the largest set size condition of 24 icons. The target icon with
target label appeared among the distractors in every trial.
The search was a self-terminating mixed search involving both visual and
semantic searches, as targets were identified by icon and also by file name. One third of
the icons displayed in the search task window matched the target icon, but only a single
icon had a matching file name label. Matching icons were used to more closely resemble
real-world situations in which there are often multiple instances of an icon on a display,
such as document icons in a folder. For this same reason, the icons were arranged in a
grid formation, such as occurs with the “lock-to-grid” feature many operating systems
support. The location of the target within the window was randomized, and the
participants searched for and clicked on the target icon. This ended the trial and a new
one began.

Participants were instructed to complete the task as quickly as possible. Speed
was emphasized in the instructions but participant were also told not to sacrifice
accuracy. If participants made an error, they heard a beep that they knew indicated a
mistake.
Results
Across all trials, the mean response time was 2660 ms (SD = 42). Mean response
times for participants are presented as a function of quality and spacing in Figure 4. From
this figure, it is apparent that as the set size increased and quality decreased, search time
lengthened. Replicating F&B’s results, the main effects of set size and quality were both
statistically reliable, F(3, 135) = 607.90, p < 0.001 and F(2, 90) = 278.33, p < 0.001,
respectively, as was the interaction between set size and quality, F(6, 270) = 34.90, p <
0.001.
0
500
1000
1500
2000
2500
3000
3500
4000
4500
5000
6 12 18 24
Set Size
Res
pons
e T
ime
(ms)
GoodFairPoor
Figure 4. Mean Response Times by Set Size and Quality.

However, the goal was not to simply replicate those effects, but to assess the
effects of spacing. Figure 5 shows response times as a function of spacing. As the space
between icons increased from small to medium to large, search times increased from an
average of 2587 ms (SD = 54) for the smallest spacing to 2655 ms (SD = 43) for medium
spacing to 2738 ms (SD = 46) for large spacing. There was a reliable main effect of
spacing, F(2, 90) = 7.27, p < 0.001. There was no interaction of set size and spacing or of
quality and spacing.
0
500
1000
1500
2000
2500
3000
Small Medium Large
Spacing
Res
pons
e T
ime
(ms)
Figure 5. Mean Response Times by Spacing for Experiment 1.
While statistically reliable, this spacing effect was small in absolute terms; the
difference between large and small spacing was only about 150 ms. However, spacing
may have affected user behavior in a more dramatic way. The small spacing condition
used here was essentially a replication of the conditions in the F&B experiments.
Therefore, response times should have been comparable across the two experiments.

However, comparisons of the data from these two studies show that the participants in the
current experiment were much slower on average than were participants in the F&B
study. Figure 6 shows the mean response times by set size and quality for the two
experiments. Because the users in the two experiments came from the same population
and the two experimental conditions are the same, one possible explanation for the
difference is that the participants in Experiment 1 adopted a new, less efficient search
strategy.
0
500
1000
1500
2000
2500
3000
3500
4000
4500
5000
6 12 18 24
Set Size
Res
pons
e T
ime
(ms)
F&B - GoodF&B - FairF&B - PoorExp 1 - GoodExp 1 - FairExp 1 - Poor
Figure 6. Mean Response Times by Set Size and Quality for F&B and the SmallestSpacing Condition in Experiment 1.
A strategy change as a result of small differences in the task has been observed
before in HCI contexts (Gray & Boehm-Davis, 2000). The “strategy” referred to here is
not necessarily a conscious decision on the part of users, but refers to the way low-level
perceptual-motor activities are coordinated by users to accomplish their task. Gray and

Boehm-Davis refer to these as “microstrategies.” The data from Experiment 1 suggested
that our users were changing microstrategies.
MODELING THE EXPERIMENT
Model 1
The initial model for the experiment was the F&B model, modified very slightly
only to make it compatible with the 5.0 version of ACT-R. This model uses a very
efficient search strategy such that shifts of visual attention go from one text label to the
next, guided by the nearest icon with a feature matching the target. This model has thus
been named the “text-look” model.
No numeric parameters or productions were modified for this model, so this
represents a true zero-parameter fit. Because certain aspects of the model are stochastic,
the model was run for 100 blocks of trials; model predictions represent average
performance across these blocks.
Comparison of Model 1 Predictions to Data from Experiment 1
In Figure 7, the response times of participants and those predicted by the model
are displayed by set size and quality. The effects of set size and quality predicted by the
model match the experimental data in direction. However, for all set sizes and qualities,
the model predicted that participants would complete the task more quickly than they did,
especially for the larger set size and lower quality icons.

0
500
1000
1500
2000
2500
3000
3500
4000
4500
5000
6 12 18 24Set Size
Res
pons
e T
ime
(ms)
Model 1 - GoodModel 1 - FairModel 1 - PoorExp 1 - GoodExp 1 - FairExp 1 - Poor
Figure 7. Mean Response Times by Set Size and Quality for the Model 1Prediction and Data from Experiment 1.
Mean response times for users and those predicted by the model as a function of
spacing are show in Figure 8. Again, the model clearly predicted that participants would
be faster at the visual search task than they actually were. It is correct, though, in the
direction of its predictions on the effect of spacing.

0
500
1000
1500
2000
2500
3000
Small Medium Large
Spacing
Res
pons
e T
ime
(ms)
Exp 1Model 1
Figure 8. Mean Response Times by Spacing for Experiment 1 and Model 1.
Although this model predicted response times consistent with the qualitative
trends of the experimental data, it did not provide a particularly good fit quantitatively.
Comparing the set size by quality interaction in Experiment 1 and Model 1 produced R2 =
0.96 with a 16.03% mean absolute error, while for the spacing main effect, R2 = 0.68 and
16.58% mean absolute error. While this is not bad for a zero-parameter fit, the systematic
under-prediction of the model suggested to us that users might have adopted a less
efficient search strategy. Model 2 was given a different search strategy and was run to
explore this possibility.
Model 2
In this model, based on the “double-shift” model of F&B, two shifts of attention
are required to examine each icon in the display. The first one shifts attention to any icon

that has features matching those of the target icon. The second attention shift is to the file
name located beneath that icon. If this file name matches the target file name, attention
shifts back to the icon so it can be clicked on. If the file name does not match that of the
target, the search process continues to find another icon with the same features as the
target. In addition, this version of the model does not enforce the constraint that the next
icon examined be the icon nearest the current fixation, as was done for Model 1. These
were the only changes made to the model; all other parameters were kept constant.
Comparison of Model 2 Predictions to Data from Experiment 1
Model 2 produced a much better fit with the experimental data than did the Model
1. This was true both for quality and spacing effects. The response times of participants
and the response times predicted by the Model 2 are displayed by set size and quality in
Figure 9 and by spacing in Figure 10.
0
500
1000
1500
2000
2500
3000
3500
4000
4500
5000
6 12 18 24
Set Size
Res
pons
e T
ime
(ms)
Model 2 - GoodModel 2 - FairModel 2 - PoorExp 1 - GoodExp 1 - FairExp 1 - Poor
Figure 9. Mean Response Times by Set Size and Quality for Experiment 1 andModel 2.

0
500
1000
1500
2000
2500
3000
Small Medium Large
Spacing
Res
pons
e T
ime
(ms)
Exp 1
Model 2
Figure 10. Mean Response Times by Spacing for Experiment 1 and Model 2.
Comparing the set size by quality interaction in Experiment 1 and Model 2
produced R2 = 0.95 with a 9.53% mean absolute deviation. For the spacing main effect,
the comparison of Experiment 1 and Model 2 yielded R2 = 0.92 and 7.59% mean absolute
deviation. Obviously, this model fit the experimental data better than the original model.
It still somewhat under-predicts times for the “poor” icons, but is much closer for the
other two conditions.
Based on the differences between the F&B results and Experiment 1, and guided
by the model, it was believed that the spacing manipulation caused a change in visual
search strategy. When the spacing between icons changed between trials, participants
used a much less efficient search strategy. This may be similar to the effect that Grice and
Hunter (1964) reported. They found that the type of experimental design used can

influence results. In their studies, participants who were exposed to two levels of stimulus
intensity within one experiment showed greater effects of the variable of interest than
groups who were exposed to either level alone. Experiment 2 was performed as an
explicit between-subjects assessment of the apparent strategy change due to participants’
exposure to variable levels of spacing.
EXPERIMENT 2
Method
The design, materials, and procedure for Experiment 2 were almost identical to
those in Experiment 1 except that participants were randomly assigned to one of two
groups. The VS (“variable spacing”) group had 20 participants for whom the experiment
was identical to that of Experiment 1 (the spacing between icons still varied between
small, medium, and large conditions). The other group, FS (“fixed spacing”), had 12
participants for whom the experiment was the same as that in Experiment 1, except that
the small spacing between icons was always used (no spacing changes). There were 23
female participants and 9 male participants, most ranging in age from 17-22. There was
also one participant who was 31 and one who was 65.
Results
For the VS group, the average response time was 2626 ms (SD = 108). Figure 11
shows the average response times by set size and quality for the VS group of this
experiment. The set size main effect was significant, F(3, 57) = 134.24, p < 0.001. The
spacing main effect was significant, F(2, 28) = 9.44, p < 0.001. The quality main effect
was significant, F(2, 38) = 108.44, p < 0.001. The set size by quality interaction was

significant, F(6, 114) = 19.21, p < 0.001, such that as set size increased, icon quality had
a larger impact on response times. The set size by spacing interaction and the spacing by
quality interaction were not significant.
0
500
1000
1500
2000
2500
3000
3500
4000
4500
5000
6 12 18 24
Set Size
Resp
on
se T
ime (
ms)
Good
Fair
Poor
Figure 11. Mean Response Times by Set Size and Quality for the VS Group ofExperiment 2.
For the FS group, the average response time was 2341 ms (SD = 49). The main
effect of set size was significant, F(3, 33) = 167.50, p < 0.001. The main effect of quality
was significant, F(2, 22) = 51.87, p < 0.001. The interaction of set size and quality was
significant, F(6, 66) = 4.23, p = 0.001.
The condition of interest in the VS group was the smallest spacing condition, in
which the displays participants saw were functionally identical to those in the FS group.
That is, there was no difference in the stimuli between the VS and FS groups for the
reported comparisons. The mean response time for this condition was 2594 ms (SD =

131). The usual effects of set size, F(3, 90) = 172.41, p < 0.001, quality, F(2, 60) =
123.91, p < 0.001, and their interaction, F(6, 180) = 12.40, p < 0.001 were replicated in
this condition of the VS group and the FS group.
Of more interest is how these results compared to the F&B results and to
Experiment 1. Figure 12 shows the mean response times by set size and quality for F&B
and the FS group of Experiment 2. Overall, this was a fairly good replication of the
original results.
0
500
1000
1500
2000
2500
3000
3500
4000
6 12 18 24
Set Size
Res
pons
e T
ime
(ms)
F&B - GoodF&B - FairF&B - PoorFS - GoodFS - FairFS - Poor
Figure 12. Mean Response Times by Set Size and Quality for F&B and for the FSGroup of Experiment 2.
Most critical to the current discussion are the results of the VS vs. FS group
manipulation. Since the displays seen were effectively identical, but the VS group also
saw displays with wider spacing, any differences between the groups must be a result of
differences induced by the VS users’ exposure to wider spacing conditions. Figure 13

shows mean response times for each group by set size and quality. Between-group
differences for the “good” icons are not large, but they are greater for the “fair” icons and
quite substantial for the “poor” icons. This was reflected in a reliable quality by group
interaction, F(2, 60) = 5.86, p = 0.005, as well as a reliable search slope by group by
quality interaction, F(2, 60) = 4.70, p = 0.013. Thus, it can be concluded that the larger
spacing conditions seen by the VS group caused them to slow down, even on the more
closely packed displays. As it is unlikely that exposure to wider spacing changed their
basic cognitive or perceptual abilities, and it is suggested that these users adopted an
inferior search strategy, particularly for the “poor” icons.
0
500
1000
1500
2000
2500
3000
3500
4000
4500
5000
6 12 18 24
Set Size
Res
pons
e T
ime
(ms)
VS - GoodVS - FairVS - PoorFS - GoodFS - FairFS - Poor
Figure 13. Mean Response Times by Set Size, Quality, and Group for Experiment 2.
EXPERIMENT 3
Tracking participants’ eye movements while completing a task has proven to be
an accurate and effective method of evaluating how people respond to an interface or

display. This technique provides precise data about where people are looking at specific
moments in time and the pattern of eye movements users make while performing
computer tasks. Being able to collect and analyze this data has helped further our
understanding of how these users interact with computer interfaces. For example,
Zelinksky and Sheinberg (1997) used eye tracking to confirm the presence of both
parallel and serial search behaviors when participants performed visual searches. Hornof
and Halverson (2003) used eye tracking in a hierarchical computer display search to help
confirm or disconfirm aspects of their cognitive models of the task such as which of
many possible strategies users employed when performing the search. Byrne et al.
(1999), in a study on the visual search of menus, demonstrated the usefulness of being
able to record what users are doing at the level of eye movements.
Fleetwood and Byrne (in press) used eye-tracking data to gain insight into the
processes underlying icon search, such as the steps taken by participants to search for and
identify a target icon. They found that participants did not need to look directly at icon
pictures, but only at icon file names to find the target. This evidence supported their Text-
Look Model (Model 1 in this paper). In some instances, the target icon file name was not
even foveated before its identification as the target. F&B also found that fixations were
less accurate and more were required when the quality of the icons worsened. Finally,
F&B also noticed a search strategy change due to the quality of icons. For good quality
icons, searches were “directed” by using features such as color but not shape. Groups
containing matching icons were searched beginning with the largest group of matching
icons. For poor quality icons, searches were “undirected” in that they were not directed
towards icons matching the target icon.

In Experiment 3, eye movement data were collected to examine the strategy
change due to increased spacing suggested by the data from Experiments 1 and 2. An eye
tracker was used to record eye movement information while participants completed an
experiment identical to Experiment 2. As F&B (Fleetwood & Byrne, in press) previously
collected data on an experiment that was very similar to that used for Experiment 2’s FS
(“fixed spacing”) group, it was not felt it would be necessary to run participants through
that version of the experiment in Experiment 3.
Method
Participants for this experiment were 13 Rice undergraduates. There were 10
female participants and 3 male participants. The design, materials, and procedure differed
from those in Experiment 1 and in Experiment 2 for the VS (“variable spacing”) group
only by the addition of collecting eye tracking data.
The eye tracker used was an ISCAN RK726/RK520 HighRes Pupil/CR tracker
and a Polhemus FASTRACK head tracker. This system has two cameras: one focused on
the participant’s eye and the other recording what the participant is looking at. The
magnetic polhemus is used to compensate for any head movements made during eye-
movement data collection. The camera recording information for a person’s eye takes a
video image of the eye and then the pupil center and the corneal reflection are calculated.
Visual point of regard (POR) can be computed from the changes that occur in the vector
between these two points when the eye’s orientation changes and is recorded at 60 Hz.
This system generally can reveal within one-half to one degree of visual angle where a
person is looking. Use of this eye-tracking system provided data on the eye movements
that participants made while completing the visual search task. This allowed the

examination of the search strategy participants use to find a target icon. The eye tracking
system was calibrated at the beginning of the experiment and when determined to be
necessary by the experimenter.
Stimulus and trial information including the spacing and icon quality used in the
trial were recorded in addition to eye movements. This allowed each trial to be replayed
later for data analysis.
Data Analysis
The part of the screen displaying icons was divided into rectangular regions of
equal area. Any fixation to a location within a rectangle was attributed to that POR
region. Gazes consisted of consecutive fixations within a single POR region.
As in Experiments 1 and 2, the data from the practice block of trials was not used
in the analysis. There were no practice effects in or performance differences between the
remaining four blocks of trials so the data was collapsed across block. Errors, which
participants made errors by clicking on an incorrect icon, occurred in less than 1% of the
trials. Outliers, trials in which an error was made, and trials in which the eye tracker
failed to record any eye movements were removed from analysis. The first gaze in every
trial was removed from consideration because this gaze was to the POR region where the
example target had been before the trial began. (Participants glanced back at the example
target just before clicking the Ready button and beginning the trial.)
When a comparison of results from the current experiment to those from F&B’s
study could be made, the comparison is reported.

Results
Across all trials, the average response time was 4249 ms (SD = 177). As we
would expect from Experiments 1 and 2, the main effects of set size, spacing, and quality
on response times in Experiment 3 were significant, F(3, 36) = 146.69, p < 0.001, F(2,
24) = 7.884, p < 0.001 and F(2, 24) = 61.96, p < 0.001, respectively. The interaction of
set size and quality was also significant, F(6, 72) = 6.68, p < 0.001. The interaction of set
size and spacing and that of spacing and quality were not significant. These results
replicated the findings of the first two experiments.
Response times in the current experiment were still much longer than in F&B’s
work. A comparison of response times from Experiment 3’s smallest spacing condition
and F&B’s equivalent condition can be seen in Figure 14. Possible explanations for this
that were explored included more fixations per trial or gazes per trial than were seen in
the F&B’s study. The possibility that longer fixation or gaze durations occurred due to
increased spacing was also considered. Additionally, the proportion of next matching,
next nearest, and revisitation gazes was also considered. These measures will be
described in more detail later. These possibilities were explored through analysis of the
eye movement data.

0
1000
2000
3000
4000
5000
6000
6 12 18 24
Set Size
Resp
on
se T
ime (
ms)
Good - Exp. 3Fair - Exp. 3Poor - Exp. 3Good - F&BFair - F&BPoor - F&B
Figure 14. Mean Response Times by Set Size and Quality for F&B and the SmallestSpacing Condition in Experiment 3.
As F&B stated, the number of fixations and the number of gazes per trial should
follow the same pattern as response times. This means that if increases in set size cause
longer response times, more fixations and gazes should also occur. This pattern of results
is seen in the current study. On average, there were 7.81 fixations made per trial (SD =
0.52). Figure 15 displays the average number of fixations per trial made by set size and
spacing. The main effects of set size, spacing, and quality on the number of fixations per
trial were significant, F(3, 36) = 63.39, p < 0.001, F(2, 24) = 8.72, p = 0.001, and F(2,
24) = 4.70, p = 0.019. The interaction of spacing and quality approached significance,
F(4, 48) = 2.52, p = 0.053. The interaction of set size and quality and that of set size and
spacing were not significant. In the F&B study, the average number of fixations per trial

was 11.1 as opposed the approximately 8 fixations per trial for the equivalent smallest
spacing condition in this experiment.
0
2
4
6
8
10
12
6 12 18 24
Set Size
Fix
ati
on
s p
er
Tri
al
Small
Medium
Large
Figure 15. Fixations per Trial by Set Size and Spacing for Experiment 3.
The gazes per trial followed a similar pattern as fixations per trial and response
times, as would be expected. The average number of gazes per trial was 2.43 (SD = 0.10).
Figure 16 shows a comparison of the average number of gazes per trial by set size and
quality for Experiment 3 and F&B’s study. The main effects of set size and quality on
this measure were significant, F(3, 36) = 143.87, p < 0.001 and F(2, 24) = 11.08, p <
0.001. The main effect of spacing approached significance, F(2, 24) = 3.07, p = 0.065.
The interaction of set size and spacing was significant, F(6, 72) = 4.14, p = 0.001, as was
the interaction of spacing and quality, F(4, 48) = 2.63, p = 0.046. The interaction of set
size and quality was not significant. In F&B’s study, participants made an average of 3.3
gazes per trial. The average number of gazes per trial in Experiment 3 was slightly lower

than this. This meant that participants took much longer, but it was not because they
made more gazes.
0
1
2
3
4
5
6
7
6 12 18 24Set Size
Nu
mb
er o
f g
azes
Good - Exp. 3Fair - Exp. 3Poor - Exp. 3Good - F&BFair - F&BPoor - F&B
Figure 16. Number of Gazes per Trial by Set Size and Quality for Experiment 3Smallest Spacing Condition and F&B.
Previous research (Zelinsky & Scheinberg, 1997) has suggested that stimulus
factors such as set size increases may produce longer fixations during searches. Fixation
durations were calculated for Experiment 3 to see if changes in the spacing between
search items could also produce this effect. The average duration of individual fixations
was 52.93 ms (SD = 2.67). Figure 17 shows the average fixation durations for set size by
spacing. The main effects of set size and spacing on fixation duration were significant,
F(3, 36) = 31.08, p < 0.001 and F(2, 24) = 29.72, p < 0.001. The interaction of set size
and spacing was significant, F(6, 72) = 3.48, p = 0.004. The interactions of set size and
quality and of spacing and quality were not significant. In F&B’s work the average

fixation duration was 291 ms, which was noticeably longer than the average in
Experiment 3.
0
20
40
60
80
100
120
6 12 18 24
Set Size
Averag
e F
ixati
on
Du
rati
on
(m
s)
Small
Medium
Large
Figure 17. Average Fixation Duration by Set Size and Spacing for Experiment 3.
Gaze durations were also studied to see if a change such as the spacing between
icons produced longer gazes. For gaze duration, the average length was 157.85 ms (SD =
6.80). Figure 18 shows the average gaze durations by set size and spacing. There were
significant main effects of set size and spacing on gaze duration, F(3, 36) = 27.34, p <
0.001 and F(2, 24) = 35.69, p < 0.001, but not of quality. The interaction of set size and
spacing was significant, F(6, 72) = 2.46, p = 0.032, but that of set size and quality and of
spacing and quality were not significant. This was similar to the average fixation duration
results; as spacing increased, the average gaze duration lengthened.

0
50
100
150
200
250
300
6 12 18 24
Set Size
Avera
ge G
aze D
ura
tio
n (
ms)
Small
Medium
Large
Figure 18. Average Gaze Duration by Set Size and Spacing for Experiment 3.
Target-matching gazes were those gazes that were to a POR region containing an
icon picture identical to the target. This measure revealed whether subjects could
preattentively identify icons with features matching those of the target and focus attention
on these regions. As one-third of the icons in every display matched the target icon, a
target-matching gaze proportion above 0.33 indicated that participants were not randomly
examining icons, but performing a feature-guided search. The average proportion of
target-matching gazes was 0.52 (SD = 0.02), which was above chance level. Figure 19
shows the proportion of target-matching gazes by set size and spacing for Experiment 3.
The main effect of spacing for this proportion was significant, F(2, 24) = 5.38, p = 0.011.
The interaction of set size and spacing was also significant, F(6, 72) = 2.52, p = 0.028.
The main effects of set size and quality were not significant, nor were the interactions of
set size and quality or of spacing and quality. The proportion of target-matching gazes in

the F&B study ranged between 0.45 to 0.6 and the average proportion of 0.52 in
Experiment 3 was within this range. In both F&B’s study and the current experiment
participants studied target-matching icons at a higher rate than would be expected if the
search were randomly directed.
0
0.1
0.2
0.3
0.4
0.5
0.6
0.7
6 12 18 24
Set Size
Targ
et
Matc
hin
g P
rop
ort
ion
Small
Medium
Large
Figure 19. Proportion of Target Matching Gazes by Set Size and Spacing forExperiment 3.
Individual trials can be replayed to show the path of eye movements during the
course of a trial. Figures 20 and 21 are replays of trials from Experiment 3. The path is
marked by a series of dots at regular time intervals. This means dots that are close
together indicate slow movement and widely spaced dots represent rapid eye movements.
The color of the dots is dark at the beginning of the trial and gradually lightens with the
passage of time. This trace was not displayed to participants during the trial. The replays
are also displayed with a grid imposed over the icon display. This grid and the labels for

boxes in the grid were not present during the actual trial. The boxes each represent a POR
region and that was used to divide the screen into discrete areas for data analysis. Figure
20 is a replay from a trial where a participant performed a feature-guided search. The
participant was able to search through the display of icons by examining mostly target-
matching icons. In contrast, Figure 21 is a replay from an undirected search. In this trial,
the participant examined many locations but was not guided by features of the target.
Figure 20. Example of a Feature-Guided Search in a Trial Replay.

Figure 21. Example of an Undirected Search in a Trial Replay.
Revisitation gazes were gazes that were in a POR region that had already been
examined during the current trial. Revisitation proportions were considered to see how
efficient the searches were and also to see whether participants re-examined locations that
had already been searched at a higher rate than in F&B’s study. If the search were truly
efficient, there should not have been any revisitations because all targets would have been
recognized the first time they were examined and participants would have remembered
where they had searched. The average revisitation proportion in Experiment 3 was 0.05
(SD = 0.01). For this measure, there were no main effects or interactions that were
significant. The main effect of set size approached significance, F(3, 36) = 2.65, p =
0.064. The main effects of spacing and quality were not significant. The interactions of
set size and spacing, set size and quality, and spacing and quality also were not
significant. In F&B’s study, the proportion of revisitations was less than 0.02 for most

conditions. For the equivalent, smallest spacing condition in the current study, this
proportion averaged 0.04 (SD = 0.01). This meant that there were slightly more
revisitations made in the current study, which could have contributed to the longer
response times. Figure 22 shows a replay with a feature-guided search and many
revisitations.
Figure 22. Example of a Feature-Guided Search with Many Revisitations in a TrialReplay.
Next nearest gazes were when the next gaze in a series of gazes was to a POR
region proximal to the current one. These proportions were examined to see whether
subjects often searched a location next to the one currently being examined in an efficient
search manner, or if the search were more random. For the proportion of next nearest
gazes, the average was 0.54 (SD = 0.03). Figure 23 displays the proportion of next
nearest gazes by set size and spacing. There were significant main effects of set size and
spacing, F(3, 36) = 4.73, p = 0.007 and F(2, 24) = 14.59, p < 0.001, but not of quality.

There were no significant effects of the interactions of set size and spacing, set size and
quality, or spacing and quality.
0
0.1
0.2
0.3
0.4
0.5
0.6
0.7
0.8
6 12 18 24
Set Size
Next
Neare
st
Pro
po
rtio
n
Small
Medium
Large
Figure 23. Proportion of Next Nearest Gazes in Experiment 3.
Next matching gazes were when the next gaze was to a POR region containing an
icon matching the target. The next matching gazes proportion was studied to see whether
participants searched locations guided by icons with features matching the target, as
would be done in an efficient search. A comparison of the proportion of next matching
gazes in F&B’s study and in the equivalent, smallest spacing condition of the current
experiment can be seen in Figure 24. For the proportion of next matching gazes, the
average was 0.48 (SD = 0.02). There were significant main effects of set size, spacing,
and quality, F(3, 36) = 6.76, p = 0.001, F(2, 24) = 24.12, p < 0.001, and F(2, 24) = 4.41,
p = 0.023. The interactions of set size and spacing, set size and quality, and spacing and
quality were not significant.

0
0.1
0.2
0.3
0.4
0.5
0.6
0.7
0.8
6 12 18 24Set Size
Next M
atch
ing
Gazes
Pro
po
rtio
n
Good - Exp. 3Fair - Exp. 3Poor - Exp. 3Good - F&BFair - F&BPoor - F&B
Figure 24. Proportion of Next Matching Gazes in Experiment 3’s Smallest SpacingCondition and F&B by Set Size and Quality.
Next nearest and matching gazes combined the above two properties and thus
were when the next gaze was to a POR region that was proximal to the current region and
also contained a target-matching icon. A high proportion of next nearest and next
matching gazes would be indicative of a very efficient search strategy, such as the one
used in Model 1. The average next nearest and matching proportion was 0.32 (SD =
0.02). Figure 25 shows the proportion of next nearest and matching gazes by set size and
spacing. For this measure, there were significant main effects of set size and spacing, F(3,
36) = 2.98, p = 0.044 and F(2, 24) = 18.62, p < 0.001, but not of quality. The interaction
of set size and spacing was significant, F(6, 72) = 3.32, p = 0.006, but the interactions of
set size and quality and of spacing and quality were not significant. Figure 26 shows the
proportion of next nearest and matching gazes for the best and worst participants.

Although this proportion was higher for the best participant than the worst in all set sizes,
the proportion of next nearest and matching gazes was still much lower than the average
in the F&B work of 0.95 to 0.99.
0
0.1
0.2
0.3
0.4
0.5
0.6
6 12 18 24
Set Size
Next
Neare
st
an
d M
atc
hin
g P
rop
ort
ion
Small
Medium
Large
Figure 25. Proportion of Next Nearest and Matching Gazes in Experiment 3.

0
0.1
0.2
0.3
0.4
0.5
0.6
0.7
6 12 18 24Set Size
Next
Neare
st
an
d M
atc
hin
g P
rop
ort
ion
Best
Worst
Figure 26. Proportion of Next Nearest and Matching Gazes for the Best and WorstParticipant in Experiment 3.
The proportion of response time that was accounted for by fixation times was
computed to see whether a large part of the response time was spent in actual fixations, as
measured by the current eye-tracking system. If this proportion were low, it could mean
that the visual search behavior of participants was not being appropriately captured by the
eye-tracker system. Also, we would expect to see the same pattern of results in this
proportion as in the total response time data. This means that as set size increases,
spacing increases, and quality decreases, there should be more response time due to
fixations. The amount of response time accounted for by fixation time was 369 ms on
average (SD = 25), or a proportion of 0.08 (SD = 0.01). Figure 26 shows the amount of
response time that was accounted for by fixation times for the smallest spacing condition.
For this measure, the main effects of set size and spacing were significant, F(3, 36) =

40.94, p < 0.001 and F(2, 24) = 44.60, p < 0.001, and the main effect of quality
approached significance, F(2, 24) = 3.04, p = 0.067. The interaction of set size and
spacing was significant, F(6, 72) = 3.42, p = 0.005, but those of set size and quality and
of spacing and quality were not. In the current study, this small proportion of response
time accounted for by fixation times meant that much of what contributed to the longer
response times was not captured by the eye-tracker system.
This finding that much of the response time was not due to actual fixation times
was highly surprising and perhaps it reflects a behavioral change in participant’s
performance due to the larger spacing. Figure 27 shows the response time accounted for
by fixation times and Figure 28 shows the response time not accounted for by fixation
times. In Figure 27, the typical set size effect is seen, but the quality effect is mostly
missing. In Figure 28, however, the usual effects of set size and of quality are quite
apparent, supporting the idea that the eye tracker system could not provide information
that would explain the differences seen in the current studies.

0
100
200
300
400
500
600
6 12 18 24
Set Size
RT d
ue t
o F
ixatio
n T
imes (
ms)
GoodFairPoor
Figure 27. Response Time Accounted for by Fixation Time in the Smallest SpacingCondition of Experiment 3.
0
1000
2000
3000
4000
5000
6000
6 12 18 24
Set Size
RT N
OT d
ue t
o F
ixatio
n T
imes
(m
s)
Good
Fair
Poor
Figure 28. Response Time NOT Accounted for by Fixation Time in the SmallestSpacing Condition of Experiment 3.

Discussion
The primary purpose of Experiment 3 was to record eye-tracking data of
participants performing the visual search task in the presence of larger, variable spacing.
This was done so that the differences in search behavior between that observed in F&B’s
work and in the experiments reported in this paper could be studied. In Experiment 3,
there were fewer fixations made per trial, shorter fixation durations, slightly more
revisitations made, and fewer next nearest and matching gazes than in F&B’s study in the
equivalent condition.
Although the response times in Experiment 3 were longer than either model
predicted, they did follow the general trend that the models predicted for spacing: wider
spacing increased search times. Also both models predicted that search behavior should
be guided by icons with features matching the target, especially for the good icons.
Experiment 3 results also showed the predicted set size effect. However, this experiment
produced results that were more similar to the predictions of Model 2 than Model 1. The
search strategy that participants seemed to use was not the very efficient one used in
Model 1. Instead, participants took longer than this model would predict, indicating that
they were not simply moving from one text label to another guided by the nearest icon
with features matching the target. Participants only moved to the next nearest and
matching icon on 34% of trials. This behavior is more similar to that produced by Model
2, where the constraint of moving to the nearest icon with features matching the target is
relaxed.
Overall, however, the response times from Experiment 3 were longer than either
model would have predicted. The differences found in the eye-tracking data between this

and F&B’s study did not explain the magnitude of the response time change produced by
the larger spacing. The effect of spacing was not seen in the amount of response time
accounted for by fixation times, but in the response time “leftovers,” when participants
were not fixating on a specific location. Because there were fewer and shorter fixations
recorded in this Experiment, it seems like likely that the spacing caused a significant
change in users’ behavior.
Figure 29 and the similar Figure 21 seen earlier in this paper are examples of
replays in which many fewer fixations occurred than would be expected. The dots
indicating the path of eye movements are much more evenly spaced during the search
than would be expected when participants are searching for a target and examining icons.
This type of movement looks more similar to smooth pursuit eye movements than the
saccadic eye movements typically seen in visual search patterns. Khurana and Kowler
(1987) found that when there are two experimental tasks, one that requires visual
attention to be allocated to a smooth pursuit task and the other that is a visual search task,
performance on the visual search task suffered. In the current study, this smooth-pursuit-
like movement occurred relatively infrequently, but performance on the visual search task
was much slower than expected. This suggests that perhaps this type of eye movement
could have contributed partially to the degraded search performance.

Figure 29. Trial Replay In Which Relatively Few Fixations Were Made.
However, as Chen, Holzman, and Nakayama (2002) state, the visual detection of
a moving target is a necessary component of smooth pursuit eye movements and in the
current studies, there were no moving objects. Even if there was not an actual switch to a
smooth pursuit type of movement, the patterns of eye movements could have been
different enough from the typical saccadic eye movements that the eye-tracking system
recorded fixations inappropriately.
GENERAL DISCUSSION
First, these results replicate the Fleetwood and Byrne work (Fleetwood, 2001;
Fleetwood & Byrne, 2002; in press) by showing that icons with varying degrees of
feature overlap produce different search slopes. Of more interest is the finding that
varying the spacing between icons increased search times, as predicted by the ACT-R

model. However, it did not do so in the anticipated way. Users in Experiment 1 were
substantially slower than was predicted by the original ACT-R model. This suggests that
when the amount of spacing changes, users employ a different search strategy to find the
target icon. Perhaps this change is caused in part by the inability of participants to get as
much information about icons preattentively as they can when smaller spacing allows
more information to be gained from the periphery. The strategy change had a fairly
dramatic time cost associated with it, and indeed giving the ACT-R model a less efficient
search strategy produced a closer fit to the experimental data. The findings from
Experiment 2 replicated this increase in search time as a function of spacing, strongly
suggesting a search strategy change when the spacing between icons changed.
From Experiments 1 and 2, it was not clear exactly what type of strategy change
was caused by the larger spacing between icons. Experiment 3 used eye tracking in an
attempt to explain what part of participants search behavior changed due to the larger
spacing. Unfortunately, the eye-tracking system does not seem to be able to explain this
behavior change. It recorded fewer fixations than in the F&B work and these fixations
were of shorter duration. The effect of spacing was seen not in the proportion of response
time accounted for by fixations, but only in the response times with the fixation times
removed. Because of this, it appears that the larger, variable spacing used in this
experiment caused a cognitive change, not a simple change in visual search strategy.
Perhaps the eye-tracker cannot provide information about the cause of longer response
times because the larger spacing actually affects a higher-order cognitive process. A
possible explanation is that subjects used a different decision criterion for when they
chose to examine icons and read their filenames. Another possibility is that participants

were, in effect, more selective in deciding when to pause and examine a region of
interest. This would not show up in many of the measures used to evaluate visual search
performance, but it could lead to longer response times.
A final and more probable explanation for the small proportion of response time
accounted for by fixation times is that there were hardware/software issues with the eye-
tracking system such that appropriate data could not be captured. The software may be
using an inappropriate algorithm for determining when fixations occur in situations such
as this one. Perhaps the system cannot accurately capture visual search behavior because
it uses criteria for deciding a fixation has occurred that are too strict and rigid under the
conditions produced in this experiment. Figure 30 shows a replay for which only 4
fixations and 3 gazes were reported by the eye-tracking analysis software, but for which
it looks as if more actually occurred. It also could be with the larger spacing, the speed
with which eye movements or fixations occur is different than with the smaller spacing
and the hardware is not equipped to deal with these differences. This might explain why
there were fewer and shorter fixations recorded in Experiment 3 than would be
anticipated given the lengthy search times.

Figure 30. Example of a Trial Replay for which the Number of Fixations and GazesReported Seems Inaccurate.
Based on the eye-tracking results of Experiment 3, the visual searches participants
performed with the larger, variable spacing can be compared to the types of searches
explained by prominent visual search theories. Fewer fixations and gazes per trial for the
good quality icons demonstrate behavior along the lines of a parallel search, as described
in Treisman and Gelade’s (1980) feature integration theory. More complex and less
distinct (lower quality) icons seem to require more time for the combination of features to
form a complete representation of the object.
This also relates to Wolfe’s Guided Search (1994) model in that because more
information is needed to identify lower quality icons as targets, serial searches must occur
that are guided by the basic feature information gained in the original, global search.
However, the results from Experiment 3 question one aspect of Guided Search 2.0 (GS2).
Once this model examines a location and decides that it does not contain the target, the
location is removed from further consideration. The eye-tracking results obtained in

Experiment 3, however, show that revisitations do occur. Revisitation rates were higher
in the current study even for the smallest spacing condition than in F&B’s equivalent
condition so the larger, variable spacing caused participants to re-examine locations more
frequently. This means that the revisited locations were not removed from consideration
as in GS2, perhaps because participants did not remember all the locations they have
searched.
CONCLUSION
Whatever the actual cause of the visual search behavior change seen in these
experiments, there was a considerable change that significantly affected response times.
This change seen in Experiments 1, 2, and 3 highlights the importance of understanding
that the visual layout of a computer screen can greatly affect a user’s performance. Subtle
manipulations can have surprisingly large impacts on overall performance; in Experiment
2 at the largest set size, users in the VS condition were almost 20% slower than users in
the FS condition. When one considers high-risk environments such as automobiles or
even how many times per day most users search for icons on computer screens, it is easy
to see how this could have a substantial impact on safety and productivity. Based on the
findings of these studies, designers should be careful to use small, consistent spacing
between items on computer displays. Even if preserving screen real estate is not a
primary design concern, the optimal layout of items may not maximize the screen area
used. Instead, better performance in visual search and selection tasks such as the one
studied in this work will be performed more quickly if small, consistent spacing between
items is maintained.

REFERENCES
Anderson, J. R., Bothell, D., Byrne M. D., Douglass, S., Lebiere, C., & Quin, Y. (2004).An Integrated Theory of the Mind. Psychological Review, 111, 1036-1060.
Beck, J. & Ambler, B. (1973). The Effects of Concentrated and Distributed Attention onPeripheral Acuity. Perception & Psychophysics, 14(2), 225-230.
Burns, C. M. (2000). Navigation Strategies with Ecological Displays. InternationalJournal of Human-Computer Studies, 52, 111-129.
Byrne, M. D. (1993). Using Icons to Find Documents: Simplicity is Critical. Proceedingsof ACM INTERCHI’93 Conference on Human Factors in Computing Systems,446-453.
Byrne, M. D., Anderson, J. R., Douglass, S. & Matessa, M. (1999). Eye Tracking theVisual Search of Click-Down Menus. Proceedings of the CHI ’99 Conference onHuman Factors in Computing Systems, 402-409. ACM Press.
Chen, Y., Holzman, P. S., & Nakayama, K. (2002). Visual and Cognitive Control ofAttention in Smooth Pursuit. Progress in Brain Research, 140. The Brain’s Eye:Neurobiological and Clinical Aspects of Oculomotor Research, 255-265.
Cohen, A. & Ivry, R. B. (1991). Density Effects in Conjunction Search: Evidence for aCoarse Location Mechanism of Feature Integration. Journal of ExperimentalPsychology: Human Perception and Performance, 17(4), 891-901.
Deco, G., Pollatos, O., & Zihl, J. (2002). The Time Course of Selective Visual Attention:Theory and Experiments. Vision Research, 42, 2925-2945.
Fleetwood, M. D. (2001). Computational Modeling of Icon Search. Master’s Thesis, RiceUniversity, Houston, TX.
Fleetwood M. D. & Byrne, M. D. (2002). Modeling Icon Search in ACT-R/PM.Cognitive Systems Research, 3, 25-33.
Fleetwood, M. D. & Byrne, M. D. (in press). Modeling the Visual Search of Displays: ARevised ACT-R/PM Model of Icon Search Based on Eye-Tracking Data. HumanComputer Interaction.

Gray, W. D. & Boehm-Davis, D. A. (2000). Milliseconds Matter: An Introduction toMicrostrategies and to Their Use in Describing and Predicting InteractiveBehavior. Journal of Experimental Psychology: Applied, 6(4), 322-335.
Green, A. J. K. & Barnard, P. J. (1990). Iconic Interfacing: The Role of IconDistinctiveness and Fixed or Variable Screen Location. Proceedings of IFIPINTERACT’90: Human-Computer Interaction, 457-462.
Grice, G. R. & Hunter, J. J. (1964). Stimulus Intensity Effects Depend Upon the Type ofExperimental Design. Psychological Review, 71(4), 247-256.
Hornof, A. J. (2001). Visual Search and Mouse Pointing in Labeled Versus UnlabeledTwo-Dimensional Visual Hierarchies. ACM Transactions on Computer-HumanInteraction, 8, 171-197.
Hornof, A. J. & Halverson, T. (2003). Cognitive Strategies and Eye Movements forsearching hierarchical Computer Displays. Proc. Proceedings of the CHI ‘03Conference on Human Factors in Computing Systems, 249-256. ACM Press.
Horton, W. (1996). Designing Icons and Visual Symbols. Tutorial. CHI ’96 Conferenceon Human Factors in Computing Systems,
Khurana, B. & Kowler, E. (1987). Shared Attentional Control of Smooth Pursuit EyeMovement and Perception. Vision Research, 27, 1603-1618.
McDougall, S. J. P., de Bruijn, O., & Curry, M. B. (2000). Exploring the Effects of IconCharacteristics on User Performance: The Role of Icon Concreteness,Complexity, and Distinctiveness. Journal of Experimental Psychology: Applied,6(4), 291-306.
Motter, B. C. & Belky, E. J. (1998a). The Zone of Focal Attention During Active VisualSearch. Vision Research, 38(7), 1007-1022.
Motter, B. C. & Belky, E. J. (1998b). The Guidance of Eye Movements During ActiveVisual Search. Vision Research, 38, 1805-1815.
Reichle, E. D., Pollatsek, A., Fisher, D. L., & Rayner, K. (1998). Toward a Model of EyeMovement Control in Reading. Psychological Review, 105(1), 125-157.

Salvucci, D. D. (2001). EMMA: An Integrated Model of Eye Movements and VisualAttention. Cognitive Systems Research, 1, 201-220.
Smallman, H. S. & Boynton, R. M. (1990). Segregation of Basic Colors in anInformation Display. Journal of the Optical Society of America. A, Optics, imagescience, and vision, 7(10), 1985-1994.
Staggers, N. (1993). Impact of Screen Density on Clinical Nurses’ Computer TaskPerformance and Subjective Screen Satisfaction. International Journal of Man-Machine Studies, 39, 775-792.
Thacker, P. P. (1986). Tabular displays: A Human Factors Study. Doctorial dissertation,University of South Florida, Tampa, FL.
Treisman, A. (1982). Perceptual Grouping and Attention in Visual Search for Featuresand for Objects. Journal of Experimental Psychology: Human Perception andPerformance, 8(2), 194-214.
Treisman, A. M. & Gelade, G. (1980). A Feature-Integration Theory of Attention.Cognitive Psychology, 12, 107-141.
Tullis, T. S. (1997). Screen Design. Handbook of Human-Computer Interaction. 2nd ed.Helander, M., Landauer, T. K., & Trabhu, P. (eds.). Elviser: New York.
Wolfe, J. M. (1994). Guided Search 2.0: A Revised Model of Visual Search.Psychonomic Bulletin & Review, 1 (2), 202-238.
Zelinsky, G. J. & Sheinberg, D. L. (1997). Eye Movements During Parallel-Serial VisualSearch. Journal of Experimental Psychology: Human Perception andPerformance, 23(1), 244-262.

APPENDIX
Icon Qualities
Poor
Fair
Good