Rice Tables - University of Nevada, Reno · PDF fileResidual 2,311 2,311 2,311 2,311 2,311...
14
Rice Tables
Transcript of Rice Tables - University of Nevada, Reno · PDF fileResidual 2,311 2,311 2,311 2,311 2,311...

Rice Tables


Rice Trade Rice Trade
05/06 06/07 07/08 08/09 09/10 10/11 11/12 12/13 13/14 14/15 15/16
(Thousand metric tons) (Thousand metric tons)
Net exporters
Argentina 477 445 434 548 481 698 588 532 462 307 555
Australia 232 -32 -152 -200 -169 232 324 288 230 153 -20
India 4,682 5,740 4,654 2,090 2,082 2,774 10,376 10,869 10,619 12,238 10,240
Thailand 7,374 9,554 10,003 8,270 8,747 10,447 6,345 6,122 10,669 9,479 9,200
United States 3,116 2,270 2,577 2,422 2,912 2,934 2,585 2,716 2,271 2,278 2,655
Total net exports 15,881 17,977 17,516 13,130 14,053 17,085 20,218 20,527 24,251 24,455 22,630
Net importers
Brazil 476 490 -128 106 186 -847 -223 -199 -289 -538 200
China -562 -868 -927 -546 -262 40 1,349 2,809 3,740 4,274 4,529
EU-28 972 1,201 1,427 1,210 1,096 1,153 1,092 1,192 1,288 1,434 1,531
Indonesia 539 2,000 350 240 1,150 3,098 1,960 650 1,225 1,350 1,100
Japan 531 558 436 467 504 611 422 566 599 565 620
Malaysia 751 873 1,036 1,085 906 1,075 1,006 874 952 978 900
Mexico 579 594 572 578 602 710 645 751 696 707 691
South Korea -4 94 254 253 297 401 377 508 311 463 338
Rest of world 9,490 10,294 13,081 8,190 6,493 8,832 9,160 10,773 11,299 12,775 11,009
Total net imports 12,772 15,236 16,101 11,583 10,972 15,073 15,788 17,924 19,821 22,008 20,918
Residual 3,109 2,741 1,415 1,547 3,081 2,012 4,430 2,603 4,430 2,447 1,712
(Dollars per metric ton) (Dollars per metric ton)
Rice price, FOB Bangkok 301 320 551 609 533 518 590 565 428 420 378
World Rice Supply & Utilization World Rice Supply & Utilization
05/06 06/07 07/08 08/09 09/10 10/11 11/12 12/13 13/14 14/15 15/16
(Million hectares) (Million hectares)
Area Harvested 154.2 154.3 155.0 158.5 155.8 158.2 160.4 158.8 161.6 160.9 159.2
(Metric tons per hectare) (Metric tons per hectare)
Yield, milled basis 2.71 2.72 2.80 2.84 2.83 2.85 2.91 2.97 2.96 2.97 2.97
(Million metric tons) (Million metric tons)
Supply 504.6 511.8 525.1 542.4 544.6 560.6 583.5 597.2 612.0 614.4 608.0
Production 417.9 420.1 433.6 449.9 440.7 450.4 467.6 472.5 478.3 478.6 472.4
Beginning stocks 74.0 76.5 75.4 80.9 92.9 95.1 100.1 106.8 113.9 113.9 114.7
Net imports 12.8 15.2 16.1 11.6 11.0 15.1 15.8 17.9 19.8 22.0 20.9
Utilization 488.7 493.8 507.6 529.3 530.5 543.5 563.3 576.7 587.8 590.0 585.3
Consumption 412.3 418.5 426.7 436.4 435.4 443.4 456.5 462.8 473.9 475.3 468.8
Ending stocks 76.5 75.4 80.9 92.9 95.1 100.1 106.8 113.9 113.9 114.7 116.5
Net exports 15.9 18.0 17.5 13.1 14.1 17.1 20.2 20.5 24.3 24.5 22.6
Total Demand 504.6 511.8 525.1 542.4 544.6 560.6 583.5 597.2 612.0 614.4 608.0

Rice Trade
16/17 17/18 18/19 19/20 20/21 21/22 22/23 23/24 24/25 25/26 26/27
(Thousand metric tons)
Net exporters
Argentina 536 457 436 427 422 418 414 411 411 414 419
Australia 248 294 302 307 310 310 306 297 288 277 266
India 10,395 10,119 10,671 10,774 10,977 11,353 11,839 12,346 12,827 13,282 13,728
Thailand 9,479 8,637 8,699 8,914 9,089 9,211 9,273 9,352 9,410 9,460 9,531
United States 2,776 2,970 3,074 2,994 2,987 3,059 3,149 3,192 3,251 3,299 3,357
Total net exports 23,433 22,477 23,182 23,415 23,786 24,351 24,980 25,599 26,187 26,732 27,301
Net importers
Brazil 42 189 178 284 214 138 104 105 68 39 13
China 4,672 3,656 3,643 3,638 3,640 3,649 3,663 3,662 3,662 3,659 3,648
EU-28 1,581 1,513 1,593 1,604 1,599 1,594 1,589 1,571 1,555 1,540 1,518
Indonesia 1,078 597 1,065 1,299 1,508 1,727 1,938 2,116 2,273 2,403 2,497
Japan 617 611 607 607 607 607 607 607 607 607 607
Malaysia 905 955 999 1,034 1,079 1,115 1,151 1,184 1,217 1,248 1,277
Mexico 750 765 791 799 808 811 814 816 820 825 830
South Korea 409 409 409 409 409 409 409 409 410 414 418
Rest of world 11,069 11,471 11,586 11,430 11,611 11,991 12,395 12,819 13,265 13,685 14,181
Total net imports 21,122 20,166 20,871 21,104 21,475 22,040 22,669 23,288 23,876 24,421 24,990
Residual 2,311 2,311 2,311 2,311 2,311 2,311 2,311 2,311 2,311 2,311 2,311
(Dollars per metric ton)
Rice price, FOB Bangkok 390 393 377 394 401 402 395 396 394 392 394
World Rice Supply & Utilization
16/17 17/18 18/19 19/20 20/21 21/22 22/23 23/24 24/25 25/26 26/27
(Million hectares)
Area Harvested 161.3 161.6 160.7 159.7 159.8 160.3 160.7 160.7 160.8 160.9 160.9
(Metric tons per hectare)
Yield, milled basis 2.98 3.03 3.06 3.09 3.12 3.15 3.17 3.20 3.23 3.26 3.29
(Million metric tons)
Supply 617.6 629.2 635.8 639.7 645.4 652.9 660.8 668.1 675.4 682.4 689.5
Production 480.0 488.8 491.2 493.1 498.1 504.2 510.0 514.9 519.9 524.7 529.6
Beginning stocks 116.5 120.2 123.8 125.4 125.8 126.7 128.2 129.9 131.6 133.3 135.0
Net imports 21.1 20.2 20.9 21.1 21.5 22.0 22.7 23.3 23.9 24.4 25.0
Utilization 594.2 606.7 612.7 616.3 621.6 628.6 635.8 642.5 649.2 655.7 662.2
Consumption 474.0 482.9 487.2 490.5 494.9 500.4 505.9 510.9 515.9 520.7 525.7
Ending stocks 120.2 123.8 125.4 125.8 126.7 128.2 129.9 131.6 133.3 135.0 136.5
Net exports 23.4 22.5 23.2 23.4 23.8 24.4 25.0 25.6 26.2 26.7 27.3
Total Demand 617.6 629.2 635.8 639.7 645.4 652.9 660.8 668.1 675.4 682.4 689.5

Argentina Rice Supply & Utilization Argentina Rice Supply & Utilization
05/06 06/07 07/08 08/09 09/10 10/11 11/12 12/13 13/14 14/15 15/16
(Thousand hectares) (Thousand hectares)
Area Harvested 169 162 183 194 215 257 235 233 241 231 208
(Metric tons per hectare) (Metric tons per hectare)
Yield, milled basis 4.52 4.27 4.43 4.47 3.28 4.35 4.29 4.35 4.26 4.39 4.38
(Thousand metric tons) (Thousand metric tons)
Supply 961 850 890 998 826 1,193 1,153 1,189 1,254 1,336 1,439
Production 764 691 810 867 706 1,118 1,008 1,014 1,027 1,014 910
Beginning stocks 197 159 80 131 120 75 145 175 227 322 529
Utilization 484 405 456 450 345 495 565 657 792 1,029 884
Consumption 325 325 325 330 270 350 390 430 470 500 520
Ending stocks 159 80 131 120 75 145 175 227 322 529 364
Net exports 477 445 434 548 481 698 588 532 462 307 555
Total Demand 961 850 890 998 826 1,193 1,153 1,189 1,254 1,336 1,439
Australia Rice Supply & Utilization Australia Rice Supply & Utilization
05/06 06/07 07/08 08/09 09/10 10/11 11/12 12/13 13/14 14/15 15/16
(Thousand hectares) (Thousand hectares)
Area Harvested 102 20 2 7 19 76 103 114 75 70 23
(Metric tons per hectare) (Metric tons per hectare)
Yield, milled basis 7.02 5.90 6.50 6.29 7.47 6.86 6.43 7.33 7.87 7.10 7.83
(Thousand metric tons) (Thousand metric tons)
Supply 1,147 633 243 96 168 567 689 876 828 738 403
Production 716 118 13 44 142 521 662 836 590 497 180
Beginning stocks 431 515 230 52 26 46 27 40 238 241 223
Utilization 915 665 395 296 337 335 365 588 598 585 423
Consumption 400 435 343 270 291 308 325 350 357 362 350
Ending stocks 515 230 52 26 46 27 40 238 241 223 73
Net exports 232 -32 -152 -200 -169 232 324 288 230 153 -20
Total Demand 1,147 633 243 96 168 567 689 876 828 738 403
Brazil Rice Supply & Utilization Brazil Rice Supply & Utilization
05/06 06/07 07/08 08/09 09/10 10/11 11/12 12/13 13/14 14/15 15/16
(Thousand hectares) (Thousand hectares)
Area Harvested 2,996 2,967 2,874 2,909 2,765 2,833 2,427 2,390 2,400 2,295 2,010
(Metric tons per hectare) (Metric tons per hectare)
Yield, milled basis 2.63 2.59 2.85 2.95 2.87 3.28 3.25 3.36 3.46 3.69 3.59
(Thousand metric tons) (Thousand metric tons)
Supply 9,930 9,315 8,986 9,312 9,027 9,003 8,468 8,378 8,539 8,566 8,051
Production 7,874 7,695 8,199 8,570 7,929 9,300 7,888 8,037 8,300 8,465 7,210
Beginning stocks 1,580 1,130 915 636 912 550 803 540 528 639 641
Net imports 476 490 -128 106 186 -847 -223 -199 -289 -538 200
Utilization 9,930 9,315 8,986 9,312 9,027 9,003 8,468 8,378 8,539 8,566 8,051
Consumption 8,800 8,400 8,350 8,400 8,477 8,200 7,928 7,850 7,900 7,925 7,800
Ending stocks 1,130 915 636 912 550 803 540 528 639 641 251

Argentina Rice Supply & Utilization
16/17 17/18 18/19 19/20 20/21 21/22 22/23 23/24 24/25 25/26 26/27
(Thousand hectares)
Area Harvested 209 211 209 206 203 201 198 196 194 193 192
(Metric tons per hectare)
Yield, milled basis 4.55 4.56 4.63 4.71 4.78 4.85 4.93 5.00 5.08 5.15 5.23
(Thousand metric tons)
Supply 1,314 1,231 1,221 1,221 1,226 1,232 1,237 1,242 1,249 1,259 1,271
Production 950 963 970 970 972 975 977 979 985 992 1,003
Beginning stocks 364 269 251 251 254 256 260 263 265 267 268
Utilization 778 774 785 795 804 814 823 831 838 845 852
Consumption 509 523 534 541 547 554 560 566 571 577 582
Ending stocks 269 251 251 254 256 260 263 265 267 268 270
Net exports 536 457 436 427 422 418 414 411 411 414 419
Total Demand 1,314 1,231 1,221 1,221 1,226 1,232 1,237 1,242 1,249 1,259 1,271
Australia Rice Supply & Utilization
16/17 17/18 18/19 19/20 20/21 21/22 22/23 23/24 24/25 25/26 26/27
(Thousand hectares)
Area Harvested 90 95 98 98 99 98 98 96 95 93 92
(Metric tons per hectare)
Yield, milled basis 7.36 7.26 7.33 7.40 7.47 7.54 7.61 7.67 7.74 7.81 7.88
(Thousand metric tons)
Supply 735 803 842 864 885 903 915 921 924 924 922
Production 662 688 719 727 736 742 744 740 735 729 722
Beginning stocks 73 116 123 137 149 160 171 181 189 195 200
Utilization 487 509 540 558 575 592 610 624 636 647 655
Consumption 372 386 403 409 415 421 429 435 441 447 453
Ending stocks 116 123 137 149 160 171 181 189 195 200 203
Net exports 248 294 302 307 310 310 306 297 288 277 266
Total Demand 735 803 842 864 885 903 915 921 924 924 922
Brazil Rice Supply & Utilization
16/17 17/18 18/19 19/20 20/21 21/22 22/23 23/24 24/25 25/26 26/27
(Thousand hectares)
Area Harvested 1,950 2,142 2,116 2,039 2,019 2,003 1,975 1,937 1,911 1,884 1,855
(Metric tons per hectare)
Yield, milled basis 4.01 3.60 3.68 3.75 3.83 3.91 3.99 4.06 4.14 4.22 4.29
(Thousand metric tons)
Supply 8,113 8,165 8,233 8,222 8,233 8,249 8,264 8,269 8,282 8,294 8,297
Production 7,820 7,710 7,782 7,656 7,736 7,827 7,871 7,867 7,911 7,943 7,966
Beginning stocks 251 266 273 283 283 284 289 296 303 311 318
Net imports 42 189 178 284 214 138 104 105 68 39 13
Utilization 8,113 8,165 8,233 8,222 8,233 8,249 8,264 8,269 8,282 8,294 8,297
Consumption 7,847 7,892 7,950 7,939 7,949 7,960 7,968 7,966 7,971 7,975 7,973
Ending stocks 266 273 283 283 284 289 296 303 311 318 325

China Rice Supply & Utilization China Rice Supply & Utilization
05/06 06/07 07/08 08/09 09/10 10/11 11/12 12/13 13/14 14/15 15/16
(Thousand hectares) (Thousand hectares)
Area Harvested 28,847 28,938 28,919 29,240 29,627 29,873 30,057 30,137 30,312 30,310 30,210
(Metric tons per hectare) (Metric tons per hectare)
Yield, milled basis 4.38 4.40 4.50 4.59 4.61 4.59 4.68 4.74 4.70 4.77 4.83
(Thousand metric tons) (Thousand metric tons)
Supply 164,783 163,115 165,212 171,546 174,854 177,574 184,623 190,832 196,102 201,936 207,735
Production 126,414 127,200 130,224 134,330 136,570 137,000 140,700 143,000 142,530 144,560 145,770
Beginning stocks 38,931 36,783 35,915 37,762 38,546 40,534 42,574 45,023 49,832 53,102 57,436
Net imports -562 -868 -927 -546 -262 40 1,349 2,809 3,740 4,274 4,529
Utilization 164,783 163,115 165,212 171,546 174,854 177,574 184,623 190,832 196,102 201,936 207,735
Consumption 128,000 127,200 127,450 133,000 134,320 135,000 139,600 141,000 143,000 144,500 144,000
Ending stocks 36,783 35,915 37,762 38,546 40,534 42,574 45,023 49,832 53,102 57,436 63,735
EU-28 Rice Supply & Utilization EU-28 Rice Supply & Utilization
05/06 06/07 07/08 08/09 09/10 10/11 11/12 12/13 13/14 14/15 15/16
(Thousand hectares) (Thousand hectares)
Area Harvested 415 411 423 411 456 482 483 449 432 424 432
(Metric tons per hectare) (Metric tons per hectare)
Yield, milled basis 4.17 4.42 4.51 4.31 4.77 4.51 4.43 4.68 4.48 4.61 4.75
(Thousand metric tons) (Thousand metric tons)
Supply 3,684 3,802 4,185 4,168 4,340 4,465 4,446 4,438 4,413 4,551 4,732
Production 1,731 1,817 1,906 1,773 2,176 2,172 2,139 2,100 1,937 1,954 2,050
Beginning stocks 981 784 852 1,185 1,068 1,140 1,215 1,146 1,188 1,163 1,151
Net imports 972 1,201 1,427 1,210 1,096 1,153 1,092 1,192 1,288 1,434 1,531
Utilization 3,684 3,802 4,185 4,168 4,340 4,465 4,446 4,438 4,413 4,551 4,732
Consumption 2,900 2,950 3,000 3,100 3,200 3,250 3,300 3,250 3,250 3,400 3,550
Ending stocks 784 852 1,185 1,068 1,140 1,215 1,146 1,188 1,163 1,151 1,182
Indonesia Rice Supply & Utilization Indonesia Rice Supply & Utilization
05/06 06/07 07/08 08/09 09/10 10/11 11/12 12/13 13/14 14/15 15/16
(Thousand hectares) (Thousand hectares)
Area Harvested 11,800 11,900 11,900 12,170 12,100 12,075 12,160 12,190 12,100 11,830 12,100
(Metric tons per hectare) (Metric tons per hectare)
Yield, milled basis 2.96 2.97 3.11 3.15 3.01 2.94 3.00 3.00 3.00 3.01 2.99
(Thousand metric tons) (Thousand metric tons)
Supply 38,946 40,507 41,957 44,157 44,577 45,175 45,591 44,603 44,001 42,411 41,411
Production 34,959 35,300 37,000 38,310 36,370 35,500 36,500 36,550 36,300 35,560 36,200
Beginning stocks 3,448 3,207 4,607 5,607 7,057 6,577 7,131 7,403 6,476 5,501 4,111
Net imports 539 2,000 350 240 1,150 3,098 1,960 650 1,225 1,350 1,100
Utilization 38,946 40,507 41,957 44,157 44,577 45,175 45,591 44,603 44,001 42,411 41,411
Consumption 35,739 35,900 36,350 37,100 38,000 38,044 38,188 38,127 38,500 38,300 37,900
Ending stocks 3,207 4,607 5,607 7,057 6,577 7,131 7,403 6,476 5,501 4,111 3,511

China Rice Supply & Utilization
16/17 17/18 18/19 19/20 20/21 21/22 22/23 23/24 24/25 25/26 26/27
(Thousand hectares)
Area Harvested 30,160 29,762 29,536 29,336 29,213 29,103 28,986 28,858 28,718 28,571 28,422
(Metric tons per hectare)
Yield, milled basis 4.80 4.85 4.89 4.93 4.97 5.01 5.06 5.10 5.14 5.18 5.22
(Thousand metric tons)
Supply 213,257 216,699 217,954 218,814 219,783 220,858 221,981 223,103 224,213 225,311 226,391
Production 144,850 144,236 144,381 144,634 145,255 145,931 146,562 147,130 147,622 148,068 148,487
Beginning stocks 63,735 68,807 69,930 70,542 70,888 71,278 71,757 72,311 72,929 73,584 74,256
Net imports 4,672 3,656 3,643 3,638 3,640 3,649 3,663 3,662 3,662 3,659 3,648
Utilization 213,257 216,699 217,954 218,814 219,783 220,858 221,981 223,103 224,213 225,311 226,391
Consumption 144,450 146,769 147,412 147,926 148,505 149,101 149,670 150,173 150,630 151,056 151,459
Ending stocks 68,807 69,930 70,542 70,888 71,278 71,757 72,311 72,929 73,584 74,256 74,932
EU-28 Rice Supply & Utilization
16/17 17/18 18/19 19/20 20/21 21/22 22/23 23/24 24/25 25/26 26/27
(Thousand hectares)
Area Harvested 439 447 447 444 443 442 442 441 440 440 439
(Metric tons per hectare)
Yield, milled basis 4.67 4.77 4.81 4.85 4.88 4.92 4.96 5.00 5.04 5.08 5.12
(Thousand metric tons)
Supply 4,813 4,808 4,877 4,927 4,975 5,028 5,085 5,132 5,175 5,215 5,245
Production 2,050 2,131 2,150 2,154 2,165 2,178 2,191 2,203 2,218 2,233 2,248
Beginning stocks 1,182 1,165 1,134 1,169 1,211 1,257 1,305 1,357 1,402 1,443 1,479
Net imports 1,581 1,513 1,593 1,604 1,599 1,594 1,589 1,571 1,555 1,540 1,518
Utilization 4,813 4,808 4,877 4,927 4,975 5,028 5,085 5,132 5,175 5,215 5,245
Consumption 3,648 3,674 3,708 3,716 3,718 3,723 3,728 3,730 3,732 3,736 3,737
Ending stocks 1,165 1,134 1,169 1,211 1,257 1,305 1,357 1,402 1,443 1,479 1,508
Indonesia Rice Supply & Utilization
16/17 17/18 18/19 19/20 20/21 21/22 22/23 23/24 24/25 25/26 26/27
(Thousand hectares)
Area Harvested 12,160 12,106 12,076 12,047 12,025 12,007 11,990 11,973 11,958 11,943 11,930
(Metric tons per hectare)
Yield, milled basis 3.01 3.10 3.11 3.13 3.14 3.15 3.17 3.18 3.19 3.21 3.22
(Thousand metric tons)
Supply 41,189 41,709 42,292 42,646 42,977 43,331 43,678 43,993 44,288 44,557 44,790
Production 36,600 37,539 37,608 37,677 37,770 37,875 37,981 38,088 38,198 38,312 38,428
Beginning stocks 3,511 3,573 3,619 3,669 3,700 3,729 3,759 3,789 3,817 3,842 3,866
Net imports 1,078 597 1,065 1,299 1,508 1,727 1,938 2,116 2,273 2,403 2,497
Utilization 41,189 41,709 42,292 42,646 42,977 43,331 43,678 43,993 44,288 44,557 44,790
Consumption 37,615 38,091 38,623 38,946 39,248 39,571 39,889 40,176 40,446 40,691 40,905
Ending stocks 3,573 3,619 3,669 3,700 3,729 3,759 3,789 3,817 3,842 3,866 3,886

India Rice Supply & Utilization India Rice Supply & Utilization
05/06 06/07 07/08 08/09 09/10 10/11 11/12 12/13 13/14 14/15 15/16
(Thousand hectares) (Thousand hectares)
Area Harvested 43,660 43,814 43,914 45,537 41,918 42,862 44,006 42,754 44,136 44,110 43,479
(Metric tons per hectare) (Metric tons per hectare)
Yield, milled basis 2.10 2.13 2.20 2.18 2.13 2.24 2.39 2.46 2.42 2.39 2.40
(Thousand metric tons) (Thousand metric tons)
Supply 100,285 103,865 108,112 112,172 108,083 116,470 128,801 130,341 132,146 128,282 122,120
Production 91,785 93,345 96,682 99,172 89,083 95,970 105,301 105,241 106,646 105,482 104,320
Beginning stocks 8,500 10,520 11,430 13,000 19,000 20,500 23,500 25,100 25,500 22,800 17,800
Utilization 95,603 98,125 103,458 110,082 106,001 113,696 118,425 119,472 121,527 116,044 111,880
Consumption 85,083 86,695 90,458 91,082 85,501 90,196 93,325 93,972 98,727 98,244 93,480
Ending stocks 10,520 11,430 13,000 19,000 20,500 23,500 25,100 25,500 22,800 17,800 18,400
Net exports 4,682 5,740 4,654 2,090 2,082 2,774 10,376 10,869 10,619 12,238 10,240
Total Demand 100,285 103,865 108,112 112,172 108,083 116,470 128,801 130,341 132,146 128,282 122,120
Japan Rice Supply & Utilization Japan Rice Supply & Utilization
05/06 06/07 07/08 08/09 09/10 10/11 11/12 12/13 13/14 14/15 15/16
(Thousand hectares) (Thousand hectares)
Area Harvested 1,706 1,688 1,673 1,629 1,628 1,643 1,610 1,616 1,621 1,608 1,586
(Metric tons per hectare) (Metric tons per hectare)
Yield, milled basis 4.84 4.61 4.74 4.93 4.75 4.74 4.84 4.89 4.89 4.88 4.84
(Thousand metric tons) (Thousand metric tons)
Supply 10,806 10,852 10,895 11,148 11,098 11,208 11,111 11,208 11,387 11,421 11,111
Production 8,257 7,786 7,930 8,036 7,733 7,781 7,792 7,907 7,931 7,849 7,670
Beginning stocks 2,018 2,508 2,529 2,645 2,861 2,816 2,897 2,735 2,857 3,007 2,821
Net imports 531 558 436 467 504 611 422 566 599 565 620
Utilization 10,806 10,852 10,895 11,148 11,098 11,208 11,111 11,208 11,387 11,421 11,111
Consumption 8,298 8,323 8,250 8,287 8,282 8,311 8,376 8,351 8,380 8,600 8,500
Ending stocks 2,508 2,529 2,645 2,861 2,816 2,897 2,735 2,857 3,007 2,821 2,611
Malaysia Rice Supply & Utilization Malaysia Rice Supply & Utilization
05/06 06/07 07/08 08/09 09/10 10/11 11/12 12/13 13/14 14/15 15/16
(Thousand hectares) (Thousand hectares)
Area Harvested 660 645 650 660 670 672 675 688 690 688 690
(Metric tons per hectare) (Metric tons per hectare)
Yield, milled basis 2.18 2.15 2.27 2.33 2.41 2.44 2.50 2.46 2.54 2.62 2.61
(Thousand metric tons) (Thousand metric tons)
Supply 2,506 2,614 2,959 3,230 3,251 3,423 3,429 3,287 3,279 3,332 3,282
Production 1,440 1,385 1,475 1,536 1,615 1,642 1,690 1,694 1,755 1,800 1,800
Beginning stocks 315 356 448 609 730 706 733 719 572 554 582
Net imports 751 873 1,036 1,085 906 1,075 1,006 874 952 978 900
Utilization 2,506 2,614 2,959 3,230 3,251 3,423 3,429 3,287 3,279 3,332 3,282
Consumption 2,150 2,166 2,350 2,500 2,545 2,690 2,710 2,715 2,725 2,750 2,750
Ending stocks 356 448 609 730 706 733 719 572 554 582 532

India Rice Supply & Utilization
16/17 17/18 18/19 19/20 20/21 21/22 22/23 23/24 24/25 25/26 26/27
(Thousand hectares)
Area Harvested 44,500 44,785 43,624 43,096 43,057 43,256 43,510 43,696 43,820 43,922 44,025
(Metric tons per hectare)
Yield, milled basis 2.39 2.51 2.54 2.57 2.60 2.63 2.66 2.69 2.72 2.76 2.79
(Thousand metric tons)
Supply 124,900 130,008 131,072 131,409 132,648 134,732 137,241 139,743 142,087 144,324 146,534
Production 106,500 112,192 110,647 110,656 111,903 113,774 115,803 117,665 119,370 121,022 122,683
Beginning stocks 18,400 17,816 20,425 20,753 20,745 20,958 21,438 22,078 22,717 23,302 23,851
Utilization 114,505 119,889 120,401 120,636 121,671 123,379 125,402 127,397 129,260 131,042 132,806
Consumption 96,689 99,464 99,648 99,891 100,713 101,941 103,324 104,680 105,958 107,191 108,408
Ending stocks 17,816 20,425 20,753 20,745 20,958 21,438 22,078 22,717 23,302 23,851 24,397
Net exports 10,395 10,119 10,671 10,774 10,977 11,353 11,839 12,346 12,827 13,282 13,728
Total Demand 124,900 130,008 131,072 131,409 132,648 134,732 137,241 139,743 142,087 144,324 146,534
Japan Rice Supply & Utilization
16/17 17/18 18/19 19/20 20/21 21/22 22/23 23/24 24/25 25/26 26/27
(Thousand hectares)
Area Harvested 1,570 1,578 1,569 1,555 1,543 1,524 1,505 1,485 1,465 1,446 1,426
(Metric tons per hectare)
Yield, milled basis 4.96 4.97 4.99 5.01 5.03 5.05 5.08 5.10 5.12 5.14 5.16
(Thousand metric tons)
Supply 11,018 10,961 10,917 10,880 10,853 10,814 10,771 10,724 10,674 10,623 10,569
Production 7,790 7,844 7,833 7,797 7,767 7,706 7,639 7,568 7,496 7,426 7,354
Beginning stocks 2,611 2,505 2,477 2,476 2,479 2,502 2,525 2,549 2,571 2,590 2,608
Net imports 617 611 607 607 607 607 607 607 607 607 607
Utilization 11,018 10,961 10,917 10,880 10,853 10,814 10,771 10,724 10,674 10,623 10,569
Consumption 8,513 8,484 8,441 8,402 8,351 8,289 8,222 8,153 8,084 8,014 7,944
Ending stocks 2,505 2,477 2,476 2,479 2,502 2,525 2,549 2,571 2,590 2,608 2,625
Malaysia Rice Supply & Utilization
16/17 17/18 18/19 19/20 20/21 21/22 22/23 23/24 24/25 25/26 26/27
(Thousand hectares)
Area Harvested 695 688 687 684 681 674 667 661 655 650 646
(Metric tons per hectare)
Yield, milled basis 2.62 2.60 2.62 2.64 2.66 2.68 2.70 2.72 2.74 2.76 2.78
(Thousand metric tons)
Supply 3,257 3,252 3,313 3,372 3,440 3,493 3,546 3,596 3,647 3,697 3,745
Production 1,820 1,789 1,801 1,807 1,811 1,807 1,803 1,798 1,796 1,796 1,796
Beginning stocks 532 507 513 531 549 572 593 614 634 653 672
Net imports 905 955 999 1,034 1,079 1,115 1,151 1,184 1,217 1,248 1,277
Utilization 3,257 3,252 3,313 3,372 3,440 3,493 3,546 3,596 3,647 3,697 3,745
Consumption 2,750 2,738 2,782 2,823 2,868 2,901 2,932 2,962 2,993 3,024 3,055
Ending stocks 507 513 531 549 572 593 614 634 653 672 690

Mexico Rice Supply & Utilization Mexico Rice Supply & Utilization
05/06 06/07 07/08 08/09 09/10 10/11 11/12 12/13 13/14 14/15 15/16
(Thousand hectares) (Thousand hectares)
Area Harvested 52 52 71 52 56 39 32 35 35 44 39
(Metric tons per hectare) (Metric tons per hectare)
Yield, milled basis 3.48 3.54 2.86 3.10 3.25 3.74 3.53 3.74 3.74 4.07 3.82
(Thousand metric tons) (Thousand metric tons)
Supply 934 937 918 932 950 1,005 982 1,038 1,020 1,045 1,005
Production 181 184 203 161 182 146 113 131 131 179 149
Beginning stocks 174 159 143 193 166 149 224 156 193 159 165
Net imports 579 594 572 578 602 710 645 751 696 707 691
Utilization 934 937 918 932 950 1,005 982 1,038 1,020 1,045 1,005
Consumption 775 794 725 766 801 781 826 845 861 880 885
Ending stocks 159 143 193 166 149 224 156 193 159 165 120
South Korea Rice Supply & Utilization South Korea Rice Supply & Utilization
05/06 06/07 07/08 08/09 09/10 10/11 11/12 12/13 13/14 14/15 15/16
(Thousand hectares) (Thousand hectares)
Area Harvested 980 955 950 936 924 892 854 849 833 816 799
(Metric tons per hectare) (Metric tons per hectare)
Yield, milled basis 4.87 4.90 4.64 5.17 5.32 4.82 4.95 4.72 5.08 5.20 5.42
(Thousand metric tons) (Thousand metric tons)
Supply 5,581 5,589 5,364 5,790 6,214 6,209 5,635 5,269 5,321 5,603 6,071
Production 4,768 4,680 4,408 4,843 4,916 4,295 4,224 4,006 4,230 4,241 4,327
Beginning stocks 817 815 702 694 1,001 1,513 1,034 755 780 899 1,406
Net imports -4 94 254 253 297 401 377 508 311 463 338
Utilization 5,581 5,589 5,364 5,790 6,214 6,209 5,635 5,269 5,321 5,603 6,071
Consumption 4,766 4,887 4,670 4,789 4,701 5,175 4,880 4,489 4,422 4,197 4,374
Ending stocks 815 702 694 1,001 1,513 1,034 755 780 899 1,406 1,697
Thailand Rice Supply & Utilization Thailand Rice Supply & Utilization
05/06 06/07 07/08 08/09 09/10 10/11 11/12 12/13 13/14 14/15 15/16
(Thousand hectares) (Thousand hectares)
Area Harvested 10,220 10,270 10,830 10,800 10,940 10,667 11,000 10,837 10,920 10,270 9,444
(Metric tons per hectare) (Metric tons per hectare)
Yield, milled basis 1.78 1.78 1.83 1.84 1.85 1.90 1.86 1.86 1.87 1.83 1.67
(Thousand metric tons) (Thousand metric tons)
Supply 20,512 21,844 22,310 22,557 25,047 26,362 26,075 29,530 33,268 30,749 26,770
Production 18,200 18,250 19,800 19,850 20,260 20,262 20,460 20,200 20,460 18,750 15,800
Beginning stocks 2,312 3,594 2,510 2,707 4,787 6,100 5,615 9,330 12,808 11,999 10,970
Utilization 13,138 12,290 12,307 14,287 16,300 15,915 19,730 23,408 22,599 21,270 17,570
Consumption 9,544 9,780 9,600 9,500 10,200 10,300 10,400 10,600 10,600 10,300 9,400
Ending stocks 3,594 2,510 2,707 4,787 6,100 5,615 9,330 12,808 11,999 10,970 8,170
Net exports 7,374 9,554 10,003 8,270 8,747 10,447 6,345 6,122 10,669 9,479 9,200
Total Demand 20,512 21,844 22,310 22,557 25,047 26,362 26,075 29,530 33,268 30,749 26,770

Mexico Rice Supply & Utilization
16/17 17/18 18/19 19/20 20/21 21/22 22/23 23/24 24/25 25/26 26/27
(Thousand hectares)
Area Harvested 42 39 37 34 34 34 35 36 37 38 39
(Metric tons per hectare)
Yield, milled basis 4.12 3.88 3.93 3.98 4.02 4.07 4.12 4.17 4.21 4.26 4.31
(Thousand metric tons)
Supply 1,043 1,067 1,096 1,107 1,118 1,126 1,134 1,141 1,151 1,163 1,174
Production 173 153 145 137 137 140 145 151 157 162 166
Beginning stocks 120 150 160 171 173 175 174 175 174 175 177
Net imports 750 765 791 799 808 811 814 816 820 825 830
Utilization 1,043 1,067 1,096 1,107 1,118 1,126 1,134 1,141 1,151 1,163 1,174
Consumption 893 907 925 934 944 951 959 967 976 986 995
Ending stocks 150 160 171 173 175 174 175 174 175 177 179
South Korea Rice Supply & Utilization
16/17 17/18 18/19 19/20 20/21 21/22 22/23 23/24 24/25 25/26 26/27
(Thousand hectares)
Area Harvested 779 761 751 741 731 721 710 699 687 676 664
(Metric tons per hectare)
Yield, milled basis 5.39 5.25 5.28 5.30 5.33 5.36 5.39 5.41 5.44 5.47 5.50
(Thousand metric tons)
Supply 6,306 6,240 6,201 6,169 6,140 6,110 6,080 6,046 6,010 5,974 5,935
Production 4,200 3,993 3,959 3,928 3,896 3,861 3,823 3,782 3,739 3,694 3,646
Beginning stocks 1,697 1,838 1,832 1,831 1,834 1,840 1,848 1,855 1,861 1,866 1,871
Net imports 409 409 409 409 409 409 409 409 410 414 418
Utilization 6,306 6,240 6,201 6,169 6,140 6,110 6,080 6,046 6,010 5,974 5,935
Consumption 4,468 4,408 4,369 4,334 4,299 4,263 4,225 4,185 4,144 4,103 4,061
Ending stocks 1,838 1,832 1,831 1,834 1,840 1,848 1,855 1,861 1,866 1,871 1,875
Thailand Rice Supply & Utilization
16/17 17/18 18/19 19/20 20/21 21/22 22/23 23/24 24/25 25/26 26/27
(Thousand hectares)
Area Harvested 10,080 10,155 10,155 10,198 10,232 10,239 10,211 10,177 10,132 10,081 10,036
(Metric tons per hectare)
Yield, milled basis 1.85 1.86 1.88 1.90 1.92 1.94 1.96 1.97 1.99 2.01 2.03
(Thousand metric tons)
Supply 26,770 25,886 25,973 26,205 26,434 26,636 26,797 26,970 27,129 27,281 27,447
Production 18,600 18,887 19,081 19,356 19,616 19,824 19,964 20,092 20,198 20,288 20,389
Beginning stocks 8,170 6,998 6,892 6,849 6,818 6,812 6,833 6,878 6,931 6,993 7,058
Utilization 17,291 17,248 17,274 17,291 17,345 17,426 17,525 17,619 17,720 17,821 17,916
Consumption 10,293 10,356 10,425 10,472 10,532 10,593 10,646 10,687 10,727 10,763 10,794
Ending stocks 6,998 6,892 6,849 6,818 6,812 6,833 6,878 6,931 6,993 7,058 7,122
Net exports 9,479 8,637 8,699 8,914 9,089 9,211 9,273 9,352 9,410 9,460 9,531
Total Demand 26,770 25,886 25,973 26,205 26,434 26,636 26,797 26,970 27,129 27,281 27,447

United States Rice Supply & Utilization United States Rice Supply & Utilization
05/06 06/07 07/08 08/09 09/10 10/11 11/12 12/13 13/14 14/15 15/16
(Thousand hectares) (Thousand hectares)
Area Harvested 1,361 1,142 1,112 1,204 1,256 1,463 1,059 1,084 999 1,187 1,046
(Metric tons per hectare) (Metric tons per hectare)
Yield, milled basis 5.22 5.49 5.65 5.44 5.68 5.19 5.54 5.86 6.12 5.99 5.86
(Thousand metric tons) (Thousand metric tons)
Supply 8,312 7,637 7,554 7,481 8,110 8,777 7,380 7,651 7,273 8,131 7,685
Production 7,101 6,267 6,288 6,546 7,133 7,593 5,866 6,348 6,117 7,106 6,133
Beginning stocks 1,211 1,370 1,266 935 977 1,184 1,514 1,303 1,156 1,025 1,552
Utilization 5,196 5,367 4,977 5,059 5,198 5,843 4,795 4,935 5,002 5,853 5,030
Consumption 3,826 4,101 4,042 4,082 4,014 4,329 3,492 3,779 3,977 4,301 3,555
Ending stocks 1,370 1,266 935 977 1,184 1,514 1,303 1,156 1,025 1,552 1,475
Net exports 3,116 2,270 2,577 2,422 2,912 2,934 2,585 2,716 2,271 2,278 2,655
Total Demand 8,312 7,637 7,554 7,481 8,110 8,777 7,380 7,651 7,273 8,131 7,685
Rest of World Rice Supply & Utilization Rest of World Rice Supply & Utilization
05/06 06/07 07/08 08/09 09/10 10/11 11/12 12/13 13/14 14/15 15/16
(Thousand hectares) (Thousand hectares)
Area Harvested 51,246 51,320 51,475 52,739 53,190 54,395 55,731 55,458 56,811 57,045 57,171
(Metric tons per hectare) (Metric tons per hectare)
Yield, milled basis 2.22 2.25 2.31 2.39 2.37 2.34 2.39 2.44 2.47 2.47 2.45
(Thousand metric tons) (Thousand metric tons)
Supply 136,241 140,254 145,524 148,815 148,021 149,150 155,109 158,596 163,209 166,331 166,152
Production 113,675 115,372 118,693 125,899 125,861 127,097 133,270 135,466 140,381 141,096 139,868
Beginning stocks 13,076 14,588 13,750 14,726 15,667 13,221 12,679 12,357 11,529 12,460 15,275
Net imports 9,490 10,294 13,081 8,190 6,493 8,832 9,160 10,773 11,299 12,775 11,009
Utilization 136,241 140,254 145,524 148,815 148,021 149,150 155,109 158,596 163,209 166,331 166,152
Consumption 121,653 126,504 130,798 133,148 134,800 136,471 142,752 147,067 150,749 151,056 151,765
Ending stocks 14,588 13,750 14,726 15,667 13,221 12,679 12,357 11,529 12,460 15,275 14,387
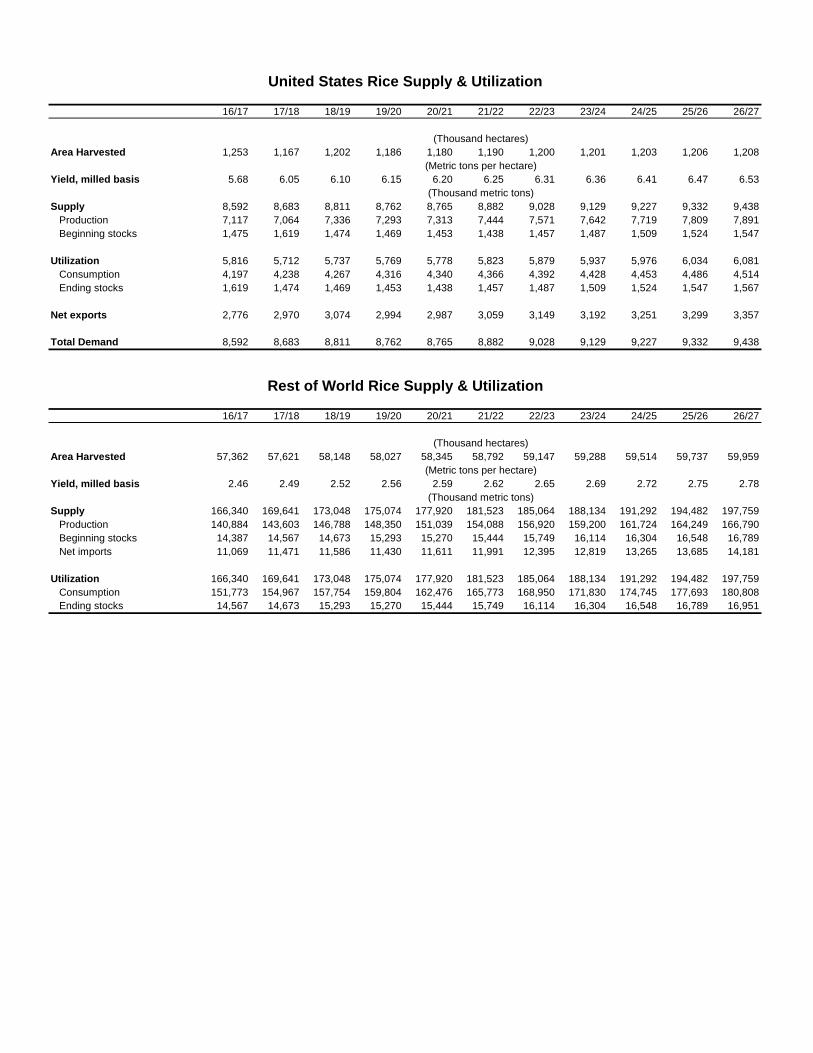
United States Rice Supply & Utilization
16/17 17/18 18/19 19/20 20/21 21/22 22/23 23/24 24/25 25/26 26/27
(Thousand hectares)
Area Harvested 1,253 1,167 1,202 1,186 1,180 1,190 1,200 1,201 1,203 1,206 1,208
(Metric tons per hectare)
Yield, milled basis 5.68 6.05 6.10 6.15 6.20 6.25 6.31 6.36 6.41 6.47 6.53
(Thousand metric tons)
Supply 8,592 8,683 8,811 8,762 8,765 8,882 9,028 9,129 9,227 9,332 9,438
Production 7,117 7,064 7,336 7,293 7,313 7,444 7,571 7,642 7,719 7,809 7,891
Beginning stocks 1,475 1,619 1,474 1,469 1,453 1,438 1,457 1,487 1,509 1,524 1,547
Utilization 5,816 5,712 5,737 5,769 5,778 5,823 5,879 5,937 5,976 6,034 6,081
Consumption 4,197 4,238 4,267 4,316 4,340 4,366 4,392 4,428 4,453 4,486 4,514
Ending stocks 1,619 1,474 1,469 1,453 1,438 1,457 1,487 1,509 1,524 1,547 1,567
Net exports 2,776 2,970 3,074 2,994 2,987 3,059 3,149 3,192 3,251 3,299 3,357
Total Demand 8,592 8,683 8,811 8,762 8,765 8,882 9,028 9,129 9,227 9,332 9,438
Rest of World Rice Supply & Utilization
16/17 17/18 18/19 19/20 20/21 21/22 22/23 23/24 24/25 25/26 26/27
(Thousand hectares)
Area Harvested 57,362 57,621 58,148 58,027 58,345 58,792 59,147 59,288 59,514 59,737 59,959
(Metric tons per hectare)
Yield, milled basis 2.46 2.49 2.52 2.56 2.59 2.62 2.65 2.69 2.72 2.75 2.78
(Thousand metric tons)
Supply 166,340 169,641 173,048 175,074 177,920 181,523 185,064 188,134 191,292 194,482 197,759
Production 140,884 143,603 146,788 148,350 151,039 154,088 156,920 159,200 161,724 164,249 166,790
Beginning stocks 14,387 14,567 14,673 15,293 15,270 15,444 15,749 16,114 16,304 16,548 16,789
Net imports 11,069 11,471 11,586 11,430 11,611 11,991 12,395 12,819 13,265 13,685 14,181
Utilization 166,340 169,641 173,048 175,074 177,920 181,523 185,064 188,134 191,292 194,482 197,759
Consumption 151,773 154,967 157,754 159,804 162,476 165,773 168,950 171,830 174,745 177,693 180,808
Ending stocks 14,567 14,673 15,293 15,270 15,444 15,749 16,114 16,304 16,548 16,789 16,951