Rice pest constraints in Tropical Asia :...
20
Special Report Rice Pest Constraints in Tropical Asia: Characterization of Injury Profiles in Relation to Production Situations SergqhSavary and Laetitia/hlocquet, ORSTOM-IRRI Project on Rice Pest Characterization, International Rice Research Institute, MCPO Box 3127, Makati City 1271, Philippines; Francisco A. Elazegui and Paul S. Teng, IRRI, Entomology and Plant Pathology Division, Philippines; Pham Van Du, Cuu Long Rice Research Institute, Omon, Cantho, Vietnam; Defeng Zhu, Qiyi Tang, Shiwen Huang, and Xianquhg Lin, China National Rice Research Institute, No. 359 Tiyuchang Road, Hangzhou 310006, Zhejiang, China; H. M. Singh 'and R. K. Srivastava, Narendra Deva University of Agriculture and Technology, Narendra Nagar, PO Kumarganj, Faizabad, 224 229 U.P., India ABSTRACT Savary, S., Willocquet, L., Elazegui, E A., Teng, P. S., Du, P. V., Zhu, D., Tang, Q., Huang, S., Lin, X., Singh, H. M., and Srivastava, R. K. 2000. Rice pest constraints in tropical Asia: Char- acterization of injury profiles in relation to production situations. Plant Dis. 84341-356. A protocol for characterizingpatterns of rice cropping practices and injuries due to pathogens, insects, and weeds was developed and used in six sites in tropical Asia covering a wide range of environments where lowland rice is cultivated. The data collected in a total population of 456 individual farmers' fields were combined to site-specific weather data and analyzed using non- parametric multivariate techniques: cluster analyses with chi-square distance and correspon- dence analyses. The main results are: (i) patterns of cropping practices that are common across sites can be identified; (ii) conversely. injury profiles that are common across sites can be de- termined; (iii) patterns of cropping practices and injury profiles are strongly associated at the regional scale; (iv) weather patterns are strongly associated with patterns of cropping practices and injury profiles; (v) pattems of cropping practices and injury profiles allow for a good de- scription of the variation in actual yield; and (vi) patterns of cropping practices and injury pro- files provide a framework that accurately reflects weather variation and site diversity, and relia- bly accounts for variation in yield. The mean estimated yield across sites (4.12 t ha-') corresponds to commonly cited averages in the region and indicates the potential for increased productivity with better management practices, especially an improved water supply. Injuries due to pests are secondary. compared with other yield-limiting factors. Injury profiles were dominated by stem rot and sheath blight (INI); bacterial leaf blight, plant hoppers, and leaf folder (INZ); and sheath rot, brown spot, leaf blast, and neck blast (IN3). IN1 was associated with high (mineral) fertilizer inputs, long fallow periods, low pesticide use, and good water management in (mostly) transplanted rice crops of a rice-rice rotation. IN2 was associated with direct-seeded rice crops in an intensive rice-rice rotation, where fertilizer and pesticide inputs are low and water management is poor, or where fertilizer and pesticide inputs are high and water management is adequate. IN3 corresponds to low input, labor intensive (hand weeding and transplanting) rice crops in a diverse rotation system with uncertain water supply. Weed infestation was an omnipresent constraint. This study shows the potential for developing pest management strategies that can be adapted throughout the region, rather than being site-specific. Additional keywords: cluster analysis, correspondence analysis, crop management, cropping system, multiple pest system The past three decades have witnessed considerable changes in the way rice is being produced in tropical Asia. The avail- Correspondingauthor: Serge Savary E-mail: [email protected] Gent address of S. Savary and L. Wllocquet: IRD, Institut de Recherchepour le DCveloppement (formerly ORSTOM), 911, Ave. Agropolis, BP 5045,34032 Montpellier cedex, France. Accepted for publication 5 November 1999. Publication no7-d-200DfOm--- --I' Q 2000 The American Phytopathological Society able statistics (14) testify that this change has not been uniform across the region, however. While average yields have in- creased considerably in some countries (e.g., in China, from about 2.1 to nearly 6.0 t ha-'), moderate but regular increase has been observed in others (e.g., in.India, 1.5 to 2.7 t ha-'), and near-stagnation has been observed elsewhere (e.g., in Nepal, 1.9 to 2.5 t ha-'). Much has been written on the causes of the overall increase and on the contribution of individual technologies to yield increase (13,34) across the region. Among the causes are techniques to allevi- ate the yield-reducing effects of rice pests (13). Individual effects of agricultural technologies-especially irrigation, intro- duction of high-yielding varieties, fertilizer management, and pest management-in- teract in their yield-enhancing effects. These technologies have not been used in the same way, with the same intensity, and have acted on very different agroecological and social backgrounds across the region. The resulting picture is a complex one, where it is difficult to isolate and quantify the contribution of each technology on yield variation. From a plant protection perspective, these changes have led to shifts in the importance of rice diseases, insect pests, and weeds (19) that must be documented. Over the past 10 years, a project on characterization of rice pests in tropical Asia has been conducted (9,25,26) with the aims of assessing their importance and of determining the areas (both physical and scientific) where pest management has had, and will have, the largest impact. Surveys of farmers' fields give baseline information to assess the importance of pests. This report presents a synthesis of this survey work. By and large, the concepts used here are derived from Rabbinge (22) and Van Itter- sum and Rabbinge (36). We concentrate on actual yields measured in a population of lowland rice fields in tropical Asia and on relationships between variation in actual yield and yield-limiting (weather, iniga- tion, nutrient, and crop husbandry prac- tices) and yield-reducing factors (patho- gens, weeds, and insects). We characterize the production situation of each field, that is, the set of factors-physical, biological, and socioeconomic-that determine agri- cultural production (7,22). The latter group of (socioeconomic) variables is assumed to be indirectly reflected by several charac- teristics of the patterns of cropping prac- tices, such as inputs (fertilizers and pesti- cides), the method of crop establishment, weed control practices, and crop rotation. More specifically, this analysis aims to (i) provide an overview of the distribution of rice pest injuries in six sites in tropical Asia; (ii) characterize the production Plant Disease I March 2000 341 ,.. .- Fonds . Documentaire ORSTOM .,.. .._
-
Upload
duongnguyet -
Category
Documents
-
view
222 -
download
3
Transcript of Rice pest constraints in Tropical Asia :...
Special Report
Rice Pest Constraints in Tropical Asia: Characterization of Injury Profiles in Relation to Production Situations
SergqhSavary and Laetitia/hlocquet, ORSTOM-IRRI Project on Rice Pest Characterization, International Rice Research Institute, MCPO Box 3127, Makati City 1271, Philippines; Francisco A. Elazegui and Paul S . Teng, IRRI, Entomology and Plant Pathology Division, Philippines; Pham Van Du, Cuu Long Rice Research Institute, Omon, Cantho, Vietnam; Defeng Zhu, Qiyi Tang, Shiwen Huang, and Xianquhg Lin, China National Rice Research Institute, No. 359 Tiyuchang Road, Hangzhou 310006, Zhejiang, China; H. M. Singh 'and R. K. Srivastava, Narendra Deva University of Agriculture and Technology, Narendra Nagar, PO Kumarganj, Faizabad, 224 229 U.P., India
ABSTRACT Savary, S., Willocquet, L., Elazegui, E A., Teng, P. S., Du, P. V., Zhu, D., Tang, Q., Huang, S., Lin, X., Singh, H. M., and Srivastava, R. K. 2000. Rice pest constraints in tropical Asia: Char- acterization of injury profiles in relation to production situations. Plant Dis. 84341-356.
A protocol for characterizing patterns of rice cropping practices and injuries due to pathogens, insects, and weeds was developed and used in six sites in tropical Asia covering a wide range of environments where lowland rice is cultivated. The data collected in a total population of 456 individual farmers' fields were combined to site-specific weather data and analyzed using non- parametric multivariate techniques: cluster analyses with chi-square distance and correspon- dence analyses. The main results are: (i) patterns of cropping practices that are common across sites can be identified; (ii) conversely. injury profiles that are common across sites can be de- termined; (iii) patterns of cropping practices and injury profiles are strongly associated at the regional scale; (iv) weather patterns are strongly associated with patterns of cropping practices and injury profiles; (v) pattems of cropping practices and injury profiles allow for a good de- scription of the variation in actual yield; and (vi) patterns of cropping practices and injury pro- files provide a framework that accurately reflects weather variation and site diversity, and relia- bly accounts for variation in yield. The mean estimated yield across sites (4.12 t ha-') corresponds to commonly cited averages in the region and indicates the potential for increased productivity with better management practices, especially an improved water supply. Injuries due to pests are secondary. compared with other yield-limiting factors. Injury profiles were dominated by stem rot and sheath blight (INI); bacterial leaf blight, plant hoppers, and leaf folder (INZ); and sheath rot, brown spot, leaf blast, and neck blast (IN3). IN1 was associated with high (mineral) fertilizer inputs, long fallow periods, low pesticide use, and good water management in (mostly) transplanted rice crops of a rice-rice rotation. IN2 was associated with direct-seeded rice crops in an intensive rice-rice rotation, where fertilizer and pesticide inputs are low and water management is poor, or where fertilizer and pesticide inputs are high and water management is adequate. IN3 corresponds to low input, labor intensive (hand weeding and transplanting) rice crops in a diverse rotation system with uncertain water supply. Weed infestation was an omnipresent constraint. This study shows the potential for developing pest management strategies that can be adapted throughout the region, rather than being site-specific.
Additional keywords: cluster analysis, correspondence analysis, crop management, cropping system, multiple pest system
The past three decades have witnessed considerable changes in the way rice is being produced in tropical Asia. The avail-
Corresponding author: Serge Savary E-mail: [email protected]
G e n t address of S. Savary and L. Wllocquet: IRD, Institut de Recherche pour le DCveloppement (formerly ORSTOM), 911, Ave. Agropolis, BP 5045,34032 Montpellier cedex, France.
Accepted for publication 5 November 1999.
Publication no7-d-200DfOm--- --I' Q 2000 The American Phytopathological Society
able statistics (14) testify that this change has not been uniform across the region, however. While average yields have in- creased considerably in some countries (e.g., in China, from about 2.1 to nearly 6.0 t ha-'), moderate but regular increase has been observed in others (e.g., in.India, 1.5 to 2.7 t ha-'), and near-stagnation has been observed elsewhere (e.g., in Nepal, 1.9 to 2.5 t ha-'). Much has been written on the causes of the overall increase and on the contribution of individual technologies to yield increase (13,34) across the region. Among the causes are techniques to allevi- ate the yield-reducing effects of rice pests (13). Individual effects of agricultural
technologies-especially irrigation, intro- duction of high-yielding varieties, fertilizer management, and pest management-in- teract in their yield-enhancing effects. These technologies have not been used in the same way, with the same intensity, and have acted on very different agroecological and social backgrounds across the region. The resulting picture is a complex one, where it is difficult to isolate and quantify the contribution of each technology on yield variation. From a plant protection perspective, these changes have led to shifts in the importance of rice diseases, insect pests, and weeds (19) that must be documented.
Over the past 10 years, a project on characterization of rice pests in tropical Asia has been conducted (9,25,26) with the aims of assessing their importance and of determining the areas (both physical and scientific) where pest management has had, and will have, the largest impact. Surveys of farmers' fields give baseline information to assess the importance of pests. This report presents a synthesis of this survey work.
By and large, the concepts used here are derived from Rabbinge (22) and Van Itter- sum and Rabbinge (36). We concentrate on actual yields measured in a population of lowland rice fields in tropical Asia and on relationships between variation in actual yield and yield-limiting (weather, iniga- tion, nutrient, and crop husbandry prac- tices) and yield-reducing factors (patho- gens, weeds, and insects). We characterize the production situation of each field, that is, the set of factors-physical, biological, and socioeconomic-that determine agri- cultural production (7,22). The latter group of (socioeconomic) variables is assumed to be indirectly reflected by several charac- teristics of the patterns of cropping prac- tices, such as inputs (fertilizers and pesti- cides), the method of crop establishment, weed control practices, and crop rotation.
More specifically, this analysis aims to (i) provide an overview of the distribution of rice pest injuries in six sites in tropical Asia; (ii) characterize the production
Plant Disease I March 2000 341
, . . .- Fonds . Documentaire ORSTOM .,.. . ._

r
situations (weather and cropping practices) under which rice production takes place; (iii) identify a set of typical injury profiles or combinations of rice pest injuries; (iv) analyze the relationships between produc- tion situations and injury profiles; and (v) assess the accuracy of the above charac- terizations in describing actual variation in yield.
MATERIALS AND METHODS Selection of sites. Six sites were se-
lected in which to conduct the survey: (i) the.plain of Central Luzon, Philippines (CLUZ), where rice is cultivated under irrigated, relatively intensive conditions twice a year; (ii) the eastem coastal plain of 110-110 Island, Philippines (EO), where rice cultivation is mostly rainfed, with low input; (iii) the inland plain of Laguna, Philippines (LAG), with well-tended, irri- gated rice crops twice a year; (iv) the east- em part of Uttar Pradesh, India (FAIZ), on the Indo-Gangetic plains of South Asia, where rice is generally cultivated under rainfed conditions at very low levels of input, except labor, in a complex cropping system involving at least eight different major crops in rotation with rice; (v) the plains bordering the Yang Tse Delta in the Zhejiang Province of China (HGZ), where rice is intensively cultivated twice a year in a complex cropping system involving rape- seed, barley, and wheat; and (vi) the Me- kong Delta, Vietnam (MD), with an inten- sive cropping system with three rice crops each year. Each of these sites can be seen as a specific reflection of the changes that accompany major agricultural transforma- tions such as the green revolution, mirrored by local needs and constraints. These sites were selected in order to reflect such a diversity in agricultural change. Details on field selection within each site are given in the “Survey Portfolio” developed in this project (25,27,30).
Sampling and data collection in each field. The survey was conducted in the rainy and dry seasons of 1987 in CLUZ; in the rainy seasons of 1992 and 1993 in FAIZ; in the winter, dry, and rainy seasons of 1996 in MD; in the rainy season of 1996 in IL0 in the dry and rainy seasons of 1996 in LAG; and in the early spring sea- son of 1997 in HGZ. A total of 456 indi- vidual fields were surveyed in the six sites. Two broad types of data were gathered: (i) predominantly time-independent and quali- tative information, i.e., location, previous crop, crop establishment method, rice vari- ety, field operations, chemical input (fertilizers, pesticides), and yield; and (ii) time-dependent, quantitative information on crop growth and levels of injuries due to pests (pathogens, insects, and weeds). While the first group of field attributes was gathered from discussions with farmers and from direct field observation, the sec- ond group was derived from a specific, field-tested sampling design (9). The sec-
342 Plant Disease / Vol. 84 No. 3
ond group of field attributes (injuries) re- sults from observations at’ four develop- ment stages of the growing crop: tillering, booting, early dough, and maturity. Except for weeds, information pertaining to inju- ries was collected in the form of number of injured organs (tillers, leaves, and pani- cles), which later was made relative to the corresponding total number of organs pres- ent in the sampling units (10 hills or 10 x 10 cm quadrats per field for transplanted or direct-seeded rice crops, respectively). In the case of weeds, the proportion of soil
“ area covered at two levels of the crop can- opy (below or above it) was assessed in three spots of I mz each. Weather data were collected at standard weather stations at the center of, or as near as possible to, the surveyed field sites.
Nature and list of variables of the survey. Survey variables are listed in Table 1 within four groups: cropping practices, injuries, weather variables, and actual yield estimates. Simplifications and data com- paction (25,28) were necessary to achieve the objective of the analysis. A first set of simplifications pertains to the pattems of cropping practices. For instance, only the accumulated amount of chemical (N, P, and K) fertilizer was used to represent input of chemical fertilizers, and not the individual inputs of N, P, and K. The methods of crop establishment in rice are extremely diverse in Asia. Only two broad categories were considered transplanted or direct-seeded. Likewise, three categories of weed control were considered those that involve some hand weeding and therefore imply availability and use of labor as input, thosc that rely only on herbicides, and indirect (or unspecified) methods.
Injury variables were also simplified. Although a very large number of patho- gens, insects, and weeds are harmful to rice (18,21,31,33), many are seldom considered to cause yield losses. Diseases such as narrow brown spot, bacterial leaf streak, leaf scald, and leaf smut, and insects such as rice bugs, rice hispa, and rdefoliators in general are not considered to represent major, widespread, yield-reducing factors (18,31,32,33). The study therefore concen- trated on injuries listed in Table 1. A sec- ond aspect pertains to the injury mecha- nisms (3,24), and Table 1 includes injuries that were grouped in the field assessment procedure according to their nature: light stealers (BLB, BS, LB: proportion of in- jured leaves), senescence accelerators (BLB, SHB, LB: proportion of injured leaves, except for SHB), tissue users (leaves: RWM, L F proportion of injured leaves; tillers: SR, SHB, DH: proportion of injured tillers; panicles: SHR, WH: pro- portion of injured panicles), assimilate sappers (PH: number of insects sampled), turgor reducers (at the tiller level: SR, SHB: proportion of injured tillers; at the panicle level: NB: proportion of injured panicles), and stand reducers (WA and
WB: percent ground coverage; RID: pro- portion of diseased hills or quadrats). Each injury was represented by varieties that would best represent its effect over time on the physiology of the crop. Broadly, two types of injury indices (25) were used areas under progress curves or maximum level at any of the four observation dates, depending on the nature of the injury (Table 1; 25,27). The time-dependent in- formation on injuries was thus synthesized and compacted over time.
The weather variables consisted of the mean daily maximum (TX) and minimum temperature (TN), the mean daily radiation (RAD), and the accumulated rainfall (RAIN) during the rice cropping season. Variation in these values within a site was accounted for by the standard deviation of each variable (SD).
The variables listed in Table 1 show several differences: some are quantitative, but a few are, in essence, qualitative. The quantitative variables are expressed in different units; more -importantly, the at- tributes pertain to different levels of or- ganization: while the weather variables refer to the physical environment of an entire season in a site, cropping practices pertain to the population of rice plants in a crop, injuries refer to particular plant or- gans, and yield represents one output of a field seen as a system. The analytical steps used here stem to a large extent from these differences.
General analytical approach and hy- potheses.. The issue of observation and analysis scales is central to this study. While the information gathered pertains to the individual field, analysis of the data should aim at conclusions that have rele- vance to the region. A starting point for reflection is the uniqueness of each farmer’s field, seen as an individual system described by a series of attributes, some of which are quantitative, while others are qualitative, ordinal, or cardinal (i.e., non- ranked) variables (such as the method of crop establishment). The technical details of the survey methodology (9,25,27,30) and of most of the analytical techniques used here (28) have been reported earlier.
A first question is the existence and strength of linkages between pattems of I
cropping practices and injuries. Therefore, - a first null hypothesis tested, Hol, is:
practices and injuries.” In a second stage, the relationships between cropping prac- tices and injuries in determining actual
yield cannot simply be accounted for by
i I ! I I Ì
“There is no linkage between cropping
I
yields are explored. Thus, a second null hypothesis, Hoz, is: “Variation in actual
the simultaneous, sole consideration of cropping practices and injuries.” A third issue addressed in this report is the general value of conclusions and their potential for extrapolation at a regional scale. This can
! I
I
be translated in a third null hypothesis, HO3: “All conclusions derived from surveys
I
I I 4
I

are specific to the sites where the data were cient filling of each class determines the injuries and yield). Some of these tests are collected” expected size of each class in chi-square briefly reported here.
Data analysis. The data collected were tests, a prerequisite to their validity (6,ll). Next, cluster analyses using a nearest analyzed in steps. First, the quantitative All injuries were categorized in three neighbor and a chi-square distance (15) were variables were categorized into classes classes, and the boundaries were chosen performed in subsets representing each site, (Table 2). They thus became ordinal (e.g., depending on each of their respective dis- in order to determine site-specific pattems of low, medium, high), qualitative variables, tribution frequencies. Five successive yield cropping practices and injury profies. ,
while variables such as “weed control classes were defined, in order to enable a Clusters including less than II = 3 fields were practices” (WCP) remained cardinal, better description and analysis of variation disregarded from further steps. qualitative variables. Table 2 shows the of actual yield, from very low (Yl) to very The site-specific clusters for pattems of numerical boundaries and classes that were high yield levels (Y5). cropping practices and injuries were then created. The number of categories was Chi-square tests were performed using considered separately. The modes (for made as small as possible for all variables, this coded, categorized information. The qualitative variables) and the medians (for in order to ensure a class-filling as regular tests pertained either to the same level of quantitative ones) of each variable repre- as possible, and the numerical boundaries organization (e.g., relationships among senting individual fields within each of were chosen so as to have each class repre- paired injuries), or to adjacent levels of these two types of clusters were computed.
,
MF FP WCP Weed control practices IU HU Fu Fungicide use in number of applications Number DS WE
Pc Crop preceding rice in the same field (None)
Total mineral fertilizer supply to the rice crop Fallow period duration preceding the rice crop
Insecticide use in number of applications Herbicide use in number of applications
Accumulated drought stress (number of observed occurrences a)
Accumulated water excess (number of observed Occurrences a)
PM Planting method (transplanted or direct-seeded) (None) - _ -
Injuries BLB Area under the progress curve of mean percentage of leaves with bacterial leaf blight symptoms (4 (% dsu.)
visits9 SR Maximum percentage of tillers with stem rot symptoms (a) SHR Maximum percentage of panicles with sheath rot symptoms (8) SHB Maximum percentage of tillers with sheath blight symptoms “ (%o)
Area under the progress curve of mean percentage of leaves with brown spot symptoms (4 visits) (% dsu) Area under the progress curve of mean percentage of leaves with leaf blast symptoms (4 visits) (% &u)
NB Maximum percentage of panicles with neck blast symptoms (%o) Maximum percentage of hills or quadrats wit$ rice tungro disease symptoms (%)
(Number dsu) Area under the progress curve of mean percentage of leaves with whorl maggot injury (4 visits) (8 &u)
Maximum percentage of panicles with white head (stem borer) injury (%I
BS LB
RTD PHd RWM
DH WH WA
WB
Area under the progress curve of number of plant hoppers caught per hill of sampled quadrat (4 visits)
LF Area under the progress-curve of mean percentage of leaves with leaf folder injury (4 visits) , (%dsu) ’
Maximum percentage of tillers with dead heart (stem borer) injury
Area under the progress curve of percent weed infestation (ground coverage) above the crop canopy (4
Area under the progress curve of percent weed infestation (ground coverage) below the crop canopy (4
(96 &u)
(% dsu) visits)
Climatec r
TX ily temperature during the cropping season (“Cl TXSD (“Cl TN Mean minimum daily temperature during the cropping season (“C) TNSD (“Cl RAD Mean daily radiation during the cropping season (MJ m2) RADSD (M J m2) RAIN Accumulated rainfall during the cropping season 1 (mm) RAINSD (-1
Y
CLUZ Central Luzon, Philippines FAIZ Faizabad, Uttar Pradesh, India HGZ Hangzhou, Zhejiang, China IL0 110-110, Philippines LAG Laguna, Philippines MD Mekong Delta, Vietnam
Standard deviation of the mean maximum temperature during the cropping season
Standard deviation of the mean minimum temperature during the cropping season
Standard deviation of the mean daily radiation during the cropping season
Standard deviation of the daily rainfall during the cropping season Yield
Sites 4
’ Estimated yield (grain yield, 14% moisture) from 3 crop cuts 10 m 2 each (t ha-’)
* Accumulated number of observed occurrences over four visits during the crop cycle. Assessments in each field were done at the tillering, booting, early dough, and maturity stages. dsu: development stage units on a O to 100 scale. PH combines the brown plant hopper, white back plant hopper, and zig-zag plant hopper-
e Weather variables were gathered at the nearest weather station, usually at the center of each survey site.
Plant Disease/ March 2000 343
‘> ‘ .. .“ . .

clusters of cropping practices (PR SITE no.) or site-specific clusters of injuries (IN SITE no.). These field ideotypes were used for the next cluster analyses to represent their corresponding site-specific clusters of cropping practices and of injuries. Two independent final cluster analyses were performed on these two sets of ideotypes using the same algorithm. These yielded meta-clusters of cropping practices and of injuries that might or might not be com- mon across sites. Cluster analysis was also applied to categorized weather data repre- senting all combinations of sites and sea- sons to generate weather pattems.
Cluster analyses thus generated three synthetic and qualitative variables: the
clusters of cropping practices (PR), of injury profile (IN), and of weather (W) to which a given field belongs. These three variables were then used in the final stage of the analysis, along with actual yield levels: chi-square tests were performed to assess relationships among these variables, and correspondence analyses (2,12,15,16,28) were performed.
Correspondence analysis was first ap- plied to three such contingency tables: [PR x IN] (corresponding to hypothesis Hol), [PR x YI, and [IN x Y]. The two latter contingency tables, their associated chi- square tests, and correspondence analyses represent further testing of the clusterings made for pattems of cropping practices and
injury profiles and their relevance in de- scribing the variation in actual yield, which was not involved in cluster analyses.
Applying production ecology concepts (22,36) where attainable yields are reduced to actual yield levels by injuries, yield- limiting factors (accounted for by cropping practices and synthesized into the PR classes), and yield-reducing factors (IN classes) were used to describe actual yield variation. This approach aims at testing h3, i.e., addressing the generalization value of the analysis and the potential to extrapolate results at a regional scale. It was based on the construction of a Burt table (16), i.e., a matrix where the [PR x IN] and flN x PR] contingency tables are
Table 2. Categorization of variables describing individual fields in surveys of rice injuries in six sites in tropical Asia
' Variable type Symbola Categories Category definitionb
Cropping practices MF
FP
WCP NW, Hand, Herb
Iu IUO, IUl, Iu2
HU RUO, HUI, HU2
Fu FUO, FUI DS DSl, DS2, DS3 WE WEO, WE1 WE0 WE=O; WEI: O < WE 5 4 PM TR, DS T R transplanting; DS: direct seeding PC
MFO, MFl, MF2, M l 3
FPl , FP2, FP3, FP4
MFO MF = O kg ha-'; MFl: O < MF 5 50 kg ha-'; MFZ: 50 < MF 5 140 kg ha-'; MF3:140 <
FPl: FP 5 15 days; Fm15 < FP 5 40 days ; FP3: 40 < FP 5 100 days; FP4 100 < FP 5 350
NW: no direct weed control practice used; Hand some hand weeding; Herb exclusive
1UO no insecticide application; IUl: one insecticide application; IU2: two insecticide
HUO: no herbicide application; HUI: one herbicide application: HU2 two herbicide
FU0 no fungicide application; FUI: one fungicide application or more DSl: O 5 DS 5 1; DS2: 1 < DS 52; DS3: 2 < DS 5 4
MF 5 300 kg ha-'
daYs
reliance on herbicides
applications or more
applications or more
Rice, Fal, Leg, W/B, Misc. Rice: rice as previous crop; FaI: fallow period exceeding 140 days; Leg: Legume crop; W/B: Wheat or Barley; Misc: miscellaneous crops
Injuries BLB BLBO, BLBI, BLB2 SR SRO, SRI, SR2 SHR SHRO, SHRl, SHR2 SHB SHBO, SHBI, SHB2 BS BSO,BSl, J3S2 LB LBO, LB1, LB2 NB NBO, NBl, NB2 PH" PHO, PHI, PH2 RWM
BLBO: BLB = 0% &u; BLBI: O < BLB 5 20% &u; BLB2: 20 < BLB 5 2,000% dsu SRO: SR=0%; SR1: O <SR 5 1 % SR2: 1 < SR 530% SHRO SHR = 0%; SHRl: O < SHR 5 3%; SHR2 3 < SHR 550% SHBO SHB = 0%; SHBI: O < SHB 55%; SHB2 5 < SHB 5 50% BSO: BS = 0% dsu: BSI: O < BS 5 100% &u; BS2 100 < BS 54,000% dsu LBO: LB = 0% dsu; LBl: O < LB 5 20% dsu: LB2 20 < LB 5 3,000% dsu NBO NB =O%, NBl: O<NB 5 5%; NB2 5 < NB 570% PHO: PH =ON dsu; PHI: O<PH 550 N dsu; PH2 50 < PH 5400 N dsu RWMO RWM = 0% dsu; RWMl: O < RWM 5 100% dsu; RWM2 100 < RWM 5 1.200% RWMO, RWM1, RWM2
Climate
LF DH WH WA
WB
T x . TXSD TN TNSD
LFO, LFI , LF2 DHO, DHl, DH2 WHO, WHI, WH2 WAI, WA2, WA3
WBl, WB2, WB3
TXI, TX2, TX3 TXSDl, TXSD2, TXSD3 TNl, TN2, TN3 TNSDI, TNSD2, TNSD3
&U LFO: LF=O% dsu: LFI: O < LF 5 100% ds~: L m 1 0 0 < L F S 2.500% dsu DHO DH = 0%; DHl: O < DH 55%; DH2 5 < DH 5 40% WHO: WH = 0%. WH1: O < WH 5 5 % WH2: 5 < WH 530% WAL O 5 WA 5 200% &u; W A 2 200 < WA 5 1,000% dsu; WA3: 1,000 < WA 5 3.500%
WB 1: O 5 WB 5 200 % dsu; WB2: 200 < WB 5 1,000% &u; WB3: 1,000 <' WB I4,000% d s U
d s U
TX1:TX53l0C;TX2 31 <TX532"C;TX3: 32eTX535"C TXSDI: TXSD 5 1.4"C; TXSD2 1.4 < TXSD 5 1.8"C; TXSD3: 1.8 < TXSD 53.0"C TNl: TN 5 22°C; TN2 22 < TN 5 24°C; TN3: 24 < TN 5 30°C TNSDI: TNSD 5 1.O"C; TNSDZ: 1.0 < TNSD 52.0"C; TNSD3: 2.0 < TNSD 53.0"C
RAD RADI, RAD2, RAD3 RADI: RADS 17.0 MJ m-*; RAD2: 17.0 <RAD 5 20.0 MJ m-2; RAD3: 20.0 < RAD 5 25.0 MJ m-2 I
RADSD RADSDI, RATXD2,
RAIN
RAINSD RAINSDl, RAINSD2,
RADSD1: RADSD 5 4.0 MJ m-2; RADSD2: 4.0 < RADSD 5 5.0 MJ m-2; RADSD3: 5.0 < l RADSD3 RADSD 58.0 MJ m-2
RAIN1, RAIN2, RAIN3 RAIN1: RAIN 5 400 mm: RAIN2: 400 <RAIN 5700 mm; RAIN3: 700 <RAIN 5 1,500
RAINSD1: XAINSD5 5 mm; RAINSD2 5 <RAINSD 5 15 mm; RAINSD3:15 <RAINSD mm 4
RAINSD3 553" Yield
I Y Yl,Y2,Y3,Y4,Y5 YI: Y < 2.75 t ha-'; Y2: 2.75 5 Y 0 . 7 5 t ha-'; Y3: 3.75 5 Y < 4.25 t ha-'; Y 4 4.25 5 Y < 5.25 t ha-'; Y5: 5.25 5 Y < 8.33 t ha-'
a Variables are listed in Table 1. Categories for quantitative variables are defined by numerical boundaries. N dsu is the unit for area under the progress curve of number of plant hoppers caught per hill of sampled quadrat (4 visits).
1
344 Plant Disease / Vol. 84 No. 3 I
tional matrices, [Y x PR] gion (l), the vide information on spe- analyses (Fig. 2). PRl corresponds to a I and [Y x IN], were appended to this table, cific weather characteristics pertaining to rice-rice cropping system, where the rice
k and correspondence analysis was con- the sites and the seasons during which the crop is mostly transplanted, with relatively ducted, considering the Y classes as addi- survey took place. W1 has medium to high high input (mineral fertilizers and pesti- tional variables. This amounts to identify- TX and TN, medium to high and variable cides), a relatively long fallow period, ing a series of axes based on pattems of RAD, and high RAIN. This group broadly . a good control of water supply (Table 5 cropping practices and injury profiles only corresponds to rainy seasons in the warm, PR1 accounts for the largest population of and projecting on this system of axes the humid tropics (Table 4). It includes rainy fields surveyed (n = 148) and ‘ classes of yield levels. A simplified view seasons in CLUZ, LO, LAG, and MD. to two sites (CLUZ and HGZ) of this last analysis is to consider PR and W2 is characterized by high RAD, medium a rice-rice transplanted syste IN as explanatory variables and Y as the TX and TN, and low RAIN. This group lower inpnt (mineral fertilizer, espe variable to be explained. Weather pattems corresponds to cloudless dry season i n the and a poorer control of the water supply. and sites were also involved in ‘this final warm humid tropics (Table 4). It is repre- Input in the form of labor, aside from analysis. sented by the dry season in CLUZ. W3 is transplanting, appears to be low, as sug-
mainly characterized by high TX and low gested by the absence of specific weed RESULTS to medium but highly -variable RAIN. It is control actions (NW = loo%, Table 5);
Prevalence of injuries across sites and also associated with medium TN and low This pattem is represented by six fields seasonk Differences among sites and sea- to medium RAD (Table 4). This group only in one site (CLUZ). PR3 accounts for sons for injury prevalence (percent fields represents the rainy (kharif) season in the rice crops in the “rice-wheat” system of affected by a given injury; 37) were sum- warm subarid tropics of southem Asia. It southem Asia, with very diverse crops, marized (Table 3). Among the injuries includes the rainy seasons in FALZ. W4 including wheat, preceding rice. The in- caused by pathogens, SHB showed the corresponds to low TX and TN, as well as puts, especially pesticides, are very low, highest prevalence, exceeding 50% in any low RAD (Table 4). It also is associated and the water control is poor. Weed control site-season combination. SHR, BS, and SR with low to medium RAIN. This group often involves hand weeding (Table 5; occurred in decreasing order of prevalence represents dry but cloudy seasons in the Hand =’ 89.3%, the highest proportion level. At the other end of this spectrum, warm humid tropics (LAG) or spring to among all clusters), reflecting input in’the RTD was observed in one site and one early summer weather in the subtropical form of labor. The rice crop is mostly season only, and thus was not further con- regions of eastem Asia (HOZ). W5 is transplanted, but direct seeding occurs. sidered in the analyses. Insect injuries ap- mainly characterized by low RAIN com- This pattem is mostly found in one site ,
pear to have higher prevalence than those bined with high TX, medium TN, and me- (FALZ), but also in another (LO) that does due to pathogens. Most insect injuries were dium RAD (Table 4). It is represented by no) belong to the rice-wheat system but omnipresent, often with prevalence ex- the “winter-spring” season of the Mekong shares commonalties with it, with. various ceeding 80%. Weed infestation, both above Delta only, i.e., climatic conditions pre- crops preceding rice, low input, drought and below the rice crop canopy, was omni- ceding the onset of the monsoon in the , stress, and direct seeding. PR3 accounts for present and had the highest prevalence warm humid tropics of Asia. W6 is char- the second largest population of fields levels of all-injuries. This crude summary acterized by high TX and TN, medium surveyed (n = 140). PR4 is characterized also suggests that differences as well as RAD, and medium RAIN (Table 4). It is I by very high input to the crop (fertilizer similarities occurred among sites and sea- similar to W2, but with higher RAIN (and and pesticides), transplanting, some hand sons with respect to occurrence of injuries. therefore lower RAD) and higher TX and weeding, and a moderately good control of
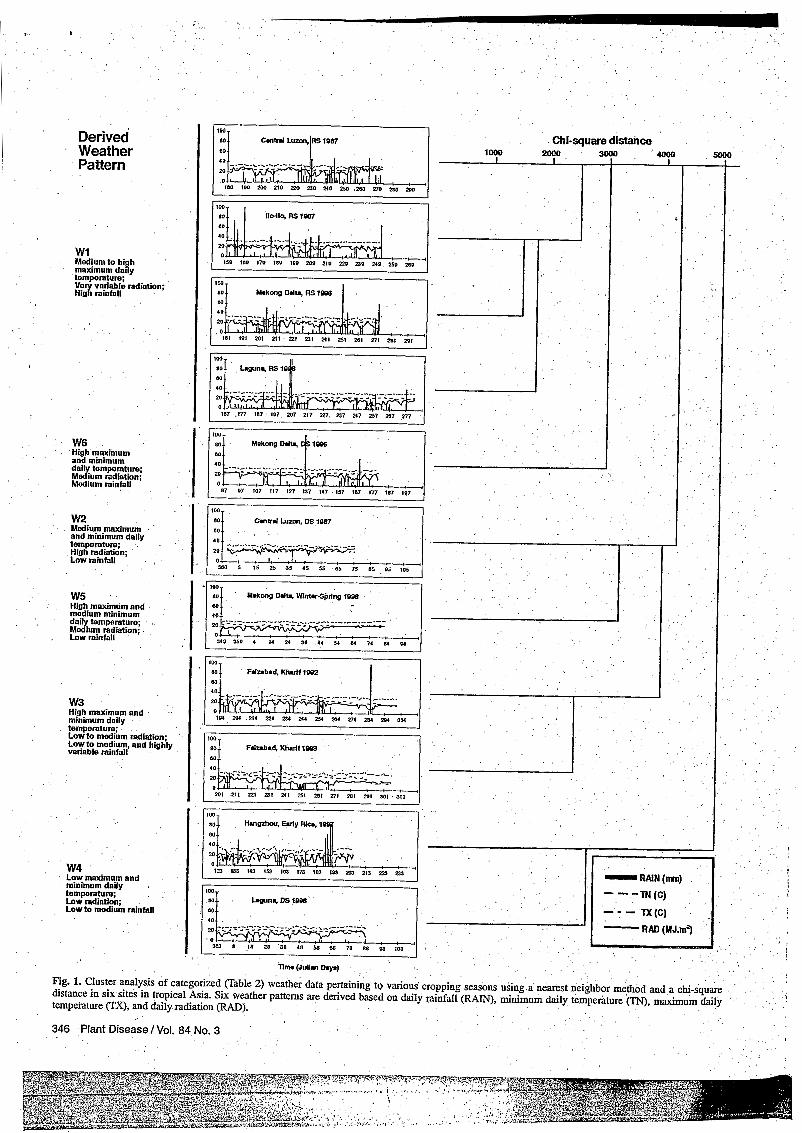
Characterization of climatic variation TN. It represents another type of dry sea- the water supply, in another rice-wheat across sites and seasons. Cluster analysis so warm humid tropics (MD, dry system, with diverse crops such as barley, led to the identification of six broad se rapeseed, or wheat preceding rice. This weather pattems (Fig. 1). While these pat- terization of patterns of crop- group is represented in one ‘site only tems conform with current knowledge of ping practices. Six pattems of cropping (HGZ), with a small (n = 11) number of tropical or subtropical climates in the re- practices were determined from cluster fields. PR5 represents rice crops in a rice-
*
j
I
i
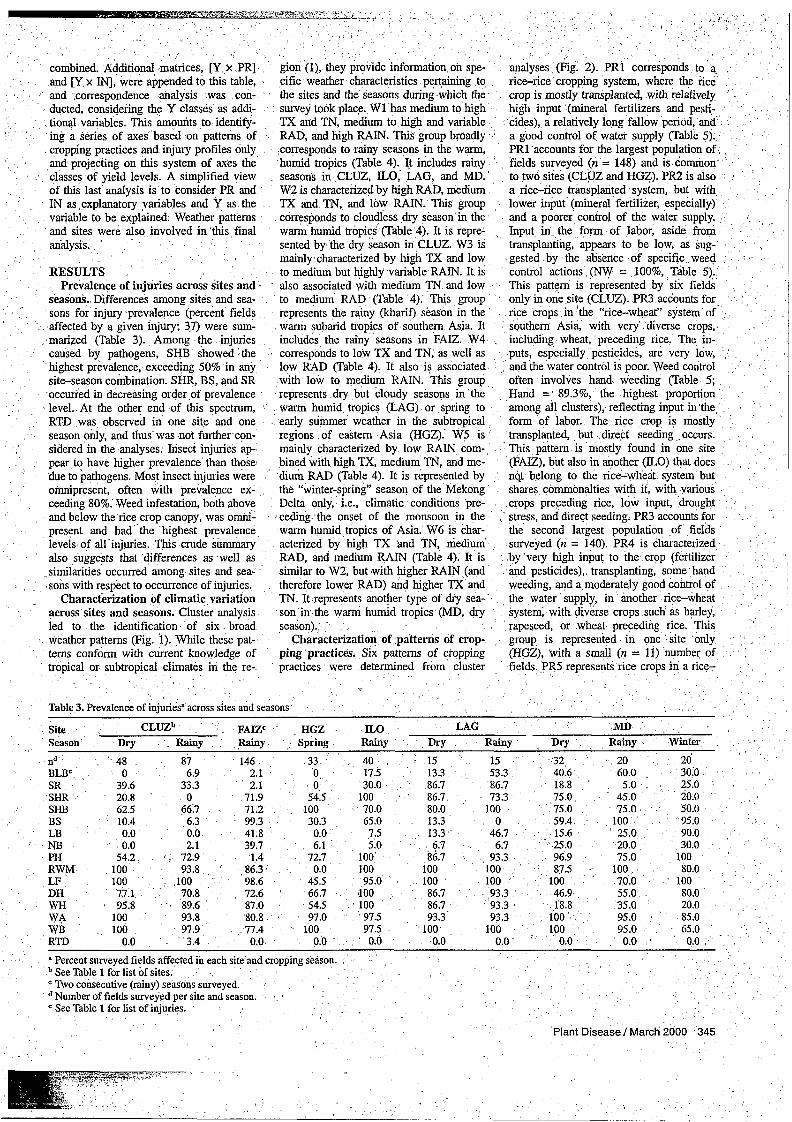
Table 3. Prevalence of injuries” across sites and seasons
Site CLUZb FAIZc HGZ IL0 LAG MD Season Dry Rainy Rainy Spring Rainy Dry -Y Dry Rainy Winter
60.0 30.0 nd 48 87 146 33 40 15 15 32, BLB” O 6.9 2.1 O 17.5 13.3 53.3 40.6 SR 39.6 33.3 2.1 O 30.0 86.7 86.7 18.8 ’ 5.0 . 25.0 SHR 20.8 O 71.9 54.5 1 O0 86.7 73 3 75.0 45.0 20.0 SHB 62.5 66.7 71.2 100 70.0 80.0 100 75.0 75.0 50.0 BS 10.4 ‘6.3 99.3 * 30.3 65.0 13.3 O 59.4 1 O0 95.0 LB 0.0 0.0 41.8 0.0 7.5 13.3 46.7 25.0 90.0 NB 0.0 2.1 39.7 6.1 5.0 6.7 6.7 20.0 30.0 PH 54.2 . 72.9 1.4 72.7 100 86.7 93.3 75.0 1 O0 RWM 100 93.8 86.3 0.0 100 100 100 87.5 . 100 80.0 LF 100 100 98.6 45.5 95.0 1 O0 100 70.0 ’ 100 DH 77.1 70.8 72.6 66.7 ,100 86.7 93.3 46.9. 55.0 80.0 WH 95.8 89.6 87.0 54.5 100 86.7 93.3 18.8 35.0 20.0 WA 100 93.8 80.8 97.0 97.5 93.3 93.3 100 95.0 85.0 W B 100 97.9 77.4 100 97.5 100 100 100 95.0 65.0 RTD 0.0 3.4 0.0 0.0 0.0 0.0 0.0 0.0 0.0 0.0
a Percent surveyed fields affected in each site and cropping season.
20 2ó
See Table 1 for list of sites. Two consecutive (rainy) seasons surveyed. Number of fields surveyed per site and season. See Table 1 for list of injuries.
Plant Disease / March 2000 345
I IW- Derived Weather Pattern
urw UlSranW
w1 Medium to high maximum daily temperature- Ve va+d radiarion; H i 2 ramfall
I w l Il I
W6 High mnximum and minimum dally tomperatuw Medium radœtbnf Medium rainfall
w2 Medium maximum and minimum daily temporaluro. . High radintidn; Low rainfall
w5 High maximum and medium minimum
. daily temperature; Medium radiation; Low rainfall
I
w3 High maximum and minimum daily temperature. L O W ~ O medium Miation- Low to medium, and hbhiy veriable rainfall
I
I 1w- I I
I l IW-
w4 Low maXimum and minimum daily tamperatuw Low mdiatio;. LOW to "iiuh rainfall . I
. .
. , ,
Y-. -- - -I I I r--.-.YL -- u*iivcu udxu on 'lruiy raintall (RAIN), minimum daily temperature (TN), maximum daily
temperature (Ta, and daiiy radiation (RAD).
346 Plant Disease /Vol. 84 No. 3
rice system, with a relatively short fallow this injury profile, which is represented by were therefore PR1, PR3, PR5, and PR6, period, fairly high labor and chemical in- four fields only. IN5 and IN3 are associ- and NI, IN2, and IN3, respectively. put, and often a poor control of the water ated with the kwest mean yields (3.3 and One main result of these tests is the very supply. A majority of the fields of this 3.5 t ha-', respectively, Table 61, while IN1 strong link between injury profiles and group are direct seeded (Table 5). This and IN4 are associated with the highest patterns of cropping practices (xz = 573, p
ted by n = 81 fields in mean yields (4.6 p d 4.3 t ha-', respec- < 0.0005). Significant associations be- s (LO, LAG, MD). PR6 tively, Table 6). tween yield classes and patterns of drop-
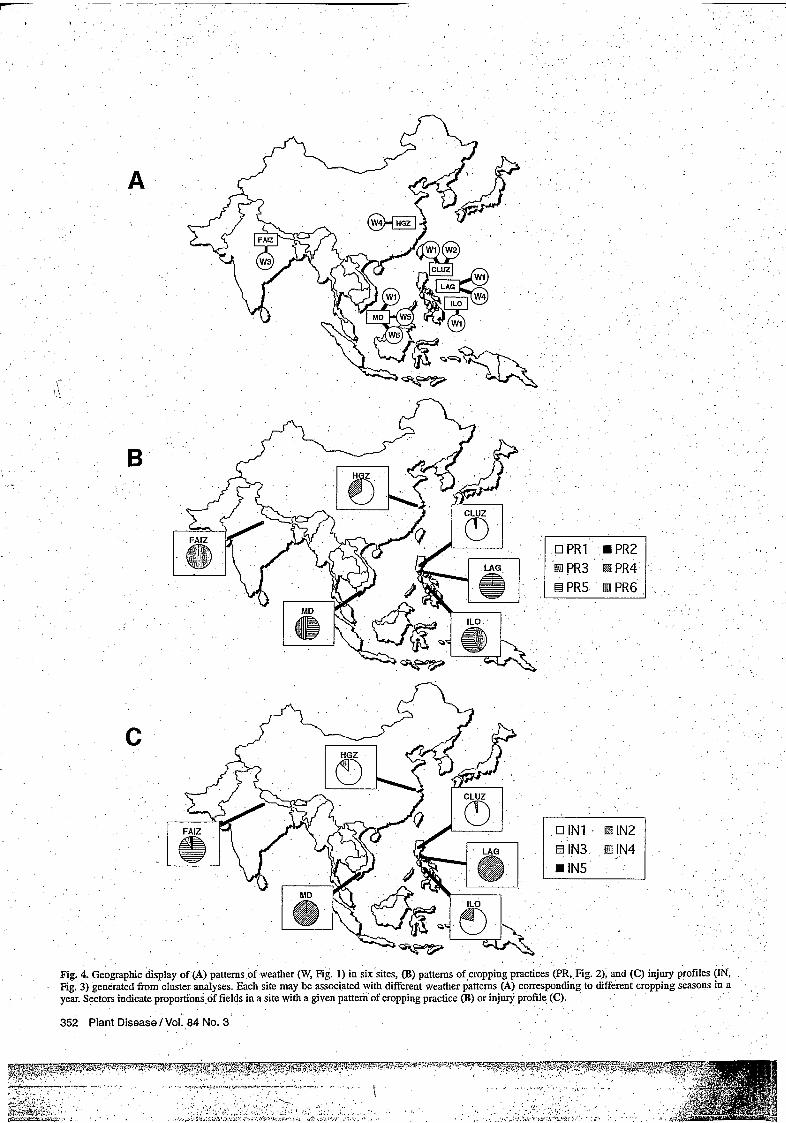
is characterized by rice crops that are ex- Geographic distribution- of weather ping practices (x' = 102, P < 0.0005), and clusively direct seeded in a very intensive patterns, cropping practices, and injury between yield classes and injury profiles rice monoculture with three crops per year, profiles. The geographic distribution of (xz = 59.6, P < 0.0005) were also found. high input, and reasonably good water weather pattems is displayed in Figure 4A. There were also very strong associations control. Direct weed control measures are Some patterns' are common across sites between weather patterns and pattems of replaced by extremely high seeding rates. (i.e., W1 in MD, KO, CLUZ, and LAG, cropping practices, as well as between Among these clusters, PR4 is associated and W4 in HGZ and LAG). Some other weather pattems and injury profiles (xz > with the highest yield level (6.7 t ha-', weather pattems are site-specific, such as 500, P < 0.0005 in both cases). Table 5). followed by PRl (4.8 t ha-') and W3 (FAIZ). Figure 4B shows the geÓ- Linkage of actual yields with yield- PR2 (4.6 t ha-'). The lowest yields are graphic distribution of patterns of cropping limiting and yield-reducing factors. associated with PR3 (3.5 t ha-'). . practices. PRl is found in two sites (HGZ Analyzing this survey yielded information
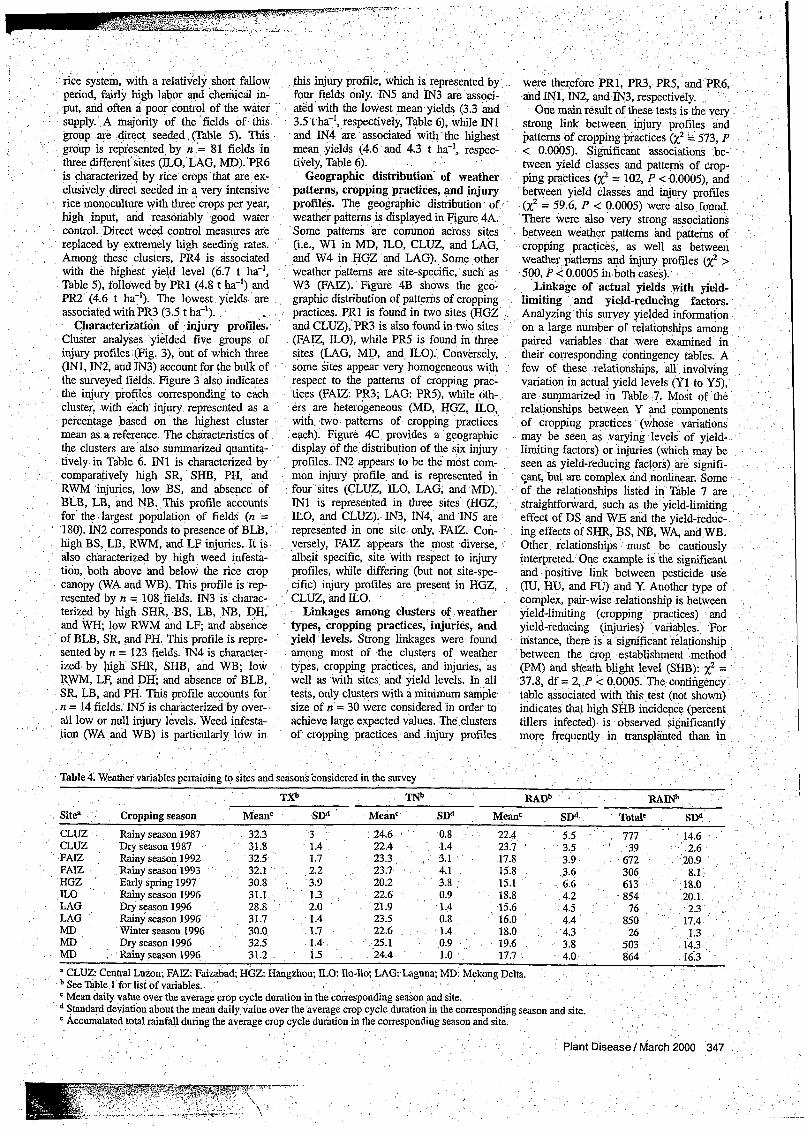
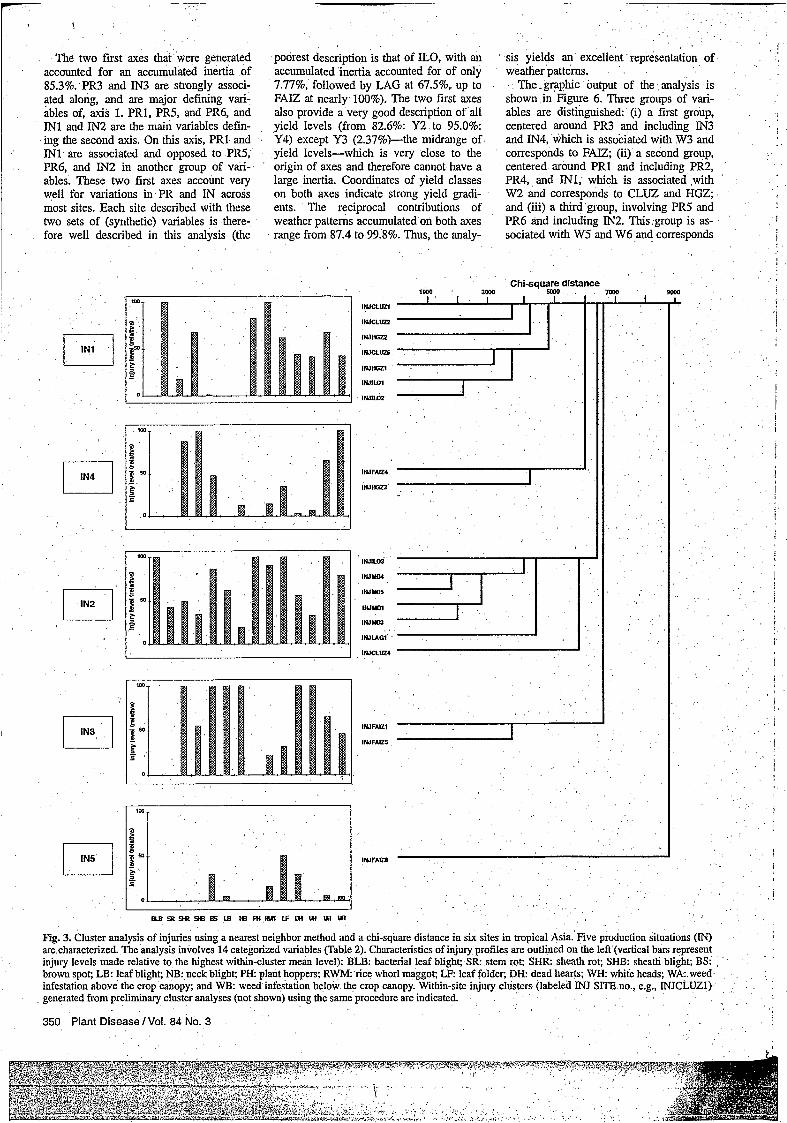
Characterization of injury profiles. and CLUZ),'PR3 is also found in two sites on a large number of relationships among Cluster analyses yielded five groups of (FAZ, ILO), while PR5 is found in three paired variables that were examined in injury profiles (Fig. 3), out of which three sites (LAG, MD, and ILO). Conversely, their corresponding contingency tables. A (IN1, IN2, and IN3) account for the bulk of some sites appear very homogeneous with few of these relationships, all involving the surveyed fields. Figure 3 also indicates respect to the patterns of cropping prac- variation in actual yield levels (Y1 to YS), the injury profiles corresponding to each tices (FA=. PR3; LAG: PRS), while 0th- are sunpnarized in Table 7. Most of the cluster, with each injury represented as a ers are heterogeneous (MD, HGZ, ILO,, relationships between Y and components percentage based on the highest cluster with two patterns of cropping practices of cropping practices (whose variations mean as a reference. The characteristics of each). Figure 4C provides a geographic may be seen as varying levels of yield- the clusters are also summarized quantita- display of the distribution of the six injury limiting factors) or injuries (which may be tively in Table 6. IN1 is characterized by profiles. IN2 appears to be the most com- seen as yield-reducing factors) are signifi- comparatively high SR, SHB, PH, and mon injury profile and is represented in cant, but are complex and nonlinear. Some RWM injuries, low BS, and absence of four sites (CLUZ, ILO, LAG, and MD). of the relationships listed in Table 7 are BLB, LB, and NB. This profile accounts IN1 is represented in three sites (HGZ, straightforward, such as the yield-limiting for the largest population of fields (n = no, and CLUZ). IN3, IN4, and IN5 are effect of DS a d WE and the yield-reduc- 180). IN2 corresponds to presence of BLB, represented in one site only, FAE. Con- ing effects of SHR, BS, NB, WA, and WB. high BS, LB, RWM, and LF injuries. It is versely, FAIZ appears the most diverse, Other relationships must be cautiously also characterized by high weed infesta- albeit specific, site with respect to injury interpreted. One example is the significant tion, both above and below the rice crop profiles, while differing (but not site-spe- and positive link between pesticide use canopy (WA and WB). This profile is rep- cific) injury profiles are present in HGZ, (IU, HU, and FU) and Y Another type of resented by n = 108-fields. IN3 is charac- CLUZ, and ILO. complex, pair-wise relationship is between terized by high SHR, BS, LB, NB, DH, Linkages among clusters of weather yield-limiting (cropping practices) and and WH; low RWM and LF; and absence types, cropping practices, injuries, and yield-reducing (injuries) variables. For of BLB, SR, and PH. This profile is repre- yield levels. Strong linkages Were found instance, there is a significant relationship sented by n = 123 fields. IN4 is character- among most of the clusters of weather between the crop establishment method ized by wgh SHR, SHB, and WB; low types, cropping practices, and injuries, as (PM) and sheath blight level (SHB): xz = RWM, LF, and DH, and absence of BLB, well as with sites and yield levels. In all 37.8, df = 2, P < 0.0005. The contingency SR, LB, and PH. This profile accounts for tests, only clusters with a minimum sample table associated with this test (not shown) n = 14 fields. IN5 is characterized by over- size of n = 30 were considered in order to indicates that high SHB incidence (percent all low or null injury levels. Weed infesta- achieve large expected values. The clusters tillers infected) is observed significantly tion (WA and WB) is particularly low in of cropping practices and injury profiles more frequently in transplanted than in
,
. ,
. I
Table 4. Weather variables pertaining to sites and seasons 'considered in the survey
T X b TNb RADb RAINb
Siten Cropping season MeanC SDd MeanC SDd Meanc SDd Totale SM CLUZ Rainy season 1987 32.3 3 24.6 * 0.8 22.4 5.5 777 14.6 CLUZ Dry season 1987 31.8 1.4 22.4 1.4 23.1 3.5 ' 39 2.6 FAIZ Rainy season 1992 32.5 1.7 23.3 3.1 17.8 3.9 672 20.9
HGZ Early spring 1997 30.8 3.9 20.2 3.8 15.1 6.6 613 18.0
LAG Dry season 1996 28.8 2.0 21.9 1.4 15.6 4.5 76 , 2.3 LAG Rainy season 1996 31.7 1.4 23.5 0.8 16.0 4.4 850 17.4 MD Winter season 1996 30.0 1.7 22.6 1.4 18.0 4.3 26 1.3 MD Dry season 1996 32.5 1.4 25.1 0.9 19.6 3.8 503 14.3 MD Rainy season 1996 31.2 1.5 24.4 1.0 17.7 4.0 864 16.3
FAIZ Rainy season 1993 32.1 2.2 23.7 4.1 15.8 3.6 306 8.1
IL0 Rainy season 1996 31.1 , 1.3 22.6 0.9 18.8 4.2 854 20.1
CLUZ Central Luzon; F A Z Faizabad; HGZ Hangzhou; I L 0 110-110; LAG Laguna; MD: Mekong Delta. See Table 1 for list of variables. Mean daily value over the average crop cycle duration in the corresponding season and site. Standard deviation about the mean daily value over the average crop cycle duration in the corresponding season and site. Accumulated total rainfall during the average crop cycle duration in the corresponding season and site.
Plant Disease I March 2000 347
i---* -

.
t
I
. . I I I ' . P U G 1 '7'. , ''
P m A W
PALO1
I
I
L
I . . I . ' i
j
. . . i , I
' ! I
I . I
. I . , . I
l !
I I I
I 6 T I nl.
1 : PRMOS
PRUDI
I Ii3 Rice (%)
, !
: " 3
l . NTR (%)
€il Fallow (%) Legume (%)
I
l UDS (%) Cereal (%) ;
OMisc (%)
Fig. 2. Cluster analysis of components of cropping practices using a nearest neighbor method and a chi-square distance in six sites in tropical Asia. Six production situations (PR) are characterized. The analysis involves 10 categorized variables ("able 2). Some of the main cluster (PR) attributes are indi- cated on the left: insecticide use (IU, mean number of applications per cropping season), herbicide use (HU, mean number of applications), fungicide use (Fv, mean number of applications), drought stress (DS, mean rating), water excess (WE, mean rating), crop establishment method (direct seeding, DS, or transplanting, TR the sectors represent proportion of fields established in each PR), and crop preceding the rice crops (rice, fallow, legume, cereal, or miscellaneous crops, sectors represent fraction of preceding crops in each PR). Mean yields (Y) in each PR are indicated by solid bars. Y was not involved in the analysis. Within-site clusters (labeled PR SITE no., e.g., PRCLUZI) generated from preliminary cluster analyses (not shown) using the same proce- dure are indicated.
i
i
348 Plant Disease / Vol. 84 No. 3

- direct-seeded fields, although the preva- while PR3 is associated with IN3 and IN5, cates that, although a good description of lence (percent fields affected) of the dis- and PR5 and PR6 are associated with IN2. yield variation (a clearly delineated path) ease is the same in both types of crop es- Thus, patterns of cropping practices and can be achieved when injury profiles are tablishment. injury profiles are closely related, regard- considered, no specific injury profile ap-
Simple correspondence analyses. less of the site. In the second analysis, a pears to be strongly directly associated Three contingency tables, [IN x PR], [PR path of increasing levels has been drawn with a given yield level. x y], and [Isr x YJ, were submitted sepa- for the ordinal (categorized) variable, Y Correspondence analysis among clus- rately to correspondence analyses. In a l l (Fig. 5B, [PR x YJ). This path is mostly ters. The array of relationships portrayed three cases, only clusters with more than accounted for by the first (horizontal) axis in Figure 5A, B, and C can be addressed 30 individuals (n 1 30 fields) were in- and progresses from pattems of cropping in a single Burt table, which is similar in volved as active (axis-determining) vari- practices PR3 and PR5.to PRl, and toward construction to a correlation matrix, ables (i.e., PRl, PR3, PR5, and PR6; and PR4. PR6 and PR2 are comparatively except that each correlation is represented IN1, IN2, and IN3), while the other clus- away from this path, the former being by a contingency table. Additional in- ters were included as additional variables more associated with low yields, and the formation pertaining to the sites, .the in the analyses. In all three analyses, the latter with high yields. This analysis illus- weather types, and the yield levels was two first axes accounted for accumulated trates .the strong link between patterns of appended to the Burt table. The numerical inertia larger than 75%. Figure 5 shows the cropping practices and Y. The description outputs of the correspondence analysis graphic outputs of these analyses. of the same yield levels involves the two are shown in Table 8. The main features
Figure 5A ([IN x PR]) shows that PRl, first axes when injuries are considered of this analysis can be summarized as PR2, and PR4 are closely linked to INl, (Fig. 5C, [IN x Y]). This third graph indi- follo
,
Clusters of cropping practices across sitesa
PRlblc(148) PRZbsd(6) PR3ble(140) PR4btf(11) PR5bq81) PRsbrh(33)
MFij YMF 137 100 98 260 133 159, *
MMF 150 1 O0 100 272 129 162 SEMMF 6 11 4 12 6.5 11
FPí YFP 137 160 78 3 53 9 MFP 112 120 90 3 60 11 SEM, 6 36 2 3 ' 5 1
WCPiVI' , Hand 37.2 O 89.3 54.5 34.6 0 % Herb 60.8 O 10.7 45.5 61.7 ' 3 NW 2 100 o . O 3.7 97
MIU 2 2 O 6 1 1
HU' YHU 1 O . 0.2 1.9 1.2 0.2 SEMILI
MHU 1 O O 2 1 O SEMHU O O O O O. 1 o. 1
o. 1 O O 0.5 0.5 1 O O O O O 1
Fu' YN MN r
SEMN O O O O ,0.1 ' 0.2 ~
DS' YDS 0.6 0.8 3.7 1.3 2.5 1.9 MDS O 0.5 4 1 3 2 SEMDS o. 1 0.4 O ' 0.3 ' 0.1 0.2
WE' YWE O 0.3 O , o 0.4 0.7 MWE O O O O O O SEMWE O 0.2 O O 0.1 0.2 TR 68.2 100 72.9 100 30.9 O DS 31.8 ' O 27.1 O 69.1 100
pcim Rice 76.4 66.7 O O 5.1 . 100 Fa1 23.6 33.3 O O 4.9 O Leg , O O 15.7 o * O O
Misc O O 13.6 54.5 O O YY 4.8 4.6 3.5 6.7 3.8 3.9 MY 4.8 4.6 3.4 6.7 3.6 3.7 SEMy 0.1 0.2 0.1 0.3 0.1 0.3
IU' YIU . 1.9 1.7 - 0.2 5.5 1:4 1.5
o. 1 0.4 O O o. 1 0.2
WIB O O 70.7 ' 45.5 O O
y i . a
a Names of between-site clusters are followed by the total number of fields belonging to the clusters. ' CLUZ Central Luzon; FAIZ: Faizabad; HGZ Hangzhou; LO: 110-110; LAG Laguna; M D Mekong Delta. PR1 includes the within-site clusters PRCLUZI, PRCLUZ3, PRHGZI, and PRHGZ2, having 87,39, 14, and 8 fields, respectively. PR2 includes the within-site cluster PRCLUZS, having 6 fields. PR3 includes the within-site clusters PRFAIZI, PRFAIZ2, PRFAIZ3, PRFAIZII, PRFAIZIS, and PRIL03, having 79, 8, 12,21,5, and 15 fields, respec- tively. PR4 includes the within-site cluster PRHZ3, having 11 fields.
S PR5 includes the within-site clusters PRILOI, PRILOZ, PRLAGl, PRLAG4, and PRMD4, having 14,7,18,7, and 35 fields, respectively. ' PR6 includes the within-site clusters PRMD4 and PRMD5, having 23 and 10 fields, respectively. ' See Table 1 for list of variables. j Y = mean, M = median, SEM = standard error of the mean. ' Percent fields with Hand = some hand weeding; Herb = exclusive reliance on herbicides for weed control; NW =no direct weed control measure.
mPercent fields with: Rice: rice; Fa1 fallow; Leg: legume; W/B: wheat or barley; Misc: miscellaneous crops, preceding the surveyed rice crop. TR =percent transplanted; DS = percent direct-seeded fields in the cluster.
Yield estimates were not included in the clustering.
Plant Disease / March 2000 349
t
The two first axes that were generated accounted for an accumulated inertia of 85.3%. PR3 and IN3 are strongly associ- ated along, and are major defining vari- ables of, axis 1. PR1, PR5, and PR6, and IN1 and IN2 are the main variables defin- ing the second axis. On this axis, PRl and M1 are associated and opposed to PR5, PR6, and IN2 in another group of vari- ables. These two first axes account very well for variations in PR and IN across most sites. Each site described with these two sets of (synthetic) variables is there- fore well described in this analysis (the
poorest description is that of LO, with an accumulated inertia accounted for of only 7.77%, followed by LAG at 67.5%, up to FALZ at nearly 100%). The two first axes also provide a very good description of all yield levels (from 82.6%: Y2 to 95.0%: Y4) except Y3 (2.37%)-the midrange of yield levels-which is very close to the origin of axes and therefore cannot have a large inertia. Coordinates of yield classes on both axes indicate strong yield gradi- ents. The reciprocal contributions of weather pattems accumulated on both axes range from 87.4 to 99.8%. Thus, the analy-
I
im
a I
6 B
O
sis yields an excellent representation of weather pattems.
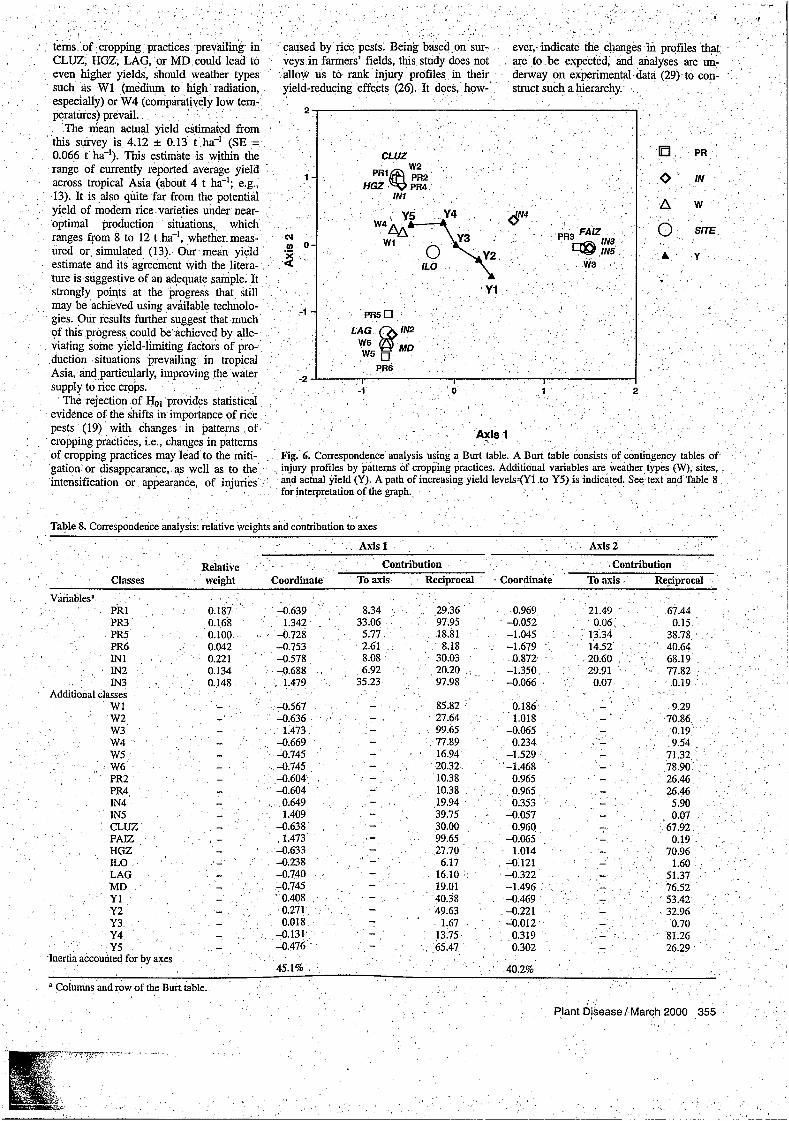
The graphic output of the analysis is shown in Figure 6. Three groups of vari- ables are distinguished (i) a first group, centered around PR3 and including IN3 and IN4, which is associated with W3 and corresponds to FAIZ; (ii) a second group, centered around PRl and including P E , PR4, and INl, which is associated with W2 and corresponds to CLUZ and HGZ, and (iii) a third group, involving PR5 and PR6 and including IN2. This group is as- sociated with W5 and W6 and corresponds
Chi-square distance 7Dop 5ooo I
I “1 1
Fig. 3. Cluster analysis of injuries using a nearest neighbor method and a chi-square distance in six sites in tropical Asia. Five production situations (IN) are characterized. The analysis involves 14 categorized variables (Table 2). Characteristics of injury profiles are outlined on the left (vertical bars represent injury levels made relative to the highest within-cluster mean level): BLB: bacterial leaf blight; SR stem rot; SHR: sheath rot; SHB: sheath blight; BS: brown spot; LB: leaf blight; NB: neck blight; P H plant hoppers; RWM: rice whorl maggot; L F leaf folder; D H dead hearts; WH white heads; W A weed infestation above the crop canopy; and WB: weed infestation below the crop canopy. Within-site injury clusters (labeled INJ SITE, no., e.g., INJCLUZI) generated from preliminary cluster analyses (not shown) using the same procedure are indicated.
350 Plant Disease / Vol. 84 No. 3
O -

I
to LAG and MD. A path of increasing yield levels has been outlined in Figure 6 indicates that this group is associated with and indicates a regular increase from PR3 a range of yields, from low to high. and IN3 (the first group, associated with FAIZ and weather type W3) to PR1 and DISCUSSION IN1 (the second group, corresponding to Some of the injuries listed in Table 3 CLUZ and HGZ, with weather type W2). appear near-omnipresent (SHR, SHB, BS, This path of yield increase also tdces the PH, RWM, LF, DH, FVH, and particularly, direction of W1 and W4. The location of WA and WB), while others are not (BLB, PR5, PR6, and IN2 (the third group) rela- SR, LB, NB). Rice tungro disease and rat
Table 6. Characteristics of injury profiles of rice crops generated from cluster analyses across six sites in tropical Asia
of increasing yield lev injuries, which were included in the survey procedure at all sites, were not considered in the analyses because of their low preva: lence and their site-specificity. One strik- ing result of this study is the comparatively low prevalence of the most commonly cited and studied rice disease: leaf blast. This leads to two interpretations: (i) the currently deployed rice varieties exhibit a sufficient level of resistance to the disease, and (ii) this disease heavily depends on climatic conditions to develop strong epi- demics, which were not encountered in all sites or seasons covered by the analysis. The survey indeed covered environments
mlb,c(180) mZb,d(lOS) m3btC(123) m4b>f(14) m5bq4) where strong blast epidemics should be expected (33, but they did not occur, pri-'
1 marily because of the regular release and deployment of resistant varieties. Similar
8.5 3.6 O O O reasoning codd be applied to several other O 0 s O O ' o injuries, such as BLB, NB (both with a '
SEMSR ' 1.4 1 . O O O wide range of prevalences, Table 3), or
MSHR O 0.6 7.5 3.5 O prevalences). That a particular injury prevails ìn SEMSHR 0.2 0.8 0.5 2.4 O
nearly all sites or season is not necessarily SHBh YSHB 12.1 6.1 9.9 17.9 O
an indication of its importance. By con- MSHB
trast, some injuries may occursporadically SEMSHB
MBS O 28 679 207 144 and cause considerable yield reductions. 2 89 43 1 o9 ,64 Rice tungro disease exemplifies this type
LBh YLB O 49 79 O 4 of injury (4). A combination of information on occurrences of injuries and on experi- mehtal measurement of yield losses they may cause is necessary to assess the im- portance of a given injury. This paper deals
PHh YPH 33 40 O O O with the first category of information only, 14 19 O 8 0 O i.e., the occurrence of injuries and their
RWMh YWM 161 145 36 23 26 While six clusters of cropping practices . were identified, only four (PRI, PR3, PR5, MWM 50 50 28 17 44
and PR6) accounted for fhe large majority S E M w 17 22 3 7 12
LP YLF 1 24 200 r 63 69 101 of fields and were further involved in the 43 83 55 .60 84 analysis as active variables. PR1 is the MLF
SEM, r 19 30 4 14 17 DHb YDH 1.5 1.9 3.4 0.1 1 most common pattern and is shared by two
MDH 0.2 0.8 3.1 O O sites (Fig. 4B). It consists essentially of fields in a rice-rice rotation, with relatively 0.2 0.2 0.3 0.1 . 1 SEMDH high input, relatively long fallow periods, W H h . Y w 2.4 1.9 5.8 0.4 O
and transplanted crops. PR3 typifies fields Mvm 0.8 O 5.9 o . O SEM- 0.3 0.4 0.2 o. 1 O
280 25 of the rice-wheat system of southern Asia, WAh YWA 291 429 282 with their diversity of rotations and low 103 250 175 138 33 inputs (except in the form of labor). Inter- SEMWA 44 51 32 108 11
WB" ywe 300 557 325 707 33 estingly, this pattern is also found in IL0 MWB 100 256 242 275 33 ' (Philippines), presumably because of the SEM, 40 70 33 244 24 similarities in rotations and low (chemical)
inputs. PR5 is not represented by a large y h j YY 4.6 3.9 3.5 4.3 3.3 3.1 population of fields, but it is shared by MY 4.7 3.7 , 3.4 4
SEMy o. 1 o. 1 0.1 0.4 0.3 three very different sites (LO, LAG, and
M~~ of these fields are direct
low input, Often in a
.
Clusters of injury profiles across sitesa
YSR
MSR SRh
SHRb YSHR 1.3 3.6- 7.3 6.4 O even PH (which exhibits generally high I
4.2 2.7 8.6 11.4 O 1.3 0.8 0.9 4.7 O
BS" YBS 7 628 727 345 216
SEMBS
MLB O O O O O SEMm Q 15 26 O 4
NB" YNB O 0.9 4.7 0.6 O MNB O O O , o SEMM O 0.3 0.9 0.4 O
O
I MPH SEMPH 4 5 O O O agroecological context.
.
MWA
'
a Names of between-site clusters are followed by the total number of fields belonging to the clusters. CLUz Central Luzon; F m Faizabad; H G z Hangzhou; IL0 110-110; LAG: Laguna; M D Me- seeded (often at very high rates), with kong Delta. IN1 includes the within-site clusters INJCLUZ1, INJCLUZ2, INJCLUZ6, INJILOI, INJIL02, INJHGZl, and INJHGZ2, having 113,7,6,9, 19,18, and 8 fields, respectively. rice monoculture. PR6, which is found in
MD ody,'typifies the very intensive rice and "4, having 6,7,24,22,10, 18, and 21 fields, respectively. production systems of Southeast Asia- IN3 includes the witbin-site clusters INJFAJZl and INJFAIZ5, which have 98 and 25 fields, re- and concerns agronomists (10,13) and spectively. plant pathologists (5,s) with respect to its IN4 includes the within-site clusters INJFAIzll and INJHGZ3, which have 10 and 4 fields, respec- sustainability. ~i~~ fields in this are
part of an intense rice monoculture with tively.
See Table 1 for list of variables. high (chemical) input. The main result achieved at this step of the analysis is that a few patterns of cropping practices were
351
d IN^ includes the within-site clusters INJCLUZA, INJIL05, INJLAG1, "DI, INJMD2, INJMD3,
g IN5 includes the within-site cluster INJFAIZ8, which has 4 fields.
i Y = mean, M = median, SEM = standard error of the mean. j Yield estimates were not included in the clustering.
Plant Disease I March 2000 ,

identified, ‘among on key piofiles of injuries due to rice pests. tionship with variation in actual yield is across sites and seasons. As for the patterns of cropping practices, found neither with the amount of fertilizer
Of the five clusters of injuries found, some of these profiles are s h e d by very application (MF) nor withthe type of weed three (INI, IN2, and IN3) accounted for distant sites, while one cluster (IN3) is control practice (WCP. This must be as- most of the fields surveyed. IN1 is an in- site-specific. cribed to complex relationships among jury profile where tiller injuries (SHB *and Two sets of clusters, the patterns of components of the pattems of cropping SR) predominate, along with PH and cropping practices and the injury profiles, practices, which need to be addressed as
‘ RWM. This profile is common to three were thus considered, and the first null groups using a multivariate approach. The Very distant sites: HGZ, CLUZ, and IL0 . hypothesis, &: “There is no linkage be- link between pesticide use (IU, HU, and (Fig. 4C). IN2 is characterized by the oc- tween cropping practices and injuries’z was FU) and Y has several interpretations, currence of BLB and comparatively high tested. A high chi-square value was found, some of which are not exclusive: (i) pesti- levels of BS, LB, RWM, and LF. Weed and the null hypothesis was rejected (P < cides ensure higher yield by suppressing infestation is also the highest in IN2. This , 0.0005). In addition, both null hypotheses injuries (i.e., there is indeed a yield-pro- profile is found in four sites (CLUZ, LAG, pertaining to independence between actual tecting effect of pesticides); (ii) pesticide EO, and MD) and appears characteristic yield and cropping practices or injury pro- use is associated with other cropping prac- of the wann, humid tropics of Southeast files were rejected (P < 0.0005). These tices that ensure higher yields fi.e., pesti- Asia. Injury profile IN3 is associated with additional tests further indicate that the cides are associated with production situa- high levels of SHR, NB, DH, and WH, in clusters, for pattems of cropping practices tions where several yield-limiting factors addition to some of the injuries found in and for injury profiles did capture a rele- . are mitigated, and thus, with higher attain- IN2 (BS, LB) or both IN1 and IN2 vant amount of information that accounts able yields); and (iii) high pesticide use, (RWM). By contrast with the two first for yield variation. The very strong linkage albeit inefficient, is a reflection of the si- profiles, this third one is found in only one . between weather pattems and injury pro- multaneous occurrence of both high inju- site (FAIZ), where it predominates. High files may account for relationships between ries (and farmer‘s reactions) and good crop BS, DH, and SHR (the latter two being injuries and weather. The equally strong stands (i.e., pesticides are associated with frequently associated injuries) indeed are linkage between weather pattems and pat- both good production situations-and high typical of the biotic constraints of rice in tems of cropping practices, on the other attainable yield-and the occurrence of the rice-wheat system of southern Asia hand, suggests that patterns of cropping injuries that have no, or marginal, yield- (20). It is worth noting that a fourth profile practices are strongly influenced . by reducing effects). Yield-reducing effects of (IN4) was found to be shared by two very weather patterns. SHR, BS, NB, and weeds (especially WA) distant sites (FAIZ and HGZ), where crop- Although considerable caution must be , seem prominent from the examination of ping practices and environments are ex- exerted in examining individual contin- contingency tables and chi-square tests tremely different except for the rotation: gency tables, some conclusions can be (Table 7). these two sites belong to the so-called rice- derived from the tests listed in Table 7. Figure 5A shows how strongly injury wheat system of Asia. However this pro- These conclusions are drawn from chi- profiles are associated with pattems of file, which corresponds to high SHR, SHB, square values and probability levels, and cropping practices: IN1 with PRI, PE, and WB, is represented by 14 fields only also from the actual pattem of each contin- and PR4; IN3 and IN5 with PR3; IN2 with and was not directly used in further ana- gency table (not shown). Among the yield- PR5 and PR6. Such a strong linkage be- lytical steps. This step of the analysis limiting factors, drought stress OS) ap- tween injury profiles and pattems of crop- therefore allowed us to achieve the char- pears the single most important one. Rather ping practices was found in earlier case acterization of a few-in practice, three- surprisingly, such a straightforward rela- studies (8,25,30; D. Zhu; Q. Tang, S.
’
, <
Table 7. Chi-square tests on the effects of yield limiting and yield reducing factors (Y-variables) on variation of actual yield (X-variable)
Variable type Variab19 X * ~ X , ~ df P Remarks and comments derived from examination of contingency tables
Cropping practices (and yield -limiting factors) MF 37.1 8 <0.0005 I High MF associated with higher yield than medium or low FP 43.9 12 <0.0005 Short or medium FP associated with lower yields than long or extensive FP WCP 18.0 8 0.02 Herbicide use associated with higher yields than hand weeding IU 49.8 12 <0.0001 Medium or high insecticide use associated with higher yields than no insecticide use Hu 30.8 8 0.0002 Low (and not high) HU associated with higher yields than no herbicide use Fu 34.9 sw 4 <0.0001 Fungicide use associated with higher yields DS 65.7 8 <0.0001 Water stress associated with lower yields , WE 33.0 4 <O.OpOI Water excess associated with lower yields PM 38.4 4 <0.0005 Transplanting associated with higher yields than direct seeding PC 58.7 ’ 16 <0.0005 Variable yield associated with PC = Fal, Leg, or Misc. ; higher yields associated with
Pc = Rice
I
Injuries (reducing factors) BLB 17.8 8 0.02 High BLB associated with lower yields SR 27.6 8 0.006 High SR associated with high (Y4) but not very high (Y5) yields S H R 38.6 8 <O.GO01 High SHR associated with lower yields SHB 15.9 8 0.04 High SRB, as well as absence of SHB, associated with low (Yl) yields . BS I 70.9 8 <O.GO01 High BS associated with low yields LB 40.3 8 <0.0001 High LB associated with either low (YI) or high (Y5) yields NB 24.6 8 0.002 High NB associated with low yields
18.8 8 0.02 High PH, as well as absence of PH, associated with high yields 14.5 8 <0.0001 Absence, as well as high, RWM associated with high yields
LF 29.9 8 0.0002 Absence of LF associated with high yields DH 18.2 8 0.02 High DH associated with low yields WH 16.0 8 0.04 High WH associated with low yields WA 29.9 8 0.04 High WA associated with low yields WB 60.9 8 <0.0001 High WB associated with low yields, and low WB associated with high yields
E f M
See Table 1 for variable list.
Plant Disease 1 March 2000 353

1 PR4 A P R l b PR2
0.5 - IN1 O
I N4 IN3 0 - O 0
IN5 N tn 2 -0.5 - .-
Y I I I I
El PR5 -1 -
o IN2 PR6
-1.5
.'..X..'-.
' . .
levels are indirect: In spite of the high chi- square value of the [injury profiles x yield level] contingency table, the relationship between the two variables is a complex one, which may involve another, interme- diate variable. It is hypothesized that this intermediate variable is the pattem of cropping practices. This interpretation is supported by the strong, linkage between patterns of cropping practices and weather patterns, the former (farmers' practices) being strongly influenced by the latter (prevailing climate).
0 PR6 PR4 U
1
B 0.5 -
Y2 Y3
a,.: &R:
cy m 0 -
2
I I , PR2n El -0.5 -
-1
contributions of axes to describing yield levels are high (Table S), indicating that, this correspondence analysis captures a large fraction. of the - variation -in actual yield levels. The same remark holds true for weather pattems and for most sites (IL0 excepted). This analysis involving PR and IN clusters as active variables thus generates a sound framework from the agronomic (PR), pests (IN), weather (W), and sites standpoints to analyze variation in actual yield. Three main groups of vari- ables are distinguished ín Figure 6: ,
0.2
C 0.1 -
cy tn 0 - - 2
IN2 -0.1 - Y1
-0.2 o IN4
1 1 - I
2. PR3, associated with IN3 and IN5, under weather type W3 in FA=,
3. PR5 and PR6, associated with IN2, under weather type W5 and W6 in MD and LAG.
As in the previous correspondence analyses, a path of increasing yield levels is drawn, which moves away from the second group to a direction intermediate between the first and the third groups. The
' highest yield category (Y5) is located be- tween the first and the third groups, indi-
.
cating that it is associated to both. Fur-
. - _ 1 .
g in CLUZ, HGZ, LAG, or MD could lead to even higher yields, should weather types such as W1 (medium to high radiation, especially) or W4 (comparatively low tem- peratures) prevail.
The mean actual yield estimated from
PR this survey is 4.12 k 0.13 t ha-' (SE = 0.066 t ha-'). This estimate is within the range of currently reported average yield across tropical Asia (about 4 t ha-'; e.g., 0 IN 13). It is also quite far from the potential yield of modem rice varieties under near- optimal production situations, which ranges from 8 to 12 t ha-', whether.meas- ured or simulated (13). Our mean yield estimate and its agreement with the litera- ture is suggestive of an adequate sample. It strongly points at the progress that still may be achieved using avklable technolo- gies. Our results further suggest that much of this progress could be achieved by alle- viating some yield-limiting factors of pro- duction situations prevailing in tropical Asia, and particularly, improving the water supply to rice crops. ,
The rejection of Hol provides statistical evidence of the shifts in importance of rice pests (19) with changes in pattems of cropping practices, i.e., changes in pattems of cropping practices may lead to the miti- gation or disappearance, as well as to the intensification or appearance, of injuries
caused by rice pests. Be ed on sur- veys in farmers' fields, this study does not allow us to rank injury profiles in their yield-reducing effects (26). It does, how-
ever, indicate the changes in profiles that are to be expected, and analyses are un- derway on experimental data (29) to con- struct such ahierarchy.
'A w
SfTE
A Y
&is 1
Fig. 6. Correspondence analysis using a Burt table. A Burt table consists of contingency tables of injury profiles by patterns of cropping practices. Additional variables are weather types 0, sites, and actual yield (Y). A path of increasing yield levels:(YI to Y5) is indicated. See text and Table 8 for interpretation of the graph.
Table 8. Correspondence analysis: relative weights and contribution to axes
Axis 1 Axis 2
Relative Contribution Contribution Classes weight Coordinate To axis Reciprocal Coordinate To axis Reuprocal
PRl O. 187 -0.639 8.34 29.36 0.969 21.49 67.44 PR3 0.168 ~ 1.342 33.06 97.95 -0.052 0.06 0.15
PR6 0.042 -0.753 2.61 8.18 -1.679 14.52 I 40.64 IN 1 0.221 -0.578 8.08 30.03 0.872 20.60 , 68.19 IN2 , 0.134 -0.688 6.92 20.20 -1.350 29.91 77.82 IN3 . 0.148 1.479 35.23 97.98 -0.066 0.07 0.19
WI - -0.567 - 85.82 0.186 - 9.29 27.64 1 .o1 8 - , 70.86 W2 - -0.636 -
w 3 - 1.473 - 99.65 ' -0.065 - 0.19 , 71.89 0.234 3 - 9.54 - -0.669 -
16.94 -1.529 - 71.32 - -0.745 - , W4
20.32 -1.468 - 78.90 , - -0.745 - w5 W6
10.38 0.965 - 26.46 - -0.604 - PR2 10.3 8 0.965 - 26.46 - -0.604 - PR4 19.94 0.353 - 5.90 - 0.649 - IN4
IN5 - 1.409 39.75 -0.057 - 0.07 30.00 0.960 - 67.92 - -0.638 - CLUZ
FAIZ - 1.473 99.65 -0.065 - 0.19 27.70 1.014 - 70.96 6.17 -0.121 - 1.60
HGZ , - -0.633 L O - -0.238
16.10 ' -0.322 - 51.37 MD - -0.145 19.01 -1.496 - 76.52 LAG
40.38 -0.469 - 53.42 Y1 Y2 - 0.27 1 49.63 -0.221 - 32.96
1.67 -0.012 - 0.70 Y3 13.75 0.319 - 81.26 Y4 6 0.302 - 26.29 Y5
Variablesn
PR5 0.100 -0.128 5.77 18.8 1 -1.045 13.34 38.78
Additional classes
-
- - -
- -0.740 -
- * 0.408 -
- 0.018 - - -0.131 - - -0.476 -
-
-
Inertia accounted for by axes
a Columns and row of the Burt table.
45.1% 40.2%
Plant Djsease / March 2000 355
This study emphasizes that pest man- agement strategies should be based on pattems of cropping practices, and more broadly, on production situations. It further illustrates how production situations may vary from one field to another in the same site, sometimes within a range of a few meters, owing to variations in farmers‘ management practices. Developing pest management strategies may thus appear a daunting task. However, this study shows that, whether the scale considered is the individual site or a region such as tropical Asia, common pattems of cropping prac- tices and injury profiles can be determined. The approach outlined here therefore pro- vides an avenue for% developing fíeld-spe- cific, yet general, domains for pest man- agement strategies for rice.
The meta-analysis presented here may provide a broad framework on rice pest problems encountered in tropical Asia. The similarities and dissimilarities among sites that this framework highlights may be helpful for multinational resource alloca- tion to research. With respect to diseases, for instance, stem rot and sheath blight appear to be the most common diseases in well-managed crops of Southeast Asia’s ?ice bowls” typified by PRI; brown spot and sheath rot appear to dominate the dis- ease profile in southem Asia’s rice-wheat system (PR3), in combination with many other diseases such as sheath blight and leaf and neck blast. Occurrence of bacterial leaf blight and blast, along with high levels of brown spot, characterize the disease profile where rice is mostly direct-seeded in a monocrop with frequently high input (pR5 and PR6).
ACKNOWLEDGMENTS This research was partly funded by the French
Ministry of Foreign Affairs, the French Ministry of Research, and a grant from the Rockefeller Foundation. We are grateful to T. W. Mew and K. S. Fischer at IRRI and to R. W. Herdt at the Rockefeller Foundation for their support, and to Nancy Castilla and Orlando Calcetas for assistance in processing and managing data.
LITERATURE CITED 1. Bailey, R. G. 1996. Ecosystem Geography.
Springer-Verlag. New York. 2. Benzecri, J. P. 1973. L‘Analyse des Donntes.
Tome 2. L‘Analyse des Correspondances. Dunod, Paris.
3. Boote, K. J., Jones, J. W., Mishoe, J. W., and Berger, R. D. 1983. Coupling pests to crop growth simulators to predict yield reductions. Phytopathology 73:1581-1587.
4. Chancellor, T. C. B., Teng, P. S., and Heong, K L., eds. 1996. Rice tungro disease epide- miology and vector ecology. IRRI Discussion Pap. Ser. 19, Los Baños, Philippines.
5. Cu, R. M., Mew, T. W., Cassman, K. G., and Teng, P. S. 1996. Effect of sheath blight on yield in tropical, intensive rice productions system. Plant Dis. 8 0 1103-1 108.
6. DagnBlie, P. 1973. Theorie et M6thodes Sta- tistiques. Applications Agronomiques. Vol. 2. Presses Agronomiques de Gemblow.
7. De Wit, C. T., and Penning de Vries, W. W. T. 1982. L’analyse des systbmes de production primaires. Pages 275-283 in: La Productivitt des Pâturages SahBliens. W. W. T. Penning de Vries and M. A. Djiteye, eds. Agricultural Re- search Report 918, Pudoc, Wageningen, Netherlands.
8. Du, P. V., and Savary, S. 1997. A survey of rice constraints in the Mekong delta. Intem. Rice Res. Notes 2243-44.
9. Elazegui. F. A., Soriano, J., Bandong, J., Estominos, L.. Jonson, I., Teng, P. S., Shepard, B. M., Litsinger, J. A., Moody, K., and Hibino, H. 1990. Methodology used in the IRRI integrated pest survey. Pages 241- 271 irk Crop Loss Assessment in Rice. IRRI, Los Baños, Philippines.
10. Flinn, J. C., and De Datta, S. K. 1984. Trends in imgated rice yields under intensive crop- ping at Philippine research stations. Field CropRes. 9:l-15.
11. Gibbons, J. D. 1976. Non Parametric Methods for Quantitative Analysis. Holt, Rinehart and Winston, New York.
12. Greenacre. M. J. 1984. Theory and Applica- tions of Correspondence Analysis. Academic Press, London.
13. Greenland, D. J. 1997. The Sustainability of Rice Farming. CABI-IRRI, Wallingford, U.K., Los Baños, Philippines.
14. Intemational Rice Research Institute. 1995. World Rice Statistics 1993-1994. IRRI, Los Baños, Philippines.
15. Lebart, L., Morineau, A., and Ftnelon, J. P. 1982. Traitement des Donntes Statistiques. Mtihodes et Programmes. Dunod, Paris.
16. Lebart, L., Morineau, A., and Piron, J. P. 1995. Statistiques Exploratoire Multidimen- tionnelle. Dunod. Paris.
17. McCool, P. M., Younglove, T., Musselman, R. C., and Teso, R. R. 1986. Plant injury analy- sis: Contingency tables as an alternative to analyses of variance. PIant Dis. 70357-360.
18. Mew, T. W. 1991. Disease management in rice. Pages 279-299 in: CRC Handbook of Pest Management in Agriculture. 2nd ed. Vol. III. D. Pimentel and A. A. Hanson, eds. CRC Press, Boca Raton, FI...
19. Mew, T. W. 1992. Management of rice dis- eases-A future perspective. Pages 54-66 in: Pest Management and the Environment in 2000. A. Aziz, S. A. Kadir, and H. Barlow, eds. CAB Intemational, Wallingford, U.K.
20. Nagarajan, S. 1989. Plant protection problems in rice-wheat rotation system-A perspective.
21. Ou, S. H. 1987. Rice Diseases. 2nd ed. CAB Intemational, Famham House, Famham Royal, Slough, England.
22. Rabbinge, R. 1993. The ecological back- ground of food production. Pages 2-29 in: Crop Protection and Sustainable Agriculture. D. J. Chadwick and J. Marsh, eds. Ciba Foun- dation Symposium 177. John Wiley & Sons, Chichester, England.
23. Rabbinge, R. D., and De Wit, C. T. 1989.
O v ~ a 26329-333.
f Systems, models and simulation. Pages 3-15 in: Simulation and Systems Management in Crop Protection. R. Rabbinge, S. A. Ward, and H. H. Van Laar, eds. Pudoc, Wageningen, Netherlands.
24. Rabbinge, R., and Rijsdijk, E H. 1981. Dis- ease and crop physiology: A modeller’s point of view. Pages 199-220 in: Effects of Disease on the Physiology of the Growing Plant. P. G. Ayres, ed. Cambridge University Press, Cam- bridge.
25. Savary, S., Elazegui, E A., Moody, K., and
1
Teng,- P. S. 1994. Characterization of rice cropping praclkes and multiple pest systems in the Philippines. Agric. Syst. 46385-408.
26. Savary, S. Elazegui, F. A., Pmchmidt, H. O., and Teng, P. S. 1997. Characterization of rice pest constraints in Asia: An empirical ap- proach. Pages 83-98 in: Applications of Sys- tems Approaches at the Farm and Regional Levels. P. S. Teng et al., eds. Kluwer Aca- demic Publishers, Dordrecht, Netherlands.
27. Savary, S., Elazegui, F. A., and Teng, P. S. 1996. A survey portfolio for the characteriza- tion of rice pest codstraints. IRRI Discussion Pap. Ser. 18, Los Baños, Philippines.
28. Savary, S., Madden, L. V., Zadoks, J. C., and Klein-Gebbinck, H. W. 1995. Use of categori- cal information and correspondence analysis in plant disease epidemiology. Adv. Bot. Res. incorporating Adv. Plant Pathol. 21:213-240.
29. Savary, S., Pinnschmidt H. O., Elazegui, F. A., Castilla, N. P., and Teng, P. S. 1997. A new approach to quantify crop losses due to rice pests in varying production situations. IRRI Discussion Pap. Ser. 20. IRRI, Los Baños, Philippines.
30. Savary, S., Srivastava, R. K., Singh, H. M., and Elazegui, F. A. 1997. ‘A characterization of rice pests and quantification of yield losses in the rice-wheat system of India. Crop Prot.
31. Shepard, B. M., Khan, Z. R., Pathak, M. D., and Heinrichs, E. A. 1991. Management of insect pests of rice in Asia. Pages 255-278 in: CRC Handbook of Pest Management in Agri- culture. Vol. III. D. Pimentel and A. A. Han-
. son, eds. CRC Press, Boca Raton, E. 32. Teng, P. S. 1990. Current knowledge on crop
losses in tropical rice. Pages 38-53 in: Crop Loss Assessment in Rice, IRRI, Los Baños, Philippines.
33. Teng, P. S. 1990. Integrated Pest Management in Rice. An Analysis of the Status Quo with Recommendation for Action. Rep. USAID Pestic. Pest Manage. Proj.
34. Teng, P. S., Fischer, K. S., and Hossain, M. 1995. Meeting the food challenges of the 21st centuxy: The role of national and intemational rice research. Asian J. Trop. Biol. 1:l-21.
35. Teng, P. S., and Yuen, J. E. 1990. Epidemics models: Lessons from plant pathology. Pages 211-220 in: Risk Assessment in Genetic En- gineering: Environmental Release of Organ- isms. M. Levin and H. Strauss, eds. McGraw Hill, New York.
36. Van Ittersum, M. K, and Rabbinge, R. 1997. Concepts in production ecology for analysis and quantification of agricultural input-output combinations. Field Crops Res. 52197-208.
37. Zadoks, J. C., and Schein, R. D. 1979. Epi- demiology and Plant Disease Management. Oxford University Press, New York.
16387-397.
I
_ i
I
l
!
I
356 Plant Disease /Vol. 84 No. 3