Ricardo Ramirez - McConnell Foundation
14
EVIDENCE OF CHANGE THE SUSTAINABLE LIVELIHOODS FRAMEWORK - AN EVALUATION TOOL FOR VALUE CHAIN PROJECTS Ricardo Ramirez
Transcript of Ricardo Ramirez - McConnell Foundation

EvidEncE of changE the sustainable livelihoods framework -
an evaluation tool for value chain projects
Ricardo Ramirez
2 • Evidence of Change: The Sustainable Livelihoods Framework - An Evaluation Tool for Value Chain Projects • December 2015
Those that work to produce more local and sustainable food are often confronted with market forces that can make their efforts financially
perilous. Competing uniquely on price can be very difficult. However, we know that many Canadian consumers are motivated by more than simply price. A local food producer — a farmer, a fisher, or an artisan — can achieve success in ways that go beyond profits on a balance sheet. He or she can have a positive impact on the local community and environment — and also secure a livelihood while doing so. But how can these impacts be measured?
The Sustainable Livelihoods Framework is a tool that can be implemented in the food system in order to track change across several dimensions — physical, natural, financial, human and social — in order to systematically evaluate the results of a given project. Shifting food systems is complex and at times unpredictable, yet change happens. It is critical to have an effective way to demonstrate the value of a project to business partners, community members, policy makers, funders and other stakeholders. While business plans and financial reports provide important information about the state of a social enterprise, they don’t capture non-financial assets that are essential measures of project wellbeing.
The Sustainable Livelihoods Framework provides evidence of important changes in financial, human, physical, social and environmental assets. It can help demonstrate changes in local contexts while also signaling system-wide barriers that remain to be addressed. It allows results to be aggregated across a range of projects, so that patterns in different regional food systems initiatives can be seen. The goal of this document is to introduce this evaluation tool to partner projects and explain how it can be used, with the example of the Off the Hook Community Supported Fishery.
The intent is to support projects in the Regional Value Chain program to evaluate their progress and communicate their stories individually, as well as to see and communicate patterns in the group of projects.
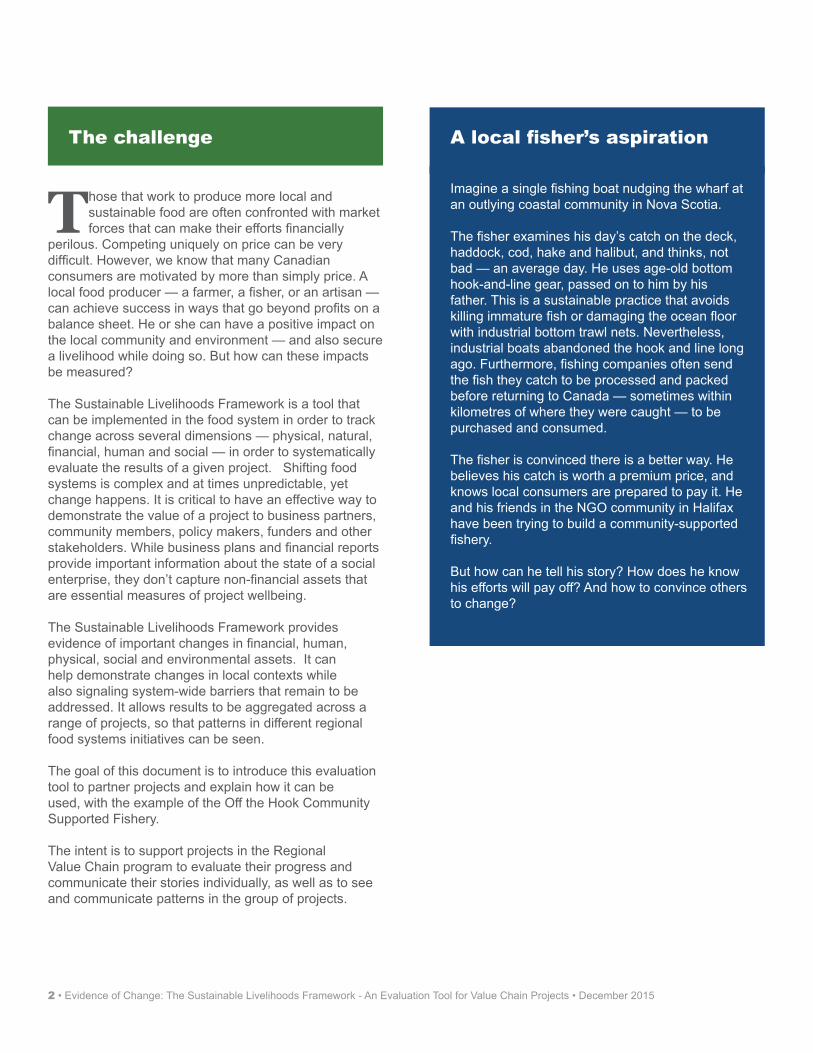
Imagine a single fishing boat nudging the wharf at an outlying coastal community in Nova Scotia. The fisher examines his day’s catch on the deck, haddock, cod, hake and halibut, and thinks, not bad — an average day. He uses age-old bottom hook-and-line gear, passed on to him by his father. This is a sustainable practice that avoids killing immature fish or damaging the ocean floor with industrial bottom trawl nets. Nevertheless, industrial boats abandoned the hook and line long ago. Furthermore, fishing companies often send the fish they catch to be processed and packed before returning to Canada — sometimes within kilometres of where they were caught — to be purchased and consumed.
The fisher is convinced there is a better way. He believes his catch is worth a premium price, and knows local consumers are prepared to pay it. He and his friends in the NGO community in Halifax have been trying to build a community-supported fishery.
But how can he tell his story? How does he know his efforts will pay off? And how to convince others to change?
The challenge A local fisher’s aspiration

Evidence of Change: The Sustainable Livelihoods Framework - An Evaluation Tool for Value Chain Projects • December 2015 • 3
The J.W. McConnell Family Foundation (JWMFF) and Food Secure Canada (FSC) have been collaborating since 2012 to support several projects as part of a funding and capacity-building program called the Regional Value Chain program. Projects work to intervene in and improve the food systems on several dimensions that go beyond production or purchasing of local or sustainably produced food. The interventions seek to improve the environment, local economic development and community wellbeing.
The projects are spread across Canada and are very diverse. FSC and JWMFF are interested in documenting change both at the project level and across the collection of projects.
The projects recognize the need to establish a baseline in order to be able to document change. However, they and their hosting organizations are unique and many are at an early stage of development. This makes it difficult to predetermine variables or indicators that are locally relevant and offer cross project comparability.
The proposed evaluation tool has three concrete evaluation purposes:• Providingfeed-back. Tracking changes so that
organizations leading the projects can understand what is changing.
• Obtainingproofofconcept.Learning about the value of the program strategy that funds projects to improve regional food systems.
• Communicatingresultsand showing common directions across a variety of food system interventions.
The above evaluation purposes are explored through the following evaluation questions:• What are the measurable outcomes taking place at
the project level?• To what extent can [some of the] outcomes be
compared across projects?• To what extent can the measurable outcomes be
attributed to the projects?• To what extent do the collection of project outcomes
signal system-wide (“landscape level”) barriers or enabling factors?
The evaluation approach needs to account for three features: a) the projects seek to track change across several, interrelated livelihood dimensions systematically, b) comparisons and aggregations across projects should be possible, and c) change should be monitored with the backdrop that projects evolve as part of broader complex and adaptive systems where some outcomes are difficult to predict.
The evaluation approach needs to accommodate a learning dimension to help the leaders of innovative projects learn from their work and obtain data for course correction.
There is a growing trend in social and environmental sectors towards tracking change along multiple dimensions. The terms “balanced score-cards” and “monitoring dashboards” are used to convey the notion of tracking indicators covering multiple dimensions that are interrelated (like a flight controller watching multiple screens). One prominent case is the Canadian Index of Wellbeing that combines federal and provincial data sets into eight interconnected domains (community vitality, democratic engagement, education, environment, healthy populations, leisure and culture, living standard, and time use).
The context Why the Sustainable Livelihood Framework?

4 • Evidence of Change: The Sustainable Livelihoods Framework - An Evaluation Tool for Value Chain Projects • December 2015
It’s a long way from Canada to Afghanistan, but nevertheless, the application of the Sustainable Livelihoods Framework in the latter country demonstrates its utility. Through the Garden Gate is a project aimed at strengthening the capacity of women entrepreneurs in the horticultural sector. It seeks to “improve agricultural productivity and access to markets for women farmers, resulting in increased family incomes; and to enable isolated rural women to become economic contributors through fresh vegetable value chain development and market integration.”
Obtaining baseline data for evaluating this project depended on asking women to provide information based on their recall of the state of various assets before the current study was initiated.
The assets measured were natural capital (number of hectares under production, change in land usage arrangement, perceptions on change in biodiversity) human capital (variation in diet, use of educational facilities); physical capital (inputs used -- fertilizer, water, etc., access to machinery); social capital (membership in community organizations, access to insurance groups, emergency funds, etc.); and financial capital (principal sources of income and related funds, funds or other assets with a savings function, etc.).
Some of the most impressive measured results were:• Increase of meat consumption by 65%
(nutrition indicator)• Improved water efficiency by use of drip
irrigation technology offered through project• Increased participation by women in
household decision making• Average revenue doubled since project inception• Access to credit increased from 2 % of
respondents before project to 75% three years after project launch
Source: Katenberg, L.; Khan, A. & Ruddick, S. 2011. Evaluating value chain impact using a sustainable livelihoods approach: A case study on horticulture in Afghanistan. Enterprise development and microfinance 22(3): 225-240
The Sustainable Livelihoods Framework (SLF) provides five dimensions or asset categories to develop baselines about the status of the project sites in a systematic manner (see the pentagon and the legend below: physical, natural, financial, human, and social).
The SLF locates the five asset categories inside a systems background, where the influence of vulnerabilities, organizational constraints, or policies and regulations are acknowledged. This backdrop is particularly important in evaluation in that a project may not be able to demonstrate that it was responsible for a measured change on its own (attribution). It may be more likely that the project can show a contribution, together with other factors that may have helped by chance, or through collaboration with other parties. Concretely, this means that if we were able to document a positive change in an asset type, we will want to refer to enabling or constraining factors – outside the project’s control – that may have helped to explain the change.
Example: a project manager documents a drop in the price of rented land for urban farming during the implementation of an urban project. Making land affordable happens to be one of the project’s goals. This change coincides with the introduction of a municipal by-law that makes some public parklands candidates for community vegetable plots, thus dropping the price of rental plots. If the project was not part of advocacy efforts to introduce the by-law, the project cannot attribute the change to its actions.
The SLF does not prescribe the types of assets within each category, as these are context specific, which allows each project to tailor the assets to their local context. 1
For example: for physical assets, a fishery project has listed boats, ice, bait, processing facilities; whereas an urban agriculture project is focusing on land, irrigation, tools and washing facilities.
Through the Garden Gate Introducing the Sustainable Livelihoods Framework

Evidence of Change: The Sustainable Livelihoods Framework - An Evaluation Tool for Value Chain Projects • December 2015 • 5
Off the Hook Community Supported Fishery. Ecology Action Centre, Nova Scotia. http://www.offthehookcsf.ca.
Community Supported Fisheries (CSFs) are modeled after “Community Supported Agriculture” (CSA) enterprises, which work to connect consumers to locally and sustainably grown, fairly traded foods. Social enterprises like CSFs help make sure that independent, small-scale fishing families can continue to pursue their livelihoods in an industry rapidly becoming dominated by large-scale, corporate players. Off the Hook’s CSF hopes to showcase a seafood-direct marketing enterprise that recognizes and nurtures the “triple bottom line”. It works to create opportunities for rural and urban communities to connect, creating more local market links, and generally spurring on a dialogue about local food, sustainable fisheries, and community health.
Off the Hook also helps to ensure that low-impact fishing gears like bottom hook and line can continue to be used to protect ocean resources into the future.
Our SLF tool consists of a set of spreadsheets made available for project partners in Google Docs. There is one spreadsheet for each type of livelihood asset, plus an extra one to document vulnerabilities. The effort at this stage is to assemble a baseline. Each project will decide on the relevant timing for a second measurement, likely after a full season is completed.
Case Study

6 • Evidence of Change: The Sustainable Livelihoods Framework - An Evaluation Tool for Value Chain Projects • December 2015
Assets were created under the five main asset categories, using assets relevant to this particular project.
Relevant asset categories
PhysicalAssets
HumanAssets
SocialAssets
NaturalAssets
• Boats• Equipment• Wharf• Ice• Bait• Processing capacity• Cold Storage / Aggregation
• Packing supplies• Transportation• Local retail• Local wholesale market• Distant markets (restaurants & wholesale)
• Skills (sustainable practices)
• Knowledge (sustainable practices)
• Training• Work, labour capacity• Health status• Entrepreneurial zest among fishers & families
• Entrepreneurial zest among DFO/NSDFA
• Entrepreneurial zest• among NGOs
• Relationships among fishers in same fleet
• Relationships among fishers in different (competing fleets)
• Relationships with processors
• Relationships among fishery organizations
• Relationships with local regulatory bodies (port authority)
• Relationships with provincial/ federal regulatory bodies
• Links to civil society / allies
• Value chain stakeholders• Strength of fishery organizations
• Access to licenses• Access to quota
• Catch volume (haddock)• Catch volume (cod)• Catch volume (pollock)• Catch volume (hake)• Catch volume (halibut)• Catch volume (total)• Biodiversity among commercial species
• Biodiversity in the marine environment
• Special status

Evidence of Change: The Sustainable Livelihoods Framework - An Evaluation Tool for Value Chain Projects • December 2015 • 7
FinancialAssets
Activity ratios: measures how efficiently day-to-day tasks are managed, and a projects ability to convert different accounts within its balance sheets into cash or sales
Liquidity ratio: measures the ability to meet short-term obligations
Solvency ratio: Debt ratios: measure the amount of debt used in the business; Coverage ratios: measures the ability to meet long-term obligations
Profitability & sustainability ration: measures the company’s (or project’s) ability to generate profits
• Days to inventory at hand• Days of sale outstanding• Days of payables outstanding
• Current ratio (working capital ratio)• Effective liquidity management (working capital management)
• Debt-to-asset ratio
• Sales growth (%)• Operating self-sufficiency• Gross profit margin (%)• Net profit margin ratio (5)• Reliance on volunteer labour

8 • Evidence of Change: The Sustainable Livelihoods Framework - An Evaluation Tool for Value Chain Projects • December 2015
The chart below shows how the Ecology Action Centre (EAC, Halifax) has filled in one of the tables (note that blank cells indicate items that are not relevant, do not need to be filled in).
Example: Ecology Action Centre
Evidence of Change: The Sustainable Livelihoods Framework - An Evaluation Tool for Value Chain Projects • December 2015 • 9
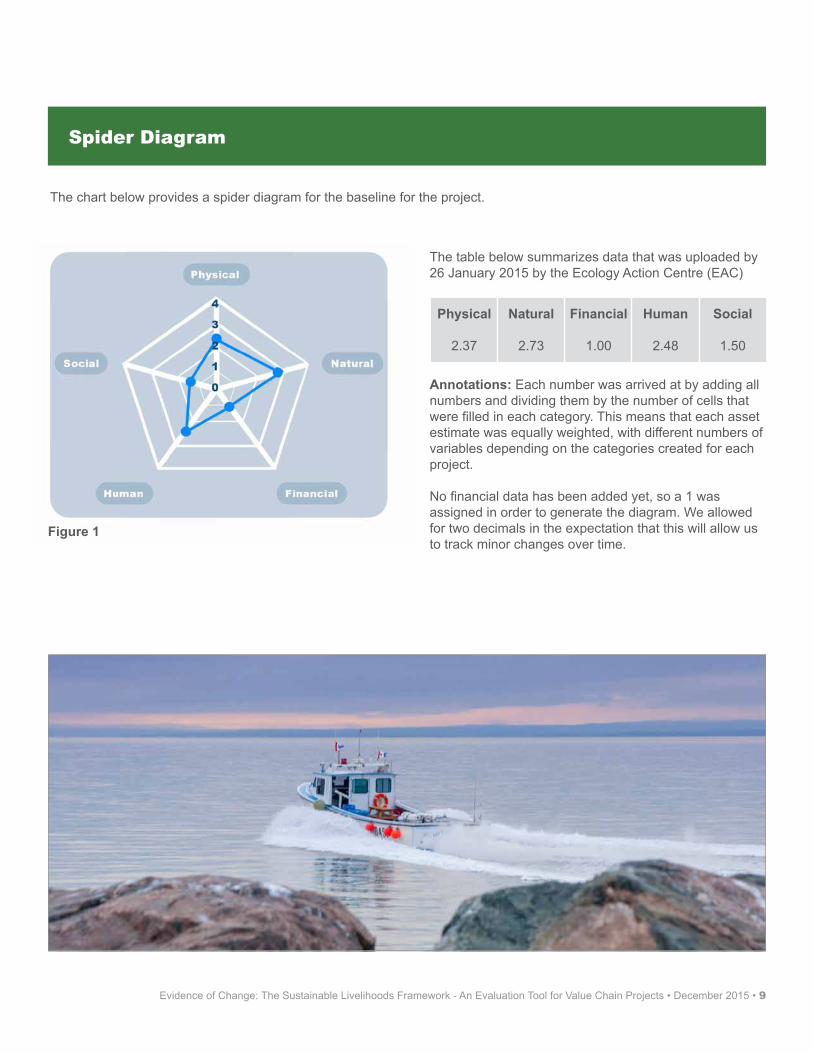
Spider Diagram
The chart below provides a spider diagram for the baseline for the project.
Physical
2.37
Financial
1.00
Natural
2.73
Human
2.48
Social
1.50
Figure 1
The table below summarizes data that was uploaded by 26 January 2015 by the Ecology Action Centre (EAC)
Annotations: Each number was arrived at by adding all numbers and dividing them by the number of cells that were filled in each category. This means that each asset estimate was equally weighted, with different numbers of variables depending on the categories created for each project.
No financial data has been added yet, so a 1 was assigned in order to generate the diagram. We allowed for two decimals in the expectation that this will allow us to track minor changes over time.

10 • Evidence of Change: The Sustainable Livelihoods Framework - An Evaluation Tool for Value Chain Projects • December 2015
Figure 3 provides an example from a value chain project in Afghanistan that was evaluated using a comparable system and a 1-4 ranking for each asset category.
(Source: Katerberg, L. Khan, A. & Ruddick, S. 2001. Evaluating value chain impact using a sustainable livelihoods approach: A case study on horticulture in Afghanistan. Enterprisedevelopment and micro finance 22(3): 225-240)
Comparisons
Figure 2
Figure 2 provides an example from a forestry project in China where the asset estimates were completed as a baseline in 2006 and again in 2010.
Projects can generate their own spider diagrams showing the baseline and the change after a season. We will then be able to explore why some asset categories may have improved and others not. We will also be able to compare these patterns across projects. In the Figure 2, the authors compare the change in five assets after four years.
(Source: Chen, H.; Zhu, T.; Krott, M.; Calvo, J.F.;Ganesh, S.P. & Makoto, I. 2013. Measurement and evaluation of livelihood assets in sustainable forest commons governance. Land use policy 30: 908-914.)

Evidence of Change: The Sustainable Livelihoods Framework - An Evaluation Tool for Value Chain Projects • December 2015 • 11
In order to have a baseline about each type of asset, projects determine the relative state or quality of each asset on a 1 – 4 scale, using stakeholders’ definitions of ”worst” and ”best” cases for each indicator. In some cases, qualitative data can be collected from community stakeholders and converted into numeric equivalents (for example, an annual survey of farmer satisfaction with a food hub’s services); in others, the project leaders self-assess the state of the indicator (for example, we developed a strong partnership with a transport company and our ”transportation” rating is moving from a 1 to a 3).
Estimating the 1-4 ranking can be challenging if the data is not already available, or if it is available but it is not entirely relevant or representative. In this case we encourage project managers to arrive at an estimate. We are working under the assumption that an estimate is better than no baseline. However, to add rigour, we encourage the use of a quality control tool. We refer to it as a validation tool 2.
The validation tool is based on the approximate level of consensus on a ranking by those familiar with the project, and the approximate level of evidence used. For example, a Saskatchewan urban gardening project ranked land tenure as a 1 by the project manager. So one can ask:
• What is the approximate level of consensus among the project team around this estimate? (0= no agreement; 10 full agreement)
• What is the approximate level of evidence used to arrive at this estimate? (0= no evidence; 10 indisputable evidence)
Even if both levels may be low at the start, we have acknowledged the origin AND we can work on ways to increase consensus and evidence as the project advances.
The validation tool is a form of quality control to verify to what extent an estimate is evidence-based and consensus-based. In this example participants felt their level of consensus was 7 and their level of evidence was 6. What was also relevant was the discussion on what it would take to move onto to the top right quadrant (with high consensus and validation scores).
Quality control for estimations

12 • Evidence of Change: The Sustainable Livelihoods Framework - An Evaluation Tool for Value Chain Projects • December 2015
Since the tool has the same structure across all projects, we will be able to aggregate the results to tell the larger story. Projects that share a common resource base (e.g. fisheries) will be able to compare the pattern of rankings by assets as well as their evolution over time.
The evolution over time will show different levels of change across assets (for example: human assets may improve sooner than natural or financial ones). If we witness common trends, we will have a platform from which to ask why food systems projects exhibit these patterns, and what factors may need more attention (as per the SLF components: vulnerabilities, transforming structures and processes).
Conversely, if some projects experience a fundamental change of a policy or market variable (e.g. a fishing regulation is modified); the levels of change of certain assets over time will need to be reported in relation to that contextual change. In other words, a major achievement may happen thanks to institutional changes that were beyond the control of the project stakeholders.
In addition to generating an approximate baseline, this tool provides a backdrop for a rich description of each context. By reviewing the comments attached to many of the numbers, one begins to witness the influence of the seasons, the changing climate, the global market forces, the policy constraints and the complex relationships. As the project leads explain each table, a narrative emerges with a lot of detail. The tables work as a map for story telling; the tool is more than a dashboard, it is the basis from which a script could be written for a play or documentary film about each food hub or value chain. The tool has engagement potential uses with other stakeholders, including local organizations that are possible partners or funders of these activities, policy makers, and those who may be interested in further developing and adapting the tool.
The changes reported in the star diagrams will need to be understood with attention to the other components of the SLF. The vulnerability and seasonal context will acknowledge organizational vulnerabilities, weather changes or other shocks to the system (ecological, access to markets, etc.). We will also need to flag the institutional context where regulatory or programmatic changes will affect the results we are tracking. As we write this document, Canada is in the midst of a new trade agreement that may change some of the rules of the game (such as supply management in the dairy sector). Our experience so far shows that the annotations we received to the 1-4 rankings, often provide insights into these contextual factors.
Potential uses: aggregation,engagement and communication
Understanding the changes

Evidence of Change: The Sustainable Livelihoods Framework - An Evaluation Tool for Value Chain Projects • December 2015 • 13
1 We have found examples in the literature where sustainability indicators were prepared in consultation with local stakeholders (Woodhouse, P.; Howlett, D. & Rigby, D., 2000. A framework for research on sustainability indicators for agriculture and rural livelihoods. Working paper 2. Prepared for DIFD, London). A major challenge is to agree on the scale at which those indicators are chosen, as often times the data is either difficult to obtain, has been collected at different scales, or is out of date. A second challenge is the aggregation among several project sites or partners.
2 This tool is borrowed from Social Analysis Systems, see http://www.sas2.net/sites/default/files/sites/all/files/manager/Toolkit_En_March7_2013-S.pdf (p.32)
Endnotes
The following people have contributed to developing this tool:
• Abra Brynne, formerly with Food Secure Canada (co-creator of this tool)• Beth Hunter, The J.W. McConnell Family Foundation• Sophie Méchin, The J.W. McConnell Family Foundation (created the financial asset table)• Laurence Miall, The J.W. McConnell Family Foundation • Justin Cantafio & David Adler, Ecology Action Centre (project partner) • Gordon Enns & Dr. Wanda Martin, Saskatoon Food Council (project partner)• Sri Sethuratnam, FarmStart (where the SLF tool is also used in evaluation)
Layout by graphic designer Aquil Virani (aquil.ca)
Acknowledgements

14 • Evidence of Change: The Sustainable Livelihoods Framework - An Evaluation Tool for Value Chain Projects • December 2015
The J.W. McConnell Family FoundationJanuary 2016