Ricardo-AEA · 2020-01-15 · Ricardo-AEA © Ricardo-AEA Ltd John Watterson With contributions...
42
Ricardo-AEA © Ricardo-AEA Ltd www.ricardo-aea.com John Watterson With contributions from James Harries, Dan Forster, Ross Hunter, Gill Wilkins, Sina Wartman Information Matters Asian Regional Workshop on GHG and Non GHG Indicators: Making climate change for sustainable development measurable Asia Regional Workshop November 4 th and 5 th , 2014) at Dusit Thani Hotel, Ayala Center, Makati City, Metro Manila, Philippines National policies for emission reduction and GHG measurement
Transcript of Ricardo-AEA · 2020-01-15 · Ricardo-AEA © Ricardo-AEA Ltd John Watterson With contributions...

Ricardo-AEA
© Ricardo-AEA Ltd
www.ricardo-aea.com
John Watterson
With contributions from James Harries, Dan Forster, Ross Hunter, Gill Wilkins, Sina Wartman
Information Matters Asian Regional Workshop on GHG and Non GHG Indicators:
Making climate change for sustainable development measurable
Asia Regional Workshop
November 4th and 5th, 2014) at Dusit Thani Hotel, Ayala Center, Makati City, Metro Manila, Philippines
National policies for emission reduction and GHG
measurement

© Ricardo-AEA Ltd Ricardo-AEA in Confidence 2
• UNFCCC accredited GHG inventory
reviewer (Energy sector)
• Great experience of MRV systems design
• Country lead for the GIZ Information
Matters project
• IPCC lead author of the stationary
combustion chapter of the 2006 guidelines
for national GHG inventories
• Invited contributor to several IPCC
thematic meetings, including the use the
Emissions Trading Data in GHG
inventories, and the extended uses of the
2006 GLs
• Led the UK GHG inventory team.
Currently technical advisor to the team
John Watterson
Thank you for the invitation to
speak at this conference, and
for the opportunity to share my
experience with you
© Ricardo-AEA Ltd Ricardo-AEA in Confidence 3
• National policies in the UK for GHG emission reduction
• National policies for GHG measurement
• We will also look at
• “Mapping the causal chain”, because this is fundamental to the setting and review of
baselines, and approaches to avoid double counting of emission savings.
• Defining and using indicators
• The problems of and some solutions to judging the effectiveness of mitigation policies
• Final thoughts
• We may not have time for all elements of the talk – but the additional material will be
provided for your reference
What this talk will cover?

© Ricardo-AEA Ltd Ricardo-AEA in Confidence 4
GHG emission reduction
• “no regret options” – they should work; complex ex ante assessments are not always
needed
• Concentrate on key categories – where potential growth in emissions is great
• Set up a “causal chain”, presenting the changes a mitigation action induces
• Identify the changes which seem most relevant (GHG and non-GHG)
• Set-up indicators for these changes, considering that each indicator needs a target, a
baseline and a deadline
What tools do we have to assess the reduction?
• A GHG inventory
• But does the inventory have to be complete – to track mitigation options?
• How accurate does it have to be?
Initial thoughts

© Ricardo-AEA Ltd Ricardo-AEA in Confidence 5
What are the national and regional policies for emission
reduction in the UK?
https://www.gov.uk/government/policies/reducing-the-uk-s-greenhouse-gas-
emissions-by-80-by-2050
http://www.theccc.org.uk/tackling-climate-change/the-legal-landscape/climate-change-act-and-
uk-regulations/

© Ricardo-AEA Ltd Ricardo-AEA in Confidence 6
Summary of UK policies for emission reduction
UK’s 6th National Communication to the UNFCCC –
summary of mitigation actions are presented
Mitigation
examples
in the
energy
sector
Mitigation
action
Sector
affected

© Ricardo-AEA Ltd Ricardo-AEA in Confidence 7
What is the national approach to GHG emission
measurement?
The UK GHG inventory
is used as the primary
source of information to
judge progress towards
the national and
international
commitments
© Ricardo-AEA Ltd Ricardo-AEA in Confidence 8
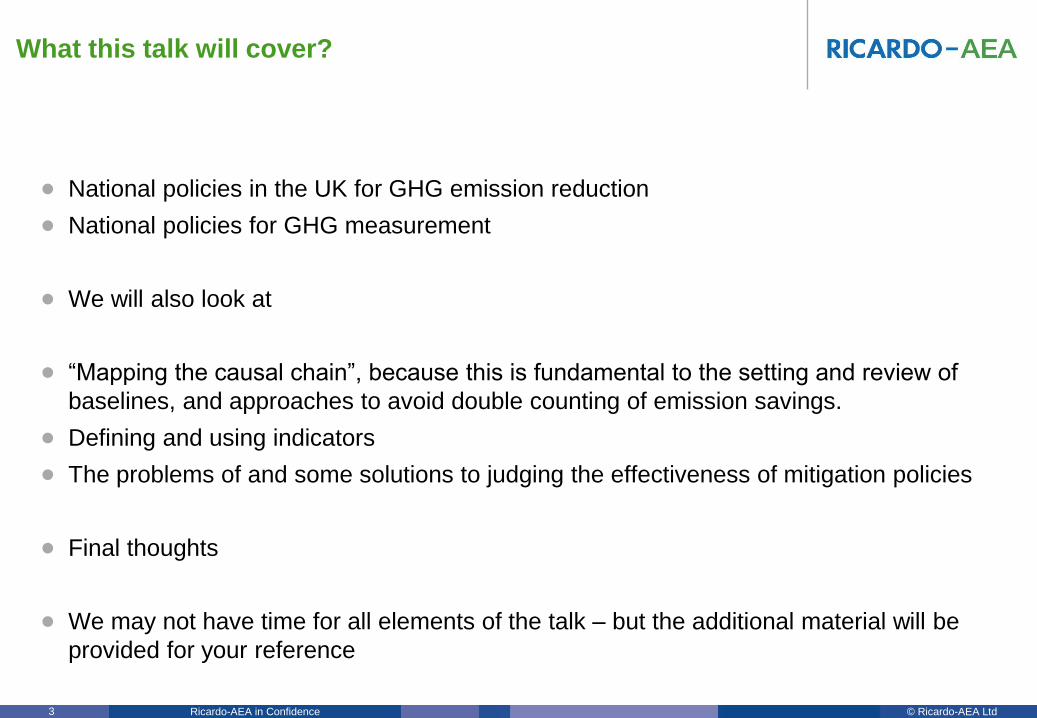
UK and the Climate Change Act – legal basis for reducing
GHG emissions
© Ricardo-AEA Ltd Ricardo-AEA in Confidence 9
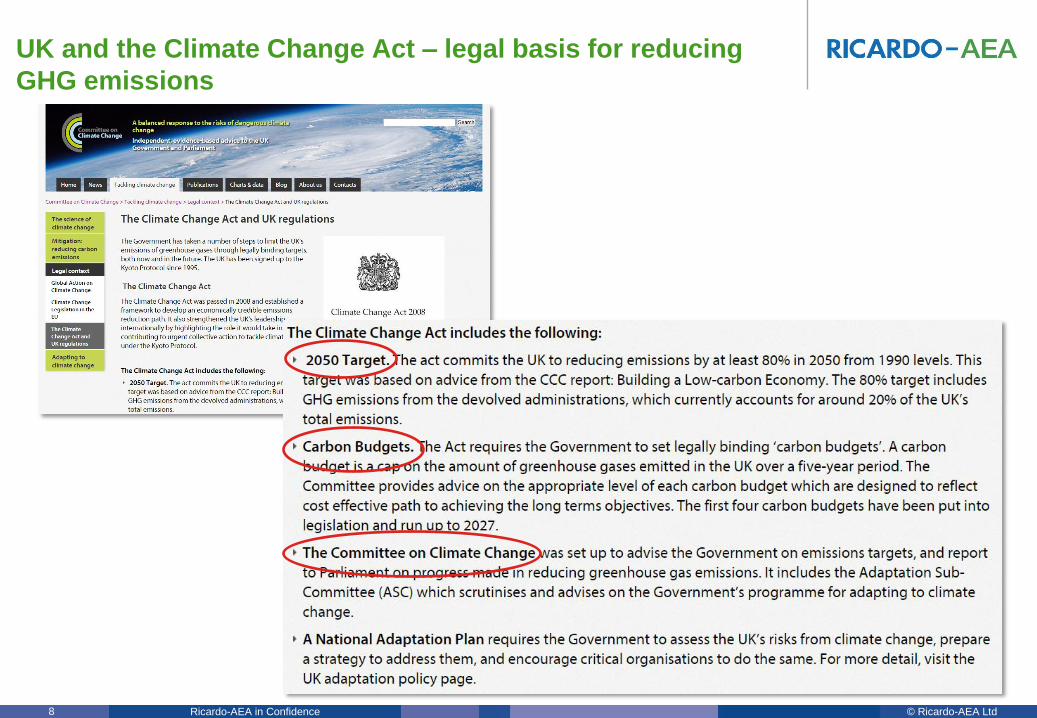
UK Climate Change Act 2008
• Sets a 2050 emissions target in law
• Requires Government to set 5 year carbon budgets, with first 3 carbon budgets being
set by June 2009, and later carbon budgets being set 11 ½ years before they start
• Requires Government to meet these carbon budgets
• Sets up the Committee on Climate Change (the CCC)
• Requires Government to report annually to Parliament on emissions levels
• Requires CCC to report annually to Parliament on progress in meeting carbon
budgets
Climate Change Committee
• Advising on level of carbon budgets
• Monitoring progress
Government
• Setting carbon budgets
• Meeting carbon budgets

© Ricardo-AEA Ltd Ricardo-AEA in Confidence 10
Assessment of progress
10
Examples
of
Indicators

© Ricardo-AEA Ltd Ricardo-AEA in Confidence 11
MRV approach to UK Climate Change Act Targets
• Causality not always straightforward – many potential factors influencing to emission
development
• Basic Approach:
- Define indicators based on relevant effects as well as drivers
- Develop indicator trajectories based on expected developments
- Collect indicators values annually
- Compare collected indicator values with trajectories
Report can be found under:
http://www.theccc.org.uk/publication/2013-
progress-report/

© Ricardo-AEA Ltd Ricardo-AEA in Confidence 12
Climate Change Committee indicator framework

© Ricardo-AEA Ltd Ricardo-AEA in Confidence 13
Monitoring and reporting of implementation - examples
• Reports explain casual assumptions
• made, e.g. GDP, fuel prices
Economic indicators
Average daily temperature Fuel prices

© Ricardo-AEA Ltd Ricardo-AEA in Confidence 14
Climate Change Committee - indicator framework
Headline indicators
• Emissions - sectoral breakdown of economy wide emissions
• Emissions intensity and demand - high level indicators of the supply and demand
side factors which drive emissions
Supporting indicators
• Implementation indicators - a set of indicators which track progress in
implementing the measures required to achieve sustainable emissions reduction
• Forward indicators - trajectories for forward indicators that are used to assess
whether the UK is on on track to deliver measures as required
• Policy milestones - In order that measures are successfully implemented, the
appropriate enabling framework will have to be in place. We therefore include in our
framework indicators reflecting key policy milestones and high level aspects of
policy design

© Ricardo-AEA Ltd Ricardo-AEA in Confidence 15
Tiered approach to indicators – “Headline” and “Supporting”

© Ricardo-AEA Ltd Ricardo-AEA in Confidence 16
Use of indicators
Residential
sector
Number of
efficient boilers
Transport
sector
Biofuels (% by
volume)
http://www.theccc.org.uk/wp-content/uploads/2013/07/1585_CCC_Progress%20Rep%202012_Interactive.pdf,
page 61. There is no equivalent table for 2013 report
Table of progress
against measures

© Ricardo-AEA Ltd Ricardo-AEA in Confidence 17
17
Energy efficiency in the industry Sector
• Absolute emission development in line with trajectory
• Key driver energy efficiency far from desired trajectory
• Absolute emissions in line with trajectory mainly
because of economic downturn
Energy efficiency in the Industry (UK level)
“…how little the pure
emission figure can
tells us...“

© Ricardo-AEA Ltd Ricardo-AEA in Confidence 18
Power sector indicators
Looked at level
of installed
capacity …
… plus approval
rates for new
capacity

© Ricardo-AEA Ltd Ricardo-AEA in Confidence 19
Buildings and transport

© Ricardo-AEA Ltd Ricardo-AEA in Confidence 20
Time check!
Transport in more detail (if we have time…)

© Ricardo-AEA Ltd Ricardo-AEA in Confidence 21
• The indicator framework reflects “measures that are either cost-effective now, or
are required on the path to deeper decarbonisation in the 2020s”
– So indicators have been selected to reflect progress in relation to specific
measures which have already been assessed and decided as important for the
mitigation strategy
• Some indicators are related to the overall outcomes, the “bigger picture” result, and are
not tied to specific policies
• However, the majority are linked to specific measures (technical or behavioural)
• Again these indicators are not policy specific, but can be more easily linked to policies if
required
– The aim of the indicators (in this context) is not to track policy effectiveness,
necessarily, but more to track the mitigation pathway as a whole
Transport - in more detail

© Ricardo-AEA Ltd Ricardo-AEA in Confidence 22
Core indicators
• Surface transport emissions
– Outcome level - Emissions from road transport (MtCO2 relative to base
year, based on inventory data)
– Output level - CO2 intensity of the fleet (gCO2/km, based on vehicle sales
statistics, and data on emissions performance different vehicles)
• Fuel efficiency of vehicles
– Activity level - Market share of electric vehicles (%, based on vehicles
sales statistics)
– Activity level - Sustainable biofuel penetration (%, based on fuel sale
statistics)
• Behaviour change
– Activity level - Implementation of Smarter Choices nationwide
– Activity level - Take up of eco-driving (million drivers)
– Activity level - Speed limit enforcement (no clear measure)
Transport - in more detail
Activity
level
Outcome
and output
level

© Ricardo-AEA Ltd Ricardo-AEA in Confidence 23
• For some indicators a forward trajectory is defined i.e. what the indicators needs to look
like in the future for the overall outcome to be achieved
• This allows progress to be monitored against the pathway
Transport - in more detail

© Ricardo-AEA Ltd Ricardo-AEA in Confidence 24
• Also some indicators may be further analysed, to explore the underlying reasons
behind the change in the indicator values
Transport - in more detail

© Ricardo-AEA Ltd Ricardo-AEA in Confidence 25
• And for other indicators the overall performance can be related to specific policies
(although often in qualitative terms)
• Indicator: Market share of electric vehicles (%)
• Supporting policies
– Price support
• Plug-in Car Grant (PiCG) - In 2012, 2,129 claims were made through the plug-in
car grant (up from 892 in 2011) and 215 through the Plug-in Van Grant.
– Infrastructure investment
• Plugged-In Places - Government offered match-funding to private and public
sector consortia for the installation of EV charging points in eight regional
schemes
• National Offer - Government announced a further £37 million funding package for
charge points
Transport - in more detail

© Ricardo-AEA Ltd Ricardo-AEA in Confidence 26
Regional approaches in the UK to policies for emission
reduction and GHG measurement

© Ricardo-AEA Ltd Ricardo-AEA in Confidence 27
Example: Carbon budgets in Wales

© Ricardo-AEA Ltd Ricardo-AEA in Confidence 28
Indicators divided into three ‘tiers’
Tier
One
Tier
Three
Tier
Two
Sector carbon dioxide equivalent emissions
CO2e emission estimates consistent with the 3% target
Activity Data
Activity data used to compile the greenhouse gas inventory for Wales
Policy – how well is it performing?
Provides an indication of how individual mitigation measures and policies are
performing
Example: Indicator structure (Wales)
e.g. Transport Indicator 1 (TI1): Transport sector GHG emissions
e.g. Transport Indicator 2 (TI2): Total distance travelled by road vehicles
e.g. Transport Indicator 5(TI5): Percentage of people travelling to work whose
mainly cycling or walking
Reveals that
something
has changed,
but not the
reason
Helps explain
the reasons
for the
changes
seen
in the GHG
inventory

© Ricardo-AEA Ltd Ricardo-AEA in Confidence 29
Example Wales: Tier 1
Tier One Sector carbon dioxide equivalent emissions
CO2e emission estimates consistent with the 3% target
• One per sector
• GHG emissions in Wales
• Measured against 2006-10
baseline
0
1
2
3
4
5
6
7
8
2006 2007 2008 2009
Em
iss
ion
s in
Mt
CO
2 e
qu
iva
len
t
Transport sector GHG emissions Baseline (2006-2009 average)
Transport sector GHG emissions
TI1 1 J WT1-
11 All
Policy Indicator Data
e.g. Transport Indicator 1 (TI1)
Transport sector GHG emissions
© Ricardo-AEA Ltd Ricardo-AEA in Confidence 30
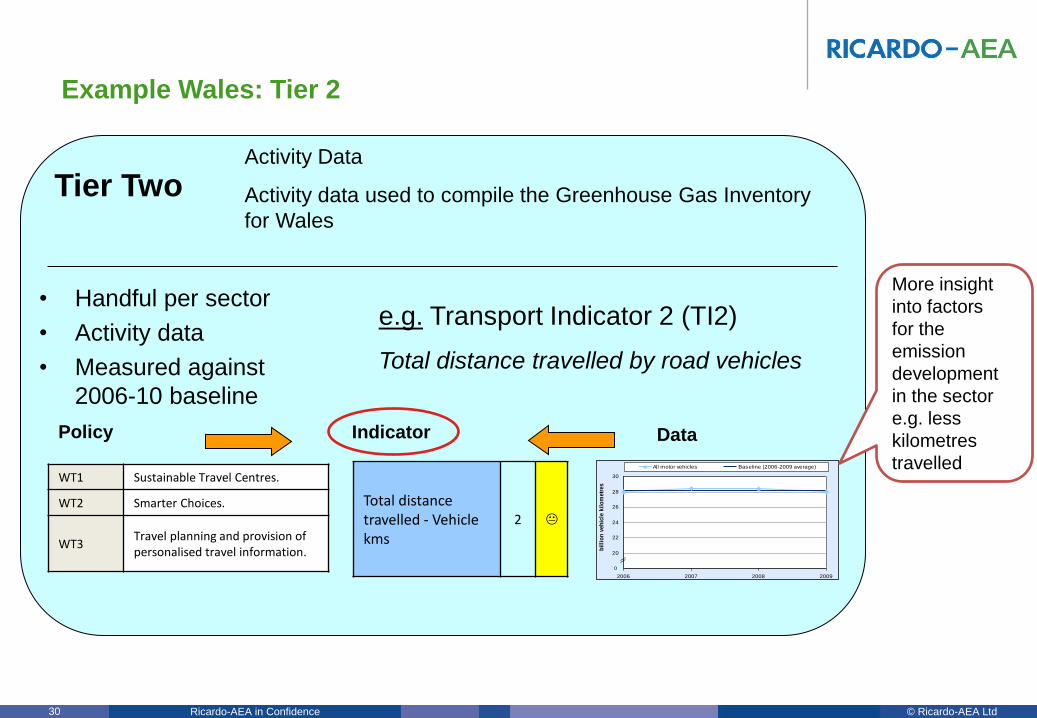
Example Wales: Tier 2
Tier Two Activity Data
Activity data used to compile the Greenhouse Gas Inventory
for Wales
• Handful per sector
• Activity data
• Measured against
2006-10 baseline
e.g. Transport Indicator 2 (TI2)
Total distance travelled by road vehicles
WT1 Sustainable Travel Centres.
WT2 Smarter Choices.
WT3 Travel planning and provision of personalised travel information.
18
20
22
24
26
28
30
2006 2007 2008 2009
bil
lio
n v
eh
icle
kil
om
etr
es
All motor vehicles Baseline (2006-2009 average)
0
Total distance travelled - Vehicle kms
2 K
Policy Indicator Data
More insight
into factors
for the
emission
development
in the sector
e.g. less
kilometres
travelled

© Ricardo-AEA Ltd Ricardo-AEA in Confidence 31
Example Wales: Tier 3
Tier Three
Policy
Monitors things Welsh Government is actively doing to reduce
GHG emissions. Provide an indication of how individual
actions and policies are performing
• Many per sector
• Not directly linked to
emission
• Measured against
2006-10 baseline
e.g. Transport Indicator 5(TI5)
Percentage of people travelling to work whose main
mode of travel to work is cycling or walking
WT1 Sustainable Travel Centres.
WT2 Smarter Choices.
WT3 Travel planning and provision of personalised travel information.
WT4 Developing a series of strategic modal interchanges.
WT5 Promotion of eco-driving.
WT6 Promotion and support for walking and cycling.
Percentage of people travelling to work whose main mode of travel to work is cycling or walking
TI5 3 K
0%
2%
4%
6%
8%
10%
12%
14%
2006 2007 2008 2009 2010
Peo
ple
walk
ing
or
cycli
ng
- %
Total % walking or cycling Baseline (2006-2009 average)
Policy Indicator Data
Indicators not
linked to the
GHG inventory.
Provide an
indication of the
“direction of
travel” that the
GHG inventory
would not
detect.

© Ricardo-AEA Ltd Ricardo-AEA in Confidence 32
• … (along with the policies implemented prior to the
implementation of the policy being assessed that were
previously included in the baseline scenario).
• The baseline scenario should also be recalculated to
include updates to all non-policy drivers based on
observed values
Estimate ex-post baseline scenario emissions – did the
policy actually work?
• The mechanisms to do this cannot be
covered in a single slide… but
• Determine the GHG effect of the policy or
action ex-post by comparing policy
scenario emissions to baseline scenario
emissions.
• The net GHG effect of the policy or action
is the difference between baseline
emissions and policy scenario emissions
• Baseline emissions should be
recalculated every time an ex-post
assessment is undertaken.
• The baseline scenario should include any
new policies or actions with significant
effects on GHG emissions that were
implemented after the policy/action being
assessed was implemented …

© Ricardo-AEA Ltd Ricardo-AEA in Confidence 33
Causal chain

© Ricardo-AEA Ltd Ricardo-AEA in Confidence 34
Causal chain and assessment boundary
Mapping the
causal chain
Intended and
unintended effects
In-boundary and out-of-boundary
effects Short- and long-term
effects
Which indicators to
choose for your mitigation
MRV?
• Consider the impact
chain to understand
which indicators will
show it is on track for
its various objectives
• Do not forget about
potentially unwanted
impacts!

© Ricardo-AEA Ltd Ricardo-AEA in Confidence 35
A worked example of a causal chain in the
transport sector …
Desired impacts
Unwanted impacts
Sta
rt

© Ricardo-AEA Ltd Ricardo-AEA in Confidence 36
Challenges and lessons learnt

© Ricardo-AEA Ltd Ricardo-AEA in Confidence 37
Lessons learned from the UK Carbon Budget MRV
approach
• Finding the right level of detail in indicators is key
• Indicators related to factors influencing emissions provide good insight into
effectiveness of measures
• Getting acceptance and support from “policy owners“ takes time
• Policy owners might lack necessary expertise to provide the indicator data
required
• GHG inventory cannot provide all indicator data (and likely never will)
• Accept system is not perfect at first and improve over time
• Independent evaluation by non-government organisation (Climate Change
Committee)
– lends credibility to the result
– can hinder open discussion on evaluation results
37

© Ricardo-AEA Ltd Ricardo-AEA in Confidence 38
Challenges to MRV of mitigation activities
38
• Change of emission levels, jobs, health, etc. can have many influencing factors.
• An MRVed change might stem from a specific NAMA (or mitigation action), but
potentially also from the interaction of several NAMAs or factors external to mitigation
actions, e.g. economic or social developments
• It is not easy to understand whether a specific NAMA has caused an MRVed change
and to what extent.
• What can be done?
– Accept these limitations and adjust expectations!
• Move away from a CDM-like MRV focussing on highly accurate emission reduction values
• Aim to understand, whether your NAMA does contribute to achieving desired impacts and
whether it has a relevant impact or not
– MRV systems can be set up to at least help understanding causality
– Package NAMAs targeting the same impacts
and assess their combined impacts
– Assess potential impacts in detail a forehand
and design MRV accordingly

© Ricardo-AEA Ltd Ricardo-AEA in Confidence 39
• Good information and communication are of vital importance. Gathering and
keeping a record of information for reporting relies on good communication and
coordination between all entities involved in the monitoring process.
• Define clear roles and responsibilities and give transparent guidance to each
organisation involved in developing and implementing the NAMA MRV-plan. This will
ensure the reliability and consistency of the measured information, as well as its timely
reporting and verification.
• Calculate emission mitigation and mitigation costs based on proven or credible
methods and using the best available data.
• Monitoring quality and reliability of data and an open and transparent access to
information increases the efficiency of the MRV process. Emission mitigation and
mitigation costs should be calculated based on proven or credible methods using the
best available data.
• Examine existing MRV best practice to ensure the MRV plan is designed according
to national requirements.
• Perform continuous review and improvement of the MRV plan. Organisations with
different expertise should be involved, in order to maximise technical capabilities.
Good practices for mitigation activity / NAMA MRV
© Ricardo-AEA Ltd Ricardo-AEA in Confidence 40
• Use and build on indicators they already have wherever possible. This should make
monitoring easier and also make the indicators more relevant and linked to what they
are already focussed on achieving for their country.
• Wherever possible the existing development plan indicators and/or Climate Change
Action plan indicators should be looked at to see if they can be used for NAMA
indicators
• Only where there are no relevant indicators should new indicators be selected
• Thinking about the level of indicators being developed from “Input level” up to “Outcome
level
• The higher up the hierarchy, the more joined up the indicators should be
– there should be few high strategic level indicators common to many actions
(NAMAS, Development plan activities, climate change action Plan activities)
– the lower down, the more individual and numerous the indicators become, these may
be specific only to activities in a specific action or project
Build on what you have – minimise the need for new
indicators and institutions

© Ricardo-AEA Ltd Ricardo-AEA in Confidence 41
• GHG mitigation policies do no exist in isolation
• Avoid double counting and omissions
• This can be difficult
• Important to consider other policies that may affect the same variables (AD and EF)
that the policy in question would be affecting
• So an assessment of what other interventions are leading to reinforcing or
counteracting trends
• This is because there may still be activity even in a ‘do nothing’ scenario, because other
policies are having the same effect
• To do consider other policies, carry out a mapping exercise. What are the possible
policies that are targeting the same emissions source(s) and will they be neutral/
independent, counteracting or reinforcing?
Taking account of policy interactions

© Ricardo-AEA Ltd
www.ricardo-aea.com
T:
E:
W:
Ricardo-AEA Ltd
The Gemini Building
Fermi Avenue
Harwell, Didcot,
OX11 0QR
John Watterson
+44 (0)1235 75 3595
www.ricardo-aea.com
(Additional material if time…)
Thank you for your
attention!