Riaan Smith
34
1 Grid Integration of Renewable Energy Focus on wind energy Presented by: Riaan Smit 2010-06-04
-
Upload
hoangkhanh -
Category
Documents
-
view
230 -
download
0
Transcript of Riaan Smith

1
Grid Integration ofRenewable Energy
Focus on wind energy
Presented by:Riaan Smit2010-06-04
2
2
Content• Wind Energy• Wind Turbine Technology Types• Energy production• Technical considerations• GTZ-DigSilent studies• Conclusion
Extract Energy
2010/06/07 2What kind of Distributed or Embedded Generation
will be connected to our networks in future?
Rotor Diameter
V47 = 47 m
Extract EnergyExpand Vision

3
3Wind Energy – understand resource
• About 1 - 2% of sun energy is converted into wind energy.
• About 50 - 100 times more energy converted into biomass
• Betz’ Law: Maximum energy to extract from wind ~ Cp = 59%
• Power max = 0.5 ρ x A x v 3 x cp– ρ = air density (1.225 kg/m3, dry, @ 15°C)
• Temperature, humidity, m above sea level– A = Rotor sweep area = π.r2 (radius increase)
Wind m/s 15°C
47 m rotor
660 kW
66 m rotor
1750 kW
1 1.04 2.05
2 8.5 16.8
3 28.6 56.4
4 68 134.1
2010/06/07 3
– A = Rotor sweep area = π.r2 (radius increase)– v3 = Wind Speed cube
• i.e. Speed x 2 ~ Energy x 8– Cp varies
• 0.5 high speed 2 blade• 0.2 – 0.4 slow speed multiple blade
• Energy = Power x time (E = P.t in kWh)• Energy ~ Roughness / obstacles of terrain• Ideal wind turbine would slow wind by 2/3• Max Efficiency 3 blade ~ 44% at 9 m/s
5 132.2 260.7
6 229.5 452.6
7 364.5 718.8
8 544 1072.9
9 774.6 1527.6
10 1062.6 2095.5

4
4Technology Types– Model correctly in Power System Analysis (PSA) pha se
Squirrel Cage Induction GeneratorNOT synchronising,but motor starting
Stall, Pitch, Active stall
Fixed Speed
Asynchronous Induction Generator
2010/06/07 4
Wound Rotor Induction Generator(radial flux cylindrical)with e.g. V47 OptiSlip®Slip may increase to ~10%
Source: Wind Power in Power Systems
Pitch controlled
VariableSpeed
Asynchronous Induction Generatorconsumes reactive power from grid

5
5
Technology Types – most modern WTG’s
Wound Rotor Induction Generator(radial flux cylindrical)e.g. V66 OptiSpeed™Slip increase higher
to e.g. “~60%”
Low voltage ride
Axial fluxdiscoidal
Radial fluxcylindrical
690V11-33kV
Pitch controlled
Variable
2010/06/07 5
Low voltage ride through capability
Permanent Magnet Synchronous Generator(axial flux discoidal)e.g. J48, Enercon
Source: Wind Power in Power Systems
Rotor
Pitch controlled
VariableSpeed

6
6
• Still generate as low as 2.8 m/s wind speed• Full production at about 12-14 m/s wind (43 – 50 km/h)• Shut down at 25 m/s wind (90 km/h) (2007: 42.3 m/s on site)• Production dependent on air density, humidity, etc.
Vestas V66 Power Curves
V66 Power Curve (Sample size = 6215)
18002000
2010/06/07 6
�At 375 m with 78 m tower
-2000
200400600800
10001200140016001800
0 5 10 15 20
Wind Speed (m/s)
Pow
er (
kW)

7
7Production profile – site specificKlipheuwel Wind Farm Production: 1 Jan 2003 - 30 Ju n 2004
1500
2000
2500
3000
3500
Pro
duct
ion
in k
W
Variability / Control / Operations…. Forecast…..
Dry WinterLow Wind
Good summer wind
2010/06/07 7
• Wind variable ~ generation variable• Wind not constant over 24 hr period
0
500
1000
2003
/01/
01
2003
/01/
31
2003
/03/
02
2003
/04/
01
2003
/05/
01
2003
/05/
31
2003
/06/
30
2003
/07/
30
2003
/08/
29
2003
/09/
28
2003
/10/
28
2003
/11/
27
2003
/12/
27
2004
/01/
26
2004
/02/
25
2004
/03/
26
2004
/04/
25
2004
/05/
25
2004
/06/
24
Date
Pro
duct
ion
in k
W

8
Load duration curve – site specific
50%
85%
Exclude Auxiliaries and Network Losses (?)
•Capacity design level ?•Not 100% needed?•Definitely good wind & cooling•Need to rethink “normal” limits?•Proper metering – use of CT ratio’s
2010/06/07 8
30% No Generation
33%
50%
2% 11% 17%
•Proper metering – use of CT ratio’s•Long hours at very low production•Accuracy
Higher Capacity Factor

9
9German Grid Code requirements• E.ON Netz Grid Code• Examples of
• Frequency control• Low Voltage Ride Through• Reactive Power requirements
• Consider input for South Africa from international Grid Codes
2010/06/07 9

10
10LVRT SA Dx Network Code requirement
Low Voltage Ride Through• Source = Ireland Dx Grid Code• 1. Sub-transmission • 2. Distribution• Wind Farm Power Stations shall remain connected
to the Distribution System for Voltage dips on any or all phases, where the Distribution System Phase Voltage measured at the Connection Point remains above the heavy black line.
1
2010/06/07 10
2None

11
11Power System LVRTLow Voltage Ride Through
2010/06/07 11
12
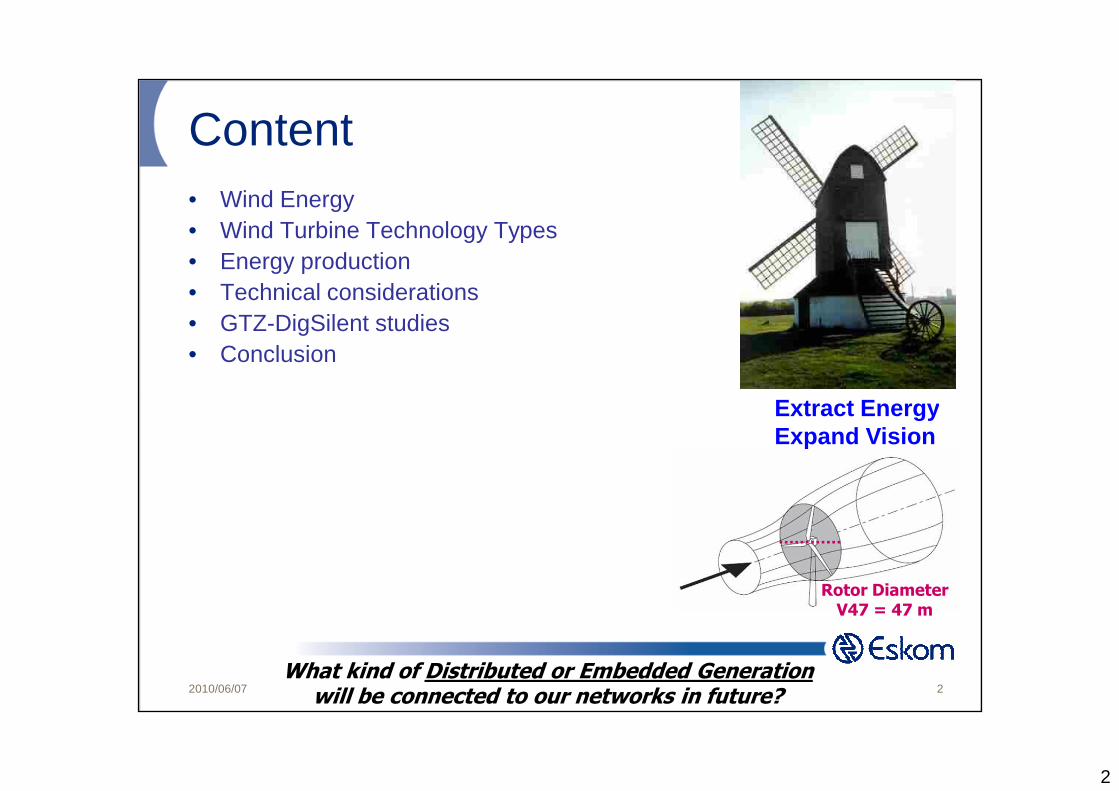
12Frequency, Harmonics, Flicker• Source = Ireland Grid Code• Need for active power
control for power frequency control
• Harmonics– Power electronics – use on
increase (IGBT’s etc.)• Flicker
– VSC HVDC control up to 3
2010/06/07 12
– VSC HVDC control up to 3 Hz
– Reducing WTG flicker considerably, mainly Type A
– “Slow” – e.g. wind gusts– “Fast” – repeated startups,
capacitor switching– Wave and other energy
converters?

13
Different network configurations400kV
132kV
66kV
40/80 MVAAuto trfr
250/500 MVAAuto trfr
MTS
40/80 MVA YNd1
Chickadee(Wolf, Ash)
Proposed Boundary
NE
CR
T
Different-Voltages-Trfr Sizes
-Substations-Vector Groups-Configurations
?
2010/06/07 13
HV/MV 2HV/MV 1
132kV
22kV
33kV
66kV
11kV
132kV
HV/MV 3 Wind Turbine Generator
(Wolf, Ash)Kingbird(Bear, Sycamore)
~ ~
5/10/20/40 MVAYNd1 connected as
YNd1 or YNd11
Dyn1
D-winding690V (Typical)NECRT NECRTNECRTNECRT
NE
CR
T
Groundlevel
Tower
Nacelle
~Converter
Indoor Outdoor
Please note: Vector groups
are area specific
Hare, (Oak)Chicadee

14
14
Embedded Generation• To fulfil Eskom Distribution’s obligation under Section 8.2 (4) of the
South African Distribution Code: Network Code:– “The Distributor shall develop the protection requirement guide
for connecting Embedded Generators to the Distribution System to ensure safe and reliable operation of the Distribution System”.
• DST 34-1765: Distribution Standard for the interconnection of
2010/06/07 14
Embedded Generation• Applicable to renewable energy facilities• South African grid code requirements for wind energy - draft for
comments • Some special considerations?
– Disturbs fault current shape, difficult to select overcurrent protection

15
GTZ – D:EADP – Eskom cooperation• Germany GTZ agreement with Western Cape Province D:EADP• Eskom participant in agreement• Cooperation activities
– 24-25 March 2009 “Grid Integration of Wind Energy” seminar by Dr Markus Pöller, sponsored by GTZ & Western Cape Province D:EADP
– Invite to Developers, Consultants, Research/Academics, City of Cape Town, Eskom and other role players, e.g. DME & NERSA
– 26-27 March 2009 Eskom Wind Energy Workshop to create scenarios for:• 150 MW case study on sub-transmission network• 750 MW case study for integration into 400kV network, incl. 132 kV
2010/06/07 15
• 750 MW case study for integration into 400kV network, incl. 132 kV• Regional study of ±2800 MW on larger main transmission system
– 14-15 May 2009 Cape Town Workshop 2– 22-24 July 2009 Follow up session to evaluate feedback– 24 July 2009 Feedback on high level grid scenarios and various technical studies, in
cooperation with DigSilent (sponsored by GTZ)– 9-13 Nov 2009 Berlin Conference & Training opportunity– 24 Nov 2009 Cape Town Workshop 4

16
16
Transmission System
Western Cape
Stage 3
Stage 2
2010/06/07 16
Stage 2
Stage 1
17
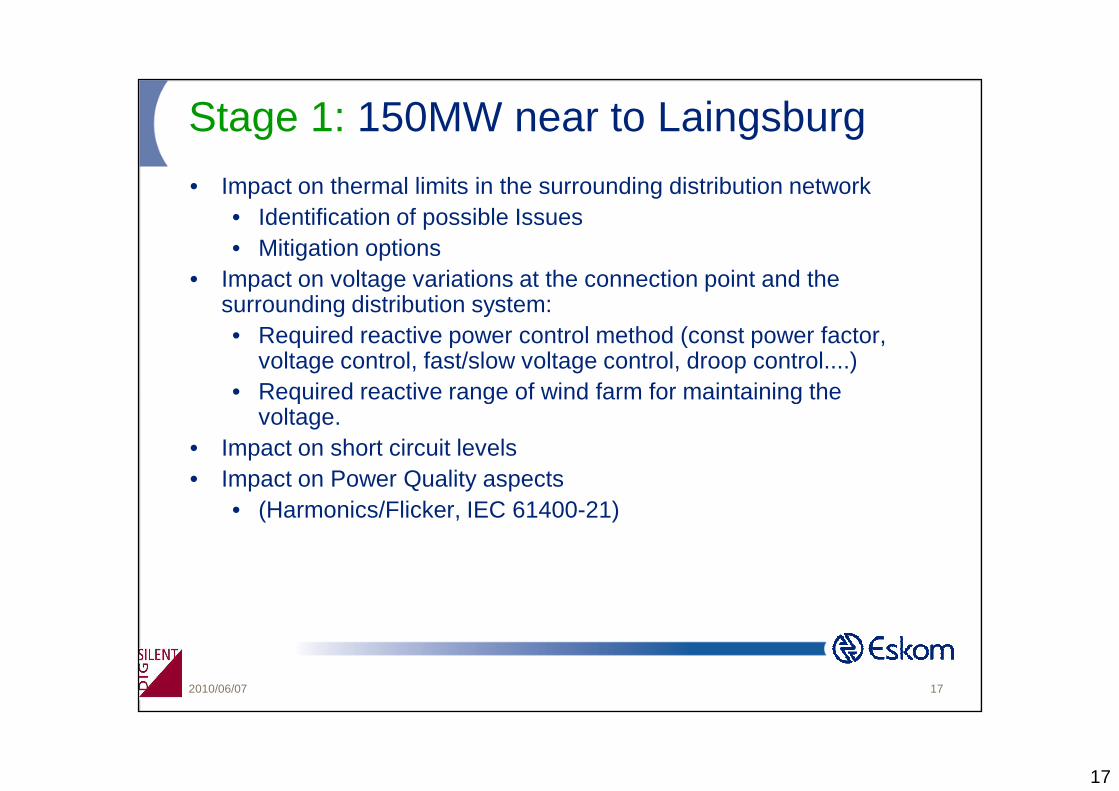
17Stage 1: 150MW near to Laingsburg
• Impact on thermal limits in the surrounding distribution network• Identification of possible Issues• Mitigation options
• Impact on voltage variations at the connection point and the surrounding distribution system:• Required reactive power control method (const power factor,
voltage control, fast/slow voltage control, droop control....)• Required reactive range of wind farm for maintaining the
2010/06/07 17
• Required reactive range of wind farm for maintaining the voltage.
• Impact on short circuit levels• Impact on Power Quality aspects
• (Harmonics/Flicker, IEC 61400-21)

18
18Transfer limitations 60 km 132 kV line
As line length increases•Increase in losses •Voltage changes•Limit transfer Capacity
( )VZ S
VB X
B ZV R P Q X B ZS
R
R
R R R
22 2
2
22 21
22 2= + − +
+ + −
..
.. . . . .
LoadGen
2010/06/07 18
100 km 132 kV lineNew infrastructure•Choice of voltage•Select conductor size
Steady state load flow•PowerFactory simulations
380 to 220 MVA
85 to 50 MVA

19
19Voltage Variations – cos phi constant (=1)
1,08
1,05
1,02
Y = 1,050 p.u.47.697 MW58.375 MW
66.198 MW
X =150,000 MW
1.065 p.u.
1.070 p.u. 1.074 p.u.
1.050 p.u.
136.500 MW 1.074 p.u.
DIg
SIL
EN
T
Expect high voltagesSmall voltage changes due to Line outages
2010/06/07 19
207,50167,50127,5087,5047,507,50
0,99
0,96
0,93
x-Axis: Laingsburg WF: Active Power in MWLAIN132 WF: Voltage in p.u. - Base CaseLAIN132 WF: Voltage in p.u. - Lain132kV_Laingsburg_OffLAIN132 WF: Voltage in p.u. - Laingsburg_Boskloof_OffLAIN132 WF: Voltage in p.u. - Laingsburg_Droerivier_Off
DIGSILENT High Load Voltage
Voltage at Laingsburg Wind Farm Connection Point PV-Curve
Date: 7/24/2009
Annex: 1 /2
Small voltage changes due to Line outages

20
20Voltage Variations– cos phi(P)-characteristic
1,075
1,050
1,025
Y = 1,050 p.u.
X =150,000 MW
1.037 p.u. 1.038 p.u. 1.044 p.u.
1.050 p.u.
DIg
SIL
EN
T
•Power Factor control characteristic•Correct technology allows for
2010/06/07 20
200,00160,00120,0080,0040,000,00
1,000
0,975
0,950
x-Axis: Laingsburg WF: Active Power in MWLAIN132 WF: Voltage in p.u. - Base CaseLAIN132 WF: Voltage in p.u. - Lain132kV_Laingsburg_OffLAIN132 WF: Voltage in p.u. - Laingsburg_Boskloof_OffLAIN132 WF: Voltage in p.u. - Laingsburg_Droerivier_Off
DIGSILENT High Load Voltage
Voltage at Laingsburg Wind Farm Connection Point PV-Curve - cosphi(P)-characteristic
Date: 7/24/2009
Annex: 1 /2
•Correct technology allows for more active power transfer
21
21Voltage Variations - Summary
• High voltages in case of cos(phi)=1• Small voltage variations if cos(phi) adjusted to actually
generated power.• Voltage control at wind farm connection point is possible but not
required in this particular case – slow voltage control is standard requirement in Germany.
• Voltage control must be seen as ancillary service that stabilizes the grid and secures the grid against voltage collapse in case of
2010/06/07 21
the grid and secures the grid against voltage collapse in case of major disturbances.
• But: Typically voltage control capability of wind farms not available in case of zero power output (vw<vw_cutin).
22
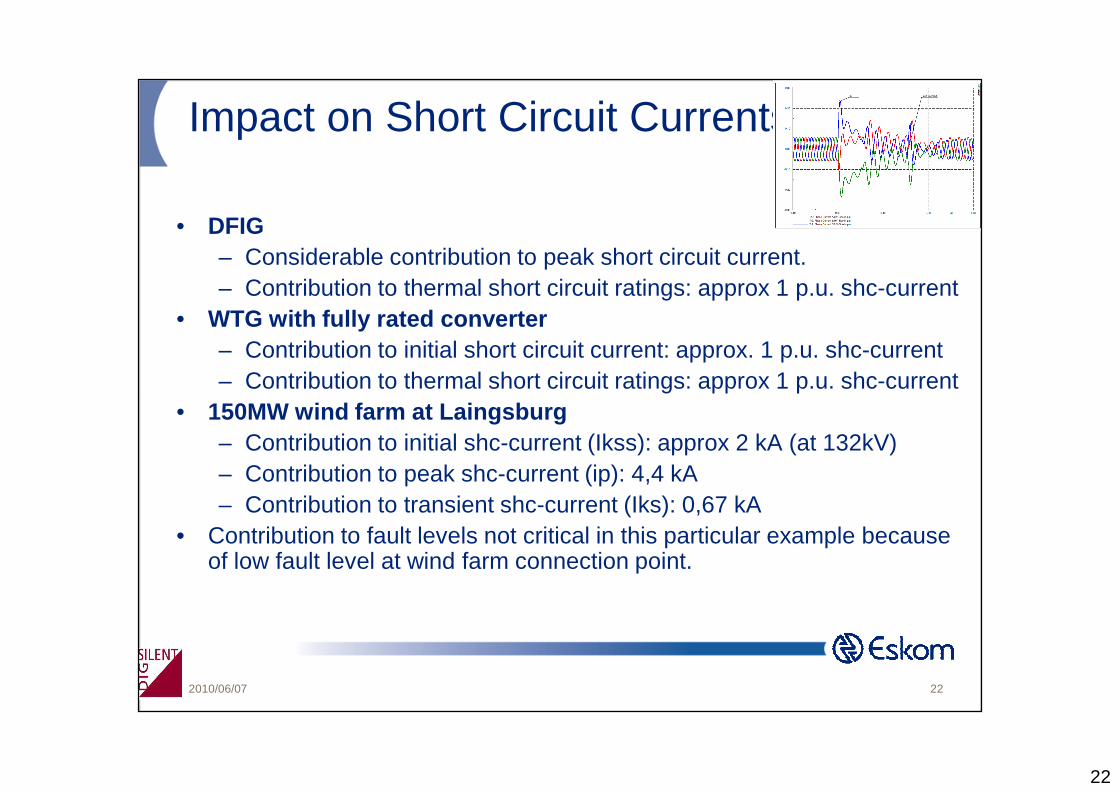
22Impact on Short Circuit Currents
• DFIG– Considerable contribution to peak short circuit current.– Contribution to thermal short circuit ratings: approx 1 p.u. shc-current
• WTG with fully rated converter– Contribution to initial short circuit current: approx. 1 p.u. shc-current– Contribution to thermal short circuit ratings: approx 1 p.u. shc-current
2010/06/07 22
• 150MW wind farm at Laingsburg– Contribution to initial shc-current (Ikss): approx 2 kA (at 132kV)– Contribution to peak shc-current (ip): 4,4 kA– Contribution to transient shc-current (Iks): 0,67 kA
• Contribution to fault levels not critical in this particular example because of low fault level at wind farm connection point.

23
23Impact on Flicker and Harmonics
• Analysis of Flicker and Harmonics using IEC 61400-21 data sheet of a typical variable-speed wind generator.• Flicker: Pst = 0,066 / Plt=0,08• Harmonics: THD=0,75%
• Flicker generally low in case of large wind farms because Flicker-relevant turbulences within a wind farm are only weekly correlated
• Harmonics of modern wind turbines (with IGBT-converters) very low. Almost no harmonic current injections.
2010/06/07 23
low. Almost no harmonic current injections.

24
24
Nuweveld
Distributed Wind Energy sites ~750 MW
35km25km
24km
Stage 2 – 750MW of Wind Gen in KarooRepresent a group of green field projects within re asonable distances
2010/06/07 24
12km
20km
Komsberg2 x 400 kV linesSeries compensated

25
25Stage 2 – 750MW – Scenarios for Studies
• System 2009 (without new 765kV running into the Cape)• Analysed cases
– High load, 1x Koeberg unit in– High load, 2x Koeberg units in– Low load, 1x Koeberg unit in– Low load, 2x Koeberg units in
• Generation Balancing / High Wind
2010/06/07 25
• Generation Balancing / High Wind– Reduction of Gas Turbine Generators (running in SCO
mode where possible)– Reduction of pump storage generation at Palmiet– Reduction of coal power plants outside the Cape

26
26Stage 2 – 750MW wind in Karoo - Voltages
1,08
1,05
1,02
X =750,000 MW
1.050 p.u.
1.034 p.u.
1.045 p.u.
1.052 p.u. 1.050 p.u.
X =750,000 MW
1.050 p.u.
1.034 p.u.
1.045 p.u.
1.052 p.u. 1.050 p.u. Y = 1,050 p.u.613.272 MW Y = 1,050 p.u.613.272 MW
DIg
SIL
EN
T
Expect high voltages
2010/06/07 26
1000,00800,00600,00400,00200,000,00
0,99
0,96
0,93
x-Axis: Static Generator: Active Power in MWStatic Generator: Voltage in p.u. - Base CaseStatic Generator: Voltage in p.u. Droerivier - Muldersvlei outStatic Generator: Voltage in p.u. Droerivier - Bacchus out
0.950 p.u. 0.950 p.u. 0.950 p.u. 0.950 p.u. Y = 0,950 p.u.Y = 0,950 p.u.

27
27Stage 2 – 750MW – Summary of Results
• No thermal overloads under n-1 conditions• Voltage variations very small, even in constant power factor
operation.• Operation with constant Q (var-control) is appropriate. • (Slow) voltage control is possible and should be considered.• 4x100Mvar shunt reactors required at Nuweveld substation (or
equivalent var-absorption of the wind farms) because of proximity to Komsberg series compensation.
2010/06/07 27
proximity to Komsberg series compensation.• Series compensation at Komsberg should be resized for
considering new line configuration.• With adjusted series compensation, shunt reactors at Nuweveld
might not be required.• No power quality issues because of the large number of turbines
and high fault level at the grid connection point

28
28Stage 3 – 2800MW of Wind Gen in the Cape
• Consideration of all wind farms in the Western Cape, for which application exist (2798MW by end of March 2009)
• High level feasibility studies considering the existing ESKOM transmission grid (excluding sub-transmission, <=132kV)
• Constraints:– No major network upgrades (such as new 400 kV lines)– Minor network upgrade, such as additional var-compensation
is allowed.
2010/06/07 28
is allowed.– Lump load in respective areas at current MTS substations
– Ignored installed transformer capacity• System 2009 (without the new 765kV line running into the Cape)

29
Stage 3 – 2800MW Generation distribution
220
750664
Scenario tested:
As per application
2010/06/07 29
400
300242
150
750Requests - 2009-03-26Load on 400 kVTransformercapacity may be required

30
30Stage 3 - 2800MW – Scenarios for Studies
• Consideration of all wind farms in the Western Cape, for which application exist (2798MW by end of March 2009)
• Assumption: Max. wind generation = installed generation -> overestimates max wind generation by 10..20%, leaving some margins.
• Analysed cases:– High load, 1x Koeberg unit in– High load, 2x Koeberg units in
2010/06/07 30
– High load, 2x Koeberg units in– Low load, 1x Koeberg unit in– Low load, 2x Koeberg units in
• Generation Balancing – High Wind Scenarios:– Reduction of Gas Turbine Generators (running in SCO mode
where possible)– Reduction of pump storage generation at Palmiet– Reduction of coal power plants outside the Cape

31
31Stage 3 – 2800MW of WindExample: Low Load + High Wind, 2xKoeberg units
967,56 MW-814,79 Mvar
Hyd
ra-L
uckh
of 4
00_3
(P
erse
us 3
)
25,4
5 %
253,87 MW-166,20 Mvar
Hyd
ra-L
uckh
of (
Bet
a) 4
00_1
21
,99
%
225,01 MW-134,50 Mvar
Hyd
ra-L
uckh
of 4
00_2
(P
erse
us 2
)
25,3
6 %
250,16 MW-169,79 Mvar
Bet
a-H
ydra
765
_2
6,42
%
238,53 MW-344,31 Mvar
968 MWNorthHydra
SubstationE Cape
Additional scenarios to be studiedNorthern Cape generation& Eastern Cape generation
2010/06/07 31
Hydra
-1912,25 MW407,80 Mvar
736,12 MW-183,35 Mvar
Hydra-Poseidon 400_1 31,32 %
362,80 MW-88,77 Mvar
Hydra-Poseidon 400_2 32,30 %
373,31 MW-94,58 Mvar-365,36 MW
94,39 MvarH
y dr a
- Vic
toria
40 0
_ 1 S
1
2 1,4
3 %
-452,87 MW81,11 Mvar
452,91 MW-81,47 Mvar
Hyd
ra-V
icto
ria 4
00_2
40
,47
%
-458,95 MW84,74 Mvar
Hyd
ra-V
icto
ria 4
00_1
S2
..39
,90
%
-452,91 MW81,47 Mvar
-635,08 MW147,56 Mvar
1912 MW 736 MW
W Cape
E CapeN Capegeneration
E Capegeneration

32
32What else needs to be done
• Additional, more detailed studies at transmission levels, including additional generation-load scenarios and alternative wind generation scenarios.
• Stability studies under various operating scenarios.• Wind farm connection studies for every wind farm application.• Studies related to transmission system operation under
situations, in which the Cape exports power to the rest of the system
2010/06/07 32
• Studies related to the expected total power variations of wind generation (variations, ramp-up and ramp-down speeds) for identifying additional reserve requirements have to be carried out.

33
Conclusion• Good cooperation by developers• REFIT 1 & 2 available • DoE IRP 1 available• Await DoE RE targets
MW/Technology• DoE IRP 2 will help dictate vision
that will help shape infrastructure• Await NERSA selection rules &
criteria
2010/06/07 33
• RFQ - RFP - PPA? Quotes for serious projects
• Renewable Energy Development Areas being studied – to motivate long term grid solutions
• Expectations high
The challenge is on for us in SA to make it work – we can do it!

34
Thank you• Also to Eskom for attending the SIDA – Life Academy “Wind
Energy Development and Use” course, 12April – 5 May 2010 in Sweden
• See www.Life.se for more info on 2011 course
2010/06/07 34