RI Comments letter, May 2011
75
C Environmental Protection Caswell F Holloway Corn missioner May 25, 201 1 Angela Licata Deputy Commssoner Christos Tsiarnis Environmental Plannirg ano Analysis Project Manager aIicatadep nycçjov U.S. Environmental Protection Agency New York Remediation Branch 59-17 Junction Boulevard 290 Broadway, 20th Floor 98 New York. NY 10007-1866 F: (718) 595-4479 Re: City of New York’s Comment on the Draft Remedial hvestigation of the Gowanus Canal Dear Mr. Tsiamis: The City of New York (“City”) hereby submits the following comments on the United States Environrnen:al Protection Agency (“EPA”)’s Draft Remedial Investigation (“Draft Ri”) for the Gowanus Canal Superfund Site, released in February 201 1. These comments vcre developed with the technical assistance of Louis Berger and Associates, RC. and The Science Collaborative. The City requests that these comments he included in the administrative record for the site. The City believes that the Draft RI represents a positive step fbrward, and we look forward to continuing to work with EPA and others to identi’ innovative solutions for the environmental remediation of the Canal, Furthermore, the City acknowledges EPA’s desire for both an open process and fr on aggressive schedule. The City remains concerned. huwever, ticti pursuing this titnelitie will lead to the omission of cerium tecimicol analyses which rue necessw y to ensure that the remedy at this complex sediment site vil I he feasible, e sneffectivc, and successful over the long-tenu. In the spirit of working together to determine a viable remedy for the Gowanus Canal sediments, the City recommends that the following actions take place to provide a more accurate and solid basis for proceeding with the Feasibility Study (hS): Morc Secilie (Inn .wteriznton of Key I pinni Sites md ( h oun&lw:.’ei Surface Water_Jnteracton: The Draft Ri contains a limited discussion of the potential contamination present on the upland sites, and whether soil or groundwater contamination at these sites could be curient or future sources
Transcript of RI Comments letter, May 2011

C
EnvironmentalProtection
Caswell F Holloway
Corn missioner
May 25, 201 1
Angela LicataDeputy Commssoner Christos TsiarnisEnvironmental Plannirg anoAnalysis Project ManageraIicatadep nycçjov U.S. Environmental Protection Agency
New York Remediation Branch59-17 Junction Boulevard 290 Broadway, 20th Floor
98 New York. NY 10007-1866F: (718) 595-4479
Re: City of New York’s Comment on the Draft Remedialhvestigation of the Gowanus Canal
Dear Mr. Tsiamis:
The City of New York (“City”) hereby submits the following comments on
the United States Environrnen:al Protection Agency (“EPA”)’s Draft
Remedial Investigation (“Draft Ri”) for the Gowanus Canal Superfund Site,
released in February 201 1. These comments vcre developed with the
technical assistance of Louis Berger and Associates, RC. and The Science
Collaborative. The City requests that these comments he included in the
administrative record for the site.
The City believes that the Draft RI represents a positive step fbrward, and
we look forward to continuing to work with EPA and others to identi’
innovative solutions for the environmental remediation of the Canal,
Furthermore, the City acknowledges EPA’s desire for both an open process
and fr on aggressive schedule. The City remains concerned. huwever, ticti
pursuing this titnelitie will lead to the omission of cerium tecimicol analyses
which rue necessw y to ensure that the remedy at this complex sediment site
vil I he feasible, e sneffectivc, and successful over the long-tenu. In the
spirit of working together to determine a viable remedy for the Gowanus
Canal sediments, the City recommends that the following actions take place
to provide a more accurate and solid basis for proceeding with the
Feasibility Study (hS):
Morc Secilie (Inn .wteriznton of Key I pinni Sites md ( h oun&lw:.’ei
Surface Water_Jnteracton: The Draft Ri contains a limited discussion of
the potential contamination present on the upland sites, and whether soil orgroundwater contamination at these sites could be curient or future sources

of contamination to the Canal. The City is patiicularly concerned about the progress of the on- and off-site investigations at the former Fulton and Metropolitan manufactured gas plants (MGPs), as a full characterization of the location, magnitude, and extent of all coal tar emanating from these sites is an essential component of the investigation of the Canal. The same type of investigation is also merited at other key upland sites.
The lack of information on these upland sites is compounded by the Draft RI's incomplete assessment of the groundwater-surface water interaction, as it does not identify specific locations of contaminant seeps or significant tidal interactions. We note that EPA is taking a far more aggressive approach with respect to investigating these issues at the Newtown Creek Superfund site. Unless and until significant sources of upland contamination are identified (including all coal tar contamination), and the contaminant fate and transport dynamics are fully understood, there remains a high possibility that such contamination will continue and interfere with the ultimate remedy for the Canal. Similarly, failure to identify contaminant fate and transport dynamics in the RI will limit the remedial action options available for consideration in the FS. Without a complete understanding of coal tar and other off-site contaminant dischat·ges to Gowanus Canal, EPA will be unable to consider remedial technologies that are at the top of the CERCLA hierarchy of preferred remedies, namely source removal and treatment.
Re-Assess CSO Discharges and Other Sources: The Draft RI nalTative overstates the relative significance of contamination associated with CSO discharges. The Draft RI also does not adequately take into account the water quality benefits associated with the City'S upgrades to the Gowanus pumping station, which will result in an atlliual 34% reduction in CSO discharges to the Canal, leading to an estimated 37% reduction in solids. At the same time, the Draft RI contains only a limited analysis of the contaminant contribution during wet weather from the over 200 unpennitted discharge pipes located within the Canal, most of which drain from industrial properties. Additionally, the Draft RI does not adequately analyze contaminant/sediment loads associated with overland stormwater flow. Without any characterization or quantification of the contamination from these uncontrolled ongoing sources, it is unclear how contaminant loads from these sources will be addressed in the FS. The City is also concerned that the natTative's focus on CSO discharges may distOli the underlying data and distract from much more significant factors bearing on the remedial design, specifically, designing measures to control the contaminant inventory in the deeper soft sediments and native deposits underlying the Canal, and the discharge of contaminated groundwater and other point source discharges.
More Rigorous SuppOli for Assumptions in Human Health Risk Assessment: The Human Health Risk Assessment makes several conservative assumptions concerning the level of human exposure to contaminants in the Canal. However, many of the assumptions are not adequately sUPPOlied and are based only on anecdotal information from a small sample of references, rather than objective, site-specific assessments (e.g., angler surveys, historic flooding data). These assumptions have therefore led to a largely unsupported and overly conservative assessment of human exposure to sediments in the Canal.
Lack of Mechanistic Model of Contaminant Fate and Transport: Mechanistic models capable of quantifying the fate and transport of contamination from a variety of sources
2

and in a variety of environmental media are essential for quantifying the contaminant loads associated with ongoing sources and evaluating phenomena unique to sediment sites such as the re-suspension and transport of surface sediments due to tidal or antlu'opogenic influences. For instance, it is essential to understand the movement of sediments from Gowanus Bay and the Upper New York Harbor into the Gowanus Canal before a remedial action can be appropriately selected and designed. Yet, the Draft RI does not rely upon, or even contain a plan to develop, a mechanistic model to assist in selecting and designing remedial strategies for the Gowanus Canal, for performing sensitivity analyses to refine remedial efforts, or for evaluating the potential for recontamination after the remedy is complete. Indeed, the Draft RI does not contain enough information to develop a mechanistic model at this time. Development of such a model is especially essential for Gowanus, as the hydrodynamics analyzed in the Draft RI will be modified when the City re-activates the flushing tmmel to improve current water quality. Considering the complexity, overall cost and importance of the remedial action on Gowanus Canal, we recommend that the FS process not be completed without this first developing a mechanistic model.
In addition to these concerns, the City also recommends that the upcoming FS carefully evaluate site-specific engineering concerns bearing on the constructability and cost effectiveness of certain remedial alternatives. Most specifically, the City is very concerned that dredging remedies may have significant impacts on the stability of the existing bulkhead system and the load bearing strength of sediments at various locations and depths beneath the sediment surface. Furthermore, a presumed "cut off" wall remedy for upland sites may not be feasible in certain areas if there is substantial subsurface infrastructure (e.g., sewer lines, utilities, or bulkhead support structures). We reconunend that EPA outline in a work plan what field studies/data collection it intends to conduct to address these issues, as an understanding of these issues is essential to developing realistic and cost effective remedial alternatives.
A. Coal Tal' and Petroleum Contamination - Not Current CSO Discharges - Are Primary Sources Of The CERCLA Hazardous Substances Identified In The Canal Sediments
The Draft RI identifies CSOs as one of several "primary" sources of contamination to the Gowanus Canal. See Draft RI, Fig. 6-2a. However, when the magnitude and chemical signature of contaminants in the CSO samples are compared to those identified in the sediment and native material samples, it is apparent that CSO discharges are not one of the primary sources of contamination. Instead, the hazardous substances in the sediments and underlying native materials are closely linked to the extensive coal tar and petroleum contamination adjacent to and underlying the Canal. Indeed, if EPA's human health risk calculations were prepared using EPA's data for the CSO sediment samples or inferred sediment concentrations from EPA's CSO aqueous samples, the associated risk from the Gowanus Canal site would be within the acceptable range (i. e., excess cancer risk less than 1 in 104
). Thus, while the permitted CSO outfalls on the Canal will remain a potential source of sanitary sewage and stormwater during certain wet-weather events, they are not an ongoing source of hazardous substances of concern in the Canal's sediments, which are the focus of the CERCLA investigative and remedial eff0l1s.
3
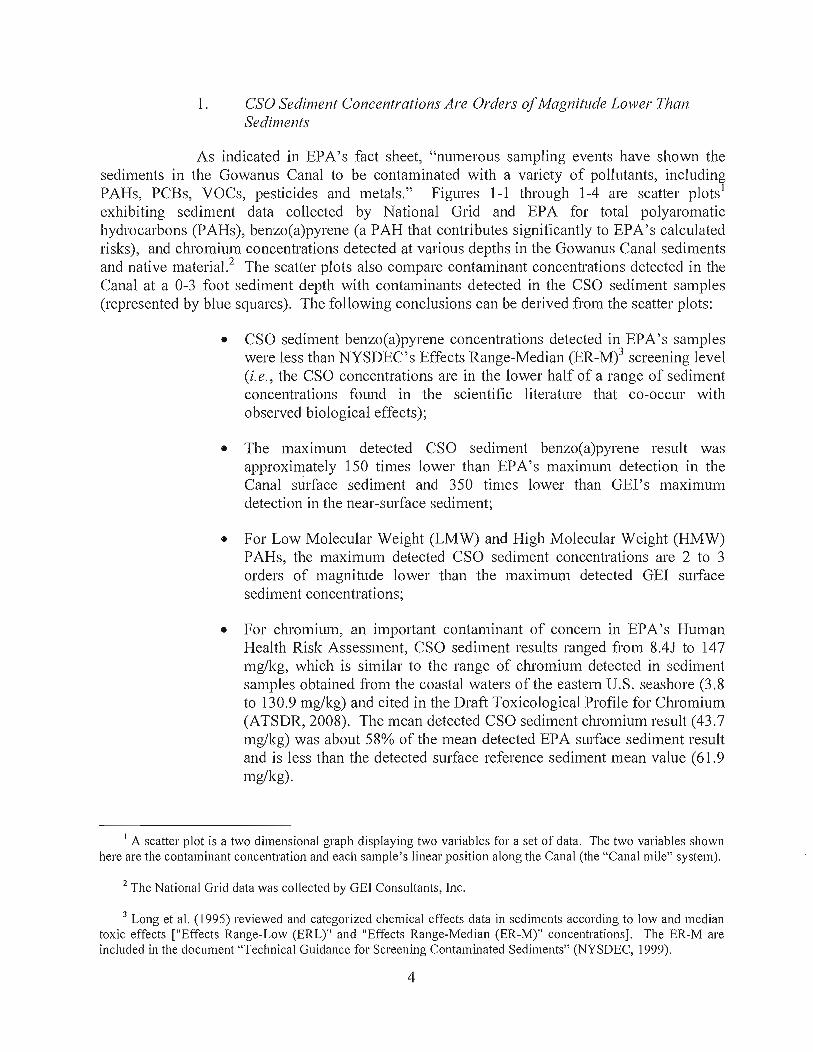
1. CSO Sediment Concentrations Are Orders of Magnitude Lower Than Sediments
As indicated in EPA' s fact sheet, "numerous sampling events have shown the sediments in the Gowanus Canal to be contaminated with a variety of pollutants, including PAHs, PCBs, VOCs, pesticides and metals." Figures 1-1 through 1-4 are scatter plots l
exhibiting sediment data collected by National Grid and EPA for total polyaromatic hydrocarbons (PAHs), benzo(a)pyrene (a PAH that contributes significantly to EPA's calculated risks), and chromium concentrations detected at various depths in the Gowanus Canal sediments and native materia1.2 The scatter plots also compare contaminant concentrations detected in the Canal at a 0-3 foot sediment depth with contaminants detected in the CSO sediment samples (represented by blue squares). The following conclusions can be derived from the scatter plots:
• CSO sediment benzo(a)pyrene concentrations det~cted in EPA's samples were less than NYSDEC's Effects Range-Median (ER-M)3 screening level (i. e., the CSO concentrations are in the lower half of a range of sediment concentrations found in the scientific literature that co-occur with observed biological effects);
• The maximum detected CSO sediment benzo(a)pyrene result was approximately 150 times lower than EPA's maximum detection in the Canal surface sediment and 350 times lower than GEl's maximum detection in the near-surface sediment;
o For Low Molecular Weight (LMW) and High Molecular Weight (HMW) P AHs, the maximum detected CSO sediment concentrations are 2 to 3 orders of magnitude lower than the maximum detected GEl surface sediment concentrations;
• For chromium, an important contaminant of concern in EPA's Human Health Risk Assessment, CSO sediment results ranged from 8.4J to 147 mg/kg, which is similar to the range of chromium detected in sediment samples obtained from the coastal waters of the eastern u.s. seashore (3.8 to 130.9 mg/kg) and cited in the Draft Toxicological Profile for Chromium (ATSDR,2008). The mean detected CSO sediment chromium result (43.7 mg/kg) was about 58% of the mean detected EPA surface sediment result and is less than the detected surface reference sediment mean value (61.9 mg/kg).
1 A scatter plot is a two dimensional graph displaying two variables for a set of data . The two variables shown here are the contaminant concenh·ation and each sample's linear position along the Canal (the "Canal mile" system).
2 The National Grid data was collected by GEl Consultants, Inc.
3 Long et al. (\995) reviewed and categorized chemical effects data in sediments according to low and median toxic effects ["Effects Range-Low (ERL)" and "Effects Range-Median (ER-M)" concenh·ations]. The ER-M are included in the document "Technical Guidance for Screening Contaminated Sediments" (NYSDEC, 1999).
4
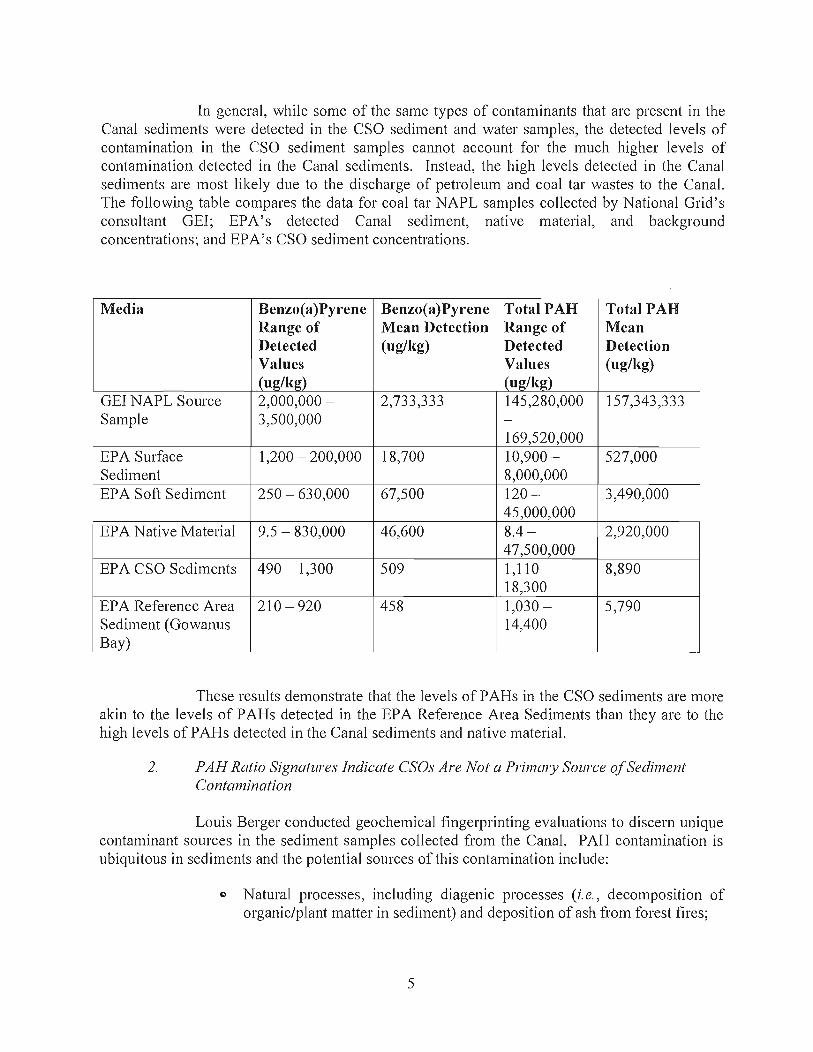
In general, while some of the same types of contaminants that are present in the Canal sediments were detected in the CSO sediment and water samples, the detected levels of contamination in the CSO sediment samples cannot account for the much higher levels of contamination detected in the Canal sediments. Instead, the high levels detected in the Canal sediments are most likely due to the discharge of petroleum and coal tar wastes to the Canal. The following table compares the data for coal tar NAPL samples collected by National Grid's consultant GEl; EPA's detected Canal sediment, native material, and background concentrations; and EPA's CSO sediment concentrations.
Media Benzo( a )Pyrene Benzo( a )Pyrene Total PAH Total PAH Range of Mean Detection Range of Mean Detected (ug/lig) Detected Detection Values Values (ug/lig) (ug/kg) (ug/lig)
GEl NAPL Source 2,000,000 - 2,733,333 145,280,000 157,343,333 Sample 3,500,000 -
169,520,000 EPA Surface 1,200 - 200,000 18,700 10,900 - 527,000 Sediment 8,000,000 EP A Soft Sediment 250 - 630,000 67,500 120 - 3,490,000
45,000,000 EPA Native Material 9.5 - 830,000 46,600 8.4 - 2,920,000
47,500,000 EPA CSO Sediments 490 - 1,300 509 1,110 - 8,890
18,300 EP A Reference Area 210 - 920 458 1,030 - 5,790 Sediment (Gowanus 14,400 Bay)
These results demonstrate that the levels of P AHs in the CSO sediments are more akin to the levels of P AHs detected in the EPA Reference Area Sediments than they are to the high levels of P AHs detected in the Canal sediments and native material.
2. P AH Ratio Signatures Indicate CSOs Are Not a Primary Source of Sediment Contamination
Louis Berger conducted geochemical fingerprinting evaluations to discern unique contaminant sources in the sediment samples collected from the Canal. P AH contamination is ubiquitous in sediments and the potential sources of this contamination include:
Natural processes, including diagenic processes (i.e., decomposition of organic/plant matter in sediment) and deposition of ash from forest fires;
5

o Combusted/pyrolysed fossil fuels or wastes, including wastes from the manufactured gas process (pyrogenic sources);
o Petroleum (e.g., fuel oil and diesel) spills/releases (petro genic sources);
o Urban background sources including residues from vehicle exhaust, generators, pavements, oil drips from vehicles, etc.
Figure 2 shows a plot (referred to as a "P AH double-plot ratio") of the ratio of chrysene to benzo(a)pyrene versus the ratio of fluoranthene to pyrene (referred to in this section as the "Selected PAH Ratios") from three different data sets: (i) Gowanus Canal sediment data; (ii) EPA CSO sediment data; and (iii) "source" data collected by GEl (samples of coal tar, tar seeps, and roadway pavement). The graphical display of the Selected P AH Ratios is a method that can identify the likely sources of the PAH contamination (e.g., urban background, pyrogenic, petrogenic, creosote, etc.) (Costa and Sauer, 2005). This method compares the abundance of the Selected PAH Ratios with data generated at other PAH-contaminated sites. The selected P AHs are resistant to environmental degradation, so that source identification can be evaluated even in weathered samples.
Figure 2 demonstrates that the majority of Gowanus Canal sediment and native material samples from varying depths (shown as blue circles) plot within a region of the chart that is associated with a coal tar (pyrogenic/manufactured gas waste) source. The sizes and positions of the labeled and circled areas on the chart are based on the Costa and Sauer research. It should be noted that samples of non-aqueous phase liquid (NAPL) (shown as red diamonds) collected from Public Place MGP plot at the center of the coal tar source region, with the majority of the sediment samples clustered around them. The NAPL 'source' samples were collected by GEl specifically to allow comparison of sediment results to the ' chemical signature' of on-site coal tar. Our conclusion is that the majority of the sediment PAH contamination is linked to releases of MGP waste into the Gowanus Canal. Some of the outfall water samples collected by GEl (yellow diamonds) also plot in the coal tar area. The report characterizes the sampled outfalls as "unknown," and perhaps connected to specific discharges, parking lot catch basins, disused piping, etc.
In contrast, the CSO sediment samples collected by EPA (green squares) plot outside the region associated with a coal tar source. Indeed, not all of the CSO sediment samples collected by EPA could be displayed on Figure 2 because one or more of the necessary P AHs were not detected in the samples. Also distinct from the sediment and native material is a group of roadway pavement samples collected in the vicinity of the site (brown diamonds), which appear in the upper left-hand portion of the plot, suggesting that run-off from roadways in the vicinity are not a primary source of the sediment and native material contamination.
A number of sediment/native material samples (blue circles) and seep samples (blue diamonds; samples collected by GEl near the Barrett and Witco tar products sites in Red Hook) plot outside the coal tar source region, displaying a higher ratio of fluoranthene to pyrene compared to other sediment/native material samples, and indicating a greater influence from P AHs associated with urban background sources and petro genic P AHs. In conclusion, while P AH contaminants are detected in samples of sediment from the CSO system, the ' chemical
6

signature' of the CSO system is unique from that of the Gowanus Canal native material and sediment, which is dominated by a coal tar waste signature.
3. Principal Components Analysis Indicates that CSOs are Not a PrimClT'Y Source of Contamination
A Principal Component Analysis (PCA) is a statistical data transformation that can be used to evaluate the variations and characteristics of a dataset. The PCA identifies "principal components" or axes that best describe the variations in the data based on the input variables. For this PCA, the input variables were the PAH concentrations in the sediment, native material, CSO sediment, outfall water, and source material samples collected by GEl, USACE, and EPA.
Figure 3 shows the results of the PCA for the Gowanus Canal data. The axes of the figure represent the first and second principal components within the transformed data. The spatial relationships between the plotted samples represent the similarity or dissimilarity of their "chemical signatures." Samples that plot close to one another tend to be chemically similar and samples that are distant from one another are chemically distinct. The relative distributions of PAH concentrations within the samples are the underlying basis for the trends observed in the PCA plot. The majority of the EPA CSO sediment samples plot to the lower right pOltion of the PCA figure, distinct from the sediment samples. This indicates that the CSO sediments are not chemically similar to the Canal sediments. In contrast, the NAPL source samples collected by GEl plot at the opposite/left-hand side of the plot, nearest to the majority of the native material samples and deeper sediment samples, indicating that the native material and deeper sediment contamination is chemically similar to the NAPL samples.
4. Risk Calculations Applied to CSO Sediment and Aqueous Data Yield Acceptable Risk
The characterization of the contaminant sources becomes critical in regard to their ability to "drive" unacceptable ecological and human health risks. For example, Table 7.3RME of the Draft RI (page 236 of 428 in the Appendix L PDF file) summarizes the calculated excess cancer risk for a child receptor due to exposure to surface sediment. The exposed surface sediment total cancer risk is calculated as 4.3 x 10⁻⁴ for the child receptor, which is due primarily to benzo(a)pyrene and chromium exposure.
Tables la through Ig repeat and summarize the human health risk calculations, as presented in the RI report, using the concentrations of contaminants detected by EPA in the CSO solids and CSO effluent samples.
o Contaminant concentrations in CSO solids are 10 to 100 times lower than surface sediments in the Gowanus Canal.
• Calculated human health exposure risks from CSO solids are 20 times lower than those calculated for surface sediment exposure.
7

• For site-specific contaminants (e.g., not including risks calculated for chromium, which is within background levels), human health risks due to CSO solids are 50 times lower than those calculated for surface sediments and would be within EPA's acceptable risk range.
Based on EPA's dataset for the CSO characterization in the Draft RI, in a hypothetical scenario where the CSO discharges were the sole source of solids to the Oowanus Canal, no unacceptable human health risk from the suite of contaminants included in EPA's risk assessment (PARs and other CERCLA hazardous substances) would be present.
Moreover, it should also be noted that toxic contaminants in the public sewers have been significantly controlled by the City's Industrial Pretreatment Program. The purpose of the IPP program is to control toxic discharges to public sewers that are tributary to sewage treatment plants by regulating Significant Industrial Users (SIU). Of the 310 Significant Industrial Users (SIUs) that exist citywide, five are cUlTently within the Oowanus Canal watershed. The total permitted flow rate of these SIUs is 0.024 million gallons per day (MOD), which corresponds to about 0.2 percent of the 14.1 MOD daily dry weather flow generated within the watershed, or 0.01 percent of the 1,215 MOD daily dry weather flow generated Citywide. It can be inferred from these flows that, of the 39.1 lb/day of metals in the City-wide dryweather flow, less than 0.004 lbs/day of metals are generated in the Oowanus Canal area. Since a portion of the combined sewage generated during wet weather is captured for treatment, the potential metals load to Oowanus Canal from SIUs during wet weather is extremely small.
In sum, while EPA's CSO sampling indicates the presence of some PARs and metals in the CSO sediments, the mere presence of these compounds does not dictate that the CSOs are a primary source of the significant contamination identified in the Canal sediments. Instead, a comparison of type and level of contamination found in the CSO sediments with the type and level of CSOs found in the Canal sediments indicates that the source of the sediment contamination is likely the substantial reservoirs of coal tar and petroleum-related contamination underlying and adjacent to the Canal.
B. Observations Concerning Mid-Canal Hot Spot
Figures 4-1 a through 4-4b present planview plots of contaminant concentration vs. Canal mile (with mile 0 set where the Canal empties into Oowanus Bay and mile 1.48 set at the terminus of the Canal) for three depth intervals: 0-3 feet (near-surface soft sediment including EPA's surface sediment samples), 3 feet to the top of the native material (the deeper soft sediments), and the native material layer that underlies the Canal sediment. The following contaminants were plotted:
• Figure 4-1a-b: benzo(a)pyrene, a PAR associated with petroleum, MOP waste (coal tar), and urban background sources.
• Figure 4-2a-b: the sum of LMW PAR concentrations.
• Figure 4-3a-b: the sum ofRWM PAR concentrations.
8

Figures 4-4a-b: clU'omium, a significant "risk-driver" in EPA's human health risk calculations.
The planview plots demonstrate that the distributions of P AHs and metals in the sediment layers exhibit two distinct patterns:
o P AH contaminant concentrations indicate distinct hotspots along the length of
the Canal, most notably a hotspot in the soft sediment and near-surface sediment between approximately Canal mile 0.7 to Canal mile 1.0. In addition, detected P AH concentrations are of comparable, elevated magnitude at the various depths sampled (in native material, soft sediment, and surface sediment samples).
• Chromium was detected at very low concentrations in the native material (12.3 mg/kg EPA mean concentration), in comparison to the soft sediment stratum.
On Figures 4-1a and 4-1b, benzo(a)pyrene concentrations are comparatively elevated between approximately Canal miles 0.7 to 1.0, in the vicinity of Public Place. LMW and HMW PAHs (Figures 4-2a through 4-3b) display a similar distribution along the Canal. In each depth interval sampled, significant concentrations of P AH contaminants were detected, indicating a large contaminant inventory in both the native material and overlying soft sediments. For example, benzo(a)pyrene detections in EPA surface sediment, soft sediment, and native . material samples were each in the range of tens of thousands of micrograms per kilogram of sample. If the Canal is primarily a depositional environment, as described in Section 6.3 of the Draft RI, the slower-than-anticipated recovery of surface sediment P AH concentrations is likely attributable to dissolution of NAPL and the migration of dissolved and possibly product contamination via groundwater/porewater discharge to the Canal. 4 In other words, the data indicates that the P AHs are likely to be migrating up from the NAPL in the deeper sediments and resulting in continued contamination of the shallower sediments.
Figures 1-1 through 1-4 present 'scatter plots' of contaminant concentration vs. Canal mile for three depth intervals: 0-3 feet (soft sediment including EPA's surface sediment samples), 3 feet to the top of the native material (the deeper soft sediments), and the native material layer that underlies the Canal sediment. Where multiple samples were present in a single depth interval at a single location, the maximum detected contaminant concentration was plotted. Non-detect results were plotted at one-half ofthe analytical detection limit.
4 In contrast, the lower mean concenh"ations of chromium detected in surface sediment samples (compared to deeper soft sediment samples) may indicate ongoing recovery of the surface concenh"ations in a depositional environment where there is not - unlike PAHs - an ongoing 'reservoir' or source of contamination (coal tar) in the native material and deeper soft sediment. In other words, the pattern of chromium contamination in the sediment layers provides some indication that there has been reductions in the concenh"ation following the decline of indush"ial activities along the Canal.
9
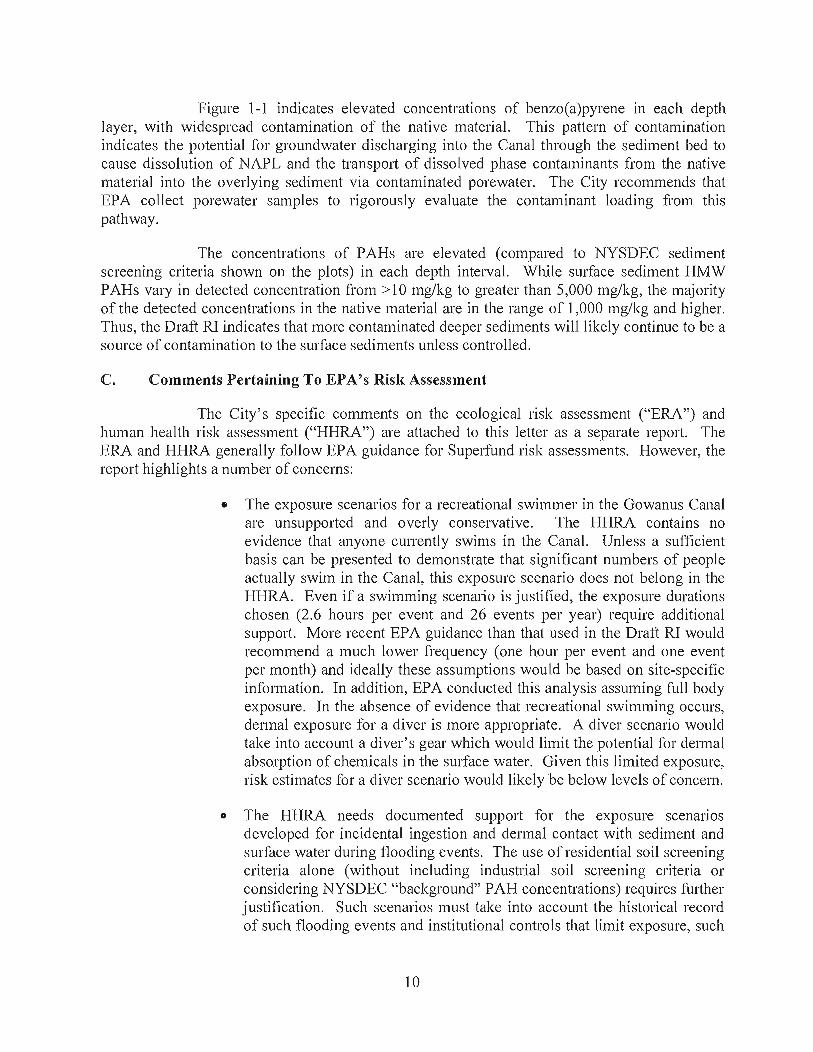
Figure 1-1 indicates elevated concentrations of benzo(a)pyrene in each depth layer, with widespread contamination of the native material. This pattern of contamination indicates the potential for groundwater discharging into the Canal through the sediment bed to cause dissolution of NAPL and the transport of dissolved phase contaminants from the native material into the overlying sediment via contaminated porewater. The City recommends that EP A collect porewater samples to rigorously evaluate the contaminant loading from this pathway.
The concentrations of PAHs are elevated (compared to NYSDEC sediment screening criteria shown on the plots) in each depth interval. While surface sediment HMW PAHs vary in detected concentration from> 10 mg/kg to greater than 5,000 mg/kg, the majority of the detected concentrations in the native material are in the range of 1,000 mg/kg and higher. Thus, the Draft RI indicates that more contaminated deeper sediments will likely continue to be a source of contamination to the surface sediments unless controlled.
C. Comments Pertaining To EPA's Risk Assessment
The City's specific comments on the ecological risk assessment ("ERA") and human health risk assessment ("HHRA") are attached to this letter as a separate report. The ERA and HHRA generally follow EPA guidance for Superfund risk assessments. However, the report highlights a number of concerns:
• The exposure scenarios for a recreational swimmer in the Gowanus Canal are unsupported and overly conservative. The HHRA contains no evidence that anyone currently swims in the Canal. Unless a sufficient basis can be presented to demonstrate that significant numbers of people actually swim in the Canal, this exposure scenario does not belong in the HHRA. Even if a swimming scenario is justified, the exposure durations chosen (2.6 hours per event and 26 events per year) require additional support. More recent EPA guidance than that used in the Draft RI would recommend a much lower frequency (one hour per event and one event per month) and ideally these assumptions would be based on site-specific information. In addition, EPA conducted this analysis assuming full body exposure. In the absence of evidence that recreational swimming occurs, dennal exposure for a diver is more appropriate. A diver scenario would take into account a diver's gear which would limit the potential for dermal absorption of chemicals in the surface water. Given this limited exposure, risk estimates for a diver scenario would likely be below levels of concern.
o The HHRA needs documented suppOli for the exposure scenarios developed for incidental ingestion and dermal contact with sediment and surface water during flooding events. The use of residential soil screening criteria alone (without including industrial soil screening criteria or considering NYSDEC "background" PAH concentrations) requires fUliher justification. Such scenarios must take into account the historical record of such flooding events and institutional controls that limit exposure, such
10
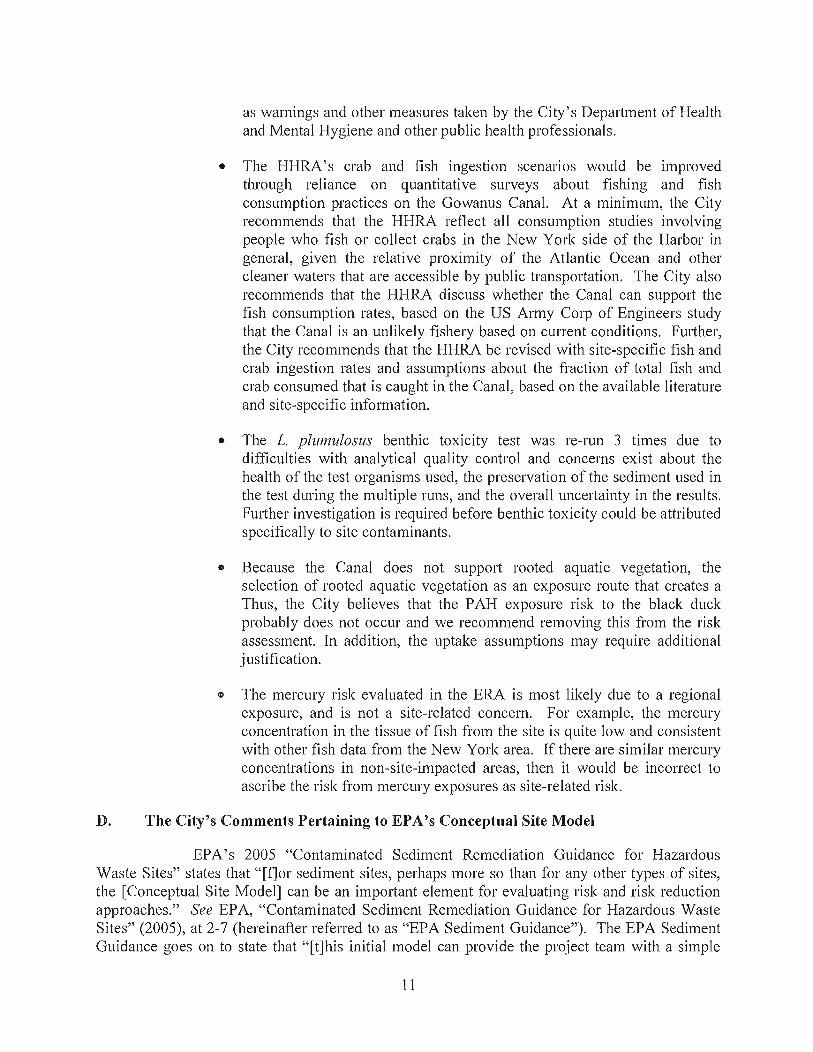
as warnings and other measures taken by the City's Department of Health and Mental Hygiene and other public health professionals.
• The HHRA's crab and fish ingestion scenarios would be improved through reliance on quantitative surveys about fishing and fish consumption practices on the Gowanus Canal. At a minimum, the City recommends that the HHRA reflect all consumption studies involving people who fish or collect crabs in the New York side of the Harbor in general, given the relative proximity of the Atlantic Ocean and other cleaner waters that are accessible by public transportation. The City also recommends that the HHRA discuss whether the Canal can support the fish consumption rates, based on the US Army Corp of Engineers study that the Canal is an unlikely fishery based on cunent conditions. Fmiher, the City recommends that the HHRA be revised with site-specific fish and crab ingestion rates and assumptions about the fraction of total fish and crab consumed that is caught in the Canal, based on the available literature and site-specific information.
• The L. plumulosus benthic toxicity test was re-run 3 times due to difficulties with analytical quality control and concerns exist about the health of the test organisms used, the preservation of the sediment used in the test during the multiple runs, and the overall uncertainty in the results. Fmiher investigation is required before benthic toxicity could be attributed specifically to site contaminants.
o Because the Canal does not support rooted aquatic vegetation, the selection of rooted aquatic vegetation as an exposure route that creates a Thus, the City believes that the P AH exposure risk to the black duck probably does not occur and we recommend removing this from the risk assessment. In addition, the uptake assumptions may require additional justification.
o The mercury risk evaluated in the ERA is most likely due to a regional exposure, and is not a site-related concern. For example, the mercury concentration in the tissue of fish from the site is quite low and consistent with other fish data from the New York area. If there are similar mercury concentrations in non-site-impacted areas, then it would be incorrect to ascribe the risk from mercury exposures as site-related risk.
D. The City's Comments Pertaining to EPA's Conceptual Site Model
EPA's 2005 "Contaminated Sediment Remediation Guidance for Hazardous Waste Sites" states that "[f]or sediment sites, perhaps more so than for any other types of sites, the [Conceptual Site Model] can be an impOliant element for evaluating risk and risk reduction approaches." See EPA, "Contaminated Sediment Remediation Guidance for Hazardous Waste Sites" (2005), at 2-7 (hereinafter referred to as "EPA Sediment Guidance"). The EPA Sediment Guidance goes on to state that "[t]his initial model can provide the project team with a simple
11

understanding of the site based on available data" and "[i]nformational gaps may be discovered in the development of the CSM that supports the collection of new data." Id. Given the importance of the CSM in characterizing large sediment sites, the City reconm1ends that the following additional data collection and/or data analysis to improve the Gowanus CSM.
1. Sediment Stability
As explained in the EPA Sediment Guidance, "[in] most aquatic environments, surface sediments and any associated contaminants move over time. The more important and more complex issue is whether movement of the contaminated sediments (surface and subsurface), or of contaminants alone, is occurring or may occur at scales and rates that will significantly change their current contribution to human health and ecological risk." See EPA Sediment Guidance, 2-23. The Guidance further states that "[a]ddressing this issue requires an understanding of the role of natural processes that counteract sediment and contaminant movement and fate, such as natural sedimentation and armoring, and contaminant transformations to less toxic or less bioavailable compounds. For this reason, it is important for project managers to use teclmical experts to help in the analysis, especially where large amounts of resources are at stake." Id.; see also EPA, "Principles for Managing Contaminated Sediment Risks at Hazardous Waste Sites" (Feb. 12, 2002) (stating in Principle 4 that "A conceptual site model is especially impOliant at sediment sites because the interrelationship of soil, surface and groundwater, sediment, and ecological and human receptors is often complex").
Section 6.3 of EPA's Draft RI Report provides a very general discussion of sediment stability in the Gowanus Canal, noting that the Canal is expected to be a depositional envirom11ent that generally accumulates sediment due to its lack of hydrologic movement, while identifying some sources of potential re-suspension (e.g., vessel movements and prop wash). The City recommends significantly expanding this analysis prior to development of remedial alternatives for the FS. A better understanding of the transpOli, mixing and potential deposition of solids from Gowanus Bay and Buttermilk Channel (via the flushing tunnel) will be required. We recommend that EPA conduct additional empirical studies to evaluate sediment stability in the Gowanus Canal, such as bathymetric evaluations (based on multiple bathymetric surveys conducted over time), collection and evaluation of sediment shear strength data, collection and analysis of sediment cores for key radionuclides such as Be-7 and Cs-137 ("dated" sediment cores), further evaluation of downcore contaminant profiles, and sediment-contaminant mass balance studies. See EPA Sediment Guidance, 2-28 (providing a list of key empirical methods to evaluate sediment and contaminant movement, including sediment-contaminant mass balance studies). FU1iher evaluation would be needed to quantify the change (likely a reduction) in deposition associated with reactivation of the flushing tunnel.
2. Further Development of Groundwater Pathway in the CSM
The EPA Sediment Guidance identifies that the "upwelling or seepage of contaminated groundwater or [NAPL] into a water body" is one of the major potential sources of contamination of sediment. See 2005 EPA Sediment Guidance, at 1-2. A highly detailed assessment of groundwater and surface water interaction is critical because the relationship may be different at different locations within a water body. As the 2005 Sediment Guidance explains, "Pore water in sediment generally is interconnected with both surface water and groundwater,
12
although the degree of interconnection may change from place-to-place and with flow changes in ground water and surface water." [d., at 1-2 - 1-3. A thorough understanding of these conditions is highly important to the development of the CSM because it will assist in the development and refinement of the remedy.
At the Newtown Creek Superfund site, EPA is requesting that the remedial investigation contain a rigorous evaluation of potential contaminant loadings from groundwater seepage and upwelling into the Creek. Although the Canal is located only two miles from the Creek and is within the same groundwater system, the Gowanus Draft RI contains only a limited evaluation of the groundwater-surface water interaction, and has not specifically identified groundwater seeps that may be contributing to contaminant loadings. The City strongly suggests that the technical basis for the EPA's approaches at these sites with respect to investigating groundwater contamination must be aligned and consistent, with a complete groundwater contamination analysis at both sites.
Given the recommendations of the EPA Sediment Guidance and Region 2' s approach at Newtown Creek, we recommend that the Gowanus CSM include a far more detailed discussion of the fate and transpOli of contaminants via the groundwater pathway, including a more expansive discussion of the groundwater-surface water interaction. We also recommend adding additional description of the various mechanisms for contaminant migration via groundwater to the CSM, and addressing historic changes in groundwater usage, which help to explain current hydrologic conditions. As described fmiher below, historic groundwater withdrawal for industrial and potable use in the Gowanus Canal area set the stage for the current accumulation of contaminants and free product in the native material underlying the Canal sediments.
The existing groundwater conditions around the Canal have been greatly influenced by historic groundwater pumping activities and their cessation, as repOlied in "Site Investigation Report for Environmental Investigations at Three City-Owned Properties (NYCDEP, 2010). From 1904 through 1947, a huge cone of depression was created in the regional water table by significant groundwater withdrawal for drinking water and industrial purposes. See "Reconnaissance of the Ground-Water Resources of Kings and Queens Counties, New York," prepared by H. Buxton, J. Soren, A. Posner, and P. Shernoff; see also Series of Water Table Maps for the Years 1903, 1936, 1943, 1951, 1961 , 1974, and 1981 (USGS Open File repOli 81-1186). By 1904, combined potable, ice production-related, and heavy industrial groundwater withdrawals reached approximately 30 million gallons per day (MGD). This total spiked to even higher levels of around 70 MGD in the late 1920s and continued at approximately 60 MGD until the late 1940s. The magnitude of this pumping reversed the natural water table and flow regime in the vicinity of the Gowanus Canal and temporarily rendered the Canal a recharge area instead of a natural discharge area.
On both the 1936 and 1943 USGS groundwater contour maps, the groundwater elevation is -20 feet in the upper (nOliheastern) pOliion of the Canal and -10 feet in the lower (southwestern) portion of the Canal. Based on this magnitude of head differential, groundwater would not have discharged (flowed) to the Canal during that time period. Fmiher, the surface water (and associated contaminants) in the Canal would have had a strong potential to be induced downwards tlu'ough the sediment bed (Canal bottom), flowing with gravity downwards
13

toward the depressed water table. The groundwater (and associated contamination) in the region of the Canal would have then flowed to the northeast, towards the pumping well locations, as indicated by the historic USGS maps.
In 1947, withdrawal for potable use ceased due to saltwater intrusion, and the groundwater began to return to the pre-pumping conditions and flowed (as it did in 1903) towards the Canal. The observed depression is greatly reduced in the 1961 USGS groundwater contour map and was no longer observed in the 1974 map. Thus, from the 1950s tlu'ough the present, the groundwater surrounding the Canal had the potential to flow back to the Canal under the natural (without pumping) flow regime. This is consistent with the information in the Draft RI, which notes that " . .. at the water table, groundwater flows toward the Gowanus Canal. Potentiometric surface data from intermediate wells depicts a more complex pattern, with groundwater flowing upward toward the Canal, which is typical of a discharge area." See Draft RI, at 3 -13 . EPA's Draft RI report also indicates a tidal component of the groundwater-surface water interaction, such that surface water from the Gowanus Canal flows into the fill and alluvium behind the bulkheads at high tide, followed by discharge of groundwater into the Canal at low tide.
As the water table recovered after the termination of significant pumping, contamination is likely to have been "trapped" below the water table - at least temporarily. It is likely that contamination, such as DNAPL and P AHs from MGP-related coal tars and other contaminants, was pulled below the CUlTent elevation of the water table, beneath industrial source properties in upland areas. With pre-pumping hydraulic conditions restored by the 1970s tlu'ough the 1980s, upland contaminant releases to underlying groundwater and the historical "trapped" contamination could again enter the Canal with groundwater discharge tlu'ough the sediment bed and bulkheads.
The Draft Remedial Investigation Technical RepOli for Public Place (GEl, 2007) contains a Longitudinal Cross-Section of the Gowanus Canal that displays sediment and native material texture along with observations of petroleum and tar contamination in cores collected from the Gowanus Canal. The observations of tar-saturated material are primarily repOlied in the native material, at elevations generally deeper than -15 to -20 feet (NAVD 88). This is consistent with the Draft RI, which notes that "NAPL is less common and typically present in smaller amounts in soft sediment than in native sediments .... NAPL was present in native sediment at nearly all of the sampling locations where it was recovered." See Draft RI, at 4-8 . Historically, it is probable that NAPL collected in the deeper native material as it was released from upland sites into the subsurface soils and also discharged directly into the Canal. This would be due to both the denser-than-water nature of coal tar wastes from the MGP activities and the historic drawdown of the water table.
We recommend that the Gowanus CSM identify and evaluate the groundwater fate and transpOli mechanisms potentially acting on existing subsurface contamination in the vicinity of the Gowanus Canal:
• Dissolution of NAPL and transpOli of dissolved contaminants from the native material upward into the overlying soft sediments and Canal surface water via groundwater/porewater discharge;
14
• Transport of surface water contaminants into the fill and alluvium (shallow aquifer) surrounding the Canal during high tide intrusion of surface water through the bulkheads;
o Transport of upland site subsurface contaminants and vicinity groundwater contaminants laterally toward the Gowanus Canal and into the Canal surface water and sediment during discharge of groundwater at low tide.
In its present stage, the Gowanus CSM is incomplete. The Draft RI ' s description of the groundwater-surface water interaction presents a number of disparate observations without providing a conclusion that cohesively describes the interaction. Sections 3.7 and 3.8 of the Draft RI, when taken together, provide inconsistent interpretations of the data. For example, the following four conclusions from the Draft RI provide a contradictory and incomplete interpretation of the groundwater-surface water interaction:
• The Draft RI indicates that the detection of acidic pH values in the Canal surface water may reflect areas influenced by groundwater discharge.
o At the same time, the Draft RI indicates that the absence of a decline in surface water Total Dissolved Solids with increasing distance from Gowanus Bay indicates minimal groundwater contribution to the Canal.
• The Draft RI contains potentiometric surface maps which suggest that at the water table, groundwater flows towards the Gowanus Canal, and in the intermediate wells, groundwater generally flows upward toward the Canal (typical of a groundwater discharge area).
• However, the Draft RI also notes that monitoring wells adjacent to the Canal exhibit sodium chloride concentrations and Canal elevations exceed groundwater potentiometric elevations at high tide; suggesting that the groundwater is recharged by surface water.
These inconsistent interpretations of the groundwater-surface water interaction need to be reconciled and a contaminant fate evaluation and mass balance needs to be prepared to evaluate the relative loads and contributions of contaminants via the groundwater pathway. The suite of contaminants that may be transpOlted via the groundwater pathway, based on previous groundwater analytical results from limited upland investigations, include VOCs, SVOCs, PAHs, pesticides, PCBs, cyanide, metals, LNAPLs, DNAPLs, coal tar, MTBE, and petroleum-based contaminants such as BTEX compounds. The upward groundwater flow gradient and magnitude, which has the potential to encourage dissolution ofNAPL and to transpOlt dissolved contaminants from the native material into the overlying sediment and surface water, needs to be well-understood prior to the evaluation of remedial alternatives for the Canal. For example, the design of a sub-aqueous capping alternative will most likely require incorporation of layers designed to adsorb/isolate contaminants moving upward through the sediment prior to their release into the water column, and will require an adequate characterization of porewater flux in the Canal. The removal of contaminated soft sediments via dredging may exacerbate the release
15

of contaminants from the native material. Another impOliant data gap related to groundwater transport is the permeability of the bulkhead itself.
In sum, while the Gowanus CSM explains these concepts in the abstract, a far more refined assessment of the groundwater-surface water interactions is needed to understand likely variations in different sections of the Canal.
3. Further Consideration of Potential Sources of Contamination
The 2005 EPA Sediment Guidance states that one of the "essential elements" of the CSM is to "include information about contaminant sources." See 2005 EPA Sediment Guidance, 2-7. While the Gowanus CSM contains some discussion and analysis of potential historic and ongoing sources, we recommend further development in the following areas.
(a) Upland Sources
The Draft RI does not adequately characterize current and former industrial, upland propeliies and processes that have historically contributed and may continue to contribute hazardous substances and petroleum contamination to the Gowanus Canal. This data gap must be addressed prior to developing remedial alternatives since existing upland source areas are likely releasing contaminants to groundwater that is subsequently discharged to the Canal. If the loads to the Canal from these sources are not well-characterized (including how they may vary with tides, seasons, and over time during the post-remediation period), they may ultimately undermine the remedy.
The historic development of the Gowanus Canal area was focused on industrial propeliy uses, and as early as 1869, the properties adjacent to the Canal were occupied by lumber yards, coal yards, and stone yards, along with other industrial development (Dripps, 1869). The continued expansion of commercial and industrial activities was noted along the Canal from the late 1800s into the early 1940s. Historical land use in the Canal basin was primarily for heavy industry, including MGPs, coal yards, cement makers, soap makers, tanneries, paint and ink factories, machine shops, chemical plants, oil refineries and storage facilities. Industrial activities have only been subject to governmental environmental regulations for the past few decades. Considering the extensive use of this area by various industries for the past 140 years, there have been relatively few cleanup activities on upland industrial propeliies under governmental regulatory programs.
Upland sites along the Gowanus Canal that are currently the subject of remedial investigation or are otherwise regulated include the three former MGP sites and over 20 other properties regulated under the New York State Brownfield Cleanup Program (BCP), the Voluntary Cleanup Program (VCP), the spill program, the Petroleum Bulk Storage (PBS) program, the Chemical Bulk Storage (CBS) program, and the Major Oil Storage Facility (MOSF) program. We recommend that the Gowanus CSM provide, at the minimum, a summary of the current status of the remedial program at each of these sites, and any existing information about the contamination. See 2005 EPA Sediment Guidance, at 2-7 (recommending that EPA use existing site data in its development of the CSM). At present, the Draft RI only summarizes
16

information about the MOP sites. There are several existing sources of information that can be in this assessment.
For instance, the City provided EPA with an evaluation of prior land use for numerous upland properties in the vicinity of the Oowanus Canal and selected approximately 100 industrial properties for more detailed evaluation (Comments of the City of New York on the United States Environmental Protection Agency's Draft Monitoring Well Installation Plan for the Oowanus Canal, April 2010). The review considered numerous factors to evaluate the likelihood of potential ongoing discharge of contaminants to the Canal, and the likelihood of discharge of specific contaminants deemed central to remedial decision-making for Canal sediments. Following this review, the City recommended further evaluation of 26 high priority industrial propelties for further study. And while these properties do not represent all potential contaminated sites along the Canal, they were each evaluated by a detailed review of historical Sanborn fire insurance maps to identify features of environmental concern, including evidence of generation, storage (such as tanks), processing, transport or disposal of hazardous waste, hazardous substances, petroleum products, and other wastes. Table 2 identifies the properties and suspected waste types based on the historic map research.
The comment document submitted by the City also identified proposed groundwater monitoring well locations to characterize the high priority industrial properties. While the EPA installed monitoring wells on or adjacent to 14 of the properties, no monitoring wells were installed on 12 of the properties identified, (refer to summary in Table 2). The City reiterates its recommendation that EPA or PRPs under consent order with the EPA perform additional characterization at some or all of these properties. We recommend that EPA move quickly to obtain basic business information and to create the appropriate mechanisms for ordering that this work occur so that the groundwater information can be considered in the FS.
In addition, we recommend that EPA use environmental assessments or other technical documents that were produced in response to its various 1 04( e) requests. This data could be used to supplement the data quality objectives and planning documents for the upland groundwater investigation program in the Draft RI. At a minimum, we recommend that this information be evaluated and summarized to improve understanding of the site conditions. The City recommends that EPA incorporate the environmental data it currently possesses regarding the following propelties into its CSM: Block 439, Lot 1; Block 445, Lots 11 and 20; Blocl{ 452, Lots 1 and 15; Block 458, Lot 11; Block 480, Lot 1; Block 482, Lot 1; Blocl{ 489, Lot 1; Block 491, Lot 1; Block 492, Lot 1; Block 493 Lot 1; Block 495, Lot1; Blocl{ 688, All Lots; Block 967, Lot 1; and Block 978, Lots 1, 16, and 19.
We recommend that these and other available data sources be compiled to identify known petroleum and other contaminant plumes affecting the regional groundwater. We recommend that any potential areas of concern be prioritized for action, and a work plan be developed to investigate and quantify the contaminant loads that these sites may be contributing to the Canal.
(b) Discharges from Facilities With SPDES Permits
17

The 2005 EPA Sediment Guidance identifies all "direct pipeline or outfall discharges into a water body from industrial facilities" as potential sources of sediment contamination. See 2005 EPA Sediment Guidance, at 1-2. While EPA performed sampling of the permitted CSO outfalls, the Draft RI does not evaluate publicly-available information about other discharge points or provide a full examination of other permitted outfalls discharging to the Canal.
Through a Freedom of Information Law request, the City obtained SPDES permits for facilities with permitted discharges to the Gowanus Canal and Gowanus Bay. These permits are summarized in Table 3. For facilities with a specified daily maximum flow or where an average flow was noted in the SPDES permit, potential contaminant loads to surface water were calculated based on the permit limits. For example, the Gowanus Gas Turbine Site (SPDES Permit NY 0201006) has four permitted outfalls, each with an average flow of 3,600 GPD. These outfalls discharge to Gowanus Bay, which is tidally connected to the Gowanus Canal. If each of those outfalls was discharging oil and grease at a level close to the permit limit of 15 mg/L, the daily load of oil and grease to Gowanus Bay would be 0.2 kg per outfall per day. Permitted discharges to the Gowanus Canal also include stormwater runoff from fuel oil storage secondary containment areas and hydrostatic tank test water discharges from the Hess Corporation Terminal and the Bayside Fuel Oil Depot. These outfalls also have the potential to contain petroleum contaminants. NYSDEC has also identified a number of illegal discharges to the Gowanus Canal and has initiated regulatory enforcement; however, the details of the enforcement actions are confidential and unavailable to the City.
We recommend that the CSM incorporate information regarding these permitted and illegal outfalls, as they could contribute to recontamination.
(c) Unpermitted Outfalls and Surface Runoff
The 2005 EPA Sediment Guidance identifies "direct pipeline or outfall discharges into a water body from ... stormwater discharges" as a potential source of contaminants in sediment. See 2005 EPA Sediment Guidance, at 1-2. As part of the RI, EPA conducted a survey of the Gowanus Canal and identified 247 outfall features (Phase 1 and Phase 2 combined; not including CSO and municipal stormwater outfalls). However, EPA only performed dry weather sampling of the discharge from 12 of the identified outfall features. As contaminated stormwater fl.-om industrial sites is likely to be discharging from these outfalls, we recommend that EPA also collect and analyze wet weather samples from a representative number of these 247 outfalls to determine if they are delivering significant contaminant loadings to the Gowanus Canal.
The 2005 EPA Sediment Guidance also identifies surface runoff or erosion of soil from floodplains and other contaminated sources on land, such as waste dumps, chemical storage facilities .... or urban areas" as a potential source of sediment contamination. See 2005 EPA Sediment Guidance, at 1-1. There are several scrap yards, bulk storage facilities, and open equipment yards along the Canal which are likely contributing contaminated overland runoff to the Canal during certain wet weather events. If left unexamined, these potential sources could continue to contribute contaminated runoff into the Canal and interfere with the ultimate remedy. Thus, we recommend that EPA attempt to quantify the loadings from contaminated runoff by conducting additional field investigations or, at a minimum, estimating potential contaminate
18

loadings by using existing data resources such as EPA's National Urban Runoff Program Report ("NURP").
E. Miscellaneous Comments
1. Development of a mechanistic model
The 2005 EPA Sediment Guidance strongly recOlmnends the use of mechanistic models, especially at complex sites. See generally 2005 EPA Sediment Guidance, § 2.9. The Sediment Guidance describes complex sites as sites that have "a long history of data collection, have documented contaminant concentrations in sediment and biota, and often have fish advisories already in place." See 2005 EPA Sediment Guidance, at 2-32. The Guidance further states that "[m]odels can help fill gaps in knowledge and allow investigation ofrelationships and processes at a site not fully understood. For this reason, simple or complex modeling can playa role at most sediment sites." Id.
The City recOlmnends that EPA evaluate what role modeling can play in shaping the remedial investigation and remedial alternatives for the Gowanus. See id., at 2-33 (recommending use of modeling tools during both the baseline risk assessment and remedy selection phase). In the Draft RI Report, the EPA has already acknowledged the need to quantify the existing contaminant loads from various sources affecting the different media. This is a critically important task, as it will help define the respective magnitude of these sources and allow for the remedial alternatives to be developed to focus on the most significant sources. Data needs and other considerations for calculating these baseline loads include:
• Having a good characterization of groundwater contamination, soil contamination, and free-product sources in the watershed, along with an understanding of the location and magnitude of tidally-influenced groundwater discharge pathways;
o Calculations of the porewater seepage rates through the native material and sediment beds, utilizing supporting field data;
o An estimation of the permeability of the Canal's bulldlead structures, which will likely vary significantly due to the differences in original bulkhead construction techniques and current structural conditions; and
e A more appropriate and representative characterization of CSO and SWO loads.
It may be appropriate for EPA to employ a mechanistic groundwater model to perform some of the load calculations. Furthermore, we strongly recOlmnend that EPA consider the development of a comprehensive mechanistic fate and transport model, which would include hydrodynamic, sediment transport, carbon cycling, toxics, and food chain models. Such a comprehensive model may improve EPA's ability to make predictions about the effectiveness of remedial alternatives and EPA's confidence in determining the selected remedy. This effort would require significant additional field data to supplement the data contained in the RI.
19

2. Consideration of additional screening values
The 200S EPA Sediment Guidance states that "culTently, that there are no widely accepted screening values for human health risks from either direct contact with sediment or from eating fish or shellfish, although research is ongoing." See 200S EPA Sediment Guidance, at 2-9. To evaluate sediment in the Canal and in the CSOs, EPA selected its 2010 Residential soil RSLs from the EPA Regional Screening Table. While the Residential soil RSLs provide a conservative measurement of risk, we recommend that EPA also evaluate the data using other available screening values to establish an upper and lower bound to consider when developing the preliminary remediation goals. Specifically, we recommend that EPA evaluate the sediment data using the following available EPA and N ew York State soil criteria:
• EP A, "Regional Screening Value for Industrial Soils" (November 2010)
G NYSDEC, Subpart 37S-6 Soil Cleanup Objectives - An assessment using the risk-based level for industrial and commercial soil cleanup objectives would be a useful point of comparison. The same is true for a comparison to soil cleanup objectives established for unrestricted residential soils, which are intended to represent New York State background levels for many contaminants, including PAHs. For instance, Table 4 compares the ranges of P AHs detected in the CSO sediment samples to the Subpart 37S-6 soil cleanup objectives for residential, commercial, and industrial scenarios.
In addition, the Draft RI's screening value approach for ecological risk from CSO discharges appears inconsistent with the ARAR framework. For given chemicals, the report used the lesser of federal water quality criteria or NOAA screening values for chronic impacts to marine life. However, the New York State water quality regulations (6 NYCRR Part 703) contain numeric water quality standards (WQSs) protective of aquatic life in waters classified as SD such as the Gowanus Canal. For SD waters, Part 703 provides acute values for certain metals identified as contaminants of concern in CSO discharges, including arsenic, chromium, copper, and lead. It is unclear why the Draft RI did not make reference to these standards as part of the screening process for ecological risk. Presumably, EPA will use these values when identifying ARARs during the FS and remedy selection phase.
3. Observations concerning the three City-owned properties
Based on analytical results of the soil and groundwater samples collected from the three City-owned properties around the Gowanus Canal, it is the City's opinion that the detected subsurface impacts at these properties are due to off-site sources and that soils at the properties themselves are not expected to be significant sources of contamination to the Canal. Soil samples collected from the NYCDEP Gowanus Pumping Station did not show any exceedences of the NYSDEC Part 37S Remedial Program Soil Cleanup Objectives (SCOs) for Industrial Use (6 NYCRR §37S-6.8b). Several VOCs and lead at concentrations slightly above the NYSDEC Technical and Operational Guidance Series (TOGS) Series 1.1.1 Class GA Groundwater Standards and Guidance Values were detected in the groundwater samples. Due to the absence
20
of soil impacts at this property, the observed impacts to the shallow and deep groundwater at the property are likely caused by off-site sources.
Several P AHs were present at concentrations slightly above the applicable regulatory criteria in soil samples collected from Soil Borings SB09 and SB 1 0 at Block 477, Lot 1. Two P AHs and tlu'ee metals exceeded the applicable groundwater standards and guidance values moderately and slightly, respectively, in groundwater samples collected from Well MW09S. Well MWI0S yielded no VOC or SVOC concentrations above the NYSDEC TOGS criteria. However, the deeper wells MW091 and MWlOI exhibited moderate VOC, P AH, and metal exceedences. Because of the lack of VOCs and the slight SVOC and metal impacts to the soil and shallow groundwater at this property, the source of deep groundwater impacts at the Block 477, Lot 1 is anticipated to be off-site.
Soil analytical results for the NYCDOT Hamilton Avenue Asphalt Plant did not show any VOC exceedences. Several P AHs at concentrations slightly exceeding the applicable SCOs were detected in shallow soil samples collected from Soil Borings SB 17 and SB 18. The highest P AH concentrations were detected at approximately 35 to 45 feet below grade at Soil Boring SB 18, and coincided with visual evidence of free-phase product, which has the appearance of coal tar waste. Groundwater analytical results indicated VOCs, SVOCs, and metals at concentrations slightly to moderately exceeding applicable regulatory criteria. VOC and SVOC exceedences detected in groundwater samples collected from deeper wells adjacent to the Canal were higher than those in shallow wells. A lack of VOC exceedences in soil samples, the higher PAH exceedences in deep than shallow soil samples, and the observation of freephase product in deep soil samples suggest that the observed subsurface impacts on this propelty are potentially due to off-site sources.
4. Preliminary comments on GEl Consultant's CSOIGowanus Canal Sampling and Screening-Level Risk Assessment Report (April 2011) ("GEl Report")
In the summer of 2010, National Grid directed its consultant GEl to collect samples from CSO regulators, surface water adjacent to CSO outfalls, and CSO sediment mounds. GEl tested each sample for pathogens, endocrine disruptor compounds (EDCs) and other pharmaceutical and personal care products (PPCPs). GEl then performed a screening level ecological and human health risk assessment using the sampling results.
The City is still reviewing the data and the risk assessments, and will provide full comments at a later date. However, upon our initial review, we would like to make the following observations:
• Number and Level of Detections: The GEl Report sampled for eight pathogens, 37 EDCs and PPCPs, free cyanide and ammonia. Of the 37 EDCs/PPCPs tested, the many were not detected in any sample. When detected, the EDC/PPCPs were generally found at very low concentrations, on the order of one part per billion (Ppb) or less in aqueous samples (including the CSO water) and concentrations of one pmt per
21
million or less (ppm) in sediment samples.5 In addition, free cyanide was not detected in any sample. The Report concluded that many of the EDCIPPCPs that were detected posed no ecological or human health risk, even when using the highly conservative exposure scenarios assumed by GEL The very low levels of these substances simply pale in comparison to the high levels of P AHs found throughout the Canal sediments, as thoroughly documented in the Draft RI, and which are attributable to uncontrolled coal tar NAPL emanating from the fonner MGPs.
o PPCPs in the Environment: The EDCIPPCPs that the GEl Report claims are potential contaminants of concern for exceeding the risk thresholds are common in the environment and are not considered hazardous substances under Superfund. The GEl Report claims that there are nine EDCIPPCPs as potential contaminants of concem in the Gowanus Canal: nonylphenol (NP); nonylphonol diethoxylate; nonylphenol monoethoxylate; four estrogens (estradiol, alpha-estradiol, estriol, estrone( 4)); fluoxetine (i.e., Prozac); and methadone. These analytes are not unique to the Gowanus Canal, and the Report does not present any assessment of background concentrations of these substances in other water bodies. For example, a study was conducted of 30 river reaches in the continental U.S. in 1989 and 1990 to determine the frequency and concentrations of nonylphenol and its ethoxylates in water and sediments. Approximately 71 percent of the sampling sites had measurable concentrations of NP in the sediments at concentrations ranging from about 10 to 2,960 )lg/kg.6 Because the GEl Report makes no attempt to compare the levels of detection in the Canal with the background concentrations for these contaminants in other water bodies, the Report lacks the basic scientific rigor of a standard environmental investigation.
o Use of Questionable Methodologies: Certain methodologies employed by the Report may overstate the risk from the limited number of EDCIPPCPs found to exceed HHRA and ERA thresholds:
5 GEl RepOli, 13 - 14.
o As the Report notes, there are no United States Environmental Protection Agency (EP A)-approved risk thresholds for screening values (SVs) for the EDCIPPCPs analyzed other than for nonylphenol (NP) for which EPA has established ambient water quality criteria. However, the criteria for NP that are used in the SLERA are not entirely appropriate for screening against criteria
6 US EPA, Aquatic Life Ambient Water Quality Criteria B Nonylphenol, EPA-822-R-05-005 at 10 (Dec. 2005), available at http://water.epa.gov/scitechlswguidance/standards/upload/2006 _ 05 _18 _criteria _ nonylphenol_fin al-doc.pdf.
22

for chronic and acute exposure. The actual acute criterion for NP is based on a one hour average, not to exceed 7 ~lg/L every three years. The chronic criterion is a four-day average not to exceed 1. 7 ~g/L every three years. It is not appropriate to compare maximum concentrations to a chronic criterion as this increases the conservatism unnecessarily, and arguably, there are insufficient samples to provide a realistic estimate of the one hour or four day average concentrations. It is also highly conservative to screen "ambient" water quality criteria against concentrations that are reflective of non-ambient conditions (i. e. inside a CSO).
o There should be more discussion in the narrative and/or in the unceliainty analysis of the Quality Assurance/Quality Control (QA/QC) procedures employed and the overall quality of the data in terms of method reporting levels, laboratory and field QC samples, recoveries, and other QA issues. This information is critical due to the low levels of the detections and the use of highly sensitive analytical methodologies.
In addition, for the HHRA:
o It is unclear as to why a Hazard Index (HI) of '0.1' was used instead of the usual value of '1.' Generally, a HI of less than' 1 ' indicates that an exposure is not likely to result in adverse health effects over a lifetime. Many of the "elevated" HIs in the repOli were less than 1.
o The HHRA should be more explicit in outlining the conservatism and uncertainty built into the ADIs used in Table 22 and patiicularly for some of the naturally occurring steroid hormones such as estrogen, estriol, estrone and testosterone. EP A has not yet developed drinking water standards or issued public health advisories on these constituents, which is complicated by the fact that they are produced and metabolized in the human body as well as present in some foods. For the hormones, the ADIs listed in Table 22 cite the Australian Guidelines for Recycled Water Quality. These guidelines were developed to ensure safety for people who might be exposed continuously to these compounds in recycled or reclaimed drinking water, and already contain a safety factor of 10,000. They were not derived for episodic exposures such as those presented in the HHRA. To add to this the conservatism, the HHRA screens against maximum concentrations and uses an HI of 0.1. Given the limited data and number of detections for ambient concentrations, this approach is overly conservative even for screening level purposes.
23
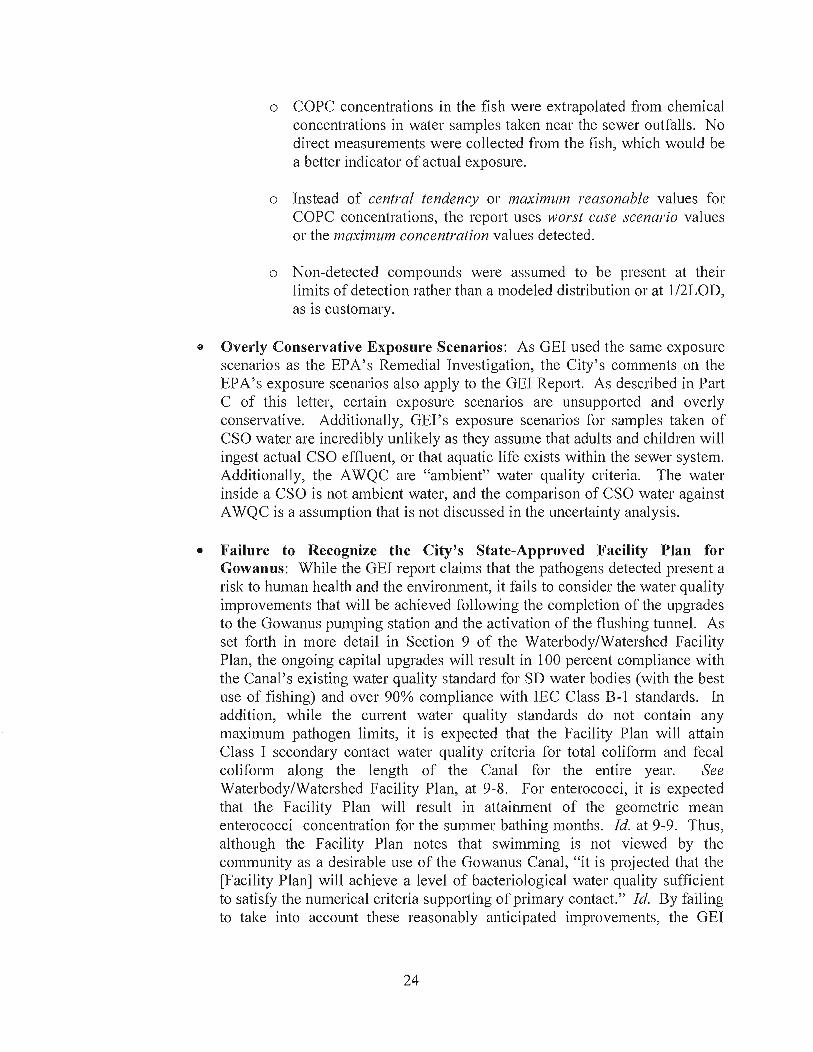
o COPC concentrations in the fish were extrapolated from chemical concentrations in water samples taken near the sewer outfalls. No direct measurements were collected from the fish, which would be a better indicator of actual exposure.
o Instead of central tendency or maximum reasonable values for COPC concentrations, the report uses worst case scenario values or the maximum concentration values detected.
o Non-detected compounds were assumed to be present at their limits of detection rather than a modeled distribution or at 1/2LOD, as is customary.
o Overly Conservative Exposure Scenarios: As GEl used the same exposure scenarios as the EPA's Remedial Investigation, the City's comments on the EPA's exposure scenarios also apply to the GEl RepOli. As described in Part C of tIns letter, celiain exposure scenarios are unsupported and overly conservative. Additionally, GEl's exposure scenarios for samples taken of CSO water are incredibly unlikely as they assume that adults and children will ingest actual CSO effluent, or that aquatic life exists within the sewer system. Additionally, the A WQC are "ambient" water quality criteria. The water inside a CSO is not ambient water, and the comparison of CSO water against A WQC is a assumption that is not discussed in the uncertainty analysis.
• Failure to Recognize the City's State-Approved Facility Plan for Gowanus: WillIe the GEl repOli claims that the pathogens detected present a risk to human health and the enviromnent, it fails to consider the water quality improvements that will be achieved following the completion of the upgrades to the Gowanus pumping station and the activation of the flushing tumlel. As set forth in more detail in Section 9 of the Waterbody/Watershed Facility Plan, the ongoing capital upgrades will result in 100 percent compliance with the Canal's existing water quality standard for SD water bodies (with the best use of fishing) and over 90% compliance with lEC Class B-1 standards. In addition, while the CUlTent water quality standards do not contain any maximum pathogen limits, it is expected that the Facility Plan will attain Class I secondary contact water quality criteria for total coliform and fecal coliform along the length of the Canal for the entire year. See Waterbody/Watershed Facility Plan, at 9-8. For enterococci, it is expected that the Facility Plan will result in attainment of the geometric mean enterococci concentration for the summer bathing months. Id. at 9-9. Thus, although the Facility Plan notes that swimming is not viewed by the community as a desirable use of the Gowanus Canal, "it is projected that the [Facility Plan] will achieve a level of bacteriological water quality sufficient to satisfY the numerical criteria suppOliing of primary contact." Id. By failing to take into account these reasonably anticipated improvements, the GEl
24

Report's assertions with respect to pathogens are marginal at best in terms of understanding the future conditions of the Canal.
F. Technical Issues To Consider In The Feasibility Study
The City recommends that EPA consider the following the following technical issues in the developing the FS:
o The structural stability and integrity of bulkheads along the Canal is of critical concern. The FS will likely consider an option to dredge the inventory of contaminated sediments in the Canal. For this alternative, dredging depths will cause a reduction in bulldlead embedment depth and structural stability. Therefore, structural reinforcement will be required in some locations. While the FS may conservatively assume that structural reinforcement is necessary in all cases, this will likely result in overestimated alternative costs if there are competent bullrneads adjacent to shallow dredging areas. In order for the FS cost estimates to meet the criteria established in EPA Guidance, we recommend that a thorough evaluation and inspection of the bullrneads be performed to determine the appropriate FS assumptions, conceptual designs, and cost estimates. We also recommend that any assessment of the bullrneads be performed in consultation with the Army Corps of Engineers.
o At present, the organic-rich, fine-grained, soft surface sediments in the Canal most likely serve to buffer and attenuate the groundwater contaminant loads through sorption and also because these sediments have lower permeability than the native material. A deep dredging alternative needs to consider the potential negative short-term and long-term consequence of removing some or all of the soft sediment, as it may increase porewater fluxes and the discharge of dissolved phase contaminants to the Canal, thus acting to increase exposures from these existing sources or result in recontamination.
• Portions of the Canal, especially lower p011ions near Gowanus Bay, are used for commercial navigation. The alternatives developed for the FS need to consider the boundary of the navigation chmmel and the future use of the Canal for navigation. For capping scenarios, we recommend that the conceptual design consider future channel maintenance requirements, in terms of cap elevation/clearance as well as cap stability due to vessel traffic. Furthermore, we recommend that EPA consider the reasonably anticipated future navigational use of the Canal and proceed with federal de-authorization if applicable.
o The EPA has stated in public meetings that it plans to consider the use of cut-off walls to control the discharge of groundwater-related contaminants to the Canal. Due to the CSM considerations discussed above, it is imperative that design eff011s consider the appropriate depths of such cut-
25
off walls, as they should be configured so that contaminants cannot go under or around them and still contribute to the loads to the Canal. Also, installation of these hydraulic obstructions will alter groundwater flow patterns and could have a negative consequence of creating new or exacerbating existing flooding situations for sub-grade structures in their vicinity. To start, we recommend that the FS evaluate potential shortterm and long-term impacts associated with the planned cut-off wall installation at Public Place, including an assessment of how hydraulic control will be implemented to prevent lateral migration of contamination and measures to control 'mounding' of the groundwater table.
26

Conclusion
The City welcomes the opportunity to discuss these comments with EPA. Overall, through innovation and adaptive management, we believe the substantial challenges faced on the Gowanus Canal can be overcome, leading to improvements of the waterway and increased protection of human health and the environment.
27
Sincerely yours,
~~~~-6: Angela Licata Deputy Commissioner New York City Department of Environmental Protection
GLOSSARY
ARAR ATSDR
Be-7 BCP BTEX
CBS CERCLA Cs-137 CSM CSO
DNAPL
EPA ERA ER-M
FS
GEl GPD
HHRA HMW
LB LMW
MGD MGP MOSF MTBE
NAPL NOAA NURP NYCDEP NYCDOT NYCRR NYSDEC
Applicable, Relevant or Appropriate Regulation Agency for Toxic Substances and Disease Registry
Beryllium-7 Brownfield Cleanup Program Benzene, Toluene, Ethylbenzene and Xylenes
Chemical Bulk Storage Comprehensive Environmental Response, Compensation, and Liability Act Cesium-137 Conceptual Site Model Combined Sewer Overflow
Dense Non-Aqueous Phase Liquid
U.S. Environmental Protection Agency Ecological Risk Assessment Effects Range - Median
Feasibility Study
Consultant for National Grid Gallons Per Day
Human Health Risk Assessment High Molecular Weight
Louis Berger and Associates, P.C. Low Molecular Weight
Million Gallons per Day Manufactured Gas Plant Major Oil Storage Facility Methyl Tertiary Butyl Ether
Non-Aqueous Phase Liquid National Oceanic and Atmospheric Administration National Urban Runoff Program New York City Department of Environmental Protection New York City Department of Transportation New York Code of Rules and Regulations New York State Depmiment of Environmental Conservation
28

OSWER
PAH PBS PCA PCB PRG
RI
sca SPDES SVOC SWO
TOC TOGS
USACE USGS
VOC VCP
WQS
Office of Solid Waste and Emergency Response
Polyaromatic Hydrocarbon Petroleum Bulk Storage Principal Component Analysis Polychlorinated Biphenyl Preliminary Remediation Goal
Remedial Investigation
Soil Cleanup Objective State Pollutant Discharge Elimination System Semi-Volatile Organic Compound Storm Water Outfall
Total Organic Carbon Technical and Operational Guidance Series
U.S. Aln1Y Corps of Engineers U.S. Geological Survey
Volatile Organic Compound Voluntary Cleanup Program
Water Quality Standard
29

Tables and Figures
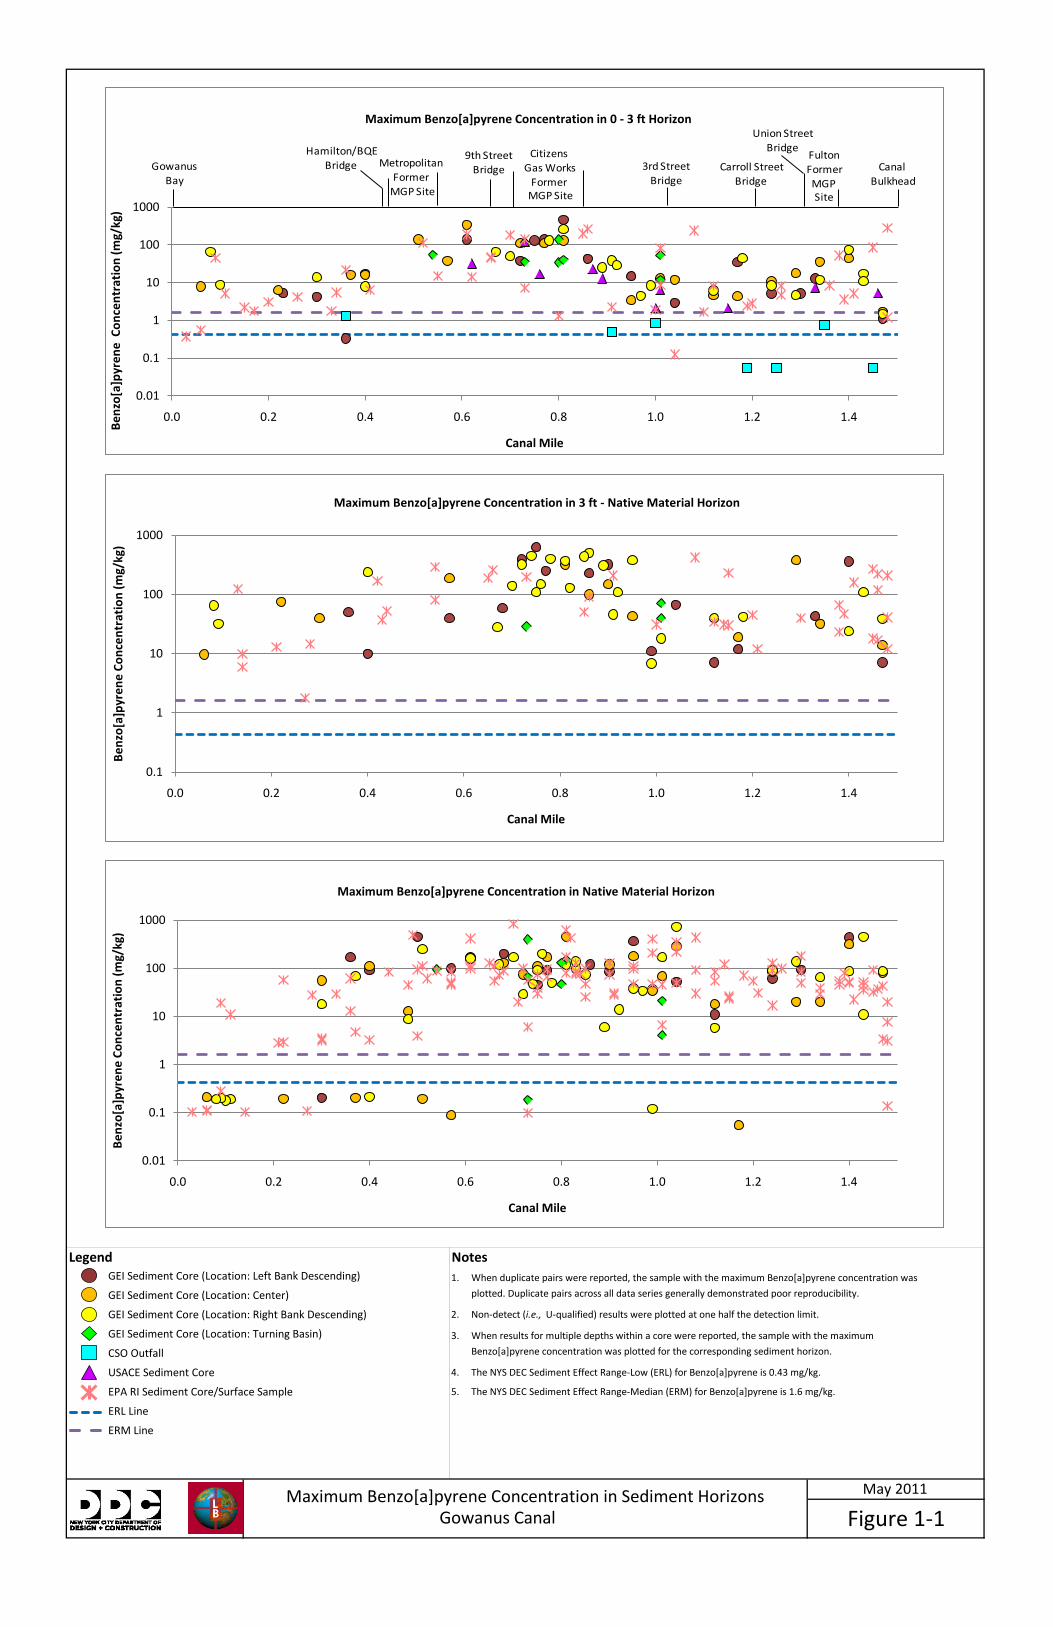
Legend Notes1. When duplicate pairs were reported, the sample with the maximum Benzo[a]pyrene concentration was
plotted. Duplicate pairs across all data series generally demonstrated poor reproducibility.
2. Non-detect (i.e., U-qualified) results were plotted at one half the detection limit.
3. When results for multiple depths within a core were reported, the sample with the maximum
GEI Sediment Core (Location: Left Bank Descending)
GEI Sediment Core (Location: Center)
GEI Sediment Core (Location: Right Bank Descending)
GEI Sediment Core (Location: Turning Basin)
Maximum Benzo[a]pyrene Concentration in Sediment Horizons Gowanus Canal
May 2011
Figure 1-1
Benzo[a]pyrene concentration was plotted for the corresponding sediment horizon.
4. The NYS DEC Sediment Effect Range-Low (ERL) for Benzo[a]pyrene is 0.43 mg/kg.
5. The NYS DEC Sediment Effect Range-Median (ERM) for Benzo[a]pyrene is 1.6 mg/kg.
CSO Outfall
USACE Sediment Core
EPA RI Sediment Core/Surface Sample
ERL Line
ERM Line
0.01
0.1
1
10
100
1000
0.0 0.2 0.4 0.6 0.8 1.0 1.2 1.4
Benz
o[a]
pyre
ne C
once
ntra
tion
(mg/
kg)
Canal Mile
Maximum Benzo[a]pyrene Concentration in 0 - 3 ft Horizon
0.1
1
10
100
1000
0.0 0.2 0.4 0.6 0.8 1.0 1.2 1.4
Benz
o[a]
pyre
ne C
once
ntra
tion
(mg/
kg)
Canal Mile
Maximum Benzo[a]pyrene Concentration in 3 ft - Native Material Horizon
0.01
0.1
1
10
100
1000
0.0 0.2 0.4 0.6 0.8 1.0 1.2 1.4
Benz
o[a]
pyre
ne C
once
ntra
tion
(mg/
kg)
Canal Mile
Maximum Benzo[a]pyrene Concentration in Native Material Horizon
MetropolitanFormer
MGP Site
Gowanus Bay
CanalBulkhead
CitizensGas Works
Former MGP Site
FultonFormerMGP Site
Carroll StreetBridge
Union StreetBridge
3rd StreetBridge
9th StreetBridge
Hamilton/BQEBridge

Legend NotesGEI Sediment Core (Location: Left Bank Descending)
GEI Sediment Core (Location: Center)
GEI Sediment Core (Location: Right Bank Descending)
GEI Sediment Core (Location: Turning Basin)
CSO Outfall
May 2011
Figure 1-2
1. When duplicate pairs were reported, the sample with the maximum LMW PAH concentration was
plotted. Duplicate pairs across all data series generally demonstrated poor reproducibility.
2. Non-detect (i.e., U-qualified) results were plotted at one half the detection limit.
3. When results for multiple depths within a core were reported, the sample with the maximum LMW PAH
concentration was plotted for the corresponding sediment horizon.
4. The NYS DEC Sediment Effect Range-Low (ERL) for LMW PAH is 0.552 mg/kg.
5. The NYS DEC Sediment Effect Range-Median (ERM) for LMW PAH is 3.16 mg/kg.
USACE Sediment Core
EPA RI Sediment Core/Surface Sample
ERL Line
ERM Line
Maximum Low Molecular Weight PAH Concentration in Sediment Horizons Gowanus Canal
0.1
1
10
100
1000
10000
100000
0.0 0.2 0.4 0.6 0.8 1.0 1.2 1.4
LMW
Con
cent
rati
on (m
g/kg
)
Canal Mile
Maximum LMW PAH Concentration in 3 ft - Native Material Horizon
0.1
1
10
100
1000
10000
100000
0.0 0.2 0.4 0.6 0.8 1.0 1.2 1.4
LMW
Con
cent
rati
on (m
g/kg
)
Canal Mile
Maximum LMW PAH Concentration in Native Material Horizon
0.01
0.1
1
10
100
1000
10000
100000
0.0 0.2 0.4 0.6 0.8 1.0 1.2 1.4
LMW
Con
cent
rati
on (m
g/kg
)
Canal Mile
Maximum LMW PAH Concentration in 0 - 3 ft Horizon
MetropolitanFormer
MGP Site
Gowanus Bay
CanalBulkhead
CitizensGas Works
Former MGP Site
FultonFormerMGP Site
Carroll StreetBridge
Union StreetBridge
3rd StreetBridge
9th StreetBridge
Hamilton/BQEBridge
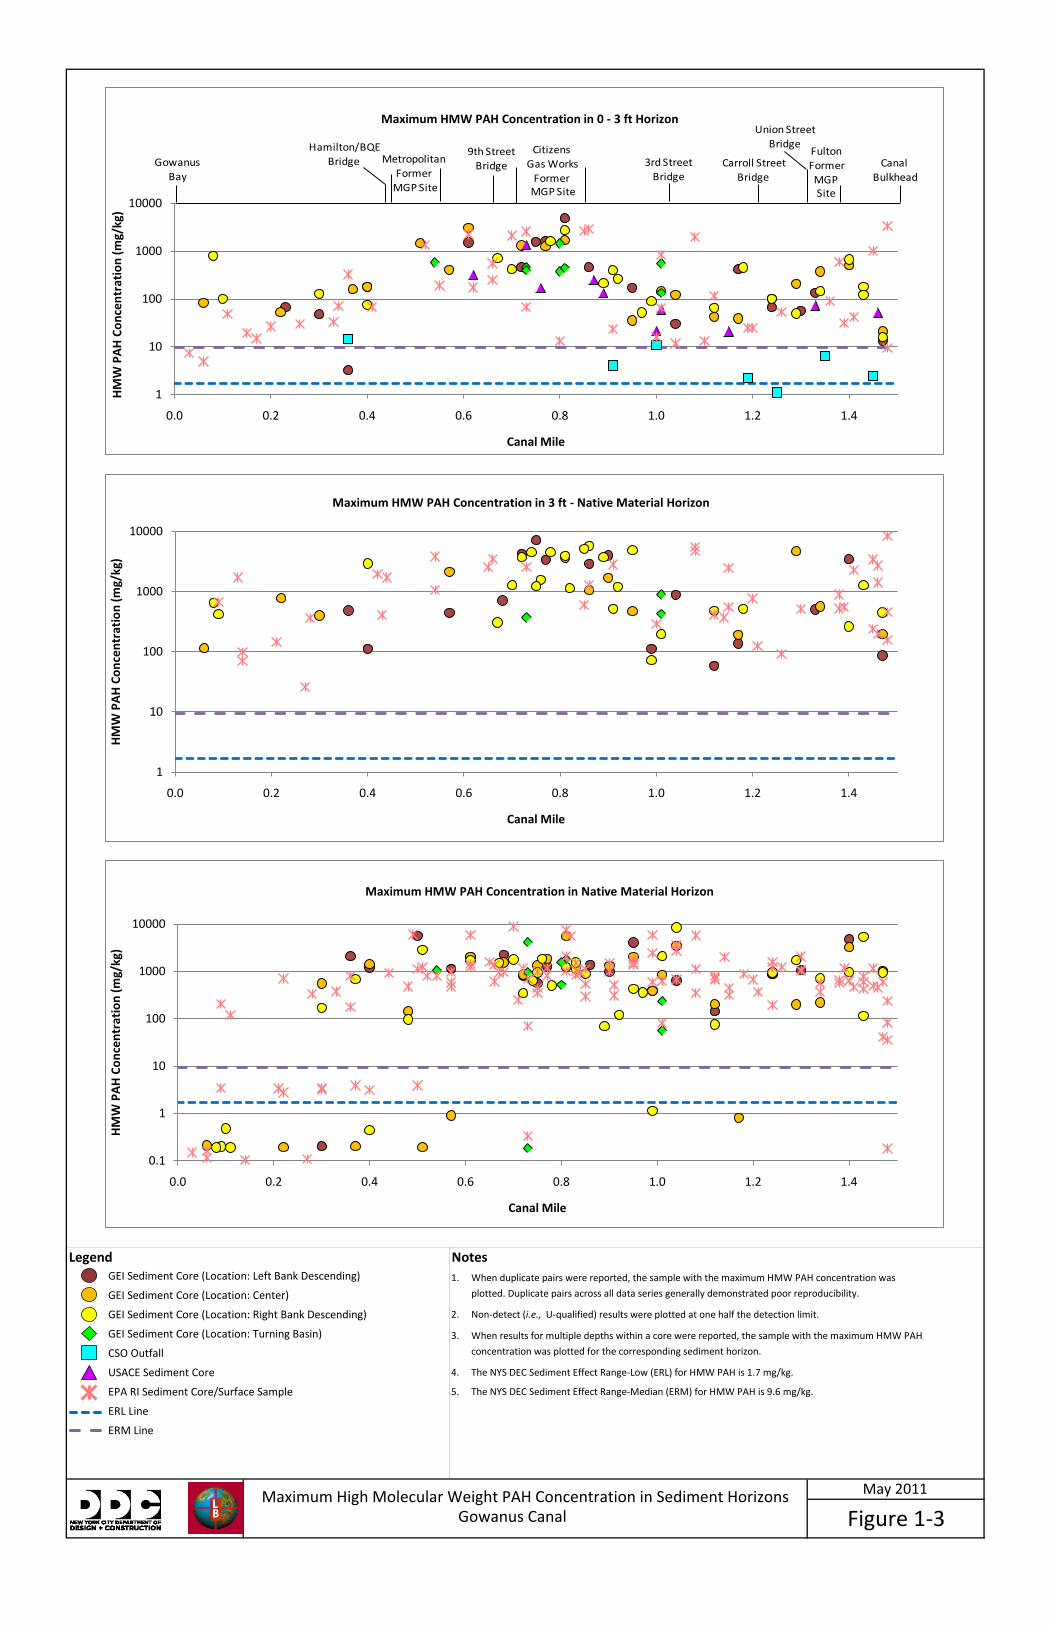
Legend NotesGEI Sediment Core (Location: Left Bank Descending)
GEI Sediment Core (Location: Center)
GEI Sediment Core (Location: Right Bank Descending)
GEI Sediment Core (Location: Turning Basin)
CSO Outfall
May 2011
Figure 1-3
1. When duplicate pairs were reported, the sample with the maximum HMW PAH concentration was
plotted. Duplicate pairs across all data series generally demonstrated poor reproducibility.
2. Non-detect (i.e., U-qualified) results were plotted at one half the detection limit.
3. When results for multiple depths within a core were reported, the sample with the maximum HMW PAH
concentration was plotted for the corresponding sediment horizon.
4. The NYS DEC Sediment Effect Range-Low (ERL) for HMW PAH is 1.7 mg/kg.
5. The NYS DEC Sediment Effect Range-Median (ERM) for HMW PAH is 9.6 mg/kg.
USACE Sediment Core
EPA RI Sediment Core/Surface Sample
ERL Line
ERM Line
Maximum High Molecular Weight PAH Concentration in Sediment Horizons Gowanus Canal
1
10
100
1000
10000
0.0 0.2 0.4 0.6 0.8 1.0 1.2 1.4
HM
W P
AH
Con
cent
rati
on (m
g/kg
)
Canal Mile
Maximum HMW PAH Concentration in 0 - 3 ft Horizon
0.1
1
10
100
1000
10000
0.0 0.2 0.4 0.6 0.8 1.0 1.2 1.4
HM
W P
AH
Con
cent
rati
on (m
g/kg
)
Canal Mile
Maximum HMW PAH Concentration in Native Material Horizon
1
10
100
1000
10000
0.0 0.2 0.4 0.6 0.8 1.0 1.2 1.4
HM
W P
AH
Con
cent
rati
on (m
g/kg
)
Canal Mile
Maximum HMW PAH Concentration in 3 ft - Native Material Horizon
MetropolitanFormer
MGP Site
Gowanus Bay
CanalBulkhead
CitizensGas Works
Former MGP Site
FultonFormerMGP Site
Carroll StreetBridge
Union StreetBridge
3rd StreetBridge
9th StreetBridge
Hamilton/BQEBridge

Legend NotesGEI Sediment Core (Location: Left Bank Descending)
GEI Sediment Core (Location: Center)
GEI Sediment Core (Location: Right Bank Descending)
GEI Sediment Core (Location: Turning Basin)
CSO Outfall
May 2011
Figure 1-4
1. When duplicate pairs were reported, the sample with the maximum Chromium concentration was plotted.
Duplicate pairs across all data series generally demonstrated poor reproducibility.
2. Non-detect (i.e., U-qualified) results were plotted at one half the detection limit.
3. When results for multiple depths within a core were reported, the sample with the maximum Chromium
concentration was plotted for the corresponding sediment horizon.
4. The NYS DEC Sediment Effect Range-Low (ERL) for Chromium is 81.0 mg/kg.
5. The NYS DEC Sediment Effect Range-Median (ERM) for Chromium is 370.0 mg/kg.
USACE Sediment Core
EPA RI Sediment Core/Surface Sample
ERL Line
ERM Line
Maximum Chromium Concentration in Sediment Horizons Gowanus Canal
0100200300400500600700800900
1000
0.0 0.2 0.4 0.6 0.8 1.0 1.2 1.4
Chro
miu
m C
once
ntra
tion
(mg/
kg)
Canal Mile
Maximum Chromium Concentration in 0 - 3 ft Horizon
0
100
200
300
400
500
600
700
800
900
0.0 0.2 0.4 0.6 0.8 1.0 1.2 1.4
Chro
miu
m C
once
ntra
tion
(mg/
kg)
Canal Mile
Maximum Chromium Concentration in 3 ft - Native Material Horizon
0
50
100
150
200
250
300
350
400
450
0.0 0.2 0.4 0.6 0.8 1.0 1.2 1.4
Chro
miu
m C
once
ntra
tion
(mg/
kg)
Canal Mile
Maximum Chromium Concentration in Native Material Horizon
MetropolitanFormer
MGP Site
Gowanus Bay
CanalBulkhead
CitizensGas Works
Former MGP Site
FultonFormerMGP Site
Carroll StreetBridge
Union StreetBridge
3rd StreetBridge
9th StreetBridge
Hamilton/BQEBridge

Legend Notes1. Due to poor reproducibility in field duplicates, PAH values were plotted for samples with the maximum BaP concentration.
2. Ratio calculations were only performed on samples with detections for all PAH constituents.
PAH Double Ratios, All Horizons
Gowanus Canal Superfund Site
MAY 26 , 2011
Figure 2
0
1
2
3
4
5
6
0 0.2 0.4 0.6 0.8 1 1.2 1.4 1.6 1.8 2
Ch
ryse
ne
/Be
nzo
[a]P
yre
ne
Fluoranthene/Pyrene
Creosote
Urban Background
Coal Tar

‐8
‐6
‐4
‐2
0
2
4
6
8Principa
l Com
pone
nt 2
Legend Notes 1. Due to poor reproduceability in field duplicates, PAH values were included for samples with the maximum BaP concentration.2. Non‐detect samples were included as zero values. 3. Environmental sediment results were taken from the GEI and EPA RI Reports. 4. Site CSO sediment results were taken from the EPA RI Report.5. Asphalt, Seep, NAPL, and Outfall results were taken from the GEI RI Report.
Fingerprint Evaluation, all HorizonsGowanus Canal Superfund Site
MAY 26, 2011
Figure 3
‐8
‐6
‐4
‐2
0
2
4
6
8
‐7 ‐5 ‐3 ‐1 1 3 5 7 9 11 13
Principa
l Com
pone
nt 2
Principal Component 1

!( !(!(!(
!(!(!(!(!(!(
!(
!(!(!(
!(
!(!(!(
!(!(
!(
!(
!(
!(
!(
!(
!(
!(
!(!(
!(!(
!(
#*
#* #*
#*
")
_̂
_̂
_̂
_̂
_̂
_̂_̂
_̂
_̂
_̂
_̂
_̂
_̂
_̂
_̂
_̂
_̂
_̂
_̂
_̂
_̂
_̂
_̂
Former Citizens Gas Works MGP Site
Metropolitan Former MGP Site
0.1
0.2
0.7
0.3
0.5
0.4
0.6
0.8
³
March 2011
!(
!(!(
!( !(!(
!(!(
!(!(
!(!(
!(
!(
!(!(
!(!(
!(
!(
!(
!(
!(
!(
!(
_̂
_̂
_̂
_̂
_̂_̂
_̂
_̂ _̂
_̂_̂
_̂
_̂
_̂_̂
Former Citizens Gas Works MGP Site
Metropolitan Former MGP Site
0.1
0.2
0.7
0.3
0.5
0.4
0.6
0.8
!(!(
!(
!(!(
!(!(
!(!(
!(!(!(
!(!(!(
!(!(!(
!(!(!(!(!(!(!(!(!(!(!(
!(!(!(!(!(!(
!(
!(
!(
!(
!(!(
!(
!(
!(
!(
!(!(
!(!(
!(
!(
_̂_̂
_̂
_̂
_̂
_̂_̂
_̂
_̂
_̂̂__̂
_̂
_̂
_̂
_̂
_̂
_̂
_̂
_̂_̂
_̂̂__̂
_̂_̂_̂
_̂_̂
_̂_̂_̂_̂_̂_̂_̂
_̂_̂_̂_̂_̂_̂_̂_̂
_̂
_̂_̂
_̂_̂_̂
_̂
_̂
_̂
_̂
_̂
_̂_̂
_̂
_̂
_̂
Former Citizens Gas Works MGP Site
Metropolitan Former MGP Site
0.1
0.2
0.7
0.3
0.5
0.4
0.6
0.8
³³
0 - 3 ft Sediment
3ft - Native Material
Native Material
Benzo[a]Pyrene (mg/kg)
!( < 0.10
!( 0.11 - 1.00
!( 1.01 - 10.00
!( 10.01 - 100.00
!( > 100.0
!( GEI Sediment Core
#* USACE Sediment Core
_̂ USEPA Sediment Core
") CSO Outfall
Gowanus Study Area (From EPA Website)
Canal Mile Centerline
Former MGP Sites
³³
³1. When duplicate values were reported, sample with the maximum result was plotted.2. Non-detect ("U" qualified) results were plottted at half of the reporting limit.3. Maximum concentrations were plotted for cores with multiple,non-contiguous samples in each stratum.
Maximum Benzo[a]Pyrene Concentration in Sediment HorizonsDraft – For Discussion Purposes Only
Figure 1-1a
0 250 500125Feet
1. The NYS DEC Sediment Effects Range-Low (ERL) for B(a)P is 0.43 mg/kg.2. The NYS DEC Sediment Effects Range-Median (ERM) for B(a)P is 1.6 mg/kg.
Figure 4-1a
April 2011May 2011

!(!(!(!(!(!(!(
!(
!(
!(!(!(!(!(
!(!(!(
!(!(!(
!(!(
!(!(
!(
!(!(
!(
!(
!(!(!(
!(!(!(!(!(!(
!(
!(!(
!(
!(
!(
!(
!(!(
!(!(
!(
!(
!(
#*
#* #*
#*
#*
#*
#*
#*
#*
#*
")
")
")
")
")
")
_̂
_̂
_̂
_̂
_̂
_̂
_̂
_̂
_̂
_̂
_̂
_̂
_̂
_̂
_̂
_̂_̂
_̂_̂
_̂
_̂_̂
_̂
_̂
_̂
_̂
_̂
_̂
_̂
Former Citizens Gas Works MGP Site
Fulton Former MGP Site
1
1.3
1.2
1.1
1.4
0.9
0.7
0.6
0.8
³
January 2011
!(!(!(!(
!(!(
!(
!(!(
!(
!(!(
!(
!(!(!(
!(!(
!(
!(
!(
!(!(
!(!(!(
!(!(!(
!(!(
!(!(
!(!(
!(!(
!(
!(
!(!(
!(
!(
!(
!(
!(
_̂_̂_̂_̂
_̂_̂
_̂
_̂
_̂
_̂
_̂
_̂
_̂
_̂
_̂_̂_̂
_̂_̂
_̂_̂
_̂
_̂_̂̂_
_̂
_̂
_̂
Former Citizens Gas Works MGP Site
Fulton Former MGP Site
1
1.3
1.2
1.1
1.4
0.9
0.70.8
!(!(!(
!(!(!(!(
!(
!(!(
!(
!(
!(!(!(
!(!(!(
!(
!(!(!(
!(!(!(
!(!(!(
!(!(!(
!(!(
!(
!(!(
!(!(
!(!(!(
!(!(!(
!(!(!(
!(!(!(!(!(!(
!(
!(
!(
!(
!(!(
!(!(
!(
!(
!(
!(
!(
!(
_̂_̂_̂_̂_̂
_̂_̂
_̂
_̂
_̂
_̂
_̂
_̂
_̂
_̂_̂
_̂
_̂
_̂
_̂
_̂_̂̂_
_̂̂__̂
_̂
_̂_̂̂_
_̂
_̂
_̂̂_
_̂̂__̂̂__̂_̂
_̂̂_
_̂̂_
_̂ _̂̂_
_̂
_̂_̂
_̂̂_̂_
_̂_̂_̂
_̂_̂_̂_̂_̂̂_
_̂̂__̂
_̂_̂̂_
_̂_̂
_̂_̂_̂_̂_̂_̂_̂
_̂_̂
_̂
_̂_̂
_̂
_̂
_̂
Former Citizens Gas Works MGP Site
Fulton Former MGP Site
1
1.3
1.2
1.1
1.4
0.9
0.70.8
³³
Maximum Benzo[a]Pyrene Concentration in Sediment Horizons
0 - 3 ft Sediment
3ft - Native Material
Native Material
!( GEI Sediment Core
#* USACE Sediment Core
_̂ USEPA Sediment Core
") CSO Outfall
Benzo[a]Pyrene (mg/kg)!( < 0.10
!( 0.11 - 1.00
!( 1.01 - 10.00
!( 10.01 - 100.00
!( > 100.0
Gowanus Study Area (From EPA Website)
Canal Mile Centerline
Former MGP Sites
³³
³
Figure 1-1b
Draft – For Discussion Purposes Only
0 250 500125Feet
1. The NYS DEC Sediment Effects Range-Low (ERL) for B(a)P is 0.43 mg/kg.2. The NYS DEC Sediment Effects Range-Median (ERM) for B(a)P is 1.6 mg/kg.
1. When duplicate values were reported, sample with the maximum result was plotted.2. Non-detect ("U" qualified) results were plottted at half of the reporting limit.3. Maximum concentrations were plotted for cores with multiple,non-contiguous samples in each stratum.
Figure 4-1b
April 2011May 2011

!( !(!(!(
!(!(!(!(!(!(
!(
!(!(!(
!(
!(!(!(
!(!(
!(
!(
!(
!(
!(
!(
!(
!(
!(!(
!(!(
!(
#*
#* #*
#*
")
_̂
_̂
_̂
_̂
_̂
_̂_̂
_̂
_̂ _̂
_̂
_̂
_̂
_̂
_̂
_̂
_̂
_̂
_̂
_̂
_̂
_̂
Former Citizens Gas Works MGP Site
Metropolitan Former MGP Site
0.1
0.2
0.7
0.3
0.5
0.4
0.6
0.8
³
March 2011
!(
!(!(
!( !(!(
!(!(
!(!(
!(!(
!(
!(
!(!(
!(!(
!(
!(
!(
!(
!(
!(
!(
_̂
_̂
_̂
_̂
_̂_̂
_̂
_̂ _̂
_̂_̂
_̂
_̂
_̂
_̂_̂
Former Citizens Gas Works MGP Site
Metropolitan Former MGP Site
0.1
0.2
0.7
0.3
0.5
0.4
0.6
0.8
!(!(
!(
!(!(
!(!(
!(!(
!(!(!(
!(!(!(
!(!(!(
!(!(!(!(!(!(!(!(!(!(!(
!(!(!(!(!(!(
!(
!(
!(
!(
!(!(
!(
!(
!(
!(
!(!(
!(!(
!(
!(
_̂_̂
_̂
_̂
_̂
_̂_̂
_̂
_̂
_̂̂__̂
_̂
_̂
_̂
_̂
_̂
_̂
_̂
_̂_̂
_̂̂__̂
_̂_̂_̂
_̂_̂
_̂_̂_̂_̂_̂_̂_̂
_̂_̂_̂_̂_̂_̂_̂_̂
_̂
_̂_̂
_̂_̂_̂
_̂
_̂
_̂
_̂
_̂
_̂_̂
_̂
_̂
_̂
Former Citizens Gas Works MGP Site
Metropolitan Former MGP Site
0.1
0.2
0.7
0.3
0.5
0.4
0.6
0.8
³³
0 - 3 ft Sediment
3ft - Native Material
Native Material
LMW PAH (mg/kg)
!( < 1.0
!( 1.1 - 10.0
!( 10.1 - 100.0
!( 100.1 - 1,000.0
!( 1,000.1 - 10,000.0
!( > 10,000
!( GEI Sediment Core
#* USACE Sediment Core
_̂ USEPA Sediment Core
") CSO Outfall
Gowanus Study Area (From EPA Website)
Canal Mile Centerline
Former MGP Sites
³³
³1. When duplicate values were reported, sample with the maximum result was plotted.2. Non-detect ("U" qualified) results were plottted at half of the reporting limit.3. Maximum concentrations were plotted for cores with multiple,non-contiguous samples in each stratum.
Maximum Low Molecular Weight PAH Concentration in Sediment HorizonsDraft – For Discussion Purposes Only
Figure 1-2a
0 250 500125Feet
1. The NYS DEC Sediment Effects Range-Low (ERL) for LMW PAHs is 0.552 mg/kg.2. The NYS DEC Sediment Effects Range-Median (ERM) for LMW PAHs is 3.16 mg/kg.
Figure 4-2a
April 2011May 2011
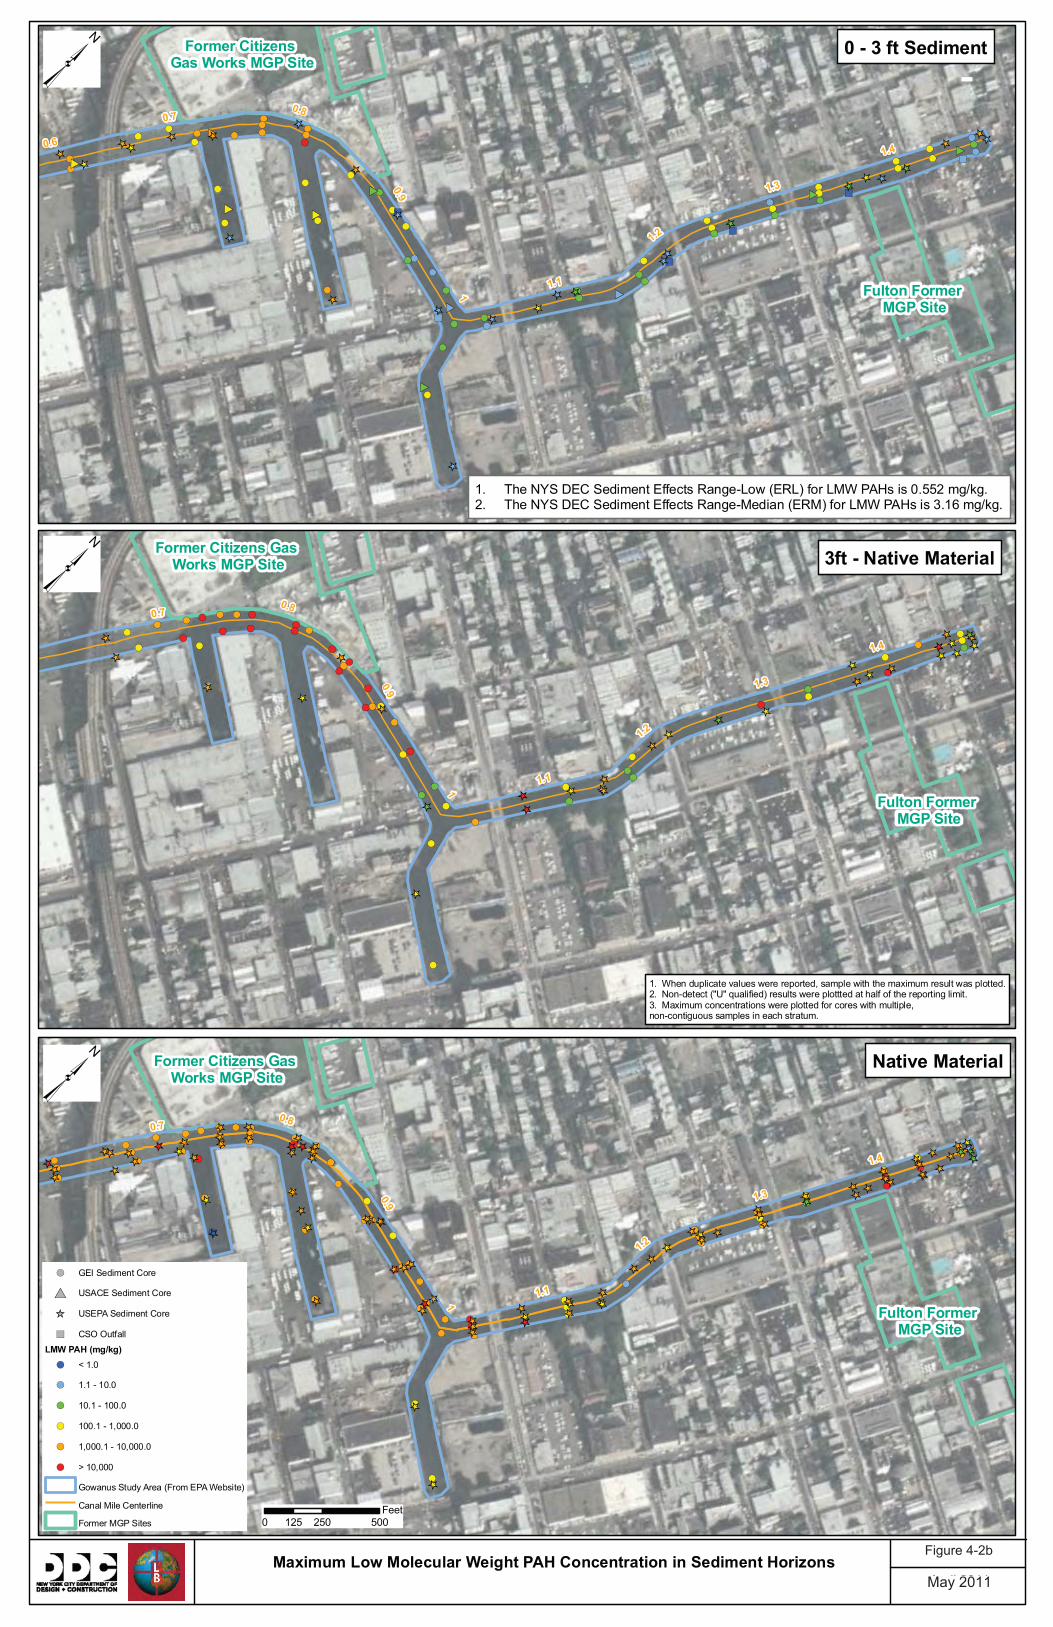
!(!(!(!(!(!(!(
!(
!(
!(!(!(!(!(
!(!(!(
!(!(!(
!(!(
!(!(
!(
!(!(
!(
!(
!(!(!(
!(!(!(!(!(!(
!(
!(!(
!(
!(
!(
!(
!(!(
!(!(
!(
!(
!(
#*
#* #*
#*
#*
#*
#*
#*
#*
#*
")
")
")
")
")
")
_̂
_̂
_̂
_̂
_̂
_̂
_̂
_̂
_̂
_̂
_̂
_̂
_̂
_̂_̂
_̂_̂
_̂
_̂_̂
_̂
_̂
_̂
_̂
_̂
_̂
_̂
Former Citizens Gas Works MGP Site
Fulton Former MGP Site
1
1.3
1.2
1.1
1.4
0.9
0.7
0.6
0.8
³
January 2011
!(!(!(!(
!(!(
!(
!(!(
!(
!(!(
!(
!(!(!(
!(!(
!(
!(
!(
!(!(
!(!(!(
!(!(!(
!(!(
!(!(
!(!(
!(!(
!(
!(
!(!(
!(
!(
!(
!(
!(
_̂_̂_̂_̂
_̂_̂
_̂
_̂
_̂
_̂
_̂
_̂_̂
_̂
_̂
_̂
_̂_̂_̂
_̂_̂
_̂_̂
_̂
_̂_̂̂_
_̂
_̂
_̂
Former Citizens Gas Works MGP Site
Fulton Former MGP Site
1
1.3
1.2
1.1
1.4
0.9
0.70.8
!(!(!(
!(!(!(!(
!(
!(!(
!(
!(
!(!(!(
!(!(!(
!(
!(!(!(
!(!(!(
!(!(!(
!(!(!(
!(!(
!(
!(!(
!(!(
!(!(!(
!(!(!(
!(!(!(
!(!(!(!(!(!(
!(
!(
!(
!(
!(!(
!(!(
!(
!(
!(
!(
!(
!(
_̂_̂_̂_̂_̂
_̂_̂
_̂
_̂
_̂
_̂
_̂
_̂
_̂
_̂_̂
_̂
_̂
_̂
_̂
_̂_̂̂_
_̂̂__̂
_̂
_̂_̂̂_
_̂
_̂
_̂̂_
_̂̂__̂̂__̂_̂
_̂̂_
_̂̂_
_̂ _̂̂_
_̂
_̂_̂
_̂̂_̂_
_̂_̂_̂
_̂_̂_̂_̂_̂̂_
_̂̂__̂
_̂_̂̂_
_̂_̂
_̂_̂_̂_̂_̂_̂_̂
_̂_̂
_̂
_̂_̂
_̂
_̂
_̂
Former Citizens Gas Works MGP Site
Fulton Former MGP Site
1
1.3
1.2
1.1
1.4
0.9
0.70.8
³³
0 - 3 ft Sediment
3ft - Native Material
Native Material
!( GEI Sediment Core
#* USACE Sediment Core
_̂ USEPA Sediment Core
") CSO Outfall
LMW PAH (mg/kg)
!( < 1.0
!( 1.1 - 10.0
!( 10.1 - 100.0
!( 100.1 - 1,000.0
!( 1,000.1 - 10,000.0
!( > 10,000
Gowanus Study Area (From EPA Website)
Canal Mile Centerline
Former MGP Sites
³³
³
Maximum Low Molecular Weight PAH Concentration in Sediment Horizons Figure 1-2b
Draft – For Discussion Purposes Only
0 250 500125Feet
1. The NYS DEC Sediment Effects Range-Low (ERL) for LMW PAHs is 0.552 mg/kg.2. The NYS DEC Sediment Effects Range-Median (ERM) for LMW PAHs is 3.16 mg/kg.
1. When duplicate values were reported, sample with the maximum result was plotted.2. Non-detect ("U" qualified) results were plottted at half of the reporting limit.3. Maximum concentrations were plotted for cores with multiple,non-contiguous samples in each stratum.
Figure 4-2b
April 2011May 2011
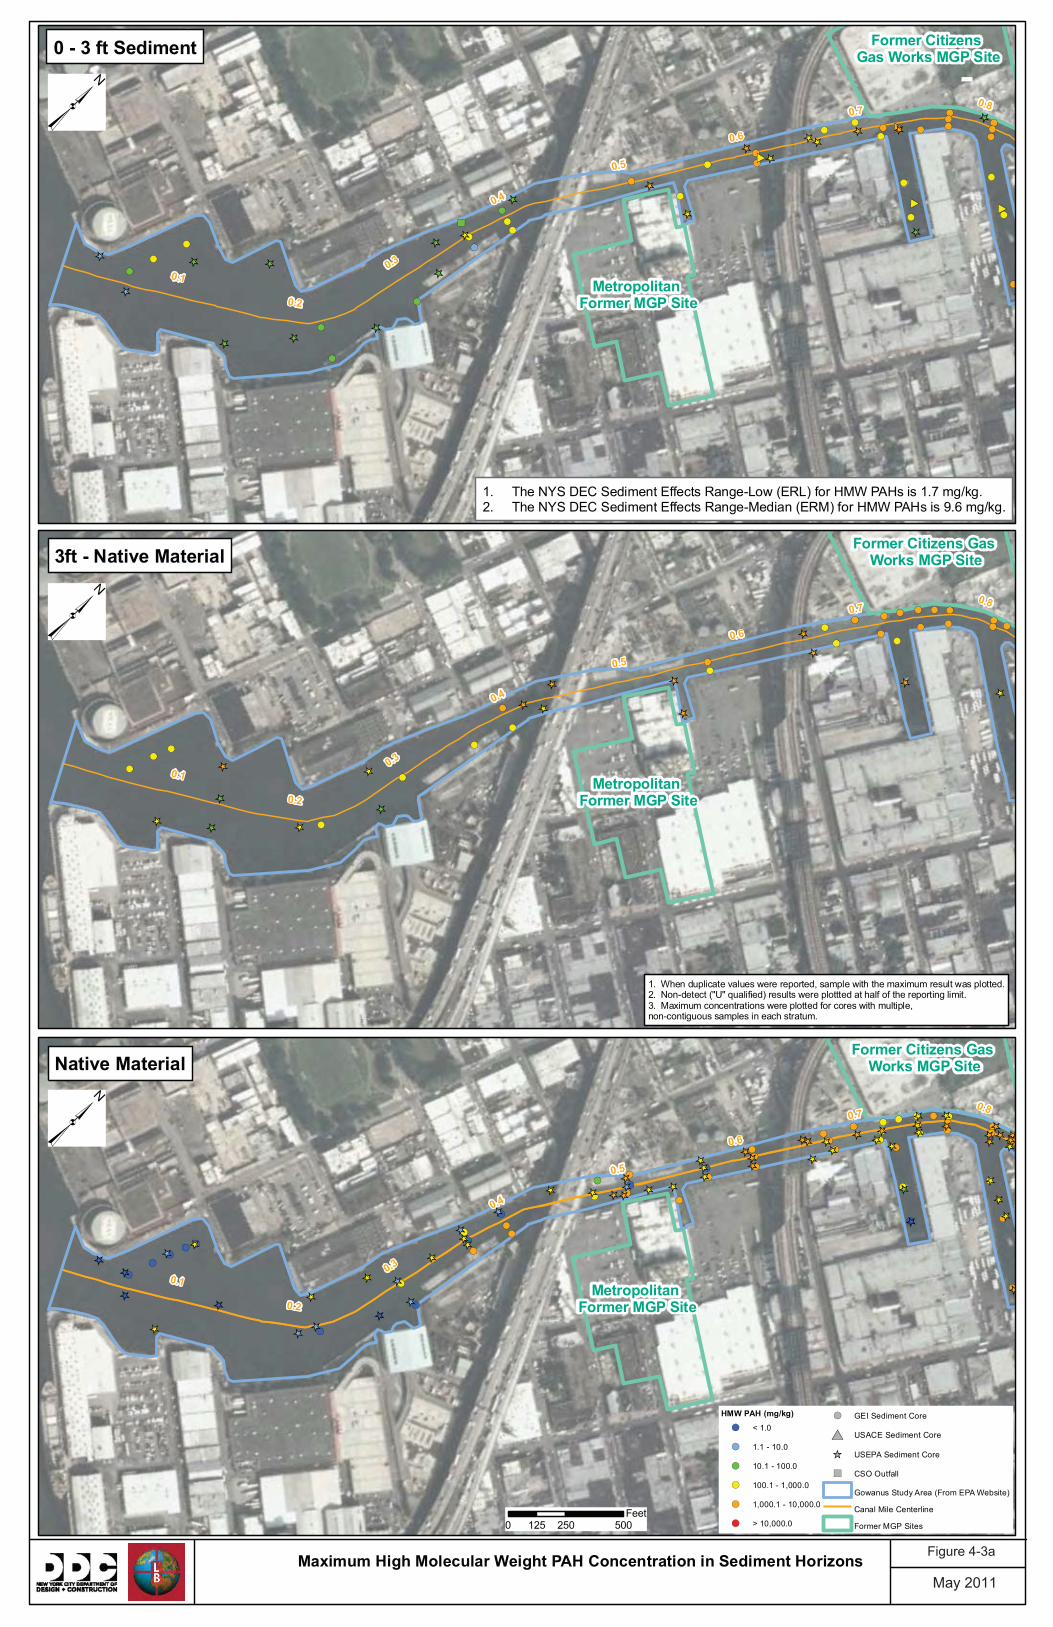
!( !(!(!(
!(!(!(!(!(!(
!(
!(!(!(
!(
!(!(!(
!(!(
!(
!(
!(
!(
!(
!(
!(
!(
!(!(
!(!(
!(
#*
#* #*
#*
")
_̂
_̂
_̂
_̂
_̂
_̂_̂
_̂
_̂ _̂
_̂
_̂
_̂
_̂
_̂
_̂
_̂
_̂
_̂
_̂
_̂
_̂
Former Citizens Gas Works MGP Site
Metropolitan Former MGP Site
0.1
0.2
0.7
0.3
0.5
0.4
0.6
0.8
³
March 2011
!(
!(!(
!( !(!(
!(!(
!(!(
!(!(
!(
!(
!(!(
!(!(
!(
!(
!(
!(
!(
!(
!(
_̂
_̂
_̂
_̂
_̂_̂
_̂
_̂ _̂
_̂_̂
_̂
_̂
_̂
_̂_̂
Former Citizens Gas Works MGP Site
Metropolitan Former MGP Site
0.1
0.2
0.7
0.3
0.5
0.4
0.6
0.8
!(!(
!(
!(!(
!(!(
!(!(
!(!(!(
!(!(!(
!(!(!(
!(!(!(!(!(!(!(!(!(!(!(
!(!(!(!(!(!(
!(
!(
!(
!(
!(!(
!(
!(
!(
!(
!(!(
!(!(
!(
!(
_̂_̂
_̂
_̂
_̂
_̂_̂
_̂
_̂
_̂̂__̂
_̂
_̂
_̂
_̂
_̂
_̂
_̂
_̂_̂
_̂̂__̂
_̂_̂_̂
_̂_̂
_̂_̂_̂_̂_̂_̂_̂
_̂_̂_̂_̂_̂_̂_̂_̂
_̂
_̂_̂
_̂_̂_̂
_̂
_̂
_̂
_̂
_̂
_̂_̂
_̂
_̂
_̂
Former Citizens Gas Works MGP Site
Metropolitan Former MGP Site
0.1
0.2
0.7
0.3
0.5
0.4
0.6
0.8
³³
0 - 3 ft Sediment
3ft - Native Material
Native Material
HMW PAH (mg/kg)
!( < 1.0
!( 1.1 - 10.0
!( 10.1 - 100.0
!( 100.1 - 1,000.0
!( 1,000.1 - 10,000.0
!( > 10,000.0
!( GEI Sediment Core
#* USACE Sediment Core
_̂ USEPA Sediment Core
") CSO Outfall
Gowanus Study Area (From EPA Website)
Canal Mile Centerline
Former MGP Sites
³³
³1. When duplicate values were reported, sample with the maximum result was plotted.2. Non-detect ("U" qualified) results were plottted at half of the reporting limit.3. Maximum concentrations were plotted for cores with multiple,non-contiguous samples in each stratum.
Maximum High Molecular Weight PAH Concentration in Sediment HorizonsDraft – For Discussion Purposes Only
Figure 1-3a
0 250 500125Feet
1. The NYS DEC Sediment Effects Range-Low (ERL) for HMW PAHs is 1.7 mg/kg.2. The NYS DEC Sediment Effects Range-Median (ERM) for HMW PAHs is 9.6 mg/kg.
Figure 4-3a
April 2011May 2011

!(!(!(!(!(!(!(
!(
!(
!(!(!(!(!(
!(!(!(
!(!(!(
!(!(
!(!(
!(
!(!(
!(
!(
!(!(!(
!(!(!(!(!(!(
!(
!(!(
!(
!(
!(
!(
!(!(
!(!(
!(
!(
!(
#*
#* #*
#*
#*
#*
#*
#*
#*
#*
")
")
")
")
")
")
_̂
_̂
_̂
_̂
_̂
_̂
_̂
_̂
_̂
_̂
_̂
_̂
_̂
_̂
_̂_̂
_̂_̂
_̂
_̂_̂
_̂
_̂
_̂
_̂
_̂
_̂
_̂
Former Citizens Gas Works MGP Site
Fulton Former MGP Site
1
1.3
1.2
1.1
1.4
0.9
0.7
0.6
0.8
³
January 2011
!(!(!(!(
!(!(
!(
!(!(
!(
!(!(
!(
!(!(!(
!(!(
!(
!(
!(
!(!(
!(!(!(
!(!(!(
!(!(
!(!(
!(!(
!(!(
!(
!(
!(!(
!(
!(
!(
!(
!(
_̂_̂_̂_̂
_̂_̂
_̂
_̂
_̂
_̂
_̂
_̂
_̂
_̂
_̂
_̂_̂_̂
_̂_̂
_̂_̂
_̂
_̂_̂̂_
_̂
_̂
_̂
Former Citizens Gas Works MGP Site
Fulton Former MGP Site
1
1.3
1.2
1.1
1.4
0.9
0.70.8
!(!(!(
!(!(!(!(
!(
!(!(
!(
!(
!(!(!(
!(!(!(
!(
!(!(!(
!(!(!(
!(!(!(
!(!(!(
!(!(
!(
!(!(
!(!(
!(!(!(
!(!(!(
!(!(!(
!(!(!(!(!(!(
!(
!(
!(
!(
!(!(
!(!(
!(
!(
!(
!(
!(
!(
_̂_̂_̂_̂_̂
_̂_̂
_̂
_̂
_̂
_̂
_̂
_̂
_̂
_̂_̂
_̂
_̂
_̂
_̂
_̂_̂̂_
_̂̂__̂
_̂
_̂_̂̂_
_̂
_̂
_̂̂_
_̂̂__̂̂__̂_̂
_̂̂_
_̂̂_
_̂ _̂̂_
_̂
_̂_̂
_̂̂_̂_
_̂_̂_̂
_̂_̂_̂_̂_̂̂_
_̂̂__̂
_̂_̂̂_
_̂_̂
_̂_̂_̂_̂_̂_̂_̂
_̂_̂
_̂
_̂_̂
_̂
_̂
_̂
Former Citizens Gas Works MGP Site
Fulton Former MGP Site
1
1.3
1.2
1.1
1.4
0.9
0.70.8
³³
0 - 3 ft Sediment
3ft - Native Material
Native Material
!( GEI Sediment Core
#* USACE Sediment Core
_̂ USEPA Sediment Core
") CSO Outfall
HMW PAH (mg/kg)
!( < 1.0
!( 1.1 - 10.0
!( 10.1 - 100.0
!( 100.1 - 1,000.0
!( 1,000.1 - 10,000.0
!( > 10,000.0
Gowanus Study Area (From EPA Website)
Canal Mile Centerline
Former MGP Sites
³³
³
Maximum High Molecular Weight PAH Concentration in Sediment Horizons Figure 1-3b
Draft – For Discussion Purposes Only
0 250 500125Feet
1. The NYS DEC Sediment Effects Range-Low (ERL) for HMW PAHs is 1.7 mg/kg.2. The NYS DEC Sediment Effects Range-Median (ERM) for HMW PAHs is 9.6 mg/kg.
1. When duplicate values were reported, sample with the maximum result was plotted.2. Non-detect ("U" qualified) results were plottted at half of the reporting limit.3. Maximum concentrations were plotted for cores with multiple,non-contiguous samples in each stratum.
Figure 4-3b
April 2011May 2011
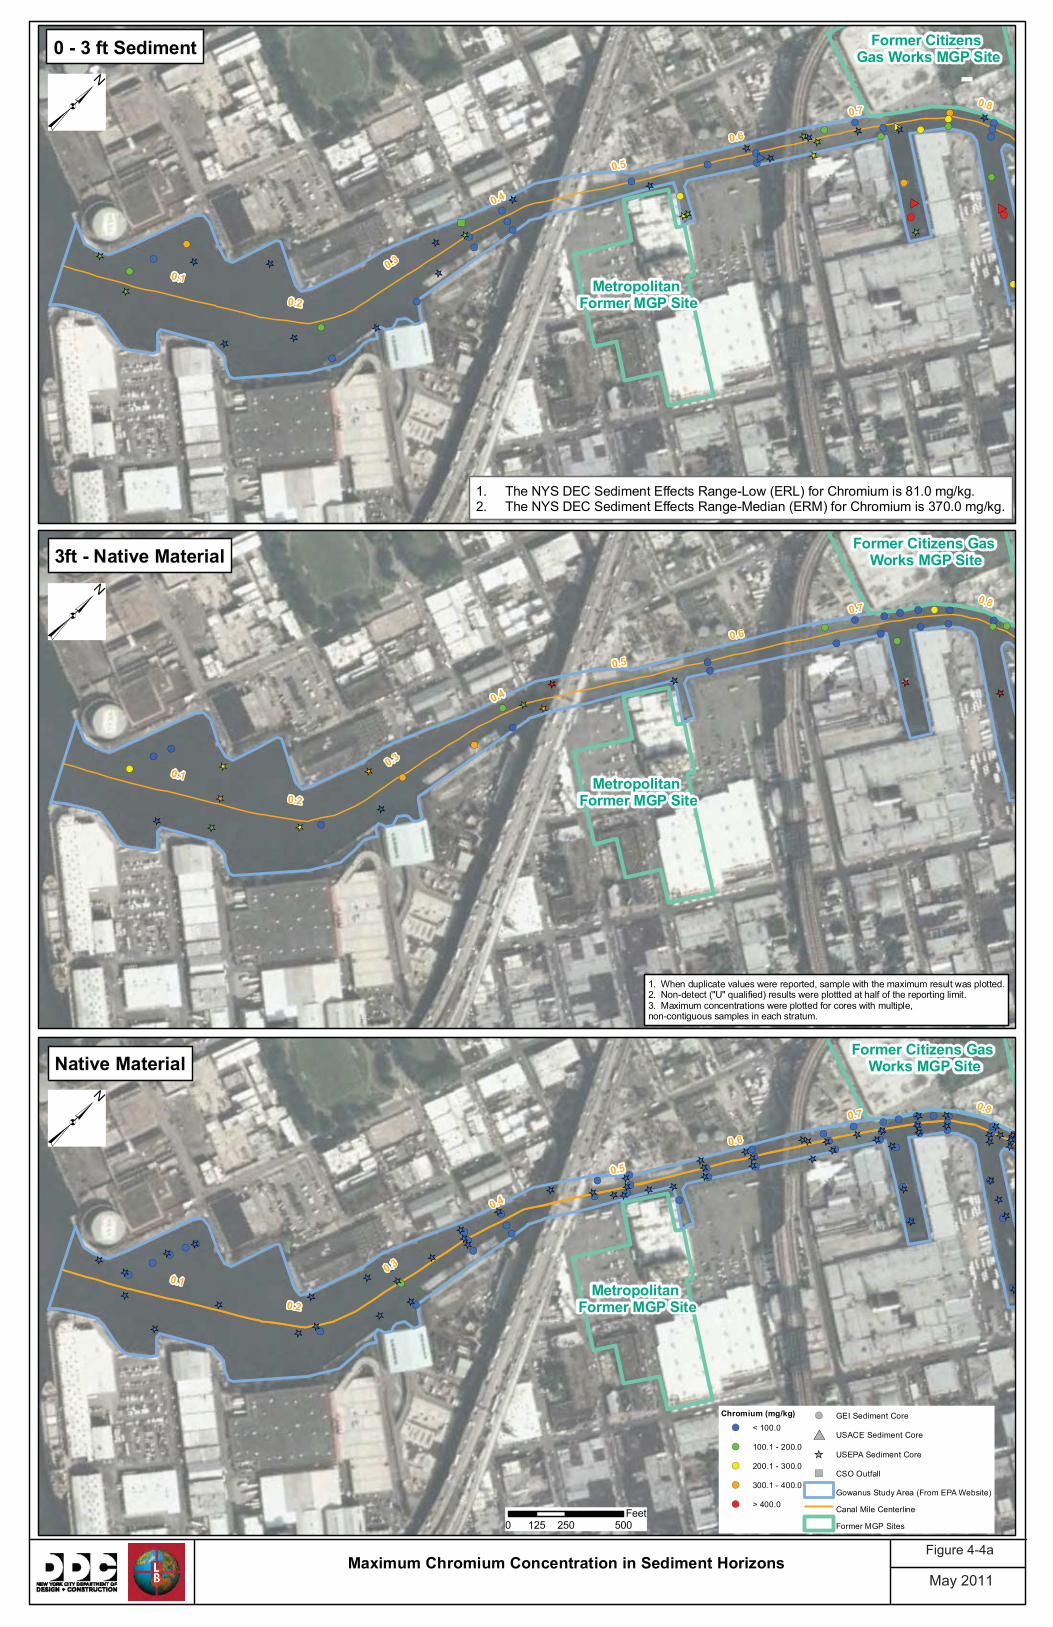
!( !(!(!(
!(!(!(!(!(!(
!(
!(!(!(
!(
!(!(!(
!(!(
!(
!(
!(
!(
!(
!(
!(
!(
!(!(
!(!(
!(
#*
#* #*
#*
")
_̂
_̂
_̂
_̂
_̂
_̂̂__̂
_̂_̂
_̂
_̂ _̂
_̂
_̂
_̂
_̂
_̂
_̂
_̂
_̂
_̂
_̂
_̂
_̂
Former Citizens Gas Works MGP Site
Metropolitan Former MGP Site
0.1
0.2
0.7
0.3
0.5
0.4
0.6
0.8
³
March 2011
!(
!(!(
!( !(!(
!(!(
!(!(
!(!(
!(
!(
!(!(
!(!(
!(
!(
!(
!(
!(
!(
!(
_̂
_̂
_̂
_̂
_̂ _̂
_̂_̂
_̂
_̂
_̂
_̂_̂
Former Citizens Gas Works MGP Site
Metropolitan Former MGP Site
0.1
0.2
0.7
0.3
0.5
0.4
0.6
0.8
!(!(
!(
!(!(
!(!(
!(!(
!(!(!(
!(!(!(
!(!(!(
!(!(!(!(!(!(!(!(!(!(!(
!(!(!(!(!(!(
!(
!(
!(
!(
!(!(
!(
!(
!(
!(
!(!(
!(!(
!(
!(
_̂_̂
_̂
_̂
_̂
_̂_̂
_̂
_̂
_̂̂__̂
_̂
_̂
_̂
_̂
_̂
_̂
_̂
_̂_̂
_̂̂__̂
_̂_̂_̂
_̂_̂
_̂_̂_̂_̂_̂_̂_̂
_̂_̂_̂_̂_̂_̂_̂_̂
_̂
_̂_̂
_̂
_̂_̂_̂
_̂
_̂
_̂
_̂
_̂_̂
_̂
_̂
_̂
Former Citizens Gas Works MGP Site
Metropolitan Former MGP Site
0.1
0.2
0.7
0.3
0.5
0.4
0.6
0.8
³³
0 - 3 ft Sediment
3ft - Native Material
Native Material
Chromium (mg/kg)
!( < 100.0
!( 100.1 - 200.0
!( 200.1 - 300.0
!( 300.1 - 400.0
!( > 400.0
!( GEI Sediment Core
#* USACE Sediment Core
_̂ USEPA Sediment Core
") CSO Outfall
Gowanus Study Area (From EPA Website)
Canal Mile Centerline
Former MGP Sites
³³
³1. When duplicate values were reported, sample with the maximum result was plotted.2. Non-detect ("U" qualified) results were plottted at half of the reporting limit.3. Maximum concentrations were plotted for cores with multiple,non-contiguous samples in each stratum.
Maximum Chromium Concentration in Sediment HorizonsDraft – For Discussion Purposes Only
Figure 1-4a
0 250 500125Feet
1. The NYS DEC Sediment Effects Range-Low (ERL) for Chromium is 81.0 mg/kg.2. The NYS DEC Sediment Effects Range-Median (ERM) for Chromium is 370.0 mg/kg.
Figure 4-4a
April 2011May 2011

!(!(!(!(!(!(!(
!(
!(
!(!(!(!(!(
!(!(!(
!(!(!(
!(!(
!(!(
!(
!(!(
!(
!(
!(!(!(
!(!(!(!(!(!(
!(
!(!(
!(
!(
!(
!(
!(!(
!(!(
!(
!(
!(
#*
#* #*
#*
#*
#*
#*
#*
#*
#*
")
")
")
")
")
") _̂
_̂
_̂
_̂
_̂̂__̂
_̂
_̂
_̂
_̂
_̂
_̂
_̂
_̂
_̂_̂
_̂_̂
_̂
_̂
_̂
_̂
_̂
_̂
_̂
_̂
_̂
_̂
Former Citizens Gas Works MGP Site
Fulton Former MGP Site
1
1.3
1.2
1.1
1.4
0.9
0.7
0.6
0.8
³
January 2011
!(!(!(!(
!(!(
!(
!(!(
!(
!(!(
!(
!(!(!(
!(!(
!(
!(
!(
!(!(
!(!(!(
!(!(!(
!(!(
!(!(
!(!(
!(!(
!(
!(
!(!(
!(
!(
!(
!(
!(
_̂_̂_̂
_̂_̂_̂
_̂_̂
_̂
_̂
_̂
_̂
_̂_̂
_̂
_̂
_̂
_̂_̂_̂
_̂_̂
_̂_̂̂_
_̂
_̂
_̂
Former Citizens Gas Works MGP Site
Fulton Former MGP Site
1
1.3
1.2
1.1
1.4
0.9
0.70.8
!(!(!(
!(!(!(!(
!(
!(!(
!(
!(
!(!(!(
!(!(!(
!(
!(!(!(
!(!(!(
!(!(!(
!(!(!(
!(!(
!(
!(!(
!(!(
!(!(!(
!(!(!(
!(!(!(
!(!(!(!(!(!(
!(
!(
!(
!(
!(!(
!(!(
!(
!(
!(
!(
!(
!(
_̂_̂_̂
_̂_̂
_̂_̂
_̂
_̂
_̂
_̂
_̂
_̂
_̂
_̂_̂
_̂
_̂
_̂
_̂
_̂_̂̂_
_̂̂__̂
_̂
_̂_̂̂_
_̂
_̂
_̂_̂
_̂̂__̂̂__̂_̂
_̂̂_
_̂̂_
_̂ _̂̂_
_̂
_̂_̂
_̂_̂_̂
_̂_̂_̂
_̂_̂_̂
_̂_̂̂_
_̂̂__̂
_̂_̂_̂
_̂_̂
_̂_̂_̂_̂_̂_̂_̂
_̂_̂
_̂
_̂
_̂_̂
_̂
_̂
Former Citizens Gas Works MGP Site
Fulton Former MGP Site
1
1.3
1.2
1.1
1.4
0.9
0.70.8
³³
0 - 3 ft Sediment
3ft - Native Material
Native Material
!( GEI Sediment Core
#* USACE Sediment Core
_̂ USEPA Sediment Core
") CSO Outfall
Chromium (mg/kg)!( < 100.0
!( 100.1 - 200.0
!( 200.1 - 300.0
!( 300.1 - 400.0
!( > 400.0
Gowanus Study Area (From EPA Website)
Canal Mile Centerline
Former MGP Sites
³³
³
Figure 1-4b
Draft – For Discussion Purposes Only
0 250 500125Feet
1. When duplicate values were reported, sample with the maximum result was plotted.2. Non-detect ("U" qualified) results were plottted at half of the reporting limit.3. Maximum concentrations were plotted for cores with multiple,non-contiguous samples in each stratum.
1. The NYS DEC Sediment Effects Range-Low (ERL) for Chromium is 81.0 mg/kg.2. The NYS DEC Sediment Effects Range-Median (ERM) for Chromium is 370.0 mg/kg.
Maximum Chromium Concentration in Sediment HorizonsFigure 4-4b
April 2011May 2011

Table 1a. Child Dermal Exposure Surface Sediments (using CSO Solids Data)
Chemical of Potential Concern Cancer Risk
Corresponding Risk
Value Units Value Units Value Units Value Units
Acenaphthene 3.70E+02 mg/kg 1.10E‐05 mg/kg‐day NA NA Benzo(a)anthracene (0‐2)* 1.30E+02 mg/kg 1.30E‐06 mg/kg‐day 7.30E+00 1/(mg/kg‐day) 9.20E‐06 4.18E‐01 mg/kg 2.96E‐08 Benzo(a)anthracene (2‐6)* 1.30E+02 mg/kg 2.50E‐06 mg/kg‐day 2.20E+00 1/(mg/kg‐day) 5.50E‐06 4.18E‐01 mg/kg 1.77E‐08 Benzo(a)pyrene (0‐2)* 1.10E+02 mg/kg 1.10E‐06 mg/kg‐day 7.30E+01 1/(mg/kg‐day) 7.70E‐05 7.08E‐01 mg/kg 4.96E‐07 Benzo(a)pyrene (2‐6)* 1.10E+02 mg/kg 2.10E‐06 mg/kg‐day 2.20E+01 1/(mg/kg‐day) 4.60E‐05 7.08E‐01 mg/kg 2.96E‐07 Benzo(b)fluoranthene (0‐2)* 1.10E+02 mg/kg 1.10E‐06 mg/kg‐day 7.30E+00 1/(mg/kg‐day) 8.10E‐06 9.98E‐01 mg/kg 7.35E‐08 Benzo(b)fluoranthene (2‐6)* 1.10E+02 mg/kg 2.20E‐06 mg/kg‐day 2.20E+00 1/(mg/kg‐day) 4.90E‐06 9.98E‐01 mg/kg 4.44E‐08 Benzo(k)fluoranthene (0‐2)* 6.50E+01 mg/kg 6.40E‐07 mg/kg‐day 7.30E‐01 1/(mg/kg‐day) 4.70E‐07 7.70E‐01 mg/kg 5.57E‐09 Benzo(k)fluoranthene (2‐6)* 6.50E+01 mg/kg 1.30E‐06 mg/kg‐day 2.20E‐01 1/(mg/kg‐day) 2.80E‐07 7.70E‐01 mg/kg 3.32E‐09 Bis(2‐ethylhexyl) phthalate 3.30E+01 mg/kg 7.60E‐07 mg/kg‐day 1.40E‐02 1/(mg/kg‐day) 1.10E‐08 7.50E+00 mg/kg 2.50E‐09 Chrysene (0‐2)* 2.50E+02 mg/kg 2.50E‐06 mg/kg‐day 7.30E‐02 1/(mg/kg‐day) 1.80E‐07 4.43E‐01 mg/kg 3.19E‐10 Chrysene (2‐6)* 2.50E+02 mg/kg 5.00E‐06 mg/kg‐day 2.20E‐02 1/(mg/kg‐day) 1.10E‐07 4.43E‐01 mg/kg 1.95E‐10 Dibenz(a,h)anthracene (0‐2)* 6.20E+00 mg/kg 6.10E‐08 mg/kg‐day 7.30E+01 1/(mg/kg‐day) 4.50E‐06 2.83E‐01 mg/kg 2.05E‐07 Dibenz(a,h)anthracene (2‐6)* 6.20E+00 mg/kg 1.20E‐07 mg/kg‐day 2.20E+01 1/(mg/kg‐day) 2.70E‐06 2.83E‐01 mg/kg 1.23E‐07 Fluoranthene 5.00E+02 mg/kg 1.50E‐05 mg/kg‐day NA NA Indeno(1,2,3‐c,d)pyrene (0‐2)* 4.90E+01 mg/kg 4.80E‐07 mg/kg‐day 7.30E+00 1/(mg/kg‐day) 3.50E‐06 6.10E‐01 mg/kg 4.36E‐08 Indeno(1,2,3‐c,d)pyrene (2‐6)* 4.90E+01 mg/kg 9.70E‐07 mg/kg‐day 2.20E+00 1/(mg/kg‐day) 2.10E‐06 6.10E‐01 mg/kg 2.61E‐08 Naphthalene 3.40E+00 mg/kg 1.00E‐07 mg/kg‐day NA NA 2.40E+00 mg/kg Pyrene 5.30E+02 mg/kg 1.60E‐05 mg/kg‐day NA NA 2.20E+00 mg/kg Dioxin‐Like PCB TEQ 4.00E‐05 mg/kg 1.30E‐12 mg/kg‐day 1.60E+05 1/(mg/kg‐day) 2.00E‐07 0.00E+00 Nondioxin‐Like PCB 5.20E+00 mg/kg 1.70E‐07 mg/kg‐day 2.00E+00 1/(mg/kg‐day) 3.30E‐07 6.85E‐01 4.35E‐08 Total PCB 5.40E+00 mg/kg 1.70E‐07 mg/kg‐day NA NA Aluminum 1.60E+04 mg/kg 3.60E‐05 mg/kg‐day NA NA Arsenic 1.80E+01 mg/kg 1.20E‐07 mg/kg‐day 1.50E+00 1/(mg/kg‐day) 1.80E‐07 6.46E+00 mg/kg 6.46E‐08 Cadmium 9.60E+00 mg/kg 2.20E‐09 mg/kg‐day NA NA Chromium (0‐2)* 9.40E+01 mg/kg 7.10E‐08 mg/kg‐day 2.00E+02 1/(mg/kg‐day) 1.40E‐05 3.93E+01 mg/kg 5.85E‐06 Chromium (2‐6)* 9.40E+01 mg/kg 1.40E‐07 mg/kg‐day 6.00E+01 1/(mg/kg‐day) 8.50E‐06 3.93E+01 mg/kg 3.55E‐06 Cobalt 1.30E+01 mg/kg 2.90E‐08 mg/kg‐day NA NA Copper 3.50E+02 mg/kg 8.00E‐07 mg/kg‐day NA NA Iron 4.00E+04 mg/kg 9.10E‐05 mg/kg‐day NA NA Lead 1.90E+03 mg/kg 4.30E‐06 mg/kg‐day NA NA Manganese 3.10E+02 mg/kg 7.20E‐07 mg/kg‐day NA NA Vanadium 5.00E+01 mg/kg 1.10E‐07 mg/kg‐day NA NA
Exposed Surface Sediment Total 1.88E‐04 1.09E‐05Exposed Surface Sediment Total, without Cr 1.65E‐04 1.48E‐06
EPC Cancer Risk Intake/
Exposure Concentration
CSF/Unit Risk CSO Dry Event Max
Conc
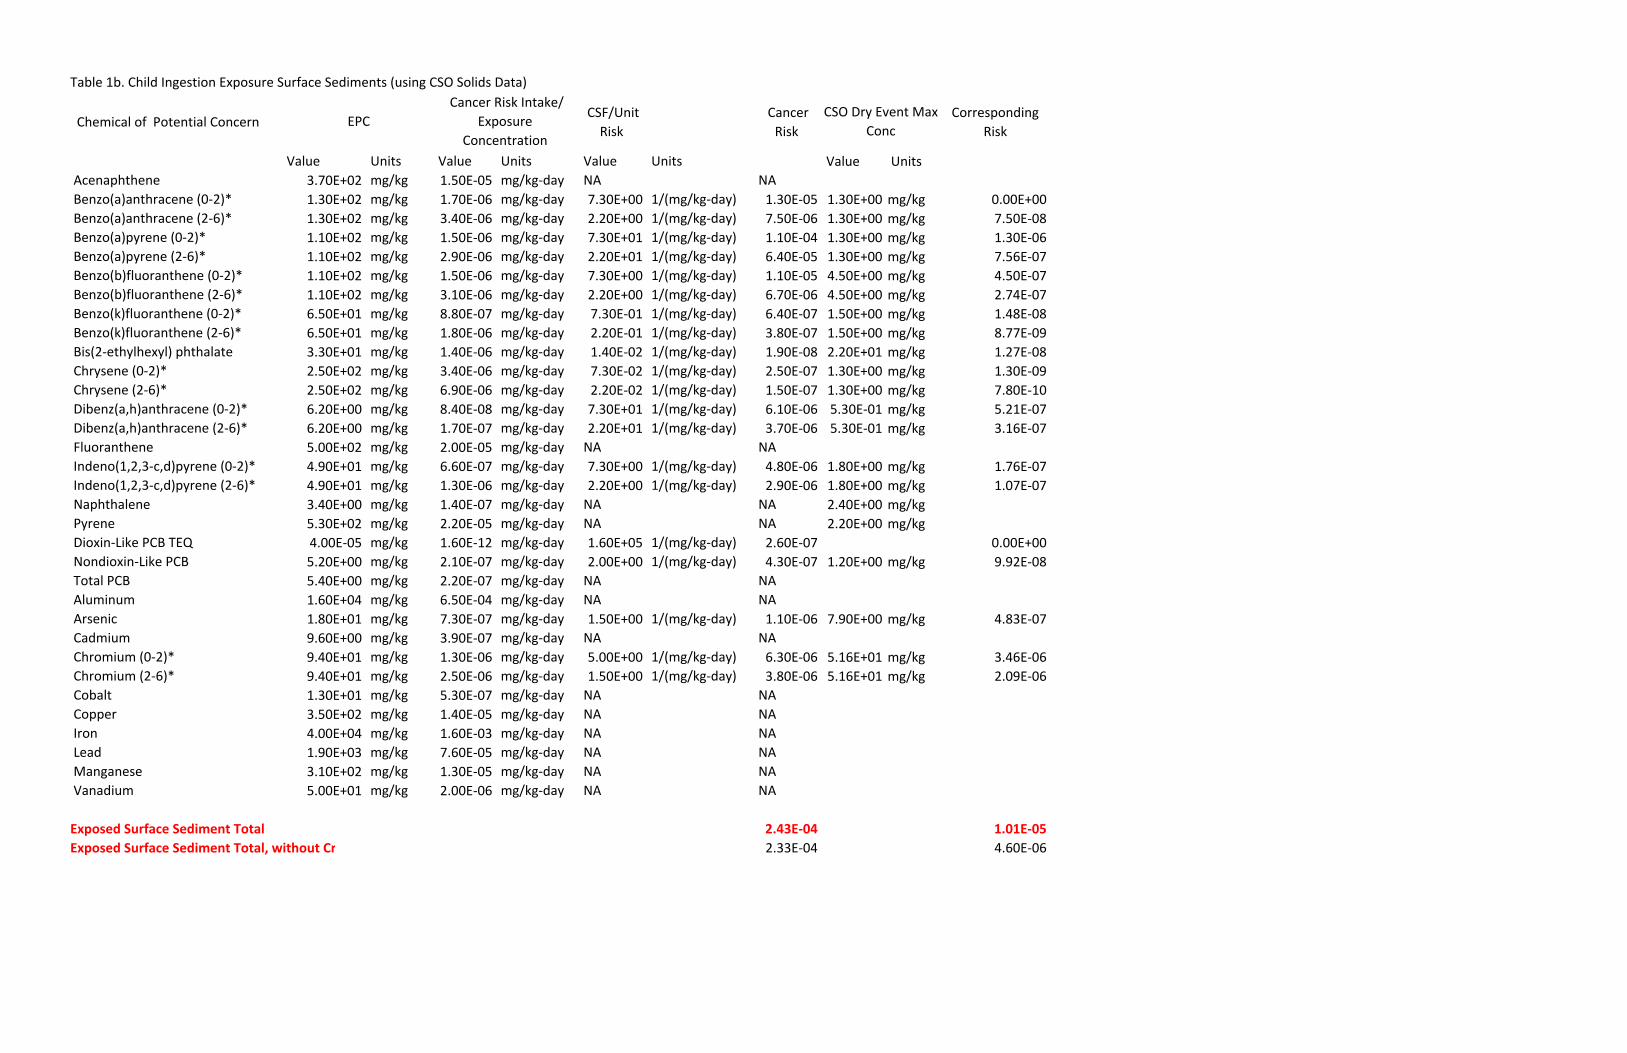
Table 1b. Child Ingestion Exposure Surface Sediments (using CSO Solids Data)
Chemical of Potential Concern CSF/Unit
Risk Cancer Risk
Corresponding Risk
Value Units Value Units Value Units Value Units Acenaphthene 3.70E+02 mg/kg 1.50E‐05 mg/kg‐day NA NA Benzo(a)anthracene (0‐2)* 1.30E+02 mg/kg 1.70E‐06 mg/kg‐day 7.30E+00 1/(mg/kg‐day) 1.30E‐05 1.30E+00 mg/kg 0.00E+00 Benzo(a)anthracene (2‐6)* 1.30E+02 mg/kg 3.40E‐06 mg/kg‐day 2.20E+00 1/(mg/kg‐day) 7.50E‐06 1.30E+00 mg/kg 7.50E‐08 Benzo(a)pyrene (0‐2)* 1.10E+02 mg/kg 1.50E‐06 mg/kg‐day 7.30E+01 1/(mg/kg‐day) 1.10E‐04 1.30E+00 mg/kg 1.30E‐06 Benzo(a)pyrene (2‐6)* 1.10E+02 mg/kg 2.90E‐06 mg/kg‐day 2.20E+01 1/(mg/kg‐day) 6.40E‐05 1.30E+00 mg/kg 7.56E‐07 Benzo(b)fluoranthene (0‐2)* 1.10E+02 mg/kg 1.50E‐06 mg/kg‐day 7.30E+00 1/(mg/kg‐day) 1.10E‐05 4.50E+00 mg/kg 4.50E‐07 Benzo(b)fluoranthene (2‐6)* 1.10E+02 mg/kg 3.10E‐06 mg/kg‐day 2.20E+00 1/(mg/kg‐day) 6.70E‐06 4.50E+00 mg/kg 2.74E‐07 Benzo(k)fluoranthene (0‐2)* 6.50E+01 mg/kg 8.80E‐07 mg/kg‐day 7.30E‐01 1/(mg/kg‐day) 6.40E‐07 1.50E+00 mg/kg 1.48E‐08 Benzo(k)fluoranthene (2‐6)* 6.50E+01 mg/kg 1.80E‐06 mg/kg‐day 2.20E‐01 1/(mg/kg‐day) 3.80E‐07 1.50E+00 mg/kg 8.77E‐09 Bis(2‐ethylhexyl) phthalate 3.30E+01 mg/kg 1.40E‐06 mg/kg‐day 1.40E‐02 1/(mg/kg‐day) 1.90E‐08 2.20E+01 mg/kg 1.27E‐08 Chrysene (0‐2)* 2.50E+02 mg/kg 3.40E‐06 mg/kg‐day 7.30E‐02 1/(mg/kg‐day) 2.50E‐07 1.30E+00 mg/kg 1.30E‐09 Chrysene (2‐6)* 2.50E+02 mg/kg 6.90E‐06 mg/kg‐day 2.20E‐02 1/(mg/kg‐day) 1.50E‐07 1.30E+00 mg/kg 7.80E‐10 Dibenz(a,h)anthracene (0‐2)* 6.20E+00 mg/kg 8.40E‐08 mg/kg‐day 7.30E+01 1/(mg/kg‐day) 6.10E‐06 5.30E‐01 mg/kg 5.21E‐07 Dibenz(a,h)anthracene (2‐6)* 6.20E+00 mg/kg 1.70E‐07 mg/kg‐day 2.20E+01 1/(mg/kg‐day) 3.70E‐06 5.30E‐01 mg/kg 3.16E‐07 Fluoranthene 5.00E+02 mg/kg 2.00E‐05 mg/kg‐day NA NA Indeno(1,2,3‐c,d)pyrene (0‐2)* 4.90E+01 mg/kg 6.60E‐07 mg/kg‐day 7.30E+00 1/(mg/kg‐day) 4.80E‐06 1.80E+00 mg/kg 1.76E‐07 Indeno(1,2,3‐c,d)pyrene (2‐6)* 4.90E+01 mg/kg 1.30E‐06 mg/kg‐day 2.20E+00 1/(mg/kg‐day) 2.90E‐06 1.80E+00 mg/kg 1.07E‐07 Naphthalene 3.40E+00 mg/kg 1.40E‐07 mg/kg‐day NA NA 2.40E+00 mg/kg Pyrene 5.30E+02 mg/kg 2.20E‐05 mg/kg‐day NA NA 2.20E+00 mg/kg Dioxin‐Like PCB TEQ 4.00E‐05 mg/kg 1.60E‐12 mg/kg‐day 1.60E+05 1/(mg/kg‐day) 2.60E‐07 0.00E+00 Nondioxin‐Like PCB 5.20E+00 mg/kg 2.10E‐07 mg/kg‐day 2.00E+00 1/(mg/kg‐day) 4.30E‐07 1.20E+00 mg/kg 9.92E‐08 Total PCB 5.40E+00 mg/kg 2.20E‐07 mg/kg‐day NA NA Aluminum 1.60E+04 mg/kg 6.50E‐04 mg/kg‐day NA NA Arsenic 1.80E+01 mg/kg 7.30E‐07 mg/kg‐day 1.50E+00 1/(mg/kg‐day) 1.10E‐06 7.90E+00 mg/kg 4.83E‐07 Cadmium 9.60E+00 mg/kg 3.90E‐07 mg/kg‐day NA NA Chromium (0‐2)* 9.40E+01 mg/kg 1.30E‐06 mg/kg‐day 5.00E+00 1/(mg/kg‐day) 6.30E‐06 5.16E+01 mg/kg 3.46E‐06 Chromium (2‐6)* 9.40E+01 mg/kg 2.50E‐06 mg/kg‐day 1.50E+00 1/(mg/kg‐day) 3.80E‐06 5.16E+01 mg/kg 2.09E‐06 Cobalt 1.30E+01 mg/kg 5.30E‐07 mg/kg‐day NA NA Copper 3.50E+02 mg/kg 1.40E‐05 mg/kg‐day NA NA Iron 4.00E+04 mg/kg 1.60E‐03 mg/kg‐day NA NA Lead 1.90E+03 mg/kg 7.60E‐05 mg/kg‐day NA NA Manganese 3.10E+02 mg/kg 1.30E‐05 mg/kg‐day NA NA Vanadium 5.00E+01 mg/kg 2.00E‐06 mg/kg‐day NA NA
Exposed Surface Sediment Total 2.43E‐04 1.01E‐05Exposed Surface Sediment Total, without Cr 2.33E‐04 4.60E‐06
EPC Cancer Risk Intake/
Exposure Concentration
CSO Dry Event Max Conc
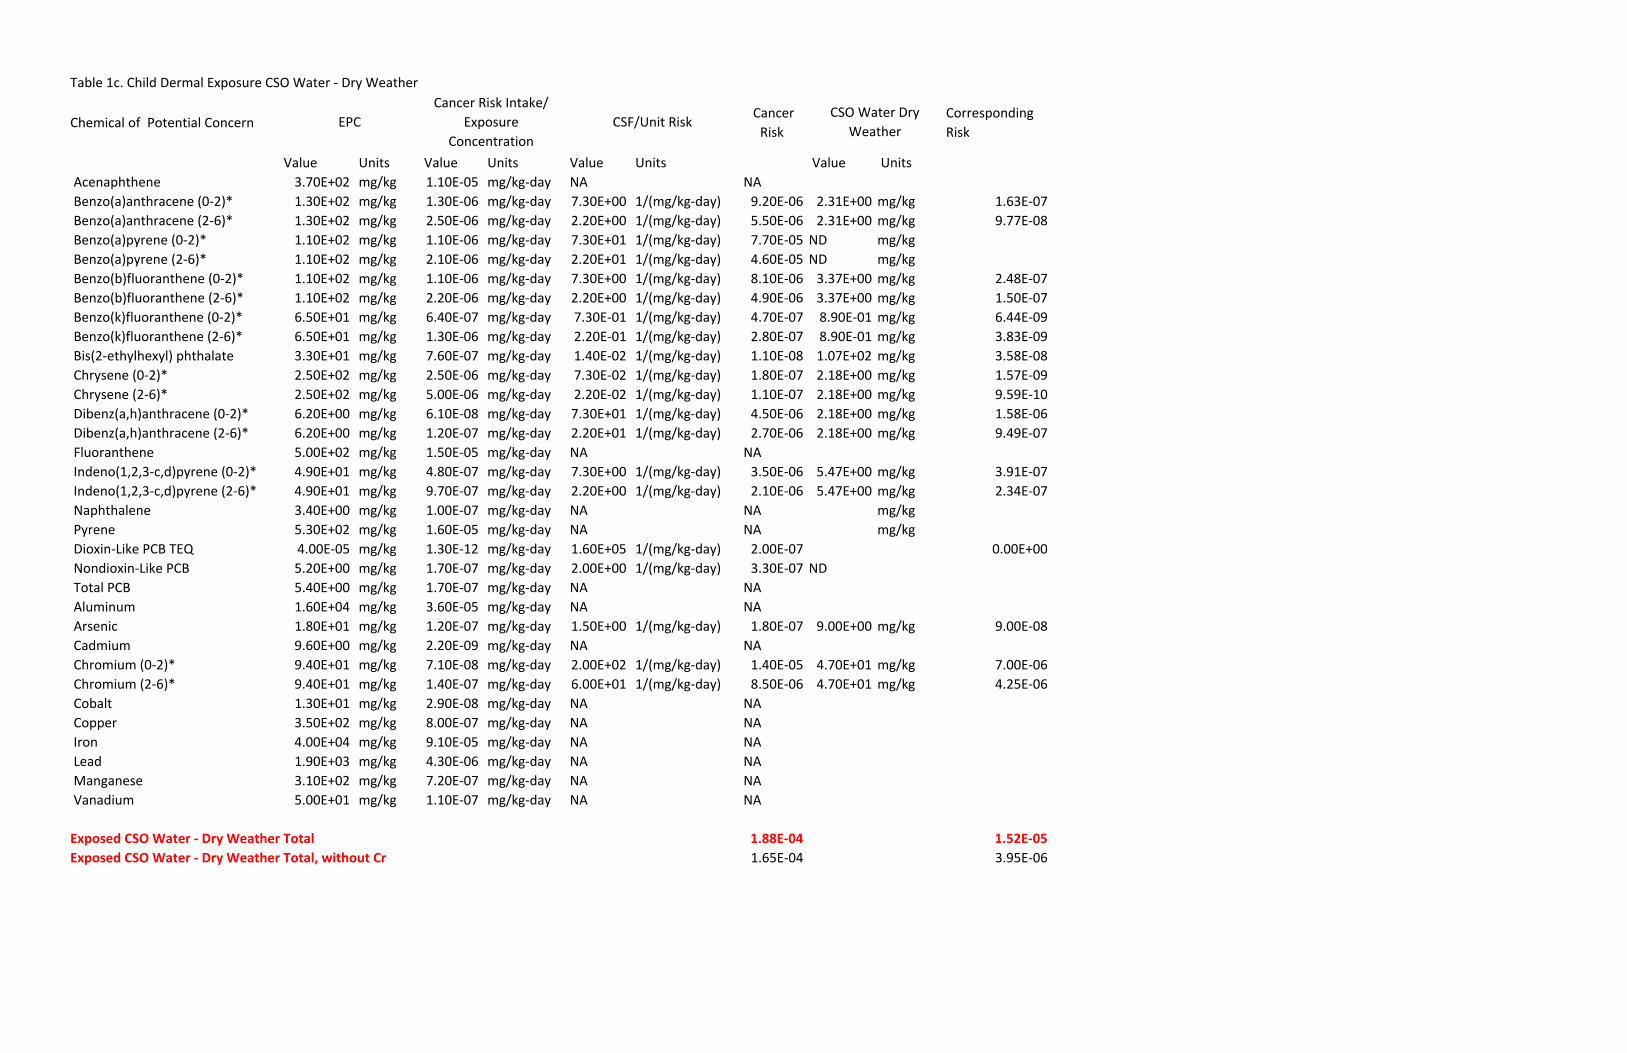
Table 1c. Child Dermal Exposure CSO Water ‐ Dry Weather
Chemical of Potential Concern Cancer Risk
Corresponding Risk
Value Units Value Units Value Units Value Units Acenaphthene 3.70E+02 mg/kg 1.10E‐05 mg/kg‐day NA NA Benzo(a)anthracene (0‐2)* 1.30E+02 mg/kg 1.30E‐06 mg/kg‐day 7.30E+00 1/(mg/kg‐day) 9.20E‐06 2.31E+00 mg/kg 1.63E‐07 Benzo(a)anthracene (2‐6)* 1.30E+02 mg/kg 2.50E‐06 mg/kg‐day 2.20E+00 1/(mg/kg‐day) 5.50E‐06 2.31E+00 mg/kg 9.77E‐08 Benzo(a)pyrene (0‐2)* 1.10E+02 mg/kg 1.10E‐06 mg/kg‐day 7.30E+01 1/(mg/kg‐day) 7.70E‐05 ND mg/kg Benzo(a)pyrene (2‐6)* 1.10E+02 mg/kg 2.10E‐06 mg/kg‐day 2.20E+01 1/(mg/kg‐day) 4.60E‐05 ND mg/kg Benzo(b)fluoranthene (0‐2)* 1.10E+02 mg/kg 1.10E‐06 mg/kg‐day 7.30E+00 1/(mg/kg‐day) 8.10E‐06 3.37E+00 mg/kg 2.48E‐07 Benzo(b)fluoranthene (2‐6)* 1.10E+02 mg/kg 2.20E‐06 mg/kg‐day 2.20E+00 1/(mg/kg‐day) 4.90E‐06 3.37E+00 mg/kg 1.50E‐07 Benzo(k)fluoranthene (0‐2)* 6.50E+01 mg/kg 6.40E‐07 mg/kg‐day 7.30E‐01 1/(mg/kg‐day) 4.70E‐07 8.90E‐01 mg/kg 6.44E‐09 Benzo(k)fluoranthene (2‐6)* 6.50E+01 mg/kg 1.30E‐06 mg/kg‐day 2.20E‐01 1/(mg/kg‐day) 2.80E‐07 8.90E‐01 mg/kg 3.83E‐09 Bis(2‐ethylhexyl) phthalate 3.30E+01 mg/kg 7.60E‐07 mg/kg‐day 1.40E‐02 1/(mg/kg‐day) 1.10E‐08 1.07E+02 mg/kg 3.58E‐08 Chrysene (0‐2)* 2.50E+02 mg/kg 2.50E‐06 mg/kg‐day 7.30E‐02 1/(mg/kg‐day) 1.80E‐07 2.18E+00 mg/kg 1.57E‐09 Chrysene (2‐6)* 2.50E+02 mg/kg 5.00E‐06 mg/kg‐day 2.20E‐02 1/(mg/kg‐day) 1.10E‐07 2.18E+00 mg/kg 9.59E‐10 Dibenz(a,h)anthracene (0‐2)* 6.20E+00 mg/kg 6.10E‐08 mg/kg‐day 7.30E+01 1/(mg/kg‐day) 4.50E‐06 2.18E+00 mg/kg 1.58E‐06 Dibenz(a,h)anthracene (2‐6)* 6.20E+00 mg/kg 1.20E‐07 mg/kg‐day 2.20E+01 1/(mg/kg‐day) 2.70E‐06 2.18E+00 mg/kg 9.49E‐07 Fluoranthene 5.00E+02 mg/kg 1.50E‐05 mg/kg‐day NA NA Indeno(1,2,3‐c,d)pyrene (0‐2)* 4.90E+01 mg/kg 4.80E‐07 mg/kg‐day 7.30E+00 1/(mg/kg‐day) 3.50E‐06 5.47E+00 mg/kg 3.91E‐07 Indeno(1,2,3‐c,d)pyrene (2‐6)* 4.90E+01 mg/kg 9.70E‐07 mg/kg‐day 2.20E+00 1/(mg/kg‐day) 2.10E‐06 5.47E+00 mg/kg 2.34E‐07 Naphthalene 3.40E+00 mg/kg 1.00E‐07 mg/kg‐day NA NA mg/kg Pyrene 5.30E+02 mg/kg 1.60E‐05 mg/kg‐day NA NA mg/kg Dioxin‐Like PCB TEQ 4.00E‐05 mg/kg 1.30E‐12 mg/kg‐day 1.60E+05 1/(mg/kg‐day) 2.00E‐07 0.00E+00 Nondioxin‐Like PCB 5.20E+00 mg/kg 1.70E‐07 mg/kg‐day 2.00E+00 1/(mg/kg‐day) 3.30E‐07 ND Total PCB 5.40E+00 mg/kg 1.70E‐07 mg/kg‐day NA NA Aluminum 1.60E+04 mg/kg 3.60E‐05 mg/kg‐day NA NA Arsenic 1.80E+01 mg/kg 1.20E‐07 mg/kg‐day 1.50E+00 1/(mg/kg‐day) 1.80E‐07 9.00E+00 mg/kg 9.00E‐08 Cadmium 9.60E+00 mg/kg 2.20E‐09 mg/kg‐day NA NA Chromium (0‐2)* 9.40E+01 mg/kg 7.10E‐08 mg/kg‐day 2.00E+02 1/(mg/kg‐day) 1.40E‐05 4.70E+01 mg/kg 7.00E‐06 Chromium (2‐6)* 9.40E+01 mg/kg 1.40E‐07 mg/kg‐day 6.00E+01 1/(mg/kg‐day) 8.50E‐06 4.70E+01 mg/kg 4.25E‐06 Cobalt 1.30E+01 mg/kg 2.90E‐08 mg/kg‐day NA NA Copper 3.50E+02 mg/kg 8.00E‐07 mg/kg‐day NA NA Iron 4.00E+04 mg/kg 9.10E‐05 mg/kg‐day NA NA Lead 1.90E+03 mg/kg 4.30E‐06 mg/kg‐day NA NA Manganese 3.10E+02 mg/kg 7.20E‐07 mg/kg‐day NA NA Vanadium 5.00E+01 mg/kg 1.10E‐07 mg/kg‐day NA NA
Exposed CSO Water ‐ Dry Weather Total 1.88E‐04 1.52E‐05Exposed CSO Water ‐ Dry Weather Total, without Cr 1.65E‐04 3.95E‐06
EPC Cancer Risk Intake/
Exposure Concentration
CSF/Unit Risk CSO Water Dry
Weather
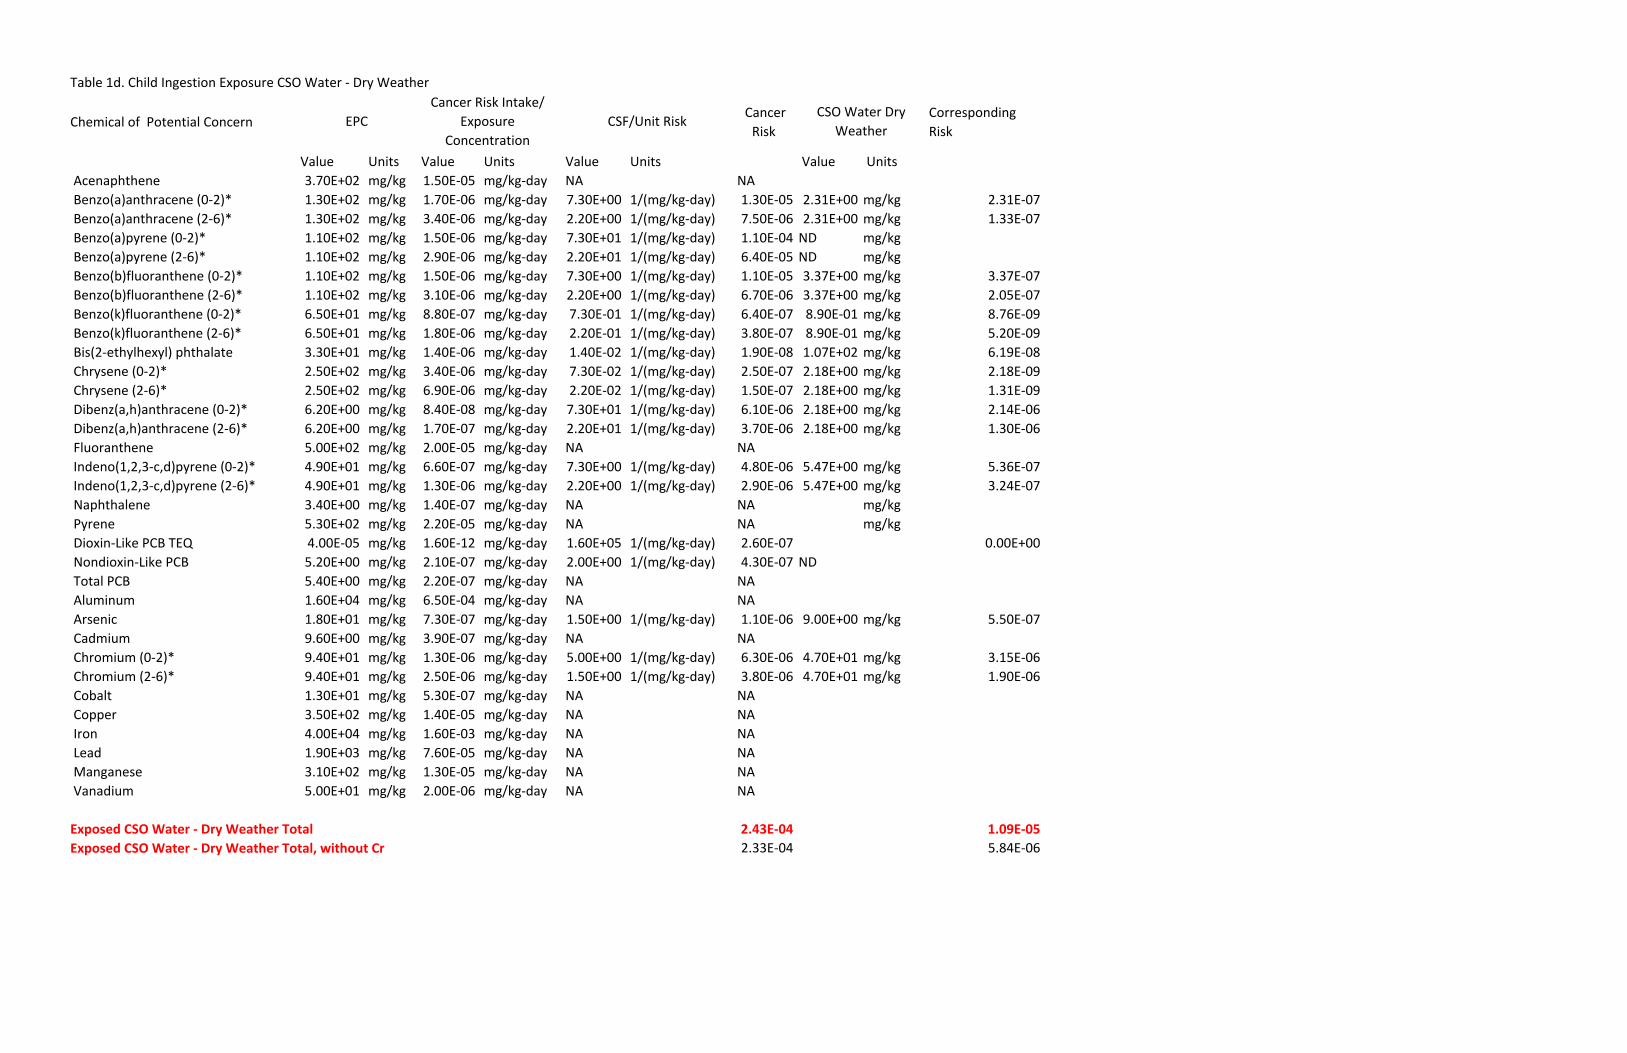
Table 1d. Child Ingestion Exposure CSO Water ‐ Dry Weather
Chemical of Potential Concern Cancer Risk
Corresponding Risk
Value Units Value Units Value Units Value Units Acenaphthene 3.70E+02 mg/kg 1.50E‐05 mg/kg‐day NA NA Benzo(a)anthracene (0‐2)* 1.30E+02 mg/kg 1.70E‐06 mg/kg‐day 7.30E+00 1/(mg/kg‐day) 1.30E‐05 2.31E+00 mg/kg 2.31E‐07 Benzo(a)anthracene (2‐6)* 1.30E+02 mg/kg 3.40E‐06 mg/kg‐day 2.20E+00 1/(mg/kg‐day) 7.50E‐06 2.31E+00 mg/kg 1.33E‐07 Benzo(a)pyrene (0‐2)* 1.10E+02 mg/kg 1.50E‐06 mg/kg‐day 7.30E+01 1/(mg/kg‐day) 1.10E‐04 ND mg/kg Benzo(a)pyrene (2‐6)* 1.10E+02 mg/kg 2.90E‐06 mg/kg‐day 2.20E+01 1/(mg/kg‐day) 6.40E‐05 ND mg/kg Benzo(b)fluoranthene (0‐2)* 1.10E+02 mg/kg 1.50E‐06 mg/kg‐day 7.30E+00 1/(mg/kg‐day) 1.10E‐05 3.37E+00 mg/kg 3.37E‐07 Benzo(b)fluoranthene (2‐6)* 1.10E+02 mg/kg 3.10E‐06 mg/kg‐day 2.20E+00 1/(mg/kg‐day) 6.70E‐06 3.37E+00 mg/kg 2.05E‐07 Benzo(k)fluoranthene (0‐2)* 6.50E+01 mg/kg 8.80E‐07 mg/kg‐day 7.30E‐01 1/(mg/kg‐day) 6.40E‐07 8.90E‐01 mg/kg 8.76E‐09 Benzo(k)fluoranthene (2‐6)* 6.50E+01 mg/kg 1.80E‐06 mg/kg‐day 2.20E‐01 1/(mg/kg‐day) 3.80E‐07 8.90E‐01 mg/kg 5.20E‐09 Bis(2‐ethylhexyl) phthalate 3.30E+01 mg/kg 1.40E‐06 mg/kg‐day 1.40E‐02 1/(mg/kg‐day) 1.90E‐08 1.07E+02 mg/kg 6.19E‐08 Chrysene (0‐2)* 2.50E+02 mg/kg 3.40E‐06 mg/kg‐day 7.30E‐02 1/(mg/kg‐day) 2.50E‐07 2.18E+00 mg/kg 2.18E‐09 Chrysene (2‐6)* 2.50E+02 mg/kg 6.90E‐06 mg/kg‐day 2.20E‐02 1/(mg/kg‐day) 1.50E‐07 2.18E+00 mg/kg 1.31E‐09 Dibenz(a,h)anthracene (0‐2)* 6.20E+00 mg/kg 8.40E‐08 mg/kg‐day 7.30E+01 1/(mg/kg‐day) 6.10E‐06 2.18E+00 mg/kg 2.14E‐06 Dibenz(a,h)anthracene (2‐6)* 6.20E+00 mg/kg 1.70E‐07 mg/kg‐day 2.20E+01 1/(mg/kg‐day) 3.70E‐06 2.18E+00 mg/kg 1.30E‐06 Fluoranthene 5.00E+02 mg/kg 2.00E‐05 mg/kg‐day NA NA Indeno(1,2,3‐c,d)pyrene (0‐2)* 4.90E+01 mg/kg 6.60E‐07 mg/kg‐day 7.30E+00 1/(mg/kg‐day) 4.80E‐06 5.47E+00 mg/kg 5.36E‐07 Indeno(1,2,3‐c,d)pyrene (2‐6)* 4.90E+01 mg/kg 1.30E‐06 mg/kg‐day 2.20E+00 1/(mg/kg‐day) 2.90E‐06 5.47E+00 mg/kg 3.24E‐07 Naphthalene 3.40E+00 mg/kg 1.40E‐07 mg/kg‐day NA NA mg/kg Pyrene 5.30E+02 mg/kg 2.20E‐05 mg/kg‐day NA NA mg/kg Dioxin‐Like PCB TEQ 4.00E‐05 mg/kg 1.60E‐12 mg/kg‐day 1.60E+05 1/(mg/kg‐day) 2.60E‐07 0.00E+00 Nondioxin‐Like PCB 5.20E+00 mg/kg 2.10E‐07 mg/kg‐day 2.00E+00 1/(mg/kg‐day) 4.30E‐07 ND Total PCB 5.40E+00 mg/kg 2.20E‐07 mg/kg‐day NA NA Aluminum 1.60E+04 mg/kg 6.50E‐04 mg/kg‐day NA NA Arsenic 1.80E+01 mg/kg 7.30E‐07 mg/kg‐day 1.50E+00 1/(mg/kg‐day) 1.10E‐06 9.00E+00 mg/kg 5.50E‐07 Cadmium 9.60E+00 mg/kg 3.90E‐07 mg/kg‐day NA NA Chromium (0‐2)* 9.40E+01 mg/kg 1.30E‐06 mg/kg‐day 5.00E+00 1/(mg/kg‐day) 6.30E‐06 4.70E+01 mg/kg 3.15E‐06 Chromium (2‐6)* 9.40E+01 mg/kg 2.50E‐06 mg/kg‐day 1.50E+00 1/(mg/kg‐day) 3.80E‐06 4.70E+01 mg/kg 1.90E‐06 Cobalt 1.30E+01 mg/kg 5.30E‐07 mg/kg‐day NA NA Copper 3.50E+02 mg/kg 1.40E‐05 mg/kg‐day NA NA Iron 4.00E+04 mg/kg 1.60E‐03 mg/kg‐day NA NA Lead 1.90E+03 mg/kg 7.60E‐05 mg/kg‐day NA NA Manganese 3.10E+02 mg/kg 1.30E‐05 mg/kg‐day NA NA Vanadium 5.00E+01 mg/kg 2.00E‐06 mg/kg‐day NA NA
Exposed CSO Water ‐ Dry Weather Total 2.43E‐04 1.09E‐05Exposed CSO Water ‐ Dry Weather Total, without Cr 2.33E‐04 5.84E‐06
EPC Cancer Risk Intake/
Exposure Concentration
CSF/Unit Risk CSO Water Dry
Weather

Table 1e. Child Dermal Exposure CSO Water ‐ Wet Weather
Chemical of Potential Concern Cancer Risk
Corresponding Risk
Value Units Value Units Value Units Value Units Acenaphthene 3.70E+02 mg/kg 1.10E‐05 mg/kg‐day NA NA Benzo(a)anthracene (0‐2)* 1.30E+02 mg/kg 1.30E‐06 mg/kg‐day 7.30E+00 1/(mg/kg‐day) 9.20E‐06 3.44E+00 mg/kg 2.43E‐07 Benzo(a)anthracene (2‐6)* 1.30E+02 mg/kg 2.50E‐06 mg/kg‐day 2.20E+00 1/(mg/kg‐day) 5.50E‐06 3.44E+00 mg/kg 1.46E‐07 Benzo(a)pyrene (0‐2)* 1.10E+02 mg/kg 1.10E‐06 mg/kg‐day 7.30E+01 1/(mg/kg‐day) 7.70E‐05 5.05E+00 mg/kg 3.54E‐06 Benzo(a)pyrene (2‐6)* 1.10E+02 mg/kg 2.10E‐06 mg/kg‐day 2.20E+01 1/(mg/kg‐day) 4.60E‐05 5.05E+00 mg/kg 2.11E‐06 Benzo(b)fluoranthene (0‐2)* 1.10E+02 mg/kg 1.10E‐06 mg/kg‐day 7.30E+00 1/(mg/kg‐day) 8.10E‐06 7.53E+00 mg/kg 5.54E‐07 Benzo(b)fluoranthene (2‐6)* 1.10E+02 mg/kg 2.20E‐06 mg/kg‐day 2.20E+00 1/(mg/kg‐day) 4.90E‐06 7.53E+00 mg/kg 3.35E‐07 Benzo(k)fluoranthene (0‐2)* 6.50E+01 mg/kg 6.40E‐07 mg/kg‐day 7.30E‐01 1/(mg/kg‐day) 4.70E‐07 4.05E+00 mg/kg 2.93E‐08 Benzo(k)fluoranthene (2‐6)* 6.50E+01 mg/kg 1.30E‐06 mg/kg‐day 2.20E‐01 1/(mg/kg‐day) 2.80E‐07 4.05E+00 mg/kg 1.74E‐08 Bis(2‐ethylhexyl) phthalate 3.30E+01 mg/kg 7.60E‐07 mg/kg‐day 1.40E‐02 1/(mg/kg‐day) 1.10E‐08 3.89E+02 mg/kg 1.30E‐07 Chrysene (0‐2)* 2.50E+02 mg/kg 2.50E‐06 mg/kg‐day 7.30E‐02 1/(mg/kg‐day) 1.80E‐07 4.17E+00 mg/kg 3.00E‐09 Chrysene (2‐6)* 2.50E+02 mg/kg 5.00E‐06 mg/kg‐day 2.20E‐02 1/(mg/kg‐day) 1.10E‐07 4.17E+00 mg/kg 1.83E‐09 Dibenz(a,h)anthracene (0‐2)* 6.20E+00 mg/kg 6.10E‐08 mg/kg‐day 7.30E+01 1/(mg/kg‐day) 4.50E‐06 4.07E+00 mg/kg 2.95E‐06 Dibenz(a,h)anthracene (2‐6)* 6.20E+00 mg/kg 1.20E‐07 mg/kg‐day 2.20E+01 1/(mg/kg‐day) 2.70E‐06 4.07E+00 mg/kg 1.77E‐06 Fluoranthene 5.00E+02 mg/kg 1.50E‐05 mg/kg‐day NA NA Indeno(1,2,3‐c,d)pyrene (0‐2)* 4.90E+01 mg/kg 4.80E‐07 mg/kg‐day 7.30E+00 1/(mg/kg‐day) 3.50E‐06 1.31E+01 mg/kg 9.39E‐07 Indeno(1,2,3‐c,d)pyrene (2‐6)* 4.90E+01 mg/kg 9.70E‐07 mg/kg‐day 2.20E+00 1/(mg/kg‐day) 2.10E‐06 1.31E+01 mg/kg 5.63E‐07 Naphthalene 3.40E+00 mg/kg 1.00E‐07 mg/kg‐day NA NA mg/kg Pyrene 5.30E+02 mg/kg 1.60E‐05 mg/kg‐day NA NA mg/kg Dioxin‐Like PCB TEQ 4.00E‐05 mg/kg 1.30E‐12 mg/kg‐day 1.60E+05 1/(mg/kg‐day) 2.00E‐07 0.00E+00 Nondioxin‐Like PCB 5.20E+00 mg/kg 1.70E‐07 mg/kg‐day 2.00E+00 1/(mg/kg‐day) 3.30E‐07 4.32E+00 2.74E‐07 Total PCB 5.40E+00 mg/kg 1.70E‐07 mg/kg‐day NA NA Aluminum 1.60E+04 mg/kg 3.60E‐05 mg/kg‐day NA NA Arsenic 1.80E+01 mg/kg 1.20E‐07 mg/kg‐day 1.50E+00 1/(mg/kg‐day) 1.80E‐07 1.22E+01 mg/kg 1.22E‐07 Cadmium 9.60E+00 mg/kg 2.20E‐09 mg/kg‐day NA NA Chromium (0‐2)* 9.40E+01 mg/kg 7.10E‐08 mg/kg‐day 2.00E+02 1/(mg/kg‐day) 1.40E‐05 5.11E+01 mg/kg 7.61E‐06 Chromium (2‐6)* 9.40E+01 mg/kg 1.40E‐07 mg/kg‐day 6.00E+01 1/(mg/kg‐day) 8.50E‐06 5.11E+01 mg/kg 4.62E‐06 Cobalt 1.30E+01 mg/kg 2.90E‐08 mg/kg‐day NA NA Copper 3.50E+02 mg/kg 8.00E‐07 mg/kg‐day NA NA Iron 4.00E+04 mg/kg 9.10E‐05 mg/kg‐day NA NA Lead 1.90E+03 mg/kg 4.30E‐06 mg/kg‐day NA NA Manganese 3.10E+02 mg/kg 7.20E‐07 mg/kg‐day NA NA Vanadium 5.00E+01 mg/kg 1.10E‐07 mg/kg‐day NA NA
Exposed CSO Water ‐ Wet Weather Total 1.88E‐04 2.60E‐05Exposed CSO Water ‐ Wet Weather Total, without Cr 1.65E‐04 1.37E‐05
EPC Cancer Risk Intake/
Exposure Concentration CSF/Unit Risk
CSO Water Wet Weather

Table 1f. Child Ingestion Exposure CSO Water ‐ Wet Weather
Chemical of Potential Concern Cancer Risk
Corresponding Risk
Value Units Value Units Value Units Value Units Acenaphthene 3.70E+02 mg/kg 1.50E‐05 mg/kg‐day NA NA Benzo(a)anthracene (0‐2)* 1.30E+02 mg/kg 1.70E‐06 mg/kg‐day 7.30E+00 1/(mg/kg‐day) 1.30E‐05 3.44E+00 mg/kg 3.44E‐07 Benzo(a)anthracene (2‐6)* 1.30E+02 mg/kg 3.40E‐06 mg/kg‐day 2.20E+00 1/(mg/kg‐day) 7.50E‐06 3.44E+00 mg/kg 1.98E‐07 Benzo(a)pyrene (0‐2)* 1.10E+02 mg/kg 1.50E‐06 mg/kg‐day 7.30E+01 1/(mg/kg‐day) 1.10E‐04 5.05E+00 mg/kg 5.05E‐06 Benzo(a)pyrene (2‐6)* 1.10E+02 mg/kg 2.90E‐06 mg/kg‐day 2.20E+01 1/(mg/kg‐day) 6.40E‐05 5.05E+00 mg/kg 2.94E‐06 Benzo(b)fluoranthene (0‐2)* 1.10E+02 mg/kg 1.50E‐06 mg/kg‐day 7.30E+00 1/(mg/kg‐day) 1.10E‐05 7.53E+00 mg/kg 7.53E‐07 Benzo(b)fluoranthene (2‐6)* 1.10E+02 mg/kg 3.10E‐06 mg/kg‐day 2.20E+00 1/(mg/kg‐day) 6.70E‐06 7.53E+00 mg/kg 4.59E‐07 Benzo(k)fluoranthene (0‐2)* 6.50E+01 mg/kg 8.80E‐07 mg/kg‐day 7.30E‐01 1/(mg/kg‐day) 6.40E‐07 4.05E+00 mg/kg 3.99E‐08 Benzo(k)fluoranthene (2‐6)* 6.50E+01 mg/kg 1.80E‐06 mg/kg‐day 2.20E‐01 1/(mg/kg‐day) 3.80E‐07 4.05E+00 mg/kg 2.37E‐08 Bis(2‐ethylhexyl) phthalate 3.30E+01 mg/kg 1.40E‐06 mg/kg‐day 1.40E‐02 1/(mg/kg‐day) 1.90E‐08 3.89E+02 mg/kg 2.24E‐07 Chrysene (0‐2)* 2.50E+02 mg/kg 3.40E‐06 mg/kg‐day 7.30E‐02 1/(mg/kg‐day) 2.50E‐07 4.17E+00 mg/kg 4.17E‐09 Chrysene (2‐6)* 2.50E+02 mg/kg 6.90E‐06 mg/kg‐day 2.20E‐02 1/(mg/kg‐day) 1.50E‐07 4.17E+00 mg/kg 2.50E‐09 Dibenz(a,h)anthracene (0‐2)* 6.20E+00 mg/kg 8.40E‐08 mg/kg‐day 7.30E+01 1/(mg/kg‐day) 6.10E‐06 4.07E+00 mg/kg 4.00E‐06 Dibenz(a,h)anthracene (2‐6)* 6.20E+00 mg/kg 1.70E‐07 mg/kg‐day 2.20E+01 1/(mg/kg‐day) 3.70E‐06 4.07E+00 mg/kg 2.43E‐06 Fluoranthene 5.00E+02 mg/kg 2.00E‐05 mg/kg‐day NA NA Indeno(1,2,3‐c,d)pyrene (0‐2)* 4.90E+01 mg/kg 6.60E‐07 mg/kg‐day 7.30E+00 1/(mg/kg‐day) 4.80E‐06 1.31E+01 mg/kg 1.29E‐06 Indeno(1,2,3‐c,d)pyrene (2‐6)* 4.90E+01 mg/kg 1.30E‐06 mg/kg‐day 2.20E+00 1/(mg/kg‐day) 2.90E‐06 1.31E+01 mg/kg 7.78E‐07 Naphthalene 3.40E+00 mg/kg 1.40E‐07 mg/kg‐day NA NA mg/kg Pyrene 5.30E+02 mg/kg 2.20E‐05 mg/kg‐day NA NA mg/kg Dioxin‐Like PCB TEQ 4.00E‐05 mg/kg 1.60E‐12 mg/kg‐day 1.60E+05 1/(mg/kg‐day) 2.60E‐07 0.00E+00 Nondioxin‐Like PCB 5.20E+00 mg/kg 2.10E‐07 mg/kg‐day 2.00E+00 1/(mg/kg‐day) 4.30E‐07 4.32E+00 3.57E‐07 Total PCB 5.40E+00 mg/kg 2.20E‐07 mg/kg‐day NA NA Aluminum 1.60E+04 mg/kg 6.50E‐04 mg/kg‐day NA NA Arsenic 1.80E+01 mg/kg 7.30E‐07 mg/kg‐day 1.50E+00 1/(mg/kg‐day) 1.10E‐06 1.22E+01 mg/kg 7.47E‐07 Cadmium 9.60E+00 mg/kg 3.90E‐07 mg/kg‐day NA NA Chromium (0‐2)* 9.40E+01 mg/kg 1.30E‐06 mg/kg‐day 5.00E+00 1/(mg/kg‐day) 6.30E‐06 5.11E+01 mg/kg 3.42E‐06 Chromium (2‐6)* 9.40E+01 mg/kg 2.50E‐06 mg/kg‐day 1.50E+00 1/(mg/kg‐day) 3.80E‐06 5.11E+01 mg/kg 2.07E‐06 Cobalt 1.30E+01 mg/kg 5.30E‐07 mg/kg‐day NA NA Copper 3.50E+02 mg/kg 1.40E‐05 mg/kg‐day NA NA Iron 4.00E+04 mg/kg 1.60E‐03 mg/kg‐day NA NA Lead 1.90E+03 mg/kg 7.60E‐05 mg/kg‐day NA NA Manganese 3.10E+02 mg/kg 1.30E‐05 mg/kg‐day NA NA Vanadium 5.00E+01 mg/kg 2.00E‐06 mg/kg‐day NA NA
Exposed CSO Water ‐ Wet Weather Total 2.43E‐04 2.51E‐05Exposed CSO Water ‐ Wet Weather Total, without Cr 2.33E‐04 1.96E‐05
EPC Cancer Risk Intake/
Exposure Concentration CSF/Unit Risk
CSO Water Wet Weather
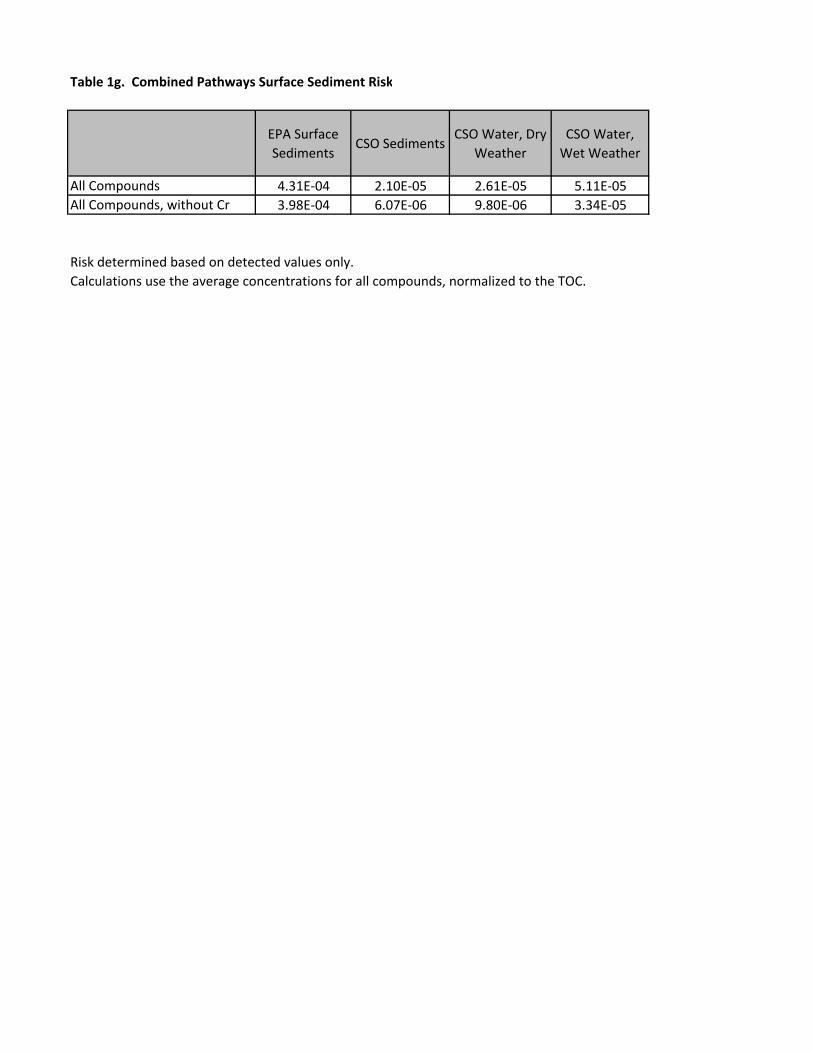
Table 1g. Combined Pathways Surface Sediment Risk
EPA Surface Sediments
CSO SedimentsCSO Water, Dry
WeatherCSO Water, Wet Weather
All Compounds 4.31E‐04 2.10E‐05 2.61E‐05 5.11E‐05All Compounds, without Cr 3.98E‐04 6.07E‐06 9.80E‐06 3.34E‐05
Risk determined based on detected values only. Calculations use the average concentrations for all compounds, normalized to the TOC.

Page 1
Table 2. High Priority Upland Sites That Require Further Characterization
Site No.
Site Name Former Use/Suspected
Contaminants Address Proximity to EPA RI Monitoring Well Network
1 Adams Fuel Corp./Adams Petroleum Corp.
Former chemical manufacturer; petroleum, coal, and kerosene storage
38 2nd Avenue One monitoring well (MW‐24) is located on the northeastern (downgradient) border of the Site.
2 American Agricultural Chemical Co./DuPont
Fertilizer manufacturer, metalworking; metals, coal tar, and petroleum use/storage
217 Huntington Street No monitoring wells on the Site. One monitoring well (MW‐10) is located on the adjacent (cross‐gradient) property to the southwest.
3 American Can/Rio Tinto Petroleum, solvents, paint, metals use/storage
232‐250 3rd St. No monitoring wells on the Site. One monitoring well (MW‐39) is located on the adjacent (cross‐/downgradient) property to the southwest.
4 Argus Chemical Corp./Witco Chemical Corp./Chemtura Corp.
Ironworks, blacksmith, chemical manufacturer; gasoline, metals, VOCs, and SVOCs storage
706 Court Street No monitoring wells on the Site. One monitoring well (MW‐16) is located on the southwestern boundary of the Site and one monitoring well (MW‐41) is located on the adjacent (cross‐/downgradient) property to the east.
5 Barrett Company/Allied Chemical & Dye/Honeywell
Shipyard, machine shop; coal tar, petroleum use/storage
592‐608, 610–628, and 627–641 Smith Street
One monitoring well (MW‐13) is located in the southeastern (downgradient) corner of the Site. Two monitoring wells (MW‐41 and MW‐40) are located on the adjacent (cross‐/downgradient) property to the southwest and one monitoring well (MW‐14) is located on the adjacent (downgradient) property to the east.
6 Burns Brothers/Rapid American
Coal yard, fuel oil storage 267‐285 Bond Street One monitoring well (MW‐4) is located in the southwestern (cross‐gradient) corner of the Site and one monitoring well (MW‐34) is located in the southeastern (downgradient) corner of the Site.
7 Burns Brothers Inc. Coal Yard
Saw mill, wagon/auto repair, coal yard
148 Third Street No monitoring wells on the Site. Two monitoring wells (MW‐7 and MW‐8) are located on the adjacent (cross‐/downgradient) property to the east.
8 Cirillo Brothers Coal & Fuel Corp./Cibro Petroleum
Former glassworks; fuel oil, gasoline, and coal storage
537 Smith Street No monitoring wells on the Site. One monitoring well (MW‐11) is located on the adjacent (cross‐gradient) property to the northeast.
9 Consolidated Edison Third Avenue Yard
Blacksmith, maintenance shop; gasoline storage
222 First Street No monitoring wells on the Site or on adjacent properties.
10 Debevoise Co./Seagrave Coatings Co.
Ink and paint manufacturer; solvents and metal pigments use
74 20th Street No monitoring wells on the Site or on adjacent properties.
11 Devoe & Reynolds Inc. Paint Works
Former fuel oil storage, chemical manufacturer, paint manufacturer (solvents and metal pigments), retail gasoline station
381 Smith Street
No monitoring wells on the Site or on adjacent properties.
12 Greason Son & Dazell Inc. /Pittson Co.
Fuel oil and solvent storage 150‐154 3rd Street Two monitoring wells (MW‐7 and MW‐8) are located on the western (upgradient) border of the Site. Refer also to Site No. 19.
13 Howard Fuel Corp. Former blacksmith; fuel oil, gasoline and coal storage
107 6th Street One monitoring well (MW‐23) is located on the central portion of the Site.
14 Ira S. Bushey & Sons/Amerada Hess Corporation
Former saw mill, shipyard, machine shop; fuel oil, paints, metals use/storage
764 Court Street One monitoring well (MW‐15) is located on the southeastern (downgradient) border of the Site and one monitoring well (MW‐16) is located on the northeastern (upgradient) border of the Site.
15 Koppers Company/Beazer Materials
Petroleum, gasoline, and coal storage
300‐326 Nevins Street Two monitoring wells (MW‐28 and MW‐35) are located on the western (downgradient) border of the Site and one monitoring well (MW‐29) is located on the southern (cross‐gradient) border of the Site.
16 Mobil Service Station/Exxon Mobil
Former paint manufacturer (solvents and metal pigments) and retail gasoline station
375 Hamilton Avenue No monitoring wells on the Site or on adjacent properties.

Page 2
Table 2. High Priority Upland Sites That Require Further Characterization
Site No.
Site Name Former Use/Suspected
Contaminants Address Proximity to EPA RI Monitoring Well Network
17
New York Tartar/Standard Brands/Nabisco/Stauffer Chemical/Cheesborough/ Unilever Ltd.
Former chemical manufacturer (metals, petroleum, acids use); fuel oil and coal storage
59 9th Street
Two monitoring wells (MW‐21 and MW‐42) are located on the eastern (upgradient) border of the Site and one monitoring well (MW‐20) is located on the western (downgradient) border of the Site.
18 Pure Oil Co./ Preferred Oil Co. /Unocal/Chevron Texaco
Fuel oil storage and auto salvage yard
400 Carroll Street Two monitoring wells (MW‐36 and MW‐43) are located on the southeastern (downgradient) border of the Site.
19 Pure Oil Co./Unocal/Chevron Texaco
Fuel oil storage and motor freight facility
150‐154 3rd Street Two monitoring wells (MW‐7 and MW‐8) are located on the western (upgradient) border of the Site. Refer also to Site No. 12.
20 Pure Oil Co./Unocal/Chevron Texaco
Fuel oil storage, blacksmith, auto repair and salvage
200‐210 3rd Street One monitoring well (MW‐38) is located on the southern (downgradient) border of the Site.
21 Standard Oil Co./Vesta Oil Works/Exxon Mobil
Machine shop; petroleum, kerosene and naphthalene storage
365 Bond Street One monitoring well (MW‐6) is located on the central portion of the Site and one monitoring well (MW‐5) is located on the eastern (downgradient) portion of the Site.
22 Supreme Oil Terminal/Bayside Fuel Oil Depot Corp.
Former coal yard, auto repair and salvage; fuel oil and gasoline storage
510 Sackett Street One monitoring well (MW‐3) is located in the northeastern (downgradient) corner of the Site.
23 Texas Company/Chevron Texaco
Machine shop; fuel oil storage 744 Clinton Street No monitoring wells on the Site or on adjacent properties.
24 Thompson & Co. Coal Yard/Donald & Co. Oil Storage
Electric power generation (PCB dielectric fluid), repair shop (solvents), retail fuel sales, fuel oil and coal storage
503 Smith Street
One monitoring well (MW‐12) is located on the central portion of the Site and one monitoring well (MW‐11) is located on the southeastern (downgradient) portion of the Site.
25 Thos Paulson & Son, Inc. Foundry (metals, cutting oils); fuel oil and coal storage
307‐325 Bond Street No monitoring wells on the Site or on adjacent properties.
26 Vidan Auto Salvage Auto garage, truck repair, junkyard; gasoline and coal storage
327 Bond Street No monitoring wells on the Site or on adjacent properties.

Table 3. Gowanus Canal SPDES Permit Summary
Facility SPDES Permit No. Parameter Limit UnitsPotential Load
(kg/day) CommentsNY 0110001 Oil & Grease 15 mg/L Unknown Outfall 001 Storm Water Runoff, Loading Rack Washwater and Boiler Blowdown
Settleable Solids 0.1 ml/L Unknown Outfall 001 Storm Water Runoff, Loading Rack Washwater and Boiler BlowdownFoaming Agents 20 mg/L Unknown Outfall 001 Storm Water Runoff, Loading Rack Washwater and Boiler BlowdownBenzene 0.1 mg/L Unknown Outfall 001 Storm Water Runoff, Loading Rack Washwater and Boiler BlowdownToluene 0.1 mg/L Unknown Outfall 001 Storm Water Runoff, Loading Rack Washwater and Boiler BlowdownTotal Xylenes 0.1 mg/L Unknown Outfall 001 Storm Water Runoff, Loading Rack Washwater and Boiler BlowdownEthylbenzene 0.1 mg/L Unknown Outfall 001 Storm Water Runoff, Loading Rack Washwater and Boiler BlowdownFlow Monitor GPD NA Outfall 001 Storm Water Runoff, Loading Rack Washwater and Boiler Blowdown
NY 0110001 Oil & Grease 15 mg/L Unknown Outfall 01A ‐ Hydrostatic Tank Test Water DischargeTSS 0.02 mg/L Unknown Outfall 01A ‐ Hydrostatic Tank Test Water DischargeBenzene 0.02 mg/L Unknown Outfall 01A ‐ Hydrostatic Tank Test Water DischargeToluene 0.02 mg/L Unknown Outfall 01A ‐ Hydrostatic Tank Test Water DischargeTotal Xylenes 0.02 mg/L Unknown Outfall 01A ‐ Hydrostatic Tank Test Water DischargeEthylbenzene 0.02 mg/L Unknown Outfall 01A ‐ Hydrostatic Tank Test Water DischargeFlow Monitor GPD NA Outfall 01A ‐ Hydrostatic Tank Test Water Discharge
NY 0110001 Oil & Grease 15 mg/L Unknown Outfall 002 Storm Water from Secondary Containment AreasTSS 50 mg/L Unknown Outfall 002 Storm Water from Secondary Containment AreasBenzene 0.1 mg/L Unknown Outfall 002 Storm Water from Secondary Containment AreasToluene 0.1 mg/L Unknown Outfall 002 Storm Water from Secondary Containment AreasTotal Xylenes 0.1 mg/L Unknown Outfall 002 Storm Water from Secondary Containment AreasEthylbenzene 0.1 mg/L Unknown Outfall 002 Storm Water from Secondary Containment AreasNaphthalene 0.1 mg/L Unknown Outfall 002 Storm Water from Secondary Containment AreasFlow Monitor GPD NA Outfall 002 Storm Water from Secondary Containment Areas
NY 002 8606 Oil & Grease 15 mg/L 5.68 Outfall 001 Storm Water runoff from PBS secondary containment areasBenzene 100 ug/L 0.04 Outfall 001 Storm Water runoff from PBS secondary containment areasEthylbenzene 100 ug/L 0.04 Outfall 001 Storm Water runoff from PBS secondary containment areasNaphthalene 100 ug/L 0.04 Outfall 001 Storm Water runoff from PBS secondary containment areasToluene 100 ug/L 0.04 Outfall 001 Storm Water runoff from PBS secondary containment areasTotal Xylenes 100 ug/L 0.04 Outfall 001 Storm Water runoff from PBS secondary containment areasFlow (Daily Max) 100000 GPD NA Outfall 001 Storm Water runoff from PBS secondary containment areasSettleable Solids 0.1 ml/L 37.9 Outfall 001 Storm Water runoff from PBS secondary containment areas
Bayside Fuel Oil Depot Corp.537 Smith StreetBrooklyn, NY
Hess Corporation ‐ Brooklyn Terminal(Gowanus Bay)722 Court StreetBrooklyn, NY

Table 3. Gowanus Canal SPDES Permit Summary
Facility SPDES Permit No. Parameter Limit UnitsPotential Load
(kg/day) Comments
NY 0201006 Flow Monitor GPD NA Outfall 001 Storm Water from GT Barge No. 1Oil & Grease 15 mg/L 0.20 Outfall 001 Storm Water from GT Barge No. 1Benzene 0.1 mg/L 0.00136 Outfall 001 Storm Water from GT Barge No. 1Toluene 0.1 mg/L 0.00136 Outfall 001 Storm Water from GT Barge No. 1Total Xylenes 0.1 mg/L 0.00136 Outfall 001 Storm Water from GT Barge No. 1Ethylbenzene 0.1 mg/L 0.00136 Outfall 001 Storm Water from GT Barge No. 1
NY 0201006 Flow Monitor GPD NA Outfall 002 Storm Water from GT Barge No. 2Oil & Grease 15 mg/L 0.20 Outfall 002 Storm Water from GT Barge No. 2Benzene 0.1 mg/L 0.00136 Outfall 002 Storm Water from GT Barge No. 2Toluene 0.1 mg/L 0.00136 Outfall 002 Storm Water from GT Barge No. 2Total Xylenes 0.1 mg/L 0.00136 Outfall 002 Storm Water from GT Barge No. 2Ethylbenzene 0.1 mg/L 0.00136 Outfall 002 Storm Water from GT Barge No. 2
NY 0201006 Flow Monitor GPD NA Outfall 003 Storm Water from GT Barge No. 3Oil & Grease 15 mg/L 0.20 Outfall 003 Storm Water from GT Barge No. 3Benzene 0.1 mg/L 0.00136 Outfall 003 Storm Water from GT Barge No. 3Toluene 0.1 mg/L 0.00136 Outfall 003 Storm Water from GT Barge No. 3Total Xylenes 0.1 mg/L 0.00136 Outfall 003 Storm Water from GT Barge No. 3Ethylbenzene 0.1 mg/L 0.00136 Outfall 003 Storm Water from GT Barge No. 3
NY 0201006 Flow Monitor GPD NA Outfall 004 Storm Water from GT Barge No. 4Oil & Grease 15 mg/L 0.20 Outfall 004 Storm Water from GT Barge No. 4Benzene 0.1 mg/L 0.00136 Outfall 004 Storm Water from GT Barge No. 4Toluene 0.1 mg/L 0.00136 Outfall 004 Storm Water from GT Barge No. 4Total Xylenes 0.1 mg/L 0.00136 Outfall 004 Storm Water from GT Barge No. 4Ethylbenzene 0.1 mg/L 0.00136 Outfall 004 Storm Water from GT Barge No. 4
020 1391 Flow Monitor MGD NA Outfall 001 Construction Water (650 GPM discharge shown on hand sketch)TSS 50 mg/L 177.14 Outfall 001 Construction Water (650 GPM discharge shown on hand sketch)BOD5 50 mg/L 177.14 Outfall 001 Construction Water (650 GPM discharge shown on hand sketch)Oil & Grease 15 mg/L 53.14 Outfall 001 Construction Water (650 GPM discharge shown on hand sketch)Cadmium 0.3 mg/L 1.063 Outfall 001 Construction Water (650 GPM discharge shown on hand sketch)Mercury 0.0008 mg/L 0.0028 Outfall 001 Construction Water (650 GPM discharge shown on hand sketch)Lead 0.5 mg/L 1.77 Outfall 001 Construction Water (650 GPM discharge shown on hand sketch)Chromium 0.1 mg/L 0.35 Outfall 001 Construction Water (650 GPM discharge shown on hand sketch)Zinc 0.95 mg/L 3.37 Outfall 001 Construction Water (650 GPM discharge shown on hand sketch)Nickel 0.74 mg/L 2.62 Outfall 001 Construction Water (650 GPM discharge shown on hand sketch)
New York Power(Gowanus Bay)NYPA 23rd Street Generation Site730 3rd AvenueBrooklyn, NY
Gowanus Gas Turbine SiteAverage Flow 3600 GPD per outfall (4 outfalls)(Gowanus Bay)27th Street and Third AvenueBrooklyn, NY

Parameter
Range of Detected
Concentrations in EPA CSO Sediment
Samples (ug/kg)
NYSDEC Residential Use Soil Cleanup Objectives (ug/kg)
NYSDEC Restricted Residential Soil Cleanup Objectives for Protection of Public Health
(ug/kg)
NYSDEC Commercial Soil Cleanup Objectives (ug/kg)
NYSDEC Industrial Soil
Cleanup Objectives (ug/kg)
NYSDEC Restricted Soil
Cleanup Objectives for Protection of Groundwater
(ug/kg)
NYSDEC Rural Soil Background Concentrations
(RSBC) (ug/kg)
2‐methylnaphthalene 430‐2,600 na na na na na na4‐methylphenol 3,200 34,000 100,000 500,000 1,000,000 3,300 naAcenapthene 310‐1,700 100,000 100,000 500,000 1,000,000 98,000 naAnthracene 310‐580 100,000 100,000 500,000 1,000,000 1,000,000 naBenzo(a)anthracene 110‐1,300 1,000 1,000 5,600 11,000 1,000 1,000Benzo(a)pyrene 490‐1,300 1,000 1,000 1,000 1,100 22,000 1,000Benzo(b)fluoranthene 230‐4,500 1,000 1,000 5,600 11,000 1,700 1,000Benzo(g,h,i)perylene 130‐960 100,000 100,000 500,000 1,000,000 1,000,000 naBenzo(k)flouranthene 170‐1,500 1,000 3,900 56,000 110,000 1,700 800
Bis(2‐ethylhexyl) phthalate 1,200‐22,000 na na na na na naChrysene 140‐1,300 1,000 3,900 56,000 110,000 1,000 1,000Dibenz(a,h)anthracene 110‐530 330 330 560 1,100 1,000,000 100Fluoranthene 170‐2,500 100,000 100,000 500,000 1,000,000 1,000,000 naFluorene 140‐910 100,000 100,000 500,000 1,000,000 386,000 naIndeno(1,2,3‐cd) pyrene 190‐1,800 500 500 5,600 11,000 8,200 500Naphthalene 110‐2,400 100,000 100,000 500,000 1,000,000 12,000 naPhenanthrene 370‐1,700 100,000 100,000 500,000 1,000,000 1,000,000 naPyrene 160‐2,200 100,000 100,000 500,000 1,000,000 1,000,000 na
NOTES:
Table 4. Comparison of Detected SVOC Concentrations in Dry Weather CSO Sediments to NYSDEC Soil Cleanup Objectives (SCO) and Background Concentrations
1. Sediment sample data from Table 4‐I2, CSO Outfalls ‐ Sediments ‐ Statistical Summary , Draft Gowanus Canal Remedial Investigation, EPA.
2. Soil Cleanup Objectives from 6NYCRR Part 375 (December 2006) and NYSDEC Soil Cleanup Guidance (October 2010).
3. RSBC from NYS Brownfield Cleanup Program, Development of Soil Cleanup Objectives (September 2006).

GOWANUS CANAL SUPERFUND SITE
Review of Baseline Human Health Risk Assessment and Combined Baseline and Screening Level Ecological Risk Assessments April 2011
Prepared For: Louis Berger 199 Water Street, 23rd Floor New York, NY 10038
Prepared By: The Science Collaborative

Review of Draft Baseline Ecological and Human Health Risk Assessments, Gowanus Canal Superfund Site
1
TABLE OF CONTENTS 1.0 SCOPE OF REVIEW ..................................................................................................................................... 2
2.0 SCREENING LEVEL AND BASELINE ECOLOGICAL RISK ASSESSMENTS ........................................................... 2
2.1 GENERAL COMMENTS ........................................................................................................................................... 2 2.2 SPECIFIC COMMENTS ............................................................................................................................................ 3 2.3 GENERAL COMMENT REGARDING ECOLOGICAL RISK CONCLUSIONS ................................................................................ 6
3.0 BASELINE HUMAN HEALTH RISK ASSESSMENT ........................................................................................... 6
3.1 GENERAL COMMENTS ........................................................................................................................................... 6 3.2 SPECIFIC COMMENTS ............................................................................................................................................ 7 3.3 GENERAL COMMENT REGARDING HUMAN HEALTH RISK CONCLUSIONS ........................................................................ 16
4.0 REFERENCES ............................................................................................................................................. 16
Review of Draft Baseline Ecological and Human Health Risk Assessments, Gowanus Canal Superfund Site
2
1.0 SCOPE OF REVIEW The Science Collaborative conducted a technical review of Appendix K (Combined Baseline and Screening Level Ecological Risk Assessments) and Appendix L (Human Health Risk Assessment) in the Draft Gowanus Canal Remedial Investigation Report Volume I, dated January 2011. The risk assessments were checked for general compliance with applicable U.S. Environmental Protection Agency (USEPA) guidance. Details of the assessments were checked with respect to formulation of the site conceptual model, adequacy of chemical concentration data for evaluating risk, calculation of exposure point concentrations (EPCs), selection of exposure assumptions in light of site-specific conditions, selection of reference and toxicity values (e.g., ERLs, RfDs), and calculation of risks. This report details the resulting questions, points of clarification, and suggestions for the USEPA.
2.0 SCREENING LEVEL AND BASELINE ECOLOGICAL RISK ASSESSMENTS This section provides a technical review of the Draft Gowanus Canal Remedial Investigation Report Volume I, January 2011, Appendix K, Combined Baseline and Screening Level Ecological Risk Assessments, Gowanus Canal.
2.1 General Comments
The ecological risk assessment generally follows USEPA Guidance (USEPA 1997a) in the format and requirements of an ecological risk assessment for a Superfund site. The screening level ecological risk assessment (SLERA), Appendix K, describes assessment endpoints and associated measures of effect in anticipation of the baseline ecological risk assessment (BERA). The surrogate species selected for the BERA are those typically chosen, and with one important exception (see below), are consistent with the habitat description provided in the Preliminary Problem Formulation of the SLERA (there is no final Problem Formulation in Appendix K, but that omission does not substantially affect the analysis). The selection of surrogate species should provide a more detailed justification for the species chosen. Why, for example, did the assessment not consider a mammalian receptor? On what basis does the assessment justify an exposure pathway that includes rooted aquatic vegetation (see expanded comment below)?

Review of Draft Baseline Ecological and Human Health Risk Assessments, Gowanus Canal Superfund Site
3
2.2 Specific Comments
Section 3.2
Editorial comment - The SLERA references the Long and Morgan 1991 ER-Ls and ER-Ms but an examination of the tables indicates that it used the updated values subsequently provided for marine and estuarine environments and estuaries (Long et al., 1995, Incidence of Adverse Biological Effects within Ranges of Chemical Concentrations in Marine and Estuarine Sediments, Environmental Management, 19:81-97).
Section 5.2.1
A footnote on page 5-5 indicates that the L. plumulosus toxicity test was run three times because the first two runs did not meet acceptability criteria for survival of test organisms (the report suggests that there may have been a problem with the health of the test organisms). Were these tests re-run on the same test sediments as used in the first two failed tests? On new samples? Or on an archived subsample? If run on the same test sediments, what is the potential for a change in sediment conditions (e.g., COC concentrations, TOC fraction, etc.) during the time required to do the first two unacceptable runs? Did the time period for the two failed runs result in exceeding holding times for the third test run (recommendations for toxicity test holding times generally range from 2 to 8 weeks)? If the third attempt was run on archived samples, did the period over which the first two tests were run result in exceeding the recommended holding times? If archived, how were samples held? Were they frozen or refrigerated at 4 degrees C? Also, the laboratory report (Attachment B of Appendix K) does not mention this retesting. These issues should be addressed in the uncertainty section. Deviations such as exceeding USEPA guidance on holding times or subjecting the sediments to overlying water longer than standard methods allow (due to repeating the test on the same sediment sample three times) would invalidate the toxicity test. In that case, the toxicity testing should be repeated with a new set of samples that meet holding times and use healthy test organisms. On pages 5-5 to 5-6, it is unclear why the BERA used a comparison to the reference area tests based on the lowest endpoint result for the reference sample. Does this mean the site tests are compared to the lowest survival, lowest growth, and lowest reproduction observed among the reference samples? This would seem to ignore the variability in reference area results. The assessment does not provide a reason for using the “reference envelope” method rather than the standard statistical comparison to controls (which follows USEPA Guidance as cited in Attachment B). The report should justify this deviation from standard methods. Toxicity tests are non-discriminatory. Therefore, on what basis do the authors of the BERA make the assumption (page 5-6) that “…the detected constituents measured in these samples were the variables most likely responsible for the eco-toxicological impacts”? This seems unjustified in the absence of some more standard quantitative assessment. For example, the detection of a chemical in a toxicity test is insufficient evidence of causation. There are more

Review of Draft Baseline Ecological and Human Health Risk Assessments, Gowanus Canal Superfund Site
4
standard and more rigorous methods to make such judgments. These include further toxicity testing using Toxicity Identification Evaluation methods or the application of some principles of causality (e.g., the presence of a dose response; independent evidence that a specific chemical is indeed toxic to the test organism; etc.). The statements made here and later in Section 6 need to be more rigorously supported. If they cannot be rigorously supported, there is significant uncertainty as to what chemical (or other sediment condition) is causing the toxicity. The assessment states that the presence of high concentrations of metals and chemicals in sediment is “likely to be causing the outcomes observed in the sediment bioassays (Section 6.1.4).” This qualitative statement ignores data that indicates little relationship between chemical and toxicological data. For example, a cursory examination of the metals data (Table 6-3) relative to the response of the polychaete toxicity tests (Table 6-2) reveals little observable correlation between metals and survival or growth. Among the organic chemicals, the lowest value for survival in the polychaete toxicity test (61% survival) and one of the lowest values in growth (1.8 mg) occurred in sediments that had among the lowest total PAH concentrations (13 ppm) and no detected PCBs. The assessment requires a more rigorous evaluation of the relationship between toxicity tests and site-related contaminants in order to convincingly ascribe the observed toxicity to a specific chemical or chemical class. On pages 5-6 to 5-7, regarding the BERA rescreening, it is clear why one would recalculate screening benchmarks based on site-specific total organic carbon for those screening criteria using an equilibrium partitioning approach; however, what is the rationale for using ER-Ms rather than ER-Ls as the BERA re-screening criteria? The authors point out that the ER-M is less conservative, but on what basis does it revert to this less conservative screen? The SLERA was conservative on two levels: the use of the ER-L and the comparison to maximum measured values. The BERA uses the 95% UCL which is often the standard exposure point concentration, but this does not justify the use of the ER-M. Somewhat inconsistently, the authors use the same BERA screening benchmarks for water quality as they used in the SLERA. Why does the assessment use different approaches to screening water and sediment contaminants?
Section 5.2.2
On page 5-8, the authors write of a theoretical foundation for using organic carbon normalized SEM-AVS. Is there a reference to the body of work that justifies this normalization? Please provide the reference or, in the absence of a literature citation, please expand upon the theoretical foundation for this technique. Also, please include an analysis of the potential uncertainties associated with the measurement and interpretation of AVS/SEM in estuarine sediments.
Section 5.2.3
On page 5-12, the authors calculated concentrations of COCs in plant tissue using uptake factors for terrestrial plants. The uncertain nature of this exercise aside (assuming that rooted aquatic plants take up contaminants from sediment similar to rooted terrestrial vegetation uptake from soil), why does the BERA address rooted aquatic vegetation as an exposure route at all? The site

Review of Draft Baseline Ecological and Human Health Risk Assessments, Gowanus Canal Superfund Site
5
description (Section 2.1.2) explicitly states that “…there are no significant colonies of rooted aquatic vegetation within the Gowanus Canal…” and that “…these observations are consistent with NYSDEC tidal maps that designate the entire water body as a littoral zone…that does not include coastal fresh marsh, intertidal marsh, or other types of vegetative wetland…” If the Gowanus Canal clearly cannot support such vegetation, why are they included as an exposure medium? The consequence of using this pathway is the conclusion that there is a risk from PAHs to avian species ingesting plants at the site; however, if the pathway does not exist at the site there is not a risk from exposure to PAHs from this pathway.
Section 6.1
In this section, the authors apply the “reference envelope” approach described in Section 5.2.1. It remains unclear why the authors use this approach especially when Attachment A provides a detailed statistical comparison of each tested sample against each reference area sample. It is unclear why this approach was used rather than the standard approach in USEPA guidance (as cited in Attachment B of Appendix K). Also, in this section, what is the purpose of the arbitrary toxicity classification scheme (severe, moderate, limited)? This classification implies some value judgments that may not have any ecological meaning. Instead, the USEPA should use a classification scheme that simply reflects the breakdown of the observations. By just using a factual classification, one avoids the problem of having to justify the idea that failing two toxicity tests is “severe” while failing one is “moderate.”
Section 6.1.3
Please provide a reference justifying the parsing of organic carbon normalized Simultaneously Extracted Metals-Acid Volatile Sulfides (SEM-AVS) data. Also, this section should provide some recognition (well established in the literature) of the variability in SEM-AVS measurements with season and depth into the sediment. These are large uncertainties and may alter the opinion regarding the bioavailability of divalent metals (they may be more available than stated in the assessment).
Section 6.3.2
This section characterizes the risk from mercury exposure to avian omnivores as a site-related risk. However, the report should assess the potential that the mercury concentrations in fish and blue crab are related to a regional exposure that is not site-related. For example, the mercury concentration in the tissue of fish from the site is quite low and consistent with other fish data from the New York area. The risk assessment refers to an Attachment E which has some local data (characterized as non-site impacted), but that attachment is not currently available on the USEPA website that contains the Gowanus Canal documents. The uncertainty section mentions that Attachment E included an evaluation of contaminants in fish and crabs from a non-site-impacted area, but does not reveal the results of this evaluation. If the evaluation revealed similar mercury concentrations in these non-site-impacted areas, then it would be incorrect to ascribe the risk from mercury exposures as a site-related risk.

Review of Draft Baseline Ecological and Human Health Risk Assessments, Gowanus Canal Superfund Site
6
The risk to black duck does not seem reasonable. As indicated above, it is unlikely that there is any rooted aquatic vegetation in Gowanus Canal according to the risk assessment habitat description. The assessment uses all of the sediment data from the canal to estimate exposure to rooted aquatic vegetation; however, it is unlikely that rooted aquatic vegetation would occur in the deeper regions of the canal if it occurred at all. This is an unlikely exposure pathway either under current or foreseeable conditions. This exposure pathway for the Black Duck probably does not occur and should be removed from the risk assessment.
2.3 General Comment Regarding Ecological Risk Conclusions
The conclusion of risk to higher trophic level ecological receptors is weak. The mercury risk may be due to a regional exposure, and consequently risk from exposure to mercury is not a site-related risk. Therefore, there is no site-specific remedial action that can address this risk. The risk from exposure to PAHs is based on a very unlikely exposure pathway. Therefore, the risk to these receptors from exposure to PAHs is not likely to be site-related, and there is not site-specific remedial action that can address this risk. There is some uncertainty regarding the toxicity testing procedures using an amphipod. The polychaete testing is the only reliable toxicity test, and the assessment requires a more rigorous evaluation of the relationship of the magnitude of response to specific chemical concentrations before it can confidentially attribute toxicity to site-related contaminants.
3.0 BASELINE HUMAN HEALTH RISK ASSESSMENT This section provides a technical review of the Draft Gowanus Canal Remedial Investigation Report Volume I, January 2011, Appendix L, Human Health Risk Assessment, Gowanus Canal.
3.1 General Comments
The human health risk assessment (HHRA) generally follows USEPA Superfund guidance for preparing such assessments in both format and substance. However, this review raises the following primary concerns about the HHRA:
Swimming exposure scenario: References provided in the HHRA do not indicate that anyone currently swims in the canal. This exposure scenario and associated exposure assumptions should be removed from the HHRA unless USEPA provides justification for its inclusion. Instead, dermal exposure for a diver should be evaluated that takes into account a diver’s gear, which would limit the potential for dermal absorption of chemicals in surface water. Given the limited exposure to water and sediment that a diver would be likely to experience, risk estimates for a diver scenario would likely be below levels of concern.
Review of Draft Baseline Ecological and Human Health Risk Assessments, Gowanus Canal Superfund Site
7
Exposure during flooding events: The HHRA lacks sufficient quantitative support for exposure assumptions used to quantify risk from exposure to sediment and surface water that infrequently overtop canal walls.
Risk from dermal exposure to PAHs: USEPA (2004) does not recommend quantification
of risk from dermal exposure to some chemicals, such as PAHs, in the baseline risk calculations given the uncertainty in modeling exposures. Instead, USEPA recommends presenting this information in the risk assessment’s discussion of uncertainty.
Crab and fish ingestion: The HHRA should discuss the ability of the Gowanus Canal to
support the assumed crab and fish ingestion rates, and these rates also should be re-evaluated in light of consumption studies that include information about fishing and fish consumption practices relevant to the Gowanus Canal, which is located in a densely populated urban area accessible by public transportation.
3.2 Specific Comments
Specific comments on the BERA were organized by section. However, specific comments on the HHRA are organized by topic because the discussion of each tends to be spread among multiple sections of the report.
Recreational Scenario Represented by a Swimmer
General description of the scenario. The authors describe this scenario as involving someone who uses the canal for boating, fishing, crabbing, and “swimming/diving;” however, the only reasonable maximum exposure (RME) recreational scenario evaluated quantitatively is a swimmer who swims in the canal as a young child (1-6 year old), an adolescent (12-18 years old), and an adult. The swimmer is assumed to be exposed to surface water, sediment, and air at canal level for 2.6 hours per day, one day per week from May through October (i.e., 26 days per year). The reason for evaluating only the swimmer was not made clear until the Uncertainty Analysis section (Section 8.2) where the authors explain that the “most conservative recreational scenario (swimming) was used to evaluate potential exposure and risks for recreational adults, adolescents, and children.” Noncancer hazard indices were calculated separately for the adult, adolescent, and child swimmer. Cancer risks were summed across these age groups; therefore, cancer risks for this RME scenario apply to someone who swims in the canal for 36 years. People living nearby presumably would be most likely to engage in recreational activities in and near the canal, and USEPA often assumes a 30-year residential exposure duration, which is an upper percentile estimate of time living at a single residence. Were census data consulted to support selection of the 36-year exposure duration? The HHRA should provide quantitative justification for its choice of exposure duration.
Review of Draft Baseline Ecological and Human Health Risk Assessments, Gowanus Canal Superfund Site
8
Are people swimming in the canal? The authors explain that “[s]wimming/diving in the canal, although it does occur (Gowanus Dredgers Canoe Club, 2010; New York Times, 2007; The Gowanus Lounge, 2007), is rare due to the general conditions of the canal, which are largely associated with CSO discharges to the canal.” The HHRA provides no other support for the assumption that swimming is occurring in the canal beyond these three references. We reviewed them to understand the basis for the swimming scenario and found that none mentions swimming in the canal. Diving in the canal is mentioned only in the New York Times article. This article describes the Urban Divers Estuary Conservancy, which runs “youth educational projects and river cleanups with six divers and 150 land-based volunteers.” The diver shown in a photograph associated with this article is wearing full scuba diving gear, in contrast to the swimming scenario that assumes full body exposure to surface water. Therefore, what is the basis for reporting that people swim recreationally in the canal? Exposure assumptions for the RME swimmer. In the absence of site-specific information regarding swimmers, the HHRA incorporates recommendations from USEPA guidance. Many are appropriate for a swimming scenario, if such a scenario is justified, but others are not as well supported in the HHRA. The exposure duration is a combination of the 30-year default often used for a young child/adult resident (USEPA 1991) and a 6-year estimate for the adolescent based on professional judgment (e.g., see Table 4.1.RME in the HHRA). It is not clear why an exposure duration of 36 years is appropriate for people using the canal recreationally; were census data consulted or were local recreational group members interviewed? Use of a 30-year exposure duration instead of a 36-year exposure duration would result in risk estimates slightly lower than those presented in the HHRA but modification of this value alone would not influence risk conclusions. The time spent swimming each year involves two variables: time spent swimming during each swimming “event” and the number of events per year. The HHRA assumes 2.6 hours of swimming per event, citing a national average (USEPA 1989), and 26 events, or days, each year based on professional judgment; however, more recent guidance is available (USEPA 1997b, USEPA 2008). USEPA (1997b) recommends assuming one hour of swimming per event and one swimming event per month, which which would correspond to six days if people swam in the canal May to October as assumed in the HHRA. If these assumptions were adopted in the HHRA, risk estimates for a swimmer’s exposure to surface water and sediment would decrease by factors of approximately 11 and six, respectively. USEPA (2008) makes corresponding recommendations for children, which are higher than values assumed for the child and adolescent in the HHRA. However, all USEPA recommendations from 1989, 1997b, and 2008 are derived from studies that include swimming in pools and do not necessarily reflect recreational swimming in an estuarine environment. No recommendations are provided in USEPA guidance for time spent swimming in an estuarine canal in a densely populated, urban area; therefore, these assumptions ideally would be based on site-specific information. The HHRA should include discussion of such site-specific information.
Review of Draft Baseline Ecological and Human Health Risk Assessments, Gowanus Canal Superfund Site
9
The assumed ingestion rate of surface water is from USEPA guidance (1989), is consistent with what is commonly assumed in such assessments, and is the same or similar to rates presented in more recent USEPA guidance. USEPA (2008) recommends mean and “upper percentile” surface water ingestion rates for swimmers 6-15 years old of 0.05 L/day and 0.1 L/d, respectively. This same guidance recommends mean and “upper percentile” rates for swimmers 18 < 21 years old of 0.02 L/day and 0.07 L/d, respectively. These surface water ingestion rates are based on swimming pool experiments and may not reflect exposure in an estuarine environment; no estimates are available for estuarine waters. The available estimates for surface water ingestion rates cover a narrow range of values; therefore, selection of a rate is not expected to strongly influence risk results. Nevertheless, the HHRA should discuss the uncertainty associated with estimating surface water ingestion. The HHRA assumes full body exposure to surface water. In the absence of evidence that recreational swimming occurs, a diver should be evaluated, taking into account the fact that a diver’s gear would limit the potential for dermal absorption of chemicals in surface water. Given the limited exposure to water and sediment that such a diver would experience, risk estimates for a diver scenario would likely be below levels of concern. The assumptions regarding dermal exposure to sediment are difficult to judge without further description of the accessibility of sediment in the canal. This information would help in determining whether the body surface area assumed to be exposed to sediment is reasonable. Are there locations where sediment is periodically exposed and, if so, is this where exposure is assumed to occur? Or is the assumption of sediment exposure based on a swimmer contacting submerged sediment? If so, is the water shallow enough that a swimmer could access the sediment? And like surface water, in the absence of evidence that recreational swimming occurs, dermal exposure for a diver should be evaluated that takes into account a diver’s gear, which would limit the potential for dermal absorption of chemicals in sediment. USEPA should evaluate dermal exposure based on the diver scenario or provide quantitative justification for its assumptions regarding a swimmer’s dermal exposure to sediment. The sediment ingestion rate is assumed to be 50% of the soil ingestion rate for residents. USEPA guidance and the scientific literature in general do not provide sediment ingestion rates for various recreational activities in aquatic settings. It is possible that the assumed sediment ingestion rate is appropriate, but it would be helpful if the HHRA included the rationale for its selection. Risk estimates for the swimmer include quantification of risk from carcinogenic PAHs in surface water; however, USEPA (2004) does not recommend this approach. This guidance explains that USEPA’s recommended equation for quantifying dermal risk relies on a mathematical model to predict absorption of chemicals from water. USEPA has concluded that not all chemicals have sufficient data to predict dermal absorption “with acceptable confidence” within the “Effective Prediction Domain” (EPD) of the model. The carcinogenic PAHs are among the chemicals that USEPA regards as having insufficient data (See Exhibit B-3 in USEPA 2004). For such

Review of Draft Baseline Ecological and Human Health Risk Assessments, Gowanus Canal Superfund Site
10
chemicals, USEPA 2004 explains that “OSWER and the workgroup, which developed this guidance, do not recommend that the model be used to quantify exposure and risk to contaminants in water that are outside the EPD in the “body” of the risk assessment. Rather, it is recommended that such information be presented in the discussion of uncertainty in the risk assessment.” Cumulative cancer and noncancer risk estimates for adults and adolescents engaged in recreation drop below 1E-4 and 1, respectively--the risk levels above which USEPA typically considers taking action at a Site--if dermal exposure to PAHs is not included. Industrial Worker and Resident Exposed to Overflow Sediment and Surface Water Nearby residents and commercial workers are evaluated for incidental ingestion of and dermal contact with sediment and surface water that overtop the canal during significant rainfall events. The HHRA indicates that these events occur about two to three times per year and that “if any of the sediment that has overtopped the canal is not washed away with rain, it is usually swept up by the local residents or workers and does not accumulate.” The amount of sediment and surface water that might collect in areas near the canal during these events is not discussed in the HHRA, making it difficult to visualize this scenario and to judge whether exposure assumptions are reasonable. Therefore, some elaboration on this scenario, perhaps with photographs documenting a typical event, would contribute to the clarity of the HHRA. For example, workers and residents are assumed to ingest 50 mL/day of surface water and be exposed to surface water for 2.6 hours per event. Does water pool sufficiently during these events to result in a swimming-type scenario that would lead to this ingestion rate and exposure time? A similar question arises with sediment. Does it accumulate to such an extent that sediment ingestion rates equivalent to residential defaults are warranted? The HHRA needs to describe conditions during these flooding events and provide support for the quantitative exposure assumptions used to estimate risks. For these exposure scenarios, risk from dermal exposure to PAHs in surface water is quantified as part of the baseline risk calculations, despite USEPA (2004) guidance recommending otherwise as discussed above in reference to the recreational (swimmer) scenario. An editorial note: USEPA’s 2009 Supplemental Guidance for Inhalation Risk Assessment is in the HHRA reference list but is not mentioned in the discussion of the inhalation pathway or in Table 4.3.RME, which includes exposure assumptions for the inhalation pathway. The inhalation risk calculations as described in the HHRA appear to be appropriate, and specific reference to this guidance would improve clarity of the document and provide assurance that all applicable guidance was followed. Fish Ingestion The HHRA refers to “observations of fishing/crabbing along the canal,” citing The Gowanus Lounge, 2007. Is this reference the only basis for the assumption that people catch and consume fish from the canal?
Review of Draft Baseline Ecological and Human Health Risk Assessments, Gowanus Canal Superfund Site
11
As with the recreational (swimmer) scenario, the exposure duration for people eating fish and crabs is a combination of the 30-year default often used for a young child/adult resident (USEPA 1991) and professional judgment for the adolescent (e.g., see Table 4.4.RME in the HHRA). It is not clear why an exposure duration of 36 years is appropriate for people catching and consuming fish from the canal; were census data consulted or were local anglers interviewed? Again, USEPA should provide quantitative justification for its assumptions regarding exposure duration for all scenarios evaluated in the HHRA and, where appropriate, revise the HHRA based on that site-specific information. The fish ingestion rate is an annual average daily intake, thus it was appropriately multiplied by 365 days per year to estimate annual ingestion of fish. [Note: This does not mean that fish is consumed each day of the year.] The HHRA incorporates Burger’s (2002) estimate of average annual crab ingestion of 5,710 g/year, which corresponds to an annual average daily ingestion rate of 16 g/day. The HHRA goes on to say that a “95% UCL of the yearly consumption value was estimated on the basis of this to be 23 g/day…” How was this 95% UCL (upper confidence limit) calculated with the information provided by Burger (2002)? It appears that USEPA multiplied the standard error by two and added this value to the arithmetic mean, which might not represent the upper 95% UCL of the mean. If one assumes that the distribution for the arithmetic mean is normally distributed, then the calculated ingestion rate would be closer to the 97.5% UCL. The HHRA relies on USEPA (1997b) guidance for the RME fish ingestion rate of 26 g/day, which is based on a study of anglers in Maine, Michigan, and elsewhere in New York. The HHRA does not justify selection of a fish ingestion rate from these regions to represent consumption practices in the canal either now or under future conditions. In support of selection of the 26 g/day rate, the HHRA refers to Burger’s (2002) estimate of average annual fish ingestion of 8,120 g/year, which corresponds to an annual average daily ingestion rate of 22 g/day. [Note: the HHRA refers to 8,210 g/year, but Burger reports 8,120 g/year. This small error does not influence the estimate of annual average daily fish ingestion rate]. The HHRA discussion of fish and crab ingestion rates is limited to Burger (2002) and USEPA (1997), yet quite a few additional studies have been conducted in the New York-New Jersey area with information of potential relevance to the Gowanus Canal (e.g., NJMSC, CPIP, NJDA 1994, May and Burger 1996, Burger 1998, Burger et al. 1999, Pflugh et al. 1999, Ramos and Crain 2001, USEPA 1999, Corburn 2002, Morland et al. 2008, Going Coastal [undated], Ray et al. 2007). The HHRA should include discussion and analysis of this broader literature to better define fishing and fish consumption practices of anglers who might fish in the Gowanus canal and to support selection of reasonable fish and crab ingestion rates. The HHRA should include discussion of the following questions:
Where do they fish and are any of these locations reasonable surrogates for the Gowanus Canal?
Do they fish from multiple fishing locations? Is there any documented fishing in the Gowanus Canal?
Review of Draft Baseline Ecological and Human Health Risk Assessments, Gowanus Canal Superfund Site
12
What is their preferred catch for consumption? How much do they typically catch for the purpose of consumption? What part of the fish do they eat? Do they share their catch with young children? How might biases influence results? Biases can arise in fish consumption studies, such as
avidity bias (e.g., Thomson 1991, Price et al. 1994), recall bias (e.g., Chu et al. 1992; Connelly and Brown 1995; Connelly et al. 2000), non-response bias, and prestige bias.
The HHRA needs to discuss the underlying literature with respect to each of these questions to support USEPA’s choice for fish and crab ingestion rates.
Assuming that people catch and consume fish from the canal, what fraction of their total catch might originate from the canal? The crab and fish ingestion rates used in the HHRA to quantify risk represent total consumption from area fisheries. The canal, if fished, might represent only one of several fishing areas used by individual crabbers and anglers, even if one assumes future remediation of the canal. A “fraction ingested” variable is used to account for such situations. For example, the baseline HHRA recently completed for the GE/Housatonic Rest of River site employed a “fraction ingested” variable that represented the fraction of sport-caught fish that comes from the Housatonic River (USEPA 2005). (Note: The HHRA for the Gowanus canal also includes a “fraction ingested” variable that has a different meaning. It refers to the fractional contribution of each species to total fish/crab diet, not to the fraction of total fish caught and consumed by anglers that comes from the canal.) The fraction ingested variable for the Housatonic River was based on site-specific knowledge of fishing practices, and the same should be done to evaluate the canal with the general review of fish consumption literature recommended above. The HHRA also should discuss whether the Gowanus Canal can support the fish consumption rate now or in the future. The United States Army Corps of Engineers (USACE) sampled the canal for fish (trap net surveys) and evidence of fish reproduction in the canal (ichthyplankton survey). They collected samples over four seasons (October 2003 to June 2004) at five reaches in Gowanus Bay and the entire length of Gowanus Canal (LMS 2004). Table 1 summarizes the trap net data for fish collections for the four reaches in the canal proper (from the east end of the canal to the Hamilton Avenue Bridge.
Table 1. Number of Fish and Species Caught by Season and Canal Reach Sampling Period Canal Reach and Number of Fish Caught 1 2 3 4 October 77 (Striped Bass;
White perch; Atlantic Silverside
2 (Striped Bass) 5 (Striped Bass; Eel) 0
December 0 0 0 2 (Striped Bass; Northern Puffer)
April 0 1 (Cunner) 0 0 June 0 0 5 (Striped Bass;
Cunner) 0

Review of Draft Baseline Ecological and Human Health Risk Assessments, Gowanus Canal Superfund Site
13
This LMS study concluded that:
There were so few resident fish caught in the canals that “…the Gowanus may not have the habitat necessary to support a resident fish community;”
“Urbanization in the canal …could present an abiotic barrier to establishment of a resident fish community;”
The ichthyoplankton survey indicated that there is probably no spawning in Gowanus Canal;
There was no evidence of winter flounder (a common recreational species throughout NY/NJ harbor spawning in Gowanus Canal.
These data indicate that the canal is an unlikely fishery under current conditions, and it would take an unusual effort largely focused in the autumn to catch enough fish to attain 40 meals. (Note: The Baseline Ecological Risk Assessment [Appendix K] references a New York City DEP 2008 report as demonstrating that "...the most frequently caught fish species ...within Gowanus Canal and the adjacent Gowanus Bay were...," followed by a list of species. However, the 2008 report instead indicates that no samples were taken from Gowanus Canal. Like the USACE report (LMS 2004), the NYCDEP report concludes that the canal is not likely to support a diverse fish community.)
Data Management and EPC Calculation
Sediment. Only sediment samples from “exposed locations” were included in EPC calculations for evaluating contact with sediment during recreational use of the canal. What is meant by “exposed locations”? Does this mean not covered by water? Does it mean the sediment is accessible beneath shallow water? In other words, how well do the sediment data used to quantify EPCs represent likely exposures? Nineteen (19) sediment samples were collected from areas “with the greatest potential for human exposure (e.g., the canoe launch)” and analyzed for PCBs. Do sediment data for other chemical analytes represent these same human exposure areas? In other words, do sediment data represent accessible sediment in areas that people frequent for all COPCs? Aroclor data were not used to quantify sediment EPCs. The HHRA explains this approach as follows:
“sediment samples were analyzed for both Aroclors and PCB congeners. Only the PCB congener data were evaluated in the risk assessment so that the risks associated with PCBs would not be double-counted in the HHRA.”
What is the risk of double-counting? Some samples were analyzed for PCBs using two methods: Aroclor analysis and congener analysis. There is no reason to sum these concentrations; they
Review of Draft Baseline Ecological and Human Health Risk Assessments, Gowanus Canal Superfund Site
14
simply represent two estimates of the PCB concentration in each sample. It would be useful to know how they compare and why the authors saw no value in presenting Aroclor data. Also, Table 4-1 shows some samples analyzed only for PCBs and others analyzed for PCBs and PCB congeners. Assuming that “PCBs” refers to Aroclor analysis, do sediment samples with only these results represent possible exposure areas that are not otherwise represented in the data set? Fish Fillet and Crabs. Detected chemicals that are USEPA Class A carcinogens were retained as COPCs regardless of how concentrations compared to risk-based screening levels. Why? We are not aware of USEPA guidance that recommends this approach and, in practice, have seen such chemicals screened out of risk assessments when their maximum detected concentrations are below risk-based screening levels. Was the skin removed from fillets before laboratory analysis? How were crab muscle and hepatopancreas data combined? Presumably the concentrations were weighted appropriately, but it would be useful to confirm the approach explicitly in the HHRA. Treatment of results below reporting limits. For all analytes except PCBs, results below detection limits were set to the detection limit for the purpose of calculating EPCs with ProUCL software. Historically, it has been common practice in risk assessment to replace results below detection limits with ½ the detection limit, not the full detection limit. Regardless, USEPA (2010a) now indicates that newer versions of ProUCL software include parametric and nonparametric alternatives to the substitution approach that should be used to calculate EPCs from data sets with results below detection limits. Blank contamination. Congeners that were B qualified were not included in EPC calculations because they were detected in a laboratory or field blank at a concentration “similar to” that in the sample. How was “similar” defined in this context? Duplicates. For duplicate samples, the maximum concentration between the two samples was used to represent the sample concentration. However, if both duplicates are of equal quality, it makes more sense to average the two results.
Toxicity Values
The authors state that “The use in an HHRA of toxicity values from sources other than IRIS increases the uncertainty of the quantitative risk estimates.” This is not necessarily true if there are cases where a lower tier value (e.g., a California EPA value) is derived more recently than an IRIS value and benefits from more recent toxicity studies that reduce uncertainty in the original IRIS estimate of toxicity. The HHRA indicates that “chromium” is a chemical that exhibits a mutagenic mode of action based on McCarrol et al. 2010. In this discussion, “chromium” should be changed to “hexavalent chromium,” which was the subject of McCarrol et al. (2010). Also, in the absence of chromium

Review of Draft Baseline Ecological and Human Health Risk Assessments, Gowanus Canal Superfund Site
15
speciation data, chromium detected in all media was assumed to be in the hexavalent form. The HHRA correctly indicates that this assumption is conservative in that chromium in fish is unlikely to be in the hexavalent form. The same is likely true in sediment, a typically reducing environment that favors trivalent chromium. If chromium might form the basis of any significant decision-making, it would be useful to obtain concentration data for chromium species in sediment. The reference dose for Aroclor 1254 was used to estimate hazard indices associated with exposure to PCBs. This is expected to be a reasonable choice, but the HHRA should document the rationale for this choice based on comparison of the PCB mixture in contaminated media with the composition of Aroclor 1254. The Uncertainty Analysis section includes discussion of the uncertainty associated with the toxic equivalents (TEQ) approach used to quantify cancer risk from dioxin-like PCB congeners. This discussion is generally appropriate; however, it includes the statement “TEFs are based on the relationship of the PCB congeners to the carcinogenic risks associated with dioxin.” It is true that TEFs are often used to quantify cancer risk from dioxin-like PCBs and not noncancer hazard. However, TEFs are based on more than cancer effects. They are intended to indicate a congener’s ability, relative to dioxin, to elicit a range of aryl hydrocarbon receptor (AhR)-mediated biochemical and toxic responses (Van den Berg 2006; Hawes et al. 2006). Moreover, USEPA (2010b) recommends that “TEFs be used for all effects mediated through aryl hydrocarbon receptor binding by the DLCs [dioxin-like compounds] including cancer and noncancer effects.” Age Dependent Adjustment Factors (ADAFs) are listed in Section 7.3 for each of the age groups evaluated in the HHRA. However, the age category of 12 < 16 years old is missing from this discussion. The HHRA indicates that “lead concentrations…less than 400 mg/kg in sediment (USEPA, 1994b) are considered adequately protective of human health under residential land-use conditions. Lead concentrations less than 800 mg/kg in sediment are considered adequately protective of human health under industrial land-use conditions.” These comparisons are not appropriate. USEPA 1994 refers to lead in soil, not sediment. No reference is provided for the 800 mg/kg concentration but is also based on exposure to lead in soil. Reference Locations The HHRA compares the concentrations of some COPCs to those at reference locations, referring to Table 7-3. However, this table is missing from the HHRA appendix, and it is not clear exactly how these comparisons were made.

Review of Draft Baseline Ecological and Human Health Risk Assessments, Gowanus Canal Superfund Site
16
3.3 General Comment Regarding Human Health Risk Conclusions
This review raises numerous questions about the HHRA. Resolution of two issues will likely have the greatest effect on risk conclusions:
1. References provided in the HHRA do not indicate that anyone is currently swimming in the canal. This exposure scenario and associated exposure assumptions need to be better supported in the HHRA. Is swimming infeasible without first controlling biological contamination from combined sewer overflows? The recreational scenario might be better evaluated for those engaged in boating, canoeing, and diving. The evaluation of this scenario would benefit from interviews with local groups organizing recreational activities on and near the canal to ensure that it reflects current and possible future exposures.
2. USEPA (2004) does not recommend quantification of risk from dermal exposure to some chemicals, such as PAHs, in the baseline risk calculations given uncertainty in modeling exposures. Instead, USEPA recommends presenting this information in the discussion of uncertainty in the risk assessment. Following USEPA’s recommended approach would strongly influence risk conclusions for scenarios involving exposure to surface water.
3. The HHRA should discuss the ability of the Gowanus Canal to support the assumed crab and fish ingestion rates, and these rates also should be re-evaluated in light of consumption studies that include information about fishing and fish consumption practices relevant to the Gowanus Canal, which is located in a densely populated urban area accessible by public transportation. This more comprehensive review might influence the choice of fish and crab ingestion rates and assumptions about the fraction of total fish and crab consumed that is caught in the canal.
4.0 REFERENCES
Burger J, Sanchez J, Gochfeld M. 1998. Fishing, Consumption, and Risk Perception in Fisherfolk along an East Coast Estuary. Environmental Research, Section A, 77: 25-35.
Burger J, Pflugh KK, Lurig L, Von Hagen LA, Von Hagen S. 1999. Fishing in Urban New Jersey: Ethnicity Affects Information Sources, Perception, and Compliance. Risk Analysis, 19(2): 217-229.
Burger J. 2002. Consumption Patterns and Why People Fish. Environmental Research Section A, 90: 125-135.
Chu A, Eisenhower D, Hay M, Morganstein D, Neter J, Waksberg J. 1992. Measuring the Recall Error in Self-Reported Fishing and Hunting Activities. Journal of Official Statistics 8(1): 19-39.
Connelly NA, Brown TL. 1995. Use of Angler Diaries to Examine Biases Associated with 12-Month Recall on Mail Questionnaires. Transactions of the American Fisheries Society 124:413-422.
Review of Draft Baseline Ecological and Human Health Risk Assessments, Gowanus Canal Superfund Site
17
Connelly NA, Brown TL, Knuth BA. 2000. Assessing the Relative Importance of Recall Bias and Nonresponse Bias and Adjusting for Those Biases in Statewide Angler Surveys. Human Dimensions of Wildlife, 5:19-29.
Corburn J. 2002. Combining Community-Based Research and Local Knowledge to Confront Asthma and Subsistence-Fishing Hazards in Greenpoint/Williamsburg, Brooklyn, New York. Environ Health Perspect 110(suppl 2):241–248 (2002).
Going Coastal, Inc. [undated]. Reel It In! Brooklyn: Fish Consumption Education Project in Brooklyn. (available at: http://www.scribd.com/full/41464909?access_key=key-182rb2ei8h44x7upqfib).
Gowanus Dredgers Canoe Club. 2010. Welcome to the Gowanus Dredgers Canoe Club. Available at http://www.waterfrontmuseum.org/dredgers/home.html.
Gowanus Lounge. November 6, 2007. Yummy Blue Plate Special: Gowanus Canal Blue Fish. Available at http://gowanuslounge.blogspot.com/2007/11/yummy-blue-platespecial-gowanus-canal.html.
Haws LC, Su SH, Harris M, DeVito MJ, Walker NJ, Farland WH, Finley B, Birnbaum LS. 2006. Review: Development of a Refined Database of Mammalian Relative Potency Estimates for Dioxin-like Compounds. Toxicological Sciences 89(1):4–30.
LMS. 2004. Gowanus Bay and Canal Ecosystem Restoration Studies. Fish and Epibenthic Invertebrate Sampling. November, 2004. Prepared by Lawler, Matusky, and Skelly, Engineers, LLP. Prepared for David Miller and Associates.
May H, Burger J. 1996. Fishing in a Polluted Estuary: Fishing Behavior, Fish Consumption and Potential Risk. Risk Analysis 16(4):459-471.
McCarroll N., N. Keshava, J, Chen, G. Akerman, A. Kligerman, and E. Rinde. 2010. An evaluation of the mode of action framework for mutagenic carcinogens case study II: Chromium (VI). Environmental and Molecular Mutagenesis 51(2):89–11.
Morland K, Wolff M, Bopp R, Godbold J, Landrigan P. 2008. Fish Consumption and Body Burden of Organochlorines Among Lower Hudson Urban Anglers. American Journal of Industrial Medicine 51:587–594.
New York Times. 2007. Divers Who Jump in to Take the Mystery out of City Waterways. Available at http://www.nytimes.com/2007/11/27/nyregion/27divers.html?_r=1. November 27.
NJMSC, CPIP, NJDA (New Jersey Marine Sciences Consortium, Center for Public Interest Polling, New Jersey Department of Agriculture). 1994. Fish Consumption Patterns by New Jersey Consumers and Anglers. Prepared for: New Jersey Department of Environmental Protection and Energy (NJDEPE). August 1994.
Pflugh KK, Lurig L, Von Hagen LA, Von Hagen S, Burger, J. 1999. Urban Anglers’ Perception of Risk from Contaminated Fish. Sci. Total Environ. 228:203-218.
Price P, Su SH, Gray MN. 1994. The Effect of Sampling Bias on Estimates of Angler Consumption Rates in Creel Surveys. Journal of Exposure Analysis and Environmental Epidemiology, 4(3): 355-372.
Ramos BS, Crain AM. 2001. Potential Health Risks of Recreational Fishing in New York City. Ambul Pediatr. 1(5):252-5.
Review of Draft Baseline Ecological and Human Health Risk Assessments, Gowanus Canal Superfund Site
18
USEPA (U.S. Environmental Protection Agency). 1989. Risk Assessment Guidance for Superfund. Vol.1: Human Health Evaluation Manual, Part A. OERR. EPA/540/1-89/002.
Ray R, Craven V, Bingham M, et al. 2007. Human Health Exposure Factor Estimates Based Upon a Creel/Angler Survey of the Lower Passaic River (Part 3). Journal of Toxicology and Environmental Health, Part A, 70: 512–528, 2007
Thomson, C.J. (1991). Effects of the avidity bias survey estimates of fishing effort and economic value. American Fisheries Society Symposium. 12:356-366.
USEPA (U.S. Environmental Protection Agency). 1991. Risk Assessment Guidance for Superfund. Vol.1: Human Health Evaluation Manual - Supplemental Guidance, Standard Default Exposure Factors. Interim Final. OSWER Directive 9285.6-03.
USEPA (U.S. Environmental Protection Agency). 1997a. Ecological Risk Assessment Guidance for Superfund: Process for Designing and Conducting Ecological Risk Assessments. OSWER9285.7-25 June.
USEPA (U.S. Environmental Protection Agency). 1997b. Exposure Factors Handbook Volume I - General Factors. Office of Research and Development.
USEPA (U.S. Environmental Protection Agency). 1999. Community-Specific Cumulative Exposure Assessment for Greenpoint/Williamsburg, New York. Office of Policy, Planning and Evaluation. Washington, DC:U.S. Environmental Protection Agency.
USEPA (U.S. Environmental Protection Agency). 2004. Risk Assessment Guidance for Superfund, Volume 1, Human Health Evaluation Manual (Part E, Supplemental Guidance for Dermal Risk Assessment) Interim. OSWER 9285.7-02EP. July.
USEPA (U.S. Environmental Protection Agency). 2005. Human Health Risk Assessment, GE/Housatonic River Site Rest of River, Volume IV, Appendix C: Consumption of Fish and Waterfowl Risk Assessment. GE/Housatonic River Project, Pittsfield, Massachusetts.
USEPA (U.S. Environmental Protection Agency). 2008. Child-Specific Exposure Factors Handbook. EPA/600/R-06/096F.
USEPA (U.S. Environmental Protection Agency). 2009. Risk Assessment Guidance for Superfund Volume I: Human Health Evaluation Manual (Part F, Supplemental Guidance for Inhalation Risk Assessment). Final. EPA-540-R-070-002/OSWER 9285.7-82.
USEPA (United States Environmental Protection Agency). 2010a. ProUCL Version 4.1.00 Technical Guide (Draft). EPA/600/R-07/041.
USEPA (United States Environmental Protection Agency). 2010b.Recommended Toxicity Equivalence Factors (TEFs) for Human Health Risk Assessments of 2,3,7,8-Tetrachlorodibenzo-p-dioxin and Dioxin-Like Compounds. Risk Assessment Forum, Washington, DC. EPA/100/R-10/005.
Van den Berg M, Birnbaum, LS, Denison M, et al. 2006. Review: the 2006 World Health Organization Reevaluation of Human and Mammalian Toxic Equivalency Factors for Dioxins and Dioxin-Like Compounds. Toxicological Sciences 93(2):223–241.