Rhode Island; Coastal Buffer Zone Planting Guide - University of Rhode Island
1
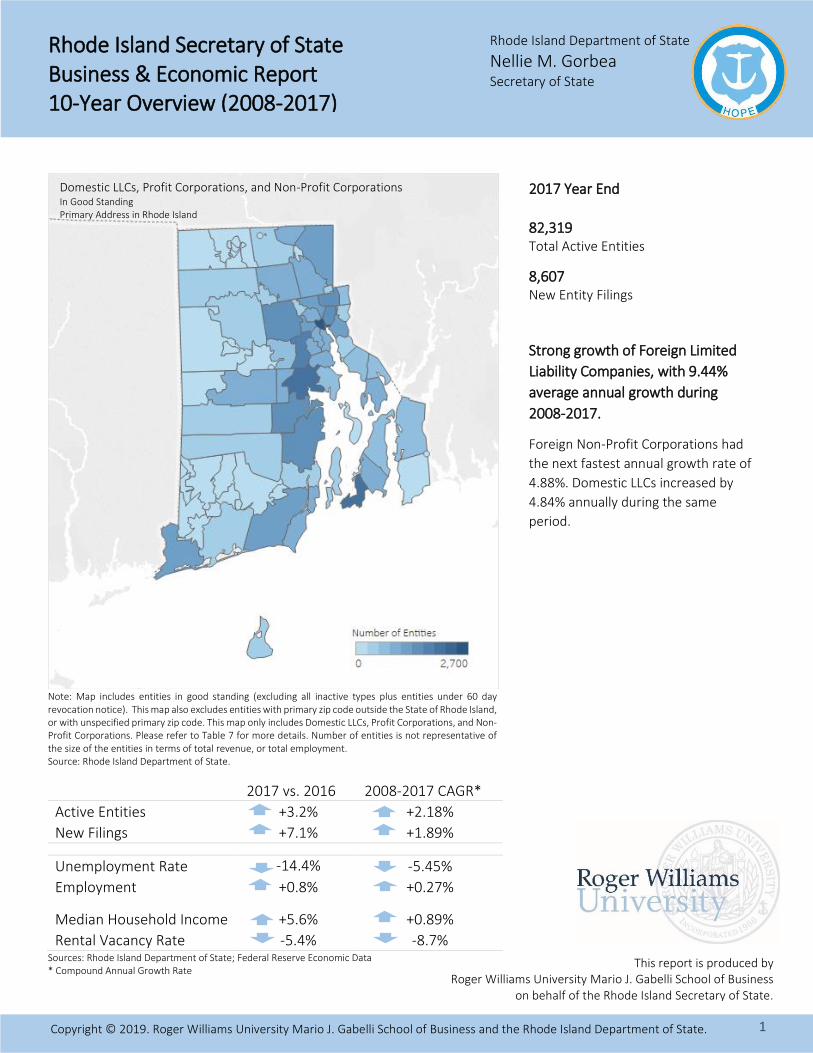
Note: Map includes entities in good standing (excluding all inactive types plus entities under 60 day revocation notice). This map also excludes entities with primary zip code outside the State of Rhode Island, or with unspecified primary zip code. This map only includes Domestic LLCs, Profit Corporations, and Non-Profit Corporations. Please refer to Table 7 for more details. Number of entities is not representative of the size of the entities in terms of total revenue, or total employment. Source: Rhode Island Department of State.
Sources: Rhode Island Department of State; Federal Reserve Economic Data * Compound Annual Growth Rate
2017 vs. 2016 2008-2017 CAGR*
Active Entities +3.2% +2.18%
New Filings +7.1% +1.89%
Unemployment Rate -14.4% -5.45%
Employment +0.8% +0.27%
Median Household Income +5.6% +0.89%
Rental Vacancy Rate -5.4% -8.7%
Rhode Island Department of State
Nellie M. Gorbea Secretary of State
Domestic LLCs, Profit Corporations, and Non-Profit Corporations In Good Standing Primary Address in Rhode Island
2017 Year End 82,319 Total Active Entities
8,607 New Entity Filings
Strong growth of Foreign Limited
Liability Companies, with 9.44%
average annual growth during
2008-2017.
Foreign Non-Profit Corporations had
the next fastest annual growth rate of
4.88%. Domestic LLCs increased by
4.84% annually during the same
period.
Rhode Island Secretary of State Business & Economic Report 10-Year Overview (2008-2017)
Copyright © 2019. Roger Williams University Mario J. Gabelli School of Business and the Rhode Island Department of State.
This report is produced by Roger Williams University Mario J. Gabelli School of Business
on behalf of the Rhode Island Secretary of State.

2
Rhode Island Industry Sectors (NAICS Codes*)
Note: Chart includes entities in good standing (excluding all inactive types plus entities under 60 day revocation notice). This chart also excludes entities with primary zip code outside the State of Rhode Island, or with unspecified primary zip code. The Unspecified category refers to 4,187 entities with unknown or unspecified NAICS code. 95% of the entities with unspecified NAICS code were incorporated during 2017. This chart only includes Domestic LLCs, Profit Corporations, and Non-Profit Corporations. Please refer to Table 7 for more details. (Number of entities is not representative of the size of the entities in terms of total revenue or total employment) Source: Rhode Island Department of State.
Domestic LLCs, Profit Corporations, and Non-Profit Corporations In Good Standing Primary Address in Rhode Island
2017 Entities in Good Standing (Details in Table 6)
73.25% of Real Estate, Rental, and Leasing sector, are
Domestic LLCs. In Construction sector, 38.79% are Domestic
Profit, and 25.9% are Foreign Profit Corporations.
43.76% of Finance and Insurance sector are Foreign LLCs.
Other Services is comprised of four subsectors: 1) Repair
and Maintenance, 2) Personal and Laundry Services, 3)
Religious, Grant making, Civic, Professional, and Similar
Organizations, and 4) Private Households. 60.53% of Other
Services sector are Domestic Non-Profits.
Domestic LLC38%
Domestic Profit21%
Domestic Non-Profit
10%
Foreign LLC10%
Foreign Profit15%
Other6%
2017 Year End Active Entities38% Domestic LLCs (reference Table 1)
Insurance
Rhode Island Business & Economic Report – 10-Year Overview (2008-2017)
* NAICS code is the North American Industry Classification System that specifies a 6-digit code for business establishments based on
their type of economic activity. For more information go to page 18.

3
Entities with Primary Address outside the State of Rhode Island
Note: Data points in this map are the difference between all entities in good standing listed in Table 6, and Table 7 with entities with primary address inside RI. Foreign Non-Profit Corporations are not included in this map due to data limitations. There are total of 673 Foreign Non-Profit Corporations in good standing.
0
5
10
15
20
25
30
DomesticLimited Liability
Company
Domestic ProfitCorporation
Domestic Non-Profit
Corporation
Foreign LimitedLiability
Company
Foreign ProfitCorporation
Nu
mb
er o
f En
titi
es
Tho
usa
nd
s
Number of Entities in Good Standing - 2017All Inside RI
Domestic LLCs, Profit Corporations, and Non-Profit Corporations & Foreign LLCs, and Profit Corporations In Good Standing Primary Address outside of Rhode Island
Outside RI - Top Cities & Number of Entities New York NY 663
Boston MA 508
Wilmington DE 369
Atlanta GA 291
Houston TX 287
Chicago IL 281
Dallas TX 164
Seekonk MA 157
Fall River MA 154
San Francisco CA 136
Outside RI - Top States & Number of Entities MA 4,297
NY 1,529
CA 1,372
CT 1,317
FL 1,245
TX 1,110
NJ 852
PA 831
IL 758
OH 629
Over 90% of the Domestic Entities
have a primary address in Rhode
Island. (Tables 6)
More than 90% of the Foreign LLCs
and Foreign Profit Corporations
reported a primary address outside of
Rhode Island.
Note: Foreign Non-Profit Corporations are not included in this chart due to data limitations.
Rhode Island Business & Economic Report – 10-Year Overview (2008-2017)

4
Rhode Island Business Entity Trends – Year End Totals
-
10,000
20,000
30,000
40,000
50,000
60,000
70,000
80,000
90,000
2008 2009 2010 2011 2012 2013 2014 2015 2016 2017
Active Entities
Other
Foreign
Domestic Non-Profit
Domestic Limited
Domestic ProfitCorporation
0
1,000
2,000
3,000
4,000
5,000
6,000
7,000
8,000
9,000
10,000
2008 2009 2010 2011 2012 2013 2014 2015 2016 2017
New Entity Filings
Other
Foreign
Domestic Non-Profit
Domestic Limited
Domestic ProfitCorporation
0
2000
4000
6000
8000
10000
400
420
440
460
480
500
2008 2009 2010 2011 2012 2013 2014 2015 2016 2017
New
En
tity
filin
gs
No
nfa
rm E
mp
loye
es (t
ho
usa
nd
s)
Employment & New Entity Filings
Nonfarm Employees (thousands) New Entity Filings
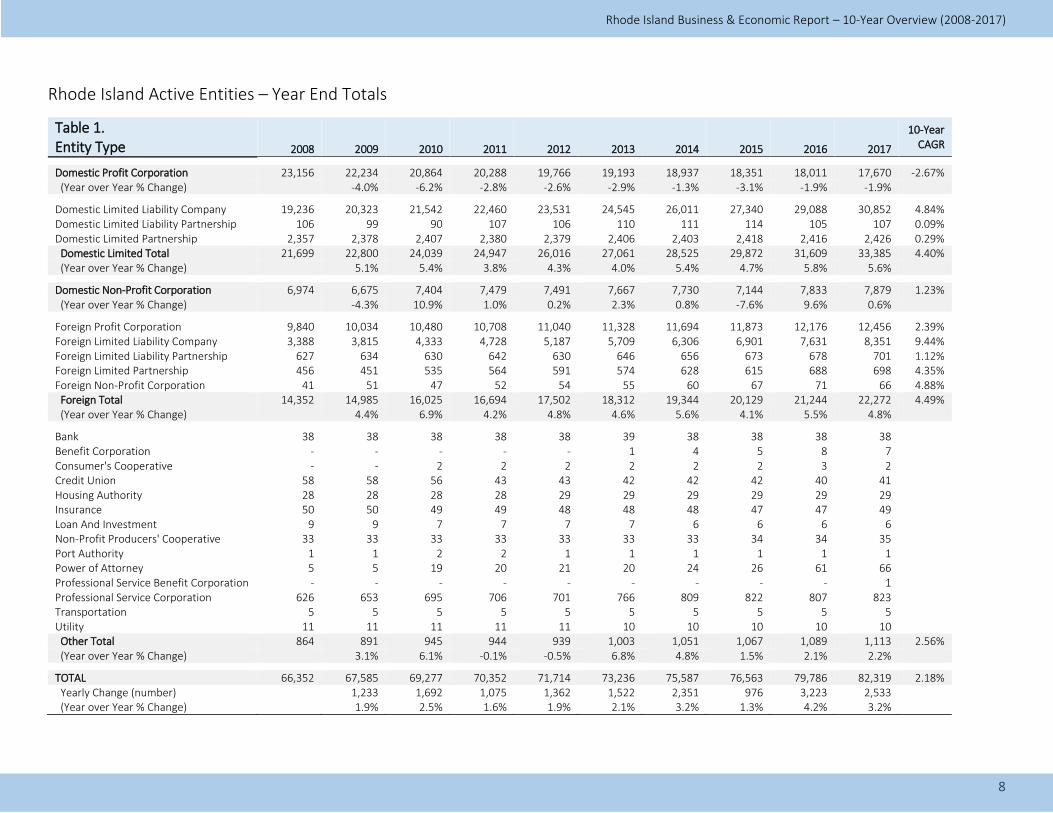
Total number of active entities
increased from 66,352 to 82,319,
with an annual 10-year growth rate
of 2.18%. (Table 1)
Foreign LLCs had the fastest annual
increase rate of 9.44%, Foreign Non-
Profit Corporations had the next
fastest annual growth rate of 4.88%,
followed by Domestic LLCs, and
Foreign Limited Partnerships. Number
of Domestic Profit Corporations
dropped with an annual rate of -2.67%.
2 year drop followed by 7 year rise
in the total number of new entity
filings. (Table 2)
Sharpest increase occurred in 2017 by
a 7.1% increase compared to 2016.
Number of the Domestic Profit
Corporation new filings have been
dropping at an annual rate of -3.62%.
Domestic and Foreign LLCs are
increasing in number of new filings
with annual averages of 3.85% and
4.81%, respectively.
Domestic and Foreign Limited
Partnerships faced a decrease in new
filings (-1.7%, -5.37% CAGR,
respectively).
Foreign Non-Profit Corporation new
filings increased by 4.95% annually,
however, Domestic Non-Profit
Corporation new filings slightly
decreased with the annual rate of
0.85%.
Rhode Island Business & Economic Report – 10-Year Overview (2008-2017)
5
Rhode Island Inactive Entity Trends – Year End Totals
0
1,000
2,000
3,000
4,000
5,000
6,000
7,000
8,000
2008 2009 2010 2011 2012 2013 2014 2015 2016 2017
Inactive Entities
Other
Conversion, Expired,Merged
Dissolved, Withrawn,Cancelled
Revoked Entity
0%
20%
40%
60%
80%
100%
120%
140%
0
2000
4000
6000
8000
10000
2008 2009 2010 2011 2012 2013 2014 2015 2016 2017
New
Fili
ngs
to
Inac
tive
Rat
io
Nu
mb
er o
f En
titi
es
New and Inactive Entities
New Filings Inactive Ratio
0
4
8
12
16
20
0
500
1000
1500
2000
2500
Do
mes
tic
LLC
Do
mes
tic
Co
rpo
rati
on
Do
mes
tic
No
n-
Pro
fit
Fore
ign
LLC
Fore
ign
Co
rpo
rati
on
Fore
ign
No
n-
Pro
fit Oth
er
Life
(Ye
ars)
Nu
mb
er o
f En
titi
es
Revoked Entities (2008-2017)
Average yearly revokations Average life before revokation
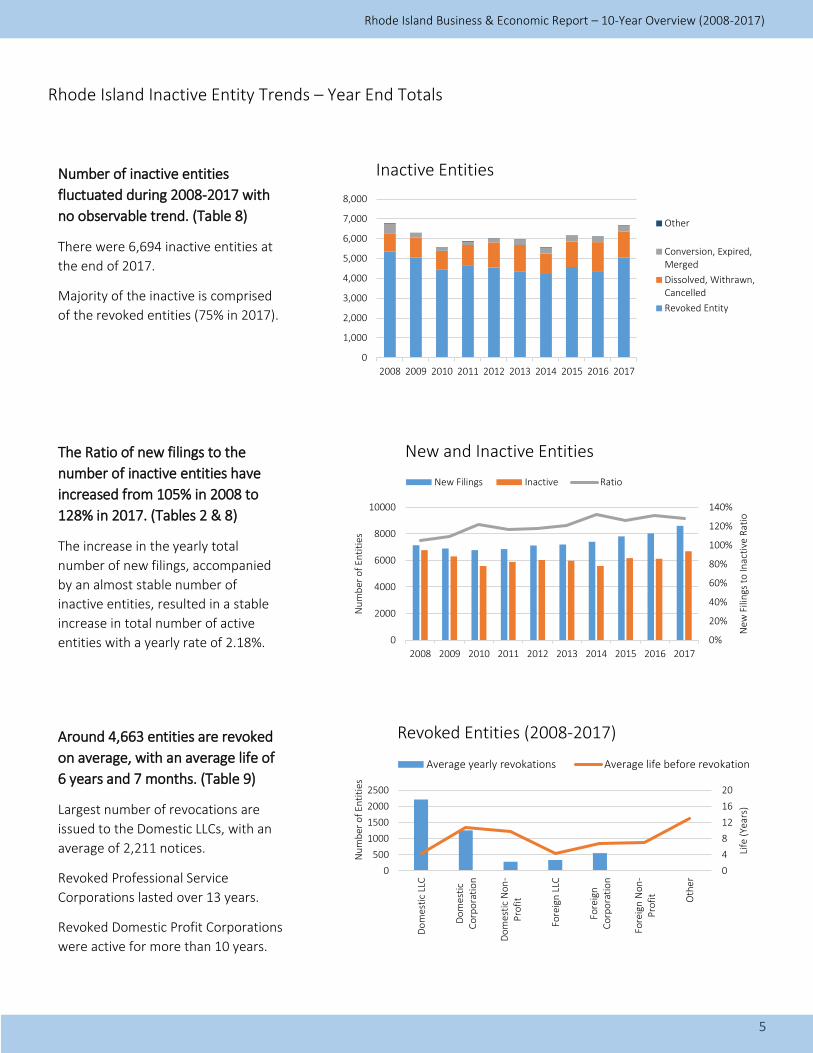
Number of inactive entities
fluctuated during 2008-2017 with
no observable trend. (Table 8)
There were 6,694 inactive entities at
the end of 2017.
Majority of the inactive is comprised
of the revoked entities (75% in 2017).
The Ratio of new filings to the
number of inactive entities have
increased from 105% in 2008 to
128% in 2017. (Tables 2 & 8)
The increase in the yearly total
number of new filings, accompanied
by an almost stable number of
inactive entities, resulted in a stable
increase in total number of active
entities with a yearly rate of 2.18%.
Around 4,663 entities are revoked
on average, with an average life of
6 years and 7 months. (Table 9)
Largest number of revocations are
issued to the Domestic LLCs, with an
average of 2,211 notices.
Revoked Professional Service
Corporations lasted over 13 years.
Revoked Domestic Profit Corporations
were active for more than 10 years.
Rhode Island Business & Economic Report – 10-Year Overview (2008-2017)

6
Rhode Island and National Economic Factors
0
2
4
6
8
10
12
2008 2009 2010 2011 2012 2013 2014 2015 2016 2017
Un
emp
loym
ent
%
Unemployment Rate
Rhode Island National
0
100
200
300
400
500
600
2008 2009 2010 2011 2012 2013 2014 2015 2016 2017
HP
I
House Price Index (1980:Q1=100)
Rhode Island National
20000
25000
30000
35000
40000
45000
50000
55000
60000
65000
2008 2009 2010 2011 2012 2013 2014 2015 2016 2017
20
08
Do
llar
Real Median Household Income (2008 $)
Rhode Island National
Unemployment rate is at 4.46% in
2017. (Tables 3 & 4)
In 2008 Unemployment rate was 7.81%,
and reached the highest rate of 11.2%
in 2010. National unemployment rate is
at 3.98% in 2017.
Minimum wages in Rhode Island have
increased from $7.4 per hour in 2008,
to $9.6 per hour in 2017.
House Price Index (HPI) had a 5 year
fall until 2013, followed by 4 year rise
to 2017. (Tables 3 & 4)
HPI in RI in 2017 is 527.31, still lower
than the 2008 index of 538.12.
The national House Price Index had
recovered after the recession and
ended higher with 399.11 in 2017.
2017 National HPI is lower than Rhode
Island by 24%.
Real median household income in
2017 ended strongly higher than the
rate in 2008. (Tables 3 & 4)
In 2017 median household income was
$58,314 (adjusted to 2008 dollars), in
comparison with $53,373 per household
in 2008.
Real median household income in
Rhode Island shows fluctuations with
highest year-over-year increase rate of
11.97% in 2012. Real median household
income in the US in year 2017 was
$53,907 in 2008 dollar, with $3,478
increase over 10 years.
Rhode Island Business & Economic Report – 10-Year Overview (2008-2017)

7
New England Comparative Analysis
15
17
19
21
23
25
27
29
31
33
2008 2009 2010 2011 2012 2013 2014 2015 2016 2017
Average Hourly Earnings - All Employees
Connecticut
Maine
Massachusetts
New Hampshire
Rhode Island
Vermont
0
500
1000
1500
2000
2500
3000
3500
4000
2008 2009 2010 2011 2012 2013 2014 2015 2016 2017
Total Nonfarm Employees (Thousands)
Connecticut
Maine
Massachusetts
New Hampshire
Rhode Island
Vermont
0
50000
100000
150000
200000
250000
300000
350000
400000
450000
500000
2008 2009 2010 2011 2012 2013 2014 2015 2016 2017
Real GDP (Millions, Chained 2012 Dollars)
Connecticut
Maine
Massachusetts
New Hampshire
Rhode Island
Vermont
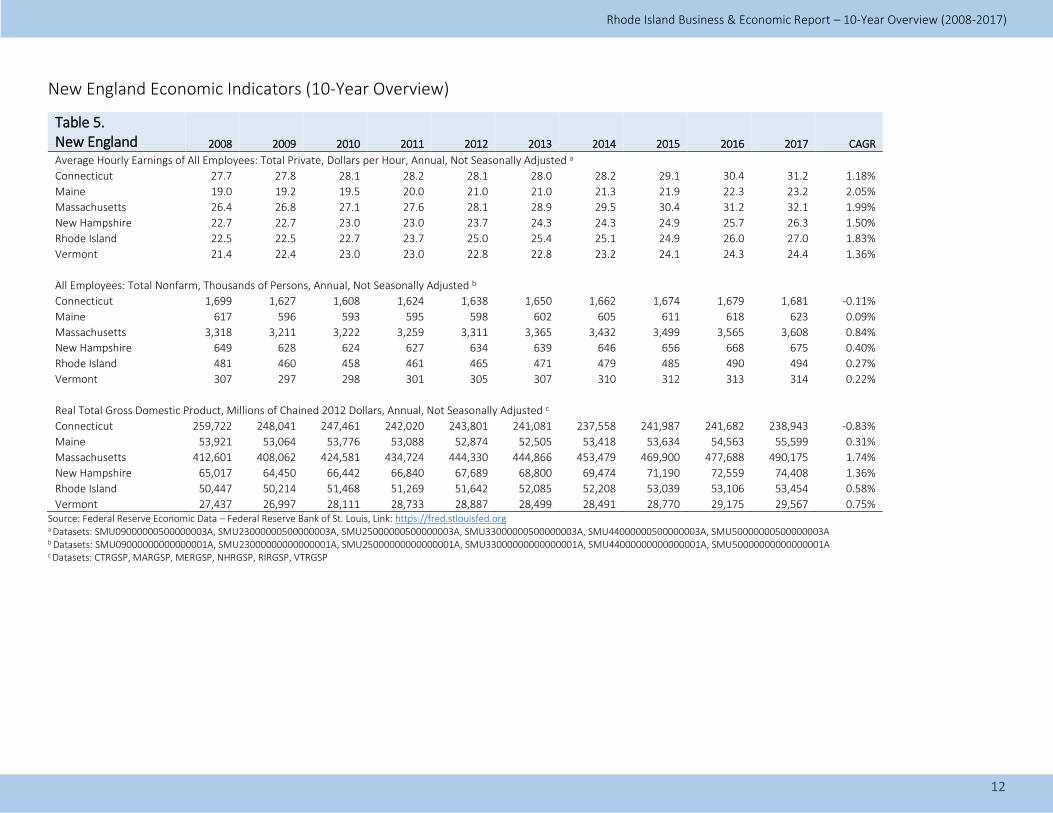
Average hourly earnings in Rhode
Island had a strong 10-year annual
growth rate of 1.83%. (Table 5)
The average hourly earnings increased to
$27 per hour in 2017 from $22.5 per hour
in 2008.
In New England, Maine had the highest
10-year increase rate, followed by
Massachusetts, with 2.05% and 1.99%,
respectively.
Total nonfarm employees in Rhode
Island had moderate 10-year
annual increase of 0.27%. (Table 5)
Massachusetts had the highest annual
rate of 0.84% among the New England
States.
Real GDP in Rhode Island has
increased by 3 billion dollars in 10
years. (Table 5)
Massachusetts, New Hampshire, and
Vermont had compound annual
increase rates of 1.74%, 1.36%, and
0.75%.
Rhode Island follows with a compound
annual growth rate of 0.58%.
Rhode Island Business & Economic Report – 10-Year Overview (2008-2017)
8
Rhode Island Active Entities – Year End Totals
Table 1. Entity Type 2008 2009 2010 2011 2012 2013 2014 2015 2016 2017
10-Year CAGR
Domestic Profit Corporation 23,156 22,234 20,864 20,288 19,766 19,193 18,937 18,351 18,011 17,670 -2.67% (Year over Year % Change) -4.0% -6.2% -2.8% -2.6% -2.9% -1.3% -3.1% -1.9% -1.9%
Domestic Limited Liability Company 19,236 20,323 21,542 22,460 23,531 24,545 26,011 27,340 29,088 30,852 4.84% Domestic Limited Liability Partnership 106 99 90 107 106 110 111 114 105 107 0.09% Domestic Limited Partnership 2,357 2,378 2,407 2,380 2,379 2,406 2,403 2,418 2,416 2,426 0.29% Domestic Limited Total 21,699 22,800 24,039 24,947 26,016 27,061 28,525 29,872 31,609 33,385 4.40% (Year over Year % Change) 5.1% 5.4% 3.8% 4.3% 4.0% 5.4% 4.7% 5.8% 5.6%
Domestic Non-Profit Corporation 6,974 6,675 7,404 7,479 7,491 7,667 7,730 7,144 7,833 7,879 1.23% (Year over Year % Change) -4.3% 10.9% 1.0% 0.2% 2.3% 0.8% -7.6% 9.6% 0.6%
Foreign Profit Corporation 9,840 10,034 10,480 10,708 11,040 11,328 11,694 11,873 12,176 12,456 2.39% Foreign Limited Liability Company 3,388 3,815 4,333 4,728 5,187 5,709 6,306 6,901 7,631 8,351 9.44% Foreign Limited Liability Partnership 627 634 630 642 630 646 656 673 678 701 1.12% Foreign Limited Partnership 456 451 535 564 591 574 628 615 688 698 4.35% Foreign Non-Profit Corporation 41 51 47 52 54 55 60 67 71 66 4.88% Foreign Total 14,352 14,985 16,025 16,694 17,502 18,312 19,344 20,129 21,244 22,272 4.49% (Year over Year % Change) 4.4% 6.9% 4.2% 4.8% 4.6% 5.6% 4.1% 5.5% 4.8%
Bank 38 38 38 38 38 39 38 38 38 38
Benefit Corporation - - - - - 1 4 5 8 7
Consumer's Cooperative - - 2 2 2 2 2 2 3 2
Credit Union 58 58 56 43 43 42 42 42 40 41
Housing Authority 28 28 28 28 29 29 29 29 29 29
Insurance 50 50 49 49 48 48 48 47 47 49
Loan And Investment 9 9 7 7 7 7 6 6 6 6
Non-Profit Producers' Cooperative 33 33 33 33 33 33 33 34 34 35
Port Authority 1 1 2 2 1 1 1 1 1 1
Power of Attorney 5 5 19 20 21 20 24 26 61 66
Professional Service Benefit Corporation - - - - - - - - - 1
Professional Service Corporation 626 653 695 706 701 766 809 822 807 823
Transportation 5 5 5 5 5 5 5 5 5 5
Utility 11 11 11 11 11 10 10 10 10 10
Other Total 864 891 945 944 939 1,003 1,051 1,067 1,089 1,113 2.56% (Year over Year % Change) 3.1% 6.1% -0.1% -0.5% 6.8% 4.8% 1.5% 2.1% 2.2%
TOTAL 66,352 67,585 69,277 70,352 71,714 73,236 75,587 76,563 79,786 82,319 2.18% Yearly Change (number) 1,233 1,692 1,075 1,362 1,522 2,351 976 3,223 2,533
(Year over Year % Change) 1.9% 2.5% 1.6% 1.9% 2.1% 3.2% 1.3% 4.2% 3.2%
Rhode Island Business & Economic Report – 10-Year Overview (2008-2017)

9
Rhode Island New Entity Filings – Year End Totals
Table 2. Entity Type 2008 2009 2010 2011 2012 2013 2014 2015 2016 2017
10-Year CAGR
Domestic Profit Corporation 1229 1152 1087 1010 962 944 903 892 870 850 -3.62%
(Year-over-Year % Change) -6.3% -5.6% -7.1% -4.8% -1.9% -4.3% -1.2% -2.5% -2.3% Domestic Limited Liability Company 3359 3283 3304 3412 3651 3599 3932 4165 4337 4901 3.85%
Domestic Limited Liability Partnership 38 44 40 41 44 40 49 38 29 35 -0.82%
Domestic Limited Partnership 38 40 36 27 23 21 26 28 27 32 -1.70%
Domestic Limited Total 3,435 3,367 3,380 3,480 3,718 3,660 4,007 4,231 4,393 4,968 3.76%
(Year-over-Year % Change) -2.0% 0.4% 3.0% 6.8% -1.6% 9.5% 5.6% 3.8% 13.1%
Domestic Non-Profit 451 471 476 445 421 445 443 435 449 414 -0.85%
(Year-over-Year % Change) 4.4% 1.1% -6.5% -5.4% 5.7% -0.4% -1.8% 3.2% -7.8%
Foreign Profit Corporation 1127 1046 992 970 1057 1098 1035 1050 1055 1042 -0.78%
Foreign Limited Liability Company 736 701 705 790 828 917 896 1046 1128 1177 4.81%
Foreign Limited Liability Partnership 26 34 20 32 22 34 26 40 32 35 3.02%
Foreign Limited Partnership 33 16 23 26 16 14 17 23 21 19 -5.37%
Foreign Non-Profit Corporation 37 55 53 61 59 55 47 57 59 60 4.95%
Foreign Total 1,959 1,852 1,793 1,879 1,982 2,118 2,021 2,216 2,295 2,333 1.76%
(Year-over-Year % Change) -5.5% -3.2% 4.8% 5.5% 6.9% -4.6% 9.6% 3.6% 1.7%
Professional Service Corporation 62 57 39 32 37 31 32 32 24 39 Benefit Corporation - - - - - 2 2 2 3 3 Miscellaneous New Filings 2 1 3 - 1 - - 1 - - Other Total 64 58 42 32 38 33 34 35 27 42 -4.12%
(Year-over-Year % Change) -9.4% -27.6% -23.8% 18.8% -13.2% 3.0% 2.9% -22.9% 55.6%
TOTAL 7138 6900 6778 6846 7121 7200 7408 7809 8034 8607 1.89%
Yearly Change (number) -238 -122 68 275 79 208 401 225 573 (Year-over-Year % Change) -3.3% -1.8% 1.0% 4.0% 1.1% 2.9% 5.4% 2.9% 7.1%
Rhode Island Business & Economic Report – 10-Year Overview (2008-2017)

10
Rhode Island Economic Indicators (10-Year Overview)
Table 3. Rhode Island Economy 2008 2009 2010 2011 2012 2013 2014 2015 2016 2017 CAGR
Wealth & Income Median Household Income (2008 $) 53,373 51,943 51,089 47,043 52,674 52,144 53,379 50,622 55,206 58,314 0.89% Per Capita Personal Income (Chained 2009 $) 41,977 41,053 42,513 42,934 44,126 43,701 43,968 45,768 45,795 - 0.97% Sales & Gross Receipts Taxes (billion, 2008 $) 1.381 1.389 1.387 1.376 1.383 1.402 1.391 1.472 1.494 - 0.88% Total Taxes (billion, 2008 $) 2.761 2.595 2.536 2.597 2.690 2.709 2.705 2.904 2.930 - 0.66%
Business & Employment Unemployment Rate 7.808 10.975 11.200 11.025 10.392 9.267 7.708 6.000 5.208 4.458 -5.45% Average Hourly Earnings (S per hour) 22.5 22.52 22.67 23.73 25 25.42 25.1 24.94 25.99 26.97 1.83% Minimum Wage Rate ($ per hour) 7.4 7.4 7.4 7.4 7.4 7.8 8 9 9.6 9.6 2.64% All Employees: Total Nonfarm (thousand) 481 459 458 461 465 472 479 485 490 494 0.27% Total Wages and Salaries (million $) 21.67 20.91 21.48 22.01 22.66 23.45 24.57 25.6 26.11 27.04 2.24%
Economic Factors Real Total GDP (billion, chained 2012 $) 50.447 50.214 51.468 51.269 51.642 52.085 52.208 53.039 53.106 53.454 0.58% House Price Index (1980:Q1=100) 538.12 494.99 473.35 452.43 440.06 438.83 449.85 470.17 492.02 527.31 -0.20% Homeownership Rate (percent) 64.5 62.9 62.8 63.4 62.1 61.5 61.8 58.9 56.3 56.6 -1.30% Initial Jobless Claims 1,772 2,230 1,914 1,839 1,698 1,521 1,466 1,291 1,263 1,143 -4.29% Continuing Jobless Claims 15,995 22,935 18,342 16,477 14,572 12,787 11,940 10,333 9,677 9,163 -5.42% Rental Vacancy Rate (percent) 8.7 8.4 7.1 7.9 6.8 6.1 6.7 4.4 3.7 3.5 -8.70% Resident Population (million) 1.055 1.054 1.053 1.052 1.053 1.053 1.055 1.056 1.058 1.060 0.05%
Source: Federal Reserve Economic Data – Federal Reserve Bank of St. Louis, Link: https://fred.stlouisfed.org All Employees: Total Nonfarm in Rhode Island, Thousands of Persons, Annual, Not Seasonally Adjusted, Dataset: SMU44000000000000001A All-Transactions House Price Index for Rhode Island, Index 1980:Q1=100, Quarterly, Not Seasonally Adjusted, Dataset: RISTHPI - Averaged Annually
Average Hourly Earnings of All Employees: Total Private in Rhode Island, Dollars per Hour, Annual, Not Seasonally Adjusted, Dataset: SMU44000000500000003A Continued Claims (Insured Unemployment) in Rhode Island, Number, Weekly, Not Seasonally Adjusted, Dataset: RICCLAIMS - Averaged Annually Homeownership Rate for Rhode Island, Percent, Annual, Not Seasonally Adjusted, Dataset: RIHOWN Initial Claims in Rhode Island, Number, Weekly, Not Seasonally Adjusted, Dataset: RIICLAIMS - Averaged Annually Real Median Household Income in Rhode Island, 2017 CPI-U-RS Adjusted Dollars, Annual, Not Seasonally Adjusted, Dataset: MEHOINUSRIA672N - Adjusted to 2008 Dollars Real Per Capita Personal Income for Rhode Island, Chained 2009 Dollars, Annual, Not Seasonally Adjusted, Dataset: RIRPIPC Real Total Gross Domestic Product for Rhode Island, Millions of Chained 2012 Dollars, Annual, Not Seasonally Adjusted, Dataset: RIRGSP Rental Vacancy Rate for Rhode Island, Percent, Annual, Not Seasonally Adjusted, Dataset: RIRVAC Resident Population in Rhode Island, Thousands of Persons, Annual, Not Seasonally Adjusted, Dataset: RIPOP State Government Tax Collections, Total Sales and Gross Receipts Taxes in Rhode Island, Thousands of Dollars, Annual, Not Seasonally Adjusted, Dataset: RISLGRTAX - Adjusted to 2008 Dollars State Government Tax Collections, Total Taxes in Rhode Island, Thousands of Dollars, Annual, Not Seasonally Adjusted, Dataset: RITOTLTAX - Adjusted to 2008 Dollars State Minimum Wage Rate for Rhode Island, Dollars per Hour, Annual, Not Seasonally Adjusted, Dataset: STTMINWGRI Total Wages and Salaries in Rhode Island, Thousands of Dollars, Quarterly, Seasonally Adjusted Annual Rate, Dataset: RIWTOT - Averaged Annually Unemployment Rate in Rhode Island, Percent, Monthly, Seasonally Adjusted, Dataset: RIUR - Averaged Annually
Rhode Island Business & Economic Report – 10-Year Overview (2008-2017)

11
National Economic Indicators (10-Year Overview)
Table 4. National Economy 2008 2009 2010 2011 2012 2013 2014 2015 2016 2017 CAGR
Wealth & Income Median Household Income (2008 $) 50,428 50,075 48,766 48,022 47,931 49,609 48,848 51,363 52,973 53,907 0.67% Per Capita Personal Income (Chained 2009 $) 41,055 39,376 39,623 40,772 41,729 41,373 42,586 44,235 44,412 - 0.88%
Business & Employment Unemployment Rate 5.192 8.617 8.975 8.342 7.450 6.767 5.667 4.842 4.458 3.983 -2.61% Average Hourly Earnings ($ per hour) 21.57 22.17 22.59 23.04 23.47 23.96 24.46 25.01 25.66 26.31 2.01% Federal Minimum Wage ($ per hour) 6.2 6.9 7.25 7.25 7.25 7.25 7.25 7.25 7.25 7.25 1.58% All Employees: Total Nonfarm Payrolls (million) 137.24 131.30 130.35 131.94 134.17 136.37 138.94 141.82 144.35 146.62 0.66% Total Wages and Salaries (trillion $) 6.142 5.859 5.976 6.217 6.491 6.673 7.017 7.385 7.607 7.966 2.63% Wages and Salaries, All employees (index, 2008=100) 100 101.72 103.31 104.92 106.67 108.48 110.55 112.99 115.57 118.42 1.71% Consumer Price Index (2008=100) 100 99.64 101.28 104.48 106.64 108.20 109.96 110.09 111.47 113.85 1.31%
Economic Factors Real GDP (trillion, chained 2012 $) 15.605 15.209 15.599 15.841 16.197 16.495 16.900 17.387 17.659 18.051 1.47% House Price Index (1980:Q1=100) 356.41 336.54 322.74 310.33 309.52 321.58 338.15 355.88 375.64 399.11 1.14% Homeownership Rate 67.8 67.35 66.83 66.13 65.48 65.15 64.48 64.48 63.4 63.88 -0.59% Initial Jobless Claims 417,942 573,731 459,000 408,604 374,615 343,308 308,288 278,019 262,642 244,692 -5.21% Continuing Jobless Claims 3,335,942 5,808,288 4,543,731 3,743,302 3,319,673 2,987,346 2,597,904 2,266,750 2,135,660 1,960,538 -5.18% Inflation Rate (consumer prices) 3.84 -0.36 1.64 3.16 2.07 1.46 1.62 0.12 1.26 2.13 -0.057
Source: Federal Reserve Economic Data – Federal Reserve Bank of St. Louis, Link: https://fred.stlouisfed.org All Employees: Total Nonfarm Payrolls, Thousands of Persons, Monthly, Seasonally Adjusted, Dataset: PAYEMS - Averaged Annually All-Transactions House Price Index for the United States, Index 1980:Q1=100, Quarterly, Not Seasonally Adjusted, Dataset: USSTHPI - Averaged Annually Average Hourly Earnings of All Employees: Total Private, Dollars per Hour, Annual, Seasonally Adjusted, Dataset: CES0500000003 Consumer Price Index: Total All Items for the United States, Index 2015=100, Annual, Not Seasonally Adjusted, Dataset: CPALTT01USA661S Continued Claims (Insured Unemployment), Number, Weekly, Seasonally Adjusted, Dataset: CCSA - Averaged Annually Employment Cost Index: Wages and salaries for All Civilian workers in All industries and occupations, Index Dec 2005=100, Annual, Not Seasonally Adjusted, Dataset: CIU1020000000000I Federal Minimum Wage Rate under the Federal Fair Labor Standards Act, Dollars per Hour, Annual, Not Seasonally Adjusted, Dataset: STTMINWGFG Homeownership Rate for the United States, Percent, Annual, Not Seasonally Adjusted, Dataset: USHOWN Inflation, consumer prices for the United States, Percent, Annual, Not Seasonally Adjusted, Dataset: FPCPITOTLZGUSA Initial Claims, Number, Weekly, Seasonally Adjusted, Dataset: ICSA - Averaged Annually Real Gross Domestic Product, Billions of Chained 2012 Dollars, Annual, Not Seasonally Adjusted, Dataset: GDPCA Real Median Household Income in the United States, 2017 CPI-U-RS Adjusted Dollars, Annual, Not Seasonally Adjusted, Dataset: MEHOINUSA672N - Adjusted to 2008 Dollars Real Per Capita Personal Income for United States, Chained 2009 Dollars, Annual, Not Seasonally Adjusted, Dataset: RPIPCUS Total wages and salaries, BLS, Billions of Dollars, Annual, Not Seasonally Adjusted, Dataset: BA06RC1A027NBEA Unemployment Rate: 20 years and over, Percent, Monthly, Seasonally Adjusted, Dataset: LNS14000024 - Averaged Annually
Rhode Island Business & Economic Report – 10-Year Overview (2008-2017)
12
New England Economic Indicators (10-Year Overview)
Table 5. New England 2008 2009 2010 2011 2012 2013 2014 2015 2016 2017 CAGR
Average Hourly Earnings of All Employees: Total Private, Dollars per Hour, Annual, Not Seasonally Adjusted a
Connecticut 27.7 27.8 28.1 28.2 28.1 28.0 28.2 29.1 30.4 31.2 1.18%
Maine 19.0 19.2 19.5 20.0 21.0 21.0 21.3 21.9 22.3 23.2 2.05%
Massachusetts 26.4 26.8 27.1 27.6 28.1 28.9 29.5 30.4 31.2 32.1 1.99%
New Hampshire 22.7 22.7 23.0 23.0 23.7 24.3 24.3 24.9 25.7 26.3 1.50%
Rhode Island 22.5 22.5 22.7 23.7 25.0 25.4 25.1 24.9 26.0 27.0 1.83%
Vermont 21.4 22.4 23.0 23.0 22.8 22.8 23.2 24.1 24.3 24.4 1.36%
All Employees: Total Nonfarm, Thousands of Persons, Annual, Not Seasonally Adjusted b
Connecticut 1,699 1,627 1,608 1,624 1,638 1,650 1,662 1,674 1,679 1,681 -0.11%
Maine 617 596 593 595 598 602 605 611 618 623 0.09%
Massachusetts 3,318 3,211 3,222 3,259 3,311 3,365 3,432 3,499 3,565 3,608 0.84%
New Hampshire 649 628 624 627 634 639 646 656 668 675 0.40%
Rhode Island 481 460 458 461 465 471 479 485 490 494 0.27%
Vermont 307 297 298 301 305 307 310 312 313 314 0.22%
Real Total Gross Domestic Product, Millions of Chained 2012 Dollars, Annual, Not Seasonally Adjusted c
Connecticut 259,722 248,041 247,461 242,020 243,801 241,081 237,558 241,987 241,682 238,943 -0.83%
Maine 53,921 53,064 53,776 53,088 52,874 52,505 53,418 53,634 54,563 55,599 0.31%
Massachusetts 412,601 408,062 424,581 434,724 444,330 444,866 453,479 469,900 477,688 490,175 1.74%
New Hampshire 65,017 64,450 66,442 66,840 67,689 68,800 69,474 71,190 72,559 74,408 1.36%
Rhode Island 50,447 50,214 51,468 51,269 51,642 52,085 52,208 53,039 53,106 53,454 0.58%
Vermont 27,437 26,997 28,111 28,733 28,887 28,499 28,491 28,770 29,175 29,567 0.75% Source: Federal Reserve Economic Data – Federal Reserve Bank of St. Louis, Link: https://fred.stlouisfed.org a Datasets: SMU09000000500000003A, SMU23000000500000003A, SMU25000000500000003A, SMU33000000500000003A, SMU44000000500000003A, SMU50000000500000003A b Datasets: SMU09000000000000001A, SMU23000000000000001A, SMU25000000000000001A, SMU33000000000000001A, SMU44000000000000001A, SMU50000000000000001A c Datasets: CTRGSP, MARGSP, MERGSP, NHRGSP, RIRGSP, VTRGSP
Rhode Island Business & Economic Report – 10-Year Overview (2008-2017)

13
Rhode Island 2017 Entities in Good Standing – All US Zip Codes*
Table 6. Industry Sector
Domestic Profit
Corporation
Domestic Limited Liability
Company
Domestic Non-Profit
Corporation Domestic Total
Foreign Profit
Corporation
Foreign Limited Liability
Company
Foreign Non-Profit
Corporation Foreign Total TOTAL*
Accommodation, Food Services 1,352 1,029 16 2,397 102 162 3 267 2,664
Administrative, Waste, Remediation 692 525 25 1,242 936 649 8 1,593 2,835
Agriculture, Forestry, Fishing, Hunting 148 184 11 343 17 8 3 28 371
Arts, Entertainment, Recreation 314 585 322 1,221 69 44 16 129 1,350
Construction 2,384 1,538 26 3,948 1,592 604 2 2,198 6,146
Educational Services 121 212 440 773 67 43 58 168 941
Finance and Insurance 508 509 18 1,035 1,659 1,075 22 2,756 3,791
Health Care, Social Assistance 779 779 1,109 2,667 226 221 122 569 3,236
Information 146 226 50 422 459 312 4 775 1,197
Management of Companies and Enterprises 57 142 1 200 128 109 1 238 438
Manufacturing 1,336 611 11 1,958 863 347 3 1,213 3,171
Mining, Quarrying, Extraction 53 24 - 77 28 8 - 36 113
Other Services (except Public Administration) 1,350 1,146 5,146 7,642 325 183 351 859 8,501
Professional, Scientific, Technical 1,436 2,073 42 3,551 2,091 910 40 3,041 6,592
Public Administration 20 18 72 110 23 15 13 51 161
Real Estate, Rental, Leasing 2,233 10,640 77 12,950 490 1,082 2 1,574 14,524
Retail Trade 1,778 1,000 9 2,787 476 252 2 730 3,517
Transportation, Warehousing 418 439 6 863 188 70 1 259 1,122
Utilities 38 41 7 86 60 120 1 181 267
Wholesale Trade 652 426 3 1,081 698 345 2 1,045 2,126
Unspecified 81 4,869 57 5,007 1,147 1,208 19 2,374 7,381
TOTAL* 15,896 27,016 7,448 50,360 11,644 7,767 673 20,084 70,444 Note: This table includes entities in good standing (excluding all inactive types plus entities under 60 day revocation notice at the time of preparing this report). Partnership entities (Domestic Limited Liability Partnership, Domestic Limited Partnership, Foreign Limited Liability Partnership, and Foreign Limited Partnership) and other entity types are not included (please see Table 1 for aggregated data). * Numbers slightly differ from 2017 year end totals at the time of preparing this report. Report prepared in quarter 4 of 2018.
Rhode Island Business & Economic Report – 10-Year Overview (2008-2017)

14
Rhode Island 2017 Entities in Good Standing – Primary Address in Rhode Island*
Table 7. Industry Sector Domestic Profit Corporation
Domestic Limited Liability Company
Domestic Non-Profit Corporation Domestic Total
Accommodation, Food Services 1,320 980 15 2,315
Administrative, Waste, Remediation 676 506 22 1,204
Agriculture, Forestry, Fishing, Hunting 146 180 11 337
Arts, Entertainment, Recreation 295 541 301 1,137
Construction 2,321 1,484 25 3,830
Educational Services 115 201 423 739
Finance and Insurance 469 486 14 969
Health Care, Social Assistance 759 729 1,081 2,569
Information 128 214 45 387
Management of Companies and Enterprises 48 128 1 177
Manufacturing 1,286 585 9 1,880
Mining, Quarrying, Extraction 52 24 - 76
Other Services (except Public Administration) 1,326 1,095 4,988 7,409
Professional, Scientific, Technical 1,375 2,001 37 3,413
Public Administration 16 18 43 77
Real Estate, Rental, Leasing 2,099 9,597 74 11,770
Retail Trade 1,727 970 8 2,705
Transportation, Warehousing 399 404 6 809
Utilities 33 33 3 69
Wholesale Trade 625 399 3 1,027
Unspecified 61 4,092 34 4,187
TOTAL in RI* 15,276 24,667 7,143 47,086
Percentage of total with Primary address in RI 96.1% 91.3% 95.9% 93.5% Note: Table excludes entities with primary zip code outside the State of Rhode Island, or with unspecified primary zip code. This table includes entities in good standing (we are excluding all inactive types plus entities under 60 day revocation notice). Only the Domestic entities are reported. Other entity types are not included (please see Table 1 for aggregated data). Foreign entities and other entity types are not included. * Numbers slightly differ from 2017 year end totals at the time of preparing this report. Report prepared in quarter 4 of 2018.
Rhode Island Business & Economic Report – 10-Year Overview (2008-2017)

15
Rhode Island Inactive Entities
Table 8. Inactive Type 2008 2009 2010 2011 2012 2013 2014 2015 2016 2017
Bankruptcy 15 9 8 Cancelled 88 106 130 165 200 168 107 155 145 146
Consolidated 4 6 Conversion 48 56 55 49 108 130 179 157 181 212
Dissolved 601 636 551 677 814 931 753 952 1092 989
Expired 328 63 86 79 66 75 86 86 68 74
Mastership 2 1 1
Merged 98 123 38 43 34 54 42 52 45 38
Receivership 25 11 12 11 7 18 20 9 18
Revoked Entity 5,363 5,060 4,466 4,630 4,548 4,358 4,223 4,572 4,363 5,043
Withdrawn 223 260 245 216 249 230 166 179 229 173
TOTAL 6,780 6,304 5,582 5,886 6,031 5,968 5,582 6,173 6,132 6,694
Yearly Change (number) -476 -722 304 145 -63 -386 591 -41 562
(Year-over-Year % Change) -7.0% -11.5% 5.4% 2.5% -1.0% -6.5% 10.6% -0.7% 9.2%
Table 9.
Total Number of Revocations Yearly Average Average Life Revocations (2008-2017)
Domestic Limited Liability Company 22,107 2,211 4 years & 3 months Domestic Profit Corporation 12,563 1,256 10 years & 7 months Domestic Non-Profit Corporation 2,794 279 9 years & 7 months
Foreign Limited Liability Company 3,329 333 4 years & 4 months Foreign Profit Corporation 5,462 546 6 years & 8 months Foreign Non-Profit Corporation 184 18 7 years & 0 months
Professional Service Corporation 183 18 13 years & 2 months Benefit Corporation 4 - 1 year & 10 months
TOTAL 46,626 4,663 6 years & 7 months
Rhode Island Business & Economic Report – 10-Year Overview (2008-2017)
16
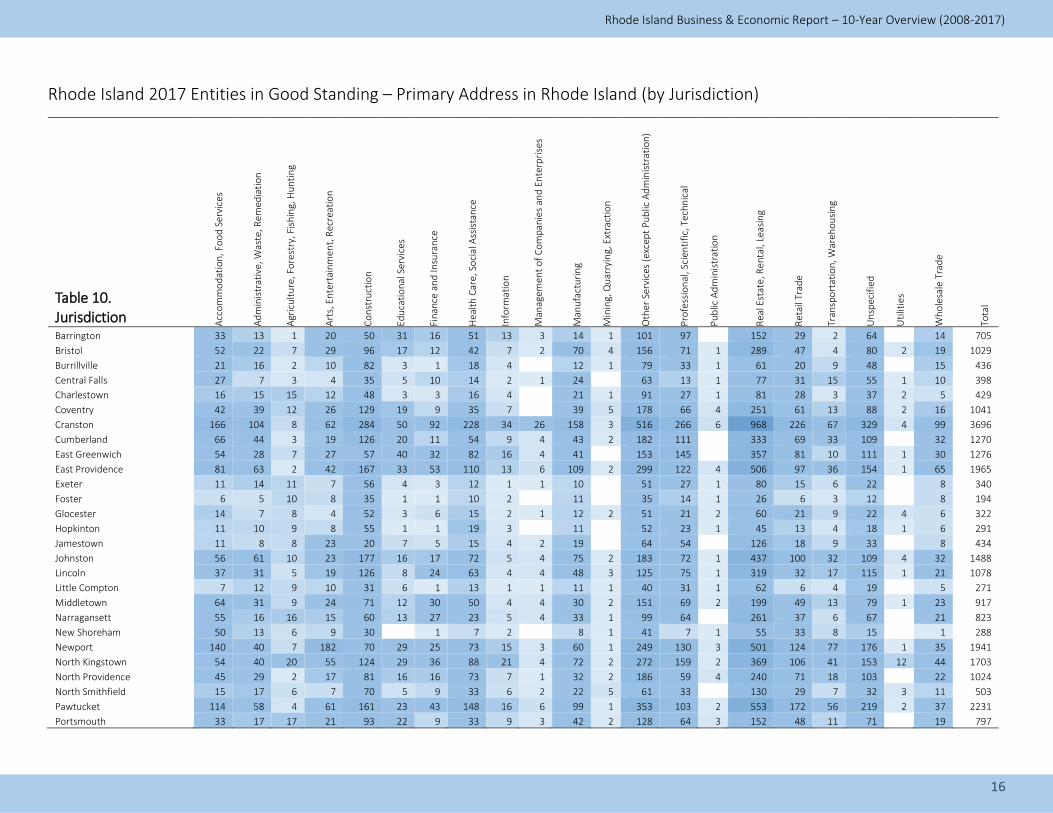
Rhode Island 2017 Entities in Good Standing – Primary Address in Rhode Island (by Jurisdiction)
Table 10. Jurisdiction A
cco
mm
od
atio
n, F
oo
d S
ervi
ces
Ad
min
istr
ativ
e, W
aste
, Rem
edia
tio
n
Agr
icu
ltu
re, F
ore
stry
, Fis
hin
g, H
un
tin
g
Art
s, E
nte
rtai
nm
ent,
Rec
reat
ion
Co
nst
ruct
ion
Edu
cati
on
al S
ervi
ces
Fin
ance
an
d In
sura
nce
Hea
lth
Car
e, S
oci
al A
ssis
tan
ce
Info
rmat
ion
Man
agem
ent
of
Co
mp
anie
s an
d E
nte
rpri
ses
Man
ufa
ctu
rin
g
Min
ing,
Qu
arry
ing,
Ext
ract
ion
Oth
er S
ervi
ces
(exc
ept
Pu
blic
Ad
min
istr
atio
n)
Pro
fess
ion
al, S
cien
tifi
c, T
ech
nic
al
Pu
blic
Ad
min
istr
atio
n
Rea
l Est
ate,
Ren
tal,
Leas
ing
Ret
ail T
rad
e
Tran
spo
rtat
ion
, War
eho
usi
ng
Un
spec
ifie
d
Uti
litie
s
Wh
ole
sale
Tra
de
Tota
l
Barrington 33 13 1 20 50 31 16 51 13 3 14 1 101 97 152 29 2 64 14 705
Bristol 52 22 7 29 96 17 12 42 7 2 70 4 156 71 1 289 47 4 80 2 19 1029
Burrillville 21 16 2 10 82 3 1 18 4 12 1 79 33 1 61 20 9 48 15 436
Central Falls 27 7 3 4 35 5 10 14 2 1 24 63 13 1 77 31 15 55 1 10 398
Charlestown 16 15 15 12 48 3 3 16 4 21 1 91 27 1 81 28 3 37 2 5 429
Coventry 42 39 12 26 129 19 9 35 7 39 5 178 66 4 251 61 13 88 2 16 1041
Cranston 166 104 8 62 284 50 92 228 34 26 158 3 516 266 6 968 226 67 329 4 99 3696
Cumberland 66 44 3 19 126 20 11 54 9 4 43 2 182 111 333 69 33 109 32 1270
East Greenwich 54 28 7 27 57 40 32 82 16 4 41 153 145 357 81 10 111 1 30 1276
East Providence 81 63 2 42 167 33 53 110 13 6 109 2 299 122 4 506 97 36 154 1 65 1965
Exeter 11 14 11 7 56 4 3 12 1 1 10 51 27 1 80 15 6 22 8 340
Foster 6 5 10 8 35 1 1 10 2 11 35 14 1 26 6 3 12 8 194
Glocester 14 7 8 4 52 3 6 15 2 1 12 2 51 21 2 60 21 9 22 4 6 322
Hopkinton 11 10 9 8 55 1 1 19 3 11 52 23 1 45 13 4 18 1 6 291
Jamestown 11 8 8 23 20 7 5 15 4 2 19 64 54 126 18 9 33 8 434
Johnston 56 61 10 23 177 16 17 72 5 4 75 2 183 72 1 437 100 32 109 4 32 1488
Lincoln 37 31 5 19 126 8 24 63 4 4 48 3 125 75 1 319 32 17 115 1 21 1078
Little Compton 7 12 9 10 31 6 1 13 1 1 11 1 40 31 1 62 6 4 19 5 271
Middletown 64 31 9 24 71 12 30 50 4 4 30 2 151 69 2 199 49 13 79 1 23 917
Narragansett 55 16 16 15 60 13 27 23 5 4 33 1 99 64 261 37 6 67 21 823
New Shoreham 50 13 6 9 30 1 7 2 8 1 41 7 1 55 33 8 15 1 288
Newport 140 40 7 182 70 29 25 73 15 3 60 1 249 130 3 501 124 77 176 1 35 1941
North Kingstown 54 40 20 55 124 29 36 88 21 4 72 2 272 159 2 369 106 41 153 12 44 1703
North Providence 45 29 2 17 81 16 16 73 7 1 32 2 186 59 4 240 71 18 103 22 1024
North Smithfield 15 17 6 7 70 5 9 33 6 2 22 5 61 33 130 29 7 32 3 11 503
Pawtucket 114 58 4 61 161 23 43 148 16 6 99 1 353 103 2 553 172 56 219 2 37 2231
Portsmouth 33 17 17 21 93 22 9 33 9 3 42 2 128 64 3 152 48 11 71 19 797
Rhode Island Business & Economic Report – 10-Year Overview (2008-2017)

17
Rhode Island 2017 Entities in Good Standing – Primary Address in Rhode Island (by Jurisdiction) Continued
Table 10 cont. Jurisdiction A
cco
mm
od
atio
n, F
oo
d S
ervi
ces
Ad
min
istr
ativ
e, W
aste
, Rem
edia
tio
n
Agr
icu
ltu
re, F
ore
stry
, Fis
hin
g, H
un
tin
g
Art
s, E
nte
rtai
nm
ent,
Rec
reat
ion
Co
nst
ruct
ion
Edu
cati
on
al S
ervi
ces
Fin
ance
an
d In
sura
nce
Hea
lth
Car
e, S
oci
al A
ssis
tan
ce
Info
rmat
ion
Man
agem
ent
of
Co
mp
anie
s an
d E
nte
rpri
ses
Man
ufa
ctu
rin
g
Min
ing,
Qu
arry
ing,
Ext
ract
ion
Oth
er S
ervi
ces
(exc
ept
Pu
blic
Ad
min
istr
atio
n)
Pro
fess
ion
al, S
cien
tifi
c, T
ech
nic
al
Pu
blic
Ad
min
istr
atio
n
Rea
l Est
ate,
Ren
tal,
Leas
ing
Ret
ail T
rad
e
Tran
spo
rtat
ion
, War
eho
usi
ng
Un
spec
ifie
d
Uti
litie
s
Wh
ole
sale
Tra
de
Tota
l
Providence 484 133 16 138 323 142 234 518 87 60 244 4 1529 591 22 2211 426 148 888 7 139 8344
Richmond 6 5 4 3 25 2 2 8 1 4 1 30 16 29 16 2 17 1 5 177
Saunderstown 1 1
Scituate 14 24 7 11 87 6 6 18 6 1 16 91 43 1 142 30 10 42 9 564
Smithfield 51 26 9 20 158 20 21 53 11 1 62 4 146 92 2 298 66 13 74 2 33 1162
South Kingstown 60 48 40 48 152 34 20 109 9 2 78 6 281 119 1 348 99 5 122 1 41 1623
Tiverton 26 19 16 18 53 6 8 21 3 3 25 2 88 52 118 53 15 48 1 24 599
Warren 34 14 4 12 44 11 7 26 3 2 26 104 48 125 28 5 40 1 12 546
Warwick 145 100 14 69 315 65 115 248 25 14 176 6 624 298 3 1084 195 50 315 9 87 3957
West Greenwich 15 9 5 4 42 4 9 19 1 2 10 34 21 71 18 5 31 1 7 308
West Warwick 41 19 1 18 72 12 12 32 9 1 38 4 152 51 1 213 59 18 96 1 20 870
Westerly 108 27 3 40 110 8 27 70 8 4 32 5 209 84 4 259 77 15 96 3 21 1210
Woonsocket 50 20 1 12 63 13 15 50 8 1 43 162 42 181 69 10 78 17 835
TOTAL 2315 1204 337 1137 3830 739 969 2569 387 177 1880 76 7409 3413 77 11770 2705 809 4187 69 1027 47086
Note: Table includes entities in good standing (we are excluding all inactive types plus entities under 60 day revocation notice). This table only includes entities with primary zip code inside the State of Rhode Island. This
table also only includes Domestic LLCs, Profit Corporations, and Non-Profit Corporations. Foreign entities and other entity types are not included. Please refer to Table 7 for more details. Number of entities is not
representative of the size of the entities in terms of total revenue or total employment.
Rhode Island Business & Economic Report – 10-Year Overview (2008-2017)

18
Rhode Island Business & Economic Report – 10-Year Overview (2008-2017)
Copyright © 2019. Roger Williams University Mario J. Gabelli School of Business and the Rhode Island Department of State.
This report is prepared in a partnership between the
Office of the Rhode Island Secretary of State Business Division
and the
Roger Williams University Mario J. Gabelli School of Business
Business Portal Rhode Island Business Portal is designed to help you access the tools that you will need to plan, start, and maintain your business or non-profit. To find out more, go to: http://sos.ri.gov/divisions/business-portal Business Basics page assists you to learn about writing a business plan, structuring your business, and the costs and fees.
Annual Report page lists deadlines and fees.
File online page is now available to file your annual report electronically.
NAICS code is the North American Industry Classification System that is the standard used by federal statistical agencies in classifying business establishments for the purpose of collecting, analyzing, and publishing statistical data related to the U.S. business economy. To learn more, go to: http://sos.ri.gov/divisions/business-portal/naics/naics
CONTACT US
401-222-3040 [email protected]
148 West River Street
Providence, RI 02904-2615