Rhode Island Department of orrections Population Repor… · I am pleased to present the Rhode...
26
RIDOC Goals To maximize community protecon through the instuonal confinement of offend- ers and appropriate levels of supervision in the community. To recognize and respect the rights and needs of the vicms of crime. To involve community organizaons, volunteers, and outside professionals in pro- gram development and service delivery. To foster the best possible relaons with the public and all elements of the Criminal Jusce System. To assist offenders in their rehabilitave efforts by affording them the opportunity to parcipate in essenal rehabilitave services in the instuons and community. To encourage offenders to become accountable for their acons. To enhance the connuum of community and instuonal services in order to pro- vide for appropriate management of criminal offenders. To employ, explore, and ulize research, technology, equipment, planning, and eval- uaon in the development of programs and standards. To provide ongoing staff development in order to increase job performance, abili- es, and professional opportunies. To promote a posive and safe work environment characterized by the mutual re- spect of all staff. To act in accordance with the highest ethical, legal, and professional standards. RIDOC Mission Statement The mission of the Rhode Island Department of Correcons (RIDOC) is to contribute to public safety by maintaining a balanced correconal system of instuon- al and community programs that provide a range of control and rehabilitave opons which facili- tate successful offender reentry. Table of Contents Message from the Director P. 2 Overview of Facilies P. 3 Organizaonal Structure & Units P. 5 Total Populaon Trends P. 8 Offender Characteriscs P. 11 Pretrial Populaon P. 14 Sentenced Populaon Stas- cs P. 15 Current Populaon & Future Projecons P. 19 Release Stascs P. 21 Community Correcons P. 23 The Future of RIDOC P. 25 Rhode Island Department of Correcons Fiscal Year 2016 Annual Populaon Report October 2016
Transcript of Rhode Island Department of orrections Population Repor… · I am pleased to present the Rhode...

RIDOC Goals To maximize community protection through the institutional confinement of offend-
ers and appropriate levels of supervision in the community.
To recognize and respect the rights and needs of the victims of crime.
To involve community organizations, volunteers, and outside professionals in pro-gram development and service delivery.
To foster the best possible relations with the public and all elements of the Criminal Justice System.
To assist offenders in their rehabilitative efforts by affording them the opportunity to participate in essential rehabilitative services in the institutions and community.
To encourage offenders to become accountable for their actions.
To enhance the continuum of community and institutional services in order to pro-vide for appropriate management of criminal offenders.
To employ, explore, and utilize research, technology, equipment, planning, and eval-uation in the development of programs and standards.
To provide ongoing staff development in order to increase job performance, abili-ties, and professional opportunities.
To promote a positive and safe work environment characterized by the mutual re-spect of all staff.
To act in accordance with the highest ethical, legal, and professional standards.
RIDOC Mission Statement
The mission of the Rhode Island
Department of Corrections
(RIDOC) is to contribute to public
safety by maintaining a balanced
correctional system of institution-
al and community programs that
provide a range of control and
rehabilitative options which facili-
tate successful offender reentry.
Table of Contents
Message from the Director
P. 2
Overview of Facilities P. 3
Organizational Structure &
Units P. 5
Total Population Trends P. 8
Offender Characteristics P. 11
Pretrial Population P. 14
Sentenced Population Statis-
tics P. 15
Current Population & Future
Projections P. 19
Release Statistics P. 21
Community Corrections P. 23
The Future of RIDOC P. 25
Rhode Island Department of Corrections Fiscal Year 2016 Annual Population Report October 2016

2
From RIDOC Director
Ashbel T. Wall II
Director’s Message
I am pleased to present the Rhode Island Department of Corrections’ Annual Population Report for Fiscal Year
2016. Our Planning and Research Unit has once again taken voluminous information and compiled it into a
comprehensive, interesting, and easy-to-understand document. In addition to a thorough analysis of population
data, you will find descriptions of each of the Adult Correctional Institutions’ facilities, a helpful organizational
chart, and a breakdown of the characteristics of a typical sentenced offender. This year the report also profiles
and highlights the valuable work the Planning and Research Unit performs.
Here are some of the important takeaways from this year’s edition:
Commitments to the ACI and our daily population are at the lowest levels we have seen in at least fourteen
years.
JFA Associates, who have performed population projections for the RIDOC for over twenty-five years, projects
that the Rhode Island prison population will stay relatively stagnant with under two percent growth over the
course of the next decade.
As we look to the future, we are committed to using evidence-based risk assessment tools to identify offend-
ers’ risks and criminogenic needs for case management both inside the prison walls and in the community.
Going forward, RIDOC is committing to the use of evidence-based risk assessment tools that identify offend-
ers’ risks and criminogenic needs for case management inside the prison walls as well as in the community.
We are fortunate to be part of the Justice Reinvestment Working Group created by Governor Gina Raimon-
do’s Executive Order and to be working with the Council of State Governments on methods of case manage-
ment that lead to more successful offender reentry.
I hope you find this report useful and thought-provoking.
Thank you.

3
Intake Service Center
Opened: 1982 - Expanded: 1992 - Renovat-
ed: 1995
Average Facility Population: 935 (FY16)
Operational Capacity: 1,118 (FY16)
Annual Cost per Offender: $48,750
The Intake Service Center (ISC) is a maxi-
mum security facility which serves as Rhode
Island’s jail for male offenders. Rhode Island
is one of six states that have unified systems,
incorporating the jail and state prison into
one department. The south wing of the facil-
ity was constructed in 1982, while the north
wing was constructed in 1992.
Inmates housed at the ISC fall into several
categories: pretrial detainees, newly sen-
tenced inmates who are awaiting classifica-
tion to other facilities, and sentenced pro-
tective custody. The facility processed
11,918 commitments in FY16, approximately
993 commitments per month. On average,
120 inmates are sent to court daily and 50
inmates per week are processed and trans-
ferred to other facilities within the Depart-
ment of Corrections. The length of time an
inmate remains housed in awaiting trial sta-
tus at the ISC is approximately 23 days (see
graph on p.14 for further details); this trans-
lates into a constant turnover of the inmate
population.
Minimum Security
Opened: 1978 - Expanded: 1989 & 1992
Average Facility Population: 393 (FY16)
Operational Capacity: 710 (FY16)
Annual Cost per Offender: $61,185
The Minimum Security facility was opened in
1978 in a converted hospital building on
Howard Avenue in Cranston. In 1989, Mini-
mum Security (MIN) expanded to a second
building, and in July of 1992, with the con-
struction of a connecting addition, the facili-
ty became one large complex, with a 710-
bed inmate capacity.
The perimeter is surrounded by a low securi-
ty fence, consistent with the minimum cus-
tody level. All Minimum Security inmates,
unless medically certified as unable to work,
are employed either within the institution,
on public service projects through work re-
lease, or are seeking employment.
Medium Security:
John J. Moran Facility
Opened: 1992
Average Facility Population: 1,082 (FY16)
Operational Capacity: 1,126 (FY16)
Annual Cost per Offender: $42,281
The John J. Moran Facility was constructed
from 1990 to 1992, at a cost of $65,000,000.
The facility covers 29 acres and houses sen-
tenced adult male offenders who are classi-
fied as medium custody. Extensive program-
ming is provided with the goal of preparing
inmates for successful return to their com-
munities.
Facilities The Adult Correctional Institutions (ACI) at the Rhode Island Department of Corrections (RIDOC) is comprised of 7 inmate facilities (5
male, 2 female), which are all located within 1 square mile in Cranston, RI. The State of Rhode Island operates a unified correctional
system, meaning that all offenders (i.e., those awaiting trial, sentenced, and under community supervision) in the state are under the
jurisdiction of RIDOC.

4
Maximum Security
Opened: 1878
Average Facility Population: 437 (FY16)
Operational Capacity: 409 (FY16)
Annual Cost per
Offender: $66,480
The Maximum
Security facility is
the state’s oldest
operational prison.
The facility was
opened during
1878 and is mod-
eled on the Auburn style construction, which consolidates all in-
mate cells into one main building.
Maximum Security (MAX) once served as the prison for both
awaiting trial and sentenced inmates. As the sentenced population
grew and the needs of the prison system changed, other facilities
were added.
Surrounded by a wall with five observation towers, this facility is
broken down into six housing areas with one segregation unit. The
population is comprised of inmates serving long sentences for a
variety of offenses, along with inmates serving shorter sentences
who have been transferred to MAX from other facilities for serious
discipline and/or behavioral problems. Inmates are prepared for
classification to lesser securities through participation in rehabilita-
tive programs.
High Security
Opened: 1981
Average Facility Population: 96 (FY16)
Operational Capacity: 138 (FY16)
Annual Cost per Offender: $187,369
The High Security Center
(HSC) is a supermax facility,
which houses inmates who
require close custody and
control, including protective
custody inmates. All inmates
are on restricted status;
therefore, there are no con-
tact visits and limited programming. The inmate population has
access to a well stocked legal and recreational library, a classifica-
tion board room, a classroom, barber shop, and a chapel.
Women’s Facilities
Gloria McDonald Building
Opened: December, 2010
Average Population: 103 (FY16)
Operational Capacity: 173 (FY16)
Annual Cost per Offender: $147,913 (both women’s facilities)
Bernadette Building
Opened: December, 2011
Average Population: 22 (FY16)
Operational Capacity: 100 (FY16)
The Women’s Facilities (WOM)
house awaiting trial offenders
and three classification levels
(medium, minimum, and work
release) in two separate build-
ings. In late 2010 and 2011,
facilities housing these offenders (referenced in previous reports as
the GM and DIX buildings) were closed to the inmate population.
The awaiting trial and medium-security women were moved to WFI
which was later re-dedicated as the Gloria McDonald Building (GM),
while the minimum security/work-release offenders are now
housed in Women’s Facility II (WFII), also known as the Bernadette
Building. GM, is a converted and expanded hospital building and
was initially constructed to be a male Reintegration Center. WFII
was originally designed to house work release security men and in
later years housed Community Corrections and Education offices.
Changes were made to both of these buildings to target the specific
needs for women prior to their opening. The unique social, cultural,
and gender-specific needs of female offenders are supported by
staff and incorporated into programming and treatment within the
facilities.
Facilities

5
RIDOC is divided into 3 divisions; Administration, Institutions and Operations, and Rehabilitative Ser-
vices. Each division plays an imperative role in the Department’s operations, activities, processes, ser-
vices, etc. This organizational chart reflects the breakdown of divisions and illustrates which units fall
under each Assistant Director’s supervision.
RIDOC Organizational Chart

6
Administration Division
Assistant Director
Patricia A. Coyne-Fague
The Administration Division is comprised of approximately 90 employees who provide a variety of critical support
functions for the Department. While employees in this Division often work “behind the scenes,” their roles are inte-
gral to the overall function of the Department. The Administration Division is divided into the following units: Finan-
cial Resources, Human Resources*, Management Information Systems*, Planning & Research, Policy, and the Training
Academy. Administration Division staff members facilitate new departmental initiatives and also provide continued
support and guidance to all on-going functions at the RIDOC. Through a strong spirit of cooperation and dedication,
these staff members assist other divisions of the Department in achieving their goals and implementing the Depart-
ment’s mission. *Sub Unit is fully staffed by Department of Administration Centralized Services
Institutions and Operations
Assistant Director
James Weeden
The Institutions & Operations Division is comprised of the Department’s correctional facilities [collectively known as
the Adult Correctional Institutions (ACI)], Special Investigations Unit (SIU), Facilities and Maintenance Unit, Food Ser-
vices, and Correctional Emergency Response Team (CERT). Some responsibilities of Institutions and Operations in-
clude gathering intelligence to assure public safety, maintaining facilities to guarantee a healthy, safe and secure en-
vironment, and providing nutritionally balanced menus to all offenders. Institutions and Operations is the corner-
stone of daily operations at the Department of Corrections.
Rehabilitative Services
Assistant Director
Barry Weiner
The Division of Rehabilitative Services is committed to realizing the meaningful reintegration of offenders into the
community. Program areas within this Division can be categorized into two distinct sections: 1) Institutional or 2)
Community Corrections. Institutional corrections includes programming offered to the offender during incarceration,
such as Health Services, Educational Services, Institutional Programs, Classification, Adult Counselors and Volunteer/
Internship Services. Community Corrections refers to units such as Probation and Parole, Community Confinement,
Reentry Services, Correctional Industries, Furlough, and Victim Services. Not only does Rehabilitative Services work
with offenders to end criminal and anti-social behavior while incarcerated, they also strive to make it possible for ex-
offenders to successfully reintegrate back into their communities upon release.

7
The Planning & Research Unit
For nearly twenty years, the Planning & Research Unit has
been responsible for preparing an annual report of the in-
mate population for the Rhode Island Department of Cor-
rections. While publication of this report is an important
task, it is merely one of a myriad of projects for which the
Unit is responsible. Under the direction of the Associate
Director, the Unit assists with a multitude of essential plan-
ning functions, from coordinating and supervising Depart-
mental program initiatives via program development to
program evaluation and statistical analysis. The Unit is
comprised of a team of highly skilled staff members, in-
cluding a Senior Word Processing Typist, two Principal
Planners, an Economic and Policy Analyst, a Principal Re-
search Technician, and a Planner. While all working togeth-
er in the same Unit, they are responsible for different pro-
jects and duties and are an integral part of large scale de-
partmental initiatives such as Justice Reinvestment, the
State-wide Recidivism Reduction Grant, and the Prison
Rape Elimination Act.
Justice Reinvestment Initiative
Rhode Island was first awarded technical assistance under
the Justice Reinvestment initiative in 2008 as RIDOC faced a
particularly high inmate population, which threatened to
exceed federal court-ordered capacities. Since Rhode Island
had one of the most conservative sentence reduction for-
mulas in the country, bi-partisan legislation was passed
through the state’s General Assembly in an innovative
attempt to enhance public safety and curb the recidivism
rate while reducing the inmate population. This resulted in
an increased sentence reduction credits for good behavior
and established sentence reduction credits for program par-
ticipation and program completion. A well-documented in-
crease in program participation has led to overall reductions
in offenders’ length of stay, resulting in a decrease in the
overall prison population.
Rhode Island entered into a second JR initiative in 2015 with
focused attention on RI’s Community Corrections popula-
tion. In this effort, a working group created through an ex-
ecutive order by Governor Raimondo brought together a
diverse panel representing every facet of RI’s criminal jus-
tice system as well as lawmakers, community agency lead-
ers, and mental health advocates. The group worked for
several months to create legislation that would, among oth-
er things, introduce risk assessment at the pretrial stage,
modernize laws regarding sentencing and violations, and
increase accountability and effectiveness in probation.
What Does Planning & Research Do?
While this legislation did not pass in 2016, some imple-
mentation projects are moving forward, including the
early termination of probation supervision and the es-
tablishment of a Risk Assessment Unit in Adult Proba-
tion.
Recidivism Reduction Grant
In October 2012, RIDOC was awarded a Second Chance
Act Statewide Recidivism Reduction Grant to address
deficiencies identified in the use of assessment, case
management and programming interventions. The pur-
pose of the grant was to implement risk reduction strate-
gies and principles of effective correctional practice by
changing case management and case planning through
the application of risk/needs assessment. Some of the
goals that were achieved through this initiative include:
the expansion of risk assessments with the sentenced
population, the implementation of the Thinking for a
Change cognitive restructuring program in certain facili-
ties, and training for community corrections staff around
offender risk/need assessment. RIDOC is currently in the
process of instituting changes to statewide policies and
practices to address those higher-risk offenders that are
at a greater likelihood of reoffending.
Prison Rape Elimination Act (PREA)
The Prison Rape Elimination Act (PREA) mandates correc-
tional facilities take steps to ensure the prevention and
analysis of the incidence of prison rape. The Associate
Director of Planning and Research served as the Prison
Rape Elimination Act Coordinator from January 2008
through July 2016. In this capacity, the Associate Director
worked with the three divisions of RIDOC to ensure com-
pliance with national PREA Standards. As of August 2016,
each of the RIDOC correctional facilities had been audit-
ed for compliance with PREA Standards. There were a
multitude of PREA-affected policy changes enacted, in-
cluding a PREA specific policy. An Interdepartmental Pro-
ject Manager was hired to assume full time PREA Coordi-
nator responsibilities in July 2016.

8
Total RIDOC Population FY02 to FY16
As was the trend nationally, Rhode Island experienced marked growth in its total prison population between
2002 and 2008. The most recent sharp increase was between FY05 and FY08, where the population grew 14.8%.
However, since FY08 the population has seen a steady decline and fell 18% in the past five years. In RI, 197 out of
every 100,000 residents are imprisoned, while nationally 439 out of 100,000 adult US residents are incarcerated
(Bureau of Justice Statistics Prisoner Statistics 2010 Revised), which makes Rhode Island third lowest in the nation
in terms of the rate of incarceration.
During the new millennium, corrections professionals around the country began to focus on permanently reduc-
ing prison populations. The federal government also began to fund reentry initiatives aimed at helping offenders
succeed in the community post-release. Jurisdictions began to look at incentives for inmates who participate in
rehabilitative programs designed to assist them in the community upon their exit from incarceration. All of these
initiatives have been shown to impact the prison population levels.
For an historical look at the RIDOC population, please see the Report of the RI Correctional Population FY76-FY11
which can be found on the RIDOC webpage at www.doc.ri.gov.
Population Trends
3387
35373554
3361
3510
3771
3860
3773
3502
3273 31913160
32143183
3068
3000
3250
3500
3750
4000
02 03 04 05 06 07 08 09 10 11 12 13 14 15 16
# of
Off
ende
rs
Fiscal Year

9
The RIDOC saw a slight decrease in the average sentenced population (-1.4%) and a much larg-
er decrease in the awaiting trial population (-11.7%) in FY16 compared to FY15. There was an
overall decrease of 88 inmates (-2.8%) from start to close of FY16 (July 2015 until the close in
June 2016).
Sentenced Population
Awaiting Trial Population
Fiscal Year Population Trends FY2012-FY2016
2300
2400
2500
2600
2700
JUL AUG SEP OCT NOV DEC JAN FEB MAR APR MAY JUN
FY2012 FY2013 FY2014 FY2015 FY2016
500
550
600
650
700
750
800
850
JUL AUG SEP OCT NOV DEC JAN FEB MAR APR MAY JUN
FY2012 FY2013 FY2014 FY2015 FY2016
10
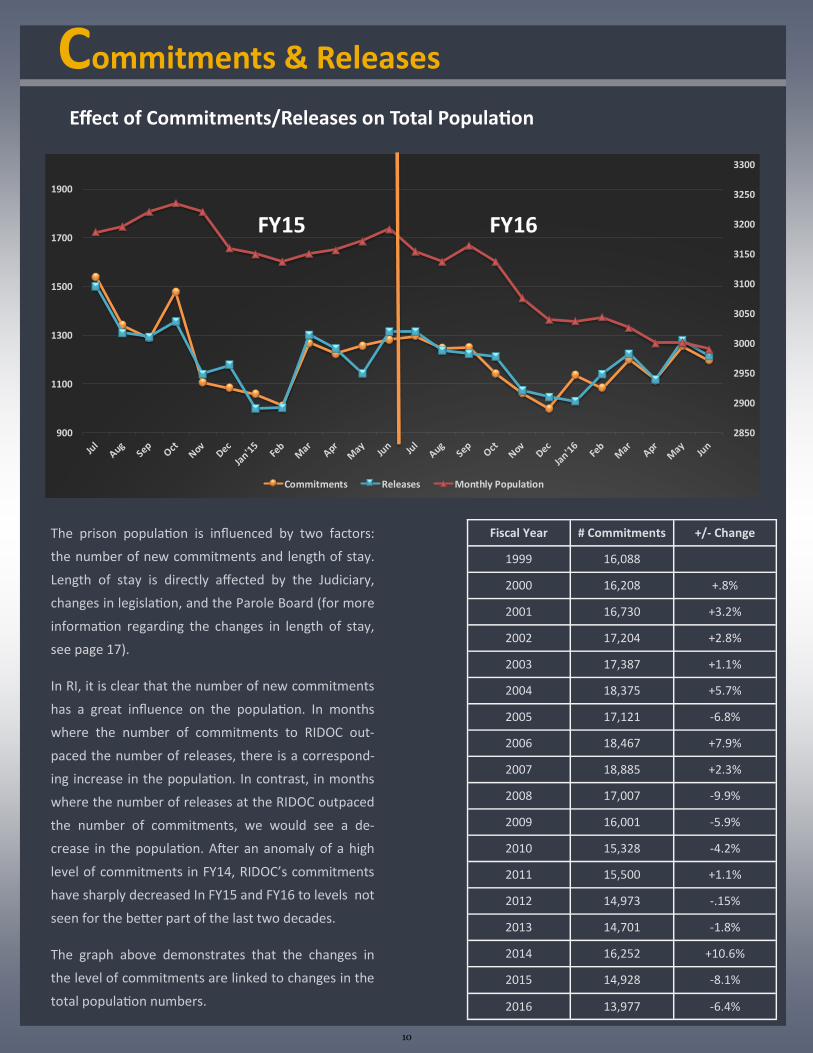
The prison population is influenced by two factors:
the number of new commitments and length of stay.
Length of stay is directly affected by the Judiciary,
changes in legislation, and the Parole Board (for more
information regarding the changes in length of stay,
see page 17).
In RI, it is clear that the number of new commitments
has a great influence on the population. In months
where the number of commitments to RIDOC out-
paced the number of releases, there is a correspond-
ing increase in the population. In contrast, in months
where the number of releases at the RIDOC outpaced
the number of commitments, we would see a de-
crease in the population. After an anomaly of a high
level of commitments in FY14, RIDOC’s commitments
have sharply decreased In FY15 and FY16 to levels not
seen for the better part of the last two decades.
The graph above demonstrates that the changes in
the level of commitments are linked to changes in the
total population numbers.
Effect of Commitments/Releases on Total Population
Fiscal Year # Commitments +/- Change
1999 16,088
2000 16,208 +.8%
2001 16,730 +3.2%
2002 17,204 +2.8%
2003 17,387 +1.1%
2004 18,375 +5.7%
2005 17,121 -6.8%
2006 18,467 +7.9%
2007 18,885 +2.3%
2008 17,007 -9.9%
2009 16,001 -5.9%
2010 15,328 -4.2%
2011 15,500 +1.1%
2012 14,973 -.15%
2013 14,701 -1.8%
2014 16,252 +10.6%
2015 14,928 -8.1%
2016 13,977 -6.4%
Commitments & Releases
2850
2900
2950
3000
3050
3100
3150
3200
3250
3300
900
1100
1300
1500
1700
1900
Commitments Releases Monthly Population

11
Twenty-two percent (22%)
entered RIDOC as a proba-
tion violator in FY16.
Four percent (4%) entered
prison as parole violators in
FY16.
The largest group are white
(41%), single (74%), and self
-identify as Catholic (33%).
About half (51%) have a
high school diploma or GED,
37% have less than a 12th
grade education; and an ad-
ditional 9% have completed
some college.
Fifty-six percent (56%) are
fathers; the average num-
ber of children fathered is 2.
Fifty-one percent (51%)
were unemployed at the
time they became incarcer-
ated.
Fifty-four percent (54%) of
males were re-sentenced
within 36 months of re-
lease.
Fourteen percent (14%) en-
tered RIDOC as a probation
violator in FY16.
Four percent (4%) entered
prison as parole violators in
FY16.
The largest group are white
(61%), single (67%), and self
-identify as Catholic (31%).
Forty-seven percent (47%)
have a high school diploma
or GED, 22% have less than
a 12th grade education; and
an additional 18% have
completed some college.
Fifty-eight percent (58%)
are mothers; the average
number of children is 2 per
offender.
Sixty-five percent (65%)
were unemployed at the
time they became incarcer-
ated.
Thirty-nine percent (39%) of
females were re-sentenced
within 36 months of re-
lease.
Offender Characteristics
Characteristics of a Typical RIDOC Sentenced Offender
Male Female

12
The charts on the following pages* contain the following categories of offenders: commitments, which include all offenders
committed to RIDOC (sentenced & pre-trial) over the last fiscal year; awaiting trial and sentenced represent the stock popu-
lation on June 30, 2016.
The vast majority of offenders
(commitments, awaiting trial, and
sentenced) are white, followed by
black and Hispanic. Offenders who
identify themselves as Asian, Na-
tive American, other, or their race
is unknown make up less than 2%
of the population for each catego-
ry of offenders.
Males make up most (85.2%) of
the RIDOC commitments while
women account for only 14.8%.
Over two thirds of all RIDOC
offenders are between the
ages of 20-39. The average
age of male RIDOC sen-
tenced offenders is 35 and
for females is 37. For pre-
trial offenders, males aver-
age 31 years of age and fe-
males 33 years of age.
*Please note any value less than 3%
will not be labeled in the graphs on
pages 12-16
Offender Characteristics
23.8%30.6% 30.0%
51.8% 39.1% 41.9%
20.9% 26.7% 25.4%
0%
10%
20%
30%
40%
50%
60%
70%
80%
90%
100%
Commitments Awaiting Trial Sentenced
Inmate Race by Status
Hispanic
Asian
White
Black
14.8% 10.0% 4.2%
85.2% 90.0% 95.8%
0%
10%
20%
30%
40%
50%
60%
70%
80%
90%
100%
Commitments Awaiting Trial Sentenced
Inmate Sex by Status
Male
Female
3.9% 5.8%
38.7% 38.7%
32.3%
26.5%28.5%
27.3%
15.6%16.5%
20.6%
7.8%7.7%
13.9%
0%
10%
20%
30%
40%
50%
60%
70%
80%
90%
100%
Commitments Awaiting Trial Sentenced
Inmate Age by Status
60+
50-59
40-49
30-39
20-29
under 20

13
Forty-two percent (42%) of male commitments are incarcerated for non-violent crimes, while over half (53.5%) of
the female commitments are incarcerated for similar offenses. Just over one third of the male population (34.4%)
have been imprisoned for violent crimes, yet not even a quarter of females are incarcerated for similar violent
crimes. We see the reverse trend in the sentenced stock population, where violent crimes make up half of males
(50%) and 40.2% for females. Lifers are included in the sentenced population, making the amount of violent sen-
tenced offenders rise drastically.
Offender Characteristics
26.5%36.7% 40.2%
3.3%
5.0%8.0%
15.1%
28.3% 17.0%
53.5%
23.3% 31.3%
0%
10%
20%
30%
40%
50%
60%
70%
80%
90%
100%
Commitments Awaiting Trial Sentenced
Offense Type by Status - Female Population
Other
Nonviolent
Drug
B&E
Sex
Violent
34.4%46.0% 50.0%
12.2%12.8%
5.7%
7.6%6.9%
14.3%
20.4% 12.8%41.7%
12.6% 17.0%
0%
10%
20%
30%
40%
50%
60%
70%
80%
90%
100%
Commitments Awaiting Trial Sentenced
Offense Type by Status - Male Population
Other
Nonviolent
Drug
B&E
Sex
Violent

14
The most common offenses for the male misdemeanant for the awaiting trial population was simple assault;
for the female population it was shoplifting. Male and female felons were imprisoned most commonly for
violation of a no contact or restraining order.
n= 14 n= 30 n= 46 n= 509
Pre-Trial Offenders: Crime Type by Offense Type
Average Length of Stay for FY16
# Days Until Released
*Approximately 11% of offenders remain on pretrial status after 30 days, but are not displayed on the graph.
0 Indicates a pretrial offender was released on the same day **Sentenced offender populations of less than two percent
are not represented on the above table
Pre-trial Statistics
0
500
1000
1500
2000
2500
0 1 2 3 4 5 6 7 8 9 10 11 12 13 14 15 16 17 18 19 20 21 22 23 24 25 26 27 28 29 30
42.9% 46.7%34.8%
46.0%
3.3%
4.3%
12.8%
6.5%
8.1%
21.4% 6.7%
30.4%
21.2%35.7%
43.3%
19.6%
10.8%4.4%
0%
10%
20%
30%
40%
50%
60%
70%
80%
90%
100%
FemaleMisdemeanants
MaleMisdemeanants
Female Felons Male Felons
Other
Nonviolent
Drug
B&E
Sex
Violent

15
n= 22 n= 241 n= 90 n= 2314
Included in the sentenced stock population are 211 inmates sentenced to life and 30 sentenced to
life without parole. Out of the 181 inmates who received life sentences, two are women. These 241
offenders constitute 9.1% of the total sentenced population. Eighteen (18) of the lifers are inmates
from other states or inmates for which RI shares jurisdiction (i.e., the inmate may have time to serve
following the expiration of sentence in RI).
For the female sentenced population, the most common misdemeanor offenses were driving while
intoxicated (27.3%) and shoplifting (18.2%).
The most common misdemeanor offenses for the male sentenced population were driving while in-
toxicated (14.6%) and driving with a suspended license (14.6%). In addition, the most common felo-
ny offenses included the delivery of a controlled substance (7.9%) and first degree murder (7.7%).
**Sentenced offender populations of less than two percent are not represented on the above table
Sentenced Offenders: Crime Type by Offense Type
Stock Data - June 30, 2016
Sentenced Statistics
22.7% 26.0%
44.4%52.3%
13.9%
10.0%
7.6%21.1%
14.0%
77.3%72.1%
20.0%
11.8%
0%
10%
20%
30%
40%
50%
60%
70%
80%
90%
100%
FemaleMisdemeanants
MaleMisdemeanants
Female Felons Male Felons
Other
Nonviolent
Drug
B&E
Sex
Violent

16
Sentenced Commitments
Sentence Length by Sex
FY2016
Sentenced Stock Population
Sentence Length by Sex
June 30, 2016
When examined together, the graphs and table on this page capture the flow of sentenced inmates in
and out of the RIDOC. The graph at the top left of the page shows the length of sentence imposed by the
Judiciary, while the graph at the right shows the percentage of inmates in prison on June 30, 2016. For
example, even though only about 11.5% of the male population is committed to sentences of more than
3 years, over time, this group of offenders represents 60% of the population.
The table above displays the average length of sentence imposed on sentenced commitments in FY2016.
The actual amount of time offenders stay in prison is almost always shorter than the full sentence im-
posed, due to factors such as statutory good time (i.e., credit earned for good or industrious behavior)
and earned time for program participation and completion (time deducted from sentence).
*The inclusion of female sex offenders had resulted in an increase in the average total sentence length by about 10
months from FY15
Offense Category Male Female Total
Sent < 6 mos Sent > 6 mos Sent < 6 mos Sent > 6 mos Sent < 6 mos Sent > 6 mos Violent 2.4 61.0 1.93 41.2 2.3 60.0 Sex 5.0 109.0 216.0 5.0 110.7 B&E 3.6 38.6 1.97 51.0 3.5 39.7 Drug 3.5 29.5 3.30 20.2 3.5 29.0 Nonviolent 2.3 21.5 2.06 19.7 2.2 21.3 Subtotal 3.3 51.9 2.3 69.6 3.3 52.1
Average Total Sentence Length = 30.4 months
Sentenced Statistics
26.8%
10.3%
8.9%
7.0%
26.8%
21.1%
15.2%
12.8%
8.9%
16.1%
13.4%
30.9%
0%
10%
20%
30%
40%
50%
60%
70%
80%
90%
100%
Female Male
10+ yrs
5 - 10 yrs
3 - 5 yrs
1 - 3 yrs
6 mos -1 yr
6 mos or less
77.2%
60.8%
7.5%
11.2%
9.9%
16.5%
0%
10%
20%
30%
40%
50%
60%
70%
80%
90%
100%
Female Male
10+ yrs
5 - 10 yrs
3 - 5 yrs
1 - 3 yrs
6 mos -1 yr
6 mos or less

17
Effects of Sentence Reductions
The above table depicts the changes in length of
stay for those inmates who have left via expira-
tion of sentence, as this group of offenders has
the ability to fully benefit from the 2008 sen-
tence reduction changes. As can be seen, there
have been significant changes in the percent of
time served for all offenders from FY08 to FY13.
Most noticeably, offenders serving mid-range
sentences (1-7 years) continue to have reduc-
tions in the time served.
Despite across the board reductions in percent
of time served, recent recidivism studies do not
show any increase in return rates for offenders.
In fact, only 49% of offenders released in 2010
returned to RIDOC with a new sentence within
three years. In comparison, 54% of offenders
released in 2004 (prior to the good time chang-
es) returned with a new sentence and 64% as
awaiting trial detainees.
Thus far, data does not appear to indicate that
a decrease in time served contributes to more
crime and re-incarcerations.
For further RIDOC recidivism information on
the 2012 cohort, please see page 21.
Program Participation & Completion:
During FY16, 1,933 offenders participated in
and/or completed one or more rehabilitative
programs offered at RIDOC and were awarded
a total of 72,483 program credits (days off sen-
tence; an average of 37 program credits per
person). Substance Abuse Treatment, High
School Equivalency Program (GED), Adult Basic
Education Program (ABE), and Cognitive Re-
structuring/Anger Management programs
awarded the most program credits in FY16.
*1 (http://webserver.rilin.state.ri.us/BillText12/
SenateText12/S2179A.pdf)
Prior to May 2008, Rhode Island had one of the most conservative state sentence reduction formulas in the country. With
the population reaching historically high levels in 2007 and 2008 and threatening to exceed prison capacity, the state’s
General Assembly, with overwhelming bipartisan support, enacted legislation designed to increase public safety, curb
spending, and reduce recidivism of released inmates.1 The legislation increased the amount of behavioral good time credit
and provided credits for program participation and completion. As a result, we have seen increased program participation
and completion and, coupled with increased good behavior time, we have experienced an overall decrease in offenders’
length of stay which has in turn led to a decreased prison population.
Average Percentage of Time Served by Sentence Length for Offenders Expiring a Sentence FY08 FY09 FY10 FY11 FY12 FY13 FY14 FY15 FY16 Difference 08-16 3 months or less 99% 91% 91% 90% 92% 91% 92% 93% 94% -5% 3 - 6 months 97% 81% 80% 79% 80% 80% 80% 80% 80% -18% 6 - 9 months 96% 82% 79% 76% 77% 79% 79% 78% 80% -17% 9 months - 1 year 95% 81% 77% 71% 74% 75% 76% 76% 77% -19% 1 - 3 years 93% 83% 76% 69% 69% 69% 71% 73% 72% -23% 3 - 5 years 88% 83% 80% 69% 62% 59% 64% 69% 68% -23% 5 - 7 years 84% 83% 73% 71% 63% 64% 60% 68% 72% -14% 7 - 10 years 79% 79% 79% 69% 51% 50% 58% 61% 69% -13% Greater than 10 years 76% 75% 76% 63% 61% 53% 60% 70% 65% -14%
Sentenced Statistics

18
Effects of Drug Offense Sentencing Reform
Two major revisions to our state’s drug laws were ap-
proved in 2009 and 2012, resulting in changes to the
treatment of certain drug offenses. Prior to 2009, man-
datory minimum sentences existed for the manufacture,
sale or possession of certain amounts of different con-
trolled substances, with offenders receiving 10 and 20
year minimum sentences, and $10,000 - $25,000 mini-
mum fines. This law was repealed in 2009, and was re-
placed with a mechanism that allows judges to use
their discretion in sentencing for these types of offens-
es. In 2012, Rhode Island passed new legislation that
was signed into law in 2013, making possession of
small amounts of marijuana punishable with a maxi-
mum $150 civil fine and no jail time.
The drug offender population has seen a drastic de-
cline in the past 6 years due partly to the two above
changes. Since FY08, commitments to sentenced status
declined 17%. Breaking commitments down by the
most serious offense types, it is apparent drug crimes
(pictured in green below) declined significantly while
all other offenses remained relatively steady. In fact,
these drug commitments dropped by 61%.
RIDOC classifies drug offenses into two separate catego-
ries: drug possession and all other drug crimes. Drug
possession commitments have seen sharper declines
than all other drug offenses combined.
Breaking this data down further into the specific type of
drugs shows that charges for marijuana dropped 92%
and charges related to cocaine or crack dropped by over
half. Offenders being charged with possession of sched-
ule I substances have virtually disappeared. Heroin in-
volved charges and crimes for other unspecified/
unknown drugs remained steady, albeit low.
Sentenced Statistics
0
100
200
300
400
500
600
700
800
FY08 FY09 FY10 FY11 FY12 FY13 FY14 FY15 FY16
Nu
mb
er
of
Co
mm
itm
en
ts
Fiscal Year
Drug Drug Possession
0
200
400
600
800
1000
1200
1400
1600
1800
2000
Nu
mb
er
of
Co
mm
itm
en
ts
Fiscal Year
Violent
Sex
B&E
Drug
Nonviolent

19
The graph above shows the actual population (orange line) compared to the projected population (blue line).
The white line predicts a nearly steady trend in the actual population over the next fiscal year.
As of the FY17 projection, RIDOC was operating below federal capacity in all facilities. The 10-year forecast of RI’s
prison population, conducted by Wendy Ware of JFA Associates/The Institute, estimates that the population will
see slight growth, 1.8% or 56 inmates. However, this projected growth would allow RI to remain below both the
operational (3,774) and federal (3,989) capacities throughout the 10-year forecast.
This projection is based on the current factors, statutes, and practices at RIDOC (e.g. good time awards). These
factors may change over time due to legislative or policing changes, rendering the existing prediction null.
Population Projections
2200
2400
2600
2800
3000
3200
3400
July'15
Aug Sept Oct Nov Dec Jan'16
Feb Mar Apr May Jun Jul Aug Sept Oct Nov Dec Jan'17
Feb Mar Apr May Jun
Actual Population Projected Population Linear (Projected Population)
FY16 FY17

20
Average FY16 Population vs. Capacities
Institutional Capacities
*Operation Capacity = All Beds—(Hospital Beds + 1/3 of
Segregation Beds)
**Palmigiano Capacity = Federal Court-Ordered Capacity
(All Beds)
Total RIDOC FY 2016
Operational Capacity* = 3774
Palmigiano Capacity** = 3989
Average FY16 Population= 3067
High MaxMed
MoranMin
ISCNorth
ISCSouth
WF1 WF2
Average population 96 437 1082 393 675 260 103 22
Operational Capacity 138 409 1126 710 784 334 173 100
Palmigiano Capacity 166 466 1186 710 784 364 213 100
0
200
400
600
800
1000
1200
1400
# o
f O
ffe
nd
ers
Average population Operational Capacity Palmigiano Capacity
21
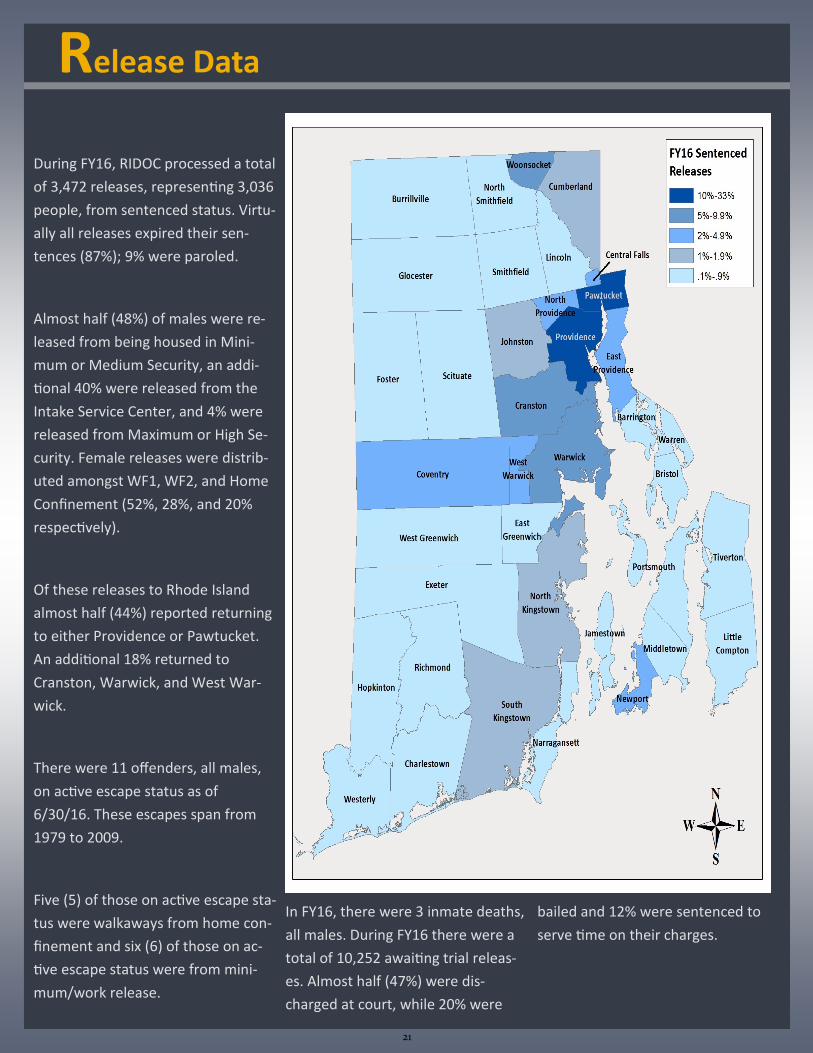
During FY16, RIDOC processed a total
of 3,472 releases, representing 3,036
people, from sentenced status. Virtu-
ally all releases expired their sen-
tences (87%); 9% were paroled.
Almost half (48%) of males were re-
leased from being housed in Mini-
mum or Medium Security, an addi-
tional 40% were released from the
Intake Service Center, and 4% were
released from Maximum or High Se-
curity. Female releases were distrib-
uted amongst WF1, WF2, and Home
Confinement (52%, 28%, and 20%
respectively).
Of these releases to Rhode Island
almost half (44%) reported returning
to either Providence or Pawtucket.
An additional 18% returned to
Cranston, Warwick, and West War-
wick.
There were 11 offenders, all males,
on active escape status as of
6/30/16. These escapes span from
1979 to 2009.
Five (5) of those on active escape sta-
tus were walkaways from home con-
finement and six (6) of those on ac-
tive escape status were from mini-
mum/work release.
In FY16, there were 3 inmate deaths,
all males. During FY16 there were a
total of 10,252 awaiting trial releas-
es. Almost half (47%) were dis-
charged at court, while 20% were
bailed and 12% were sentenced to
serve time on their charges.
Release Data

22
Recidivism
With the award of the Second Chance Adult Offender
Comprehensive Statewide Recidivism Reduction Demon-
stration Program Grant (Recidivism Reduction Grant) in
October 2012, the focus on reducing recidivism has be-
come even more crucial to RIDOC staff.
RIDOC defines recidivism as:
1. An offender who was released from sentence at
RIDOC within a specific period of time (cohort), and
2. Who was returned to RIDOC as a sentenced inmate, or
3. Who was returned to RIDOC as an awaiting trial inmate
as noted.
The Cohort
There were 3,029 offenders released in Calendar Year 2012
(CY12), accounting for the 3,365 distinct release events. The
majority of offenders were white (56%), male (88%), and av-
eraged 34 years of age. The majority were released from serv-
ing for a nonviolent (43%) or violent (31%) offense with an
average sentence of 1.6 years.
Sentenced Readmissions
At 3-years post release, 52% of offenders returned to RIDOC
with a new sentence, resulting in a moderate increase from
the from the CY09 cohort that reported a 48% 3-year return
rate. Just over half (54%) of males and 39% of females were
recommitted as sentenced offenders 36 months post release.
In addition, more than one third (41%) of all sentenced re-
commitments were for probation violations. While the ma-
jority of probation violators returned with new charges (73%),
the vast majority of parole violators returned for a technical
violation (71%).
RIDOC operates a unified correctional system, meaning that
all pre-trial detainees and sentenced offenders (regardless of
sentence length or crime type) are under the department’s
jurisdiction. Unlike most departments, this gives RIDOC the
unique opportunity to report rates for those who await trial.
Awaiting Trial Readmissions
Sixty percent (60%) of offenders returned as awaiting trial
detainees within three years of their release, resulting in a
slight increase from CY09 which had a 57% 3-year return rate.
The majority of both men (61%) and women (51%) returned
as awaiting trial detainees 36 months post release.
Time in the Community
The average time spent in the community was 10.3 months.
Almost 7% of recidivists returned within 30 days of initial re-
lease with an additional 22% returning between 1 and 3
months post release. By 6 months post-release, 46% of recidi-
vists had returned to RIDOC. Females tended to spend 30
days less time in the community prior to recidivating than
their male counterparts.
Council of State Governments
The efforts of RIDOC were highlighted in a recent Washing-
ton, DC forum by the Council of State Governments Justice
Center (CSG). CSG outlined which states’ initiatives in reduc-
ing recidivism showed success and delivered results.
(http://csgjusticecenter.org/wp-content/uploads/2014/06/
ReducingRecidivism_StatesDeliverResults.pdf)
Release Data
This graph depicts a 2% decrease in 3-year recidivism rates for sentenced
readmissions from the CY04 cohort compared to the CY12 cohort.
54%
48%49%
52% 52%
40%
45%
50%
55%
60%
CY04 CY09 CY10 CY11 CY12
Re
cid
ivis
m R
ate
Cohort Year

23
Interpreting the chart: The probation population is plotted on the secondary axis to the right, while parole and
home confinement are plotted on the primary axis to the left.
According to the Bureau of Justice Statistics, as of 2014, Rhode Island has the fourth highest rate of Community
Corrections supervision in the nation; 2,848 per 100,000 residents. BJS Probation and Parole in the United States,
2014.
Probationers and Parolees by Square Mile as of June 30, 2016
Community Corrections Population
17
168.5
84
314.6
215.6
53.4
87.5
550.8
0 100 200 300 400 500 600
Total RI
Woonsocket
W.Warwick
Providence
Pawtucket
Newport
N.Providence
Central Falls
# of Offenders Per Square Mile
1 in 9 males aged 30-34
1 in 9 males aged 25-29
1 in 7 males aged 25-29
79
114138 144
194167
129145
205 213 218235 228 218
168 172156
179 168201
740
636619 629
592578 588 592
490
421
477
551
606656
553524
497
456472
50019103
20939
22138 22436 22780
25807 26275 26376 26437 26075 26474 26779 2712826411
25454 25026
23707 23539 23823 23598
0
5000
10000
15000
20000
25000
30000
0
100
200
300
400
500
600
700
800
1997 1998 1999 2000 2001 2002 2003 2004 2005 2006 2007 2008 2009 2010 2011 2012 2013 2014 2015 2016
# O
f O
ffe
nd
ers
Fiscal Year
Home Confinement Parole Probation

24
Community Corrections Population

25
As correctional facilities throughout the country continue to
transition from a historically punitive incarceration model in
taking a more rehabilitative and community based approach,
the Rhode Island Department of Corrections will relentlessly
work towards implementing a more modern, innovative, and
efficient case management plan by incorporating the use of
evidence-based risk assessments.
The Level of Service Inventory Revised (LSI-R)
The Level of Service Inventory Revised (LSI-R) is a 54-item
instrument which assesses offenders across 10 domains
known to correlate with an offender’s likelihood of recidi-
vating. LSI-R’s are completed by trained assessors who con-
duct interviews with offenders and will make every attempt
to verify the information through external sources. Research
consistently suggests that implementing innovative evidence
based practices that are narrowly tailored to address an
offender’s dynamic criminogenic risk factors is essential in
reducing the likelihood of recidivism. As a result, these as-
sessments take a very targeted approach by utilizing the re-
sulting LSI-R score to identify the subset of the offender pop-
ulation that yields a moderate or high risk of recidivating.
Incorporating LSI-R scores is paramount in allocating depart-
mental resources to treat and supervise offenders in the
most efficient manner possible.
LSI-R Training
In the spring of 2014, LSI-R assessment training was provided
to approximately 150 staff members as a means to ensure
assessments are completed and updated as an offender
moves through the system. Training was provided to all Adult
Counselors, Probation & Parole Officers, and Discharge Plan-
ners at the Department through a series of interactive, two-
day sessions.
Looking Toward the Future
The Expansion of LSI-R
Upon the completion of the LSI-R training, Probation
and Parole Officers began transitioning from the Proxy
risk assessment to the LSI-R Screening Version, an 8-
item screen tool derived from the full LSI-R. The LSI-R
SV is now operational statewide and is used to identify
low risk offenders who can be triaged to low supervi-
sion. After a brief pilot program in October of 2015,
the LSI-R SV was also fully implemented at the Intake
Service Center to all men sentenced to over 6 months.
The use of this screening tool now allows the Depart-
ment to expand the use of assessments to a greater
sentenced commitment population, as previously the
LSI-R assessment was solely given to male inmates
who were sentenced to one year or more.
Other Initiatives
A total of 6 RIDOC staff (3 from Planning & Research)
were trained on the administration of the Correctional
Program Checklist (CPC). The CPC is used to ensure
adherence to evidence-based curricula and reliance on
effective treatment modalities. It incorporates 77 indi-
cators used to make accurate evaluations used to as-
certain how closely correctional programs meet
known principles of effective intervention.
In October of 2014, Community Corrections staff par-
ticipated in Effective Practices in Community Supervi-
sion (EPICS) training. EPICS teaches core correctional
supervision practices such as addressing criminogenic
risk factors, determining supervision allocation and
how to address immediate risk situations such as vio-
lations in a manner that will not remove them from
the community, while still holding the offender ac-
countable for their actions.

26
RIDOC Description
The Rhode Island Department of Corrections (RIDOC) operates a unified correctional system, meaning that all pretrial detain-
ees and all sentenced offenders (regardless of sentence length or crime) are under the jurisdiction of the Department. RIDOC
has seven (7) housing facilities on the Pastore Government Center Complex in Cranston, Rhode Island. In addition to institu-
tional corrections, offenders on probation, parole and electronic monitoring also fall under the jurisdiction of the RIDOC.
Facilities: RIDOC historically only includes open inmate facilities. The Donald Price Building has been omitted since its closure
in November of 2011. It’s also important to highlight that the recent closure of the Bernadette Building has been excluded
because it took place during Fiscal Year 2017.
Race Categories: RIDOC records Hispanic as a race rather than ethnicity. As a result, we cannot determine whether inmates
identifying themselves as Hispanic are white or black. Those identifying themselves as white or black may also be Hispanic.
Offense Categories: Throughout this report, type of offense is determined by the most serious charge for which the offender
is sentenced to incarceration or community supervision. As an example, if an offender had both a drug charge and a sex
charge, s/he would be captured in the sex category (and not the drug category) for reporting purposes. An additional caveat
is that the offense category is based on those charges entered into Infacts, and there are times where multiple counts are
condensed into one charge record. At times, offense information is not immediately available to RIDOC; in these instances,
the designation “pending court verification” is assigned.
Stock Data: Refers to data that are a “snapshot” of the population, which provides information about the population on a
given day. For this report, the date for the stock data is June 30, 2016.
Commitments & Releases: In contrast to stock data, commitment and release information provides data about the move-
ment of offenders into and out of the RIDOC system. For this report, the time period covered is July 1, 2012 through June 30,
2016.
Cost per Offender: The cost per offender per annum excludes central RIDOC Administration and Capital costs. For this report,
the time period covered is July 1, 2015 through June 30, 2016 (FY2016).
Population Averages: The Community Corrections Chart on page 23 uses the average population for parole, probation, and
home confinement for the fiscal year. Due to technological issues the data for FY12 represents July 2011 through May 2012.
June data is not available.
For further information or questions please contact Keith Ivone, Principal Research Technician,
at [email protected] or 401-462-6721
Data Caveats & Definitions