Rheological studies of disulfonated poly(arylene … studies of disulfonated poly ... Disulfonated...
9
Rheological studies of disulfonated poly(arylene ether sulfone) plasticized with poly(ethylene glycol) for membrane formation Hee Jeung Oh a , Benny D. Freeman a , James E. McGrath b , Christopher J. Ellison a , Sue Mecham b , Kwan-Soo Lee c , Donald R. Paul a, * a The University of Texas at Austin, Department of Chemical Engineering, Austin, TX 78712, USA b Virginia Polytechnic Institute and State University, Department of Chemistry, Blacksburg, VA 24061, USA c Honam Petrochemical Corp., Daejeon, South Korea article info Article history: Received 13 December 2013 Received in revised form 30 January 2014 Accepted 3 February 2014 Available online 11 February 2014 Keywords: Sulfonated polysulfone Poly(ethylene glycol) Bueche-Harding master curve abstract Disulfonated poly(arylene ether sulfone) (BPS) random copolymers, prepared from a sulfonated mono- mer, have been considered for use as membrane materials for various applications in water purification and power generation. These membranes can be melt-processed to avoid the use of hazardous solvent- based processes with the aid of a plasticizer, a low molecular weight poly(ethylene glycol) (PEG). PEG was used to modify the glass transition temperature and melt rheology of BPS to enable coextrusion with polypropylene (PP). Our previous paper discussed the miscibility of BPS with PEG and the influence of PEG on the glass transition of BPS. In this study, the rheological properties of disulfonated poly(arylene ether sulfone)s plasticized with poly(ethylene glycol) (PEG) are investigated to identify coextrusion processing conditions with candidate PPs. The effects of various factors including PEG molecular weight, PEG concentration, temperature and BPS molecular weight on blend viscosity were studied. The rheo- logical data effectively lie on the same master curve developed by Bueche and Harding for non- associating polymers such as poly(methyl methacrylate) (PMMA) and polystyrene (PS). Although sul- fonated polysulfone contains ionic groups, the form of its viscosity versus shear rate (or frequency) behavior appears to be dominated by the relaxation of polymer entanglements. Ó 2014 Elsevier Ltd. All rights reserved. 1. Introduction Most ion containing membranes used for desalination [1e3] and electrodialysis [4,5], etc. are prepared using solvent-based pro- cessing methods. For example, polyamide (PA) thin film composite membranes, the state-of-art membrane in reverse osmosis, are produced by interfacial polymerization at a water/solvent interface [1,2]. Solution processing has several disadvantages including environmental and health hazards and the high costs associated with solvent disposal. As a result, better methods of preparing membranes are of some interest. Sulfonated polysulfone is a potential alternative membrane material for water purification [6e10] and fuel cell applications [5,11e 15], owing to its good ion transport properties as well as good thermal and mechanical stability [5e15]. Moreover, unlike most membranes, which can only be produced by solution processing, sulfonated polysulfone membranes may be prepared via a solvent-free extrusion using rather benign plasticizers; e.g., poly(ethylene glycol) [16]. This plasticizer enables the extrusion processing of sulfonated polysulfone and can be removed from the extruded membrane by water extraction. In addition, com- posite membranes may be obtained by coextrusion with a proper support material that can be made porous by stretching or by laminating the sulfonated polysulfone layer onto a porous sup- port layer [17e19]. The objective of this study is to investigate the formation of sulfonated polysulfone desalination membranes without the use of solvents. Bebin et al. have reported on a similar approach for extruding post-sulfonated polysulfone films for proton exchange mem- brane fuel cell (PEMFC) materials. Proton conductivity and life span of the extruded films were compared with those of solvent cast films [20,21]. Sanchez et al. also used post-sulfonated pol- ysulfone for PEMFC. The influence of several plasticizers on the glass transition and rheological properties of the post-sulfonated polysulfone was reported [22e26]. These previous studies have focused on fuel cell applications, and the possibility of membrane * Corresponding author. The University of Texas at Austin, Department of Chemical Engineering, 1 University Station, Mail Code: C0400, Austin, TX 78712, USA. Tel.: þ1 512 471 5392; fax: þ1 512 471 0542. E-mail address: [email protected] (D.R. Paul). Contents lists available at ScienceDirect Polymer journal homepage: www.elsevier.com/locate/polymer http://dx.doi.org/10.1016/j.polymer.2014.02.011 0032-3861/Ó 2014 Elsevier Ltd. All rights reserved. Polymer 55 (2014) 1574e1582
Transcript of Rheological studies of disulfonated poly(arylene … studies of disulfonated poly ... Disulfonated...

lable at ScienceDirect
Polymer 55 (2014) 1574e1582
Contents lists avai
Polymer
journal homepage: www.elsevier .com/locate/polymer
Rheological studies of disulfonated poly(arylene ether sulfone)plasticized with poly(ethylene glycol) for membrane formation
Hee Jeung Oh a, Benny D. Freeman a, James E. McGrath b, Christopher J. Ellison a,Sue Mechamb, Kwan-Soo Lee c, Donald R. Paul a,*a The University of Texas at Austin, Department of Chemical Engineering, Austin, TX 78712, USAbVirginia Polytechnic Institute and State University, Department of Chemistry, Blacksburg, VA 24061, USAcHonam Petrochemical Corp., Daejeon, South Korea
a r t i c l e i n f o
Article history:Received 13 December 2013Received in revised form30 January 2014Accepted 3 February 2014Available online 11 February 2014
Keywords:Sulfonated polysulfonePoly(ethylene glycol)Bueche-Harding master curve
* Corresponding author. The University of TexaChemical Engineering, 1 University Station, Mail CodUSA. Tel.: þ1 512 471 5392; fax: þ1 512 471 0542.
E-mail address: [email protected] (D.R. Paul).
http://dx.doi.org/10.1016/j.polymer.2014.02.0110032-3861/� 2014 Elsevier Ltd. All rights reserved.
a b s t r a c t
Disulfonated poly(arylene ether sulfone) (BPS) random copolymers, prepared from a sulfonated mono-mer, have been considered for use as membrane materials for various applications in water purificationand power generation. These membranes can be melt-processed to avoid the use of hazardous solvent-based processes with the aid of a plasticizer, a low molecular weight poly(ethylene glycol) (PEG). PEGwas used to modify the glass transition temperature and melt rheology of BPS to enable coextrusion withpolypropylene (PP). Our previous paper discussed the miscibility of BPS with PEG and the influence ofPEG on the glass transition of BPS. In this study, the rheological properties of disulfonated poly(aryleneether sulfone)s plasticized with poly(ethylene glycol) (PEG) are investigated to identify coextrusionprocessing conditions with candidate PPs. The effects of various factors including PEG molecular weight,PEG concentration, temperature and BPS molecular weight on blend viscosity were studied. The rheo-logical data effectively lie on the same master curve developed by Bueche and Harding for non-associating polymers such as poly(methyl methacrylate) (PMMA) and polystyrene (PS). Although sul-fonated polysulfone contains ionic groups, the form of its viscosity versus shear rate (or frequency)behavior appears to be dominated by the relaxation of polymer entanglements.
� 2014 Elsevier Ltd. All rights reserved.
1. Introduction
Most ion containingmembranes used for desalination [1e3] andelectrodialysis [4,5], etc. are prepared using solvent-based pro-cessing methods. For example, polyamide (PA) thin film compositemembranes, the state-of-art membrane in reverse osmosis, areproduced by interfacial polymerization at a water/solvent interface[1,2]. Solution processing has several disadvantages includingenvironmental and health hazards and the high costs associatedwith solvent disposal. As a result, better methods of preparingmembranes are of some interest.
Sulfonated polysulfone is a potential alternative membranematerial for water purification [6e10] and fuel cell applications[5,11e15], owing to its good ion transport properties as well asgood thermal and mechanical stability [5e15]. Moreover, unlikemost membranes, which can only be produced by solution
s at Austin, Department ofe: C0400, Austin, TX 78712,
processing, sulfonated polysulfone membranes may be preparedvia a solvent-free extrusion using rather benign plasticizers; e.g.,poly(ethylene glycol) [16]. This plasticizer enables the extrusionprocessing of sulfonated polysulfone and can be removed fromthe extruded membrane by water extraction. In addition, com-posite membranes may be obtained by coextrusion with a propersupport material that can be made porous by stretching or bylaminating the sulfonated polysulfone layer onto a porous sup-port layer [17e19]. The objective of this study is to investigatethe formation of sulfonated polysulfone desalination membraneswithout the use of solvents.
Bebin et al. have reported on a similar approach for extrudingpost-sulfonated polysulfone films for proton exchange mem-brane fuel cell (PEMFC) materials. Proton conductivity and lifespan of the extruded films were compared with those of solventcast films [20,21]. Sanchez et al. also used post-sulfonated pol-ysulfone for PEMFC. The influence of several plasticizers on theglass transition and rheological properties of the post-sulfonatedpolysulfone was reported [22e26]. These previous studies havefocused on fuel cell applications, and the possibility of membrane

Table 1Characteristics of the polymers of this study.
Material Mwa [g/mol] IVa [ml/g] Tg
b,e [�C] Densityc,e [g/cm3] Water Permeabilityd [L mm m�2 h�1 bar�1] NaCl rejectiond [%]
BPS-20K 33,900 48.2 273 1.30 0.03 99.2BPS-20K 45,500 61.8 273 1.31 0.03 99.2BPS-20K 56,700 72.3 273 1.35 0.03 99.2
a Determined by SEC using NMP with 0.05 M LiBr at 50 �C. Note that specific refractive index increment (dn/dc) values were measured using an assumption of 100% massrecovery. dn/dc values for BPS-20K polymers of this study are 0.17 [ml/g].
b Measured by DSC at 20 �C/min.c Measured using a Mettler Toledo density determination kit (Part# 238490, Switzerland) with n-heptane (Cat# 32287, SigmaeAldrich, St. Louis, MO) at ambient tem-
perature (20e22 �C).d Table 1 from Ref. [10].e Measurements were conducted using solution cast films. Transparent and uniform thickness films (30w40 mm) were formed by the solution casting method reported
previously [16].
H.J. Oh et al. / Polymer 55 (2014) 1574e1582 1575
formation for water purification applications has not beenexplored.
Thin film composite membranes are composed of an active se-lective layer supported by a porous layer. The active layer provideshigh water transport and salt rejection while the porous layerprovides a mechanical support with minimal obstruction of waterflow [2,27]. This study examines the feasibility of compositemembranes that might be useful for desalination prepared viacoextrusion of a sulfonated polysulfone with a suitable supportlayer material [17]. Polypropylene (PP) is considered as a candidatesupport material for the proposed membranes since porous PP canbe readily formed by a number of approaches involving post-extrusion stretching [18,19].
In this study, disulfonated poly(arylene ether sulfone)s (BPS)blended with PEG plasticizers have been explored to identifyappropriate extrusion formulations for membrane applications.Previously, we reported the effect of various PEG materials on theblend glass transition temperature and the thermal stability ofthese PEGs at potential melt processing temperatures [16]. Thispaper reports rheological properties of the plasticized sulfonatedpolysulfone to identify formulations that are rheologicallycompatible for coextrusion with PP. The effects of various factorsincluding PEG molecular weight, concentration, temperature andBPS molecular weight on the complex viscosity of blends areinvestigated. An approach by Bueche and Harding was employed togeneralize the rheological behavior of the blends and to compare itwith that of non-associating polymers [28,29]. A subsequent paperwill report on the transport properties and morphology of theextruded sulfonated polysulfone membranes relative to solutioncast films.
2. Experimental
2.1. Materials
The disulfonated poly(arylene ether sulfone) random co-polymers (BPS-XY) used in this study were synthesized by directaromatic nucleophilic substitution step polymerization, as estab-lished by McGrath et al. (See Fig. 1) [6,8e10,30]. The nomenclature
Fig. 1. Chemical structure of disulfonated poly(arylene ether sulfone) random copolymer: foK (potassium salt form).
for these polymers is BPS-XY, where X is the mole percent (mol%) ofsulfone groups in the polymer (i.e., disulfonated monomer), and Yis the cation, such as H (acid form) or K (potassium form). Forinstance, BPS-20K consists of 20 mol% of disulfonated monomer inthe potassium form.
BPS polymers prepared in the K form were supplied by AkronPolymer Systems (Akron, OH) and were used as received. In thisstudy, the potassium form of the sulfonated polysulfone, or BPS-K form was chosen due to its good thermal stability [9,16]. Toexplore the effect of plasticizers on the melt behavior of sulfo-nated polysulfone, BPS-20K (ion exchange capacity(IEC) ¼ 0.92 meq/g) was used because of its good membraneperformance as well as chemical and thermal stability at extru-sion conditions [6,8,10,16]. Polymers with various molecularweights (Mw ¼ 33,900e56,700 g/mol) were used to investigatethe effect of molecular weight on viscosity. Selected propertiesare summarized in Table 1.
Note that the polydispersity (PDI) of sulfonated polysulfonefrom step growth polymerization is around 2 [31], although theratio of Mw=Mn determined by Size Exclusion Chromatography(SEC) is around 1.4w1.5. This is related to the characteristics of lightscattering measurements employed for SEC, which have a tendencyto overestimate number average molecular weight ðMnÞ since thelight scattering measurements are not sensitive to the lower mo-lecular weight portion of the molecular weight distribution, as re-ported previously [32]. The molar mass determined by the lightscattering measurements is the weight average molecular weightðMwÞ and therefore we report Mws of BPS-20K materials as shownin Table 1.
2.2. Plasticizer
Poly(ethylene glycol), PEG, materials were used as plasticizers inthis study, and their physical properties are summarized in Table 2[16]. These PEGswere purchased from Sigma Aldrich (St. Louis, MO)and were used as received. Product details are PEG 200 Cat# P3015,PEG 300 Cat# 202371, PEG 400 Cat# 202398, and PEG 600 Cat#87333.
r BPS-XY series, X ¼ mol% of disulfonated monomer (0 < X < 100), Y ¼ H (acid form) or

Table 2Properties of PEG oligomers.
Material Average Mn
[g/mol]PDIa Tg
b [�C] Tmb [�C] Density at 20 �Cc
[g/cm3]
PEG 200 200 1.04 �83 e 1.124PEG 300 300 1.01 �76 �15 1.125PEG 400 400 1.02 �72 2 1.126PEG 600 600 1.02 �69 17 1.130
a Determined by ESI, details are mentioned in Ref. [16].b Measured by DSC at 20 �C/min, Table 2 from Ref. [16].c Number reported in SigmaeAldrich product documentation [34e37].
H.J. Oh et al. / Polymer 55 (2014) 1574e15821576
Note that PDIs are in the range of 1.01w1.04 (see Table 2). Thisvalue implies a narrow molecular weight distribution and is char-acteristic of polymers prepared using a living polymerizationmethod [16,33].
2.3. Blend preparation
BPS/PEG blend samples for the rheological measurements wereprepared using a 5 ml twin screwmicro-compounder (DSM Xplore,the Netherlands) and a compression press (Wabash Metal ProductsInc., Wabash, IN). The compounding temperature was in the rangeof 170e210 �C depending on the blend composition [16]. BPS andPEG were mixed in the approximate ratio before feeding to thecompounder and melt processed under an extra dry nitrogen at-mosphere (99.9%, Matheson Tri-Gas, Austin, TX). Samples of 25 mmdiameter and 1 mm thickness were molded in a compression press.
2.4. Rheological measurement
The rheological properties were measured using a rotationalrheometer, AR2000EX (TA Instruments, New Castle, DE) with theElectrically Heated Plates (EHP) fixture. All measurements wereconducted at a temperature range of 170w250 �C under an extradry nitrogen atmosphere.
Rheological properties were measured using oscillatory shearflow with 25 mm diameter parallel plates (gap distance of 1 mm).Strain sweep tests were performed to confirm that the % strain wasin the linear viscoelastic range. Frequency sweep tests were con-ducted over the angular frequency range of 0.1w400 rad/s withinthe linear % strain region depending on the blend compositions.Time sweep tests were also done at the frequency of 1 Hz (i.e.u ¼ 6.283 rad/s) for 10w30 min to check the thermal stability ofBPS/PEG blends.
2.5. Other characterization
2.5.1. Proton nuclear magnetic resonance (1H NMR)1H NMR analysis was performed to verify the molecular struc-
ture, number ðMnÞ average molecular weight of PEGs, and PEGconcentration (wt%) using a Varian DirectDrive spectrometer(Agilent Technologies, Santa Clara, CA) at 400 MHz. A 20 mgpolymer sample was dissolved in 2 cm3 of (CD3)2SO, dimethylsulfoxide-D6 (99.9%, Cat# DLM-10, Cambridge Isotope Laboratories,Andover, MA) to prepare NMR samples. 1H NMR spectrum wasrecorded using 8 scans, 2 s of relaxation time, and a 20 Hz spin rate.
2.5.2. Size-exclusion chromatography (SEC)The SEC system consisted of an isocratic pump (Agilent 1260
infinity, Agilent Technologies, Santa Clara, CA) with an onlinedegasser (Agilent 1260, Agilent Technologies, Santa Clara, CA),autosampler and column oven used for mobile phase delivery andsample injection, and three Agilent PLgel 10 mm Mixed B-LS
columns 300 � 7.5 mm connected in series with a guard column asthe stationary phase. A system of multiple detectors connected inseries was used for the analysis. A multi-angle laser light scattering(MALS) detector (DAWN-HELEOS II, Wyatt Technology Corporation,Goleta, CA), operating at a wavelength of 658 nm, a viscometerdetector (Viscostar, Wyatt Technology Corporation, Goleta, CA), anda refractive index detector operating at a wavelength of 658 nm(Optilab T-rEX, Wyatt Technology Corporation, Goleta, CA) pro-vided online results. The system was corrected for interdetectordelay, band broadening, and the MALS signals were normalizedusing a 21,720 g/mol polystyrene standard obtained from AgilentTechnologies or Varian. Data acquisition and analysis was con-ducted using Astra 6 software (Wyatt Technology Corporation,Goleta, CA). Themobile phasewas 1-methyl-2-pyrrolidinone (NMP,Cat# BS770, Spectrum Chemicals & Laboratory Products, Gardena,CA), which was vacuum distilled over phosphorus pentoxide (P2O5)(99%, Cat# 214701, Sigma Aldrich) before use. The salt, 0.05 M driedlithium bromide (LiBr) (99þ%, Cat# 213225, Sigma Aldrich), wasadded and dissolved in the NMP before the solvent was degassedand filtered. The sample solutions were prepared in a concentrationrange of 2e3 mg/mL and were filtered to remove any dust orinsoluble particles using 0.22 mm PTFE filters. Molecular weightvalues were measured using light scattering and the intrinsic vis-cosity values were measured online. Note that specific refractiveindex increment (dn/dc) values were calculated for each backbonetype based on 100% mass recovery using Astra 6 software. If mul-tiple samples of one backbone were available, the values wereaveraged and applied to all samples of that backbone. All mea-surements were conducted with both the solvent system and de-tectors maintained at 50 �C.
3. Results and discussion
It is important to control the BPS/PEG rheology within a specificrange for coextrusion with PP to achieve uniform thickness anddefect-free membranes [17]. Since the rheology is sensitive to smallchanges in the blend [38,39], various factors that influence therheology, such as PEG molecular weight, PEG concentration, tem-perature, and BPS molecular weight, etc. should be considered [40].
A sulfonation level of 20 mol% BPS-K form (Mw ¼ 33,900 g/mol)was chosen for this study because it offers good membrane prop-erties and thermal stability as mentioned previously (see Table 1)[6,8e10,16]. PEGs, with Mn values between 200 and 600 g/mol,were used since they effectively lower the glass transition tem-perature (Tg) of BPS-20K at relatively low concentrations; this isthought to be favorable for water extraction of the PEG plasticizerafter extrusion [16]. BPS-20K/PEG blends composed of 20w45 wt%PEG were prepared for rheological property measurements.
3.1. PEG viscosity
Before studying the blend viscosities, the viscosities of individ-ual materials (i.e., BPS-20K and PEGs) were investigated. However,since BPS-20K has a Tg of 273 �C and does not readily flow prior toreaching its decomposition temperature [9,16], its viscosity couldnot be measured.
For the various PEG materials, the viscosity was recorded bysteady shear flow using a Peltier plate geometry (40 mm diametercone and plate, a gap distance of 55 mm, TA Instruments, NewCastle, DE) over the temperature range of 25w200 �C. Due to thecharacteristics of the Peltier plate, the maximum temperature thatthis geometry offers is 200 �C, and all measurements were con-ducted in an ambient atmosphere. Note that PEGmaterials withMn
in the 200w600 g/mol range are thermally stable at 25w220 �C inair according to our previous studies [16]. Under nitrogen

H.J. Oh et al. / Polymer 55 (2014) 1574e1582 1577
atmosphere, PEGmaterials withMn in the range of 200w600 g/molare stable up to 250 �C for 10 min [16].
PEG is a Newtonian fluid as shown in Fig. 2. The viscosities ofPEG 200w600 are essentially independent of shear rate (seeFig. 2a) and decrease with increasing temperature because of chainrelaxation at high temperature (see Fig. 2b). At a fixed temperature,the viscosity is proportional to Mn as shown in Fig. 2b, since thesematerials are below the critical entanglement molecular weight of4,400 g/mol reported for PEG [41,42]. PEG viscosities measuredhere were used to generate a master curve in the later section.
3.2. Thermal stability of BPS/PEG blends
As previously reported, most of BPS-20K/PEG blends showadequate thermal stability at 170w210 �C for rheological mea-surements [16]. However, for some BPS-20K/PEG blends with lowermolecular weight PEGs, evaporation can occur when the mea-surements are performed at high temperatures for long times[16,43,44]. Thermal stability of BPS-20K/PEG blends depends on thecombination of PEG molecular weight ðMnÞ, PEG concentration,measurement temperature and the duration of measurement. Forexample, BPS-20K/PEG 200 30 wt% blend is thermally stable up to200 �C during the frequency sweep (around 10 min), but is onlystable for a few minutes at 210 �C, so its viscosity at this temper-ature cannot be readily obtained over a broad range of frequency.
All rheological data shown here represent thermally stablemixtures. Three methods were used to confirm stability andreproducibility of the data: continuous frequency sweeps to check
Fig. 2. Viscosities of PEGs. [a] viscosity versus shear rate curves of PEG 200w600 g/molat 200 �C and [b] viscosity versus PEG molecular weight ðMnÞ (g/mol) at varioustemperatures. All measurements were conducted under an ambient atmosphere.
whether a second scan agrees with the first scan; time sweeps for10w30 min; and 1H NMR to verify the lack of change in molecularstructure, PEG molecular weight ðMnÞ, and PEG concentration aftereach measurement [16].
3.3. Effect of PEG concentration on viscosity
Fig. 3 presents the effect of PEG concentration (wt%) on thecomplex viscosity of BPS-20K/PEG blends at 200 �C in the range of20w45 wt% PEG 600. With one exception, all viscosity versus fre-quency curves exhibit a Newtonian plateau followed by shearthinning; the BPS-20K/PEG 600 20 wt% blend does not exhibit aclear Newtonian plateau. As the PEG (i.e., plasticizer) concentrationincreases, the complex viscosity decreases as expected when apolymer is diluted with a low molecular weight solvent or plasti-cizer [45]. Fig. 4 summarizes the effect of PEG 600 weight fractionon the zero shear viscosity h0, of BPS-20K/PEG 600 blends; thetrend is consistent with a log-mean mixing rule as often found formiscible mixtures [46,47]. For cases where the Newtonian plateauis not clearly developed at the lowest frequency, i.e., u¼ 0.1 rad/s, avalue of h0 was estimated with the help of the Bueche-Hardingmodel as will be explained in section 3.7. As PEG concentrationincreases from 20 to 45 wt% h0, decreases by three orders ofmagnitude, following a linear semi-logarithmic relation.
As shown in the 20 wt% PEG blend (see Fig. 3), the viscositymeasured from low to high frequency (filled symbols) agrees wellwith the viscosity measured from high to low frequency (unfilledsymbols), indicating the shear history or the time at temperaturedoes not affect the rheological properties; similar data were foundfor all of the other compositions but are not shown for brevity.
For all compositions in Fig. 3, the frequency sweep was runtwice to verify reproducibility. Data from the BPS-20K/PEG 60045 wt% blend, which is the least stable composition among theblends considered, is shown as an example in Fig. 3. The viscositymeasured from the first frequency sweep (filled symbols) overlapswith that from the second (unfilled symbols). A time sweep at thesame temperature (200 �C) was conducted for 10 min to ascertainany changes in rheological properties ðG0;G00;
��h*��Þ, but no signifi-cant differences were found as shown in Fig. 5. Moreover, 1H NMRanalyses confirm that the PEG molecular structure, PEG Mn, or PEGconcentration in the blends were not significantly changed duringthe rheological measurements.
Fig. 3. Effect of PEG concentration (wt%) on blend viscosity. BPS-20K/PEG 600 blendswere used at 200 �C. For 20 wt% PEG curves, the filled symbols (C) are from frequencysweep done from low to high frequency; whereas the unfilled symbols (B) are fromhigh to low frequency sweep. For the 45 wt% PEG curves, the filled symbols ( ) arefrom the 1st frequency sweep and the unfilled symbols ( ) are from the 2nd frequencysweep. Unless otherwise indicated, a low to high frequency sweep was conducted.

Fig. 4. Effect of PEG 600 weight fraction on zero shear viscosity h0, of BPS-20K/PEG600 blends at 200 �C.
Fig. 6. Effect of PEG molecular weight ðMnÞ (g/mol), on the complex viscosity,��h*��, of
BPS-20K/PEG 30 wt% blends at 200 �C.
H.J. Oh et al. / Polymer 55 (2014) 1574e15821578
3.4. Effect of PEG Mn on viscosity
Fig. 6 shows the effect of PEG molecular weight ðMnÞ on thecomplex viscosity of BPS-20K/PEG blends at a fixed PEG concen-tration of 30 wt%. At a fixed PEG concentration, the blend viscositydecreases with decreasing PEG Mn since shorter chain PEG mole-cules themselves have a lower viscosity and possibly are moreeffective plasticizers than higher molecular weight PEG [16,45,48].The hydroxyl groups are likely to interact much more strongly withsulfonated groups than do the ether oxygens [49], thus, lowermolecular weight PEG molecules may more effectively plasticizethe BPS polymer. Fig. 7 summarizes the effect of PEGMn on the zeroshear viscosity h0, of BPS-20K/PEG 30 wt% blends at 200 �C. As thePEG Mn decreases from 600 g/mol to 200 g/mol h0, decreases byabout a factor of three.
However, compared to the three orders of magnitude decreasein the blend viscosity as PEG concentration increases between20 wt% to 45 wt% (see Fig. 4), this h0 decrease induced bydecreasing PEG Mn is relatively small (i.e., less than an order ofmagnitude decrease). Indeed, the viscosity difference between theBPS-20K/PEG 30 wt% blends with PEG 300 g/mol, 400 g/mol and600 g/mol is very small as shown in Fig. 6, so that their viscosities
Fig. 5. Storage modulus, G0 (B), loss modulus, G00 (C) and complex viscosity,��h*�� ( )
of BPS-20K/PEG 600 45 wt% blend as a function of time (minute). f ¼ 1 Hz, T ¼ 200 �Cunder a nitrogen atmosphere.
almost overlap each other at the higher frequency range (i.e.,>50 rad/s).
When the complex viscosity is normalized by the PEG viscosity(i.e., hBPS=PEG=hPEG), the data approach a single master curve asshown in Fig. 8. At a PEG concentration of 30 wt% and 200 �C, theBPS-20K/PEG blends, with PEG Mn ranging from 200 g/mol to600 g/mol, lead to a similar shear thinning behavior.
3.5. Effect of temperature on viscosity
The effect of temperature on the complex viscosity of BPS/PEGblends is shown in Fig. 9. For a blend of BPS-20K containing 30 wt%of PEG 600, the viscosity decreases as temperature increases from170 to 210 �C [50].
At temperatures well above Tg (i.e., Tg þ 100 �C or above), vis-cosity is typically expressed by an Arrhenius equation [51]:
h0 ¼ A$exp�DEhRT
�(1)
where h0 is the zero shear viscosity A, is a pre-exponential factorDEh, is the activation energy for flow R, is a gas constant, and T istemperature. Plots of logh0 versus 1/T are presented in Fig. 10 forBPS-20K/PEG 600 30w40 wt% blends. Some values of h0 were
Fig. 7. Effect of PEG molecular weight ðMnÞ (g/mol), on zero shear viscosity h0, of BPS-20K/PEG 30 wt% blends at 200 �C.

Fig. 10. Influence of temperature on zero shear viscosity h0, in blends of BPS-20K with30 wt% and 40 wt% PEG 600.
Fig. 8. Normalized viscosity, hBPS=PEG=hPEG, versus frequency of BPS-20K/PEG 30 wt%blends at 200 �C. PEGs with Mn ranging between 200 and 600 g/mol were used.
H.J. Oh et al. / Polymer 55 (2014) 1574e1582 1579
estimated with the help of the Bueche-Harding model as will beexplained in Section 3.7. The Arrhenius model provides a reason-able fit for the data, and model parameters are recorded in Table 3.As PEG concentration increases from 30 to 40wt% DEh, decreases byalmost a factor of two, presumably due to increased plasticizationin the blend containing more PEG. Typical values for DEh for non-associating polymer fluids are of the order of 20w65 kJ/mol [50].For associating polymers, the DEh values can vary depending onvarious factors including cation, bound ion type, and ion contentet al. [40,52e54]. Weiss et al. reported the DEh values around 230w270 kJ/mol with Na and Zn substituted sulfonated polystyrene(sulfonation level ¼ 1.82 w 5.81 mol%) [53].
3.6. The effect of BPS Mw on viscosity
In the discussion so far, results have been presented using onlyone sulfonated polysulfone (Mw ¼ 33,900 g/mol). More limited setsof measurements were made for other sulfonated polysulfoneswith higher molecular weight. The characteristics of these otherpolymers are presented in Table 1. Using these additional sulfo-nated polymers, blends were prepared using 30 wt% PEG 600, andrheological properties were measured at 200 �C.
The effect of the polymer molecular weight on the complexviscosity of BPS-20K/PEG blends is presented in Fig.11. The BPS-20Kweight average molecular weights range from 33,900 g/mol to
Fig. 9. Effect of temperature (�C) on the complex viscosity,��h*��, of BPS-20K/PEG 600
30 wt% blends.
56,700 g/mol. At a fixed sulfonation level (DS ¼ 20 mol%), thecomplex viscosity increases with increasing molecular weight.
Increasing the molecular weight of an associating polymer canenhance both molecular entanglements as well as ionic in-teractions, both of which could influence viscosity [40,52,53,55]. Itis difficult to distinguish the influences from entanglements andionic interactions, since the contribution of the entanglements tothe dynamic storage modulus is as significant as that of ionic as-sociations, according to Weiss et al. in their studies with lightlysulfonated polystyrene (2.5 and 4.8 mol% sulfonation) [53,54,56].Fouissac et al. also reported for hyaluroate, a wormlike ionomerthat, in the dilute region, whereM<Mc (Mc is the critical molecularweight for entanglements), the zero shear viscosity scales withmolecular weight to the first power (h0fM1), similar to that of non-associating polymers. HoweverMc, is observed at concentrations 10times less than in entangled, non-associating flexible polymers insolution. It has been suggested that above the entanglement con-centration, the zero shear viscosity scales with molecular weight tothe fourth power ðh0fM4Þ in associating polymers rather than the3.4 power ðh0fM3:4Þ typically observed in non-associating poly-mers [55].
A plot of zero shear viscosity as a function ofmolecular weight inBPS-20K materials is presented in Fig. 12. Since the Newtonianplateau is not fully developed for some curves in Fig.11, the Bueche-Harding model was used to estimate the h0 values as mentionedearlier. In RADEL� polysulfones, which are not sulfonated, the zeroshear viscosity scales with molecular weight raised to the 3.4 po-wer above the critical molecular weight, which is 10,000 g/mol[57]. Similarly, in the BPS-20K materials, the exponent is more orless consistent, based on these limited data, with the expectedvalue of 3.4 for non-associating polymers.
3.7. Master curve using Bueche-Harding Model
Many studies reported that the melt behavior of associatingpolymers (or ionomers) is different from that of non-associatingpolymers since the ionic groups act as physical cross-links, or
Table 3Parameters calculated from the Arrhenius type equation (1).
PEG 600 concentration [wt%] DEh [kJ/mol] A [Pa-s]
30 52.5 1.4140 28.3 2.49

Fig. 11. Effect of BPS-20K molecular weight (g/mol) on the complex viscosity,��h*��, of
BPS-20K/PEG 600 30 wt% blends at 200 �C.
H.J. Oh et al. / Polymer 55 (2014) 1574e15821580
may aggregate, leading to rheological complexity. In general, therheology of ionomers may be affected by various factors such ascounter ion/bound ion type, molecular weight, neutralization level,plasticizer, temperature and shear rate, etc., but no universal rulehas been established to explain the effect of all of these factors onrheology [40,58].
For the shear rate dependence of the viscosity, most polymersare pseudoplastic in the non-Newtonian region at high shear rate,whereas some associating polymer solutions (for example, Na andLi substituted sulfonated polystyrene) exhibit shear thickeningwhere, after the Newtonian regime, the viscosity increases by afactor of 2e3 times, and then shear thinning follows at higher shearrates [40,59e64]. Witten et al. explained that the ionic intrachainpairs separated and interchain connections increase as shear flowelongated the polymer chains, forming larger ionic networks,which contributed to higher viscosity. As the shear rate increased tolevels exceeding the chain relaxation time, a shear thinning regionappeared [59,65]. Therefore, ionic interactions as well as polymerentanglement should be considered in interpreting the rheology ofassociating polymers [40,52,53,66].
For a variety of non-associating polymers with similar molecularweight distributions like polystyrene, poly(methyl methacrylate),and mixtures of such polymers with diluents, Bueche and Harding[29] showed that plots of h/h0 versus s _g, lead to a single master
Fig. 12. Influence of molecular weight on zero shear viscosity h0, in blends of BPS-20Kcontaining 30 wt% of PEG 600. These measurements were performed at 200 �C. Thesolid line has a slope of 3.4.
curve, where _g is the shear rate and s is a relaxation time [67e71]given by:
s ¼ 12p2
Mwh0CRT
(2)
where Mw is the weight average molecular weight of the polymer,and C is the polymer concentration per unit volume (g polymer/cm3) [28,29].
It was of interest to learn whether the data for the currentmixtures of the ion containing polymer BPS-K could be describedby themaster curve established by Bueche and Harding [28,29]. Theviscosity versus frequency curves shown earlier can be converted tothe viscosity versus shear rate curves using the Cox-Merz rule [72e75] since it was found to be applicable for these materials withinacceptable error ranges (see Figure S1 and section S.1 in theSupplemental Material). The plots of h/h0 versus s _g where thevalue of s was calculated via Equation (2) are shown in Fig. 13; thiswas only possible for cases where h0 was well defined experi-mentally. When plotted in this manner, all of the rheological datamore or less collapse onto a single master curve. The solid line inFig. 13 was calculated from themaster curve equation developed byBueche and Harding [29,67]:
h
h0¼
h1þ 0:6ðs _gÞ0:75
i�1(3)
For the cases where the Newtonian plateau is not developed inthemeasured angular frequency range h0, was estimated as follows.Equation (3) can be rearranged to:
1h
¼ 1h0
þ 0:6s0:75
h0ð _gÞ0:75 (4)
when 1/h is plotted versus _g0:75, the data align linearly as illus-trated in Fig. 14. From the reciprocal of the intercept on the ordinateof such plots, a value for h0 was estimated. Fig.14 shows an exampleof BPS-20K/PEG 600 20wt% blend; similar datawere found for all ofthe other compositions but are not shown for brevity. The param-eters h0 and s calculated from this analysis are presented in Table 4.
The close agreement of the experimental data for the BPS-K/PEGmixtures with the Bueche-Harding master curve implies that therheological behavior of plasticized sulfonated polysulfone is similar
Fig. 13. Master curve of BPS-K/PEG blends using the Bueche-Harding Model. All dots(BPS-K/PEG blends) are the rheological data in Figs. 3, 6, 9 and 11. The solid line is themaster curve that Bueche and Harding found with many linear polymer systemsincluding the concentrated solutions of poly(methyl methacrylate) (PMMA) andpolystyrene (PS) [29,67].
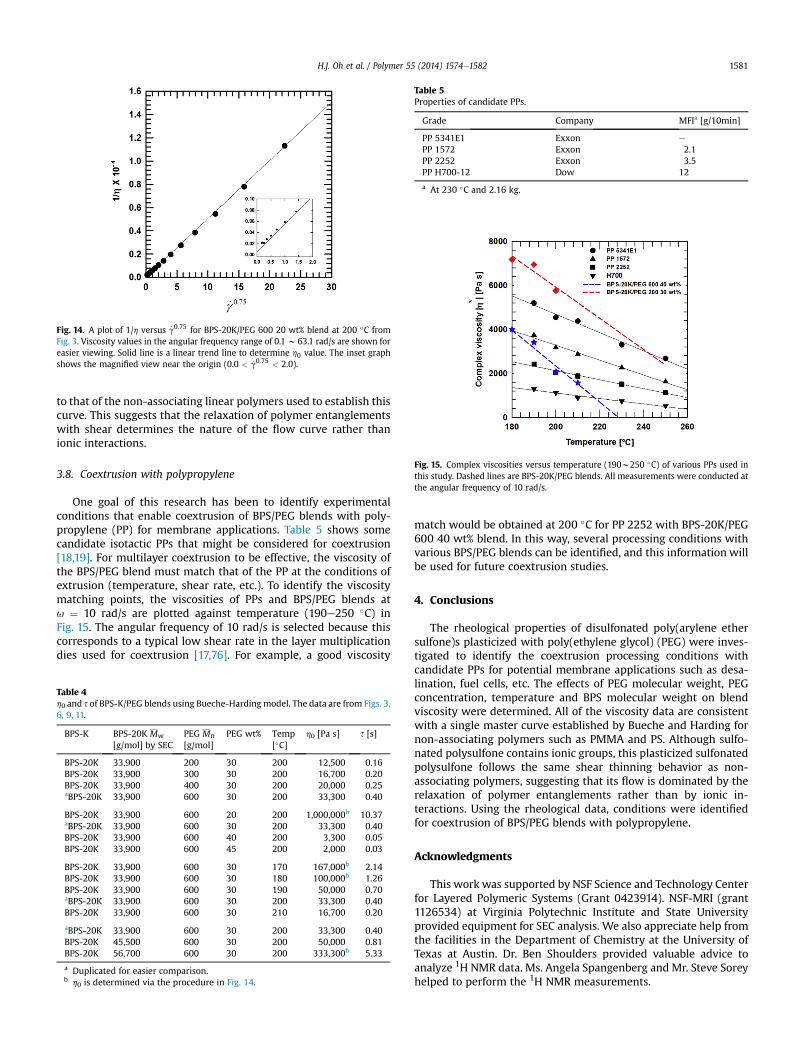
Fig. 14. A plot of 1/h versus _g0:75 for BPS-20K/PEG 600 20 wt% blend at 200 �C fromFig. 3. Viscosity values in the angular frequency range of 0.1 w 63.1 rad/s are shown foreasier viewing. Solid line is a linear trend line to determine h0 value. The inset graphshows the magnified view near the origin (0.0 < _g0:75 < 2.0).
Table 5Properties of candidate PPs.
Grade Company MFIa [g/10min]
PP 5341E1 Exxon e
PP 1572 Exxon 2.1PP 2252 Exxon 3.5PP H700-12 Dow 12
a At 230 �C and 2.16 kg.
Fig. 15. Complex viscosities versus temperature (190w250 �C) of various PPs used inthis study. Dashed lines are BPS-20K/PEG blends. All measurements were conducted atthe angular frequency of 10 rad/s.
H.J. Oh et al. / Polymer 55 (2014) 1574e1582 1581
to that of the non-associating linear polymers used to establish thiscurve. This suggests that the relaxation of polymer entanglementswith shear determines the nature of the flow curve rather thanionic interactions.
3.8. Coextrusion with polypropylene
One goal of this research has been to identify experimentalconditions that enable coextrusion of BPS/PEG blends with poly-propylene (PP) for membrane applications. Table 5 shows somecandidate isotactic PPs that might be considered for coextrusion[18,19]. For multilayer coextrusion to be effective, the viscosity ofthe BPS/PEG blend must match that of the PP at the conditions ofextrusion (temperature, shear rate, etc.). To identify the viscositymatching points, the viscosities of PPs and BPS/PEG blends atu ¼ 10 rad/s are plotted against temperature (190e250 �C) inFig. 15. The angular frequency of 10 rad/s is selected because thiscorresponds to a typical low shear rate in the layer multiplicationdies used for coextrusion [17,76]. For example, a good viscosity
Table 4h0 and s of BPS-K/PEG blends using Bueche-Hardingmodel. The data are from Figs. 3,6, 9, 11.
BPS-K BPS-20K Mw
[g/mol] by SECPEG Mn
[g/mol]PEG wt% Temp
[�C]h0 [Pa s] s [s]
BPS-20K 33,900 200 30 200 12,500 0.16BPS-20K 33,900 300 30 200 16,700 0.20BPS-20K 33,900 400 30 200 20,000 0.25aBPS-20K 33,900 600 30 200 33,300 0.40
BPS-20K 33,900 600 20 200 1,000,000b 10.37aBPS-20K 33,900 600 30 200 33,300 0.40BPS-20K 33,900 600 40 200 3,300 0.05BPS-20K 33,900 600 45 200 2,000 0.03
BPS-20K 33,900 600 30 170 167,000b 2.14BPS-20K 33,900 600 30 180 100,000b 1.26BPS-20K 33,900 600 30 190 50,000 0.70aBPS-20K 33,900 600 30 200 33,300 0.40BPS-20K 33,900 600 30 210 16,700 0.20
aBPS-20K 33,900 600 30 200 33,300 0.40BPS-20K 45,500 600 30 200 50,000 0.81BPS-20K 56,700 600 30 200 333,300b 5.33
a Duplicated for easier comparison.b h0 is determined via the procedure in Fig. 14.
match would be obtained at 200 �C for PP 2252 with BPS-20K/PEG600 40 wt% blend. In this way, several processing conditions withvarious BPS/PEG blends can be identified, and this information willbe used for future coextrusion studies.
4. Conclusions
The rheological properties of disulfonated poly(arylene ethersulfone)s plasticized with poly(ethylene glycol) (PEG) were inves-tigated to identify the coextrusion processing conditions withcandidate PPs for potential membrane applications such as desa-lination, fuel cells, etc. The effects of PEG molecular weight, PEGconcentration, temperature and BPS molecular weight on blendviscosity were determined. All of the viscosity data are consistentwith a single master curve established by Bueche and Harding fornon-associating polymers such as PMMA and PS. Although sulfo-nated polysulfone contains ionic groups, this plasticized sulfonatedpolysulfone follows the same shear thinning behavior as non-associating polymers, suggesting that its flow is dominated by therelaxation of polymer entanglements rather than by ionic in-teractions. Using the rheological data, conditions were identifiedfor coextrusion of BPS/PEG blends with polypropylene.
Acknowledgments
This work was supported by NSF Science and Technology Centerfor Layered Polymeric Systems (Grant 0423914). NSF-MRI (grant1126534) at Virginia Polytechnic Institute and State Universityprovided equipment for SEC analysis. We also appreciate help fromthe facilities in the Department of Chemistry at the University ofTexas at Austin. Dr. Ben Shoulders provided valuable advice toanalyze 1H NMR data. Ms. Angela Spangenberg and Mr. Steve Soreyhelped to perform the 1H NMR measurements.

H.J. Oh et al. / Polymer 55 (2014) 1574e15821582
Appendix A. Supplementary data
Supplementary data related to this article can be found at http://dx.doi.org/10.1016/j.polymer.2014.02.011.
References
[1] Xie W, Geise GM, Freeman BD, Lee H-S, Byun G, McGrath JE. J Membr Sci2012;403-404:152e61.
[2] Petersen RJ. J Membr Sci 1993;83(1):81e150.[3] Linder C, Kedem O. History of nanofiltration membranes 1960 to 1990. In:
Schafer AI, Fane AG, Waite TD, editors. Nanofiltration: principles and appli-cations. New York: Elsevier; 2003.
[4] Kariduraganavar MY, Nagarale RK, Kittur AA, Kulkarni SS. Desalination2006;197:225e46.
[5] Heinzer M, Lee M, Van Houten R, Ozma L, McGrath JE, Baird DG. In: AnnualTechnical Conferencee Society of Plastics Engineers, vol. 67; 2009. pp. 606e10.
[6] Xie W, Park HB, Lee CH, Byun G, Freeman BD, McGrath JE. Water Sci Technol JInt Assoc Water Pollut Res 2010;61(3):619e24.
[7] Xie W, Geise GM, Freeman BD, Lee CH, McGrath JE. Polymer 2012;53:1581e92.
[8] Xie W, Cook J, Park HB, Freeman BD, Lee CH, McGrath JE. Polymer 2011;52:2244e54.
[9] Wang F, Hickner M, Kim YS, Zawodzinski TA, McGrath JE. J Membr Sci2002;197:231e42.
[10] Park HB, Freeman BD, Zhang Z-B, Sankir M, McGrath JE. Angew Chem2008;47(32):6019e24.
[11] Yu C, Rowlett JR, Lee CH, Lane OR, Van Houten D, Zhang M, et al. J Polym SciPart Polym Chem 2013;51(10):2301e10.
[12] Roy A, Hickner MA, Lee H-S, Badami A, Yu X, Li Y, et al. ECS Trans 2006;20(24):45e54.
[13] Li Y, Wang F, Yang J, Liu D, Roy A, Case S, et al. Polymer 2006;47:4210e7.[14] Kim YS, Dong L, Hickner MA, Pivovar BS, McGrath JE. Polymer 2003;44(19):
5729e36.[15] Huang J, Baird DG, McGrath JE. In: Annual Technical Conference e Society of
Plastics Engineers, vol. 66; 2008. pp. 69e73.[16] Oh HJ, Freeman BD, McGrath JE, Lee CH, Paul DR. Polymer 2014;55:235e47.[17] Ponting M, Hiltner A, Baer E. Macromol Symp 2010;294(1):19e32.[18] Offord GT, Armstrong SR, Freeman BD, Baer E, Hiltner A, Swinnea JS, et al.
Polymer 2013;54:2577e89.[19] Offord GT, Armstrong SR, Freeman BD, Baer E, Hiltner A, Paul DR. Polymer
2013;54:2796e807.[20] Bebin P, Galiano H. Adv Polym Technol 2006;25(2):127e33.[21] Bebin P, Galiano H. Adv Polym Technol 2006;25(2):121e6.[22] Sanchez J-Y, Iojoiu C, Piffard Y, Kissi NE, and Chabert F. Extrusion of a ther-
moplastic polymer bearing acid ionic groupings, United States Patent no.7956095 B2. 2011.
[23] Sanchez J-Y, Iojoiu C, Mercier R, Marechal M, Kissi NE, et al. Membranepreparation method comprising the extrusion of a thermoplastic polymerbearing alkaline groupings, United States Patent no. 7,973,089 B2. 2011.
[24] Sanchez J-Y, Chabert F, Iojoiu C, Salomon J, Kissi NE, Piffard Y, et al. Electro-chimica Acta 2007;53:1584e94.
[25] Molmeret Y, Chabert F, Kissi NE, Iojoiu C, Mercier R, Sanchez J-Y. Polymers2011;3:1126e50.
[26] Molmeret Y, Chabert F, Iojoiu C, Kissi NE, Sanchez J-Y. Extruded proton ex-change membranes based on sulfonated polyaromatic polymers for fuel cellapplication. In: The XV International Congress on Rheology: the Society ofRheology 80th Annual Meeting, vol. 1027. Monterey, CA: American Instituteof Physics; 2008.
[27] Baker RW. Vapor and gas separation by membranes. In: Li NN, Fane AG,Ho WS, Matsuura T, editors. Advanced membrane technology and applica-tions. John Wiley & Sons, Inc; 2008. pp. 562e3.
[28] Paul DR. J Appl Polym Sci 1968;12:2273e98.[29] Bueche F, Harding SW. J Polym Sci 1958;32:177e86.[30] Yang L, Heatley F, Blease TG, Thompson RIG. Eur Polym J 1996;32(5):535e47.[31] Ordian G. Principles of polymerization. 4th ed. John Wiley and Sons; 2004.[32] Podzimek S. Light scattering. In: Podzimek S, editor. Light scattering, size
exclusion chromatography and asymmetric flow field flow fractionation:powerful tools for the characterization of polymers, proteins and nano-particles. Wiley; 2011. pp. 37e98.
[33] Lin H, Kai T, Freeman BD, kalakkunnath S, Kalika D. Macromolecules 2005;38:8381e93.
[34] Sigma-Aldrich. Poly(ethylene glycol) average Mn 300 (cat# 202371) http://www.sigmaaldrich.com/catalog/product/aldrich/202371?lang¼en®ion¼US; 2012.
[35] Sigma-Aldrich. Poly(ethylene glycol) average Mn 400 (cat# 202398) http://www.sigmaaldrich.com/catalog/product/aldrich/202398?lang¼en®ion¼US; 2012.
[36] Sigma-Aldrich. In: Sigma-Aldrich, editor. Poly(ethylene glycol) 600 (cat#87333). http://www.sigmaaldrich.com/catalog/product/sigma/87333?lang¼en®ion¼US; 2012.
[37] Sigma-Aldrich. Poly(ethylene glycol) average mol wt 200 (cat# P3015) http://www.sigmaaldrich.com/catalog/product/sial/p3015?lang¼en®ion¼US;2012.
[38] Tirrell M. Rheology of polymeric liquids. In: Macosko CW, editor. Rheologyprinciples, measurements, and applications. VCH Publishers, Inc; 1994.pp. 475e514.
[39] Ferry JD. Viscoelastic properties of polymers. 3rd ed. New York: Wiley; 1980.[40] Register RA, Prud’homme RK. Melt rheology. In: Tant MR, Mauritz KA,
Wilkes GL, editors. Ionomers. Blackie Academic & Professional; 1997.pp. 208e60.
[41] Zdyrko B, Varshney SK, Luzinov I. Langmuir 2004;20:6727e35.[42] Wool RP. Polymer interfaces: structure and strength. Munich: Carl Hanser
Verlag; 1995.[43] Pielichowski K, Flejtuch K. J Anal Appl Pyrol 2005;73:131e8.[44] Han S, Kim C, Kwon D. Polymer 1997;38(2):317e23.[45] Eisenberg A, Kim JS. Plasticization. Introduction to ionomers. Canada: John
Wiley & Sons, Inc; 1998. pp. 244e56.[46] Utracki LA. Polymer alloys and blends: thermodynamics and rheology. Hanser
Publishers; 1989.[47] Wagner Jr JR. Polymer blend for packaging applications multilayer flexible
packaging. Technology & Engineering; 2009. pp. 158e9.[48] Curtis AJ. Dielectric properties of polymeric systems. In: Birks JB, Schulman JH,
editors. Progress in dielectrics, vol. 2. Hertfordshire, UK: Heywood & CompanyLtd.; 1960. pp. 31e76.
[49] Lee CH, VanHouten D, Lane O, McGrath JE, Hou J, Madsen LA, et al. ChemMater 2011;23(4):1039e49.
[50] Bueche F. Physical properties of polymer. New York: Interscience Publishers;1962.
[51] Lodge TP, Hiemenz PC. Polymer chemistry. 2nd ed. CRC Press Taylor & FrancisGroup; 2007.
[52] Weiss RA. J Rheol 2009;53:191e213.[53] Weiss RA, Fitzgerald JJ, Kim D. Macromolecules 1991;24:1071e6.[54] Weiss RA, Zhao H. J Rheol 2009;53(1):191.[55] Fouissac E, Milas M, Rinauldo M. Macromolecules 1993;26:6945e51.[56] Wiles KB, Wang F, McGrath JE. J Polym Sci Part Polym Chem 2005;43(14):
2964e76.[57] Roovers J, Toporowski PM, Ethier R. High Perform Polym 1990;2(3):165e79.[58] Kim JS, Eisenberg A. Ion aggregation and its effect on ionomer properties. In:
Schlick S, editor. Ionomers: characterization, theory and applications. CRCPress, Inc; 1996. pp. 7e34.
[59] Witten TA. J De Physique 1988;49:1055e63.[60] Bhargava S, Cooper SL. Macromolecules 1998;31:508e14.[61] Li L, Guo G, Prud’homme RK. ACS Polym Prepr 2006;47:271.[62] Maus C, Fayt R, Jerome R, Teyssie P. Polymer 1995;36:2083e8.[63] Pieffer DG, Lundberg RD, Duvdevani I. Polymer 1986;27:1453e62.[64] Saho L, Weiss RA, Lundberg RD. J Polym Sci Part B Polym Phys 1995;33:2083e
92.[65] Witten TA, Cohen MH. Macromolecules 1985;18:1915e8.[66] Lu X, Steckle WP, Weiss RA. Macromolecules 1993;26:5876e84.[67] Dealy JH, Wissbrun KF. Melt rheology and its role in plastic processing: theory
and applications. Van Nostrand Reinhold; 1990.[68] Bueche F, Harding SW. J Chem Phys 1957;27(5):1210.[69] Bueche F. J Appl Phys 1959;30(7):1114.[70] Graessley WW. J Chem Phys 1967;47(6):1942.[71] Paul DR, Lawrence JES, Troell JH. Polym Eng Sci 1970;10(2):70e8.[72] Cox WP, Merz EH. J Polym Sci 1958;28(119):619e22.[73] Al-Hadithi TSR, Barnes HA, Walters K. Colloid Polym Sci 1992;270:40e6.[74] Milner ST. J Rheol 1996;40:303e15.[75] Laun HM. J Rheol 1986;30(3):459e501.[76] Ponting MT. Gradient multilayered films & confined crystallization of polymer
nanolayers by forced assembly coextrusion. Ph.D. Dissertation, Department ofMacromolecular Science & Engineering: Case Western Reserve University;2010.