Rheological Characterization of Polymer Melts in Shear and Extension
67
-
Upload
miguel-marujo -
Category
Documents
-
view
221 -
download
0
Transcript of Rheological Characterization of Polymer Melts in Shear and Extension

8/12/2019 Rheological Characterization of Polymer Melts in Shear and Extension
http://slidepdf.com/reader/full/rheological-characterization-of-polymer-melts-in-shear-and-extension 1/67

8/12/2019 Rheological Characterization of Polymer Melts in Shear and Extension
http://slidepdf.com/reader/full/rheological-characterization-of-polymer-melts-in-shear-and-extension 2/67
Tampereen teknillinen yliopisto. Julkaisu 964Tampere University of Technology. Publication 964
Johanna Aho
Rheological Characterization of Polymer Melts in Shearand Extension: Measurement Reliability and Data forPractical Processing
Thesis for the degree of Doctor of Science in Technology to be presented with duepermission for public examination and criticism in Konetalo Building, Auditorium K1702,at Tampere University of Technology, on the 20th of May 2011, at 12 noon.
Tampereen teknillinen yliopisto - Tampere University of TechnologyTampere 2011

8/12/2019 Rheological Characterization of Polymer Melts in Shear and Extension
http://slidepdf.com/reader/full/rheological-characterization-of-polymer-melts-in-shear-and-extension 3/67
ISBN 978-952-15-2569-8 (printed)ISBN 978-952-15-2583-4 (PDF)ISSN 1459-2045

8/12/2019 Rheological Characterization of Polymer Melts in Shear and Extension
http://slidepdf.com/reader/full/rheological-characterization-of-polymer-melts-in-shear-and-extension 4/67
ABSTRACT
In order to manage the processing of polymers one needs to understand and be able to quantify the rheological phenomena occurring in complex flows of viscoelastic
materials. Knowledge on rheological behavior of polymers is needed for setting the right
process window, such as temperature and flow rate. In addition, rheological data is
needed for process simulation, which is increasingly adapted as an important part of new process setup. Rheological properties of the polymer melt are of particular
importance in flow modeling. Despite their importance, shortcuts in rheological
measurements are often taken, which can lead to inaccurate or incorrect results. The scope of the study was to add knowledge on the importance of different
rheological properties of polymers regarding melt processing, to improve their
measurement techniques and discuss possible errors in experiments. The focus of the
work was on selected subjects important in polymer processing, the emphasis being on injection molding: measuring and modeling of polymer melt viscosity at low
temperature and shear rates, pressure dependence of viscosity, and extensional
viscosity. In addition, rheological data measured using an injection molding machine and slit die were reported. Secondly, the correct way of performing experiments, measurement accuracy and correct data analysis were discussed in capillary rheometer
measurements and uniaxial extensional viscosity measurements. The results of Publication showed that generalized Newtonian fluid (GNF) models,
such as Carreau-Yasuda equation, were able to describe the viscosity function accurately for the studied amorphous polymers over the flow phases relevant in injection molding high temperature and high shear rate, as in filling, or low shear rate and low
temperature, as in packing. Dynamic oscillatory experiments at low temperatures showed tendency towards an apparent 2nd Newtonian plateau at high angular
frequencies.
Publication II discussed the correction of entrance pressure drop in capillary
rheometry: an orifice die proved to offer convenient short-cut for evaluating the entrance pressure drop, but the conical expansion area of the commercial design used
here requires correction for the additional pressure drop caused by the adhesion of
the melt to the wall of the expansion area.
Publication III confirmed that the pressure dependence of viscosity, studied for several polymers, increases with increasing complexity. At lower temperatures, close to
the glass transition temperature, the effect of pressure on viscosity is more pronounced,
hence the test temperature must be taken into account when pressure dependence of
viscosity for different polymers is compared. Publication IV examined the experimental and analytical practice and errors in
uniaxial extension experiments by Sentmanat extensional rheometer (SER). Modifying
the calculation by taking into account the changes in sample geometry due to thermal expansion and pre-stretching, more exact results were achieved. As one important
outcome of this study, an option for taking into account the geometrical error related to
the thermal expansion was made in the software provided by the rheometer manufacturer Anton Paar, to be used in conjunction with SER.

8/12/2019 Rheological Characterization of Polymer Melts in Shear and Extension
http://slidepdf.com/reader/full/rheological-characterization-of-polymer-melts-in-shear-and-extension 5/67
ii
combination of two methods for determining extensional viscosity at broad-
extension rate range considering injection molding simulation as possible application was studied in Publication V. Extensional viscosity could be achieved over wide range of extension rates with relatively good accuracy by measuring it using SER
and by evaluating it from contraction flow analysis on capillary rheometry data.
Moreover, the molecular stress function (MSF) model could be used to predict the extensional behavior in case where scarce experimental data is available.
Rheological measurements of polymer melts under actual processing conditions,
using an adjustable slit die coupled to an injection molding machine, were reported in
Publication VI comparing them to low and moderate shear rate data achieved by conventional off-line rheometers. The viscosity results achieved by the slit die
measurements correlated very well with the off-line data, demonstrating the usefulness
of low-cost, easy and fast operation device as rheological tool. In addition,
measurements with three different slit sizes showed good superposition verifying the absence of wall slip.
8/12/2019 Rheological Characterization of Polymer Melts in Shear and Extension
http://slidepdf.com/reader/full/rheological-characterization-of-polymer-melts-in-shear-and-extension 6/67
iii
PREFACE
This work was carried out between years 2006- 2011 at Tampere University of Technology (TUT), Department of Materials Science. Part of the work, from April 2008
to September 2009, was done during the author’s exchange period in Germany at Berlin
Institute of Technology (TU Berlin), Chair of Polymer Engineering/ Polymer Physics. The
work was inspired by the EU 6th Framework research project “Virtual Injection
Moulding for improving production efficiency, quality, and time-to-market speed” (VIM), and carried out under the Graduate School of Processing of Polymers and Polymer-
based Multimaterials. They, as well as Academy of Finland, are acknowledged for the
financial support. gratefully acknowledge Professor Peter Van Puyvelde from K.U. Leuven, Belgium,
and PhD Susana Filipe from Borealis Polyolefine GmbH, Austria, for examining this
thesis. express my most sincere gratitude to my supervisor PhD Seppo Syrjälä for always being available for discussion, for tirelessly reviewing my texts, and for teaching
me to assess research work objectively and with the necessary criticism. further
acknowledge my custos, Professor Pentti Järvelä for giving me the chance to work at
TUT for all these years, and Professor Jyrki Vuorinen for encouraging me in my striving
towards the doctoral degree. give my special thanks to Professor Manfred H. Wagner for his professional
guidance, patience, and true interest towards my work during my stay at Berlin Institute
of Technology, and PhD Víctor H. Rolon-Garrído for innumerable fruitful discussions, support and collaboration in preparing manuscripts and conference papers. Further
want to thank the entire staff of the Laboratory of Plastics and Elastomer Technology at
TUT as well as the colleagues at Polymer Engineering/ Polymer Physics at TU Berlin for
encouragement and help, and for creating pleasant working environment. also thank all the partners of VIM consortium for the rewarding cooperation during and even after
the project
sincerely thank all my friends for giving me inspiration, support and the important balance between free time and work. Especially would like to thank Ms. Tytti Erästö,
Dr. Ozgur Dedehayir, Ms. Mari Kylmälä and Ms. Eloise Kok for sharing the ups and downs of research work and doctoral studies. Finally wish to express my deepest
gratitude to all my nearest and dearest: my sisters Helena and Laura, and brothers Tapio, Pirkka, Kalervo and Markus, my dad Markku, and especially my dear Mum Irja,
who has supported me all the way and given an outsider’s view to my research
problems.
Tampere, May 2011
8/12/2019 Rheological Characterization of Polymer Melts in Shear and Extension
http://slidepdf.com/reader/full/rheological-characterization-of-polymer-melts-in-shear-and-extension 7/67
iv
LIST OF ORIGINAL PUBLICATIONS
Peer-reviewed journal publications included in the PhD thesis
Aho J, Syrjälä S. On the measurement and modeling of viscosity of polymers at low
temperatures. Polymer Testing 27, 2008, 35-40.
II Aho J, Syrjälä S. Evaluation of different methods for determining the entrance pressure drop in capillary rheometry. Applied Rheology 18, 2008, 63258-1 63258-
5.
III Aho J, Syrjälä S. Measurement of the pressure dependence of viscosity of polymer
melts using back-pressure regulated capillary rheometer. Journal of Applied
Polymer Science 117, 2010, 1076-1084.
IV Aho J, Rolón-Garrido VH, Syrjälä S, Wagner MH. Measurement technique and data
analysis of extensional viscosity for polymer melts by Sentmanat Extensional
Rheometer (SER). Rheologica Acta 49, 2010, 359-370.
Aho J, Rolón-Garrido VH, Syrjälä S, Wagner MH. Extensional Viscosity in Uniaxial
Extension and Contraction Flow Comparison of Experimental Methods and
Application of the Molecular Stress Function Model. Journal of Non-Newtonian Fluid Mechanics 165, 2010, 212-218.
VI Aho J, Syrjälä S. Shear viscosity measurements of polymer melts using injection
molding machine with adjustable slit die. Polymer Testing 30, 2011, 595-601.
AUTHOR’S CONTRIBUTION
For papers I-III the author performed the majority of the experimental work and
share of the writing, excluding the parts involving numerical modeling. In papers IV-V the author performed all the experimental work and the writing excluding the parts
involving molecular modeling (MSF theory). In paper VI the author performed all the
experiments and majority of writing. All the papers were commented by the coauthors
and revised by supervising coauthors Seppo Syrjälä and/ or Manfred H. Wagner.

8/12/2019 Rheological Characterization of Polymer Melts in Shear and Extension
http://slidepdf.com/reader/full/rheological-characterization-of-polymer-melts-in-shear-and-extension 8/67
Other related journal publications and conference papers
Aho J, Syrjälä S. Evaluation of Pressure Dependence of Viscosity for some Polymers
Using Capillary Rheometer. 14th Nordic Rheology Conference, June 2005, Tampere,
Finland. Annual Transactions of the Nordic Rheology Society 13, 2005, 55-60.
Aho J, Syrjälä S. Determination of the Entrance Pressure Drop in Capillary Rheometry
Using Bagley Correction and Zero-length Capillary. 15th Nordic Rheology Conference,
June 2006, Stockholm, Sweden. Annual Transactions of the Nordic Rheology Society 14, 2006, 143-137.
Syrjälä S, Aho J. Evaluation of the effect of viscous heating in capillary rheometry of
polymer melts. 16th Nordic Rheology Conference, June 2007, Stavanger, Norway. Annual Transactions of the Nordic Rheology Society 15, 2007, 99-103.
Fernández M, Muñoz ME, Santamaria A, Syrjälä and Aho J. Determining the pressure
dependency of the viscosity using pvt data: practical alternative for thermoplastics. Polymer Testing 28, 2009, 109-113.
Aho J, Rolón-Garrido VH, Syrjälä S, Wagner MH. Extensional viscosity in uniaxial extension and contraction flow Comparison of experimental methods and
application of the molecular stress function model. 18th Nordic Rheology Conference,
August 2009, Reykjavik, Iceland. Annual Transactions of the Nordic Rheology Society
17, 2009, 167-173.
Aho J, Rolón-Garrido VH, Syrjälä S, Wagner MH. Study of extensional viscosity in
uniaxial extension and contraction flow Comparison of methods and application of
MSF model. Gemeinsame Diskussionstagung der Deutschen Rheologischen Gesellschaft (DRG) und des ProcessNet Fachausschusses “Rheologie”, March 2009,
Berlin, Germany. Book of Abstracts of DRG, 28.
Aho J, Moog M, Thornagel M, Syrjälä S, Wagner MH. The role of extensional viscosity
in injection molding evaluated by contraction flow simulations. Advances in Polymer
Science 01, July 2009, Linz, Austria. Proceedings of Conference on Polyolefins and
Polymelamines, 113.
Aho J, Rolón-Garrido VH, Syrjälä S, Wagner MH. Measurement Technique and Data
Analysis of Extensional Viscosity for Polymer Melts by Sentmanat Extensional
Rheometer (SER). 81st Annual Meeting of the Society of Rheology, October 2009,
Madison, WI, USA. Proceedings of the Society of Rheology, 89.
Aho J, Syrjälä S. Pressure dependence of viscosity of polymers and its importance to
the simulation of injection molding process” Nordic Polymer Days, May 2010, Helsinki Finland. Book of Abstracts of NPD, 20.
Aho J, Moberg L, Syrjälä S, Järvelä P. Injection molding machine with height-adjustable slit die for rheological measurements of polymer melts under processing
conditions. 20th Nordic Rheology Conference, June 2011, Helsinki, Finland. Annual
Transactions of the Nordic Rheology Society, 19, 2011, 125-133.

8/12/2019 Rheological Characterization of Polymer Melts in Shear and Extension
http://slidepdf.com/reader/full/rheological-characterization-of-polymer-melts-in-shear-and-extension 9/67
vi
LIST OF SYMBOLS AND ABBREVIATIONS
material characteristic constant
surface area fitting parameter in Carreau, Carreau-Yasuda, and Cross equations
,
,
,
horizontal temperature/ pressure/ temperature and pressure shift factor
B material characteristic constant
bT vertical temperature shift factor
C 1 C 2 WLF equation fitting parameters
D diameter
E activation energy
F force
G gi relaxation modulus
G* complex modulus
G’ storage modulus
G” loss modulus
h gap/ slit height
K material characteristic constant
L l length
L0 initial length
M 0 torque amplitude
M w molecular weight
n power-law coefficient
n’ local power-law index
N 1 1st normal stress difference
N 2 2nd normal stress difference
p hydrostatic pressure
Q volume flow rate
Qd drag flow rate
R ideal gas constant
r R radius
R p piston radius
T temperature t, t’ time

8/12/2019 Rheological Characterization of Polymer Melts in Shear and Extension
http://slidepdf.com/reader/full/rheological-characterization-of-polymer-melts-in-shear-and-extension 10/67
vii
T g glass-transition temperature
T m melting temperature
T ref reference temperature
v velocity
v 1 v 2 v 3 velocity components in directions x1 x2 and x3 V p piston speed
w slit width
pressure coefficient strain 0 strain amplitude , 0 shear (strain) rate
shear rate at outer rim of the plate-plate rheometer
reduced shear rate apparent wall shear rate true wall shear rate differential length pressure gradient entrance pressure drop
phase angle strain
Hencky strain
Hencky strain rate viscosity 0, 0, zero-shea viscosity (at normal pressure) 0, zero-shear viscosity at pressure p complex viscosity extensional viscosity reduced viscosity shear viscosity
in-phase component of complex viscosity out-of-phase component of complex viscosity start-up shear viscosity start-up extensional viscosity, uniaxial extension start-up extensional viscosity, biaxial extension start-up extensional viscosity, planar extension , characteristic (relaxation) time 0 linear viscoelastic limit
density
reference density

8/12/2019 Rheological Characterization of Polymer Melts in Shear and Extension
http://slidepdf.com/reader/full/rheological-characterization-of-polymer-melts-in-shear-and-extension 11/67
viii
tensile stress
component ij of m × n stress tensor
, 0 shear stress, shear stress amplitude
’ , ” in-phase and out-of-phase components of shear stress
critical shear stress elastic shear stress
viscous shear stress
apparent wall shear stress
true wall shear stress
0 cone angle in cone-plate rheometer
0 angular amplitude of oscillatory shear in rotational rheometer
initial deflection angle in SER device 1 1st normal stress coefficient
2 2nd
normal stress coefficient angular velocity
angular frequency
ABS acrylonitrile butadiene styrene
CAD computer aided design
GNF generalized Newtonian fluid
FEM finite element method
FSR filament stretching rheometer
HDPE high-density polyethylene LCB long-chain branch(ing)
LDPE low-density polyethylene
LVE linear viscoelastic envelope
MWD molecular weight distribution
MFR melt flow rate
MTR Münstedt tensile rheometer
MVR melt volume (flow) rate
NPL National Physics Laboratory
PC polycarbonate PMMA poly methylmethacrylate
PP polypropylene
PS polystyrene
pVT pressure-volume-temperature relation
RME Rheometrics melt extensiometer
SAOS small angle oscillatory shear
SER Sentmanat extensional rheometer
WLF William-Landels-Ferry equation

8/12/2019 Rheological Characterization of Polymer Melts in Shear and Extension
http://slidepdf.com/reader/full/rheological-characterization-of-polymer-melts-in-shear-and-extension 12/67
ix
TABLE OF CONTENTS
ABSTRACT ........................................................................................................................................................................ i PREFACE ........................................................................................................................................................................ iii LIST OF ORIGINAL PUBLICATIONS........................................................................................................................ iv AUTHOR’S CONTRIBUTION ...................................................................................................................................... iv LIST OF SYMBOLS AND ABBREVIATIONS ........................................................................................................... vi 1 INTRODUCTION ...................................................................................................................................................... 1
1.1 Scope of the study ......................................................................................................................................... 2 2 OVERVIEW TO POLYMER RHEOLOGY ............................................................................................................ 3
2.1 Basic flow characteristics of polymers .................................................................................................. 3 2.1.1 Linear viscoelasticity and mechanical models ............................................................................. 4 2.1.2 Non-linear viscoelasticity .................................................................................................................... 7 2.1.3 Cox-Merz rule .......................................................................................................................................... 8 2.1.4 Temperature dependence and time-temperature superposition ......................................... 9 2.1.5 Pressure dependence......................................................................................................................... 10
2.2 Viscometric Flows ..................................................................................................................................... 11 2.3 Extensional Flows ...................................................................................................................................... 12 2.4
Viscosity models for shear-thinning polymer melts ...................................................................... 14
3 RHEOMETRY AND GOOD MEASUREMENT PRACTICE ........................................................................... 17
3.1 Cone-plate and parallel-plate rheometry .......................................................................................... 17 3.2 Capillary rheometry .................................................................................................................................. 19 3.3 Slit rheometry ............................................................................................................................................. 23 3.4 Rheological measurements with polymer processing machines .............................................. 25 3.5 Extensional rheometry by counter-rotating drum device ........................................................... 26 3.6 Other devices for uniaxial extension ................................................................................................... 27 3.7 Sample preparation and treatment in rheological measurements ........................................... 28
4 ROLE OF RHEOLOGY IN POLYMER PROCESSING .................................................................................... 30 4.1 Rheology in injection molding............................................................................................................... 30 4.1.1 Filling phase .......................................................................................................................................... 31 4.1.2 Packing phase ....................................................................................................................................... 32
4.2 Significance of rheology in injection molding simulation ............................................................ 32 4.2.1 Calculation basis for polymer melt flow in 2.5D simulation................................................. 33 4.2.2 Simplifying assumptions .................................................................................................................. 34 4.2.3 Pressure dependence of viscosity and other rheology-related challenges in injection
molding simulation............................................................................................................................. 34 4.3 Rheology in extrusion .............................................................................................................................. 35 4.3.1 Effect of viscoelasticity on die swell and extrusion instabilities ......................................... 37
4.4 Rheology in extensional flow dominated processes ...................................................................... 39 4.4.1 Fiber spinning ...................................................................................................................................... 39 4.4.2 Blow molding........................................................................................................................................ 39 4.4.3 Film blowing ......................................................................................................................................... 40
5 SUMMARY OF EXPERIMENTAL WORK AND RESULTS .......................................................................... 41 5.1 Test materials and experimental settings ......................................................................................... 41 5.2 Viscosity at low shear rates and temperatures (Publication I) .................................................. 42 5.3 Determining the entrance pressure drop in capillary rheometry (Publication II) ............. 43 5.4 Viscosity at elevated pressures (Publication III) ............................................................................ 44 5.5 Measurement of uniaxial extensional viscosity by SER (Publication IV)................................ 45 5.6 Comparison of uniaxial extension and contraction flow analysis (Publication V) .............. 46 5.7 Viscosity measurements of polymer melts by an adjustable slit die and injection molding
machine (Publication VI) ........................................................................................................................ 47 6 CONCLUDING REMARKS ................................................................................................................................... 48 7 REFERENCES......................................................................................................................................................... 50 APPENDIX 1: ORIGINAL PUBLICATIONS INCLUDED IN THE THESIS APPENDIX 2: CORRECTION OF RESULTS IN PUBLICATION

8/12/2019 Rheological Characterization of Polymer Melts in Shear and Extension
http://slidepdf.com/reader/full/rheological-characterization-of-polymer-melts-in-shear-and-extension 13/67
All exact science is
dominated by the idea
of approximation.
-Bertrand Russel
8/12/2019 Rheological Characterization of Polymer Melts in Shear and Extension
http://slidepdf.com/reader/full/rheological-characterization-of-polymer-melts-in-shear-and-extension 14/67
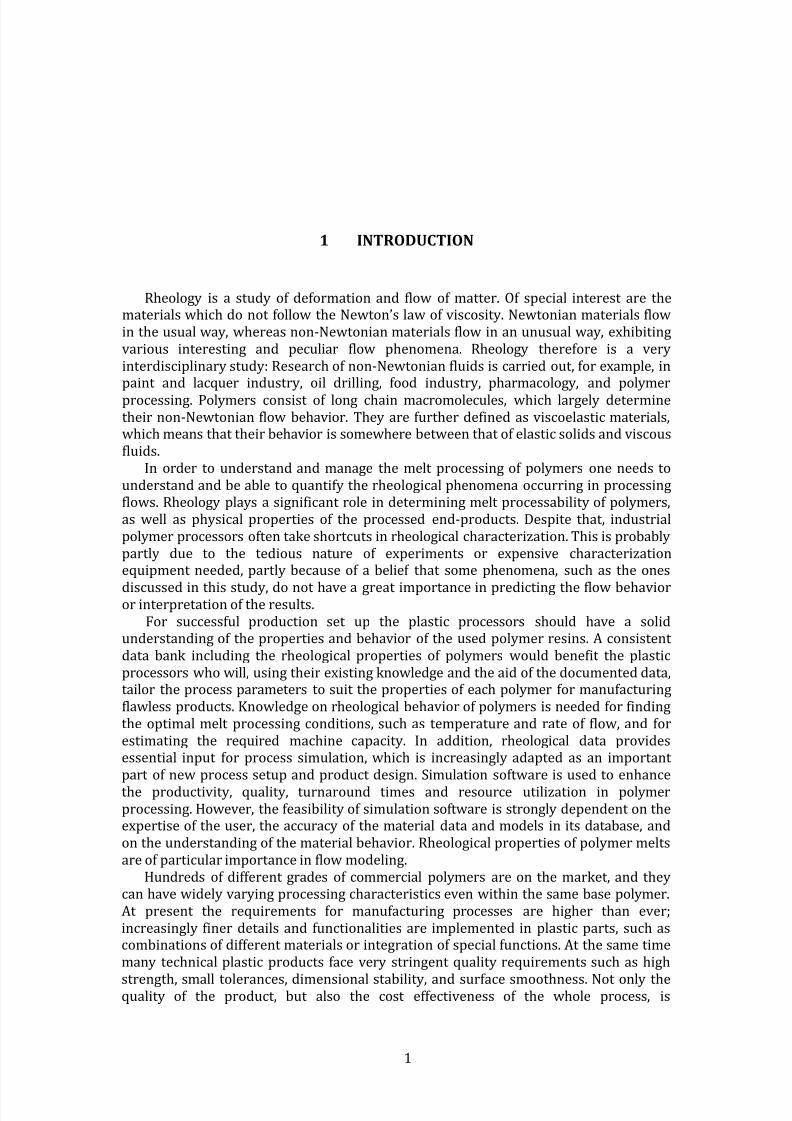
1 INTRODUCTION
Rheology is study of deformation and flow of matter. Of special interest are the materials which do not follow the Newton’s law of viscosity. Newtonian materials flow
in the usual way, whereas non-Newtonian materials flow in an unusual way, exhibiting
various interesting and peculiar flow phenomena. Rheology therefore is very
interdisciplinary study: Research of non-Newtonian fluids is carried out, for example, in paint and lacquer industry, oil drilling, food industry, pharmacology, and polymer
processing. Polymers consist of long chain macromolecules, which largely determine
their non-Newtonian flow behavior. They are further defined as viscoelastic materials, which means that their behavior is somewhere between that of elastic solids and viscous
fluids.
In order to understand and manage the melt processing of polymers one needs to
understand and be able to quantify the rheological phenomena occurring in processing flows. Rheology plays significant role in determining melt processability of polymers,
as well as physical properties of the processed end-products. Despite that, industrial
polymer processors often take shortcuts in rheological characterization. This is probably
partly due to the tedious nature of experiments or expensive characterization equipment needed, partly because of belief that some phenomena, such as the ones
discussed in this study, do not have great importance in predicting the flow behavior or interpretation of the results.
For successful production set up the plastic processors should have solid understanding of the properties and behavior of the used polymer resins. consistent
data bank including the rheological properties of polymers would benefit the plastic
processors who will, using their existing knowledge and the aid of the documented data, tailor the process parameters to suit the properties of each polymer for manufacturing
flawless products. Knowledge on rheological behavior of polymers is needed for finding
the optimal melt processing conditions, such as temperature and rate of flow, and for
estimating the required machine capacity. In addition, rheological data provides essential input for process simulation, which is increasingly adapted as an important
part of new process setup and product design. Simulation software is used to enhance
the productivity, quality, turnaround times and resource utilization in polymer
processing. However, the feasibility of simulation software is strongly dependent on the expertise of the user, the accuracy of the material data and models in its database, and
on the understanding of the material behavior. Rheological properties of polymer melts
are of particular importance in flow modeling.
Hundreds of different grades of commercial polymers are on the market, and they can have widely varying processing characteristics even within the same base polymer.
At present the requirements for manufacturing processes are higher than ever;
increasingly finer details and functionalities are implemented in plastic parts, such as combinations of different materials or integration of special functions. At the same time
many technical plastic products face very stringent quality requirements such as high
strength, small tolerances, dimensional stability, and surface smoothness. Not only the quality of the product, but also the cost effectiveness of the whole process, is
8/12/2019 Rheological Characterization of Polymer Melts in Shear and Extension
http://slidepdf.com/reader/full/rheological-characterization-of-polymer-melts-in-shear-and-extension 15/67
increasingly important. Booming petroleum price raises the polymer raw material costs
and, moreover, small- medium size companies in Europe cannot compete in the labor costs with the cheap-labor mass production in emerging industrial countries. In order to
keep up with the competition, the consumption of the raw materials and the process
cycle time should be kept down and the time and labor needed for the tool design and
process setup phases should be minimized. For all the above-mentioned reasons, numerical simulation is achieving an increasingly important role in the part and mould
or die design process, as well as in adjusting the right processing parameters for the
actual production.
1.1 Scope of the study
In order to increase the competitiveness of European small-medium scale injection
molding enterprises, the integrated EU 6th framework project “Virtual Injection
Moulding for improving production efficiency, quality, and time-to-market speed”
(IP505718-2 VIM) was implemented during 2004-2008. The aim was to increase the
efficiency of the molding companies by providing them better tools for optimizing the injection molding process, thus saving time, money and effort related to the
optimization of material, mold and process especially at the start-up phase of production. The first task in the project was “Material characterization”, which involved
measurement of rheological, thermal and mechanical properties of selected set of
commercial polymer grades, in which the author was also involved. These results were
utilized to build data base that was put to use in “Simulation tool development”, where the influence of different material parameters on the accuracy of the injection molding
filling and packing simulation was studied. This doctoral thesis is partly based on, and
inspired by, the studies carried out during the VIM project.
The scope of this study was to add knowledge on the importance of different rheological phenomena in polymer melt processing especially injection molding and
to improve the rheological measurement techniques. Relevant characterization methods
and some difficulties related to them were addressed and examined. The focus was on
certain rheological subjects considered important for different polymer processes: pressure dependence of viscosity (Publication III), viscosity of polymers at low
temperatures and shear rates (Publication I) and extensional viscosity (Publication V).
Experimental procedures for correcting entrance pressure drop in capillary rheometry (Publication II) and extensional viscosity measurements by uniaxial extension device
(Publication IV) were studied and the reliability of the measurements and correct data
analysis was discussed. The usefulness of tailor-made adjustable slit die for rheological
measurements using an injection molding machine was demonstrated in Publication VI. The following chapters wrap up the work summarizing the important aspects of
polymer melt rheology, rheometry and experimental techniques, and the role of rheology in polymer processing.

8/12/2019 Rheological Characterization of Polymer Melts in Shear and Extension
http://slidepdf.com/reader/full/rheological-characterization-of-polymer-melts-in-shear-and-extension 16/67
2 OVERVIEW TO POLYMER RHEOLOGY
2.1 Basic flow characteristics of polymers
Factors related to the molecular structure of polymers set challenges to their
successful processing; unlike metals or ceramics, polymeric materials consist of very
long chain-like macromolecules. This leads to rather complex rheological behavior in the molten state. The relationship between elastic shear stress and strain for fully elastic materials, such as metals, is determined by Hooke’s law.
= (1)
For pure viscous liquids such as water, oil, or syrup deformation is time-dependent, and the relationship between the viscous shear stress and strain rate is determined by Newton’s law.
(2)
For Newtonian fluids viscosity is material constant and not dependent of the rate of deformation. For fully elastic materials the strain is directly proportional to the stress
with factor called shear modulus G (for shear) or Young’s modulus E (for tension), and
the elastic energy is stored in the substance upon deforming it. Thus the strain is totally recoverable after permitting the material to return to its undeformed equilibrium state,
provided that the limit of plastic deformation was not exceeded in loading. For pure
viscous materials all the energy is dissipated in the continuous deformation, thus the amount of recoverable strain is zero. The deformation follows the applied stress with
delay1
The properties of polymer melts lie somewhere between Hookean and Newtonian
materials, thus they are viscoelastic liquids by nature. Cross-linked rubbers have properties closer to the elastic materials and they are often referred to as viscoelastic
solids. Viscoelasticity makes the materials’ response to stress-strain behavior time dependent and their deformation partially reversible. Polymer melts are further defined
as non-Newtonian fluids: their viscosity is not constant, thus the relationship between deformation rate and stress is not linear. The reasons for non-Newtonian behavior can
be found in the molecular structure: Polymers consist of long molecules that entangle
with each other, forming several flexible, reversible “joints”. These enable different
conformations of the molecules by rotation along the backbone and cause the elastic behavior of polymer melts. The chains can also move with respect to each other by
crawling kind of movement called reptation. These rotation and reptation occurring
above the glass transition temperature of the polymer are called Brownian motions, and they tend to return the molecules towards the equilibrium, i.e., to the energetically most
preferable state, after being oriented by applying deforming stress. This will not,

8/12/2019 Rheological Characterization of Polymer Melts in Shear and Extension
http://slidepdf.com/reader/full/rheological-characterization-of-polymer-melts-in-shear-and-extension 17/67
however, occur immediately after removing the stress but within certain relaxation
time, dependent on the molecular characteristics of the polymer1From the polymer processing point of view, among all non-Newtonian phenomena
the most important one for polymer melts is their common shear thinning characteristic , which means that their viscosity decreases as function of shear rate. This occurs due to
orientation and disentanglement of the entangled macromolecules in the melt when certain critical shear rate (limit of the linear viscoelasticity; change from the zero-shear
viscosity to shear thinning behavior) is exceeded. Shear thinning is actually the property
that ultimately enables many of the melt processing techniques of polymers1
2.1.1 Linear viscoelasticity and mechanical models
When very small deformation is applied to the polymer melt, or when the
deformation rate is very slow, the molecules have enough time to relax through the
Brownian motion and the polymer structure remains unaltered; the entangled and
coiled state of the molecules is not disturbed. The deformation is said to be in the linear
viscoelastic range For characterizing the inherent material properties in rheological experiments, it is essential that the measurements are done in the linear viscoelastic
range, i.e. the deformation is kept small enough. The relaxation of the molecules is described by relaxation modulus G According to the Boltzmann superposition principle,
in the linear viscoelastic region the response of material to series of step strains is
sum of the responses of the each step (total stress () is the sum of stresses generated
at each step from time to is the shear rate):
() = ( ) () (3)
The responses of viscoelastic materials to applied stress or strain can be modeled
with the aid of mechanical spring-dashpot analogies. The dashpot describes the viscous, and the spring the elastic response to the applied load or deformation. The dashpot
represents the time dependence and relates to the characteristic relaxation time of material, the time the molecule needs to return to the equilibrium state after
deformation1
The Maxwell model consists of dashpot and spring in series (Figure 1a) and is simplest model to describe the behavior of viscoelastic liquids. As can be figured from this setting, the dashpot allows for indefinite deformation; for viscoelastic fluid no
limiting cross-links exist, unlike in viscoelastic solids. The Maxwell model describes the
stress relaxation of polymer: decay of the stress at constant, pre-defined strain.
However, the one-element Maxwell model alone is not able to describe the stress relaxation behavior of true viscoelastic liquids, as they are always more complex
systems consisting of distribution of molecule chains lengths. The generalized Maxwell model (Figure 1b) consists of series of Maxwell elements, and gives closer-to-reality picture of the behavior of viscoelastic fluids, such as polymer melts above their glass
transition and melting temperatures. It describes the relaxation time spectrum of
polymer; each length of molecule has characteristic relaxation time and each element
represents one of them. The Kelvin model (also called the Kelvin-Voigt or Voigt model) combines one
dashpot and one spring in parallel (Figure 1c), modeling the behavior of viscoelastic
solids, such as cross-linked rubbers. This model describes the creep and creep recovery behavior; constant loading condition causes “creeping” time dependent strain deformation of the material. Similarly, the strain recovery after stress removal does
not occur instantaneously but depends on the material’s characteristic time. The Kelvin model allows for completely recoverable strain, thus it does not describe the creep
8/12/2019 Rheological Characterization of Polymer Melts in Shear and Extension
http://slidepdf.com/reader/full/rheological-characterization-of-polymer-melts-in-shear-and-extension 18/67
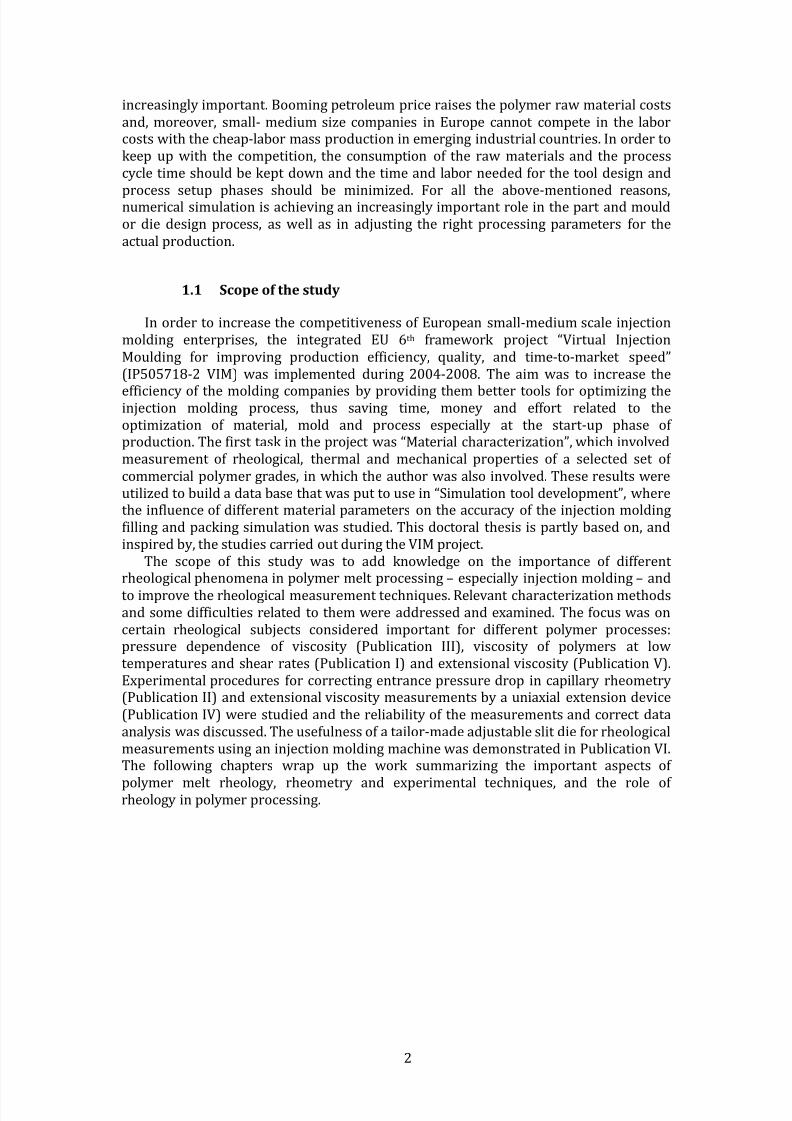
recovery behavior of molten thermoplastics correctly. For modeling the creep of
polymer melts, at least one dashpot element has to be added in series with the Kelvin model in order to model the non-recoverable portion of strain. In creep test constant
stress is applied to the sample, and the following deformation strain is recorded. When
the applied stress is removed, strain recovery is observed: The material returns partially
to the original, undeformed state2,3
Figure 1. Representation of the Maxwell model (a), the generalized Maxwell model (b), and
the Kelvin model (c)
The behavior of real polymer systems in creep or stress relaxation can be modeled using the different combinations of mechanical model analogies presented above,
nevertheless, they do not describe the structure of viscoelastic solids or liquids
physically, neither give quantitative information of viscoelasticity. Creep/creep recovery, stress relaxation, and small amplitude oscillatory shear (SAOS) experiments
are used to characterize the linear viscoelastic properties of polymers. SAOS involves dynamic load of the material at small pre-defined strain amplitude at changing frequency. In oscillatory shear the deformation is sinusoidal provided that the deformation is in the linear viscoelastic region and the viscoelasticity manifests itself
as phase lag between the applied stress and the strain (Figure 2). The phase lag
between stress and strain is expressed as the phase angle
Figure 2. Sinusoidal forms of stress and strain for viscoelastic substance.
2
3
2
3
2
1 2
1
Strain
Stress
S t r e s s ,
S t r a i n
(b) (a)
G
(c)
G
3 ... n
G1
G 2
G3
Gn
n

8/12/2019 Rheological Characterization of Polymer Melts in Shear and Extension
http://slidepdf.com/reader/full/rheological-characterization-of-polymer-melts-in-shear-and-extension 19/67
The strain function has the form
sin t (4)
strain amplitude and angular frequency. Correspondingly, the stress is
= sin( + ) (5)
Stress consists of in-phase ( and out-of-phase ( components, from which the first
one relates to the elastic and the latter one to the viscous part of the response to applied strain:
= + = sin + cos (6)
The out-of-phase component of the stress is in phase with the strain rate, which is the
time derivative of the small-amplitude strain:
= = cos (7)
where strain rate amplitude. The viscoelastic moduli: storage modulus G’ representing the elastic part i.e. the amount of energy stored in the material and the loss modulus G” representing the viscous part, i.e. the energy dissipated in the deformation
are:
= =
(8)
The relation between the viscoelastic moduli is called the loss factor:
tan =
(9)
The relation between the moduli and frequency can be expressed as magnitude of complex viscosity (from this point onwards simply ‘complex viscosity’) consisting of the
viscous and elastic parts:
|
| =
(
+
) =
+
=
||
(10)
8/12/2019 Rheological Characterization of Polymer Melts in Shear and Extension
http://slidepdf.com/reader/full/rheological-characterization-of-polymer-melts-in-shear-and-extension 20/67
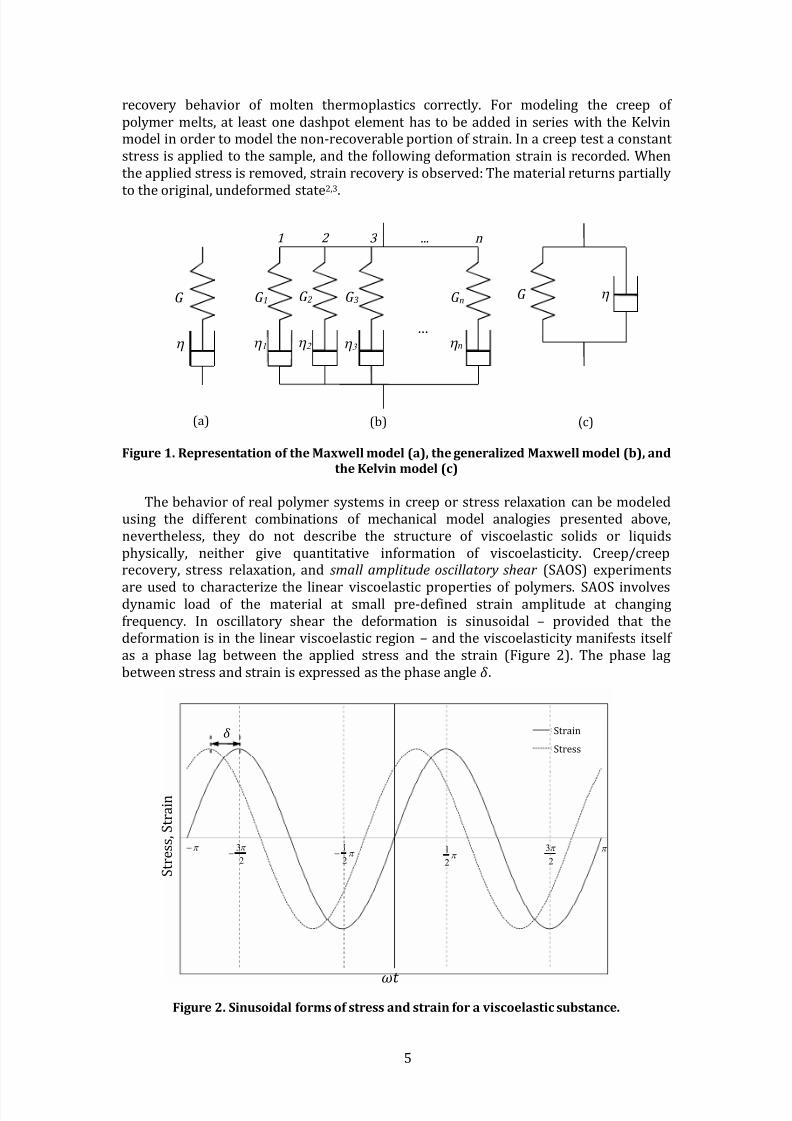
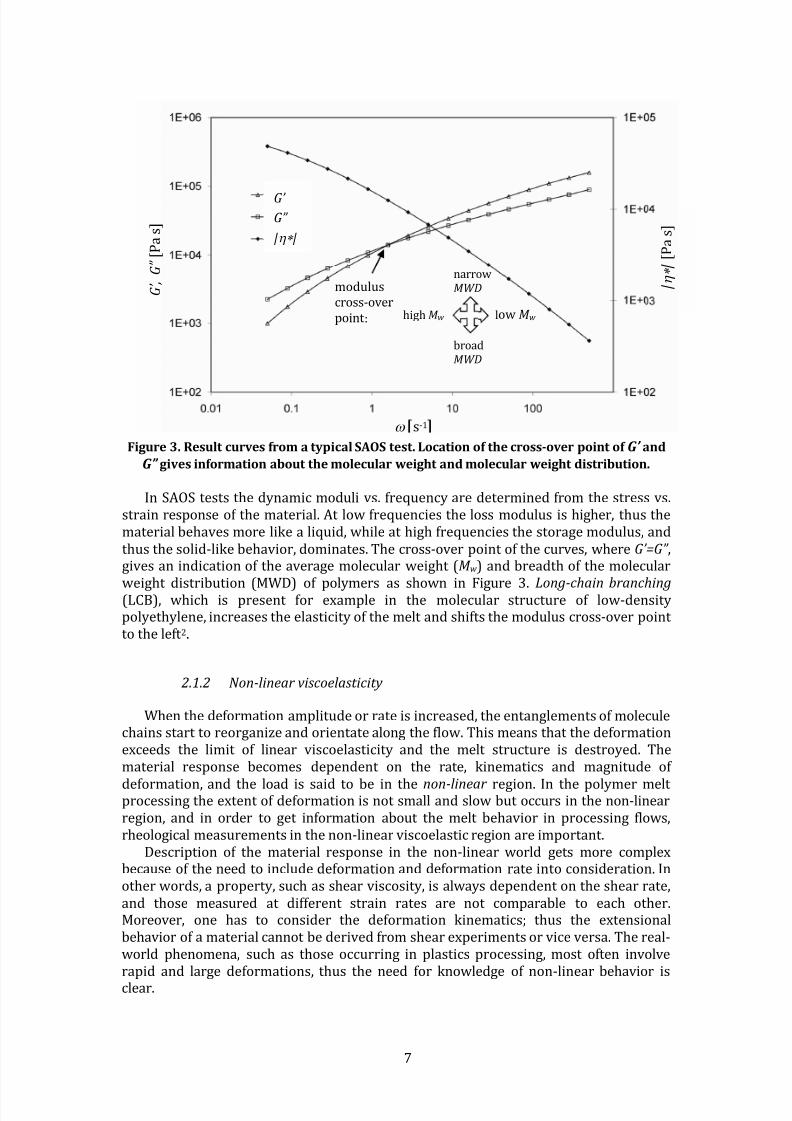
Figure 3. Result curves from typical SAOS test. Location of the cross-over point of G’ and G” gives information about the molecular weight and molecular weight distribution.
In SAOS tests the dynamic moduli vs. frequency are determined from the stress vs.
strain response of the material. At low frequencies the loss modulus is higher, thus the
material behaves more like liquid, while at high frequencies the storage modulus, and
thus the solid-like behavior, dominates. The cross-over point of the curves, where G’=G” gives an indication of the average molecular weight (M w and breadth of the molecular
weight distribution (MWD) of polymers as shown in Figure 3. Long-chain
branching (LCB), which is present for example in the molecular structure of low-density polyethylene, increases the elasticity of the melt and shifts the modulus cross-over point
to the left 2
2.1.2 Non-linear viscoelasticity
When the deformation amplitude or rate is increased, the entanglements of molecule chains start to reorganize and orientate along the flow. This means that the deformation
exceeds the limit of linear viscoelasticity and the melt structure is destroyed. The
material response becomes dependent on the rate, kinematics and magnitude of
deformation, and the load is said to be in the non-linear region. In the polymer melt processing the extent of deformation is not small and slow but occurs in the non-linear
region, and in order to get information about the melt behavior in processing flows,
rheological measurements in the non-linear viscoelastic region are important.
Description of the material response in the non-linear world gets more complex because of the need to include deformation and deformation rate into consideration. In
other words, property, such as shear viscosity, is always dependent on the shear rate,
and those measured at different strain rates are not comparable to each other. Moreover, one has to consider the deformation kinematics; thus the extensional
behavior of material cannot be derived from shear experiments or vice versa. The real-
world phenomena, such as those occurring in plastics processing, most often involve
rapid and large deformations, thus the need for knowledge of non-linear behavior is clear.
G ’ , G ” [ P a
s ]
G’ G”
|
modulus cross-over point :
narrow MWD
broad MWD
high M w low M w
| | [ P a
s ]
s-1

8/12/2019 Rheological Characterization of Polymer Melts in Shear and Extension
http://slidepdf.com/reader/full/rheological-characterization-of-polymer-melts-in-shear-and-extension 21/67
Newtonian fluid flow exhibits only stress component in the flow direction ( x 1 see
Figure on page 11), whereas in polymer melts also normal stresses, that is, stress components in the parallel directions (Figure 4, x 2 and x 3), are found due to the fluids’
viscoelastic nature. As polymer melts in normal cases are considered incompressible,
the normal stresses are isotropic, and do not cause any deformation. Therefore the
absolute normal stress values have no rheological significance. However, the difference between the normal stresses acting in different directions causes deformation and is
significant from the rheological point of view. For simple shear flow normal stresses are
thus expressed as normal stress differences: the difference between the 1st and 2nd
diagonal component (1st normal stress difference 1 and the difference between the 2nd
and 3rd diagonal component (2nd normal stress difference 2 in the tensor notation for the shear stress1
At the steady-state of start-up flow or creep flow the non-linear rheological
behavior of the polymer can be fully described with the aid of three viscometric functions that depend on shear rate; viscosity 1st normal stress coefficient and 2nd
normal stress coefficient
() = (11)
() = (12)
() = (13)
where and are the diagonal components of the stress tensor. () is
usually regarded as positive-signed, whereas () has an opposite sign and its
magnitude is only fraction of that for () Most commonly in determining the polymer properties for processing purposes, the quantity of major interest is the shear
viscosity as function of shear rate. In fact, the determination of normal stress differences is much more complicated than that of () and lot less is known about
them. However, the normal stress coefficients give important information about the
viscoelastic properties of the melt and are, together with other rheological measures,
significant in characterizing molecular structures: and () are both proportional to the molecular weight of the polymer1,2,3 Moreover, observing changes in normal stress
differences during the step-strain measurements by cone-plate and plate-plate
experiments gives indications about edge flow instabilities4 and has also been related to the instabilities occurring in extruding flows, for example in capillary rheometry5
2.1.3
Cox-Merz rule
An empirical rule found out by Cox and Merz6 creates link between the linear and
non-linear quantities. If the Cox-Merz rule is applicable, the complex viscosity from SAOS test and steady-shear viscosity can be combined so that
() = |()| when = (14)
Originally, the rule was found to hold for two different polystyrenes between dynamic
data and capillary rheometry data. In capillary rheometry, issues such as entrance
pressure drop and pressure effects can impair the compatibility of data, thus the
applicability of the rule depends on the polymer in question and must in unclear cases
be separately checked. The two before-mentioned factors naturally do not affect the

8/12/2019 Rheological Characterization of Polymer Melts in Shear and Extension
http://slidepdf.com/reader/full/rheological-characterization-of-polymer-melts-in-shear-and-extension 22/67
compatibility if dynamic data is combined with steady-shear data from rotational
rheometer. The advantage of applying the Cox-Merz rule is the smaller number of experiments
needed for characterization: both linear viscoelastic characteristics and non-linear flow
properties can be extracted from same measurements. Moreover, the maximum shear
rate range of the rotational rheometer is ‘extended’: in the steady step-shear mode the maximum rate due to arising edge fracture (see Chapter 3.1) is about 10 s-1 but in the
dynamic mode rheometers can typically be operated at up to 100 Hz, which corresponds
to an angular frequency of 628 s-1
2.1.4 Temperature dependence and time-temperature superposition
Polymer molecules constantly exhibit so called Brownian motion; they can move
past each other, rotate and reptate in large number of possible conformations due to
their length and flexibility. The Brownian motion of an individual chain is largely
inhibited by the other molecules surrounding it. This is also referred to as
entanglements of the chains, although the chains do not necessarily need to be looped together; the chains packed closely together in the melt just do not have space, thus they
are inhibiting each others’ motions2 When the temperature of the melt is increased, the Brownian motions of the chains augment and the free volume around the polymer chains
increases. Increased free volume means easier flow, and decreased viscosity7
The extent to which the viscoelastic properties are dependent on temperature is
traced back to the molecular structure of the polymer chains: The more complex the structure i.e. the more branches, large pendant groups, and ring structures it has the
stronger the effect of temperature on the viscosity, since the greater is then the relative
change in the free volume as function of temperature7. In order to make the polymer
melt to flow, the chain segments must have enough free space around them and there must be enough thermal energy to overcome the motion-inhibiting barriers, such as
rotation around covalent bonds1
If the viscoelastic functions of polymer measured at different temperatures can be
shifted by single shift factor to one, selected reference temperature to form master curve with good superposition, the material is thermo-rheologically simple meaning
that all the relaxation times have the same temperature dependence. Quantities
including stress component, such as the storage and loss moduli, are shifted by multiplying with vertical shift factor and the quantities including time, such as
frequency or shear rate, with horizontal shift factor This procedure is called the time-temperature superposition (TTS). If TTS is valid and shift factors can be used to create
master curve from linear viscoelastic data, the same shift factors should in principle be also applicable for shifting non-linear data, e.g. viscosity as function of shear rate.
When the quantity to be shifted includes both time and stress, like viscosity does, both horizontal and vertical shift factors should be applied: the viscosity is shifted by
multiplying with the factor / to yield the ‘reduced’ viscosity
= ( ,) (15)
and the reduced shear rate is obtained by shifting with
= (16)
The vertical shift factor is given as
= (17)
8/12/2019 Rheological Characterization of Polymer Melts in Shear and Extension
http://slidepdf.com/reader/full/rheological-characterization-of-polymer-melts-in-shear-and-extension 23/67
10
with temperature and density, and and respectively are the reference
temperature and pressure. However, the vertical shift factor is relatively insensitive
to temperature, and often taken to be unity. Then the viscosity can be shifted by the
horizontal shift factor only, and has the form
= ( ,) (18)
The horizontal temperature shift factor at + 100 can be described
according to Williams, Landel and Ferry (the WLF equation)8 as
log = ()() (19)
with and as fitting parameters. When = these parameters have been
observed to have universal constant values
17.44 and
51.6 K, based on fitting
on large number of polymers. The more accurate approximation with WLF equation was found when was not treated as fixed parameter but allowed to be adjusted
being ~50 above the glass transition temperature. This was accomplished with the constants 8.86 and 101.6 K8 At temperatures higher than + 100 the free
volume is no longer limiting factor, but the energy barriers resisting the flow become
significant. Then the temperature dependence is better expressed by the Arrhenius equation7
= (20)
where E is the activation energy of flow and ideal gas constant 8.314 J/mol·K. The activation energy of flow gives an indication about the molecular structure and chain
branching9 typically polymers with LCB structures have higher than the linear ones.
The master curve presentation is sometimes used even when material shows thermo-rheological complexity. In such cases no information about the molecular
features of the polymer can be achieved from the master curves, however, they show the
general trend of rheological behavior over wide range of deformation10
2.1.5 Pressure dependence
Generally fluids, such as polymer melts, are considered incompressible.
Nevertheless, at high hydrostatic pressures that can occur in melt processing, they do exhibit some compressibility. Therefore pressure also has an effect on viscosity, albeit
not nearly as strong as temperature. The pressure dependence of viscosity of polymer melts has practical significance in high-pressure processes, such as injection molding,
where pressure frequently exceeds 100 MPa. In an analogous manner to the
temperature dependence, viscosity as function of pressure obeys exponential
behavior, but with an inverse effect: the free volume between the molecules decreases when the pressure increases, and thus the Brownian motions of the chains are more
inhibited. Therefore an increase in pressure also increases viscosity. common way to
describe the pressure effect on viscosity is to use the Barus equation
,
=
,
(21)
8/12/2019 Rheological Characterization of Polymer Melts in Shear and Extension
http://slidepdf.com/reader/full/rheological-characterization-of-polymer-melts-in-shear-and-extension 24/67
11
where and , zero-shear viscosity at normal (atmospheric) pressure, pressure
and material-characteristic pressure coefficient. The pressure shift factor is thus
= (22)
In the vicinity of the the effect of pressure, as also the effect of temperature, is larger than at higher temperatures11 Pressure induced crystallization can also occur at
elevated pressures, causing solidification above the of atmospheric pressure, and this
naturally causes strong increase in melt viscosity1According to Cogswell12 the pressure dependence can be expressed in terms of
equivalent change in temperature as pressure-temperature coefficient ( dT/ d p) which
has an average value of -5 10-7 K/Pa meaning that an increase of pressure by 100 MPa would correspond to decrease of temperature by 50 K. The exact value of the
coefficient varies depending on the polymer in question in the same way as for the
temperature dependence.
2.2 Viscometric Flows
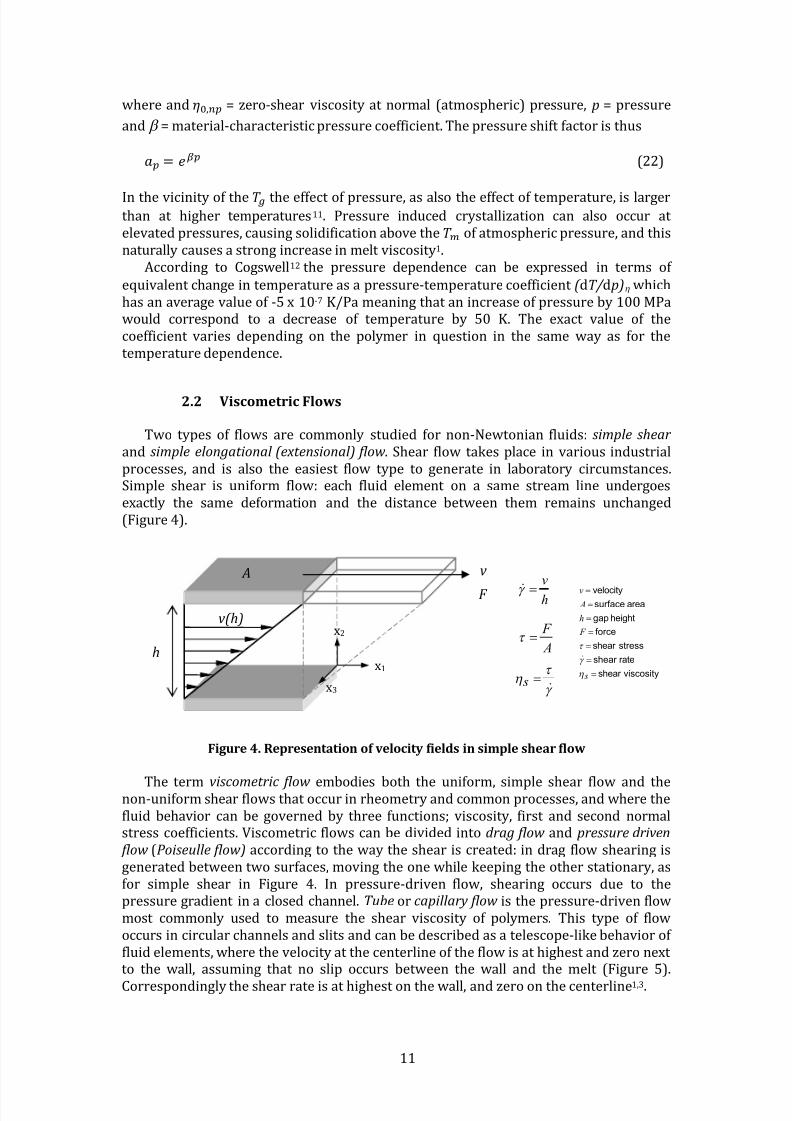
Two types of flows are commonly studied for non-Newtonian fluids: simple shear and simple elongational (extensional) flow Shear flow takes place in various industrial
processes, and is also the easiest flow type to generate in laboratory circumstances. Simple shear is uniform flow: each fluid element on same stream line undergoes
exactly the same deformation and the distance between them remains unchanged
(Figure 4).
Figure 4. Representation of velocity fields in simple shear flow
The term viscometric flow embodies both the uniform, simple shear flow and the non-uniform shear flows that occur in rheometry and common processes, and where the
fluid behavior can be governed by three functions; viscosity, first and second normal stress coefficients. Viscometric flows can be divided into drag flow and pressure driven flow (Poiseulle flow) according to the way the shear is created: in drag flow shearing is
generated between two surfaces, moving the one while keeping the other stationary, as
for simple shear in Figure 4. In pressure-driven flow, shearing occurs due to the pressure gradient in closed channel. Tube or capillary flow is the pressure-driven flow
most commonly used to measure the shear viscosity of polymers. This type of flow
occurs in circular channels and slits and can be described as telescope-like behavior of
fluid elements, where the velocity at the centerline of the flow is at highest and zero next to the wall, assuming that no slip occurs between the wall and the melt (Figure 5).
Correspondingly the shear rate is at highest on the wall, and zero on the centerline1,3
v
F
v(h)
h
A
A
F
h
v
s
viscosityshear
rateshear
stressshear
force
heightgap
areasurfacevelocity
s
F
h
A
v
x3
x1
x2

8/12/2019 Rheological Characterization of Polymer Melts in Shear and Extension
http://slidepdf.com/reader/full/rheological-characterization-of-polymer-melts-in-shear-and-extension 25/67
12
Figure 5. Representation of velocity fields in pressure-driven tube and slit flow.
2.3 Extensional Flows
Besides shear flow, melt can experience extensional (or elongational) flow during processing. This means that the material undergoes stretching along the streamlines as
consequence of extensional deformation and the distance between particles on the same streamline changes. The simplest extensional flow type is uniaxial extension:
stretching of the material in one direction causes compression in the other two directions. In biaxial extension the velocity profile is the same as for uniaxial flow, but
the extension rate is always negative (compression), whereas for uniaxial flow it is
always positive (tension). In planar extension one dimension of the material is extended while the second one is maintained constant and the third one compressed (Figure 6)1,2
Figure 6. Uniaxial, planar, and biaxial extension and their velocity distributions
Typical curves of start-up test in uniaxial extension are given in Figure 7. Trouton’s
rule links shear and extensional properties together: in the linear region the curve
should obey the linear viscoelastic envelope (LVE), which in uniaxial extension is three
times the start-up shear viscosity when the shear rate is within the Newtonian flow
region and viscosity thus independent of shear rate (Equation 23). In biaxial extension
the multiplication factor is (Equation 24), and in the planar case in the x 1 direction
and in the x 2 direction (Equation 25).
uniaxial
33
22
11
)(½
)(½
)(
xt v
xt v
xt v
33
2
11
)(
0
)(
xt v
v
xt v
33
22
11
)(
)(½
)(½
xt v
xt v
xt v
planar
biaxial
x 2
x 1
x 3
R
h
w
8/12/2019 Rheological Characterization of Polymer Melts in Shear and Extension
http://slidepdf.com/reader/full/rheological-characterization-of-polymer-melts-in-shear-and-extension 26/67
13
lim |(, )| = 3(, 0) (23)
lim |(, )| = 6(, 0) (24)
lim
|
(
,
)| = 4
(
,
0)
lim | (, )| = 2(, 0) (25)
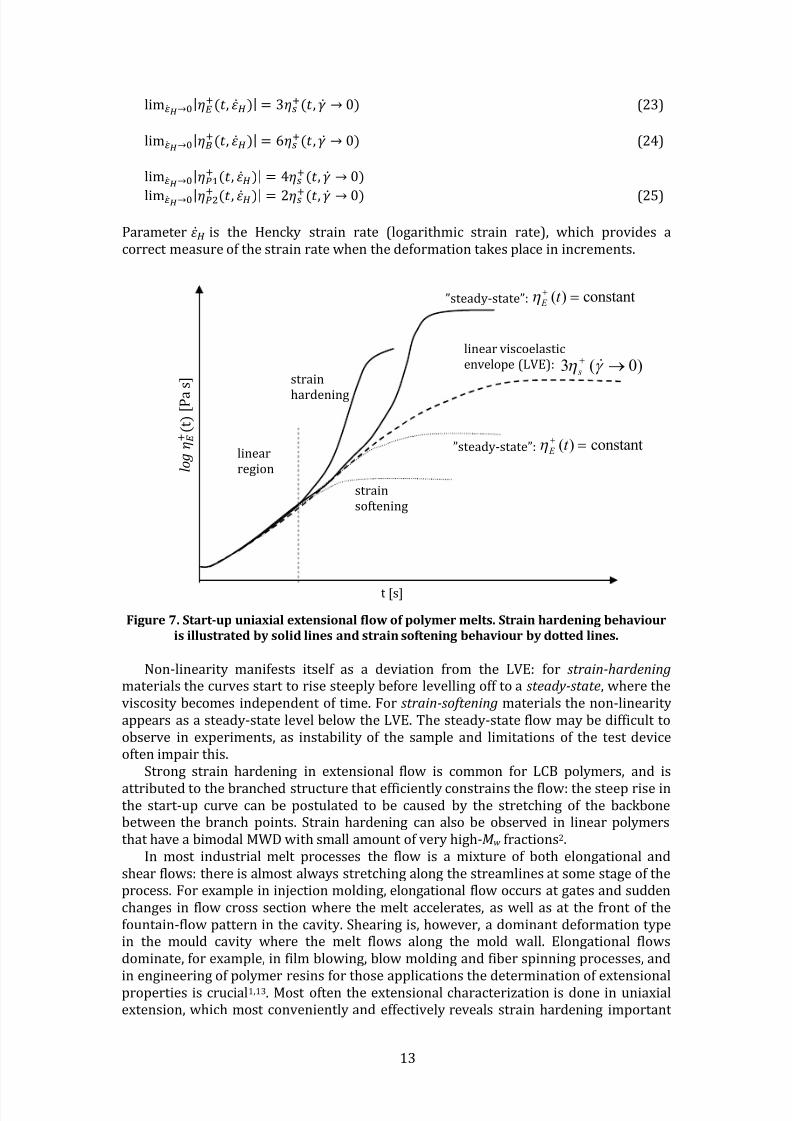
Parameter is the Hencky strain rate (logarithmic strain rate), which provides
correct measure of the strain rate when the deformation takes place in increments.
Figure 7. Start-up uniaxial extensional flow of polymer melts. Strain hardening behaviour
is illustrated by solid lines and strain softening behaviour by dotted lines.
Non-linearity manifests itself as deviation from the LVE: for strain-hardening materials the curves start to rise steeply before levelling off to steady-state where the
viscosity becomes independent of time. For strain-softening materials the non-linearity
appears as steady-state level below the LVE. The steady-state flow may be difficult to
observe in experiments, as instability of the sample and limitations of the test device often impair this.
Strong strain hardening in extensional flow is common for LCB polymers, and is
attributed to the branched structure that efficiently constrains the flow: the steep rise in the start-up curve can be postulated to be caused by the stretching of the backbone between the branch points. Strain hardening can also be observed in linear polymers
that have bimodal MWD with small amount of very high-M w fractions2
In most industrial melt processes the flow is mixture of both elongational and
shear flows: there is almost always stretching along the streamlines at some stage of the process. For example in injection molding, elongational flow occurs at gates and sudden
changes in flow cross section where the melt accelerates, as well as at the front of the
fountain-flow pattern in the cavity. Shearing is, however, dominant deformation type in the mould cavity where the melt flows along the mold wall. Elongational flows
dominate, for example, in film blowing, blow molding and fiber spinning processes, and
in engineering of polymer resins for those applications the determination of extensional properties is crucial1,13 Most often the extensional characterization is done in uniaxial extension, which most conveniently and effectively reveals strain hardening important
linear region
)0(3 s
strain
hardening
t [s]
strain softening
constant)( t
E ”steady-state”:
constant)( t
E ”steady-state”:
l o g
( t )
[ P a
s ]
linear viscoelastic envelope (LVE):

8/12/2019 Rheological Characterization of Polymer Melts in Shear and Extension
http://slidepdf.com/reader/full/rheological-characterization-of-polymer-melts-in-shear-and-extension 27/67

8/12/2019 Rheological Characterization of Polymer Melts in Shear and Extension
http://slidepdf.com/reader/full/rheological-characterization-of-polymer-melts-in-shear-and-extension 28/67
15
Figure 9. Typical shear viscosity curve for shear-thinning polymer melt
Power-Law –model (also: Ostwald de Waele model) is the simplest viscosity model
requiring two fitting parameters: and
() = (26)
1 is the slope of log vs. log thus for Newtonian materials 1, for shear-
thinning material 1, and for shear-thickening materials 1. K relates to the magnitude of the viscosity being the vertical axis intercept on the log viscosity vs. log
shear rate plot. The model is capable of describing either only Newtonian flow, or shear
thinning (or shear thickening), and is thus of less use for polymer melts that show Newtonian plateau at low shear rates and shear thinning at high shear rates. The Cross model is capable of describing Newtonian viscosity, shear-thinning viscosity, and also
the transition area between them
() = ( ) (27)
with fitting parameters: zero-shear viscosity, power-law coefficient, and
characteristic time. For certain polymers better fit at the transition area is achieved by
the Carreau model
() = [1 + ()] (28)
Factor in the exponents of the model makes the shift from zero-shear viscosity to
Power-law area sharper. This model therefore describes best the viscosity function of narrow MWD polymers. The Carreau-Yasuda model has one freely adjustable parameter more than the Cross and Carreau models, thus it is able to describe more gradual
transition from Newtonian plateau to the shear-thinning region,
() = [1 + ()]
(29)
therefore allowing good fit also for polymers with broader MWD (long chain branched polymers). The Cross and Carreau models are actually only variations of the Carreau-Yasuda model, both having fixed parameter for the curvature of the transient region
=
l o g
[ P a
s ]
log [s-1
shear-thinning region: defines the slope transition region: defines the shape
and the horizontal position
zero-shear viscosity (1st Newtonian plateau)

8/12/2019 Rheological Characterization of Polymer Melts in Shear and Extension
http://slidepdf.com/reader/full/rheological-characterization-of-polymer-melts-in-shear-and-extension 29/67
16
from Newtonian to shear-thinning behavior. For Cross model = making the
curvature dependent on the shear-thinning of viscosity, and for Carreau model =2. The latter offers the least flexibility of these three models, and the fitting suits well only for
polymers with sharp transition area, i.e. for polymers with relatively narrow MWD3,14
Temperature and pressure effects can be included in the fitting using coefficient
based either on the Arrhenius or WLF equation for temperature, and the Barus equation for pressure. Acknowledging both the temperature and pressure effect in the viscosity
fitting is done by multiplying the individual shift factors and and including the
total shift factor in the viscosity model, as for example here in the Carreau-Yasuda
fitting:
() = , 1 + (,) (30)
The viscosity models presented here are extensions of Newtonian constitutive
equation (Equation 2) for viscous fluid flow. Unlike the Newtonian equation, they can also model the shear rate dependence of viscosity and are therefore called constitutive
equations for generalized Newtonian fluids (GNF). Viscoelasticity, and thus for example the normal stress differences, cannot be described by GNF models3

8/12/2019 Rheological Characterization of Polymer Melts in Shear and Extension
http://slidepdf.com/reader/full/rheological-characterization-of-polymer-melts-in-shear-and-extension 30/67
17
3 RHEOMETRY AND GOOD MEASUREMENT PRACTICE
Devices for shear rheology measurements can be roughly divided into drag-flow and
pressure-flow based. Extensional properties can be measured using devices operating
either in uniaxial, planar, or biaxial extension. Several types of devices for both shear
and extensional flow exist, and only the ones used within this study are introduced in the following sections.
3.1 Cone-plate and parallel-plate rheometry
Drag flow can be generated, for example, by parallel-plate (plate-plate) or cone-plate geometries connected with rotational rheometers, which are commonly used for
measuring the viscometric and viscoelastic functions of polymer melts. Drag flow
between two rotating or oscillating plates is often called torsion flow due to the
kinematics of the system. In the strain-rate controlled mode the deformation rate is set and the resulting torque recorded, and in the stress-controlled mode the torque is pre-set value and the deformation is the measured quantity. Many rheometers are able to
operate in both modes whereas some are limited to either stress or strain control. Only very small sample amount is needed, and the tests can be run in either step-strain mode (shear rate profile from low to high rates or vice versa) or oscillatory (dynamic) mode.
Rotational rheometers typically have very accurate temperature control in isothermal
tests (convection oven used at 200 °C) and high torque resolution. The limitation of
the function is usually set by the maximum deformation rates and stresses: flow instabilities, such as edge fracture (breakage of the sample layer between the plates)
start to occur when the stress and strain become too high. Often the maximum shear
rate in strain-rate controlled rheometers is less than 10 s-1 but it varies by polymer depending also on the viscoelasticity of the sample5 and the gap at the rim (thus in case
of cone-plate configuration, on the cone angle)15 The maximum measurable torque is
commonly ~200 mNm which limits experimentation on high-viscous materials such as
cross-linking rubbers or any polymer melt at very low temperature. The parallel-plate and cone-plate geometries are illustrated in Figure 10.
8/12/2019 Rheological Characterization of Polymer Melts in Shear and Extension
http://slidepdf.com/reader/full/rheological-characterization-of-polymer-melts-in-shear-and-extension 31/67
18
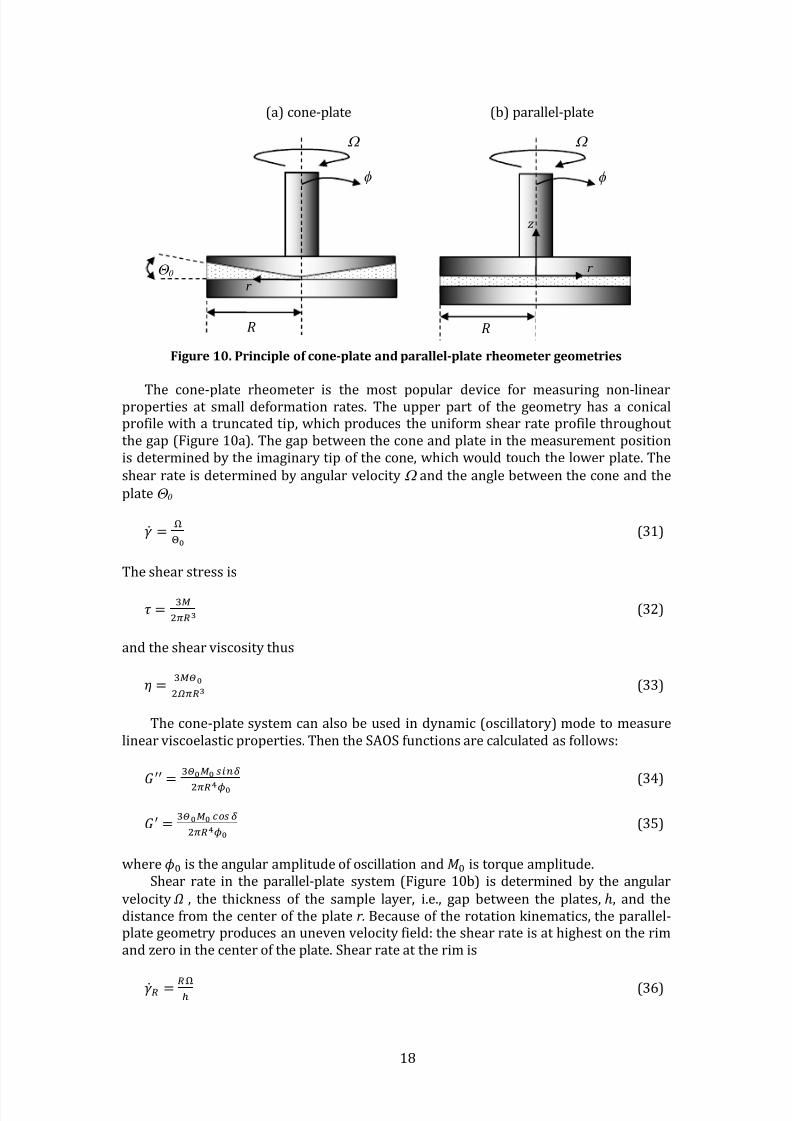
Figure 10. Principle of cone-plate and parallel-plate rheometer geometries
The cone-plate rheometer is the most popular device for measuring non-linear properties at small deformation rates. The upper part of the geometry has conical profile with truncated tip, which produces the uniform shear rate profile throughout
the gap (Figure 10a). The gap between the cone and plate in the measurement position
is determined by the imaginary tip of the cone, which would touch the lower plate. The
shear rate is determined by angular velocity and the angle between the cone and the
plate
= (31)
The shear stress is
= (32)
and the shear viscosity thus
= (33)
The cone-plate system can also be used in dynamic (oscillatory) mode to measure
linear viscoelastic properties. Then the SAOS functions are calculated as follows:
= (34)
= (35)
where is the angular amplitude of oscillation and is torque amplitude.
Shear rate in the parallel-plate system (Figure 10b) is determined by the angular
velocity the thickness of the sample layer, i.e., gap between the plates, and the
distance from the center of the plate r. Because of the rotation kinematics, the parallel-plate geometry produces an uneven velocity field: the shear rate is at highest on the rim
and zero in the center of the plate. Shear rate at the rim is
= (36)
R
(b) parallel-plate
r
(a cone-plate
8/12/2019 Rheological Characterization of Polymer Melts in Shear and Extension
http://slidepdf.com/reader/full/rheological-characterization-of-polymer-melts-in-shear-and-extension 32/67
19
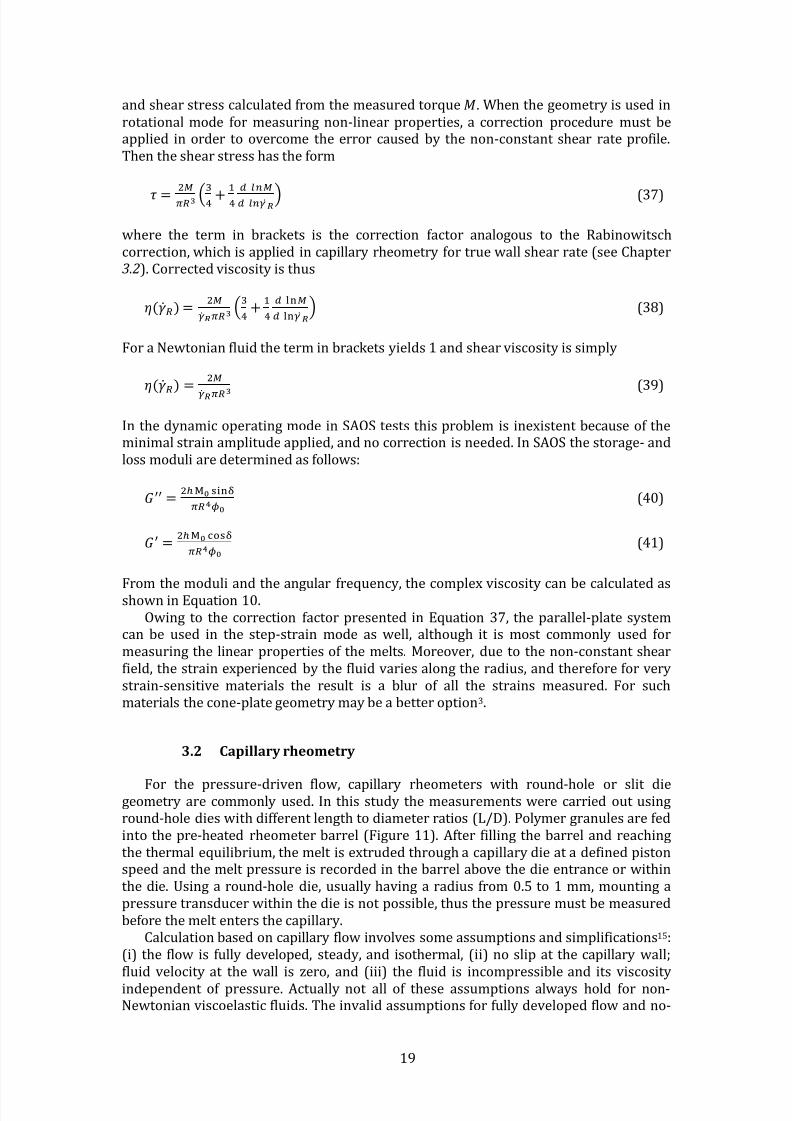
and shear stress calculated from the measured torque When the geometry is used in
rotational mode for measuring non-linear properties, correction procedure must be applied in order to overcome the error caused by the non-constant shear rate profile.
Then the shear stress has the form
= + (37)
where the term in brackets is the correction factor analogous to the Rabinowitsch
correction, which is applied in capillary rheometry for true wall shear rate (see Chapter 3.2). Corrected viscosity is thus
() = +
(38)
For Newtonian fluid the term in brackets yields and shear viscosity is simply
() =
(39)
In the dynamic operating mode in SAOS tests this problem is inexistent because of the minimal strain amplitude applied, and no correction is needed. In SAOS the storage- and
loss moduli are determined as follows:
= (40)
= (41)
From the moduli and the angular frequency, the complex viscosity can be calculated as shown in Equation 10.
Owing to the correction factor presented in Equation 37, the parallel-plate system can be used in the step-strain mode as well, although it is most commonly used for
measuring the linear properties of the melts. Moreover, due to the non-constant shear
field, the strain experienced by the fluid varies along the radius, and therefore for very
strain-sensitive materials the result is blur of all the strains measured. For such materials the cone-plate geometry may be better option3
3.2 Capillary rheometry
For the pressure-driven flow, capillary rheometers with round-hole or slit die geometry are commonly used. In this study the measurements were carried out using round-hole dies with different length to diameter ratios (L/D). Polymer granules are fed
into the pre-heated rheometer barrel (Figure 11). After filling the barrel and reaching
the thermal equilibrium, the melt is extruded through capillary die at defined piston speed and the melt pressure is recorded in the barrel above the die entrance or within
the die. Using round-hole die, usually having radius from 0.5 to mm, mounting
pressure transducer within the die is not possible, thus the pressure must be measured
before the melt enters the capillary. Calculation based on capillary flow involves some assumptions and simplifications15
(i) the flow is fully developed, steady, and isothermal, (ii) no slip at the capillary wall;
fluid velocity at the wall is zero, and (iii) the fluid is incompressible and its viscosity
independent of pressure. Actually not all of these assumptions always hold for non-Newtonian viscoelastic fluids. The invalid assumptions for fully developed flow and no-
8/12/2019 Rheological Characterization of Polymer Melts in Shear and Extension
http://slidepdf.com/reader/full/rheological-characterization-of-polymer-melts-in-shear-and-extension 33/67
20
slip at the capillary wall are handled by different corrections as will be discussed briefly
in this chapter3
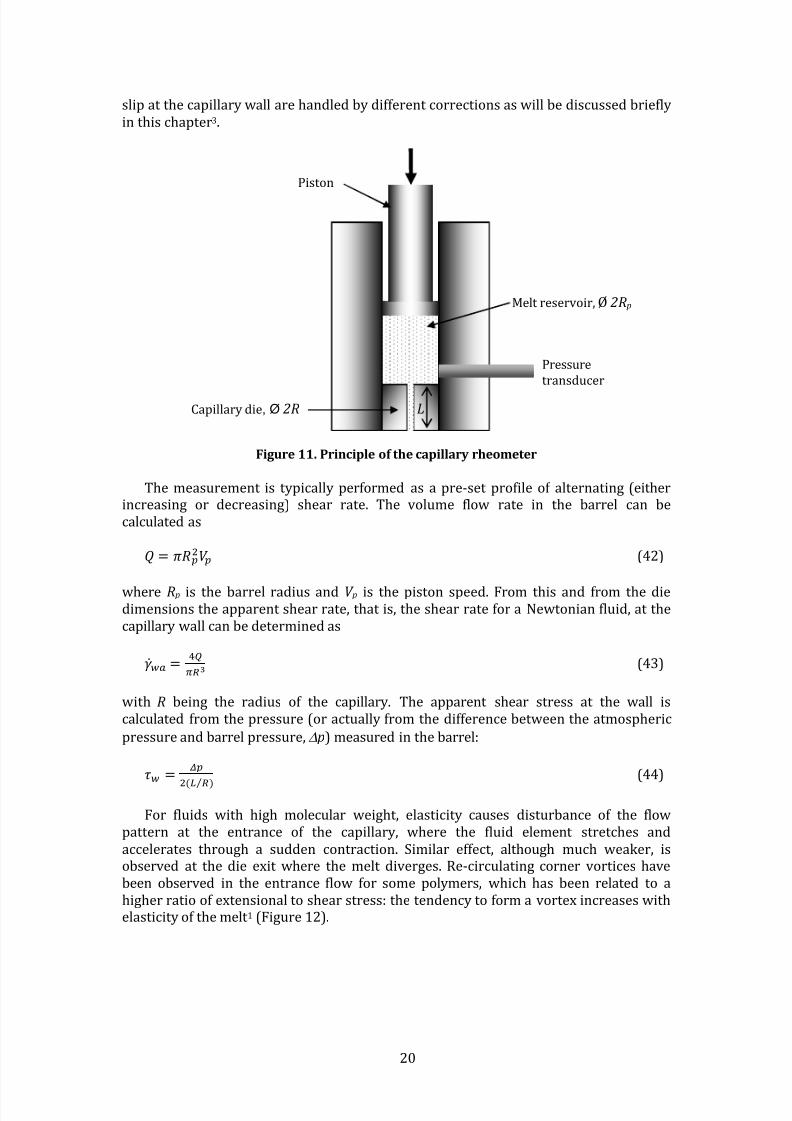
Figure 11. Principle of the capillary rheometer
The measurement is typically performed as pre-set profile of alternating (either increasing or decreasing) shear rate. The volume flow rate in the barrel can be
calculated as
= (42)
where R p is the barrel radius and V p is the piston speed. From this and from the die dimensions the apparent shear rate, that is, the shear rate for Newtonian fluid, at the
capillary wall can be determined as
= (43)
with R being the radius of the capillary. The apparent shear stress at the wall is
calculated from the pressure (or actually from the difference between the atmospheric
pressure and barrel pressure, p measured in the barrel:
=
( )
(44)
For fluids with high molecular weight, elasticity causes disturbance of the flow pattern at the entrance of the capillary, where the fluid element stretches and
accelerates through sudden contraction. Similar effect, although much weaker, is observed at the die exit where the melt diverges. Re-circulating corner vortices have
been observed in the entrance flow for some polymers, which has been related to
higher ratio of extensional to shear stress: the tendency to form vortex increases with elasticity of the melt 1 (Figure 12).
Melt reservoir, 2R p
Piston
Pressure transducer
Capillary die, Ø 2R L

8/12/2019 Rheological Characterization of Polymer Melts in Shear and Extension
http://slidepdf.com/reader/full/rheological-characterization-of-polymer-melts-in-shear-and-extension 34/67
21
Figure 12. Melt stream lines in entrance flow at contraction for linear polymer (HDPE)
and branched polymer (LDPE)16
Calculation in the capillary rheometry assumes fully developed flow along the
entire capillary length, thus omitting the end effects will lead to slightly overestimated
pressure drop across the capillary. For achieving the true shear rate at the wall, the extra pressure drop, arising at the entrance of the capillary die must be included in
the calculation. The additional exit pressure drop at the capillary downstream is comparatively small and usually ignored. Correction is conventionally done through Bagley correction procedure17 The measurements are repeated using at least three
capillaries with the same diameter and different length. The Linear regression on the
measured pressure vs. capillary L/D ratio plot is used to find the intersection on the
pressure axis, which represents the pressure drop at the zero distance from the entrance, (Figure 13)
Figure 13. An example of Bagley plot with die length to diameter ratios 10, 20 and 30 at
one measured shear rate.
For true wall shear stress the entrance pressure drop is subtracted from the total
pressure drop across the capillary:
=
) (45)
shortcut option for determining the entrance pressure drop is the use of an orifice
die with nominal length of zero. This procedure is discussed in detail and compared to
the Bagley correction in Publication II.
Capillary L/D
P r e s s u r e
20 30 10
pe

8/12/2019 Rheological Characterization of Polymer Melts in Shear and Extension
http://slidepdf.com/reader/full/rheological-characterization-of-polymer-melts-in-shear-and-extension 35/67
22
Newtonian, parabolic velocity profile in the capillary is assumed, although due to
the shear thinning nature of polymer melts the profile is non-parabolic, resembling more plug: the velocity is at highest in the centerline and zero at the wall, when the no-slip condition is valid. Thus the shear rate at the wall is at highest. The shape of the
profile is defined by the power-law index
the smaller its value, the more the profile
deviates from parabolic. Shear rate at the wall can be calculated using procedure known as the Rabinowitsch or Weissenberg-Rabinowitsch correction:
= (46)
The local power-law index at each shear rate for any fluid is obtained by numerical
derivation as slope of the apparent shear rate vs. wall shear stress on double
logarithmic plot:
= (47)
The most straightforward way of performing the Rabinowitsch correction for experimental data is through polynomial fitting on log vs. log Differentiation of
the polynomial equation in terms of each log gives the local power law index for each measured shear rate. For power-law fluids the slope of the polynomial fitting curve
remains constant, thus = Viscosity corrected for both entrance pressure drop and the non-Newtonian flow profile is then
= =
()[() ] (48)
Correction for the entrance pressure drop and plug-like flow in pressure-driven
contraction flow are well-known procedures in capillary rheometry. Nevertheless, their
significance is sometimes overlooked and the data handling phase skipped. This can
perhaps be justified for quality-control purposes where the only goal is to ensure the consistence of polymer grade between different polymerization batches, and the
control is done comparing the test results obtained for different batches always using an
identical test procedure. When the aim is to examine the true rheological behavior of
polymers and the reflections of molecule-level properties, such as chain architecture or molecular weight distribution to the rheology, it becomes extremely important to follow
careful experimental procedures minimizing the influence of all external factors, and
also to perform all the possible corrections that eliminate the errors caused by the above
discussed assumptions. This is equally important when measured data is used for process simulation purposes: the models for flow simulation give good predictions only
if the measured data used to form the data bank for each material is exact and correct. The general no-slip assumption of classical fluid mechanics dictates that the melt
adheres to the capillary or slit wall. However, for some polymers, when critical shear stress is exceeded, the melt starts to slip along the wall, thus the fluid velocity at the
capillary wall is nonzero and the true shear rate smaller than in no-slip case. The wall
slip can be determined by performing parallel measurements with dies having different diameter but the same length-to-diameter (or radius) ratio: if the plot of
apparent shear rate vs. 1/R at constant wall shear stress gives horizontal line, no slip
occurs. If the curve is linear with positive slope, slip occurs, and the slip velocity at the
wall can be calculated from the slope, according to the procedure proposed by Mooney18
Entrance pressure drop in capillary rheometer with either round-hole or slit die can
be used to evaluate the extensional viscosity. Contraction flow analysis method is based
on the assumption, that the pressure drops due to shear and extensional deformation

8/12/2019 Rheological Characterization of Polymer Melts in Shear and Extension
http://slidepdf.com/reader/full/rheological-characterization-of-polymer-melts-in-shear-and-extension 36/67
23
can be calculated separately and their sum is the total pressure drop. Additionally the
general assumptions of capillary rheometry are applied in the contraction flow analysis as well. Cogswell19 and Binding20 analyses are the most popular techniques for
estimating the extensional viscosity from the capillary rheometry data. The first one is
discussed in more detail and compared to extensional viscosity in uniaxial extension in
Publication IV.
3.3 Slit rheometry
Instead of round-hole capillary, wide slit can also be mounted on
capillary rheometer to measure rheological properties in pressure-driven flow (Figure
14). The calculation presumes that the slit is infinitely wide, which in practice can be assumed with good accuracy when 10 When this is the case, the effect of the
edges can be ignored. The main advantage of slit die is its flat wall geometry that
enables measurement of pressure directly in the slit where the flow is fully developed,
thus making exact determination of pressure profile possible. For this reason, the
correction of the entrance pressure drop is unnecessary. Slit dies are, however, more difficult to assemble and to disassemble. In addition, cleaning of the slit edges requires
more effort: possible remnants of burned or charred melt at the edges can reduce the die dimensions and thus cause computational error21 Another source of error possibly
occurring with slit die is the so called hole-pressure error, related to the normal forces
present in the flow of viscoelastic fluids over discontinuity of the pressure transducer
bore. Slit constructions and hole pressure error can also be used for determining the normal stress differences by means of transverse pressure transducer: the hole-
pressure error can roughly be approximated to be one third of the first normal stress
difference for shear-thinning fluids22
Figure 14. An illustrational drawing of slit die rheometer
Shear stress on the slit wall is
=
(49)
where 2 = 3 if the pressure profile is linear, that is, if neither pressure dependent viscosity nor viscous heating cause any curvature to the pressure
piston
w
h
p1 p2 p3
pressure transducers
slit
rheometer barrel
L
band heater
l l

8/12/2019 Rheological Characterization of Polymer Melts in Shear and Extension
http://slidepdf.com/reader/full/rheological-characterization-of-polymer-melts-in-shear-and-extension 37/67
24
profile across the slit. In capillary geometry these possible non-linearities can be
observed as an upward (pressure dependence) or downward (viscous heating) curvature of the Bagley plot for end corrections22,23 The shear rate for Newtonian fluid
(apparent shear rate) in rectangular slit is
= (50)
For shear-thinning polymers the correction for the non-parabolic velocity profile must be performed analogously to the Rabinowitsch correction for capillary die calculations:
= (51)
where
= (52)
Shear viscosity at the slit wall is then
= =
[() ] (53)
simpler, yet reasonably accurate alternative for accounting for the non-Newtonian velocity profile has been proposed by Schümmer and co-workers24,25 and developed
further by Giesekus and Langer26 This procedure is based on estimating the shear rate and viscosity at radial distance (for circular geometry) or vertical distance from the
flow slit center (for rectangular slit), where the apparent shear rate equals the true
shear rate. Hence, considering that under fully developed conditions the apparent shear rate, as well as the shear stress, varies linearly with radial position, one obtains
() = () (54)
Factor = / for circular capillary, where = radius of the die, and for slit
geometry = 2 where is the slit height 26 Apparently, when = 0.36 1. 2
varies by only small amount, so that representative value of may be chosen for most materials with very little loss in accuracy. For rectangular slit this approximation is
given as1
= /() 0.79 (55)
and for circular capillary as
= /() 0.83 (56)

8/12/2019 Rheological Characterization of Polymer Melts in Shear and Extension
http://slidepdf.com/reader/full/rheological-characterization-of-polymer-melts-in-shear-and-extension 38/67
25
The Schümmer approximation is valid for true shear stress It shifts data only
horizontally (to the left) and can be applied to single points.
3.4 Rheological measurements with polymer processing machines
In order to achieve data at high shear rates relevant for injection molding,
performing rheological measurement using capillary or slit die connected to an
injection molding machine is an attractive option. This way the measurable melt experiences similar thermal and shear history as in actual processing, and thus the
results from such measurements can be assumed to best serve for the evaluation of
processability of polymer. Moreover, use of processing machines as rheometers often
enables achieving higher deformation rates which are out of the measurement range of regular capillary rheometer.
Continuous in-process experiments can be separated by means of the melt flow
through the measurement device: In in-line measurements the entire melt stream
passes through the measurement unit. By-pass on-line experiments are referred to,
when the measurement is only made for part of the melt stream that is directed to by-pass the process stream through the meter. In recycled on-line measurement, the by-passed melt stream is directed back to the process line after measurement 27 In many works where the plasticizing is done by an injection molding machine and the pressures
are recorded in the die fixed on the mounting table, the term “in-line measurement” is
used28,29 One can, however, also understand the in-line measurement as an experiment
that is carried out simultaneously with actual processing. In the case where slit or capillary die is mounted to an injection molding machine, it replaces the mold, thus no
actual molding can be done at the same time with such experiments and the term “in-line” must be understood bit differently.
Rheological measurements can be accomplished by means of die, either circular or rectangular, where the pressure and temperature are recorded by transducers mounted
on the die wall and/ or entrance. Such measurement unit can be connected to either an
extruder or an injection molding machine. In case of extrusion, continuous screw
rotation causes the flow through the die, and therefore the flow rate cannot be calculated simply from the screw rotation speed and barrel dimensions, but the
characteristic flow resistance of the die has to be considered as well1 The accurate flow
rate can be determined by collecting the extrudate over specified time period, weighing it, and using the melt density value of the material to convert the mass-flow
rate to volume-flow rate27 After this the shear rate corresponding to the screw rotation
speed can be calculated. In an injection molding machine the calculation of the flow rate
is more straightforward; injection through the die occurs shot-wise by rapid movement of the screw at pre-determined speed and over set distance, and the flow
rate can be calculated using Equation 42. However, especially at low injection pressure, one has to consider the possible leakage flow of melt from the nozzle, backwards along
the screw, which can reduce the theoretical flow rate30High shear-rate viscosity has been examined by circular capillary die specially
designed and built in-house31,32,33 Tailor-made rectangular slit dies and hyperbolically
converging and diverging planar dies have also been used for extensive examination of
shear and elongational properties of polymers34 utilizing Cogswell and Binding analyses for determining the apparent extensional properties. At the moment commercial
device with wide slit 30 compatible with injection molding machine also exists. The slit
die experiments using an injection molding machine as rheometer are discussed further in Publication VI.

8/12/2019 Rheological Characterization of Polymer Melts in Shear and Extension
http://slidepdf.com/reader/full/rheological-characterization-of-polymer-melts-in-shear-and-extension 39/67

8/12/2019 Rheological Characterization of Polymer Melts in Shear and Extension
http://slidepdf.com/reader/full/rheological-characterization-of-polymer-melts-in-shear-and-extension 40/67
27
where tensile stress, momentum, time, and the cross-sectional area of the
sample as function of both drum deflection angle and temperature, (, ) is taken into account as follows:
(
,
) =
°
(
)
/
(59)
Here, sample width, sample thickness, initial drum deflection angle, sample density at solid state, and () sample density at melt state at test
temperature T . The initial deflection angle of the drum means the drum rotation needed in the pre-heating phase in order to avoid sagging of the sample before the actual test.
Temperature correction, on the other hand, takes into account the thermal expansion of
the polymer. Correction procedures for both of these effects are presented in detail in
Publication IV. Gravitational sagging of the sample during the heating prior to the actual stretching
is problem causing serious inconsistency between the results. Besides using pre-stretching and taking the initial deflection angle into account in the calculation of sample
dimensions, very different and interesting way has also been used to overcome this: an MIT research group performed uniaxial extension experiments on dilute polymer
solutions in weightless environment at the International Space Station to eliminate the
effects of gravity39 This method is naturally out of reach for ordinary laboratories, but tests in liquid of the same density as the tested polymer can in principle be used: in
fact, the 2nd generation design of SER40 enables immersion of the testing system into
liquid. If floating liquid is used, proper fixing of the sample is essential to avoid slipping
or loosening from the test drums. Recently, uniaxial extensional viscosity measurements by SER have also been numerically simulated: in simulations an uneven necking close to
the attachment points onto the drums was observed41 Necking causes an uneven strain
distribution along the sample strip, and thus the locally observed strain rate also
deviates from the pre-set Hencky strain rate.
3.6 Other devices for uniaxial extension
In addition to rotating drum devices other types of designs for uniaxial extension
exist: Meissner type rheometers, of which RME (Rheometrics Melt Extensiometer)42 is
commercialized version, involve stretching of the polymer strip by rotating belts or clamps in horizontal position, where the sample is supported by oil bed or inert gas
flow. In MTR (Münstedt Tensile Rheometer)43 the sample is in vertical position in an
oil bath, which prevents sagging and ensures an accurate temperature control and distribution in and around the sample. In both these devices the actual strain rate is
observed by an external device: in RME video camera recording is used during the test, and in MTR the length of the sample is observed electro-optically. In filament stretching
rheometer (FSR), originally developed for low-viscous solutions but later revised also for polymer melts44 the sample mounted between cylindrical plates is stretched
vertically. The strain rate at the center of the sample remains constant and the extension
is purely uniaxial. Another advantage of FSR over SER, MTR and RME is the capability of
measuring the extensional viscosity of less-viscous fluids. melt spinning device, such as Göttfert Rheotens45 is an approximate test method
where the polymer melt is extruded from capillary and the filament is spun on roll downstream. Here the melt is subjected to the temperature of the environment, thus the
flow is non-isothermal. However, at high spinning rate the cooling effect can be assumed to have minimal effect. The spinning rate is determined by the tensile drawdown force,
thus the strain and strain rate experienced by the melt strand varies along its length by
changing thickness. Although the true uniaxial extensional viscosity cannot be measured
8/12/2019 Rheological Characterization of Polymer Melts in Shear and Extension
http://slidepdf.com/reader/full/rheological-characterization-of-polymer-melts-in-shear-and-extension 41/67
28
directly due to uncontrollable variables; non-uniform temperature and strain, the device
is useful in determining the melt strength46 which is an important measure when evaluating the polymer’s eligibility for example to be processed by fiber spinning47
Despite the variety of different experimental settings for uniaxial, biaxial, and planar
extension, reliable measurement is still not simple task and each technique has
certain limitations48
Results between devices based on different principles and even between different laboratories, due to their sample preparation technique, can differ
from each other. Different types of tensile stretching devices were compared together
and with converging flow analysis in the study coordinated by the National Physics
Laboratory (NPL)49 Especially the steady-state or maximum values in start-up extensional flow varied highly between the experiments. However, some agreement was
found in overall comparison between uniaxial extension techniques and contraction
flow analysis. NPL has put some effort on creating framework for standardizing the
experimental procedure for defining the transient extensional flow properties for polymer melts50 which is now stated in ISO 20965:2005.
3.7 Sample preparation and treatment in rheological measurements
Rheological properties of polymers are sensitive to many external factors, such as humidity, heat, or impurities. Numerous factors arising from improper sample handling
or preparation of experimental setting can cause discrepancy and poor reproducibility
of the results, or in worst case rough misinterpretation of the rheological behavior of the
examined material. Further, poor design of the measurement device or limitations dictated by solely constructional or practical reasons can give erroneous results, which
require post-processing for extracting true material properties of the output data.
Thermal stability of polymer melts is an important issue to be considered in
processing as well as when performing rheological characterization. Some polymer grades are very sensitive to excess heat and/or shearing, showing chain scission and
hence decrease of molecular weight, which is reflected in the properties of final
products, for example, as color changes and weaker mechanical properties. Thermal
degradation is pronounced in the presence of oxygen, and therefore parallel-plate and cone-plate rheometer measurements are often conducted in protective gas usually
nitrogen atmosphere. Viscosity is very sensitive to changes in molecular weight, and
the degradation can be observed as decreasing viscosity in time sweep experiment at constant shear rate or angular frequency. However, some polymers can also start
forming cross-links due to the excess heat, and show drastic increase in viscosity. In
dynamic tests storage modulus reveals changes in elasticity due to cross-linking clearly,
as demonstrated for example for metallocene-catalyzed narrow-MWD LDPE (Figure 16). In the experiment the polymer remained stable over the entire measurement time
of approximately one hour when the protecting nitrogen atmosphere was used during the experiment, whereas without nitrogen atmosphere the oxidation and cross-linking
started already after few minutes.

8/12/2019 Rheological Characterization of Polymer Melts in Shear and Extension
http://slidepdf.com/reader/full/rheological-characterization-of-polymer-melts-in-shear-and-extension 42/67
29
Figure 16. Time sweep for an LDPE at 230 °C. The solid line represents the storage
modulus measured under protecting nitrogen atmosphere, and the dashed line is storage
modulus from an identical measurement but without the protecting gas atmosphere.
The possibility of thermal degradation should also be taken into account when samples for rheological tests are prepared. For some measurements, such as the
extensional viscosity measurements by SER, sample strips must be prepared beforehand
by hot pressing the resin into thin sheets. It is important to use enough shearing and
heating to avoid inhomogeneities of the sample, such as granular boundaries or thickness variations, while making sure that the sample preparation process is gentle
enough to maintain the original properties of the material.
Another very important factor is the effect of moisture in polymers. Some types of
polymers, e.g. polyamides and polycarbonate, absorb humidity from the surroundings very easily. The water molecules act as plasticizers in the polymer, intruding between
the molecules and lowering the viscosity. Therefore careful drying, following the
polymer supplier’s recommendation, must be done before any rheological
characterization, as well as before melt processing. Moisture absorption can happen very fast, already while moving the test material from drying chamber to the
measurement device. Some thermal degradation can also happen during the sample
loading, so already the first measured data can be corrupt 1
In some cases human factors can have an influence on the measurement reliability: good example is the capillary rheometer experiment, where the test material is fed and
compressed by hand. The force used in doing this affects the compression level of the
melt in the barrel and can lead to slight differences in the pressure recorded at the lower end of the barrel. Similarly, in cone-plate or parallel-plate measurements, careful
trimming of the sample around the rim is important: too much melt outside the lower
plate of the system causes slight addition to the measured torque signal51 but even
larger error arises, if the gap between the measurement heads is not completely filled the same error that is caused due to edge fracture15 For especially sensitive polymers
the time used for sample loading and preparations before the experiment is started may
also affect the results through variations in moisture absorption or thermal history. In
order to be able to utilize measured rheological data for modeling purposes reliably, uniform, careful measuring procedure for all the rheological properties should be
followed.
G’ (no N2)
G’ (with N2

8/12/2019 Rheological Characterization of Polymer Melts in Shear and Extension
http://slidepdf.com/reader/full/rheological-characterization-of-polymer-melts-in-shear-and-extension 43/67

8/12/2019 Rheological Characterization of Polymer Melts in Shear and Extension
http://slidepdf.com/reader/full/rheological-characterization-of-polymer-melts-in-shear-and-extension 44/67
31
4.1.1 Filling phase
The melt proceeds in the barrel during plasticizing by drag flow mechanism, and in runners, as well as in the mold cavity, by pressure-driven flow. In the rapid, isothermal
tube flow the orientation of the molecules at the wall cause non-parabolic flow profile:
The shear-thinning property of polymer melts turns the velocity profile to more plug-like, so that the outer part closest to the skin experiences the highest rate of shearing. This means that the maximum strain in the tube flow occurs at the tube wall, but the
average strain for the total flow in the tube is far smaller1,52 Due to the cooled mold
cavity, the flow in the mold is non-isothermal: the skin forming on the outer surface has
the most frozen-in orientations, while the core that stays molten for longer time, remains less oriented.
The mold cavity is filled by pressure-driven flow and during the filling stage the
advancing flow front in the cavity has fountain-flow pattern (Figure 17) where the
melt “folds backwards” to the mold wall and forms the solidified outer layer, the afore-mentioned skin. The fountain-flow front is generally semispherical in shape; however,
numerical simulations in recent study showed that increasing melt elasticity changes
the flow profile towards bullet-like. In addition to the viscoelastic properties, the flow front is also affected by the flow rate and the geometry; high flow rate increases the
bullet-likeness of the flow front, and planar flow geometry produces more bullet-like
flow front compared to an axisymmetric flow channel53
Figure 17. Representation of fountain-flow in the mold cavity
In the filling phase, especially at the mold gate, the rapid screw-forward movement causes very high shear rate and high pressure. The shear rate, depending on the channel
profile and dimensions, can be as high as 105 s-1 and the pressures exceeding 100 MPa
are not uncommon52 As viscosity is an exponential function of pressure, the pressure
dependence of viscosity may become important at this point for some materials. The
melt is at high temperature in the filling phase, and some viscous heating also occurs due to friction. This increases the melt temperature even more and thus lowers the
viscosity. Therefore viscous heating has been considered to partly counteract the effect
of pressure that tends to increase the viscosity54 However, more recent study55 speculated that at extremely high pressures the effect of pressure would overrule the
effect of temperature increase on viscosity and therefore the effect of viscous dissipation
and the increasing pressure could not be assumed to cancel each other.
At the gate the melt flows through an abrupt contraction, and the flow streamlines converge causing acceleration of fluid particles and thus in addition to shear also
extensional deformation. The proportion of the extensional deformation increases with
increasing elasticity of the melt and thus for melts with high elasticity, the extensional
flow component has more significant effect on the overall pressure drop56
Both above-mentioned factors affect the correctness of the estimation of needed
injection pressure: rising pressure increases the viscosity of the melt, which in turn
cavity wall
frozen skin melt flow front
velocity profile behind the flow front
velocity profile at the flow front

8/12/2019 Rheological Characterization of Polymer Melts in Shear and Extension
http://slidepdf.com/reader/full/rheological-characterization-of-polymer-melts-in-shear-and-extension 45/67
32
requires higher injection pressure in order to fill the cavity. For melts with high elastic
contribution the larger pressure drop at contractions increases the need of injection pressure compared to less-elastic polymers. Extensional properties as well as the
pressure dependence of viscosity are dependent on molecular structure and chain
architecture57 and the significance of their contribution to the overall pressure must
therefore be treated separately for different types of polymers.
4.1.2 Packing phase
Once the mold is volumetrically filled, the process is switched from velocity-controlled injection phase to pressure-controlled packing phase. The purpose of the
packing phase is to compensate for the shrinking of the part due to the solidification and (for semi-crystalline polymers) crystallization that continues after the part has been
removed from the mold. If the packing pressure or packing time is insufficient, part
dimensions can continue distorting (warpage) and shrinking even days after molding.
Unlike the filling phase, the packing phase is characterized by flow at low temperature
and at low shear rate, before the melt finally solidifies. When the mold gate is sealed due to melt solidification, the packing pressure ceases to affect and the part has reached its
final density. The solidification point, the point at which viscosity gets high enough to cease flowing, is described in injection molding simulation as “no-flow temperature” or
“transition temperature”58
4.2 Significance of rheology in injection molding simulation
Using simulations in designing the injection molding part, mold gating and cooling, and the process, can be of great aid. With correctly performed simulation it is possible to reduce trial and error, time-to-market of the products, re-adjustments of the mold and
process parameters, and molding material waste. Starting with computer aided design (CAD) model of the part to be molded, material characteristic data of the molding resin are needed as input parameters; rheological properties are needed for flow behavior
prediction, thermal properties for the cooling analysis, pressure-volume-temperature
(pVT) and mechanical properties for modeling the packing phase and predicting post-ejection shrinkage and warpage.
Finite element method (FEM) calculation is the prevailing method to solve the
numerical problems in fluid flow, as well as in several other types of problems, for
example, in solid mechanics and heat transfer59 First attempts to simulate the injection molding process were done in the 1950’s, and the first models used were 1-dimensional
models. In order to be able to simulate the melt flow in complex cavity with simple 1-
dimensional approach, the geometry had to be deconstructed and laid flat into different components, in which the flow analysis is performed separately. After this the components were re-joined to complete model and adjusted for the equal pressure
drop and total flow rate60
The 2.5D approach offers more sophisticated model, which is useful for modeling
thin-walled mold geometries and when the fluid has high viscosity, as polymer melts do. 2.5D simulation uses either mid-plane or surface models (Figure 18 a, b). In the mid-plane model an arbitrary central plane of the part is meshed and the thickness is given
to create the “three-dimensionality”. However, the simulation with mid-plane model is
not real 3D simulation. In the surface model the part’s outer surface is meshed, and the mesh elements on the opposing surfaces are aligned and matched to represent an actual
three-dimensional part. The model preparation time for converting the commonly used
solid CAD models to surface model is much shorter than with the mid-plane model,

8/12/2019 Rheological Characterization of Polymer Melts in Shear and Extension
http://slidepdf.com/reader/full/rheological-characterization-of-polymer-melts-in-shear-and-extension 46/67
33
and in injection molding simulation the surface model is presently the most commonly
used60
Figure 18. 2.5D models; (a) mid-plane, (b) surface, and (c) true 3D model with
tetrahedral elements.
If the part to be modeled is not thin-walled and relatively simple, surface model
does not provide accurate approximation of the flow geometry. Simplifications related
to approximations used in the 2.5D modeling do not allow for correct prediction of flow
in junctions or abruptly changing cross-sections, nor around special parts of the mould, such as ribs, bosses, and corners. Neither does it work with thick-walled parts. For such
cases true 3D model with tetrahedral volume mesh elements (Figure 18c) should be
used. This increases the calculation time dramatically but has nevertheless become manageable with the ever-increasing computing capacity of modern computers.
Presently there are still unsolved issues regarding its computing flexibility and
efficiency, thus the surface model still remains the prevailing mesh type in common injection molding simulations60
4.2.1 Calculation basis for polymer melt flow in 2.5D simulation
For modeling polymer melt flow in injection molding, the conservation equations of mass, momentum and energy must be satisfied, simultaneously fulfilling the constitutive equations for material functions and the boundary conditions for the flow.
Conservation of mass dictates that the mass flow rate in must equal the mass flow
rate out. If incompressible fluid is assumed, the same can readily be applied to the
volume flow rate, but for compressible flow, which is assumed in injection molding simulation, variable density, defined by the pVT parameters, needs to be included. The
solution of the conservation equation of momentum (motion) gives the velocity field at
given point in time and space. For modeling the fluid flow in non-isothermal conditions,
the law of conservation of energy must also be fulfilled. It states that the rate of heat loss of body is proportional to the difference in temperatures between the body and its
surroundings, and determines the cooling of the polymer melt in contact to the mold
wall3,59For complete description of fluid flow in injection molding, material constitutive
equations and boundary conditions are required. In injection molding simulation, the
rheological constitutive equations for generalized Newtonian fluid (GNF) flow are used.
As extensions of Newtonian constitutive equation, GNF equations are capable of describing the viscosity as function of shear rate, as explained in Chapter 2.4 where
common GNF equations are given. However, GNF equations are not able to describe the
viscoelasticity, hence they cannot be used to define the normal stresses in polymer fluid
flow3
The number of boundary conditions in injection molding problems is relatively small
and depends on the type of flow problem and geometry. The first boundary condition for
the flow is no-slip
at
the
wall meaning that velocity of the fluid at the wall is the same as the velocity of the wall. Usually the walls are not moving, thus v=0 The second boundary
(a) (b) (c)

8/12/2019 Rheological Characterization of Polymer Melts in Shear and Extension
http://slidepdf.com/reader/full/rheological-characterization-of-polymer-melts-in-shear-and-extension 47/67
34
condition states symmetry around the central plane If the flow has plane of symmetry,
the velocity has its minimum or maximum on that plane, and its first derivative on the plane is zero. The symmetry condition is also applied in the heat transfer phenomena
related to cooling: the temperatures on both sides of the center plane are assumed
equal. Another boundary condition needed for modeling of cooling is the heat transfer
coefficient between the polymer melt and the mold wall. Further boundary conditions can be identified according to the flow problem at hand3,59
4.2.2 Simplifying assumptions
The above requirements lead to highly non-linear equations, and in order to be able
to solve them unambiguously, some general assumptions must be made in numerical simulation. In order to enable smooth simulation within an acceptable time,
simplifications are done regarding the material properties, the flow geometry, and the
governing balance equations involved in the process58
For reliable 2.5D simulation one prerequisite is small thickness compared to the
flow length. Using the assumption and ignoring the fluid inertia, the momentum equations for the flow velocity field are simplified to form called the Hele-Shaw
approximation, which was first applied to solve flow problems in injection molding simulation in the early 80’s61 The fountain flow in the mold cavity cannot be modeled, as
only the unidirectional flow streamlines are taken into account. For the same reason, the
converging flow in junctions and changing cross-sections is ignored62,63
The first simplification related to the rheological properties is the fact that the polymer melt is treated with GNF flow equations, thus the elastic effects are ignored.
The viscosity models used in injection molding software are generally of Cross or
Carreau type. The Carreau-Yasuda equation has one freely fitted parameter more and
thus provides the best fit for the widest variety of shear thinning polymer melts. However, the choice of the viscosity model does not seem to play very critical role in
the overall simulation accuracy14 Use of viscoelastic constitutive equations would
multiply the required calculation time, especially for complex geometries often dealt
with in injection molding. Besides, none of the existing viscoelastic constitutive equations is able to predict complex flow for any given geometry universally, but merely
describe certain, simple flow. Due to these complications, no commercial flow
simulation code with true viscoelastic constitutive equations exist 62 although several case-specific simulation experiments using viscoelastic models have been conducted, for
example for analyzing the cavity filling63,64 fountain-flow instabilities65 and residual
stresses, shrinkage and warpage66,67 Secondly, the increase of viscosity with increasing
pressure is most often ignored, although compressibility of the polymer melt is taken into account through the pVT parameters for enabling the calculation of the packing
phase. Thirdly, extensional deformation occurs at gates, junctions and converging cross-sections. Normally, however, only shear viscosity of polymers is used to describe the
flow, with the simplification that the main type of the deformation occurring in mold filling is shear68 These points are discussed further in the following.
4.2.3 Pressure dependence of viscosity and other rheology-related challenges in injection molding simulation
Melt viscosity increases with pressure, when the decreasing free volume in the polymer structure causes more interaction between the molecule chains. The effect of
pressure on melt viscosity can be ignored when the polymer process does not require
high pressure operation. However, in injection molding high pressure is often involved. The significance of the pressure effect on the viscosity depends on the polymer’s
8/12/2019 Rheological Characterization of Polymer Melts in Shear and Extension
http://slidepdf.com/reader/full/rheological-characterization-of-polymer-melts-in-shear-and-extension 48/67
35
molecular structure and melt temperature, as explained in Chapter 2.1.5. Apparently
pressure dependence becomes relevant for the accuracy of injection molding simulation only above certain pressure level: one estimation of the critical pressure limit,
presented in literature, is 100 MPa69 although for certain polymers the pressure
obviously affects the viscosity significantly already at much lower pressures
(Publication III). Ignoring the pressure-induced viscosity increase in simulation can lead to under-predicted nozzle pressure and over-predicted pressure inside the cavity70 The
pressure coefficient can be introduced to GNF viscosity model through WLF type
relationship, as for example in Cadmould®71 and Autodesk Moldflow®72 injection
molding simulation software. In fact, the option for taking pressure dependence of viscosity into account has existed in flow simulation codes for over twenty years now73
However, it still seems to be very seldom characterized in rheological tests and
therefore, for most materials, the pressure dependence parameter is missing in the
software databases. For flow in narrow, uniform gap without any obstacles disturbing the flow,
polymer melt exhibits mostly shear flow, and an accurate prediction can be achieved
with purely viscous flow models for shear viscosity. However, viscoelasticity manifests
itself as disruptive flow pattern at each discontinuity in the mold cavity, in runner junctions, at varying cavity gap height, or at the gate: When the melt flows from larger
to smaller cross-section, it stretches through the contraction experiencing extensional
deformation. This causes additional pressure loss at contractions and junctions, often referred to as “juncture loss”69 Its significance regarding the overall pressure in the
process depends on the viscoelastic properties of the melt and thus varies for each
material. In one study extensional properties of LDPE were modeled using Carreau-Yasuda equation modified for extensional viscosity to simulate the contraction flow at the capillary entrance74 The model does not capture true viscoelastic behavior, but
reasonable description of the extensional deformation estimated by the Binding method
was established. Likewise, better accuracy in injection molding simulation compared
to the use of mere GNF model was also achieved in another study using dualistic viscosity model with both extensional and shear deformation75 recent study58 summarizes the state-of-the-art of the injection molding simulation,
concentrating mainly on the issue of shrinkage and warpage simulation. It also points out the problem of different flow situation in conventional rheological experiments
compared to the actual injection molding process. As briefly discussed in Chapter 3.4
and in Publication VI, some studies on rheological experiments in injection molding
conditions have been done: especially the high shear rate viscosity data has been measured in-line, using die fixed to stationary mounting plate of an injection molding
machine31,32,33 Modeling the phase change is another great challenge in simulation:
rapid change in viscosity due to solidification cannot be predicted by any GNF flow
model, and the solidification is simply described by no-flow temperature, or
transition temperature, at which the melt fully ceases to flow58 Neither do the commonly used viscosity models describe the yield stress behavior at low shear rates,
typical for highly filled and rubbery polymers. Further, as specified above, more
accurate pressure prediction in injection molding simulation could be achieved if pressure dependence of viscosity and extensional flow properties were included in
viscosity model68 Yet both are usually omitted in the simulation, most probably because
of the lack of experimental data for molding materials.
4.3 Rheology in extrusion
Extrusion is continuous process, where the boundary conditions are given by the
geometry of the die and the calibrator. The polymer resin is conveyed, homogenized and compressed by rotating screw, and the form is given by the die through which the melt
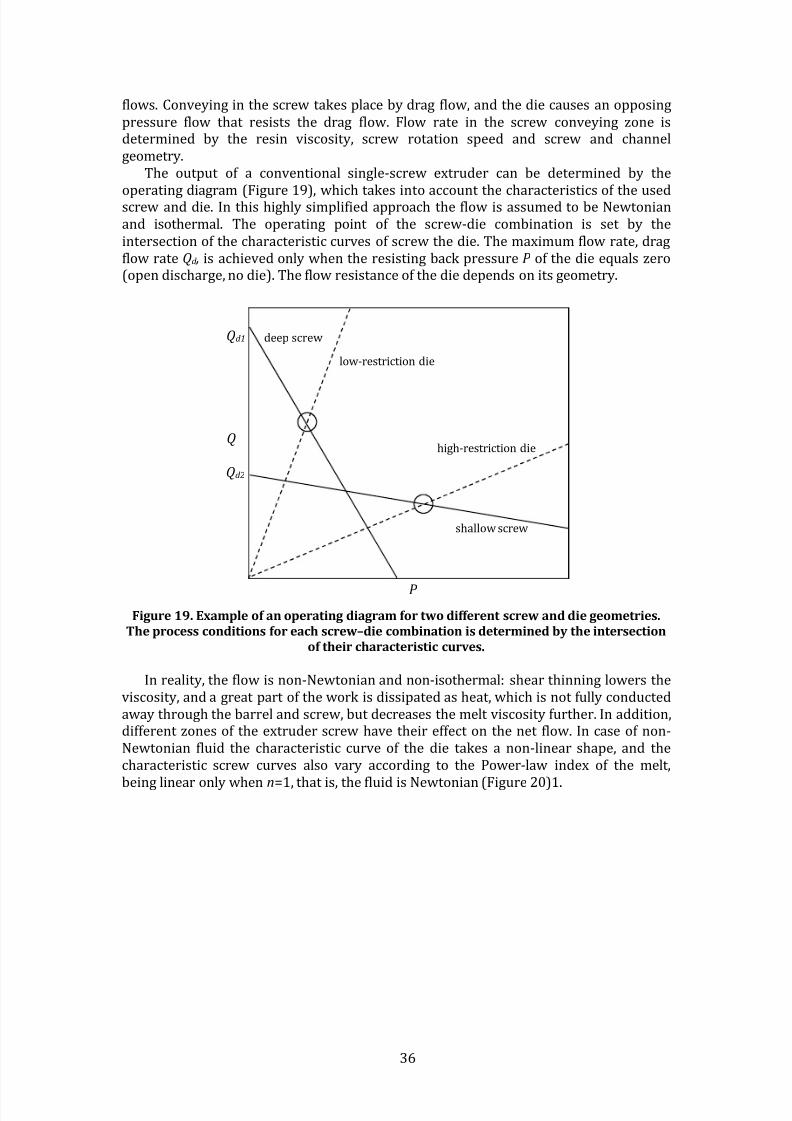
8/12/2019 Rheological Characterization of Polymer Melts in Shear and Extension
http://slidepdf.com/reader/full/rheological-characterization-of-polymer-melts-in-shear-and-extension 49/67

8/12/2019 Rheological Characterization of Polymer Melts in Shear and Extension
http://slidepdf.com/reader/full/rheological-characterization-of-polymer-melts-in-shear-and-extension 50/67
37
Figure 20. Normalised characteristic screw and die curves in case of non-Newtonian fluids
Simplified analysis assumes the flow rate to depend only on the screw rotation speed. As can be seen in Figure 19, with deep screw the best output is achieved using
low restriction die, whereas shallow screw gives maximum output with higher-
restriction die. In real cases, however, multiple possible operating points, that is,
combinations of temperature, pressure and flow rate, can be found1
4.3.1 Effect of viscoelasticity on die swell and extrusion instabilities
The viscoelastic nature of the polymer melts is the origin of many peculiar phenomena faced in polymer processing and various polymer processing difficulties
have been associated with extensional flow properties13 Viscoelasticity manifests itself in extrusion as die swell: long, entangled and coiled molecules are forced to partly
orientate along the flow when the stream converges at the entrance to narrow die.
However, the “memory effect” of the viscoelastic materials makes them to gravitate back
to the original, un-oriented state at the die exit. This is seen as an expanded cross-section of the extrudate, die swell (Figure 21). The effect is more pronounced for
polymers with high degree of branching and high molecular weight. The degree of
swelling is further set by die and resin temperature and the L/D ratio of the die: In long die the molecules orient more with the flow, relaxate and “forget” part of their
original coiled state, therefore swelling less at the die exit. In flow through short die
smaller part of the original coiling is lost and the die swell at the exit is greater. Swell in the circular dies is the simplest case, because the extrudate shape is not distorted. In case of non-circular profiles the shape also changes at the exit 1 Die swell measurements
can be used to qualitative estimations of elasticity.
die, non-Newtonian fluid

8/12/2019 Rheological Characterization of Polymer Melts in Shear and Extension
http://slidepdf.com/reader/full/rheological-characterization-of-polymer-melts-in-shear-and-extension 51/67
38
Figure 21. Representation of die swell
Melt flow instability occurs when critical shear stress is exceeded. Therefore the
maximum rate in extrusion process is limited by the onset of flow instability. This causes extrudate distortion, varying from minor loss of surface gloss to rough, spiral-like melt
fracture. Melt fracture types can be divided into volume distortions and surface
distortions according to the depth of occurrence within the extruded polymer strand.
Surface distortions, often described according to their appearance as shark skin or screw thread, originate at the die exit, whereas volume distortions, which show as
helical, wavy or chaotic extrudate, originate at the die entry16
Reasons of melt fracture are various: Die geometry and material, processing
conditions (temperature, flow rate), as well as the chemical nature and molecular architecture of the polymer all have an influence on its occurrence. Nevertheless, its
mechanisms are still not fully understood. Several theories on both macroscopic and
microscopic level have been presented. In most of them, extensional rheology and elasticity plays significant role. According to one theory, the surface layer of an
extrudate accelerates at die exit, leading to high level of surface stretching, while the
extrudate core decelerates (Figure 22). High elasticity retards the stress growth at the surface, and therefore more elastic, highly branched and high Mw polymers tolerate higher strain rates without melt fracture. Another theory suggests that the fracture of
the surface layer is caused by melt sticking and slipping at the die exit: The core flows
constantly while the surface grows ridge of melt to the die exit, which then detaches
along the flow, and new melt ridge starts to form causing an alternating stick-slip phenomenon16
Figure 22. Representation of surface distortions due to acceleration of the extrudate outer
layer16
swell ratio D/D0
die extrudate
D0 D
entangled molecule
partial orientation
return to original state
barrel

8/12/2019 Rheological Characterization of Polymer Melts in Shear and Extension
http://slidepdf.com/reader/full/rheological-characterization-of-polymer-melts-in-shear-and-extension 52/67
39
4.4 Rheology in extensional flow dominated processes
Extensional flow dominates especially in processes where free flow surfaces exist; the polymer is stretched or oriented in uniaxial, biaxial, or planar manner. Many
secondary shaping methods, such as fiber spinning (uniaxial extension), film blowing
(biaxial and planar extension) and blow molding (uniaxial, biaxial and planar extension) are examples of extensional flow processes. In order to correctly model the polymer flow in such processes, rheological characterization in extension instead of (or in
addition to) shear is essential. Extensional viscosity is very sensitive indicator of
changes in molecular architecture, such as long-chain branching, which has great
impact on the performance of polymers in processes involving high degree of stretching. Shear viscosity, on the other hand, does not readily reveal such properties:
Two polymers with completely different extensional behaviors (e.g. extension
thickening extension thinning) can have virtually the same zero-shear viscosity and
flow curve, which does not tell anything about their different stretchability13
4.4.1 Fiber spinning
Spinning of fibers from polymer melt involves strong axial orientation in uniaxial
flow: The polymer melt is extruded through spinneret die and drawn and spooled on roll at pre-determined take-up speed. The take-up speed is much higher than the
extrusion speed, which leads to high degree of uniaxial stretching. The process is
highly non-isothermal as the thread is cooled during drawing before the take-up. The
relationship of take-up speed to the extrusion speed is called the draw ratio, and in industrial processes it is generally about 5:176 When the draw ratio exceeds critical
limit, instable flow, draw resonance, occurs. Polymers preferred for melt spinning have
low level of chain branching at high degree of polymerization77However, sensitivity to
draw resonance is higher for linear than for long-chain branched, strain hardening (and
extension thickening) polymers78,79,80 The Rheotens test mentioned in Chapter 3.6 is good representation of fiber spinning and useful for evaluating the performance of polymers in such manufacturing processes47
4.4.2 Blow molding
Blow molding, common method for manufacturing, for example, beverage bottles,
can be divided into two categories according to the method for forming the preform of the moldable article. In injection blow molding (also: stretch blow molding) the preform is first injection molded, cooled down, transferred to blowing station, where it is again
heated to the required stretching temperature and formed into hollow object by
biaxial stretching using pressurized air (and stretch rod).
In extrusion blow molding the final forming takes place instantaneously after extrusion of the tube-like parison; an automated mold pinches the parison end to form
the bottom of the bottle, inflated by air blown from the upper end of the mold which also forms the neck of the bottle.
Both of these manufacturing processes involve shear (extrusion/ injection molding of the preform) and extensional deformation (blowing phase). Especially in extrusion
blow molding the flow is complex combination of different factors: swelling at the die
exit due to the memory effect of the macromolecular compound, uniaxial extensional
flow due to vertical gravitational sagging of the extruded tube before it is taken by the blowing mold, and finally mixture of planar and biaxial stretching due to the blowing
pressure. Sag and die swell of the preform occur simultaneously after extrusion and are
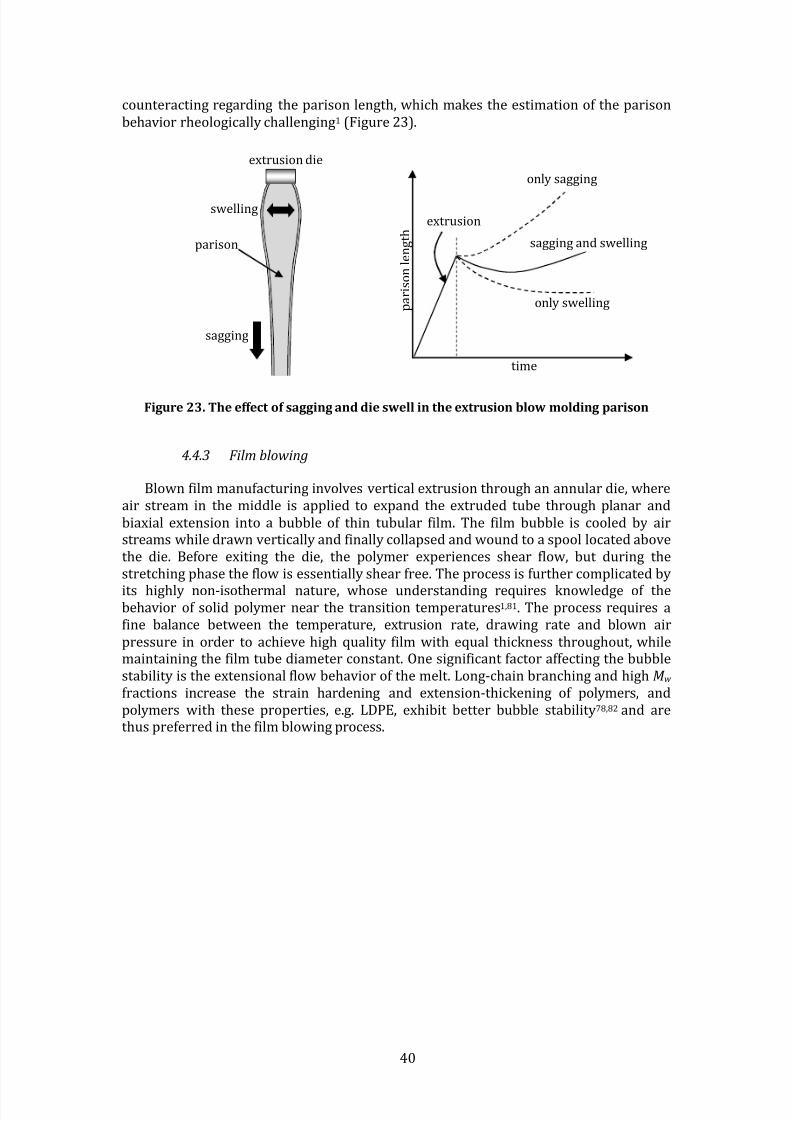
8/12/2019 Rheological Characterization of Polymer Melts in Shear and Extension
http://slidepdf.com/reader/full/rheological-characterization-of-polymer-melts-in-shear-and-extension 53/67
40
counteracting regarding the parison length, which makes the estimation of the parison
behavior rheologically challenging1 (Figure 23).
Figure 23. The effect of sagging and die swell in the extrusion blow molding parison
4.4.3 Film blowing
Blown film manufacturing involves vertical extrusion through an annular die, where air stream in the middle is applied to expand the extruded tube through planar and
biaxial extension into bubble of thin tubular film. The film bubble is cooled by air streams while drawn vertically and finally collapsed and wound to spool located above
the die. Before exiting the die, the polymer experiences shear flow, but during the
stretching phase the flow is essentially shear free. The process is further complicated by
its highly non-isothermal nature, whose understanding requires knowledge of the behavior of solid polymer near the transition temperatures1,81 The process requires fine balance between the temperature, extrusion rate, drawing rate and blown air
pressure in order to achieve high quality film with equal thickness throughout, while maintaining the film tube diameter constant. One significant factor affecting the bubble
stability is the extensional flow behavior of the melt. Long-chain branching and high M w
fractions increase the strain hardening and extension-thickening of polymers, and
polymers with these properties, e.g. LDPE, exhibit better bubble stability78,82 and are thus preferred in the film blowing process.
parison
sagging
extrusion die
swelling
time
only sagging
p a r i s o n
l e n g t h
only swelling
sagging and swelling
extrusion

8/12/2019 Rheological Characterization of Polymer Melts in Shear and Extension
http://slidepdf.com/reader/full/rheological-characterization-of-polymer-melts-in-shear-and-extension 54/67
41
5 SUMMARY OF EXPERIMENTAL WORK AND RESULTS
In this part brief summary of the work done in each publication and the central
results and conclusions as well as suggestions for further research are given. The first
subchapter gives brief summary of all tested materials and test methods.
5.1 Test materials and experimental settings
Commercial thermoplastic grades designed mainly for extrusion or injection molding
were used in all the studies (Table 1).
Table 1. Polymer grades used in the experiments discussed in publications. Properties are
provided by the suppliers.
Supplier Polymer Trade name Density [kg/m3
MFR [g/10min] MVR [cm3/10min]
Publication
(Lyondell) Basell
LDPE Lupolen 1840H 919 1.5 g/10 min (190°C, 2.16kg) II, III
Lupolen 3020D 926 0.30 g/10 min (190, 2.16) IV,
PP
Moplen EP340K 900 4.0 g/10 min (190, 2.16) III
Moplen HP501L 900 6.0 g/10 min (230, 2.16) VI
Moplen HP501H 900 2.1 g/10 min (230, 2.16) VI
BASF PS
Polystyrol 143E 1040 10 cm3/10 min (200, 5.0) I, II, III, VI
Polystyrol 158K 1050 3.0 cm3/10 min (200, 5.0) VI
ABS Terluran GP-22 1040 19 cm3/10 min (220, 10) III
GE Plastics PC Lexan HF1110R 1200 26 cm3/10 min (300, 1.2) I, III
Degussa PMMA Plexiglas 6N 1190 12 cm3/10 min (230, 3.8)
ABS, PC, and PMMA were always dried in vacuum oven or desiccator according to the suppliers’ recommendations before rheological characterization.
Anton Paar MCR301 rotational rheometer with CTD600 convection oven was used
for low-shear rate rheological characterization: For dynamic oscillation tests 25 mm
parallel-plate geometry, and for steady-shear tests 25mm cone-plate geometry with 2° cone angle was used. Uniaxial extensional experiments (Publications IV and V) were
done with SER “1st generation” extensional fixture connected to Anton Paar MRC301
with CTD450 convection oven (device located at Berlin Institute of Technology). All the experiments by rotational rheometer were carried out under protective nitrogen
atmosphere.
8/12/2019 Rheological Characterization of Polymer Melts in Shear and Extension
http://slidepdf.com/reader/full/rheological-characterization-of-polymer-melts-in-shear-and-extension 55/67
42
Capillary rheometry experiments were all done using Göttfert Reograph 6000 three-
bore capillary rheometer. Depending on the case, circular dies with L/D of 5, 10, 20, and 30 were used, and the entrance pressure drop was measured using an orifice die with
conically expanding outlet, standard design provided by Göttfert. Viscosity
measurements at elevated pressure were produced using counter-pressure chamber,
also standard device by Göttfert. Viscosity measurements with an injection molding machine (Publication VI) were
done using the all-electric injection molding machine Fanuc Roboshot -30C with
tailor-made slit die with exchangeable inserts for slit heights 0.75, 1, and 1.5 mm.
Pressure data was collected with the Agilent 34970A data acquisition unit. Samples for rotational rheometer were prepared from the resins by hot-pressing the
granulates by heated press into thin plaque, from which round discs with 25 mm
diameter were punched or cut out. For extensional experiments the resin was first
homogenized by single screw extruder and after that pressed into sheet between PTFE foil-covered aluminum plates in hot press. The sheets were cooled down slowly
at room temperature between the press plates and under heavy weight to avoid
warpage and to eliminate the possible effects of shearing, to which the melt is subjected
in the extruder. After cooling, rectangular strips were cut out of the pressed sheet.
5.2 Viscosity at low shear rates and temperatures (Publication I)
The accuracy of the simulation of injection molding process is dependent on the
ability of the viscosity model to describe the behavior at the shear rates, temperatures and pressures involved in the process. Commercial simulation software use GNF
equations to predict the melt viscosity. Commonly the measurements are carried out at
relatively high temperature, corresponding to the polymer’s processing temperature.
Injection molding, however, is highly non-isothermal process including phases of high shear and high temperature, such as the filling phase, and low shear and low
temperature, such as the packing phase. The purpose was to study the applicability of
GNF equation in modeling the viscosity of polymer melts in the latter cases.
The Carreau-Yasuda model is five-parameter GNF model and was used here with the WLF equation for temperature dependence to characterize the flow behavior at low-temperature, low-shear flow region for three amorphous polymers: PS, PMMA, and PC.
First, temperature sweep test in dynamic mode was performed to get an indication of the solidification point and thus the lower temperature limit for frequency sweep tests.
The lowest measurement temperatures that could be realized without exceeding the
torque limit of the device or detachment of the sample off the measuring plates was
around 20 °C above the glass-transition temperature of each polymer. The experimental viscosity data was obtained from the dynamic oscillatory measurements using the Cox-
Merz approach to relate the complex viscosity vs. angular frequency to viscosity vs. shear rate. The Carreau-Yasuda-WLF fitting was applied on the experimental data, and
generally good fit could be achieved. However, at lowest temperatures and highest angular frequencies leveling-off of the viscosity curves towards the apparent 2nd
Newtonian plateau could be observed for the studied materials, and the used viscosity
model as such was not able to model this trend. Whether this really indicates the actual
2nd Newtonian plateau, remains rather uncertain on the basis of present data: the measurements were made in the dynamic mode and the Cox-Merz rule was applied.
However, the Cox-Merz empirical relation was originally applied at temperatures way
above the glass-transition6 and to the authors’ knowledge has not been validated close to the polymer’s solidification temperature. Results showing an apparent 2nd
Newtonian plateau for various polymers have been achieved at high shear rate, usually
around 106 s-1 with specially designed capillary rheometers and dies coupled to the nozzle of an injection molding machine31,32,33,83,84
8/12/2019 Rheological Characterization of Polymer Melts in Shear and Extension
http://slidepdf.com/reader/full/rheological-characterization-of-polymer-melts-in-shear-and-extension 56/67

8/12/2019 Rheological Characterization of Polymer Melts in Shear and Extension
http://slidepdf.com/reader/full/rheological-characterization-of-polymer-melts-in-shear-and-extension 57/67
44
For both materials the measurements with the orifice die gave higher entrance
pressure drop than the Bagley correction. The difference between pe0- peB was greater for PS, which suggests that it sticks more to the outlet wall than LDPE. Also the
comparison of pe0- peB to pCalc confirmed this, although the differences in the sticking behavior cannot really be observed visually during the measurement. Another factor for
the smaller difference in results for LDPE might be its higher relative extensional viscosity: this manifests itself as stronger corner vortex formation in the contraction
flow, and therefore higher entrance pressure drop, which in turn leads to smaller pe0-
peB. The outlet area increased the total entrance pressure drop with increasing shear
rate by factor from 1.3 to 1.5 for LDPE and by 1.4 to 2.1 for PS. Factor of 1.5 was suggested here to correct the error caused by the sticking, so that the corrected entrance
pressure drop pe peB/1.5. The applicability of this correction factor to other materials has not been proved.
Sometimes the extraction of the entrance pressure drop is bypassed using only one
long capillary die without any correction. In long capillary the relative portion of
entrance pressure drop is indeed small, but at the same time viscous heating and pressure dependence of viscosity may corrupt the results. Here, the use of orifice die
data for the entrance pressure drop correction gave results closer to the Bagley corrected ones than the use of die with L/D=30 alone. For further use of the direct
measurement method, the best solution would be finding an ideal orifice die geometry that allows free exit of the extruded melt.
5.4 Viscosity at elevated pressures (Publication III)
When polymer melts are subjected to high pressure, their viscosity is affected by
the pressure, increasing with increasing hydrostatic pressure. The pressure dependence of viscosity of polymer melts becomes important when the pressure in the
manufacturing process gets high enough. Generally, such situation occurs in injection molding, and more specifically in the mold filling and packing phase. Compressibility and the dependence of viscosity on the pressure for polymer melt is largely dependent
on its structure; in general amorphous polymers with large pendant groups, ring
structures and double bonds in the backbone possess more free volume and thus are
able to compress to higher degree. Viscosity at elevated pressure was measured for five commercial thermoplastic
polymers; PC, ABS, PS, PP and LDPE, to find out the significance of the pressure
dependence of viscosity for each. The experiments were carried out by capillary
rheometer with an additionally mounted pressure chamber with maximum mean operating pressure of 120 MPa. For each polymer, measurements were done at typical
processing temperature at shear rates 50, 100, 200, and 500 (for PC also 1000 s-1), so
that during each test the shear rate was held constant and the mean pressure was gradually increased by constricting the downstream flow in the chamber. An orifice die and die with L/D 10 were used, and the correction for the entrance pressure drop
was done according to the procedure suggested in Publication II. Pressure was recorded
upstream and downstream of the capillary by two transducers, and the total pressure drop across the die is the difference between their readings. In order to get low-shear
rate data inaccessible by capillary rheometer, rotational rheometer with cone-plate
geometry was used at ambient pressure.
As the experimental setting does not allow exact adjustment of the upstream pressure, the data points achieved with both capillaries were fitted on quadratic curve
in order to be able to extract the entrance pressure drop (measured with the orifice die)
from the pressure drop of the die with L/D=10. Data handling also included correction
for the non-parabolic velocity profile in the die. For this the Schümmer approximation24,25 was used: the shear rates were multiplied by 0.83. The pressure
8/12/2019 Rheological Characterization of Polymer Melts in Shear and Extension
http://slidepdf.com/reader/full/rheological-characterization-of-polymer-melts-in-shear-and-extension 58/67
45
coefficient that describes the pressure dependence of viscosity was obtained by time-
pressure superposition of the data measured at different pressures. The data are compiled to master curve at ambient pressure ( p=0.1 MPa) by shifting them with
pressure shift factor.
The Carreau-Yasuda equation was fitted on the high-pressure data for modeling the
viscosity, and the cone-plate data was included in the fit for better description of the low-shear rate region. However, for ABS no leveling-off towards the Newtonian plateau
could be observed, and instead of the Carreau-Yasuda equation, power-law fitting was
used and the low-shear data was omitted from the fit. For PC, the Newtonian plateau
was reached already in capillary rheometer measurements, and no additional cone-plate data was necessary.
The order of the pressure coefficients was PS PC ABS PP LDPE. As expected,
the amorphous polymers have stronger pressure dependence of viscosity than the
semi-crystalline ones. Regarding the relationship of pressure dependence to the complexity of the molecular structure, one would think PC would have stronger
pressure dependence of viscosity than PS. However, considering the temperature
dependence of pressure coefficient the order makes sense, as the test temperature of PS
was much closer to its T g than the test temperature of PC. theoretical perusal of pressure dependence of viscosity in injection molding was made on the basis of the
pressure coefficient achieved for PS. Including the pressure shift factor in the calculation
at hypothesized pressure in mold filling situation, p=200 MPa, increased the viscosity at high shear rates multifold compared to the situation where no pressure dependence
of viscosity is taken into account.
5.5 Measurement of uniaxial extensional viscosity by SER (Publication
IV)
SER is relatively simple device for characterizing the extensional flow properties of
polymer melts. However, certain limitations must be taken into account and some
corrections need to be done in order to get accurate, reliable results. The basic
procedure in evaluating the measured extensional viscosity data should always include checking against the linear viscoelastic limit as the first step of result validation: for
uniaxial extension, in the slow-flow region of transient start-up flow, that is, low Hencky
strain rates, the transient extensional viscosity should be related to the start-up shear viscosity as illustrated in Figure and Eq. 23, so that in uniaxial extension the LVE () = 3(, 0) In many rheology laboratories the LVE for extensional start-up
curves is found to lie above this, and simple shift of data downwards is performed to
“correct” the results, without thinking of the reasons for this discrepancy. The steady-state flow indicated by the leveling of the start-up extensional viscosity towards
constant value can most often not be achieved by SER due to instability and rupture of the sample, and maximum values, rather than steady state values, should be reported.
In this study the extensional viscosity of LDPE at three different temperatures, 170, 180, and 190 °C, was measured by SER using different testing and calculation
procedures. The accuracy and correctness issues related to experiments and
calculations were discussed in detail. The results were compared with the ones obtained
earlier by RME and MTR87 and the comparability with theoretical approach was studied through application of the Molecular Stress Function (MSF) model88,89
The best results were achieved when the measurements were performed using
long pre-tempering time of the device, mounting the temperature sensor tight next to the SER frame, and fixing the sample without clamps. The two first factors are related to
the temperature control of the device and applied in order to ensure proper heating of
the SER device and uniform temperature distribution throughout the sample. The third factor apparently has an effect on the deformation at the sample strip ends: attaching

8/12/2019 Rheological Characterization of Polymer Melts in Shear and Extension
http://slidepdf.com/reader/full/rheological-characterization-of-polymer-melts-in-shear-and-extension 59/67
46
the sample with clips can cause partially planar deformation field, so that the
assumption for uniaxial extensional flow does not fully hold. In addition to these measures, the experimental data were corrected by taking into account the changes of
the sample dimensions because of thermal expansion and pre-stretching: The
calculation takes into account the density of the sample at solid state, but heating the
sample causes expansion that has to be corrected by using the melt density at test temperature. Pre-stretching is needed in order to avoid sagging of the sample during the
heating phase, as discussed in Extensional Flows (Chapter 2.3). Correct sample
dimensions at the beginning of the test are thus achieved by taking into account the
decrease of the sample width and thickness caused by drum rotation (initial deflection
angle in the pre-stretching phase.
After the experimental and correction procedures summarized above the measured strain hardening function of LDPE was well in accordance with the RME and MTR
measurements, although the maximum values achieved in transient SER tests were
lower. The MSF model was able to describe the strain hardening behavior at all three
temperatures by the same non-linear parameters. The work conducted for this paper was carried out in cooperation with Anton Paar GmbH rheometer manufacturer, and the
outcome led to improvements of the software module used when measuring the extensional viscosity by SER: in the current version it is possible to feed the melt density of the sample as an input parameter, and it is taken into account in the calculation. The
experiments were performed using only one material, commercial LDPE. In order to
prove and develop the technique further, broader study using polymers with different
properties is suggested.
5.6 Comparison of uniaxial extension and contraction flow analysis
(Publication V)
The maximum values from the transient extensional viscosity tests for LDPE by SER,
reported in Paper IV, were compared to the results obtained by Cogswell approximation method. In addition, the MSF model was applied to describe the experimentally achieved () For Cogswell analysis, capillary measurements were performed by Göttfert
Rheograph 6000 capillary rheometer using round-hole die with diameter of mm
and L/D of 20. In addition, an orifice die was used to measure the entrance pressure
drop pe directly according to the procedure presented in Publication II. Both dies have
an abrupt contraction at the entrance, i.e. the entrance angle is 180°. The measured set covered the shear rates 10, 20, 40, 100, 200, 400, 1000 s1
The Cogswell analysis19 is based on the assumption that shear and extensional
components of an additional pressure drop at flow contraction can be separated: When the polymer fluid flows through sudden contraction, the center of the flow region is
funnel-shaped, whereas, due to the elastic effects, circulating flow vortices are formed at the corners. These vortices dissipate energy, causing an extra pressure drop at the
entrance region of the contraction. The contribution of the extensional effects can be
calculated according to Cogswell by deriving it from the entrance pressure drop, pe
which is assumed to be the sum of pressure drops caused by shear and elongational deformation.
When extensional viscosity obtained by two different methods is compared, it is
critical that the total strain, rather than the strain rate, is equal in both. Indeed, the
average maximum strain in the SER tests, 3 agrees with the average strain at the capillary flow contraction with the barrel/ die cross-sectional area Ab:Ad 144.
relatively good correlation between these two methods was found for the LDPE test
material. This suggests that using the Cogswell analysis may be sufficient when
evaluating extensional properties for needs of process modeling, such as injection molding simulation, and no accurate information of the polymer structure-behavior

8/12/2019 Rheological Characterization of Polymer Melts in Shear and Extension
http://slidepdf.com/reader/full/rheological-characterization-of-polymer-melts-in-shear-and-extension 60/67
47
relationship is sought. The MSF theory predicted higher steady-state extensional
viscosity values, which is readily explained by the fact that the strain level corresponding to the steady state was not reached in the experiments. Reapplication of
the MSF model at resulted in remarkable agreement with the experimental data.
As an extension to the present work, the compatibility of the Cogswell method and
uniaxial extensional measurements should be proved with other type of polymers. Moreover, studying extensional viscosity achieved by different experimental methods
and by theoretical predictions would be an interesting topic for future research,
combined with the study of extensional flow in the injection mold cavity. Molecular
modeling, such as MSF theory, could offer an interesting possibility to theoretically achieve data needed for processing applications, when only limited number of
experimental results are available.
5.7 Viscosity measurements of polymer melts by an adjustable slit die
and injection molding machine (Publication VI)
Shear viscosities of two grades of PP and two grades of PS were measured with slit die connected to an injection molding machine. The slit die was tailor-made and
designed to fit both extruders and injection molding machines. The die has modular construction, designed to allow variation of the slit height by exchanging the slit insert.
The height can be set to 0.75, 1.0 or 1.5 mm, all having the same width, 15 mm. The
benefits of this flexibility become obvious when various materials with highly different
flow properties are characterized. Another point is that by performing measurements using all the slit heights, one can detect possible wall slip as discrepancy in the flow
curves or viscosity curves achieved with different slit sizes. To allow the practical
mounting of temperature sensor in the middle of the die, this design has only two bores
for pressure transducers.
The die was fixed to the stationary mounting plate of Fanuc Roboshot -30C all-electric injection molding machine. Measurements were carried out at 200 and 230 °C at pre-set injection speeds so that the shear rate varied approximately from 400 to 20 000
s-1 Slit pressure was measured at two points with distance of 55 mm with Dynisco
pressure transducers. For all the polymer grades studied here, an excellent agreement of
viscosity measured by the injection molding machine with slit die and conventional off-line rheometer was achieved. Slit die measurements with an injection molding
machine provide an easy-operation, fast and sufficiently precise option for measuring
shear viscosity of polymer melts at relatively high shear rates typical of polymer melt processing. Because of the screw plasticizing, the thermo-mechanical history of the melt
is similar to the processing conditions. Modular design with detachable slit inserts
facilitates proper cleaning of the die, thus eliminating one of the major downsides
associated with slit die constructions. In order to extend the usability of the initial slit die design tested here, adding
constriction valve downstream the flow has been considered: this way the back-pressure of the die could be regulated, enabling measurement of viscosity at elevated
pressures. The all-electric injection molding machine used in these tests proved to be very precise: good agreement with off-line rheometry indicates that exact calculation of
the flow rate from the injection speed and screw diameter is possible which is an
essential requirement for rheological measurement device. However, the machine
used in the current study has relatively small capacity, and in order to study viscosity at extremely high shear rates and/or elevated pressures, machine with higher shot
volume and injection pressure capacity should be used.

8/12/2019 Rheological Characterization of Polymer Melts in Shear and Extension
http://slidepdf.com/reader/full/rheological-characterization-of-polymer-melts-in-shear-and-extension 61/67
48
6 CONCLUDING REMARKS
This work aimed at extensive rheological characterization of thermoplastic polymers, necessary for understanding the flow behavior of the melt in polymer
processing, especially in injection molding. Certain issues related to the accuracy and
correctness of experimental and analytical procedures were also considered. Thus the
purpose of this work is not only enhancing the knowledge of the significance of polymer melt rheology for improving the accuracy of injection molding simulation, but also
pointing out some of the important issues related to correct measurement procedures
useful in polymer processing and research in general. Publication on measuring and modeling viscosity at low temperature and shear
rates, reports situation faced in the packing phase of injection molding. For the flow
phases relevant in injection molding high temperature and high shear rate, as in filling,
or low shear rate and low temperature, as in packing GNF model, such as the Carreau-Yasuda equation, was able to describe the viscosity function accurately.
Publication III reported the pressure dependence of viscosity for several polymers.
The pressure dependence of viscosity is highly dependent on molecular structure:
complex structure possesses more free volume, and is thus more strongly affected by compression, which causes the polymer chains to inhibit each others’ movements and
thus increase viscosity. At lower temperatures, close to the T g the effect of pressure on viscosity is more pronounced. This has an effect on the simulation accuracy when the
polymer’s pressure dependence factor is large enough and the pressure level in the process gets relatively high.
Some factors affecting the measurement quality related to capillary rheometry and
uniaxial extension by counter-rotating drum device were considered. Publication II deals with the correction of entrance pressure drop in capillary rheometry: Orifice die is good alternative for evaluating the entrance pressure drop, but the conical outlet
geometry of the commercial design used here requires correction for the additional
pressure drop caused by the adhesion of the melt to the outlet wall. Publication IV examined the experimental and analytical practice and errors in
uniaxial extensional experiments by SER. It was shown that by taking into account the
changes in sample geometry due to thermal expansion and pre-stretching, more exact
results can be achieved. The author was in close cooperation with the rheometer manufacturer Anton Paar GmbH when the measurement protocol and calculation
routine were evaluated. As one important outcome of this study, the Anton Paar
software module used to operate SER has been improved by adding an option of taking
into account the geometrical error related to the thermal expansion. combination of two methods for determining extensional viscosity at broad-
extension rate range considering injection molding simulation as possible
application was studied in Publication V. Extensional viscosity could be achieved over wide range of extension rates with relatively good accuracy by measuring it using SER
and by evaluating from contraction flow analysis on capillary rheometry data. Moreover,
the MSF model was able to predict the extensional behavior in case where scarce experimental data is available.
8/12/2019 Rheological Characterization of Polymer Melts in Shear and Extension
http://slidepdf.com/reader/full/rheological-characterization-of-polymer-melts-in-shear-and-extension 62/67

8/12/2019 Rheological Characterization of Polymer Melts in Shear and Extension
http://slidepdf.com/reader/full/rheological-characterization-of-polymer-melts-in-shear-and-extension 63/67
50
7 REFERENCES
1 Dealy JM, Wissbrun, KF. Melt rheology and its role in plastics processing Theory and applications. Dordrecht: Kluwer Academic Publishers; 1999. 665 p.
Dealy JM, Larson RG. Structure and rheology of molten polymers From structure to flow behavior and back again. Munich: Carl Hanser Verlag; 2006. 516 p.
3 Morrison, FA. Understanding rheology. New York: Oxford University Press; 2001. 545 p.
4 Kulicke WM, Porter RS. Irregularities in steady state flow for non-Newtonian fluids between cone and plate. Journal of Applied Polymer Science 23, 1979, 953-965.
5 Larson RG. Instabilities in viscoelastic flows. Rheologica Acta 31, 1992, 213-263.
Cox WP, Merz EH. Correlation of dynamic and steady flow viscosities. Journal of Polymer Engineering and Science 28, 1958, 619-621.
7 Ferry JD. Viscoelastic properties of polymers. Ed., New York: John Wiley Sons, Inc.; 1970. 671 p.
8 Williams ML, Landel RF, Ferry JD. The temperature dependence of relaxation mechanisms in
amorphous polymers and other glass-forming liquids. Journal of the American Chemical Society 77, 1955, 3701-3706.
9 Filipe S, Knogler B, Buchmann K, Obadal M. Shear and extensional flows as drivers for the crystallization of isotactic polypropylene When rheology, microscopy and thermal analysis must meet. Journal of Thermal Analysis and Calorimetry 98, 2009, 667-674.
10 Dealy J, Plazek D. Time-Temperature Superposition Users Guide. Rheology Bulletin 78(2), 2009, 16-31.
11 Hieber CA in: Injection and Compression Molding Fundamentals. ed. Isayev AI, ch.1, New York: Marcel Dekker; 1987.
12 Cogswell FN. The influence of pressure on the viscosity of polymer melts. Plastics Polymers, 41, 1973, 39-43.
13 Baird DG. The role of extensional rheology in polymer processing. Korea-Australia Rheology Journal 11(4), 1999, 305-311.
14 Hieber CA, Chiang HH. Shear-rate-dependence modeling of polymer melt viscosity. Polymer Engineering and Science, 32(14), 1992, 931-938.
15 Macosko CW. Rheology: Principles, measurements and applications. New York: Wiley-VHC, Inc.; 1994. 581 p.
16 Koopmans R, den Dolder J, Molenaar J. Polymer melt fracture. Boca Raton, FL: Taylor and Francis Group LLC; 2011. 311 p.
17 Bagley EB. End corrections in the capillary flow of polyethylene. Journal of Applied Physics 28, 1957, 624-627.
18 Mooney M. Explicit formulas for slip and fluidity. Journal of Rheology 2, 1931, 210-222.
8/12/2019 Rheological Characterization of Polymer Melts in Shear and Extension
http://slidepdf.com/reader/full/rheological-characterization-of-polymer-melts-in-shear-and-extension 64/67
51
19 Cogswell FN. Converging flow of polymer melts in extrusion dies. Polymer Engineering and Science 12, 1972, 64-73.
20 Binding DM. An approximate analysis for contraction and converging flows. Journal of Non-Newtonian Fluid Mechanics 27, 1988, 173-189.
21 Nelson B, Capillary Rheometry in: Handbook of Plastics Analysis. Ed. Lobo H, Bonilla JV. New York: Marcel Dekker Inc.; 2003.
22 Laun HM. Polymer melt rheology with slit die. Rheologica Acta 22, 1983, 171-185.
23 Laun HM. Pressure dependent viscosity and dissipative heating in capillary rheometry of polymer melts. Rheologica Acta 42, 2003, 295-308.
24 Chmiel H, Schümmer P. Eine neue Methode zur Auswertung von Rohrrheometer-Daten. Chemie Ingenieur Technik 1971, 43(23), 1257-1259.
25 Schümmer P, Worthoff RH. An elementary method for the evaluation of flow curve. Chemical Engineering Science 33, 1978, 759-763.
26 Giesekus H, Langer G. Die Bestimmung der wahren Fließkurven nicht-Newtonischen
Flüssigkeiten und plastischen Stoffe mit der Methode der repräsentativen Viskosität. Rheologica Acta, 16, 1977, 1-22.
27 Padmanabhan M, Bhattacharya M. In-line measurement of rheological properties of polymer melts. Rheologica Acta 33, 1994, 71-87.
28 Bariani PF, Salvador M, Lucchetta G. Development of test method for the rheological characterization of polymers under the injection molding process conditions. Journal of Materials Processing Technology 191, 2007, 119-122.
29 Qin X, Thompson MR, Hrymak A. Rheology studies of polyethylene/ chemical blowing agent solutions within an injection molding machine. Polymer Engineering and Science 45, 2005, 1108-1118.
30 Gornik C. Determining rheological data directly at the machine. Kunststoffe Plast Europe 4, 2005, 88-92.
31 Kelly AL, Gough T, Whiteside BR, Coates PD. High shear strain rate rheometry of polymer melts. Journal of Applied Polymer Science 114, 2009, 864-873.
32 Haddout A, Villoutreix G. Polymer melt rheology at high shear rates. International Polymer Processing XV(3), 2000, 291-296.
33 Benhadou M, Haddout A. Injection of polypropylene reinforced with short glass fibers: Rheological behavior. Journal of Reinforced Plastics and Composites 26(13), 2007, 1357-1366.
34 Mobuchon C, Carreau PJ, Heuzey M-C, Sepehr M. Shear and extensional properties of short glass fiber reinforced polypropylene. Polymer composites, 2005, 247-264.
35 Sentmanat M. Miniature universal testing platform: from extensional melt rheology to solid-
state deformation behavior. Rheologica Acta 48, 2004, 657-669.
36 Franck A, The ARES-EVF: Option for measuring extensional viscosity of polymer melts. Available from http://www.tainstruments.com/pdf/literature/APN002_V2_ARES_EVF_to_measure_elongation_v
iscosity.pdf. Accessed 2010 Sept 28.
37 Padmanabhan M, Kasehagen LJ, Macosko C. Transient extensional viscosity from rotational shear rheometer using fiber-windup technique. Journal of Rheology, 40, 1996, 473-481.
38 Svrcinova P, Kharlamov A, Filip P. On the measurement of elongational viscosity of polyethylene materials. Acta Technica 54, 2009, 49-67.
39 Soulages JM, McKinley GH, Hall NR, Magee KS, Chamitoff GE, Fincke ME. Characterization of
dilute polymer solution following preshear in microgravity. Society of Rheology Annual Meeting 2009, Madison, WI, USA, Book of Abstracts, 75.

8/12/2019 Rheological Characterization of Polymer Melts in Shear and Extension
http://slidepdf.com/reader/full/rheological-characterization-of-polymer-melts-in-shear-and-extension 65/67
52
40 SER universal testing platform. Available from http://www.xpansioninstruments.com/images/SER2_Literature.pdf. Accessed 2010 Dec 07
41 Lyhne A, Rasmussen HK, Hassager O. Simulation of elastic rupture in extension of entangled monodisperse polymer melts. Physics Review Letters 102, 2009, 138301-1 1383101- 4.
42 Meissner J, HostettlerJ. new elongational rheometer for polymer melts and other highly viscoelastic liquids. Rheologica Acta 33, 1994, 1-21.
43 Münstedt H. New universal extensional rheometer for polymer melts. Measurements on polystyrene sample. Journal of Rheology, 23, 1979, 421-436.
44 Bach A, Rasmussen HK, Hassager O. Extensional viscosity for polymer melts measured in the filament stretching rheometer. Journal of Rheology 47, 2003, 429-441.
45 Meissner J. Dehnunhgsverhalten von Polyetylen-Schmelzen. Rheologica Acta 10,1971, 230-240.
46 Tsenoglou CJ, Voyiatzis E, Gotsis AD. Simple constitutive modeling of nonlinear viscoelasticity under general extension. Journal of non-Newtonian Fluid Mechanics 138, 2006, 33-43.
47 Wagner MH, Bernnat A. The rheology of the Rheotens test. Journal of Rheology 42, 1998, 917-
928. 48 Kaschta J, Münstedt H. Measuring the elongational properties of polymer melts simple task? Conference proceedings The XVth International Congress on Rheology, 2008, 1105-1107.
49 Rides M, Allen CRG, Chakravorty S. Intercomparison of extensional flow characterization techniques for polymer melts: tensile stretching and converging flow methods. Report CMMT(A)171, Centre for Material Measurement and Technology, National Physics Laboratory, Teddington, Middlesex, UK, 1999.
50 Rides M. Draft ISO Standard for the determination of the transient extensional viscosity of polymer melts. Report CMMT(A)248, Centre for Material Measurement and Technology, National Physics Laboratory, Teddington, Middlesex, UK, 2000.
51 Kalika DS, Nuel L, Denn MM. Gap-dependence of the viscosity of thermotropic liquid crystalline copolymer. Journal of Rheology 33, 1989, 1059-1070.
52 Rosato DV, Rosato DV, Rosato MG, Eds. Injection molding handbook. 3rd Ed. Dordrecht: Kluwer Academic Publishers; 2000. 1485 p.
53 Mitsoulis E. Effect of viscoelasticity in fountain flow of polyethylene melts. International Polymer Processing XXIV(5), 2009, 439-451.
54 Mnekbi C, Vincent M, Agassant JF. Polymer rheology at high shear rate for microinjection moulding. International Journal of Material Forming, 3, 2010, 539-542.
55 Kelly AL, Gough T, Whiteside BR, Coates PD. High shear strain rate rheometry of polymer melts. Journal of Applied Polymer Science 114, 2009, 864-873.
56 Mitsoulis E, Hatzikiriakos SG. Bagley correction: the effect of contraction angle and its
prediction. Rheologica Acta, 42, 2003, 309-320.
57 Binding DM, Couch MA, Walters K. The pressure dependence of the shear and elongational properties of polymer melts. Journal of Non-Newtonian Fluid Mechanics, 79, 1998, 137-155.
58 Kennedy PK. Practical and scientific aspects of injection molding simulation. PhD Thesis, Technishe Universiteit Eindhoven, The Netherlands, 2008.
59 Osswald T, Hernández-Ortiz JP. Polymer processing Modeling and simulation. Munich; Carl Hanser Verlag, 2009, 606 p.
60 Cardozo D. brief history of the filling simulation of injection moulding. Journal of Mechanical Engineering Science, 223, 2009, 711-721.
61 Hieber CA, Shen SF. finite element/ finite difference simulation of the injection-molding
filling process. Journal of Non-Newtonian Fluid Mechanics 7, 1980, 1-32.

8/12/2019 Rheological Characterization of Polymer Melts in Shear and Extension
http://slidepdf.com/reader/full/rheological-characterization-of-polymer-melts-in-shear-and-extension 66/67
53
62 Ray S. three-dimensional flow simulation using viscoelastic constitutive equation and segregated finite element scheme. PhD Thesis, Swinburne University of Technology, Australia, 2000.
63 Papathanasiou TD, Kamal MR. Filling of complex-shaped mold with viscoelastic polymer.
Part I: The mathematical model. Polymer Engineering and Science, 33(7), 1993, 410-417. 64 Kamal MR, Papathanasiou TD. Filling of complex-shaped mold with viscoelastic polymer. Part II: Comparison with experimental data. Polymer Engineering and Science, 33(7), 1993, 400-409.
65 Bogaerds ACB, Hulsen MA, Peters GWM, Baaijens PT. Stability analysis of injection molding flows. Journal of Rheology, 48(4), 2004, 765-785.
66 Kwon K, Isayev AI, Kim KH. Toward viscoelastic modeling of anisotropic shrinkage in injection molding of amorphous polymers. Journal of Applied Polymer Science, 98, 2005, 2300-2313.
67 Cao W, Shen C, Zhang C, Wang L. Computing flow-induced stresses of injection molding based on the Phan-Thien-Tanner model. Archives of Applied Mechanics, 78, 2008, 363-377.
68 Brincat P, Talwar K, Friedl C. Extensional viscosity modeling for injection molding simulation. Journal of Reinforced Plastics and Composites 18(6), 1999, 499-507.
69 Speight RG, Costa F, Kennedy PK, Friedl C. Best practice for benchmarking injection molding simulation. Plastics Rubbers and Composites 37, 2008, 124-130.
70 Sherbelis G, Friedl C. The importance if pressure dependent viscosity and contraction pressure losses to injection molding CAE analysis. SPE ANTEC Technical Papers, 1996, 778-782.
71 Cadmould 3D-F product information. Available from http://www.simcon-worldwide.com/pages/en/products/cadmould.php. Accessed 2010 Aug 25.
72 Autodesk Moldflow Insight product information. Available from http://usa.autodesk.com/adsk/servlet/pc/index?id=12269104&siteID=123112. Accessed 2010
Aug 25. 73 Huilier DFG. Modeling of injection mold post-filling: review and some critical problems to solve. Journal of Polymer Engineering, 9(4), 1990, 237-302.
74 Gupta M. Estimation of elongational viscosity of polymers for from entrance loss data using individual parameter optimization. Advances in Polymer Technology 21(2), 2002, 98-107.
75 Moller JC, Lee D. Verification of extensional viscosity effects in injection mold filling simulation. Polymer Engineering and Science, 42(2), 2002, 307-325.
76 Perera SSN. Sensitivity of viscoelastic melt spinning processes with respect to operating conditions and material constants. Nihon Reoroji Gakkaishi (Journal of the Society of Rheology, Japan) 37(3), 2009, 143-147.
77
Fourné F. Synthetic fibers Machines and equipment, manufacture, properties. Handbook for plant engineering, machine design, and operation. Munich: Hanser Publishers; 1998. 930 p.
78 Ivanov, I, Muke S, Kao N, Bhattacharya SN. Extensional rheology of polypropylene in relation to processing characteristics. International Polymer Processing XIX(1), 2004, 40-46.
79 Lee JS, Jung, HW, Hyun JC. Frequency response of film casting process. Korea-Australia Rheology Journal, 15(2), 2003, 91-96
80 Lee S, Kim BM, Hyun JC. Dichotomous behavior of polymer melts in isothermal melt spinning. Korean Journal of Chemical Engineering 12(3), 1995, 345-351.
81 Laffargue J, Demay Y, Agassant JF. Investigation of polymer stretching instabilities: Application to film blowing, International Polymer Processing XXV(5), 2010, 356-371.
82
Steffl T. Rheological and film blowing properties of various low density polyethylenes and their blends. PhD Thesis, University of Erlangen-Nürnberg, Germany, 2004.

8/12/2019 Rheological Characterization of Polymer Melts in Shear and Extension
http://slidepdf.com/reader/full/rheological-characterization-of-polymer-melts-in-shear-and-extension 67/67
83 Takahashi H, Matsuoka T, Kurauchi T. Rheology of polymer melts in high shear rate. Journal of Applied Polymer Science 30, 1985, 4669-4684.
84 Takahashi H, Matsuoka T, Ohta T, Fukumori K, Kurauchi T, Kamigaito O. Rheological behaviour of SAN/PC blends under extremely high shear rate. Journal of Applied Polymer Science 37, 1989,
1837-1853. 85 Janeschitz-Kriegl H. How to understand nucleation in crystallizing polymer melts under real processing conditions. Colloid and Polymer Science 281, 2003, 1157-1171.
86 Janeschitz-Kriegl H, Eder G, Stadtlbauer M, Ratajski E. thermodynamic frame for the kinetics of polymer crystallization under processing conditions. Monatshefte für Chemie 136, 2005, 1119-1137.
87 Bastian H. Non-linear viscoelasticity of linear and long-chain-branched polymer melts in shear and extensional flows. PhD Thesis, University of Stuttgart, Germany, 2001.
88 Wagner MH, Rubio P, Bastian H. The molecular stress function model for polydisperse polymer melts with dissipation convective constraint release. Journal of Rheology 45, 2001, 1387-1412.
89 Wagner MH, Yamaguchi M, Takahashi M. Quantitative assessment of strain hardening of low-density polyethylene melts by the molecular stress function model. Journal of Rheology, 47, 2003, 779-793.


![RECYCLE OF WASTE FLY ASH: A RHEOLOGICAL ... 6.pdfRecycle of Waste Fly Ash: A Rheological Investigation accurately [15]. However, major problem arises in determining the bob shear rate](https://static.fdocuments.in/doc/165x107/5adae29c7f8b9a53618d3a3a/recycle-of-waste-fly-ash-a-rheological-6pdfrecycle-of-waste-fly-ash-a-rheological.jpg)