Rheological characterisation of biofilms in both linear ...
204
1 Rheological characterisation of biofilms in both linear and nonlinear viscoelastic regimes A thesis submitted to the Faculty of Science, Agriculture and Engineering for the Degree of Doctor of Philosophy by Sam Charlton School of Engineering Newcastle Upon Tyne August, 2019
Transcript of Rheological characterisation of biofilms in both linear ...
1
Rheological characterisation of biofilms in both
linear and nonlinear viscoelastic regimes
A thesis submitted to the Faculty of Science, Agriculture and
Engineering for the Degree of Doctor of Philosophy
by
Sam Charlton
School of Engineering
Newcastle Upon Tyne
August, 2019

i
Abstract
Biofilms are a ubiquitous mode of bacteria proliferation found within aqueous
environments. The structure and architecture that a biofilm self assembles into
confers mechanical resistance against shear forces. A characteristic trait of biofilm is
the production of extra cellular materials which act as the “glue” in the ECM/bacteria
composite. The myriad physical properties of biofilm systems result in highly variable
mechanical properties, which are studied using rheology. Previous studies about
biofilm mechanics were mainly focused on linear viscoelastic regions. However the
linear region is unable to provide information regarding the dynamics of deformation
and structural rearrangement. Probing the biofilm nonlinear viscoelastic regime and
yielding dynamics opens a window to access how the rearrangement behaviour of
the EPS network and bacterium network are impacted by EPS composition and
bacterial network topology.
In addition, to determine the rheological properties of biofilms within the linear
viscoelastic regime using the rotational rheometer, this thesis sheds light on utilising
high fidelity non-linear rheological techniques and advanced imaging techniques to
produce a framework explaining the emergence of characteristic biofilm mechanical
behaviours across an array of species, chemical environments and genetic
mutations. I have demonstrated the applicability of three types of large amplitude
oscillatory shear (LAOS) analysis methodologies to Pseudomonas fluorescens
biofilms and the rheological effects of divalent cations and a chaotropic compound. It
was shown that by increasing ionic concentration the characteristic behaviour
changes from a repulsive glass to an attractive glass. To understand the rheological
and architectural effects of capsular polysaccharide secretion in biofilms, I selected
the bacterium Pantoea sp. I revealed how the secretion of amylovoren and stewartin
causes a characteristic rheological change from viscoelastic liquid to glass and how
this is primarily driven by changes in EPS polymer concentration and packing
fraction. Finally, I investigated the yielding behaviours across a range of bacteria with
different geometries (rods/cocci) and EPS compositions. I identified four different
types of yielding behaviour across the tested bacterial strains and used a range of
rheological and microscopy data to identify the extent of short- and long-range
polymer networks which determine the viscoelastic response of bacterial biofilms.
ii
In summary, this thesis demonstrates how contemporary rheological methods and
soft matter physics can be used in a reductive approach towards linking biofilm
mechanics, microstructure and phenomenology.

iii
Acknowledgements
I have been at Newcastle University for 7 years and during that time I’ve met a wide
range of people who have assisted my personal and professional development.
I would like to thank my supervisor Dr Jinju Chen for her advice and guidance during
my PhD studies. I would also like to thank Dr Saikat Jana who has provided me with
pearls of wisdom and helped formulate my outlook on the research world, as well as
being there as a friend.
I’d like to thank the NUFEB research group for their support and wisdom on all things
biofilm. In particular Prof Tom Curtis, who has provided words of wisdom throughout
my PhD. I’d also like to thank Dr Matthew Brown, Dr Ben Allen and Dan Curtis who
I’ve had the pleasure of working with on a couple of projects which do not feature in
this thesis.
I’ve had the pleasure of working amongst some great fellow PhD candidates in the
Stephenson building; of particular significance are Yunyi Cao, Kegan Bannon and
Babis Tzivelekis.
I’d also like to thank Prof Grant Burgess and Cassie Bakshani for their friendship and
advice. I would like to acknowledge Dr Nick Jakubovic for providing some bacteria
strains.
In addition, I have had the fortune in working with Dr Alex Laude, Dr Rolando
Berlinguer- Palmini and Dr David Bulmer in the Bioimaging unit. I thank them for
helping to fuel my enthusiasm for microscopy techniques.
I would also like to thank EPSRC DTP for my scholarship and funding throughout my
PhD.
Finally, I’d like to thank by family and friends for bearing with me and supporting me
as I have travelled through the inevitable peaks and troughs of PhD life.
iv
Contents
Chapter 1 Introduction ................................................................................................ 1
1.1 Aim and objectives of the project ....................................................................... 3
1.2 Thesis structure ................................................................................................. 3
Chapter 2 Literature review ......................................................................................... 5
2.1 The biofilm lifecycle ........................................................................................... 5
2.2 Biofilm EPS and microstructure ....................................................................... 10
2.3 Typical mechanical characterisation approaches ............................................ 13
2.3.1 Microscale mechanical characterisation techniques ..................................... 14
2.3.2 Macroscale mechanical characterisation techniques .................................... 16
2.4 Fundamental concepts of viscoelasticity.......................................................... 18
2.4.1 Stress relaxation ........................................................................................... 18
2.4.2 Creep ............................................................................................................ 19
2.4.3 Representative mechanical models .............................................................. 19
2.5 Principles of oscillatory shear rheology: data collection and analysis .............. 22
2.5.1 Rheometer nuisance factors ......................................................................... 24
2.5.2 Linear rheology theory .................................................................................. 27
2.5.3 Origins of LAOS ............................................................................................ 28
2.5.4 Analysis of LAOS waveforms – theoretical background ............................... 30
2.5.5 Stress symmetry ........................................................................................... 30
2.5.6 Fundamentals of Ewoldt Chebyshev method ............................................... 32
2.5.7 Series of physical processes ........................................................................ 35
2.5.8 Transient phase angle .................................................................................. 38
2.6 Viscoelastic liquids, glasses and gels .............................................................. 38
2.7 Colloidal polymer gels...................................................................................... 41
2.8 Bacteria used within this thesis ........................................................................ 44
2.8.1 Pseudomonas fluorescens ........................................................................... 44
2.8.2 Pantoea sp. .................................................................................................. 45
v
2.8.3 Neisseria polysaccharea ............................................................................... 46
2.8.4 Streptococcus epidermidis ............................................................................ 46
2.8.5 Comamonas denitrificans .............................................................................. 48
Chapter 3 Rheology of P. fluorescens in different chemical environments ................ 49
3.1 Introduction ...................................................................................................... 49
3.2 Materials and Methods ..................................................................................... 51
3.2.1 Bacterial culture and sample collection ...................................................... 51
3.2.2 Linear rheological measurement ................................................................ 52
3.2.3 Non-linear rheological measurement ......................................................... 52
3.2.4 CLSM of chemically treated P. fluorescens biofilm .................................... 53
3.3 Results ............................................................................................................. 54
3.3.1 Microstructure analysis .............................................................................. 54
3.3.2 Frequency sweeps of the chemically treated P. fluorescens biofilms ........ 56
3.3.3 Chemically treated P. fluorescens biofilms display changes in yielding
behaviour ............................................................................................................ 57
3.3.4 Chemical treatments cause a transition to both nonlinear thickening and
softening behaviours ........................................................................................... 62
3.3.5 Sequence of physical processes analysis .................................................. 66
3.4 Discussion and Conclusions ............................................................................ 70
Chapter 4 Effect of the production of polysaccharides amylovoran and stewartin on
the microstructure and rheology of Pantoea sp... ...................................................... 73
4.1 Introduction ...................................................................................................... 73
4.2 Materials and methods ..................................................................................... 75
4.2.1 Bacteria growth in liquid cultures and agar plates ...................................... 75
4.2.2 Time lapse microscopy .............................................................................. 75
4.2.3 Rheometry ................................................................................................. 76
4.2.4 Packing fraction calculation ....................................................................... 76
4.3 Results ............................................................................................................. 77
4.3.1 Pantoea sp. macrostructure is drastically different to Pantoea sp. UDP .... 77
vi
4.3.2 Agarose pad timelapses reveal different packing structures in Pantoea sp.
and Pantoea sp. UDP ........................................................................................ 77
4.3.3 Packing fraction of Pantoea sp. YR343 can be controlled by mixing
different ratios of Pantoea sp. and Pantoea sp. UDP ......................................... 78
4.3.4 Pantoea WT displays different rheological behaviour to Pantoea UDP ..... 80
4.3.5 Mixtures of Pantoea WT:UDP enable investigation of the transition between
viscoelastic liquid and viscoelastic glass behavior ............................................. 82
4.3.6 Stress strain and creep response of Pantoea. sp mixtures ....................... 84
4.3.7 Increases in UDP concentration reduce the 𝐼3/1 gradient ......................... 86
4.3.8 Intercycle Chebychev method reveals a transition in non-linear thickening
behavior ............................................................................................................. 88
4.3.9 Sequence of physical processes analysis ................................................. 89
4.4 Discussion and conclusions ............................................................................. 92
Chapter 5 Results: Multiplicity of yielding in bacterial biofilms .................................. 98
5.1 Introduction ...................................................................................................... 98
5.2 Materials and methods .................................................................................... 99
5.2.1 Bacterial strain and growth ........................................................................ 99
5.2.2 Non-linear rheology - LAOS ...................................................................... 99
5.2.3 CLSM ...................................................................................................... 100
5.2.4 Image analysis ........................................................................................ 100
5.2.5 C. denitrificans flocculation protocol ........................................................ 100
5.3 Results........................................................................................................... 101
5.3.1 Comamonas denitrificans displays attractive glass/gel rheology ............. 101
5.3.2 Pseudomonas fluorescens displays repulsive glassy rheology ............... 102
5.3.2 Rheology of diplococcus and coccus bacteria ......................................... 103
5.3.3 C. denitrificans and S. epidermidis exhibit two step yielding ................... 105
5.3.4 Two step yielding mechanism depends on the range of EPS network
bonding and bacterium topology ...................................................................... 106
5.3.5 Microstructural analysis of each biofilm ................................................... 111
vii
5.3.6 C. denitrificans forms gel like aggregates in culture ................................. 113
5.4 Discussions and Conclusions......................................................................... 116
Chapter 6 Conclusions and future work................................................................... 119
6.1 Conclusions.................................................................................................... 119
6.2 Future work .................................................................................................... 123
References .............................................................................................................. 126
Appendix ................................................................................................................. 165
A) LAOS data pre-processing script ..................................................................... 165
B) ImageJ preprocessing macroscript .................................................................. 170
C) Matlab quantification – packing fraction from ImageJ processed images ........ 170
D) Comparison of Mexican hat and dilation processing parameters .................... 172
E) Representative image slices of Syto 63 and FX 1-43 channels ....................... 172
F) Pantoea sp. Lissajous Bowditch plots .............................................................. 173
G) Lissajous Bowditch plots of C. denitrificans, S. epidermidis, N. polysaccharea
and P. fluorescens ............................................................................................... 178
viii
List of Figures
Figure 2-1: The biofilm life cycle begins with reversable attachment of planktonic
bacteria to a solid-liquid interface. In this regime bacteria explore the surface through
surface motility and remove attached bacteria are removed by shear forces. In the
next stage strongly attached bacteria switch to the biofilm phenotype and begin to
secrete EPS substances. The secretion of EPS substances and cellular growth leads
to formation of mature biofilm structures such as mushrooms and towers. Dispersion
is the final stage of a biofilm, here bacteria are released due to the self-induced
breakdown of the EPS structure. ............................................................................... 5
Figure 2-2: The morphology and microstructure of biofilm is influenced by a variety of
parameters such as the cellular packing, nutrient conditions, EPS secretion and
bacterium shape. (A) When biofilm growth enters the irreversible attachment stage
the initial bacteria monolayers buckles this causes the verticalization of some
bacteria within the monolayer (red arrow). (B) Deletion of cell-cell attachment proteins
leads to less dense biofilm structures (J Yan et al., 2016). (C) Matured biofilm
morphology is influenced by the nutrients bacteria consume, here Pseudomonas
aeruginosa biofilms produce mushroom features with the addition of sucrose (Xiao et
al., 2017). (D) The volume of secreted EPS has been shown computationally to
induce phase separation in biofilm monolayers (Ghosh et al., 2015). (E) Bacteria cell
shape has been computationally shown to influence the packing and population
distribution within bacterial colonies (Smith et al., 2017). ............................................ 6
Figure 2-3: The EPS matrix has a lower diffusion coefficient in comparison to water
which results in the formation of physicochemical gradients with increasing depth.
Within multispecies biofilms localised gradients can result in the formation of
microenviroments with distinct community compositions. Nutrients absorbed at the
biofilm liquid interface which are consumed by proximate bacteria cause nutrient
gradients, starving deeply imbedded bacteria of resources. The sorption of antibiotic
molecules in the upper portion of the biofilms and slow diffusion through the biofilm
protect bacteria towards the base of the biofilm from antibiotic attack. The gradient is
signified by the transition from dark brown to light brown (Flemming & Wingender,
2010)........................................................................................................................... 8
Figure 2-4: Biofilm mechanically induced detachment and deformation mechanisms
(A) Overview of main deformation mechanisms, each mechanism is dependent upon
the local environmental conditions, rippling, rolling and streaming generally occur
under elevated levels of shear stress. Seeding dispersal is triggered via quorum
ix
sensing (P. Dirckx, Center for Biofilm Engineering, Montana State University, 2003)
(B) P. aeruginosa can form streamers under elevated levels of shear stress
microfluidic chambers, P. aeruginosa streamers show a high content of EPS
substances and eDNA (Drescher et al., 2013) (C) Video images depict the rolling
migration of a Staphlococcus. aureus biofilm, the tether of the structure is pointed out
by the white arrow (Rupp et al., 2005). ........................................................................ 9
Figure 2-5: Schematic of a generic biofilm structure and parameters which are
influence by EPS composition and specific EPS components. The resulting cellular
arrangement and polymer interactions confluent to determine biofilm rheology and
microstructure (Charlton et al., 2019). ....................................................................... 12
Figure 2-6: A variety of multiscale methods can be used to characterise biofilm
rheology. (A) Strain and force sensors are used to measure the yield stress and
moduli of liquid gas interface biofilms (pellicles). Uniaxial tension setups typically
involve custom made growth cells which provide a platform to test agar grown
biofilms. (B) Rheometers are the standard tool used to measure the bulk properties
of agar grown and biofilms grown directly on the rheometer plates. These setups
typically involve the use of parallel plate and cone plate geometries. Rheometers are
also used to measure the interfacial rheology of pellicle biofilms. (C) Microscale
microcantilever methods typically probe agar grown biofilms, this method calculates
stress based upon knowing the spring constant of the cantilever. Cantilever methods
allow increased control in determining the local region which is probed. Microfluidic
chambers are platform to grow and probe submerged biofilms. Mechanical
characterisation is performed using flow rate ramps and imaging the resulting biofilm
deformation. (D) Microrheological techniques include both passive and active
methods which enable highly localised measurements of biofilm rheology. Passive
microrheology is performed using particle tracking, where moduli can be calculated
based upon the mean squared displacement of beads trapped in the biofilm. Active
microrheology includes techniques such as optical and magnetic tweezers which
actively control the movement of embedded beads (Charlton et al., 2019). .............. 13
Figure 2-7: A linear elastic spring element, where 𝜎 is stress, 𝜖 is strain and 𝐺 is the
spring constant. ......................................................................................................... 19
Figure 2-8: A viscous dashpot element, where 𝜎 is stress, 𝜖 is strain and 𝜂 is
viscosity. .................................................................................................................... 20
Figure 2-9: The Maxwell model is composed of a singular spring element with string
constant 𝐺 and singular dashpot element with viscosity 𝜂 in series. The summation of
x
the strain from the spring 𝜖1 and dashpot 𝜖2 equals the overall strain 𝜖 when a stress
𝜎 is applied. .............................................................................................................. 20
Figure 2-10: The Kelvin Voigt model is composed of a spring element with a spring
constant 𝐺 and a dashpot element of viscosity 𝜂 in parallel. The summation of the
stress from the spring 𝜎1 and dashpot 𝜎2 equals the total stress 𝜎 when a strain of 𝜖
is applied. .................................................................................................................. 21
Figure 2-11: A four element Burgers model is composed of a Maxwell element and a
Kelvin-Voigt element in series. Where 𝐺1 and 𝜂1 are the spring constant and
viscosity of the Maxwell element and 𝐺2 and 𝜂1 are the spring constant and viscosity
of the Kelvin Voigt element. The strain of each of these elements when under stress
𝜎 is represented by 휀1, 휀2 and 휀3. ............................................................................. 22
Figure 2-12: Illustrated is a representation of the separate motor transducer (SMT)
and Combined motor transducer (CMT) rheometer configurations. The two featured
rheometer configurations vary primarily by where torque is sensed and applied. In the
SMT configuration the motor and torque transducer are separate, which enables
separate control over each element. Whereas in the CMT system both motor and
transducer are combined. The advantage of the SMT layout is that the effect of
instrument inertia on the measured torque is reduced in comparison to CMT. ......... 24
Figure 2-13: An example frequency sweep of a Pantoea sp. biofilm grown for 48 hr
on an agar plate. The elasticity of the biofilm is represented by G’, the storage
modulus, whilst the viscous behaviour is represented by G’’, the viscous modulus.
The elastic and viscous moduli are in a plateau region until inertia effects begin to
dominate the sample response. The dashed back line signifies the beginning of the
region where instrument inertia torque dominates over sample torque. Within this
region the apparent elastic and viscous moduli increase dramatically which is
unrepresentative of the actual sample’s response. ................................................... 25
Figure 2-14: Schematic of the rheometer filling conditions. Ideally filled samples will
have a contact line with constant contact angle 𝜃 and radius 𝑟. Under-filled and
overfilled samples have a non-equal contact radius and non-equal contact angle.
This leads to the occurrence of surface tension torques, which increase the
measured torque, resulting in an overestimation elasticity and viscosity. ................. 26
Figure 2-15: Generic schematic of an amplitude sweep plot. The red curve denotes
the linear storage moduli G' and the blue line denotes the linear viscous moduli G’’, in
the small amplitude oscillatory shear (SAOS) region both moduli are independent of
strain amplitude. When the linear viscoelastic regime is exceeded both G’ and G’’
xi
become a function of strain amplitude which is defined as the large amplitude
oscillatory shear (LAOS) region. ................................................................................ 28
Figure 2-16: Different types of LAOS stress waveforms with their corresponding
relative phase angle of the third Fourier harmonic for 4 different types of soft and
hard polymer gels. The different waveform shapes correspond to different polymer
microstructures. The plateau waveform was displayed for diblock copolymer gels.
The backward tilted shoulder was displayed for soft gels. The forward tilted shoulder
was displayed for polysaccharides xanthan gum and hyaluronic acid (Roth, 2012). . 29
Figure 2-17: Schematic of the Fernet Serret TNB reference frame. The tangent (T),
normal (N) and binormal (B) are unit vectors used to fully describe the trajectory of a
path through strain 𝛾, strain rate 𝛾 and stress 𝜎 coordinate space. The trajectory is
formed of experimentally acquired discrete data points taken at time 𝑡 in an
oscillation period. The resolution of sampling is dependent upon the rheometer
sampling frequency. .................................................................................................. 37
Figure 2-18: A phase diagram of colloidal phases against interaction potential
(𝑉0𝑘𝐵𝑇) and packing fraction (𝜑). At low packing fractions 𝜑𝑐 and interaction
potential colloids freely move due to thermal brownian motion corresponding to
disordered fluid behaviour (𝛼). At an intermediate packing fraction, below the glass
transition point 𝜑𝑔 particles are increasingly constricted, limiting free motion causing
increases to viscosity (𝛽). Belond the glass transition point particle motion is
suppressed entirly which results in a frustrated state and formation of a glass. The
mechanical properties of glasses are purely due to constriction of nearest
neighbours, known phenomologically as cages and the rearrangment/relaxation of
these cages underflow (𝜖). Increasing the interaction potential of the system results in
the formation of bonded space spanning structures at low packing fractions. This
state is known as gelation, where the attractive interparticle bonds determine the
mechanical response of the system 𝛾2. The space spanning network morphology is
influenced by interaction potential and packing faction. The density of the clusters
and network connectivity reduces with lower interaction potential whilst particle
crowding increases with an increasaing packing fractions (𝛾1 and 𝛿). The mechanical
response of these conformations is a confluence of the interparticle bonding strength
and the constriction of motion within the interparticle cages. Adapted from (Roth,
2012). ........................................................................................................................ 40
Figure 3-1: Representative CLSM images of a single slice of P. fluorescens after 60
mins chemical treatment. Slices were taken 10 µ𝑚 above the coverslip. Urea treated
xii
P. fluorescens displayed a structure which appeared to exhibit increased void regions
in comparison to CaCl2 and FeCl2. The differences between cation treatments CaCl2
and FeCl2 appeared minimal. .................................................................................... 54
Figure 3-2: Packing fraction calculated from CLSM z slices for each chemically
treated P. fluorescens biofilm, cells were stained with cell permeable DNA stain Syto
63. Error bars represent the standard deviation (n=3). ............................................. 55
Figure 3-3: Frequency sweeps of chemically treated P. fluorescens biofilm. 𝜔 = 0.1 –
50 Hz and the strain 𝛾 =1 %. Circular symbols represent the elastic moduli G’,
triangle symbols represent the viscous moduli G’’. The dashed lines signify the
frequency dependence of the control and urea biofilms. The mean of three biological
replicates ± standard deviation is shown. ................................................................. 56
Figure 3-4: Nonlinear parameter ratio of third harmonic to the first. 𝛾 represents
strain. The yellow box denotes the linear viscoelastic region. Inset, is a log-log plot
showing the MAOS region which fell between 𝛾 =1 % and 10 %. The results shown
are the mean ± standard deviation. .......................................................................... 57
Figure 3-5: Amplitude sweeps of DDH2O and Urea treated P. fluorescens biofilm, 𝜔
= 1 Hz, 𝛾 = 0-250 %. The pink dots represent the yielding (crossover) point 𝛾𝐶 of the
biofilm where 𝐺′ > 𝐺′′. Both the Control and Urea treated biofilms exhibit a viscous
overshoot before the crossover point. The mean of three biological replicates ±
standard deviation is shown. ..................................................................................... 58
Figure 3-6: Amplitude sweeps of FeCl2 and CaCl2 treated P. fluorescens biofilm, 𝜔 =
1 Hz, 𝛾 = 0-250 %. The pink dots represent the yielding (crossover) point 𝛾𝐶 of the
biofilm where 𝐺′ > 𝐺′′. The CaCl2 treated biofilm didn’t display an obvious stress
overshoot before the crossover point. Treatment with FeCl2 resulted in an increased
strengthening effect in comparison to CaCl2. The FeCl2 treatment caused the viscous
moduli to drop before the crossover point. The mean of three biological replicates ±
standard deviation is shown. ..................................................................................... 59
Figure 3-7: Plot of Viscous moduli 𝐺′′ normalised by 𝐺′′ from the linear viscoelastic
region. Treatment with urea resulted in a reduced viscous overshoot in comparison to
the control, the stress overshoot peak also occurred at a lower strain. Treatment with
divalent cations eliminated the viscous stress overshoot behaviour. Treatment with
FeCl2 resulted in the appearance of a shouldered decrease in 𝐺′′. CaCl2 treated P.
fluorescens biofilms exhibited behaviour intermediate to the control and FeCl2
treatments. The mean of three biological replicates ± standard deviation is shown. 60
xiii
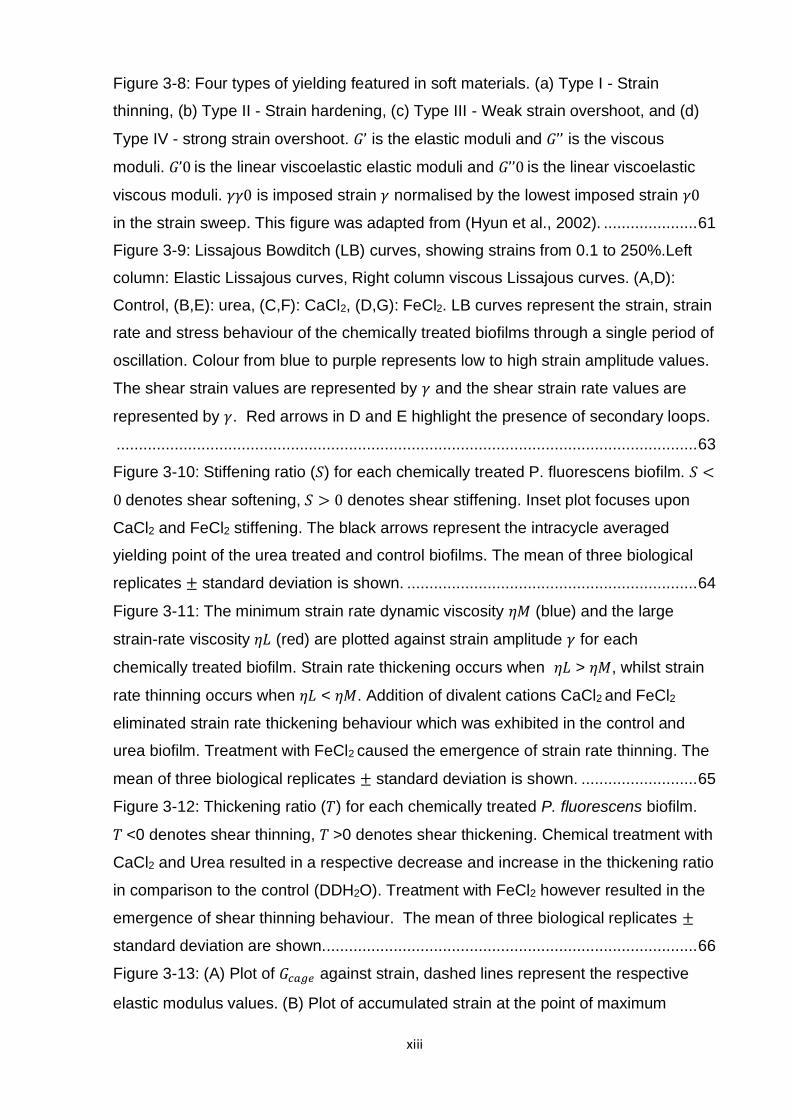
Figure 3-8: Four types of yielding featured in soft materials. (a) Type I - Strain
thinning, (b) Type II - Strain hardening, (c) Type III - Weak strain overshoot, and (d)
Type IV - strong strain overshoot. 𝐺’ is the elastic moduli and 𝐺’’ is the viscous
moduli. 𝐺’0 is the linear viscoelastic elastic moduli and 𝐺’’0 is the linear viscoelastic
viscous moduli. 𝛾𝛾0 is imposed strain 𝛾 normalised by the lowest imposed strain 𝛾0
in the strain sweep. This figure was adapted from (Hyun et al., 2002). ..................... 61
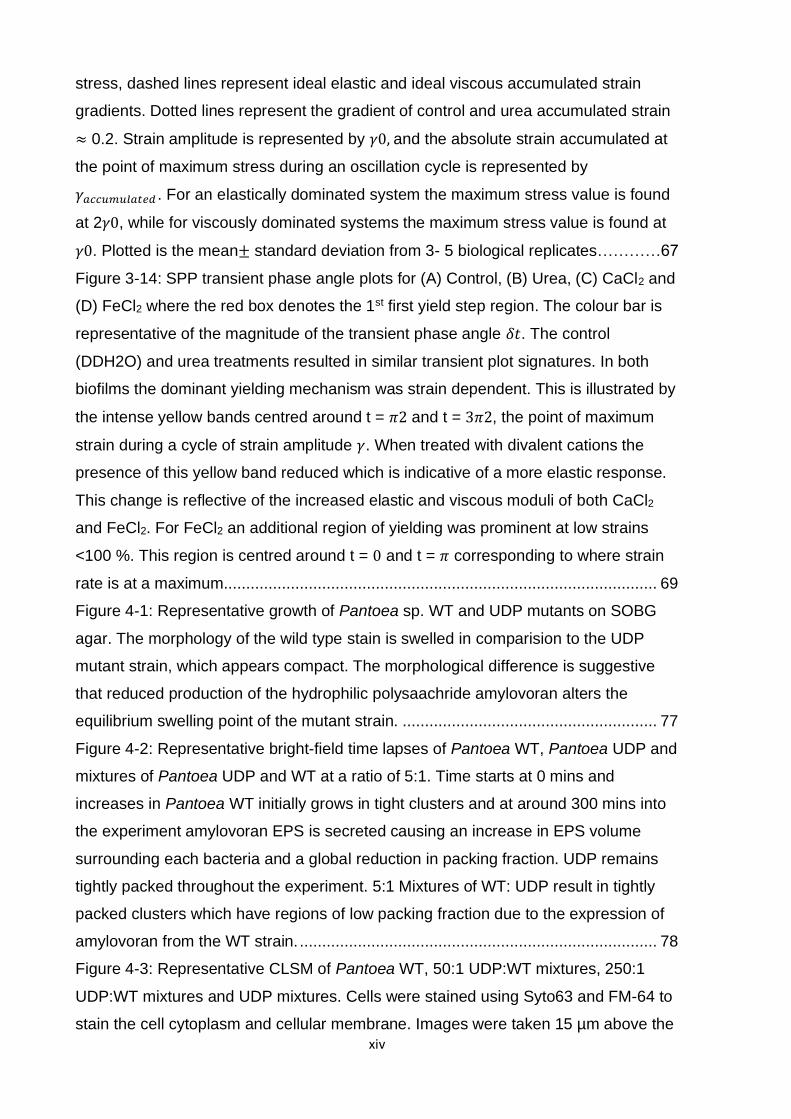
Figure 3-9: Lissajous Bowditch (LB) curves, showing strains from 0.1 to 250%.Left
column: Elastic Lissajous curves, Right column viscous Lissajous curves. (A,D):
Control, (B,E): urea, (C,F): CaCl2, (D,G): FeCl2. LB curves represent the strain, strain
rate and stress behaviour of the chemically treated biofilms through a single period of
oscillation. Colour from blue to purple represents low to high strain amplitude values.
The shear strain values are represented by 𝛾 and the shear strain rate values are
represented by 𝛾. Red arrows in D and E highlight the presence of secondary loops.
.................................................................................................................................. 63
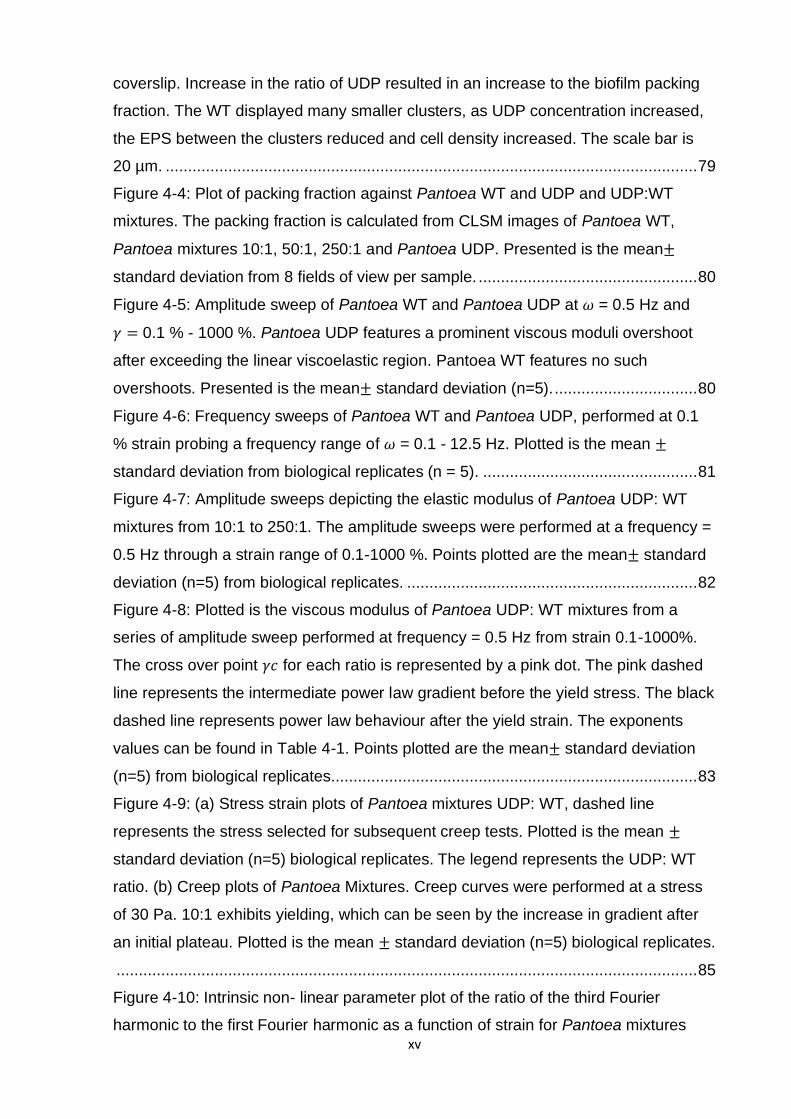
Figure 3-10: Stiffening ratio (𝑆) for each chemically treated P. fluorescens biofilm. 𝑆 <
0 denotes shear softening, 𝑆 > 0 denotes shear stiffening. Inset plot focuses upon
CaCl2 and FeCl2 stiffening. The black arrows represent the intracycle averaged
yielding point of the urea treated and control biofilms. The mean of three biological
replicates ± standard deviation is shown. ................................................................. 64
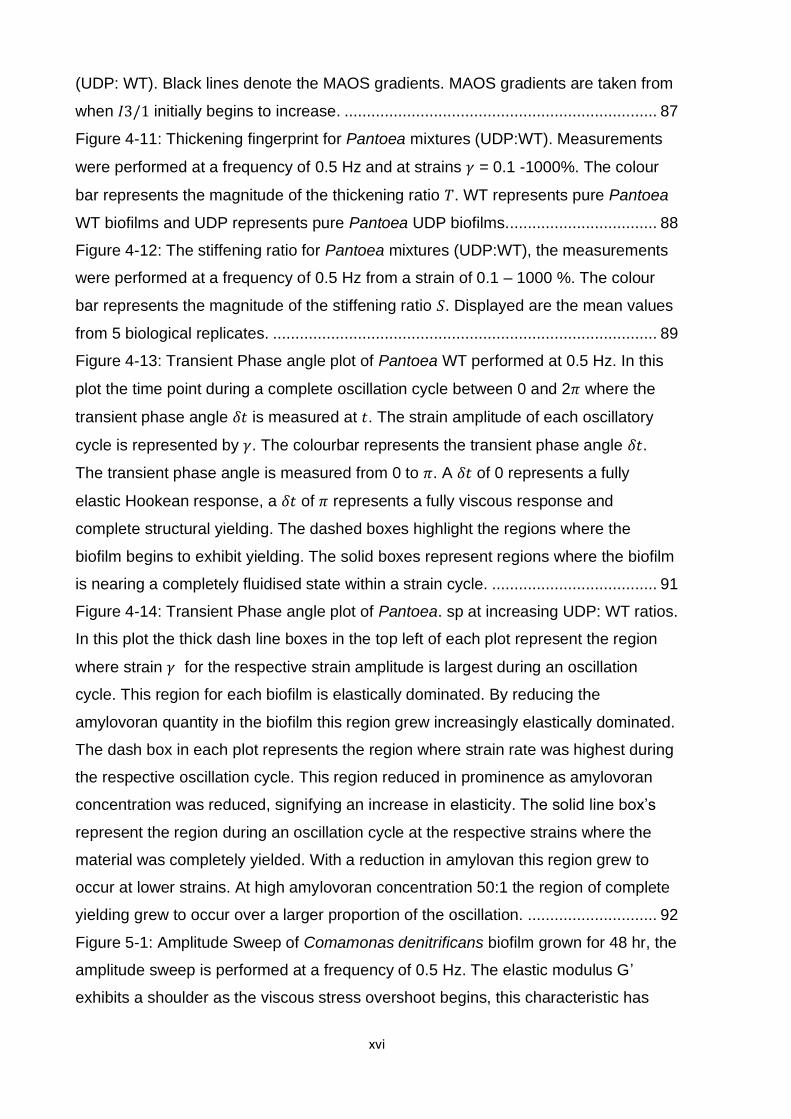
Figure 3-11: The minimum strain rate dynamic viscosity 𝜂𝑀 (blue) and the large
strain-rate viscosity 𝜂𝐿 (red) are plotted against strain amplitude 𝛾 for each
chemically treated biofilm. Strain rate thickening occurs when 𝜂𝐿 > 𝜂𝑀, whilst strain
rate thinning occurs when 𝜂𝐿 < 𝜂𝑀. Addition of divalent cations CaCl2 and FeCl2
eliminated strain rate thickening behaviour which was exhibited in the control and
urea biofilm. Treatment with FeCl2 caused the emergence of strain rate thinning. The
mean of three biological replicates ± standard deviation is shown. .......................... 65
Figure 3-12: Thickening ratio (𝑇) for each chemically treated P. fluorescens biofilm.
𝑇 <0 denotes shear thinning, 𝑇 >0 denotes shear thickening. Chemical treatment with
CaCl2 and Urea resulted in a respective decrease and increase in the thickening ratio
in comparison to the control (DDH2O). Treatment with FeCl2 however resulted in the
emergence of shear thinning behaviour. The mean of three biological replicates ±
standard deviation are shown. ................................................................................... 66
Figure 3-13: (A) Plot of 𝐺𝑐𝑎𝑔𝑒 against strain, dashed lines represent the respective
elastic modulus values. (B) Plot of accumulated strain at the point of maximum
xiv
stress, dashed lines represent ideal elastic and ideal viscous accumulated strain
gradients. Dotted lines represent the gradient of control and urea accumulated strain
≈ 0.2. Strain amplitude is represented by 𝛾0, and the absolute strain accumulated at
the point of maximum stress during an oscillation cycle is represented by
𝛾𝑎𝑐𝑐𝑢𝑚𝑢𝑙𝑎𝑡𝑒𝑑 . For an elastically dominated system the maximum stress value is found
at 2𝛾0, while for viscously dominated systems the maximum stress value is found at
𝛾0. Plotted is the mean± standard deviation from 3- 5 biological replicates…………67
Figure 3-14: SPP transient phase angle plots for (A) Control, (B) Urea, (C) CaCl2 and
(D) FeCl2 where the red box denotes the 1st first yield step region. The colour bar is
representative of the magnitude of the transient phase angle 𝛿𝑡. The control
(DDH2O) and urea treatments resulted in similar transient plot signatures. In both
biofilms the dominant yielding mechanism was strain dependent. This is illustrated by
the intense yellow bands centred around t = 𝜋2 and t = 3𝜋2, the point of maximum
strain during a cycle of strain amplitude 𝛾. When treated with divalent cations the
presence of this yellow band reduced which is indicative of a more elastic response.
This change is reflective of the increased elastic and viscous moduli of both CaCl2
and FeCl2. For FeCl2 an additional region of yielding was prominent at low strains
<100 %. This region is centred around t = 0 and t = 𝜋 corresponding to where strain
rate is at a maximum................................................................................................. 69
Figure 4-1: Representative growth of Pantoea sp. WT and UDP mutants on SOBG
agar. The morphology of the wild type stain is swelled in comparision to the UDP
mutant strain, which appears compact. The morphological difference is suggestive
that reduced production of the hydrophilic polysaachride amylovoran alters the
equilibrium swelling point of the mutant strain. ......................................................... 77
Figure 4-2: Representative bright-field time lapses of Pantoea WT, Pantoea UDP and
mixtures of Pantoea UDP and WT at a ratio of 5:1. Time starts at 0 mins and
increases in Pantoea WT initially grows in tight clusters and at around 300 mins into
the experiment amylovoran EPS is secreted causing an increase in EPS volume
surrounding each bacteria and a global reduction in packing fraction. UDP remains
tightly packed throughout the experiment. 5:1 Mixtures of WT: UDP result in tightly
packed clusters which have regions of low packing fraction due to the expression of
amylovoran from the WT strain. ................................................................................ 78
Figure 4-3: Representative CLSM of Pantoea WT, 50:1 UDP:WT mixtures, 250:1
UDP:WT mixtures and UDP mixtures. Cells were stained using Syto63 and FM-64 to
stain the cell cytoplasm and cellular membrane. Images were taken 15 µm above the
xv
coverslip. Increase in the ratio of UDP resulted in an increase to the biofilm packing
fraction. The WT displayed many smaller clusters, as UDP concentration increased,
the EPS between the clusters reduced and cell density increased. The scale bar is
20 µm. ....................................................................................................................... 79
Figure 4-4: Plot of packing fraction against Pantoea WT and UDP and UDP:WT
mixtures. The packing fraction is calculated from CLSM images of Pantoea WT,
Pantoea mixtures 10:1, 50:1, 250:1 and Pantoea UDP. Presented is the mean±
standard deviation from 8 fields of view per sample. ................................................. 80
Figure 4-5: Amplitude sweep of Pantoea WT and Pantoea UDP at 𝜔 = 0.5 Hz and
𝛾 = 0.1 % - 1000 %. Pantoea UDP features a prominent viscous moduli overshoot
after exceeding the linear viscoelastic region. Pantoea WT features no such
overshoots. Presented is the mean± standard deviation (n=5). ................................ 80
Figure 4-6: Frequency sweeps of Pantoea WT and Pantoea UDP, performed at 0.1
% strain probing a frequency range of 𝜔 = 0.1 - 12.5 Hz. Plotted is the mean ±
standard deviation from biological replicates (n = 5). ................................................ 81
Figure 4-7: Amplitude sweeps depicting the elastic modulus of Pantoea UDP: WT
mixtures from 10:1 to 250:1. The amplitude sweeps were performed at a frequency =
0.5 Hz through a strain range of 0.1-1000 %. Points plotted are the mean± standard
deviation (n=5) from biological replicates. ................................................................. 82
Figure 4-8: Plotted is the viscous modulus of Pantoea UDP: WT mixtures from a
series of amplitude sweep performed at frequency = 0.5 Hz from strain 0.1-1000%.
The cross over point 𝛾𝑐 for each ratio is represented by a pink dot. The pink dashed
line represents the intermediate power law gradient before the yield stress. The black
dashed line represents power law behaviour after the yield strain. The exponents
values can be found in Table 4-1. Points plotted are the mean± standard deviation
(n=5) from biological replicates.................................................................................. 83
Figure 4-9: (a) Stress strain plots of Pantoea mixtures UDP: WT, dashed line
represents the stress selected for subsequent creep tests. Plotted is the mean ±
standard deviation (n=5) biological replicates. The legend represents the UDP: WT
ratio. (b) Creep plots of Pantoea Mixtures. Creep curves were performed at a stress
of 30 Pa. 10:1 exhibits yielding, which can be seen by the increase in gradient after
an initial plateau. Plotted is the mean ± standard deviation (n=5) biological replicates.
.................................................................................................................................. 85
Figure 4-10: Intrinsic non- linear parameter plot of the ratio of the third Fourier
harmonic to the first Fourier harmonic as a function of strain for Pantoea mixtures
xvi
(UDP: WT). Black lines denote the MAOS gradients. MAOS gradients are taken from
when 𝐼3/1 initially begins to increase. ...................................................................... 87
Figure 4-11: Thickening fingerprint for Pantoea mixtures (UDP:WT). Measurements
were performed at a frequency of 0.5 Hz and at strains 𝛾 = 0.1 -1000%. The colour
bar represents the magnitude of the thickening ratio 𝑇. WT represents pure Pantoea
WT biofilms and UDP represents pure Pantoea UDP biofilms. ................................. 88
Figure 4-12: The stiffening ratio for Pantoea mixtures (UDP:WT), the measurements
were performed at a frequency of 0.5 Hz from a strain of 0.1 – 1000 %. The colour
bar represents the magnitude of the stiffening ratio 𝑆. Displayed are the mean values
from 5 biological replicates. ...................................................................................... 89
Figure 4-13: Transient Phase angle plot of Pantoea WT performed at 0.5 Hz. In this
plot the time point during a complete oscillation cycle between 0 and 2𝜋 where the
transient phase angle 𝛿𝑡 is measured at 𝑡. The strain amplitude of each oscillatory
cycle is represented by 𝛾. The colourbar represents the transient phase angle 𝛿𝑡.
The transient phase angle is measured from 0 to 𝜋. A 𝛿𝑡 of 0 represents a fully
elastic Hookean response, a 𝛿𝑡 of 𝜋 represents a fully viscous response and
complete structural yielding. The dashed boxes highlight the regions where the
biofilm begins to exhibit yielding. The solid boxes represent regions where the biofilm
is nearing a completely fluidised state within a strain cycle. ..................................... 91
Figure 4-14: Transient Phase angle plot of Pantoea. sp at increasing UDP: WT ratios.
In this plot the thick dash line boxes in the top left of each plot represent the region
where strain 𝛾 for the respective strain amplitude is largest during an oscillation
cycle. This region for each biofilm is elastically dominated. By reducing the
amylovoran quantity in the biofilm this region grew increasingly elastically dominated.
The dash box in each plot represents the region where strain rate was highest during
the respective oscillation cycle. This region reduced in prominence as amylovoran
concentration was reduced, signifying an increase in elasticity. The solid line box’s
represent the region during an oscillation cycle at the respective strains where the
material was completely yielded. With a reduction in amylovan this region grew to
occur at lower strains. At high amylovoran concentration 50:1 the region of complete
yielding grew to occur over a larger proportion of the oscillation. ............................. 92
Figure 5-1: Amplitude Sweep of Comamonas denitrificans biofilm grown for 48 hr, the
amplitude sweep is performed at a frequency of 0.5 Hz. The elastic modulus G’
exhibits a shoulder as the viscous stress overshoot begins, this characteristic has
xvii
been seen in attractive colloidal gels. Presented is the mean and standard deviation
from n = 3 biological replicates. ............................................................................... 102
Figure 5-2: Amplitude Sweep of Pseudomonas fluorescens biofilm grown for 48 hr,
the amplitude sweep is performed at a frequency of 0.5 Hz. Presented is the mean
and standard deviation from n = 5 biological replicates. .......................................... 103
Figure 5-3: Amplitude Sweep of Neisseria polysaccharea biofilm grown for 48 hr, the
amplitude sweep is performed at a frequency of 0.5 Hz. Presented is the mean and
standard deviation from n = 5 biological replicates .................................................. 103
Figure 5-4: Amplitude Sweep of Staphylococcus epidermidis biofilm grown for 48 hr,
the amplitude sweep is performed at a frequency of 0.5 Hz. Presented is the mean
and standard deviation from n = 3 biological replicates ........................................... 104
Figure 5-5: (A) Elastic stress vs strain curves for Comamonas denitrificans,
Pseudomonas fluorescens, Staphylococcus epidermidis and Neisseria
polysaccharea. The black labelled arrows denote the yielding points of each biofilm.
(B) Plot of the corresponding phase angles for each biofilm with increasing strain. C.
denitrificans displays a plateau region at intermediate strains. ................................ 105
Figure 5-6: Thickening ratio (T) for tested 48 hr grown biofilms. Black arrows
represent yielding points from stress strain curve for C. denitrificans, pink arrows, S.
epidermidis, green arrows, N. polysaacharea and red arrows P. fluorescens. Dashed
lines signify the first yielding point and solid lines represent the second yielding point.
Presented is the mean± standard deviation from n= 3- 6 biological replicates. ...... 107
Figure 5-7: Gcage plot for each biofilm, C. denitrificans displays a significant drop as
strain increases and converges around the plateau values of S. epidermidis and P.
fluorescens. Shown are the mean± standard deviation from 3- 5 biological repeats.
................................................................................................................................ 108
Figure 5-8: Transient phase angle plots from amplitude sweeps performed at 0.5 Hz
at strain amplitudes ranging from 𝛾 of 0.1 % to 1000%. The instantaneous phase
angle 𝛿𝑡 was continuously measured throughout each amplitude cycle at time 𝑡 (a) C.
denitrificians, the red dashed boxes denote a strain dependent 1st stage yielding
process whilst the cyan boxes denote a strain/strain rate dependent 1st stage yielding
process. The green boxes denote 2nd stage yielding processes (b) S. epidermidis, the
red dashed boxes denote a strain rate dependent 1st stage yielding process whilst
the cyan boxes denote a strain/strain rate dependent 1st stage yielding process. The
green boxes denote a 2nd stage yielding process (c) N. polysaccharea, the red boxes
denote the faint emergence of a 1st stage yielding behaviour. The green boxes
xviii
denote strain/strain rate dependent yielding. (d) P. fluorescens, the green boxes and
red boxes denote strain/strain rate dependent yielding........................................... 110
Figure 5-9: Representative CLSM images of 48 hr agar plate grown biofilms (A) C.
denitrificans a morphology of interwoven filamentous networks with an apparent
nematic ordering and alignment (B) P. fluorescens (C) S. epidermidis (D) N.
polysaccharea, inset depicts the diplococcus shape............................................... 111
Figure 5-10: Calculated packing fraction of each bacterial biofilm. The packing
fraction of the biofilms were broadly comparable. Presented is the mean ± standard
deviation from 8 FOV. ............................................................................................. 112
Figure 5-11: (Top row) Micrographs display a 15 mins timelapse of a concentrated C.
denitrificans culture (OD = 2, 3x concentrated) autoaggregating. After 15 mins a
space spanning network is formed which is composed of clusters connected by
floppy bridges. (Bottom row) A liquid culture of P. fluorescens (OD = 2, 3x
concentrated) does not display autoaggregative behaviour. After 15 mins no space
spanning network is formed, and the cells are homogeneously distributed within the
FOV. ....................................................................................................................... 114
Figure D-1: Plotted is a comparison of image processing parameters used to
calculate the packing fraction of P. fluorescens after chemical treatment with
respective chemicals. Plotted are the three different radius of mexican hat filter (MH)
ranging from radius of 2 to 4 pixels. The same filters where then applied with a
dilation step to account for the cell membrane (dilaition). Pink values are the selected
processing parameters. Plotted are the mean± standard deviation from n = 5 fields of
view taken from z slices from CLSM images. ......................................................... 172
Figure E -1: CLSM depicting the double staining method. This is a representative
image slice of Pantoea sp. UDP (A) Syto 63 which is a cell permeable DNA stain (B)
FX 1-43 which is a cell membrane strain (C) The combined image of intercellular
DNA and the cell membrane……………………………………………………………..172
Figure F-1: Lissajous Bowditch Elastic curves of Pantoea WT. Columns are
increasing left to right in strain, where as rows are increasing bottom to top in
frequency…………………………………………………………………………………..173
Figure F-2: Lissajous Bowditch Viscous curves of Pantoea WT. Columns are
increasing left to right in strain, where as rows are increasing bottom to top in
frequency…………………………………………………………………………………..173
Figure F-3: Lissajous Bowditch Elastic curves of 50:1 UDP:WT. Columns are
increasing left to right in strain, where as rows are increasing bottom to top in
xix
frequency…………………………………………………………………………………..174
Figure F-4: Lissajous Bowditch Viscous curves of 50:1 UDP:WT. Columns are
increasing left to right in strain, where as rows are increasing bottom to top in
frequency…………………………………………………………………………………..174
Figure F-5: Lissajous Bowditch Elastic curves of 100:1 UDP:WT. Columns are
increasing left to right in strain, where as rows are increasing bottom to top in
frequency…………………………………………………………………………………..175
Figure F-6: Lissajous Bowditch Viscous curves of 100:1 UDP:WT. Columns are
increasing left to right in strain, where as rows are increasing bottom to top in
frequency…………………………………………………………………………………..175
Figure F-7: Lissajous Bowditch Elastic curves of 250:1 UDP:WT. Columns are
increasing left to right in strain, where as rows are increasing bottom to top in
frequency…………………………………………………………………………………..176
Figure F-8: Lissajous Bowditch Viscous curves of 250:1 UDP:WT. Columns are
increasing left to right in strain, where as rows are increasing bottom to top in
frequency…………………………………………………………………………………..176
Figure F-9: Lissajous Bowditch Viscous curves of Pantoea UDP. Columns are
increasing left to right in strain, where as rows are increasing bottom to top in
frequency…………………………………………………………………………………..177
Figure F-10: Lissajous Bowditch Elastic curves of Pantoea UDP. Columns are
increasing left to right in strain, where as rows are increasing bottom to top in
frequency…………………………………………………………………………………..177
Figure G-1: Elastic Lissajous Bowditch plots acquired at a frequency of 0.5 Hz (A)
Comamonas denitrificans (B) Pseudomonas fluorescens, (C) Staphylococcus
epidermidis and (D) Neisseria polysaccharea. The strain value starts at 0.1 %
(Green) to 1000 % (Red)…………………………………………………………………178
Figure G-2: Viscous Lissajous Bowditch plots acquired at a frequency of 0.5 Hz (A)
Comamonas denitrificans (B) Pseudomonas fluorescens, (C) Staphylococcus
epidermidis and (D) Neisseria polysaccharea. The strain value starts at 0.1 %
(Green) to 1000 % (Red)…………………………………………………………………178
xx
List of Tables
Table 2-1: Torque, stress and strain conversions for Parallel plate and Cone and
plate rheometer geometries. The angular displacement is 𝜃, 𝜃 is the angular velocity,
𝜂 is the viscosity, 𝑅 is the geometry radius, ℎ is the gap height, 𝛾𝑅 is the strain rate
and 𝜑 is the cone angle. ........................................................................................... 23
Table 3-1: Power Law exponents for each chemically treated biofilm, 𝑛′ is the elastic
power law exponent and 𝑛′ is the viscous power law exponent after the cross over
strain 𝛾𝐶. Measurements are presented as an average ± standard deviation from
three biological replicates. ........................................................................................ 59
Table 4-1: Table of the MAOS and LAOS power law gradients for different ratios of
Pantoea sp. (UDP:WT) . The values in brackets represent the strain range the power
law gradient correspond to. Presented is the mean± standard deviation from 5
biological replicates................................................................................................... 84
Table 4-2: Calculated Burger coefficients from the 4 element Burger model for
Pantoea Mixtures (UDP:WT). 𝐺1 and 𝜂1are the initial short time response elasticity
and viscosity, respectively. 𝐺2 and 𝜂2 are the long time elastic and viscous
responses, respectively. Presented is the mean ± standard deviation (n=5) biological
replicates. ................................................................................................................. 86
Table 5-1: Linear elastic and viscous modulus values, crossover strain and Linear
viscoelastic limit values for each tested biofilm. Presented are mean and standard
deviation from n=3-5 biological replicates ............................................................... 105
Table 5-2: Summary of the length, width and aspect ratio of individual bacteria taken
from 13 replicate CLSM images. Presented is the mean± standard deviation. .. 113
xxi
Nomenclature
𝐴 Spatial coordinate
𝐵 Binormal vector
𝐷 Bacteria diameter
𝐷𝑒 Deborah Number
𝑒𝑛 Elastic Chebychev harmonic
𝐺 Shear modulus
𝐺𝑐𝑎𝑔𝑒 Cage modulus
𝐺1,2 Burger elastic coefficients
𝐺∞ Long term relaxation elastic moduli
𝐺∗ Complex modulus
𝐺𝑛∗ Higher order complex moduli
𝐺′ Elastic modulus
𝐺′′ Viscous modulus
𝐺′′𝑁𝑂𝑅𝑀 Viscous modulus normalized
𝐺𝑛′ Higher order elastic moduli
𝐺n′′ Higher order elastic moduli
𝐺𝑀′ Minimum elastic modulus
𝐺𝐿′ Large strain elastic modulus
𝐺𝑡′ Transient elastic modulus
𝐺𝑡′′ Transient viscous modulus
𝐺𝑡∗ Transient complex modulus
ℎ Height
𝐼31
Intrinsic nonlinearity parameter
𝐽 Compliance
𝑙 Wave propagation length
𝑟 Contact angle radius
𝑅 Cell radius
𝑟𝐿 Localization length
𝑆 Stiffening ratio
xxii
𝑇 Thickening ratio
𝑇𝑛 Chebychev polynomial
𝑡0 Initial time
𝑡 Time
𝜑 Cone angle
𝛾 Shear strain
�� Shear strain rate
𝛾𝐶 Crossover shear strain
𝛿 Phase angle
𝛿𝑡 Transient phase angle
휀 Strain
휀0 Step strain
𝜂 Viscosity
𝜂1,2 Burger viscous coefficients
𝜂𝑀′ Minimum viscous modulus
𝜂𝐿′ Large strain rate modulus
𝜂𝑛′′ Higher order viscosity
𝜂𝑛′ Higher order viscosity
𝜃 Displacement
�� Displacement velocity
𝜆 Relaxation time
𝜆𝑡 Experiment time
𝜎 Stress
𝜎0 Initial stress
𝑣𝑛 Viscous Chebychev harmonic
𝜐′ Elastic modulus power law coefficient
𝜐′′ Viscous modulus power law coefficient
𝜙 Packing fraction
𝜔 Frequency
List of Abbreviations
AFM Atomic force microscope
AU Arbitrary units
C-di-GMP Cyclic diguanylate
xxiii
CLAHE Contrast limited adaptive histogram
equalization
CMT Combined motor transducer
CP Cone and plate
EPS Extracellular polymeric substances
FT Fourier transform
DMA Dynamic mechanical analysers
FOV Fields of view
LAOS Large amplitude oscillatory shear
LB Lissajous Bowditch
LoG Laplacian of Gaussian
LVER Linear viscoelastic region
MAOS Medium amplitude oscillatory shear
MSCRAMM Microbial surface components
recognising adhesive matrix molecules
NMCT Naïve Mode coupling theory
PFS Perfect focus system
PGPR Plant growth promoting rhizobacteria
PP Parallel plate
OCT Optical coherence tomography
SAOS Small amplitude oscillatory shear
SMT Separate motor transducer

1
Chapter 1 Introduction
Bacteria along with archaea are the foundational forms of life (Hug et al., 2016).
Estimated to number in the range of 1030, bacteria play a predominant role in the
global ecosystem (Kallmeyer et al., 2012). Bacteria drive the biogeochemical cycling
of nutrients such as carbon, nitrogen and sulphur (Hofer, 2018; Kuypers et al., 2018).
Bacteria have evolved to thrive in almost all environmental conditions. For example,
extremophiles can survive extremes in temperature, pH and salinity. Until the 1970’s
it was believed that bacteria primarily lived in a planktonic state. However, over the
past few decades this assumption has been replaced by the framework that most
bacteria (40-80%) live communally through symbiotic, antagonistic and consummate
interactions within structures termed biofilms (Donlan, 2002; Flemming & Wuertz,
2019).
The biofilm mode of growth confers bacteria various biological advantages over
planktonic growth: increased resistance to chemical challenges such as antibiotics
(Høiby et al., 2010) and pH fluctuations (Tasaki et al., 2017), closer intracellular
proximity increasing the transfer rate of genetic information through horizontal gene
transfer (Madsen et al., 2012), division of labour strategies (Dragoš, Kiesewalter, et
al., 2018), symbiotic interspecies interactions (M. Cao & Goodrich-Blair, 2017; Meera
et al., 2009), resistance to shear forces (A. Park et al., 2011) and increased
protection from bacteriophage attack (Meera et al., 2009; Vidakovic et al., 2018). The
chemical, biological and physical interactions occurring within a biofilm are complex
and myriad. Therefore, biofilm research requires a multidisciplinary approach to
reveal the rich physical, chemical and biological interactions which govern the biofilm
lifestyle.
Biofilm formation has widespread consequences from both the medical and
environmental perspective. Biofilms are the leading cause of hospital infections and
contribute to antibiotic resistance in harmful pathogens, reducing antibiotic efficacy.
Mutation rates in biofilm bacteria selecting for antibiotic resistance occur at an
increased rate through horizontal gene transfer. Biofilms also cause persistent
infections in burn victims and cystic fibrosis sufferers and are responsible for surgical
site infections and catheter associated urinary tract infections. In the environment
biofilm formation on ship hulls and within pumping systems increases hydrodynamic
drag, resulting in increased carbon emissions and economic expense (Schultz et al.,
2011). Biofilms are also a major cause of corrosion and membrane biofouling in
2
reverse osmosis water treatment (Maddah & Chogle, 2017). Thus, a greater
understanding of biofilm mechanical properties is a necessary in the design and
evaluation of disruption and dispersal strategies, to assist in combatting antibiotic
resistance and reducing global emissions.
An improved understanding of the biofilm lifecycle can be beneficially harnessed and
applied within various industries. For decades biofilm formation has been exploited in
biological wastewater treatment filters to remove excessive nutrients and micro
pollutants. Electroactive biofilms are used within biological fuel cells, taking
advantage of bacterial electrocatalytic reactions to produce electricity (Angelaalincy
et al., 2018). The increasing sophistication and availability of synthetic biology
techniques is now enabling biofilm to be viewed as a programmable material (C.
Zhang et al., 2019). Potential promising applications for biofilm based living materials
include the construction of responsive materials, environmental detoxification and
materials processing (Balasubramanian et al., 2019; Schaffner et al., 2017).
The resistance of a biofilm to physical forces is determined by its architecture and
EPS composition, which are described using rheology (William N. Findley, 1989).
Rheology is the study of how matter deforms and flows and investigates how micro
and macro interactions within material structures influence multiscale mechanical
behaviour (Tanner, 2000). Biofilm rheology is transient and varies from species to
species and with environmental physicochemical conditions. The adaptability of
biofilm rheology to specific environments is increasingly being recognised as a
potential virulence factor for pathogenic biofilms and is one of the governing factors
affecting the stable operation of wastewater treatment filters (Gloag et al., 2018).
Therefore, an understanding of the structure function relationships which govern
biofilm rheology is an important step in understanding how biological function,
physical arrangement and chemical conditions link together to determine the
mechanical properties of a biofilm.
In this project I propose to investigate multiple single species biofilms using
advanced rheological characterisation and mathematical analysis. To better
understand the mechanisms underpinning different rheological properties of biofilms,
the biofilm structures have been studied by high-resolution imaging techniques
(brightfield and confocal laser scanning microscopes). Furthermore, the key
principles of soft matter physics have been adopted to better understand the nature
of different biofilm rheological fingerprints.
3
1.1 Aim and objectives of the project
This project aims to explore biofilm mechanics and structure relationships across a
range of bacterial species and physicochemical environments by using high fidelity
non-linear rheological characterisation and advanced imaging techniques. The
specific objectives are:
• Develop a methodology for testing the rheology of bacterial biofilms with high
fidelity non-linear rheological techniques.
• Study how physicochemical environments affect biofilm rheology.
• Investigate how the secretion of hydrophilic polysaccharides within the
extracellular polymeric substances (EPS) impacts biofilm rheology.
• Explore how different cell morphologies and EPS compositions influence
biofilm rheology and microstructure.
• Determine how the nonlinear rheological behaviour of bacterial biofilms can
be used to characterise the presence of long- and short-range interactions
within a biofilm structure.
1.2 Thesis structure
In order to achieve the aims of this project this thesis is split into seven chapters:
In Chapter 1 a brief introduction to the motivation behind this project is provided. The
aims and objective are also stated.
Chapter 2 provides a comprehensive literature review. It provides background
information into the biofilm lifecycle and provides an overview of the mechanical
interactions involved in biofilm formation. It then moves onto focus on the EPS
matrix. I then describe our current understanding of biofilm rheology and the different
multiscale techniques which can be adopted to study biofilm rheology. Finally, I move
on to explaining the concepts behind linear rheology, rheometers and I provide
mathematical background for the non-linear rheological techniques which will be
used throughout this thesis.
Chapter 3 presents a proof of concept study demonstrating the applicability of
nonlinear rheological techniques towards the characterisation of bacterial biofilms.
This study investigates the rheology of P. fluorescens and effect of chemical
treatment with; urea, CaCl2 and FeCl2. I show that addition of divalent cations causes
4
P. fluorescens to change from a repulsive glassy system to an attractive glassy
system.
In Chapter 4 I investigate the non-linear rheology of Pantoea sp. and Pantoea sp.
UDP, a genetic mutant which has reduced production of amylovaroan and stewartin,
EPS polysaccharides. I show how EPS secretion can drive changes in cellular
packing causing a transition from viscoelastic liquid behaviour to glassy behaviour.
To investigate the effect of EPS volume on biofilm rheology I combine Pantoea sp.
and Pantoea sp. UDP in different ratios to control biofilm packing fraction. This
system is then used to investigate the transitionary regime between viscoelastic
liquid and glassy behaviour.
In Chapter 5 I investigate the rheology of 4 different biofilm forming strains, C.
denitrificans, P. fluorescens, S. epidermidis and N. polysaccharea. I compare the
rheology of rod and cocci strains and show how cocci biofilm strains consistently
exhibit two-step yielding, a property known to occur in attractive glassy materials. I
also investigate the unusual rheology of C. denitrificans, a bacterial strain which
displays short range attractive behaviour and autoaggregates to produce a large
interconnected fractal network.
In Chapter 6 I discuss the findings from this work and position the significance of this
work towards assisting biofilm computational modelling and how rheological finger
printing could be used in the future with genomic sequencing in order to construct a
rheology – genotype database. I also discuss how biofilm non-linear rheology could
be used to assist in the processing of artificial functional biofilm structures and how
bacterial systems be used to answer fundamental soft matter physics questions.
5
Chapter 2 Literature review
2.1 The biofilm lifecycle
For aqueous environments within the natural ecosystem bacteria predominantly exist
as a biofilm, a complex three dimensional structured community of single or multi
species cells bound within a hydrated extra polymeric substance (EPS) secreted by
cells and attached to exposed surfaces (Flemming, 2011). Principally the mechanistic
aspects of biofilm growth can be reduced to four fundamental stages: reversible and
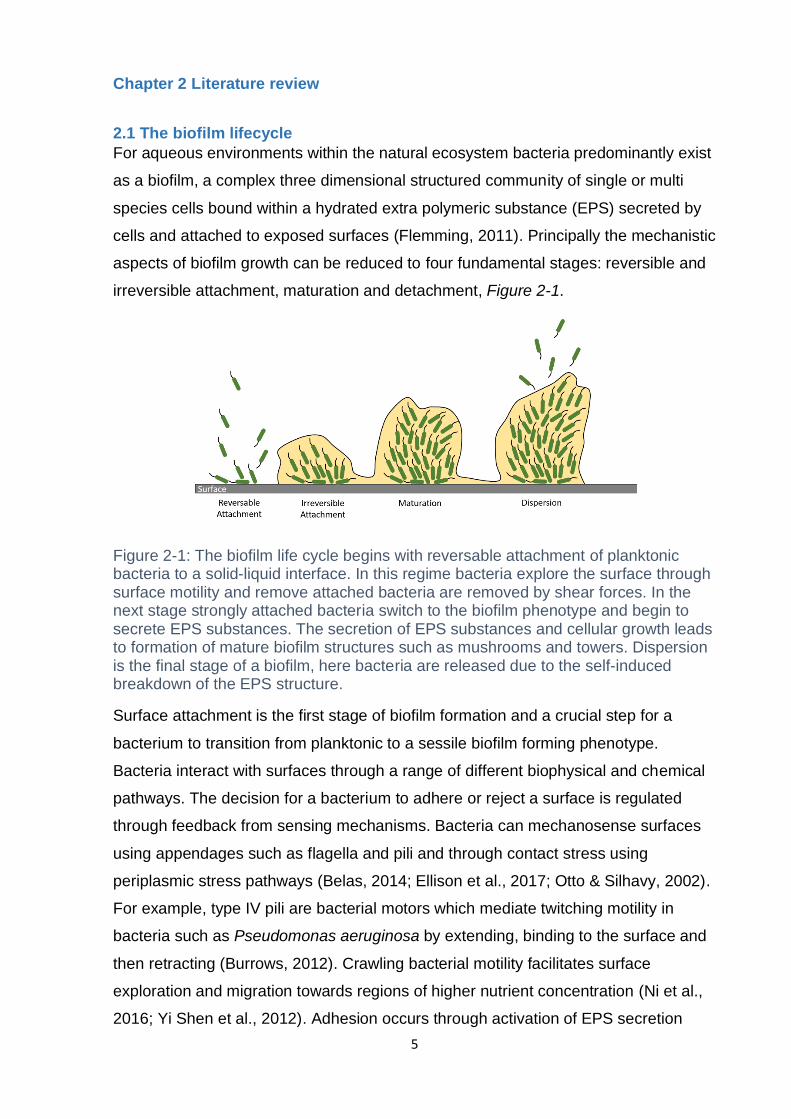
irreversible attachment, maturation and detachment, Figure 2-1.
Figure 2-1: The biofilm life cycle begins with reversable attachment of planktonic bacteria to a solid-liquid interface. In this regime bacteria explore the surface through surface motility and remove attached bacteria are removed by shear forces. In the next stage strongly attached bacteria switch to the biofilm phenotype and begin to secrete EPS substances. The secretion of EPS substances and cellular growth leads to formation of mature biofilm structures such as mushrooms and towers. Dispersion is the final stage of a biofilm, here bacteria are released due to the self-induced breakdown of the EPS structure.
Surface attachment is the first stage of biofilm formation and a crucial step for a
bacterium to transition from planktonic to a sessile biofilm forming phenotype.
Bacteria interact with surfaces through a range of different biophysical and chemical
pathways. The decision for a bacterium to adhere or reject a surface is regulated
through feedback from sensing mechanisms. Bacteria can mechanosense surfaces
using appendages such as flagella and pili and through contact stress using
periplasmic stress pathways (Belas, 2014; Ellison et al., 2017; Otto & Silhavy, 2002).
For example, type IV pili are bacterial motors which mediate twitching motility in
bacteria such as Pseudomonas aeruginosa by extending, binding to the surface and
then retracting (Burrows, 2012). Crawling bacterial motility facilitates surface
exploration and migration towards regions of higher nutrient concentration (Ni et al.,
2016; Yi Shen et al., 2012). Adhesion occurs through activation of EPS secretion
6
pathways which are activated through signalling chemicals, the most widely studied
being cyclic diguanylate (C-di-GMP) (Hengge, 2009). Certain species use EPS
substances, such as eDNA and specific proteins such as Bap (Biofilm associated
protein), to condition surface for attachment (Cucarella et al., 2001; Pakkulnan et al.,
2019). The process of initial adhesion is adaptive. Recent studies have shown how
bacteria sense and adapt to abiotic surfaces, retaining an integrated memory of
previous adhesion events (C. K. Lee et al., 2018). Irreversible attachment occurs
when attached bacteria can no longer be easily removed by shear forces and provide
an initial layer of bacteria conditioning the surface for further aggregation.
Aggregation and attraction of planktonic bacteria is controlled through quorum
sensing; which involves the release of chemical messengers called autoinducers,
creating chemotactic gradients (Humphries et al., 2017; Miller et al., 2002). After
initial colonisation and aggregation, biofilm structures begin to form through a series
of physical interactions mediated by the secretion of EPS. Bacterial colonies display
a wide array or morphologies and arrangements, Figure 2-2. Depending upon the
bacterial strain and environmental conditions, various complex patterned structures
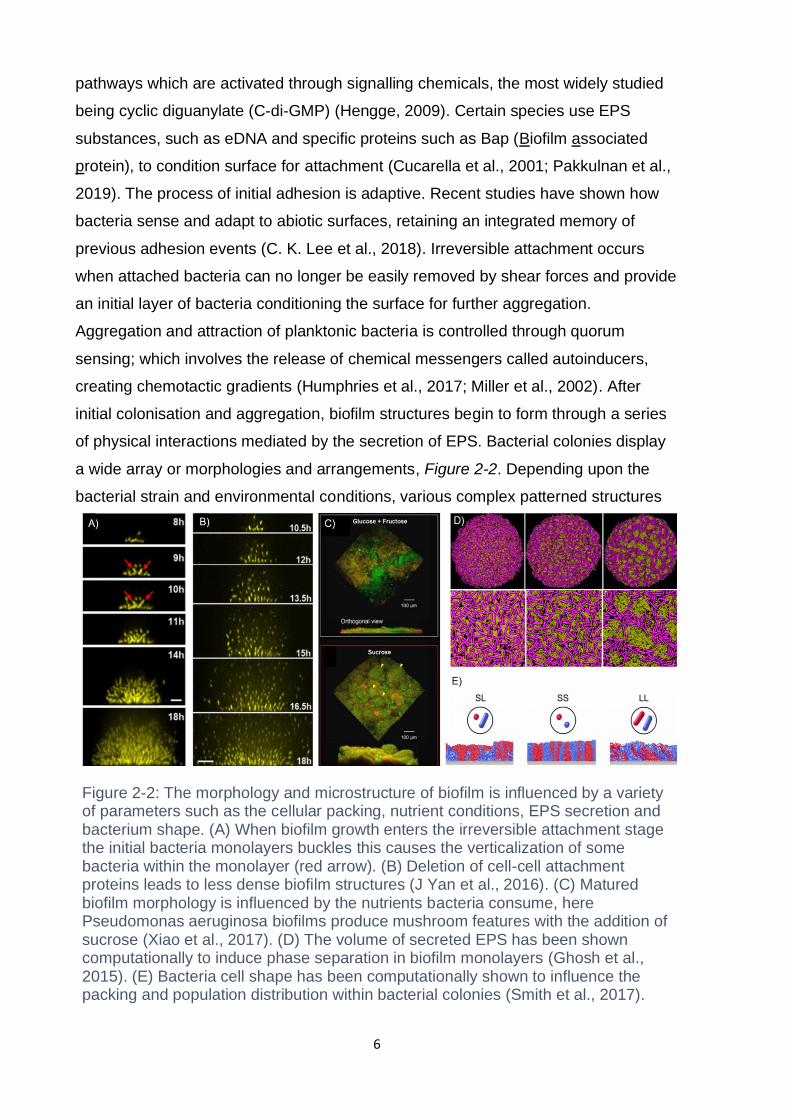
Figure 2-2: The morphology and microstructure of biofilm is influenced by a variety of parameters such as the cellular packing, nutrient conditions, EPS secretion and bacterium shape. (A) When biofilm growth enters the irreversible attachment stage the initial bacteria monolayers buckles this causes the verticalization of some bacteria within the monolayer (red arrow). (B) Deletion of cell-cell attachment proteins leads to less dense biofilm structures (J Yan et al., 2016). (C) Matured biofilm morphology is influenced by the nutrients bacteria consume, here Pseudomonas aeruginosa biofilms produce mushroom features with the addition of sucrose (Xiao et al., 2017). (D) The volume of secreted EPS has been shown computationally to induce phase separation in biofilm monolayers (Ghosh et al., 2015). (E) Bacteria cell shape has been computationally shown to influence the packing and population distribution within bacterial colonies (Smith et al., 2017).
7
can form (Kundukad et al., 2016). During early stage maturation when still only a few
cell layers are attached, colony morphology is driven by mechanical instabilities, such
as buckling, which can result in verticalisation (Beroz et al., 2018). At this early stage,
cell orientations have a reduced nematic order, and preferential patterns can form
due to differences in cell shape and aspect ratio (Boyer, Mather et al. 2011). The
order and orientation of rod-shaped bacteria colonies, for instance, varies as a
function of growth and stage of division. Early cellular organisation is also controlled
via the production of EPS. High levels of non-absorbent EPS increase aggregation
through the depletion interaction resulting in phase separation (Ghosh et al., 2015).
Verticalisation results in cellular alignment as daughter cells orient with mother cells.
This leads to higher cellular packing as the biofilm grows away from the surface
(Drescher et al., 2016). Beside mechanical contact forces, the specific types of EPS
secreted during biofilm formation have a large impact on how bacteria self-assemble,
deletion of cell-cell adhesion proteins can lead to swollen structures with reduced
packing density (Genovese, 2012; J Yan et al., 2016). As the biofilm community
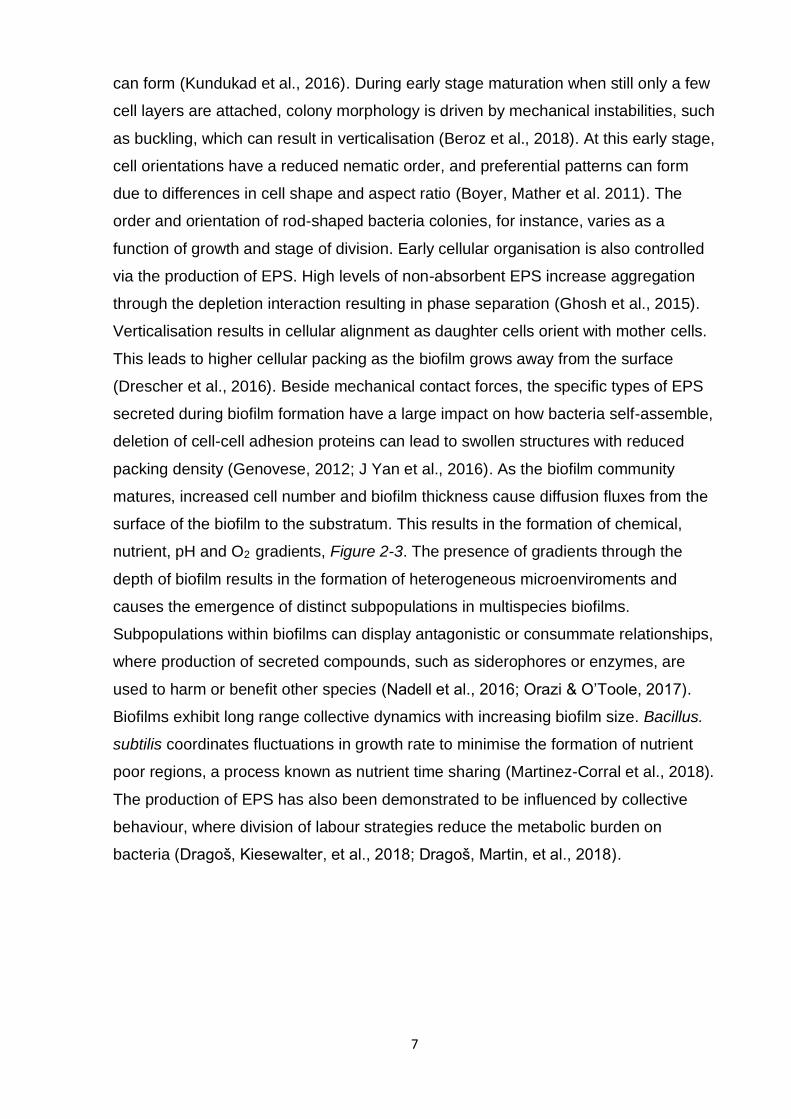
matures, increased cell number and biofilm thickness cause diffusion fluxes from the
surface of the biofilm to the substratum. This results in the formation of chemical,
nutrient, pH and O2 gradients, Figure 2-3. The presence of gradients through the
depth of biofilm results in the formation of heterogeneous microenviroments and
causes the emergence of distinct subpopulations in multispecies biofilms.
Subpopulations within biofilms can display antagonistic or consummate relationships,
where production of secreted compounds, such as siderophores or enzymes, are
used to harm or benefit other species (Nadell et al., 2016; Orazi & O’Toole, 2017).
Biofilms exhibit long range collective dynamics with increasing biofilm size. Bacillus.
subtilis coordinates fluctuations in growth rate to minimise the formation of nutrient
poor regions, a process known as nutrient time sharing (Martinez-Corral et al., 2018).
The production of EPS has also been demonstrated to be influenced by collective
behaviour, where division of labour strategies reduce the metabolic burden on
bacteria (Dragoš, Kiesewalter, et al., 2018; Dragoš, Martin, et al., 2018).

8
Dispersion and detachment are the final process in the biofilm lifecycle. Dispersion is
regulated through several different molecular mechanisms activated in response to
various environmental stimuli. Dispersion can occur in nutrient and O2 depleted
conditions where a transition to the planktonic state enables recolonization in more
favourable regions (Gjermansen et al., 2010; Sauer et al., 2004). Dispersion is also a
reaction to variations in cell density, which can be a major cause of virulence in
pathogenic species (Rutherford & Bassler, 2012). The main molecular mechanisms
currently known to control dispersion relate to quorum sensing pathways and
reductions in concentration of cyclic diguanylate (C- di –GMP), which results in a
reduction in the production of biofilm related matrix polysaccharides (Ha & O’Toole,
2015). To enable biofilm dispersion, bacteria disrupt the extracellular matrix, this is
achieved through the production of various nucleases, glycosides and proteases
(Beenken et al., 2012; Fleming et al., 2017; Mitrofanova et al., 2017). In some cases,
dispersion can be controlled through cell autolysis of bacteria subpopulations
resulting in the formation of cavities which disrupts the biofilm architecture and
provide neighbouring live cells with additional nutrients which may be used for
growth. Autolysis has also been shown to result in increased metabolic activity of
Figure 2-3: The EPS matrix has a lower diffusion coefficient in comparison to water which results in the formation of physicochemical gradients with increasing depth. Within multispecies biofilms localised gradients can result in the formation of microenviroments with distinct community compositions. Nutrients absorbed at the biofilm liquid interface which are consumed by proximate bacteria cause nutrient gradients, starving deeply imbedded bacteria of resources. The sorption of antibiotic molecules in the upper portion of the biofilms and slow diffusion through the biofilm protect bacteria towards the base of the biofilm from antibiotic attack. The gradient is signified by the transition from dark brown to light brown (Flemming & Wingender, 2010).
9
dispersed cells which may confer an advantage upon recolonization (Guilhen et al.,
2016).
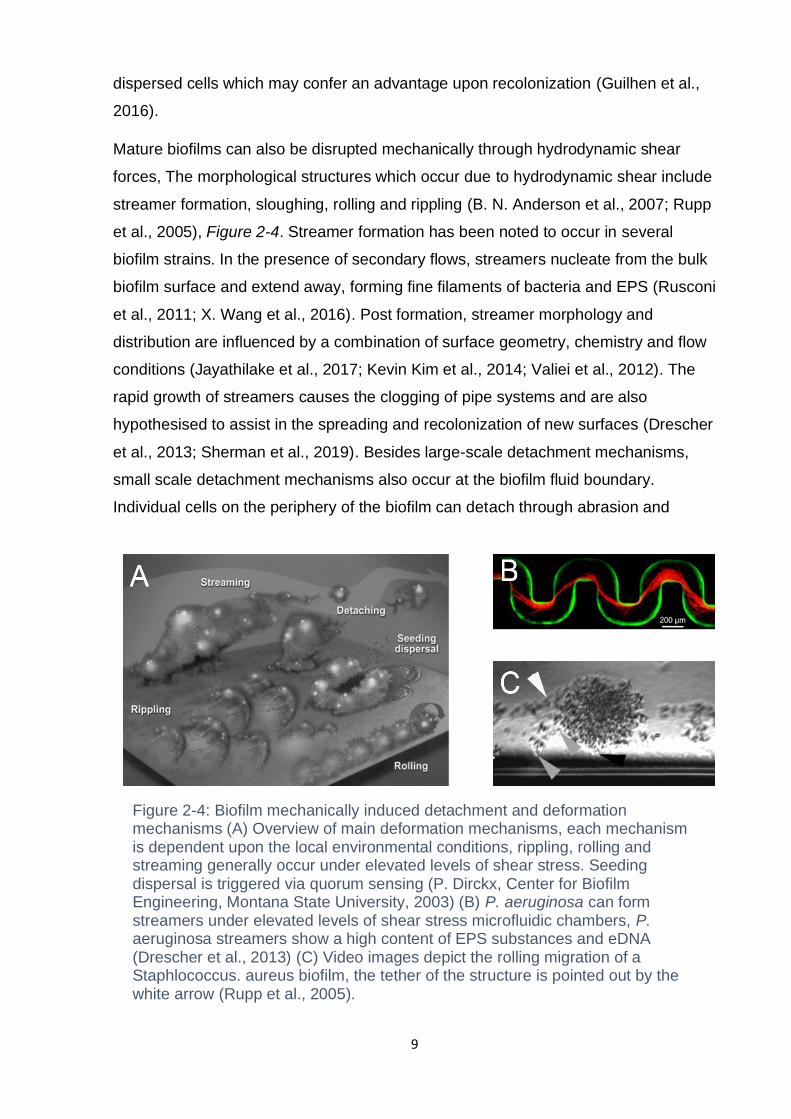
Mature biofilms can also be disrupted mechanically through hydrodynamic shear
forces, The morphological structures which occur due to hydrodynamic shear include
streamer formation, sloughing, rolling and rippling (B. N. Anderson et al., 2007; Rupp
et al., 2005), Figure 2-4. Streamer formation has been noted to occur in several
biofilm strains. In the presence of secondary flows, streamers nucleate from the bulk
biofilm surface and extend away, forming fine filaments of bacteria and EPS (Rusconi
et al., 2011; X. Wang et al., 2016). Post formation, streamer morphology and
distribution are influenced by a combination of surface geometry, chemistry and flow
conditions (Jayathilake et al., 2017; Kevin Kim et al., 2014; Valiei et al., 2012). The
rapid growth of streamers causes the clogging of pipe systems and are also
hypothesised to assist in the spreading and recolonization of new surfaces (Drescher
et al., 2013; Sherman et al., 2019). Besides large-scale detachment mechanisms,
small scale detachment mechanisms also occur at the biofilm fluid boundary.
Individual cells on the periphery of the biofilm can detach through abrasion and
Figure 2-4: Biofilm mechanically induced detachment and deformation mechanisms (A) Overview of main deformation mechanisms, each mechanism is dependent upon the local environmental conditions, rippling, rolling and streaming generally occur under elevated levels of shear stress. Seeding dispersal is triggered via quorum sensing (P. Dirckx, Center for Biofilm Engineering, Montana State University, 2003) (B) P. aeruginosa can form streamers under elevated levels of shear stress microfluidic chambers, P. aeruginosa streamers show a high content of EPS substances and eDNA (Drescher et al., 2013) (C) Video images depict the rolling migration of a Staphlococcus. aureus biofilm, the tether of the structure is pointed out by the white arrow (Rupp et al., 2005).
10
erosion. Abrasion involves the collision of particles in the bulk flow with loosely
adhered cells, which results in detachment (Rochex et al., 2009). Biofilm erosion
occurs when fluid frictional forces detach weakly adhered cells which are not
enmeshed within the EPS matrix (Klotz et al., 2019).
2.2 Biofilm EPS and microstructure
The production of extrapolymeric substance (EPS) is one of the signature features of
the biofilm phenotype. After initial bacterial adhesion, EPS is produced through
cellular metabolic activity signalled by changes to cell membrane stress which is a
function the of adhesion force between the cell and the substrate (Busscher & van
der Mei, 2012). The secretion of EPS modifies the substrate surface chemistry
creating a surface conditioning layer reducing repulsive forces and creating more
favourable hydrophobic conditions (Smith-Palmer et al., 2016). EPS is a biopolymer
composite composed of carbohydrates, proteins, humic substances, lipids, nucleic
acids, and uronic acids. The composition of EPS is highly varied and dependent
upon a wide array of physicochemical and genotypic variables. The EPS matrix is
structured in a series of channels and pores containing water. This keeps the biofilm
hydrated and determines the diffusion rate and transport of nutrients and organic
substances to the encapsulated bacteria (Sutherland, 2001; Wilking et al., 2013). The
structure of these channel networks results in density heterogeneities and affects the
overall viscoelastic properties of the biofilm aggregate (Flemming et al., 2007).
Nutrients diffuse through the matrix from the biofilm/ fluid boundary to the
encapsulated cells fuelling growth. Thick densely populated biofilms experience
oxygen and nutrient starvation (a vital component involved in the respiration of cells)
for cells deep inside the biofilm away from the liquid interface, causing cell lysis in
aerobic bacteria and creating anoxic microenviroments. The EPS structure can be
digested by their own producer cells and other microorganisms when starved (Costa
Oliveira et al., 2017; X. Zhang & Bishop, 2003). Other EPS molecules, such as
phenol-soluble modulins, are influenced post secretion by the presence of eDNA,
which causes a reduction in local pH resulting in an increased rate of amyloid
polymerisation (Schwartz et al., 2016).
Due to heterogeneities in both composition and structure, EPS is amphiphilic. EPS
substances, such as Bap (biofilm associated protein) in Staphylococcus aureus
strains, have been shown to alter cell surface hydrophobicity to improve the
favourability of adhesion and develop stronger bonds with the substrate over time
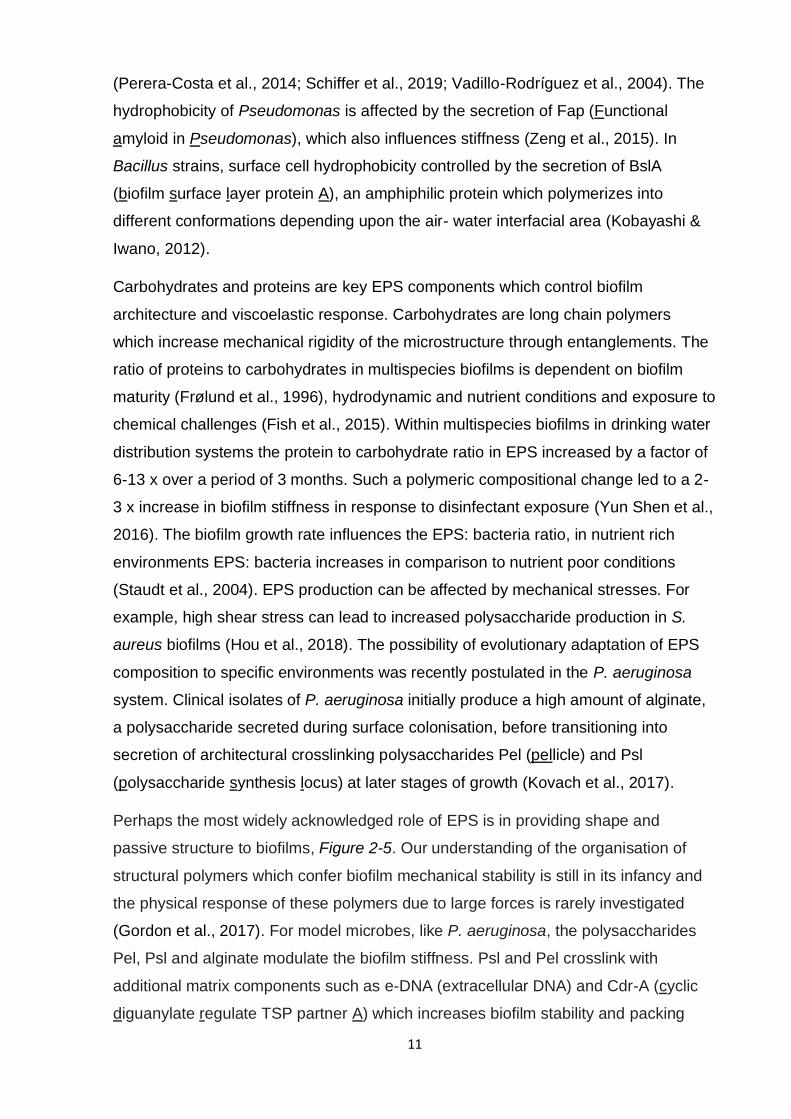
11
(Perera-Costa et al., 2014; Schiffer et al., 2019; Vadillo-Rodrıguez et al., 2004). The
hydrophobicity of Pseudomonas is affected by the secretion of Fap (Functional
amyloid in Pseudomonas), which also influences stiffness (Zeng et al., 2015). In
Bacillus strains, surface cell hydrophobicity controlled by the secretion of BslA
(biofilm surface layer protein A), an amphiphilic protein which polymerizes into
different conformations depending upon the air- water interfacial area (Kobayashi &
Iwano, 2012).
Carbohydrates and proteins are key EPS components which control biofilm
architecture and viscoelastic response. Carbohydrates are long chain polymers
which increase mechanical rigidity of the microstructure through entanglements. The
ratio of proteins to carbohydrates in multispecies biofilms is dependent on biofilm
maturity (Frølund et al., 1996), hydrodynamic and nutrient conditions and exposure to
chemical challenges (Fish et al., 2015). Within multispecies biofilms in drinking water
distribution systems the protein to carbohydrate ratio in EPS increased by a factor of
6-13 x over a period of 3 months. Such a polymeric compositional change led to a 2-
3 x increase in biofilm stiffness in response to disinfectant exposure (Yun Shen et al.,
2016). The biofilm growth rate influences the EPS: bacteria ratio, in nutrient rich
environments EPS: bacteria increases in comparison to nutrient poor conditions
(Staudt et al., 2004). EPS production can be affected by mechanical stresses. For
example, high shear stress can lead to increased polysaccharide production in S.
aureus biofilms (Hou et al., 2018). The possibility of evolutionary adaptation of EPS
composition to specific environments was recently postulated in the P. aeruginosa
system. Clinical isolates of P. aeruginosa initially produce a high amount of alginate,
a polysaccharide secreted during surface colonisation, before transitioning into
secretion of architectural crosslinking polysaccharides Pel (pellicle) and Psl
(polysaccharide synthesis locus) at later stages of growth (Kovach et al., 2017).
Perhaps the most widely acknowledged role of EPS is in providing shape and
passive structure to biofilms, Figure 2-5. Our understanding of the organisation of
structural polymers which confer biofilm mechanical stability is still in its infancy and
the physical response of these polymers due to large forces is rarely investigated
(Gordon et al., 2017). For model microbes, like P. aeruginosa, the polysaccharides
Pel, Psl and alginate modulate the biofilm stiffness. Psl and Pel crosslink with
additional matrix components such as e-DNA (extracellular DNA) and Cdr-A (cyclic
diguanylate regulate TSP partner A) which increases biofilm stability and packing
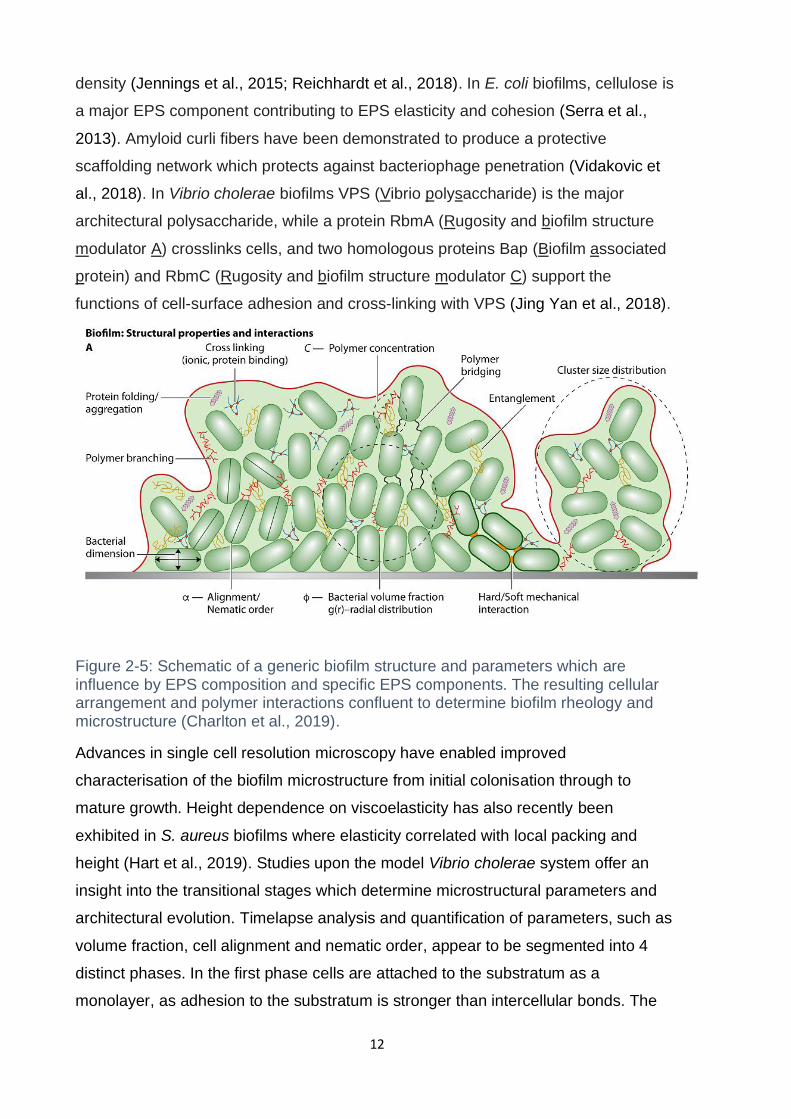
12
density (Jennings et al., 2015; Reichhardt et al., 2018). In E. coli biofilms, cellulose is
a major EPS component contributing to EPS elasticity and cohesion (Serra et al.,
2013). Amyloid curli fibers have been demonstrated to produce a protective
scaffolding network which protects against bacteriophage penetration (Vidakovic et
al., 2018). In Vibrio cholerae biofilms VPS (Vibrio polysaccharide) is the major
architectural polysaccharide, while a protein RbmA (Rugosity and biofilm structure
modulator A) crosslinks cells, and two homologous proteins Bap (Biofilm associated
protein) and RbmC (Rugosity and biofilm structure modulator C) support the
functions of cell-surface adhesion and cross-linking with VPS (Jing Yan et al., 2018).
Figure 2-5: Schematic of a generic biofilm structure and parameters which are influence by EPS composition and specific EPS components. The resulting cellular arrangement and polymer interactions confluent to determine biofilm rheology and microstructure (Charlton et al., 2019).
Advances in single cell resolution microscopy have enabled improved
characterisation of the biofilm microstructure from initial colonisation through to
mature growth. Height dependence on viscoelasticity has also recently been
exhibited in S. aureus biofilms where elasticity correlated with local packing and
height (Hart et al., 2019). Studies upon the model Vibrio cholerae system offer an
insight into the transitional stages which determine microstructural parameters and
architectural evolution. Timelapse analysis and quantification of parameters, such as
volume fraction, cell alignment and nematic order, appear to be segmented into 4
distinct phases. In the first phase cells are attached to the substratum as a
monolayer, as adhesion to the substratum is stronger than intercellular bonds. The
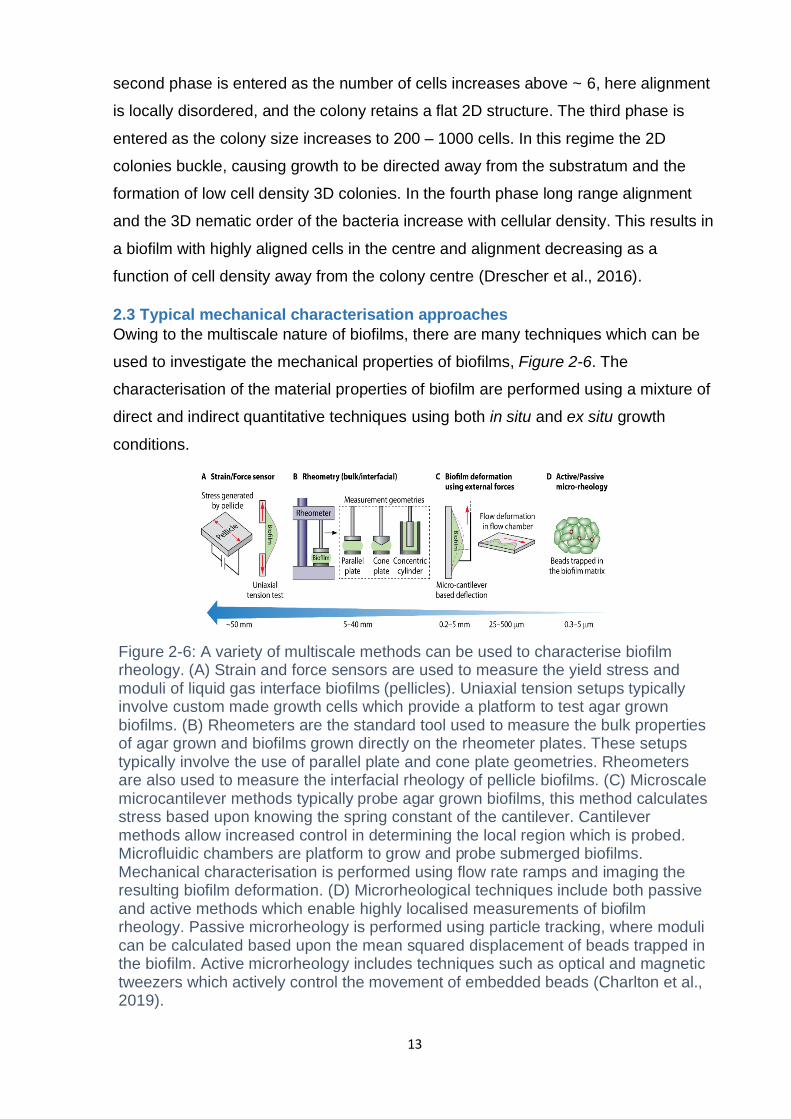
13
second phase is entered as the number of cells increases above ~ 6, here alignment
is locally disordered, and the colony retains a flat 2D structure. The third phase is
entered as the colony size increases to 200 – 1000 cells. In this regime the 2D
colonies buckle, causing growth to be directed away from the substratum and the
formation of low cell density 3D colonies. In the fourth phase long range alignment
and the 3D nematic order of the bacteria increase with cellular density. This results in
a biofilm with highly aligned cells in the centre and alignment decreasing as a
function of cell density away from the colony centre (Drescher et al., 2016).
2.3 Typical mechanical characterisation approaches
Owing to the multiscale nature of biofilms, there are many techniques which can be
used to investigate the mechanical properties of biofilms, Figure 2-6. The
characterisation of the material properties of biofilm are performed using a mixture of
direct and indirect quantitative techniques using both in situ and ex situ growth
conditions.
Figure 2-6: A variety of multiscale methods can be used to characterise biofilm rheology. (A) Strain and force sensors are used to measure the yield stress and moduli of liquid gas interface biofilms (pellicles). Uniaxial tension setups typically involve custom made growth cells which provide a platform to test agar grown biofilms. (B) Rheometers are the standard tool used to measure the bulk properties of agar grown and biofilms grown directly on the rheometer plates. These setups typically involve the use of parallel plate and cone plate geometries. Rheometers are also used to measure the interfacial rheology of pellicle biofilms. (C) Microscale microcantilever methods typically probe agar grown biofilms, this method calculates stress based upon knowing the spring constant of the cantilever. Cantilever methods allow increased control in determining the local region which is probed. Microfluidic chambers are platform to grow and probe submerged biofilms. Mechanical characterisation is performed using flow rate ramps and imaging the resulting biofilm deformation. (D) Microrheological techniques include both passive and active methods which enable highly localised measurements of biofilm rheology. Passive microrheology is performed using particle tracking, where moduli can be calculated based upon the mean squared displacement of beads trapped in the biofilm. Active microrheology includes techniques such as optical and magnetic tweezers which actively control the movement of embedded beads (Charlton et al., 2019).
14
2.3.1 Microscale mechanical characterisation techniques
Direct in situ visualisation of biofilm growth as well as mechanical characterisation is
commonly performed using microfluidics flow cells in combination with high speed
imaging techniques. Biofilm deformation in flow cells is a function of hydrodynamic
shear. Images of biofilm deformation can be captured using a high-speed camera
with conventional brightfield microscopes or at a slower speed using optical
coherence tomography or confocal microscopy (Blauert et al., 2015; Paul Stoodley,
John D. Boyle & Lappin-Scott, 1999; Picioreanu et al., 2018; Rupp et al., 2005). From
these imaging datasets shear strain and shear stress can be calculated using image
analysis, where biofilm deformation is tracked with time, enabling the calculation of
elastic modulus (Mathias & Stoodley, 2009).
Biofilm flow cell experiments have revealed insights into biofilm structural
deformation, biofilm ripple migration (Paul Stoodley, John D. Boyle & Lappin-Scott,
1999; Rupp et al., 2005), detachment (Stoodley et al., 2002; Walter et al., 2013) and
streamer formation (Biswas et al., 2016). The controlled hydrodynamic conditions
within flow cells enables testing of environmental parameters, such as nutrient
concentration, temperature and pH. Flow cells have been used to study the effects of
different chemicals (Eric et al., 2011; Kundukad et al., 2017), ionic concentration
(Paquet-Mercier et al., 2016), turbulence (Teodósio et al., 2011), interactions
between different species (W. Zhang et al., 2013) and the impact of nutrient and
chemical gradients on biofilm morphology (J. L. Song et al., 2014; W. Zhang et al.,
2011). Complex flow cell geometries can be manufactured to study the effects of
hydrodynamics on matrix organisation, colonisation, competition (Aufrecht et al.,
2019; Jing Yan et al., 2017) and have been used to study upstream twitching in
Pseudomonas aeruginosa (Kyrylyuk et al., 2009; Yi Shen et al., 2012).
Microrheology is a commonly used in technique used in combination with microfluidic
flow cells to measure biofilm mechanics and heterogeneity. Microrheological analysis
in combination with confocal laser scanning microscopy enables the correlation of
local mechanics to structural parameters such as the radial distribution function
(Stewart et al., 2013). Microrheological methods are classified as either passive or
active. Passive particle tracking micro-rheology is based upon the Brownian motion
of micro-beads (typically 0.2 – 2 µm diameter). Using the generalised Stokes-Einstein
equation the mean squared displacement of the tracer particles is used to calculate
material compliance. Passive micro-rheology studies of biofilms have revealed how
15
elasticity varies with biofilm height and varies dependent upon morphological
features, such as voids and clusters (H. Cao et al., 2016). Passive microrheology has
also been used to evaluate how growth, shear rate, EPS composition, starvation and
chemicals targeting different components in the EPS matrix modify biofilm
viscoelasticity (Birjiniuk et al., 2014; Chew et al., 2014; Hart et al., 2019; S. S. Rogers
et al., 2008). The predominant active micro-rheological technique applied to biofilms
is magnetic tweezing, where paramagnetic beads are driven by a magnetic actuator.
Magnetic tweezing has been used to assess the effect of shear stress on E. coli
biofilm viscoelasticity during growth (Galy et al., 2012).
Cantilever methods of assessing biofilm mechanics can be performed at both the
microscale and nanoscale. The setup is imaged using a microscope and the
deformation of the cantilever is analysed using video analysis to calculate biofilm
elastic modulus, toughness and failure strain (Aggarwal & Hozalski, 2010). To assess
nanoscale variations in biofilm viscoelasticity and viscoelastic changes with
morphology Atomic force microscopes (AFM) are commonly used. Two approaches
are used with this method, the first involves growing the biofilm directly onto
microbeads which are attached to AFM cantilever tips. The mechanics of the biofilm
are then tested by compressing the biofilm on the surface of the microbead against a
flat surface. This method has been used to measure biofilm elasticity and biofilm
adhesion strength as a function of growth time, loading time, contact time and
retraction velocity (Lau et al., 2009; Ziemba et al., 2016). An alternative method is to
grow the biofilm in a flow chamber, then remove the chamber to allow access for the
AFM cantilever tip or in culture dishes which can be transferred to the AFM stage
(Mosier et al., 2012). This method has been used to measure the variations in elastic
modulus as a function of micro-colony diameter and to evaluate the effect of
oligosaccharides on biofilm elasticity (Kundukad et al., 2016; Powell et al., 2013).
AFM studies have also measured environmental samples, such a drinking water
distribution biofilm, to assess the effect of disinfectant on Young’s modulus and
wastewater biofilms (Safari et al., 2016; Yun Shen et al., 2016). In addition to
mechanical nano-indentation tests, AFM also allows measurement of biofilm
roughness, which has been used to assess the effect of specific EPS components in
B. subtilis (Kesel et al., 2016).
16
2.3.2 Macroscale mechanical characterisation techniques
Macroscale biofilm mechanics can be measured using compression and tensile tests.
Compression tests are generally performed on dynamic mechanical analyzers (DMA)
(Körstgens et al., 2001). Recently however custom glass plunger setups and
compression application using permeate flux have been used in combination with
optical coherence tomography (OCT) devices to image biofilm compression and
recovery (He et al., 2013; Hou et al., 2018). Compression tests are typically used to
measure biofilm viscoelastic properties during creep or stress relaxation. The elastic
and viscous constants can be determined using phenomenological spring dashpot
models (Peterson et al., 2013). This quantitative approach has been used to assess
the effects of nutrient composition and antimicrobial peptides on P. aeruginosa
viscoelasticity and used to determine how polysaccharides, eDNA and water
contributed to the viscoelastic response (Rozenbaum et al., 2019). Compression
tests have also been used to assess the effects of osmotic pressure and sucrose
concentration on the elasticity of Streptococcus mutans biofilms (Rmaile et al., 2013).
To investigate biofilm viscoelastic response to tensile strain, custom setups are
primarily used. Each design shares fundamental similarities. Typically, the biofilm is
grown on an agar surface which is poured directly into a mould attached to a load
cell. The agar surface is positioned over a microscope setup to visualise deformation,
where particle imaging velocimetry (PIV) can be used to track the deformation field.
Tensile tests have been used to investigate biofilm growth induced compressive
stresses, while PIV analysis enables the visualisation of non-affine deformations
(Hollenbeck et al., 2016). Tensile tests have also revealed strain rate dependence
and provide a suitable platform for assessing the effect of chemical treatment on
tensile stress and rupture energy (Grumbein et al., 2016).
Rheometers are typically favoured for biofilm macroscale analysis. Rheometers
enable direct measurement of viscoelastic material parameters through application of
rotational oscillatory shear tests, stress relaxation and creep tests. (Houari et al.,
2008; Pavlovsky et al., 2013; Vinogradov et al., 2004). The study of biofilm
mechanics via rheometers is predominantly performed using three methods:
1) In situ interfacial rheology, where biofilm pellicles are grown at the liquid gas
interface.
17
2) In situ grown biofilms, where a growth reactor is integrated onto a rheometer or
biofilm is grown on filter paper on an agar pad and then transferred to a rheometer.
3) Ex situ growth on agar plates and transferred to the rheometer via scrapping.
The interfacial rheology method allows the growth conditions of the biofilm to be
altered while simultaneously measuring the changes to elastic and viscous modulus
of the biofilm surface. The effects of pH, nutrient concentration and surfactants on
biofilm viscoelasticity have been investigated using this method (P A Rühs et al.,
2014; Patrick A Rühs et al., 2013; Wu et al., 2012). More recently interfacial rheology
was chosen to access the competition between cocultures of Bacillus licheniformis
and Pseudomonas fluorescens over a period of 48 hrs (Abriat et al., 2019).
In situ biofilm reactors enable biofilm to be grown directly onto the rheometer
geometries. Typically, agarose pads are directly attached to the bottom rheometer
plate, with inlet and outlet tubing to provide nutrients or alter environmental
parameters, such as pH. This method enables in situ biofilm growth in direct contact
with rheometer plates where temperature is controlled using a Peltier plate. In situ
reactors have been used to reveal the effect of temperature and salt concentration on
the elastic stiffness of S. epidermidis biofilms (Pavlovsky et al., 2013, 2015) and to
assess the effect of sucrose concentration on S. mutans (Waters et al., 2014). An
unanswered element of these agarose pad experiments is the question of separating
the viscoelastic contributions of the biofilm and agarose pad. However, generally
there’s a large difference between the stiffness of biofilm samples and agar. Another
in situ approach, involved transfer of yeast biofilms grown on a removable disk, which
could be attached to the bottom rheometer plate (Brugnoni et al., 2014).
The most used method for biofilm rheological characterisation using a rheometer is
the ex situ growth and transfer method. Here biofilms are grown ex situ on agar
plates or collected from the study specific environment to be tested ex vivo. This
method is commonly used to assess environmental samples, such as wastewater
biofilms, biofilms from cystic fibrosis patients or contaminant biofilms from food
processing plants (Abbà et al., 2017; Kovach et al., 2017; Meera et al., 2009; Safari
et al., 2014, 2016). For biofilms cultured on agar plates, osmotic pressure and
nutrient composition can be modulated through agar concentration (Daalkhaijav et
al., 2019; Jing Yan et al., 2018). This method has been used extensively to study the
rheology of a wide range of biofilms, such as P. aeruginosa, V. cholera and B. subtilis
18
biofilms (Gloag et al., 2018; Huang et al., 2019; Kesel et al., 2016; Jing Yan et al.,
2018).
As rheology is the primary technique adopted in this study, in the following section, I
focus on rheological concepts which can be measured using a rheometer. It will
cover creep and stress relaxation under shear using the rheometer using both small
and large amplitude measurements.
2.4 Fundamental concepts of viscoelasticity
The recalcitrant nature of biofilm to mechanical removal treatments, such as washout
and fluctuating levels of hydrodynamic shear, has been attributed to the viscoelastic
behaviour of the biofilm matrix. Viscoelasticity is a combination of elastic and viscous
behaviour. An elastic material deforms instantaneously to relieve stress and will
reversibly return to its initial state when the force is removed; a viscous material
relieves stress over time by continuous irreversible deformation. Viscoelastic
materials thus exhibit a time dependent relationship between stress, 𝜎 and strain, 휀,
and can be characterised by two material relationships; stress relaxation and creep.
2.4.1 Stress relaxation
Stress relaxation describes the time dependent decrease of stress within a material
when acted upon by a unit step strain 휀0 at time 𝑡0. At 𝑡0 the material is deformed by
the unit step strain and stress increases until it reaches 𝜎0, the maximal stress.
Stress then decays at a rate depending upon the viscoelastic materials stress
relaxation properties until a limiting value (plateau) is reached. Relaxation is
described using the relaxation modulus 𝐺(𝑡). A viscoelastic solid is defined as when
the residual stress remaining within the material is nonzero (𝐺∞ > 0). A viscous fluid
exhibits a residual stress decaying to zero (𝐺∞ = 0). A viscous fluid is able
completely dissipate stress. While a viscoelastic solid may conserve stress.
The rate at which stress decays in a viscoelastic material can be described in terms
of the relaxation time 𝜆. Relaxation time is an estimation of the time taken for a
material to fully relax. Materials with small relaxation times are fluid-like and dissipate
stress quickly, whereas large relaxation times correspond to solid behaviour. The
Deborah number is a dimensionless value used to describe the apparent fluidity of
materials. The Deborah number describes the ratio of relaxation time 𝜆 to the
observation time of an experiment 𝜆𝑡,
𝐷𝑒 = 𝜆
𝜆𝑡 [1]
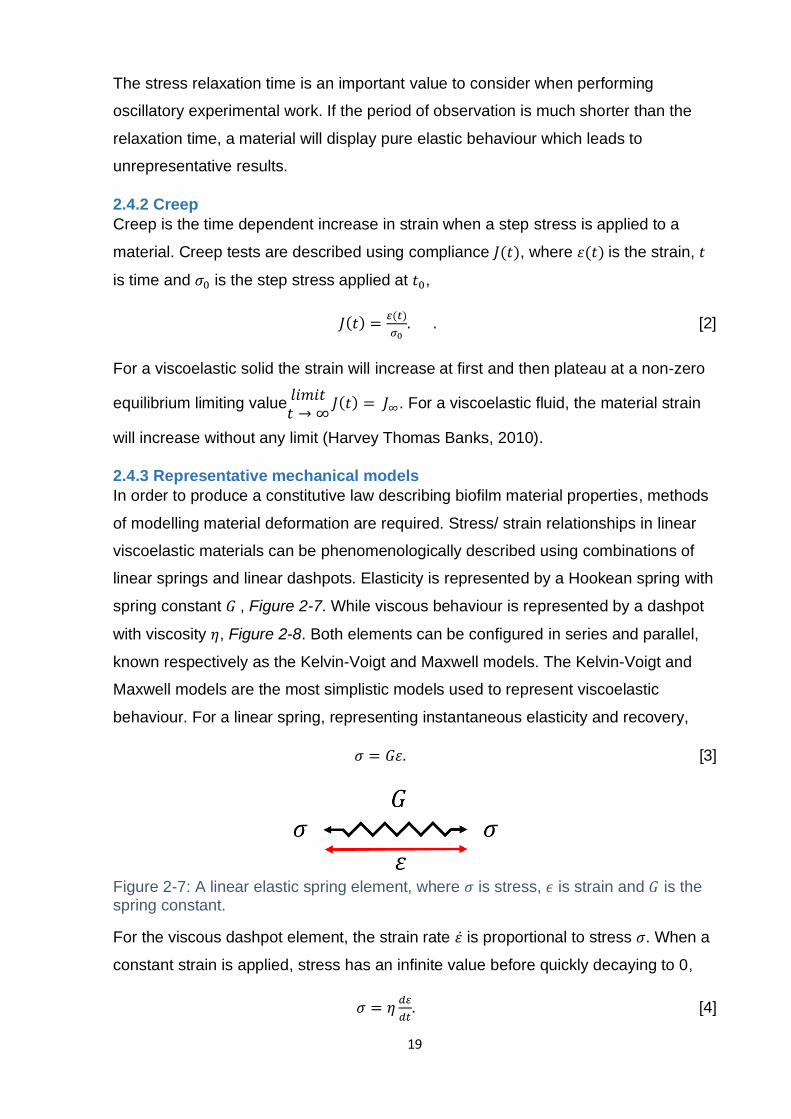
19
The stress relaxation time is an important value to consider when performing
oscillatory experimental work. If the period of observation is much shorter than the
relaxation time, a material will display pure elastic behaviour which leads to
unrepresentative results.
2.4.2 Creep
Creep is the time dependent increase in strain when a step stress is applied to a
material. Creep tests are described using compliance 𝐽(𝑡), where 휀(𝑡) is the strain, 𝑡
is time and 𝜎0 is the step stress applied at 𝑡0,
𝐽(𝑡) =(𝑡)
𝜎0. . [2]
For a viscoelastic solid the strain will increase at first and then plateau at a non-zero
equilibrium limiting value𝑙𝑖𝑚𝑖𝑡𝑡 → ∞
𝐽(𝑡) = 𝐽∞. For a viscoelastic fluid, the material strain
will increase without any limit (Harvey Thomas Banks, 2010).
2.4.3 Representative mechanical models
In order to produce a constitutive law describing biofilm material properties, methods
of modelling material deformation are required. Stress/ strain relationships in linear
viscoelastic materials can be phenomenologically described using combinations of
linear springs and linear dashpots. Elasticity is represented by a Hookean spring with
spring constant 𝐺 , Figure 2-7. While viscous behaviour is represented by a dashpot
with viscosity 𝜂, Figure 2-8. Both elements can be configured in series and parallel,
known respectively as the Kelvin-Voigt and Maxwell models. The Kelvin-Voigt and
Maxwell models are the most simplistic models used to represent viscoelastic
behaviour. For a linear spring, representing instantaneous elasticity and recovery,
𝜎 = 𝐺휀. [3]
Figure 2-7: A linear elastic spring element, where 𝜎 is stress, 𝜖 is strain and 𝐺 is the spring constant.
For the viscous dashpot element, the strain rate 휀 is proportional to stress 𝜎. When a
constant strain is applied, stress has an infinite value before quickly decaying to 0,
𝜎 = 𝜂𝑑
𝑑𝑡. [4]
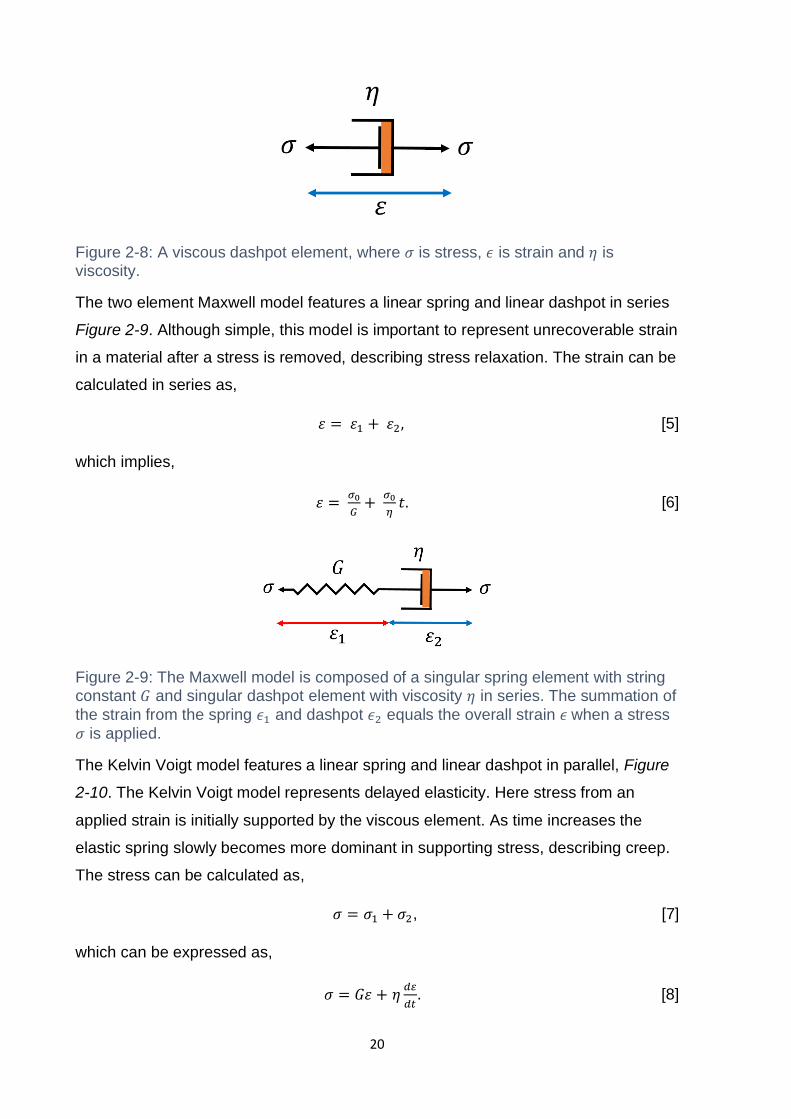
20
Figure 2-8: A viscous dashpot element, where 𝜎 is stress, 𝜖 is strain and 𝜂 is viscosity.
The two element Maxwell model features a linear spring and linear dashpot in series
Figure 2-9. Although simple, this model is important to represent unrecoverable strain
in a material after a stress is removed, describing stress relaxation. The strain can be
calculated in series as,
휀 = 휀1 + 휀2, [5]
which implies,
휀 = 𝜎0
𝐺+
𝜎0
𝜂𝑡. [6]
Figure 2-9: The Maxwell model is composed of a singular spring element with string constant 𝐺 and singular dashpot element with viscosity 𝜂 in series. The summation of
the strain from the spring 𝜖1 and dashpot 𝜖2 equals the overall strain 𝜖 when a stress
𝜎 is applied.
The Kelvin Voigt model features a linear spring and linear dashpot in parallel, Figure
2-10. The Kelvin Voigt model represents delayed elasticity. Here stress from an
applied strain is initially supported by the viscous element. As time increases the
elastic spring slowly becomes more dominant in supporting stress, describing creep.
The stress can be calculated as,
𝜎 = 𝜎1 + 𝜎2, [7]
which can be expressed as,
𝜎 = 𝐺휀 + 𝜂𝑑
𝑑𝑡. [8]
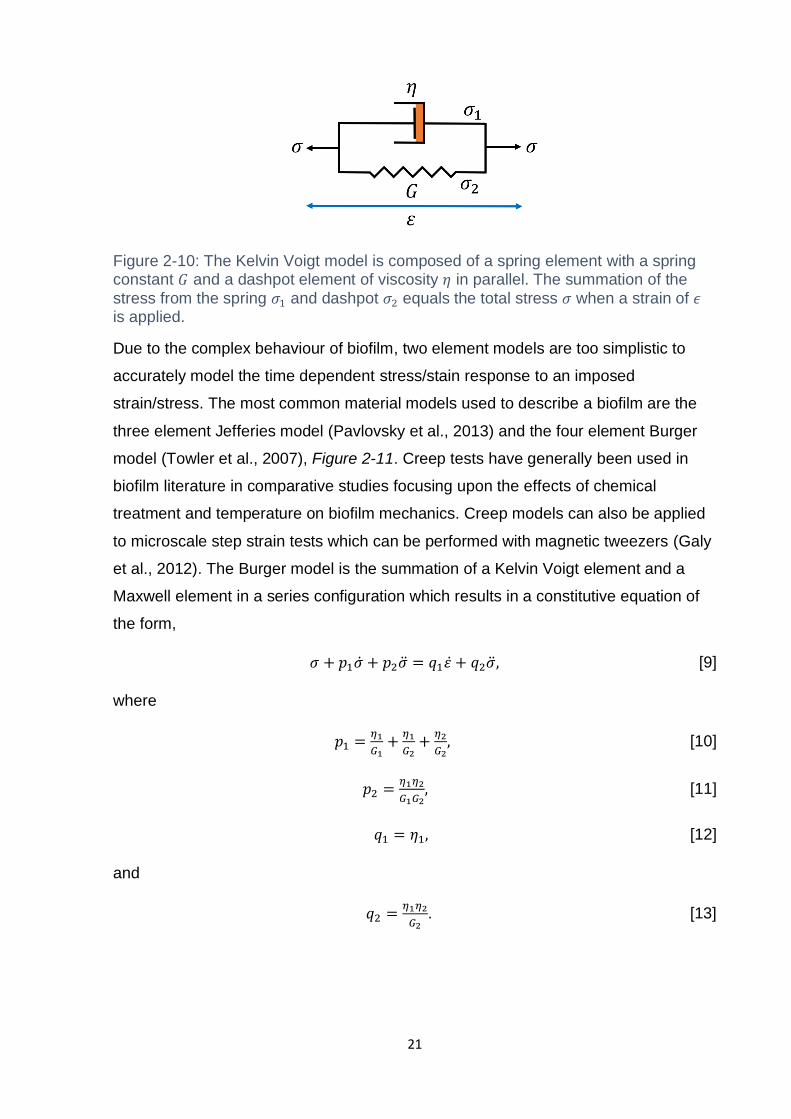
21
Figure 2-10: The Kelvin Voigt model is composed of a spring element with a spring constant 𝐺 and a dashpot element of viscosity 𝜂 in parallel. The summation of the
stress from the spring 𝜎1 and dashpot 𝜎2 equals the total stress 𝜎 when a strain of 𝜖 is applied.
Due to the complex behaviour of biofilm, two element models are too simplistic to
accurately model the time dependent stress/stain response to an imposed
strain/stress. The most common material models used to describe a biofilm are the
three element Jefferies model (Pavlovsky et al., 2013) and the four element Burger
model (Towler et al., 2007), Figure 2-11. Creep tests have generally been used in
biofilm literature in comparative studies focusing upon the effects of chemical
treatment and temperature on biofilm mechanics. Creep models can also be applied
to microscale step strain tests which can be performed with magnetic tweezers (Galy
et al., 2012). The Burger model is the summation of a Kelvin Voigt element and a
Maxwell element in a series configuration which results in a constitutive equation of
the form,
𝜎 + 𝑝1�� + 𝑝2�� = 𝑞1휀 + 𝑞2��, [9]
where
𝑝1 =𝜂1
𝐺1+
𝜂1
𝐺2+
𝜂2
𝐺2, [10]
𝑝2 =𝜂1𝜂2
𝐺1𝐺2, [11]
𝑞1 = 𝜂1, [12]
and
𝑞2 =𝜂1𝜂2
𝐺2. [13]
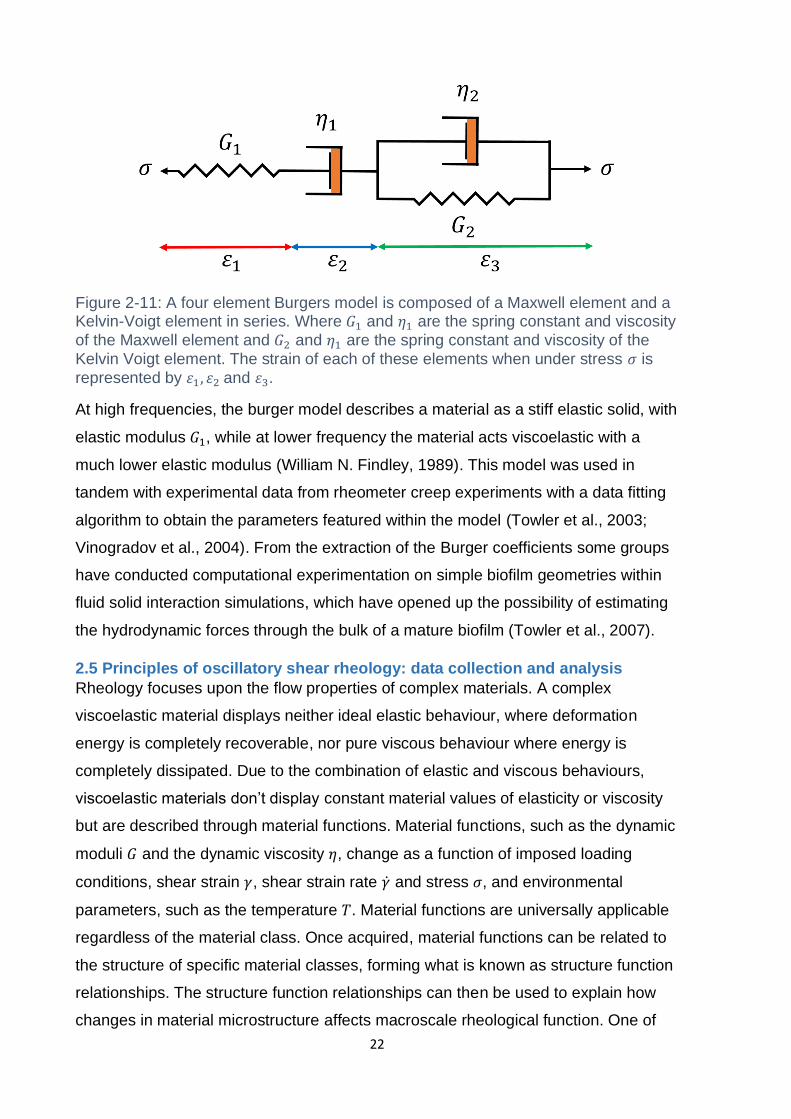
22
Figure 2-11: A four element Burgers model is composed of a Maxwell element and a Kelvin-Voigt element in series. Where 𝐺1 and 𝜂1 are the spring constant and viscosity
of the Maxwell element and 𝐺2 and 𝜂1 are the spring constant and viscosity of the
Kelvin Voigt element. The strain of each of these elements when under stress 𝜎 is
represented by 휀1, 휀2 and 휀3.
At high frequencies, the burger model describes a material as a stiff elastic solid, with
elastic modulus 𝐺1, while at lower frequency the material acts viscoelastic with a
much lower elastic modulus (William N. Findley, 1989). This model was used in
tandem with experimental data from rheometer creep experiments with a data fitting
algorithm to obtain the parameters featured within the model (Towler et al., 2003;
Vinogradov et al., 2004). From the extraction of the Burger coefficients some groups
have conducted computational experimentation on simple biofilm geometries within
fluid solid interaction simulations, which have opened up the possibility of estimating
the hydrodynamic forces through the bulk of a mature biofilm (Towler et al., 2007).
2.5 Principles of oscillatory shear rheology: data collection and analysis
Rheology focuses upon the flow properties of complex materials. A complex
viscoelastic material displays neither ideal elastic behaviour, where deformation
energy is completely recoverable, nor pure viscous behaviour where energy is
completely dissipated. Due to the combination of elastic and viscous behaviours,
viscoelastic materials don’t display constant material values of elasticity or viscosity
but are described through material functions. Material functions, such as the dynamic
moduli 𝐺 and the dynamic viscosity 𝜂, change as a function of imposed loading
conditions, shear strain 𝛾, shear strain rate �� and stress 𝜎, and environmental
parameters, such as the temperature 𝑇. Material functions are universally applicable
regardless of the material class. Once acquired, material functions can be related to
the structure of specific material classes, forming what is known as structure function
relationships. The structure function relationships can then be used to explain how
changes in material microstructure affects macroscale rheological function. One of
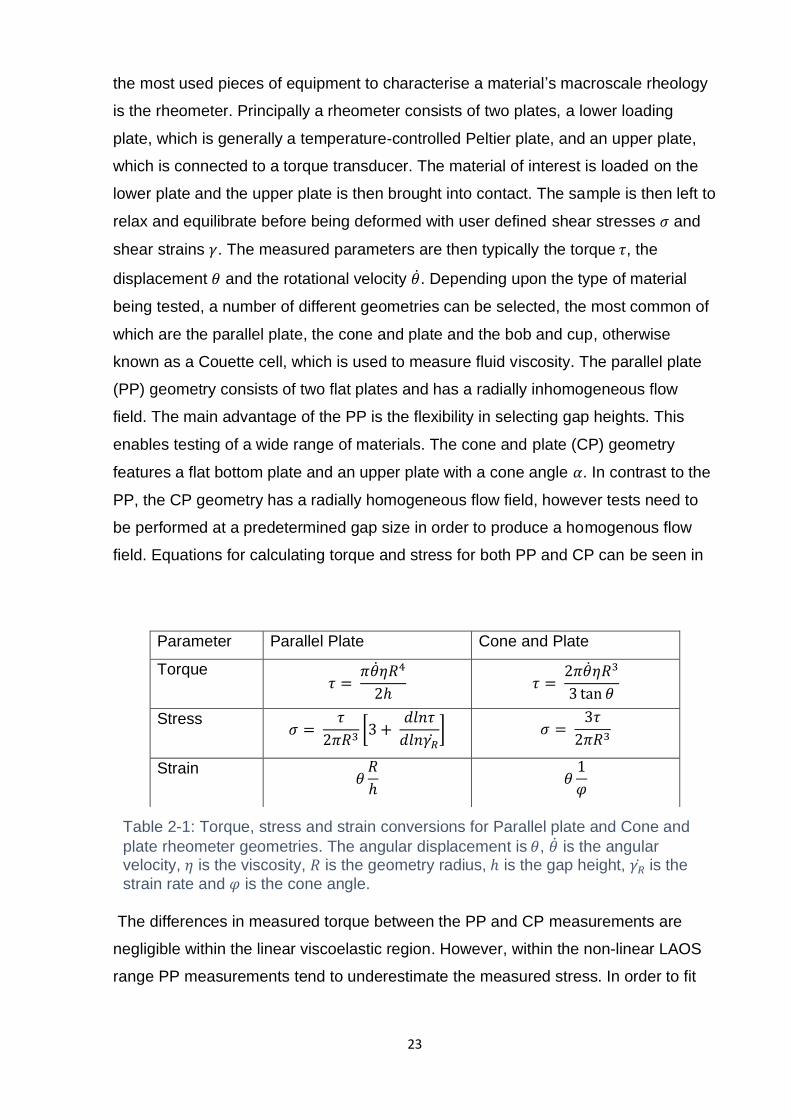
23
the most used pieces of equipment to characterise a material’s macroscale rheology
is the rheometer. Principally a rheometer consists of two plates, a lower loading
plate, which is generally a temperature-controlled Peltier plate, and an upper plate,
which is connected to a torque transducer. The material of interest is loaded on the
lower plate and the upper plate is then brought into contact. The sample is then left to
relax and equilibrate before being deformed with user defined shear stresses 𝜎 and
shear strains 𝛾. The measured parameters are then typically the torque 𝜏, the
displacement 𝜃 and the rotational velocity ��. Depending upon the type of material
being tested, a number of different geometries can be selected, the most common of
which are the parallel plate, the cone and plate and the bob and cup, otherwise
known as a Couette cell, which is used to measure fluid viscosity. The parallel plate
(PP) geometry consists of two flat plates and has a radially inhomogeneous flow
field. The main advantage of the PP is the flexibility in selecting gap heights. This
enables testing of a wide range of materials. The cone and plate (CP) geometry
features a flat bottom plate and an upper plate with a cone angle 𝛼. In contrast to the
PP, the CP geometry has a radially homogeneous flow field, however tests need to
be performed at a predetermined gap size in order to produce a homogenous flow
field. Equations for calculating torque and stress for both PP and CP can be seen in
The differences in measured torque between the PP and CP measurements are
negligible within the linear viscoelastic region. However, within the non-linear LAOS
range PP measurements tend to underestimate the measured stress. In order to fit
Parameter Parallel Plate Cone and Plate
Torque 𝜏 =
𝜋��𝜂𝑅4
2ℎ 𝜏 =
2𝜋��𝜂𝑅3
3 tan 𝜃
Stress 𝜎 =
𝜏
2𝜋𝑅3[3 +
𝑑𝑙𝑛𝜏
𝑑𝑙𝑛𝛾��] 𝜎 =
3𝜏
2𝜋𝑅3
Strain 𝜃𝑅
ℎ 𝜃
1
𝜑
Table 2-1: Torque, stress and strain conversions for Parallel plate and Cone and
plate rheometer geometries. The angular displacement is 𝜃, �� is the angular velocity, 𝜂 is the viscosity, 𝑅 is the geometry radius, ℎ is the gap height, 𝛾�� is the
strain rate and 𝜑 is the cone angle.
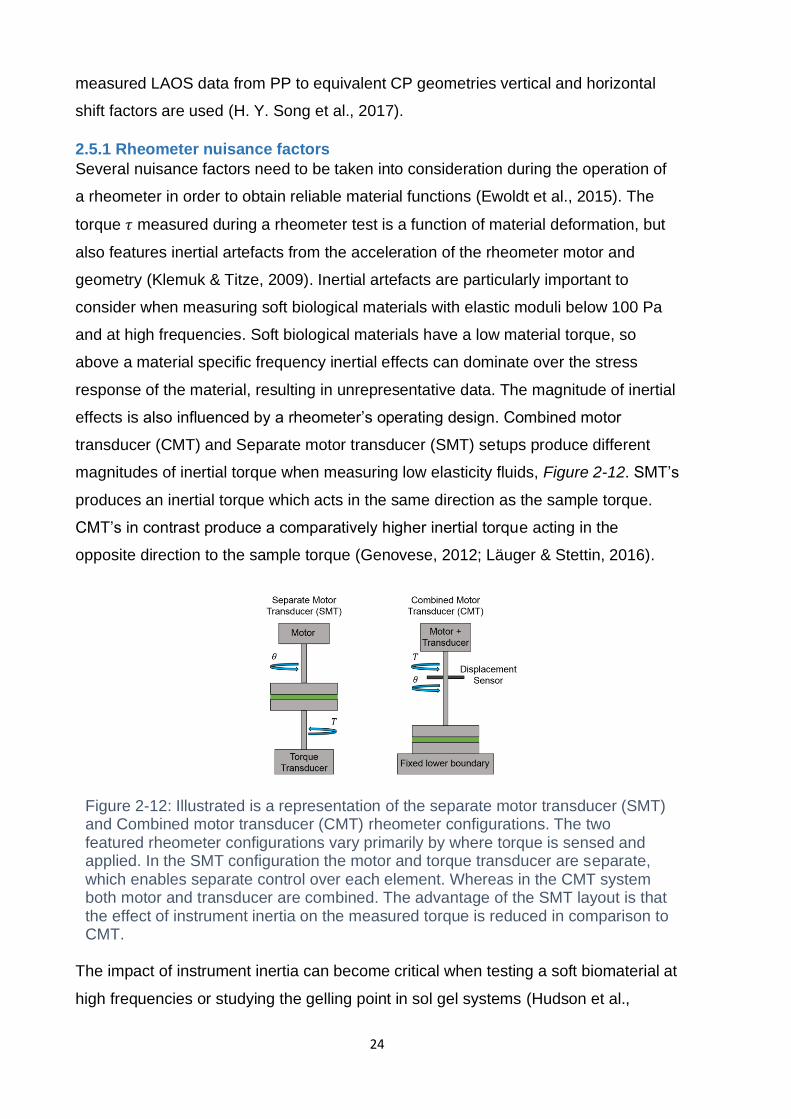
24
measured LAOS data from PP to equivalent CP geometries vertical and horizontal
shift factors are used (H. Y. Song et al., 2017).
2.5.1 Rheometer nuisance factors
Several nuisance factors need to be taken into consideration during the operation of
a rheometer in order to obtain reliable material functions (Ewoldt et al., 2015). The
torque 𝜏 measured during a rheometer test is a function of material deformation, but
also features inertial artefacts from the acceleration of the rheometer motor and
geometry (Klemuk & Titze, 2009). Inertial artefacts are particularly important to
consider when measuring soft biological materials with elastic moduli below 100 Pa
and at high frequencies. Soft biological materials have a low material torque, so
above a material specific frequency inertial effects can dominate over the stress
response of the material, resulting in unrepresentative data. The magnitude of inertial
effects is also influenced by a rheometer’s operating design. Combined motor
transducer (CMT) and Separate motor transducer (SMT) setups produce different
magnitudes of inertial torque when measuring low elasticity fluids, Figure 2-12. SMT’s
produces an inertial torque which acts in the same direction as the sample torque.
CMT’s in contrast produce a comparatively higher inertial torque acting in the
opposite direction to the sample torque (Genovese, 2012; Läuger & Stettin, 2016).
The impact of instrument inertia can become critical when testing a soft biomaterial at
high frequencies or studying the gelling point in sol gel systems (Hudson et al.,
Figure 2-12: Illustrated is a representation of the separate motor transducer (SMT) and Combined motor transducer (CMT) rheometer configurations. The two featured rheometer configurations vary primarily by where torque is sensed and applied. In the SMT configuration the motor and torque transducer are separate, which enables separate control over each element. Whereas in the CMT system both motor and transducer are combined. The advantage of the SMT layout is that the effect of instrument inertia on the measured torque is reduced in comparison to CMT.
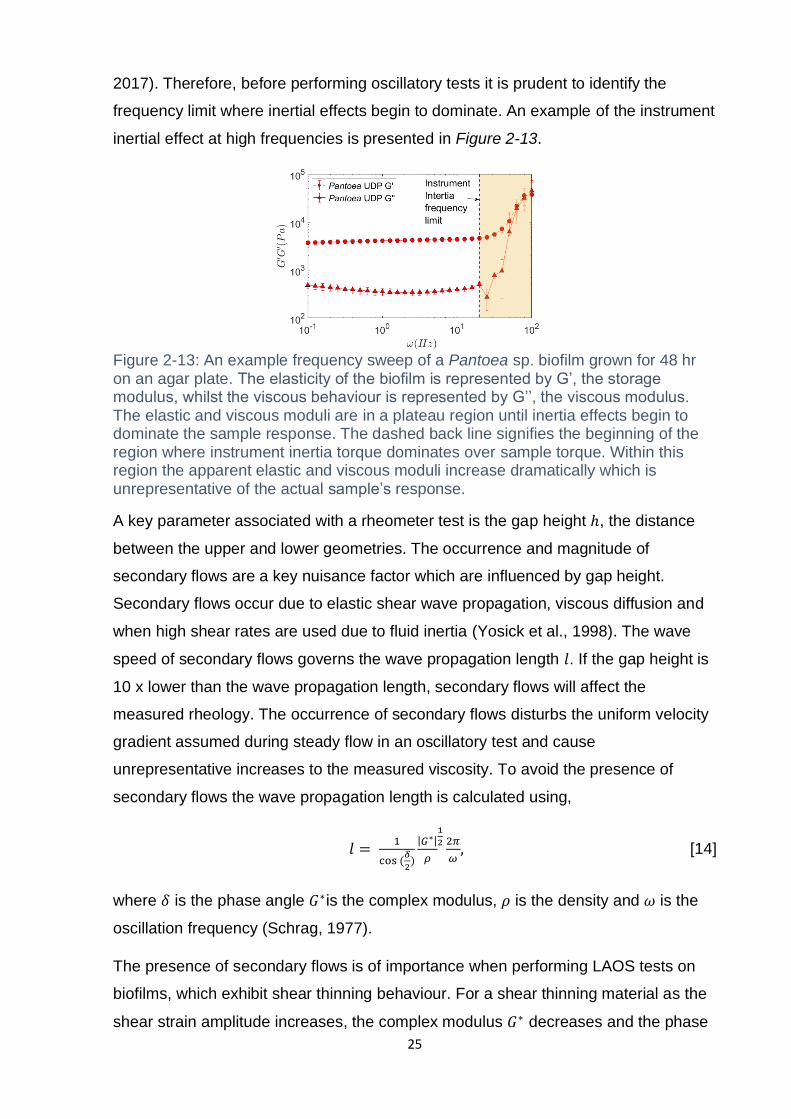
25
2017). Therefore, before performing oscillatory tests it is prudent to identify the
frequency limit where inertial effects begin to dominate. An example of the instrument
inertial effect at high frequencies is presented in Figure 2-13.
Figure 2-13: An example frequency sweep of a Pantoea sp. biofilm grown for 48 hr on an agar plate. The elasticity of the biofilm is represented by G’, the storage modulus, whilst the viscous behaviour is represented by G’’, the viscous modulus. The elastic and viscous moduli are in a plateau region until inertia effects begin to dominate the sample response. The dashed back line signifies the beginning of the region where instrument inertia torque dominates over sample torque. Within this region the apparent elastic and viscous moduli increase dramatically which is unrepresentative of the actual sample’s response.
A key parameter associated with a rheometer test is the gap height ℎ, the distance
between the upper and lower geometries. The occurrence and magnitude of
secondary flows are a key nuisance factor which are influenced by gap height.
Secondary flows occur due to elastic shear wave propagation, viscous diffusion and
when high shear rates are used due to fluid inertia (Yosick et al., 1998). The wave
speed of secondary flows governs the wave propagation length 𝑙. If the gap height is
10 x lower than the wave propagation length, secondary flows will affect the
measured rheology. The occurrence of secondary flows disturbs the uniform velocity
gradient assumed during steady flow in an oscillatory test and cause
unrepresentative increases to the measured viscosity. To avoid the presence of
secondary flows the wave propagation length is calculated using,
𝑙 = 1
cos (𝛿
2)
|𝐺∗|
𝜌
1
2 2𝜋
𝜔, [14]
where 𝛿 is the phase angle 𝐺∗is the complex modulus, 𝜌 is the density and 𝜔 is the
oscillation frequency (Schrag, 1977).
The presence of secondary flows is of importance when performing LAOS tests on
biofilms, which exhibit shear thinning behaviour. For a shear thinning material as the
shear strain amplitude increases, the complex modulus 𝐺∗ decreases and the phase
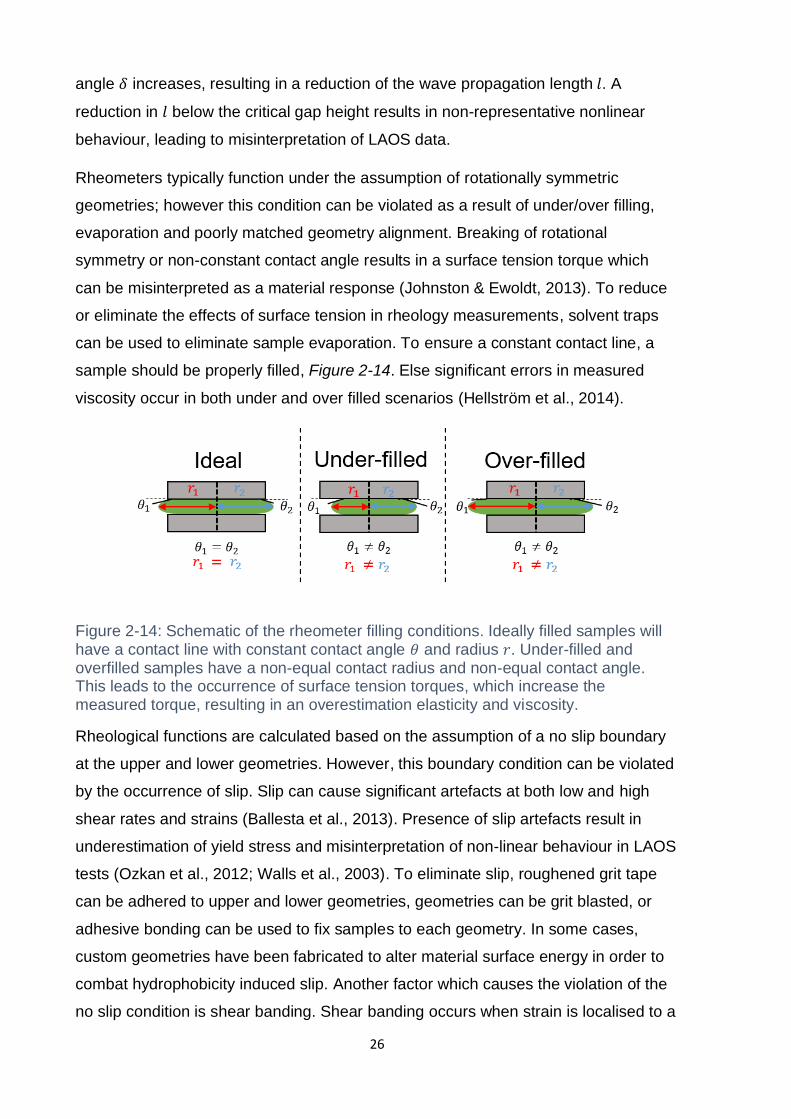
26
angle 𝛿 increases, resulting in a reduction of the wave propagation length 𝑙. A
reduction in 𝑙 below the critical gap height results in non-representative nonlinear
behaviour, leading to misinterpretation of LAOS data.
Rheometers typically function under the assumption of rotationally symmetric
geometries; however this condition can be violated as a result of under/over filling,
evaporation and poorly matched geometry alignment. Breaking of rotational
symmetry or non-constant contact angle results in a surface tension torque which
can be misinterpreted as a material response (Johnston & Ewoldt, 2013). To reduce
or eliminate the effects of surface tension in rheology measurements, solvent traps
can be used to eliminate sample evaporation. To ensure a constant contact line, a
sample should be properly filled, Figure 2-14. Else significant errors in measured
viscosity occur in both under and over filled scenarios (Hellström et al., 2014).
Figure 2-14: Schematic of the rheometer filling conditions. Ideally filled samples will have a contact line with constant contact angle 𝜃 and radius 𝑟. Under-filled and overfilled samples have a non-equal contact radius and non-equal contact angle. This leads to the occurrence of surface tension torques, which increase the measured torque, resulting in an overestimation elasticity and viscosity.
Rheological functions are calculated based on the assumption of a no slip boundary
at the upper and lower geometries. However, this boundary condition can be violated
by the occurrence of slip. Slip can cause significant artefacts at both low and high
shear rates and strains (Ballesta et al., 2013). Presence of slip artefacts result in
underestimation of yield stress and misinterpretation of non-linear behaviour in LAOS
tests (Ozkan et al., 2012; Walls et al., 2003). To eliminate slip, roughened grit tape
can be adhered to upper and lower geometries, geometries can be grit blasted, or
adhesive bonding can be used to fix samples to each geometry. In some cases,
custom geometries have been fabricated to alter material surface energy in order to
combat hydrophobicity induced slip. Another factor which causes the violation of the
no slip condition is shear banding. Shear banding occurs when strain is localised to a
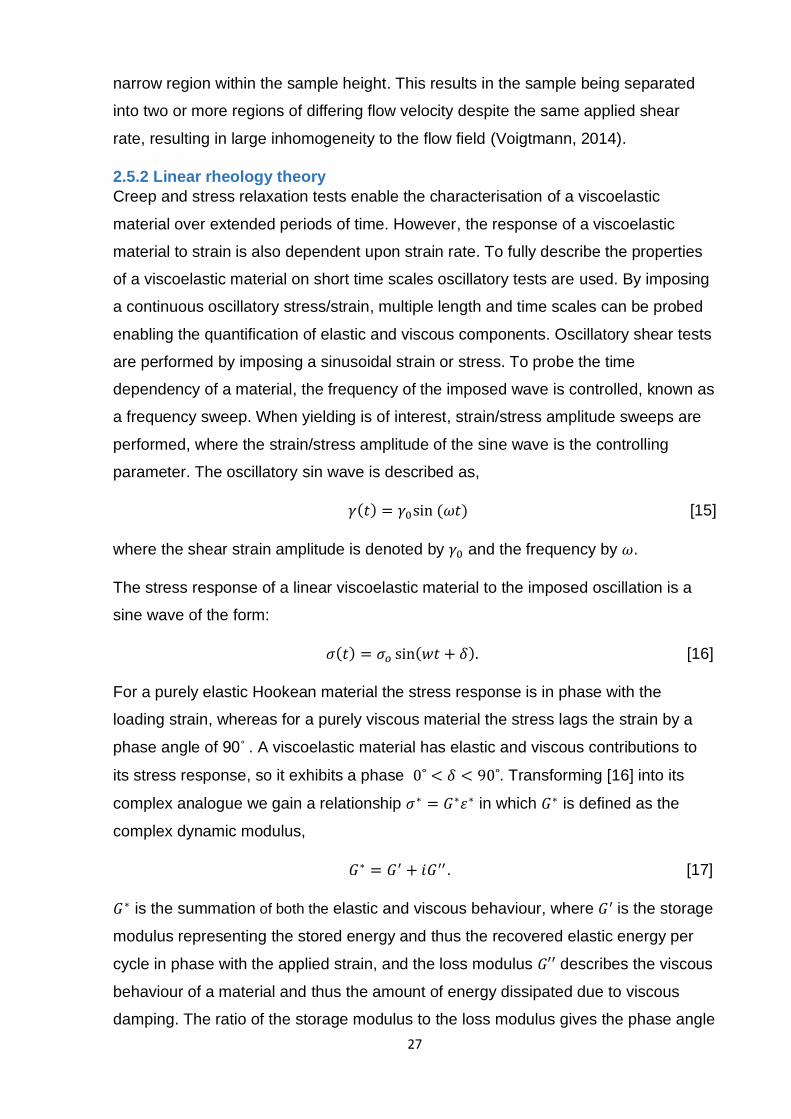
27
narrow region within the sample height. This results in the sample being separated
into two or more regions of differing flow velocity despite the same applied shear
rate, resulting in large inhomogeneity to the flow field (Voigtmann, 2014).
2.5.2 Linear rheology theory
Creep and stress relaxation tests enable the characterisation of a viscoelastic
material over extended periods of time. However, the response of a viscoelastic
material to strain is also dependent upon strain rate. To fully describe the properties
of a viscoelastic material on short time scales oscillatory tests are used. By imposing
a continuous oscillatory stress/strain, multiple length and time scales can be probed
enabling the quantification of elastic and viscous components. Oscillatory shear tests
are performed by imposing a sinusoidal strain or stress. To probe the time
dependency of a material, the frequency of the imposed wave is controlled, known as
a frequency sweep. When yielding is of interest, strain/stress amplitude sweeps are
performed, where the strain/stress amplitude of the sine wave is the controlling
parameter. The oscillatory sin wave is described as,
𝛾(𝑡) = 𝛾0sin (𝜔𝑡) [15]
where the shear strain amplitude is denoted by 𝛾0 and the frequency by 𝜔.
The stress response of a linear viscoelastic material to the imposed oscillation is a
sine wave of the form:
𝜎(𝑡) = 𝜎𝑜 sin(𝑤𝑡 + 𝛿). [16]
For a purely elastic Hookean material the stress response is in phase with the
loading strain, whereas for a purely viscous material the stress lags the strain by a
phase angle of 90˚ . A viscoelastic material has elastic and viscous contributions to
its stress response, so it exhibits a phase 0˚ < 𝛿 < 90˚. Transforming [16] into its
complex analogue we gain a relationship 𝜎∗ = 𝐺∗휀∗ in which 𝐺∗ is defined as the
complex dynamic modulus,
𝐺∗ = 𝐺′ + 𝑖𝐺′′. [17]
𝐺∗ is the summation of both the elastic and viscous behaviour, where 𝐺′ is the storage
modulus representing the stored energy and thus the recovered elastic energy per
cycle in phase with the applied strain, and the loss modulus 𝐺′′ describes the viscous
behaviour of a material and thus the amount of energy dissipated due to viscous
damping. The ratio of the storage modulus to the loss modulus gives the phase angle
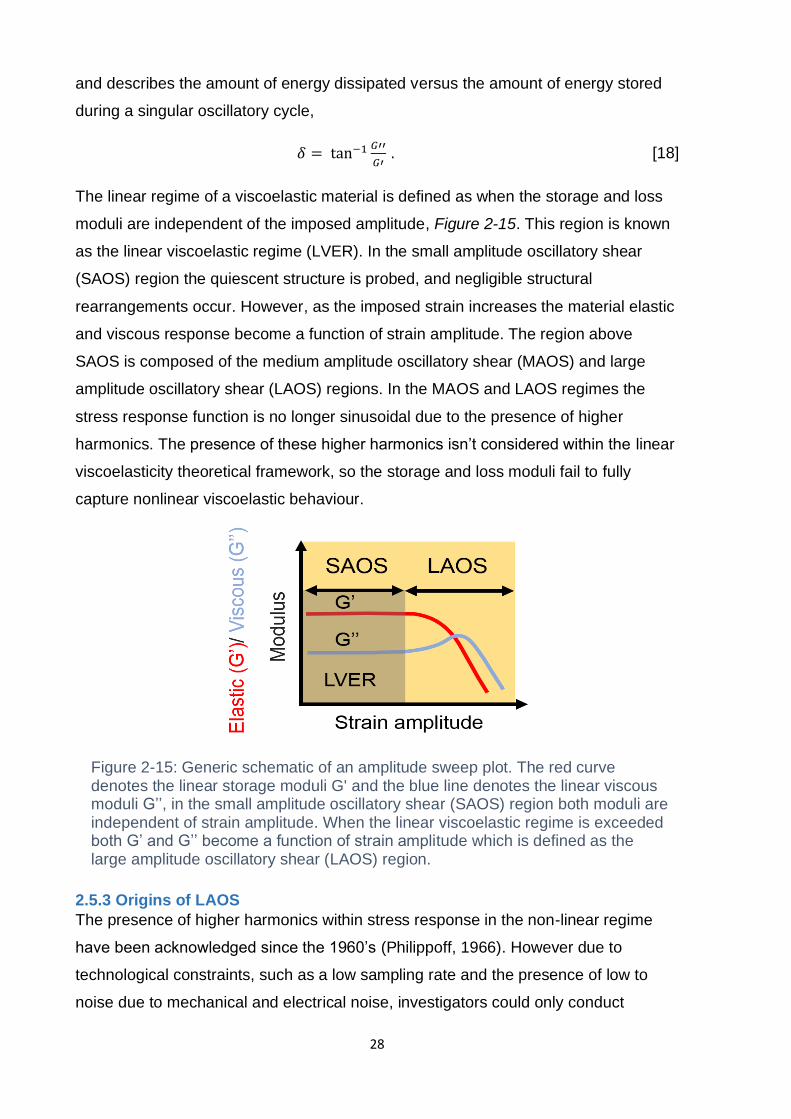
28
and describes the amount of energy dissipated versus the amount of energy stored
during a singular oscillatory cycle,
𝛿 = tan−1𝐺′′
𝐺′ . [18]
The linear regime of a viscoelastic material is defined as when the storage and loss
moduli are independent of the imposed amplitude, Figure 2-15. This region is known
as the linear viscoelastic regime (LVER). In the small amplitude oscillatory shear
(SAOS) region the quiescent structure is probed, and negligible structural
rearrangements occur. However, as the imposed strain increases the material elastic
and viscous response become a function of strain amplitude. The region above
SAOS is composed of the medium amplitude oscillatory shear (MAOS) and large
amplitude oscillatory shear (LAOS) regions. In the MAOS and LAOS regimes the
stress response function is no longer sinusoidal due to the presence of higher
harmonics. The presence of these higher harmonics isn’t considered within the linear
viscoelasticity theoretical framework, so the storage and loss moduli fail to fully
capture nonlinear viscoelastic behaviour.
2.5.3 Origins of LAOS
The presence of higher harmonics within stress response in the non-linear regime
have been acknowledged since the 1960’s (Philippoff, 1966). However due to
technological constraints, such as a low sampling rate and the presence of low to
noise due to mechanical and electrical noise, investigators could only conduct
Figure 2-15: Generic schematic of an amplitude sweep plot. The red curve denotes the linear storage moduli G' and the blue line denotes the linear viscous moduli G’’, in the small amplitude oscillatory shear (SAOS) region both moduli are independent of strain amplitude. When the linear viscoelastic regime is exceeded both G’ and G’’ become a function of strain amplitude which is defined as the large amplitude oscillatory shear (LAOS) region.
29
qualitative analysis using analogue stress response signals (Komatsu et al., 1973).
However, the advent of analogue to digital converters (ADC) and increasingly
sophisticated rheometers with lower noise enabled investigators to substantially
increase the stress response sampling rate. The first quantitative approach to
analysing LAOS data was Fourier transform rheology (FT-rheology) (Wilhelm, 2002).
This methodology performed a Fourier transform on the stress response signal using,
𝜎(𝑡) = ∑ 𝜎𝑛sin (𝑛𝜔1𝑡 + 𝛿𝑛)𝑛=1,𝑜𝑑𝑑 . [19]
Performing a Fourier transform over multiple periods resulted in a higher S/N ratio
and enabled non-linear rheological analysis based on the Fourier harmonics (Hyun et
al., 2003). Materials were analysed based upon the magnitude of Fourier harmonics
to compliment qualitative analysis of the raw output stress waveforms, Figure 2-16.
Non-linearity was quantified using the relative intensity of the third Fourier harmonic
𝐼3/1,
𝐼3/1 = 𝐼3
𝐼1=
𝜎3
𝜎1=
√(𝜎3cos 𝛿3)2+(𝜎3𝑠𝑖𝑛𝛿3)
2
√(𝜎1cos 𝛿1)2+(𝜎1𝑠𝑖𝑛𝛿1)
2. [20]
Within the medium amplitude oscillatory region 𝐼3/1 behaviour is typically
characterised through the exponent 𝑛 which is calculated using,
log (𝐼3
𝐼1) = 𝑎 + 𝑛 log 𝛾0, [21]
where 𝑎 is an arbitrary constant and 𝛾0 is the strain amplitude. In early investigations
using linear polymer solutions the exponent 𝑛 was found to scale quadratically with
strain. This relation had first been predicted using Doi- Edwards theory and has
Figure 2-16: Different types of LAOS stress waveforms with their corresponding relative phase angle of the third Fourier harmonic for 4 different types of soft and hard polymer gels. The different waveform shapes correspond to different polymer microstructures. The plateau waveform was displayed for diblock copolymer gels. The backward tilted shoulder was displayed for soft gels. The forward tilted shoulder was displayed for polysaccharides xanthan gum and hyaluronic acid (Roth, 2012).
30
subsequently been demonstrated using the pom pom model (Hyun et al., 2012;
Pearson & Rochefort, 1982). However, the precise physical reason which causes this
exponent value is still not understood. Subsequent experimental investigations have
demonstrated that the gradient of 𝐼3/1 varies with dependent upon polymer topology.
The gradient of 𝐼3/1 is known to be sensitive in detecting the amount of branching
within polymer melts. For example, a highly branched high-density polyethylene melt
has a 𝐼3/1 gradient of 𝑛 ≈ 1.6 (Hyun et al., 2006, 2007).
2.5.4 Analysis of LAOS waveforms – theoretical background
This thesis focuses upon the nonlinear rheology of bacteria biofilms and uses a
range of LAOS techniques to interpret rheometer data and understand the
rheological signatures experimentally obtained. Therefore, I find it logical to spend
some time introducing the foundational mathematical principles of each technique.
2.5.5 Stress symmetry
The total stress generated within a material is dependent upon the magnitude of
strain (𝛾) and its derivative, strain rate (��). For a viscoelastic material the total stress
(𝜎) is separated into an elastic response 𝐺′(𝜔)𝛾(𝜔𝑡), which is dependent upon the
strain (𝛾), and the viscous response 𝐺′′(𝜔)��(𝜔𝑡)
𝜔, which is dependent upon strain rate
��(𝜔𝑡)
𝜔. The three time dependent variables 𝛾, ��/𝜔 𝑎𝑛𝑑 𝜎 can be represented as vectors
𝑖, 𝑗, 𝑘 within a (𝛾,��
𝜔, 𝜎) coordinate system. These vectors map the path of a time
dependent plane known as the stress surface, which represents the dynamic
response of a material through an oscillatory cycle. The total stress response of a
material is thus a function of frequency, strain and time which is assumed continuous
and differentiable. By substituting 𝛾 = 𝑥(𝑡) and ��
𝜔= 𝑦(𝑡), the total stress can be
represented as,
𝜎(𝜔, 𝛾0, 𝑡) = 𝜎(𝑥, 𝑦), [22]
where 𝛾0 is the strain amplitude of the oscillation cycle. Inverting strain and strain rate
produces a negative stress,
𝜎(−𝑥,−𝑦) = −𝜎(𝑥, 𝑦), [23]
which makes stress 𝜎 an odd function as 𝑓(−𝑥) = −𝑓(𝑥). This property of stress is
applicable to most soft materials (Kwang Soo et al., 2005). As both 𝑥 and 𝑦 are odd
functions of their arguments, the total stress can be decomposed into
31
𝜎(𝑥, 𝑦) = 𝜎(𝑥,𝑦)−𝜎(−𝑥,𝑦)
2+
𝜎(𝑥,𝑦)−𝜎(𝑥,−𝑦)
2, [24]
since
𝜎(−𝑥, 𝑦) = −𝜎(𝑥,−𝑦). [25]
The first and second components of [24] represent an odd even and even odd
contribution of total stress respectively,
𝜎𝑂𝐸 = 𝜎(𝑥,𝑦)−𝜎(−𝑥,𝑦)
2, [26]
𝜎𝐸𝑂 = 𝜎(𝑥,𝑦)−𝜎(𝑥,−𝑦)
2. [27]
Taking the contour integral over one period of oscillation [26] and [27] with respect to
the odd component yields zero, a characteristic property of odd functions,
∮𝜎𝑂𝐸𝑑𝑥 = 0, [28]
∮𝜎𝐸𝑂𝑑𝑦 = 0. [29]
Which means that the total stress in the system is the contour integral of the even
functions over one period of oscillation,
∮𝜎𝑑𝑥 = ∮ 𝜎𝐸𝑂𝑑𝑥 , [30]
∮𝜎𝑑𝑦 = ∮𝜎𝑂𝐸𝑑𝑦. [31]
Proving that the decomposition of [24] is unique and satisfies [28] and [29] means
that [26] and [27] are true and that total stress can be geometrically decomposed into
elastic and viscous parts 𝜎′ and 𝜎′′. This decomposition is valid as in the linear
viscoelastic region we can show that:
𝜎(𝑥, 𝑦) = 𝜎′(𝑥, 𝛾) + 𝜎′′(𝑦, γ), [32]
where
𝜎′ = 𝐺′𝑥(𝑡) [33]
and
𝜎′′ = 𝐺′′𝑦(𝑡). [34]

32
where 𝜎′ is an odd function of 𝑥 and 𝜎′′ is an odd function of 𝑦, meaning they are in
the linear viscoelastic regime, so,
∮𝜎′𝑑𝑥 = 0, [35]
∮𝜎′′𝑑𝑦 = 0, [36]
And
∮𝜎𝑑𝑥 = ∮ 𝜎′′𝑑𝑥, [37]
∮𝜎𝑑𝑦 = ∮𝜎′𝑑𝑦 . [38]
Which leads us to show the equivalency in decomposing LAOS stress into elastic
and viscous components as with linear viscoelasticity,
𝜎′ = 𝜎𝑂𝐸, [39]
𝜎′′ = 𝜎𝐸𝑂, [40]
𝜎′(𝑥, 𝑦) = 𝜎′(𝑥, γ), [41]
𝜎′′(𝑥, 𝑦) = 𝜎′′(𝑦, γ), [42]
This then allows the interpretation of LAOS signal as an extension of the linear
regime where Γ′ and Γ′′ are used as the dynamic moduli in the nonlinear region,
𝜎′ = Γ′(𝑥, γ)𝑥, [43]
𝜎′′ = Γ′′(𝑦, γ), [44]
which in the linear viscoelastic limit can also be used to represent the linear
storage 𝐺′ and loss modulus 𝐺′′,
limγ→0
Γ′(𝑥, γ) = 𝐺′(𝜔), [45]
limγ→0
Γ′′(𝑦, γ) = 𝐺′′(𝜔). [46]
2.5.6 Fundamentals of Ewoldt Chebyshev method Traditionally FT rheology involved the analysis of the stress response signal by
performing a Fourier transform, from which the overall stress 𝜎 could be analysed in
terms of the higher order shear moduli 𝐺𝑛′ and 𝐺𝑛
′′ and the higher order viscosities 𝜂𝑛′
and 𝜂𝑛′′,
33
𝜎(𝑡; 𝜔, 𝛾0) = 𝛾0 ∑ {𝐺𝑛′ (𝜔, 𝛾0)sin 𝑛𝜔𝑡𝑛 𝑜𝑑𝑑 + 𝐺n
′′(𝜔, 𝛾0)𝑐𝑜𝑠𝑛𝜔𝑡}, [47]
𝜎(𝑡; 𝜔, 𝛾0) = ��0 ∑ {𝜂𝑛′′(𝜔, 𝛾0)sin 𝑛𝜔𝑡𝑛 𝑜𝑑𝑑 + 𝜂𝑛
′ (𝜔, 𝛾0) cos 𝑛𝜔𝑡}, [48]
where 𝛾0 is the strain amplitude and ��0 is the strain rate amplitude.
However, this method suffers from a series of drawbacks:
1. The physical interpretation of higher harmonics is unclear.
2. Characterising non-linear behaviour using 𝐺1′ and 𝐺1
′′ generally is not sensitive
enough to provide an accurate representation of the non-linear behaviour.
To eliminate these weaknesses and construct a repeatable, consistent, physically
interpretable framework, Ewoldt (Randy et al., 2008) took Cho’s stress decomposition
proof and argued that the Fourier transform of the total stress could be decomposed
into elastic and viscous stresses:
𝜎′ ≡𝜎(𝛾,��)−𝜎(−𝛾,��)
2= 𝛾0 ∑ 𝐺𝑛
′ (𝜔, 𝛾0) sin 𝑛𝜔𝑡 ,𝑛 𝑜𝑑𝑑 [49]
𝜎′′ ≡𝜎(𝛾,��)−𝜎(𝛾,−��)
2= 𝛾0 ∑ 𝐺𝑛
′′(𝜔, 𝛾0) cos𝑛𝜔𝑡 .𝑛 𝑜𝑑𝑑 [50]
Plotting the Fourier transformed signal 𝜎′ and 𝜎′′ with respect to 𝑥 and 𝑦 results in a
single valued curve.This approach captures the full Fourier transformed signal,
including higher harmonics, which partially solves drawback 1. To characterise the
curves Cho suggested using a polynomial regression analysis which is of the general
form,
𝐹 = 𝑎0𝑓0(𝑥) + 𝑎1𝑓1(𝑥) + 𝑎2𝑓2(𝑥) +⋯+ an𝑓𝑛(𝑥), [51]
where 𝑎n are the weighting coefficients on the fitting polynomials 𝑓𝑛(𝑥).However,
polynomial analysis features an arbitrary user choice of the number of higher order
terms used to represent each curve, which has a feedback effect in influencing the
value of the lower order terms. To solve this issue Ewoldt proposed the adoption of
Chebyshev polynomial basis functions, which determine the fitting points used during
polynomial analysis. Chebyshev polynomials are suited towards describing LAOS
due to their orthogonality in the domain [-1 1] which corresponds to [−𝛾, 𝛾] and are
defined by,
𝜎′(𝑥) = 𝛾0 ∑ 𝑒𝑛(𝜔, 𝛾0)𝑇𝑛(𝑥),𝑛:𝑜𝑑𝑑 [52]
𝜎′′(𝑦) = 𝛾0 ∑ 𝑣𝑛(𝜔, 𝛾0)𝑇𝑛(𝑦).𝑛:𝑜𝑑𝑑 [53]
34
Here 𝑒𝑛 is representative of the elastic Chebyshev harmonic and 𝑣𝑛 is representative
of the viscous Chebyshev harmonic. Only odd harmonic contributions are considered
due to the flow symmetry assumption from FT rheology. The Chebyshev coefficients
in the strain or strain rate domain are represented by,
𝑒𝑛 = 𝐺𝑛′ (−1)
𝑛−1
2 𝑛: 𝑜𝑑𝑑, [54]
𝑣𝑛 =𝐺𝑛′′
𝜔= 𝜂𝑛
′ 𝑛: 𝑜𝑑𝑑. [55]
Both 𝑒𝑛 and 𝑣𝑛 can be physically interpreted by considering the phase angle 𝛿𝑛 of the
complex modulus 𝐺𝑛∗,
𝜎 = 𝛾0 ∑ |𝐺𝑛∗|sin (𝑛𝜔𝑡 + 𝛿𝑛𝑛:𝑜𝑑𝑑 ). [56]
For the third harmonic the magnitude of 𝑒3 and 𝑣3 can be related to a physical
behaviour using the third order phase angle 𝛿𝑛,
𝑒3 = −|𝐺3∗|cos 𝛿3
{
> 0 𝑓𝑜𝑟
𝜋
2< 𝛿3 <
3𝜋
2,
= 0 𝑓𝑜𝑟 𝛿3 =𝜋
2,3𝜋
2,
< 0 𝑓𝑜𝑟 −𝜋
2< 𝛿3 <
𝜋
2,
[57]
𝑣3 = − |𝐺3∗
𝜔| sin 𝛿3 {
> 0 𝑓𝑜𝑟 0 < 𝛿3 < 𝜋, = 0 𝑓𝑜𝑟 𝛿3 = 0, 𝜋, < 0 𝑓𝑜𝑟 𝜋 < 𝛿3 < 2𝜋.
[58]
Ewoldt also constructed geometrically derived moduli from the elastic and viscous
Lissajous Bowditch plots, in order to capture the contribution of higher harmonics. In
the elastic LB plots, local elastic response at zero strain is represented by the
minimum strain modulus 𝐺𝑀′ and at large strains by 𝐺𝐿
′ , the large strain modulus. In
the linear region 𝐺𝑀′ and 𝐺𝐿
′ converge to 𝐺′,
𝐺𝑀′ ≡
𝑑𝜎
𝑑𝛾|𝛾=0
= ∑ 𝑛𝐺𝑛′ = 𝑒1 − 3𝑒3 +⋯ ,𝑛 𝑜𝑑𝑑 [59]
𝐺𝐿′ ≡
𝜎
𝛾|𝛾=±𝛾0
= ∑ 𝐺𝑛′ (−1)
𝑛−1
2 = 𝑒1 + 𝑒3 +⋯ .𝑛 𝑜𝑑𝑑 [60]
From the viscous LB plots, local viscous response at zero strain is represented by the
minimum viscosity modulus ηM′ and at large strains by ηL
′ the large viscosity modulus.
In the linear region ηM′ and ηL
′ converge with G′′,
Strain stiffening
Linear elastic
Strain softening
Strain thickening
Linear viscous
Strain thinning
35
𝜂𝑀′ ≡
𝑑𝜎
𝑑��|��=0
=1
𝜔𝑛 ∑ 𝑛𝐺𝑛
′′(−1)𝑛−1
2 = 𝑣1 − 3𝑣3 +⋯ ,𝑛 𝑜𝑑𝑑 [61]
𝜂𝐿′ ≡
𝜎
��|��=±��0
=1
𝜔𝑛 ∑ 𝐺𝑛
′′ = 𝑣1 + 𝑣3 +⋯ .𝑛 𝑜𝑑𝑑 [62]
The rate of change of the large viscosity modulus in comparison to the minimum
viscosity modulus is indicative of the non-linear behaviours described in [59] and [60].
To represent these using the geometric measures the dimensionless numbers based
on the strain, the stiffening ratio 𝑆 and the shear thickening ratio 𝑇, are constructed.
With a 𝑆 value of zero, the gradients of the large elastic modulus and minimum
elastic modulus are equivalent. This signifies a linear behaviour, in the limit where 𝐺𝑀′
and 𝐺𝐿′ converge to 𝐺′. A value of 𝑆 > 0 corresponds to strain stiffening, which occurs
when the gradient of 𝐺𝐿′ is steeper than 𝐺𝑀
′ , signifying that at high strain the
intercycle moduli of the material has increased. When 𝑆 < 0 the material is exhibiting
a strain softening response, and 𝐺𝑀′ has a larger gradient than 𝐺𝐿
′ ,
𝑆 ≡𝐺𝐿′−𝐺𝑀
′
𝐺𝐿′ =
4𝑒3+⋯
𝑒1+𝑒3+⋯ . [63]
The 𝑇 ratio follows the same logic as the 𝑆 ratio, with 𝑇 = 0 signifying a linear
response and 𝑇 > 0 a shear thickening response and 𝑇< 0 a shear thinning response,
𝑇 ≡𝜂𝐿′−𝜂𝑀
′
𝜂𝐿′ =
4𝑣3+⋯
𝑣1+𝑣3+⋯. [64]
2.5.7 Series of physical processes
Chebyshev analysis is a mathematically rigorous approach to analysing LAOS data
using a static approach. However, the formulation of 𝑆 and 𝑇 ratios is inherently an
intercycle averaged property. Since they are intercycle averaged metrics, 𝑆 and 𝑇
cannot fully describe the instantaneous response of a material, thus neglecting the
transient material response to imposed strain. Additionally, the validity of stress
symmetries which underlie the mathematics of the Chebyshev analysis cannot be
experimentally guaranteed. Materials can exhibit even harmonics due to the
occurrence of nuisance factors, such as secondary flows and slip. In order to
circumvent these issues Rogers proposed a mathematical approach which relies
upon differential geometry to characterise the trajectory of stress in the (𝛾,��
𝜔, 𝜎)
coordinate system (Donley et al., 2019; C.-W. Lee & Rogers, 2017; S. A. Rogers,
2017; S. A. Rogers & Lettinga, 2011). The series of physical processes (SPP)
approach considers the change in material response in relation to a change in
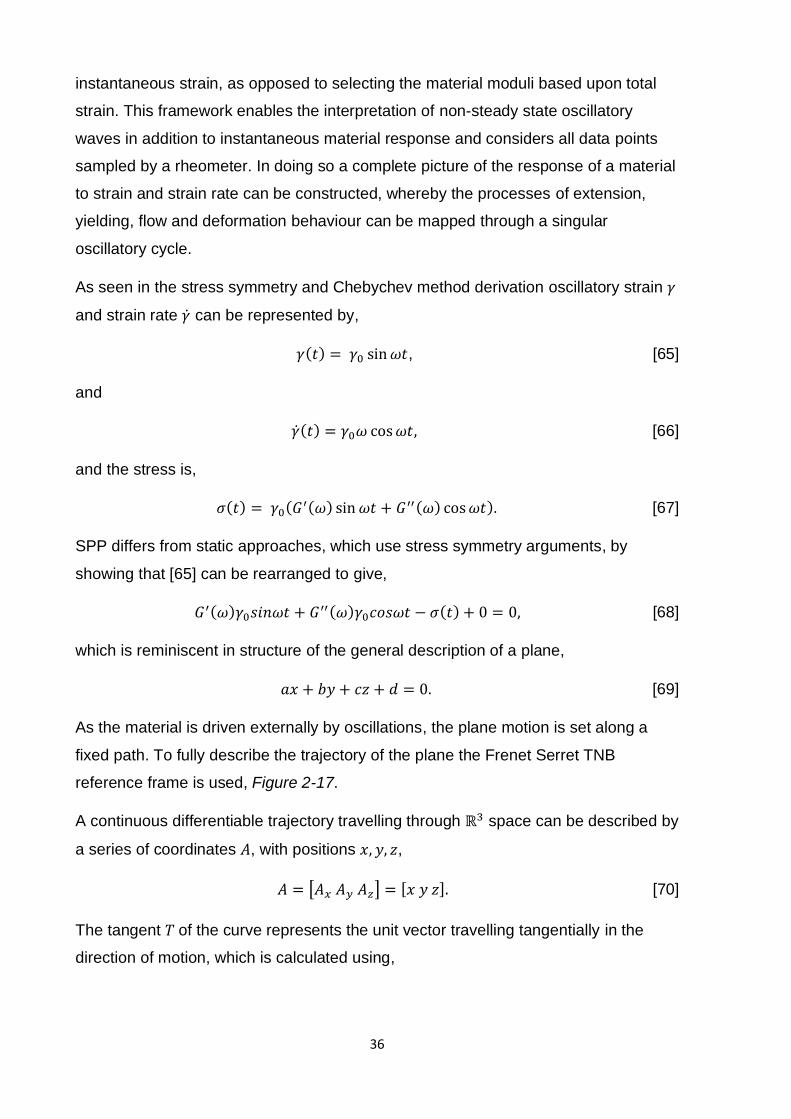
36
instantaneous strain, as opposed to selecting the material moduli based upon total
strain. This framework enables the interpretation of non-steady state oscillatory
waves in addition to instantaneous material response and considers all data points
sampled by a rheometer. In doing so a complete picture of the response of a material
to strain and strain rate can be constructed, whereby the processes of extension,
yielding, flow and deformation behaviour can be mapped through a singular
oscillatory cycle.
As seen in the stress symmetry and Chebychev method derivation oscillatory strain 𝛾
and strain rate �� can be represented by,
𝛾(𝑡) = 𝛾0 sin𝜔𝑡, [65]
and
��(𝑡) = 𝛾0𝜔 cos𝜔𝑡, [66]
and the stress is,
𝜎(𝑡) = 𝛾0(𝐺′(𝜔) sin 𝜔𝑡 + 𝐺′′(𝜔) cos𝜔𝑡). [67]
SPP differs from static approaches, which use stress symmetry arguments, by
showing that [65] can be rearranged to give,
𝐺′(𝜔)𝛾0𝑠𝑖𝑛𝜔𝑡 + 𝐺′′(𝜔)𝛾0𝑐𝑜𝑠𝜔𝑡 − 𝜎(𝑡) + 0 = 0, [68]
which is reminiscent in structure of the general description of a plane,
𝑎𝑥 + 𝑏𝑦 + 𝑐𝑧 + 𝑑 = 0. [69]
As the material is driven externally by oscillations, the plane motion is set along a
fixed path. To fully describe the trajectory of the plane the Frenet Serret TNB
reference frame is used, Figure 2-17.
A continuous differentiable trajectory travelling through ℝ3 space can be described by
a series of coordinates 𝐴, with positions 𝑥, 𝑦, 𝑧,
𝐴 = [𝐴𝑥 𝐴𝑦 𝐴𝑧] = [𝑥 𝑦 𝑧]. [70]
The tangent 𝑇 of the curve represents the unit vector travelling tangentially in the
direction of motion, which is calculated using,
37
𝑇 = ��
|��|, [71]
where �� is the first order derivative of 𝐴 and |��| is the magnitude of the first order
derivative of 𝐴. From 𝑇 the normal unit vector 𝑁 of the curve can be calculated which
is the derivative of the tangent vector,
𝑁 = ��
|��|=
�� ×(��×��)
|��||����|. [72]
Finally, 𝐵 is the binormal unit vector which points perpendicularly to both 𝑇 and 𝑁,
and defines the orientation,
𝐵 = 𝑇 × 𝑁 = ��×��
|����|. [73]
By calculating the TNB unit vectors, trajectories through (𝛾,��
𝜔, 𝜎) space can be fully
described. By substituting the coordinate system (𝛾,��
𝜔, 𝜎) into 𝐴 we can show that a
LAOS trajectory can be described by a series of points 𝐴,
𝐴 = [𝐴𝛾 𝐴𝛾
𝜔
𝐴𝜎] = [𝛾0𝑠𝑖𝑛𝜔𝑡 𝛾0𝑐𝑜𝑠𝜔𝑡 𝜎(𝑡)] = [ 𝛾(𝑡)𝛾(𝑡)
𝜔𝜎(𝑡)]
. [74]
To describe the displacement of the stress plane in terms of the points within a
trajectory and the associated binormal vector we use,
𝜎 = 𝐺𝑡′(𝑡)𝛾(𝑡) + 𝐺𝑡
′′(𝑡)��(𝑡)
𝜔+
𝐵𝛾(𝑡)
𝐵𝜎(𝑡)𝐴𝛾(𝑡) +
𝐵 ��𝜔
(𝑡)
𝐵𝜎(𝑡)𝐴𝛾
𝜔
(𝑡) + 𝐴𝜎(𝑡), [75]
Figure 2-17: Schematic of the Fernet Serret TNB reference frame. The tangent (T), normal (N) and binormal (B) are unit vectors used to fully describe the trajectory of a path through strain 𝛾, strain rate �� and stress 𝜎 coordinate space. The trajectory is formed of experimentally acquired discrete data points taken at
time 𝑡 in an oscillation period. The resolution of sampling is dependent upon the rheometer sampling frequency.
38
where 𝐵𝛾 is the binormal vector of strain and 𝐵𝜎 the binormal vector of stress and 𝐵 ��
𝜔
is the binormal vector of strain rate over frequency and 𝐺𝑡′(𝑡) and 𝐺𝑡
′′(𝑡) are the
transient storage and transient loss moduli. Substituting [72] into [73] produces,
𝜎 = 𝐺𝑡′𝛾 + 𝐺𝑡
′′ 𝛾
𝜔+
𝐵𝛾
𝐵𝜎𝛾 +
𝐵 ��𝜔
𝐵𝜎
𝛾
𝜔+ 𝜎, [76]
which can then be rearranged to yield,
[𝐺𝑡′ +
𝐵𝛾
𝐵𝜎] 𝛾 + [𝐺𝑡
′′ + 𝐵 ��𝜔
𝐵𝜎]��
𝜔= 0, [77]
which can be solved by processing 𝛾, �� and 𝜎 data through the TNB reference frame
using [74]. Solving [77] results in the transient measures of viscoelasticity, the
transient storage modulus,
𝐺𝑡′(𝑡) = −
𝐵𝛾(𝑡)
𝐵𝜎(𝑡), [78]
and the transient loss modulus,
𝐺𝑡′′(𝑡) = −
𝐵 ��𝜔
(𝑡)
𝐵𝜎(𝑡). [79]
2.5.8 Transient phase angle
In linear rheology the elastic and viscous components can be defined geometrically
through the complex modulus 𝐺∗ and the phase angle 𝛿. The transient moduli can be
described analogously in this way. This results in what is termed the complex
transient modulus,
|𝐺𝑡∗| = √𝐺𝑡
′2 + 𝐺𝑡′′2, [80]
and the transient phase angle,
𝛿𝑡 = tan−1 𝐺𝑡
′′
𝐺𝑡′ , [81]
which describes the state of instantaneous yielding within a material.
2.6 Viscoelastic liquids, glasses and gels
The field of soft matter physics concerns the study of physical systems assembled
through weak interactions which are easily deformed with thermal fluctuations or
physical stresses (Likos, 2001). A spectrum of materials fall into this category
including: foams, emulsions, gels, biological materials and colloids. These systems
39
are commonly heterogeneous and complex due to the transient nature of the
material’s microstructure and are classified as either passive or active. An active
system is constantly out of equilibrium as constituents consume energy to convert
into active mechanical processes, such as bacterial swimming or in mammalian
systems where molecular protein motors drive spontaneous self-organisation of
microtubule filaments (Lushi et al., 2014; Sanchez et al., 2012). A biofilm can be
considered an active system whereby bacteria consume energy for cell division and
EPS secretion. Within this field a primary aim is the formulation and dissection of
structure – function relationships. Determining these relationships enables engineers
to carefully design soft matter materials for practical applications. Soft matter systems
exhibit self-organisation, where local interactions cause large scale ordering to
emerge (Secor et al., 2015). The structure of these systems determines the materials
mechanical properties.
The transitions between colloidal phases is a confluence of physical and chemical
parameters, which can be simplified into two variables: packing fraction and
interaction potential (V. J. Anderson & Lekkerkerker, 2002). The dynamics of each of
these categories is driven by the diffusive motion of particle constituents, which range
from fully diffusive in liquids to amorphous arrested states in glasses and gels.
Packing fraction is simply the ratio of the solid particles volume to filler in the solution,
while pairwise interaction potential describes the strength of particle – particle
attraction. Varying each of these parameters results in different behaviours. In liquids
packing fraction is low < 0.1, increasing the packing fraction results in increased
elastic behaviour. As stiffer filler particles begin to interact with each other, the
material becomes viscoelastic. Increasing the packing fraction further > 0.3 causes
crowding and results in glassy and gel rheology (Laurati et al., 2011). The random
packing limit (𝜑𝑟𝑝𝑙) of 0.64 for spheres results in complete dynamic arrest while 𝜑𝑟𝑝𝑙
in rod systems is dependent upon rod aspect ratio (Kyrylyuk et al., 2009). The
interaction potentials differentiate glassy and gel dynamics.
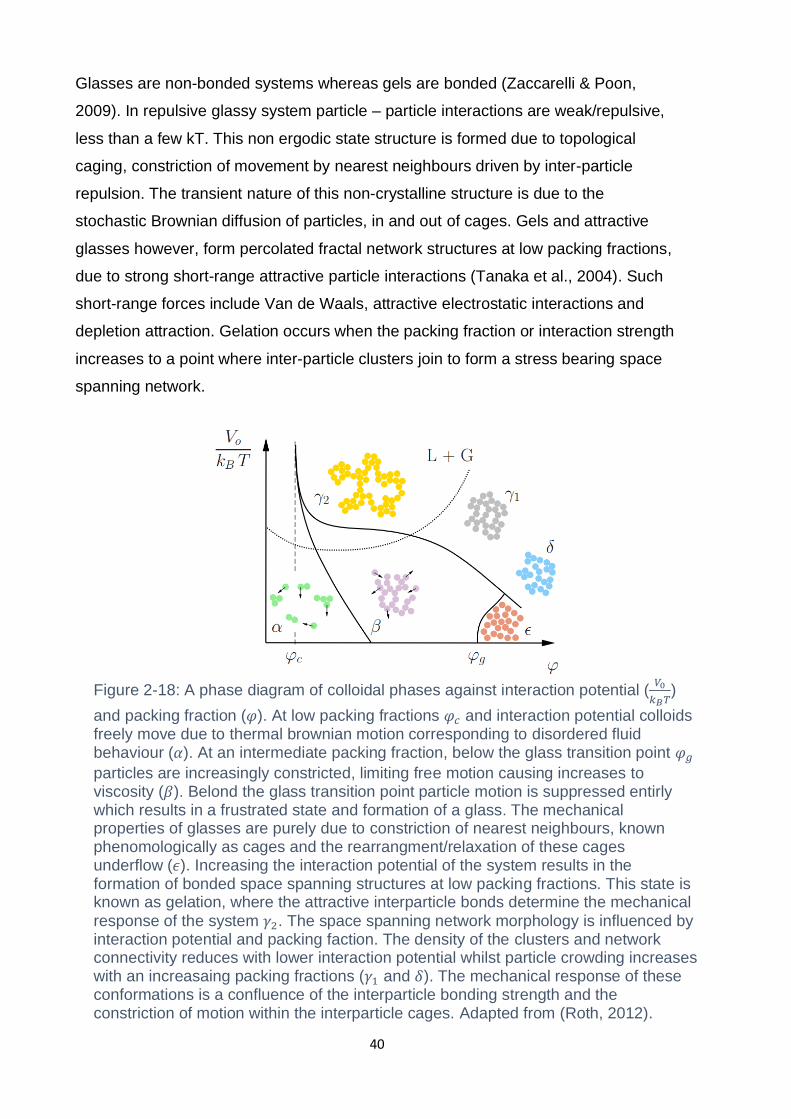
40
Glasses are non-bonded systems whereas gels are bonded (Zaccarelli & Poon,
2009). In repulsive glassy system particle – particle interactions are weak/repulsive,
less than a few kT. This non ergodic state structure is formed due to topological
caging, constriction of movement by nearest neighbours driven by inter-particle
repulsion. The transient nature of this non-crystalline structure is due to the
stochastic Brownian diffusion of particles, in and out of cages. Gels and attractive
glasses however, form percolated fractal network structures at low packing fractions,
due to strong short-range attractive particle interactions (Tanaka et al., 2004). Such
short-range forces include Van de Waals, attractive electrostatic interactions and
depletion attraction. Gelation occurs when the packing fraction or interaction strength
increases to a point where inter-particle clusters join to form a stress bearing space
spanning network.
Figure 2-18: A phase diagram of colloidal phases against interaction potential (𝑉0
𝑘𝐵𝑇)
and packing fraction (𝜑). At low packing fractions 𝜑𝑐 and interaction potential colloids freely move due to thermal brownian motion corresponding to disordered fluid behaviour (𝛼). At an intermediate packing fraction, below the glass transition point 𝜑𝑔
particles are increasingly constricted, limiting free motion causing increases to viscosity (𝛽). Belond the glass transition point particle motion is suppressed entirly which results in a frustrated state and formation of a glass. The mechanical properties of glasses are purely due to constriction of nearest neighbours, known phenomologically as cages and the rearrangment/relaxation of these cages underflow (𝜖). Increasing the interaction potential of the system results in the formation of bonded space spanning structures at low packing fractions. This state is known as gelation, where the attractive interparticle bonds determine the mechanical
response of the system 𝛾2. The space spanning network morphology is influenced by interaction potential and packing faction. The density of the clusters and network connectivity reduces with lower interaction potential whilst particle crowding increases with an increasaing packing fractions (𝛾1 and 𝛿). The mechanical response of these conformations is a confluence of the interparticle bonding strength and the constriction of motion within the interparticle cages. Adapted from (Roth, 2012).
41
The transition between gel and glassy rheology is determined by the interplay
between caging and bonding dynamics (Jia et al., 2018). As a consequence of the
different length scales associated with bonding and caging, materials which feature
both display different yielding dynamics, depicted in Figure 2-18.
2.7 Colloidal polymer gels
Colloidal polymer gel networks are self-supporting networks, composed of mixtures
of colloids and polymers. The interactions which govern colloidal gel self-assembly
are dependent upon the enthalpic interactions between polymers and colloidal
(Zaccarelli, 2007). When enthalpic interaction is high enough this leads to permanent
polymer absorption on the colloid surface. However, where enthalpic interaction isn’t
high enough this leads to a non-absorbing state, where the polymer isn’t absorbed on
the colloidal surface. In colloidal gels with a high non absorbing polymer
concentration the entropic depletion attraction governs self-assembly (Eckert &
Bartsch, 2002). Depletion attraction occurs when the non-absorbing polymer within
the system is excluded from the surface at the colloid excluded volume layer. This
leads to regions between proximate colloids where polymer is excluded, known as
the overlap layer. The formation of the overlap layer induces an osmotic pressure
and effective attractive force between the colloids, leading to contact aggregation
(Marenduzzo et al., 2006). This type of attraction leads to an increase in the entropy
of the colloidal polymer system. The magnitude of the depletion attraction is
dependent upon the molecular weight of the polymer. Longer polymer chains result in
a larger depletion layer, which causes an increase the effective attractive force and
influences the structure of depletion induced aggregates (Burns et al., 2002).
For polymer colloids mixtures where polymer is absorbed onto a colloidal surface,
two enthalpic interaction processes can occur. The thickness of the absorbed layer is
determined by the solvent properties, such as ionic concentration and pH and the
polymer chain length and concentration (Cohen Stuart et al., 1985). For instance, in
solutes with high ionic strengths bridging flocculation is reduced as the polymer
chains compress onto the colloidal surface. Regions on the colloid unsaturated with
polymer may bond through polymer bridging (Swenson et al., 1998). Polymer
bridging results in the formation of aggregated structures and can lead to gelation.
The extent of aggregation is dependent upon the affinity of the polymer to the
colloidal surface, for weakly adhesive polymers where interaction strength is below
that of the system thermal energy bonding will be reversible (F. Yan et al., 2018). The
42
extent of bonding is also dependent upon the polymer weight, or chain length. Long
chain polymers have been shown computationally to result in the formation of loops
or double bonds (multiple colloidal polymer bonds on the same colloid), wasting
potential bonds with neighboring colloids and increasing interstitial space (Howard et
al., 2019). Polymer bridging interaction strength increases with polymer
concentration, until a maximum bridging interaction point. Beyond this concentration
point for thermodynamically stable bound polymer steric effects induce a repulsive
interaction and excess polymer addition results in an increase in steric repulsion, and
the emergence of steric stabilization, which prevents colloidal contact aggregation
(Weeks et al., 2000). However colloidal/polymer mixtures can also display spectrums
of these interaction behaviors. In mixtures where absorbed layers and a non-
absorbed polymer a combination of short-range repulsion and long-range attraction is
present, a behavior known as tele bridging (Hooper & Schweizer, 2005).
The structure of polymer colloidal gel mixtures can be decomposed into two
networks, the colloidal network, which is mediated through the aforementioned
entropic and enthalpic processes and the polymer network with forms between
interacting polymer chains in the solvent phase. Polymer networks are mediated by a
combination of physical, ionic and covalent interactions which vary as a function of
the polymer chains properties. Physical interactions between long linear polymer
chains are mediated through the polymer molecular weight and relaxation behavior.
These characteristics are described using tube models such as the Doi Edward
model (Linnes et al., 2013). In tube-based models polymer chain dynamics are
described based upon the extent of topological constriction by neighboring polymer
chains otherwise known as entanglement. In dense polymer solutions the thermal
motion of the chains, known as reptation determines the relaxation behavior of the
network. Increased constriction causes a reduction to chain relaxation time resulting
in increased network strength. Ionic crosslinking between polymer chains is
dependent upon the charge and protonated state of the polymer. Polymers can be
cationic or anionic depending on the polymer chain chemistry and the pH of the bulk
solvent. The extent of polymer ionic crosslinking is therefore dynamic and
controllable, a trait which is harnessed in the production of responsive polymer
materials with switchable mechanical properties such as ionically responsive
elastomers (Miwa et al., 2018). The crosslinking of proteins and polysaccharides is
primarily driven by electrostatic, hydrogen bonding and hydrophobic interactions and
43
enzymatic crosslinking (Gentile, 2020). Covalently crosslinked polymer networks are
a function of the functional groups of the polymer and the concentration and valence
of the related ionic moiety or ion. Alginate for example is a polymer network which
requires the addition of calcium ions to form a gelated crosslinked structure (K. Y.
Lee & Mooney, 2012). The interaction of ligands and ionic metals mediates
crosslinking density and gelation through chelation, where cationic metals covalently
bind with ligand polymer networks (Magami & Williams, 2019).
Combinations of different types of polymer network lead to the formation of
interpenetrating polymer networks (Myung et al., 2008). Networks of this type have
combined properties from the individual networks which results in a confluence of the
mechanical attributes of each network, such in the construction of double network
hydrogels (Sun et al., 2016). The formation of a double network hydrogel can result
in enhanced hydrogel mechanical properties such as increased strength and
emergence of seal healing properties (Lei et al., 2020). The collective interacts
between colloidal and polymer networks are complex. Colloidal and matrix networks
are generally bonded through weak intermolecular forces. When sheared colloidal
motion induces hydrodynamic many body forces upon the polymer network structure,
resulting in the emergence of complex mechanical behaviors. For example, inclusion
of colloids into a polymer network can influence the stiffening and softening behavior
by influencing the relaxation dynamics of the polymer network (van Oosten et al.,
2019). One of the most well-known effects is the Payne or Fletcher-Gant effect which
was first seen in particle filled rubber polymer networks. The effect emerges as the
polymer particle filled material is sheared. The storage modulus of the material drops
rapidly with increasing strain and at a material dependent strain the viscous modulus
of the material increases, the magnitude of which is dependent upon the filler
concentration (Drozdov & Dorfmann, 2002). The precise mechanism governing this
effect is still debated however a number of possible mechanisms have been
proposed such as; the breakdown/ reformation of the filler network, molecular
disentanglement, agglomeration/deagglomeration of filler aggregates and desorption
of the polymer chain bridges from the colloidal phase of the mixture (Heinrich &
Klüppel, 2002).
44
2.8 Bacteria used within this thesis
In this thesis a variety of bacteria are used, this section provides background
information of each strain and the motivation behind their selection for rheological
analysis.
2.8.1 Pseudomonas fluorescens
Pseudomonas fluorescens is a rod-shaped, gram-negative bacterium commonly
found in soil and water environments. In soils P. fluorescens has been shown to
influence the mechanical properties of vermiculite and clays (Genovese, 2012). The
EPS of P. fluorescens is known to be composed of functional amyloids which confer
protection from desiccation and controls hydrophobicity and stiffness (Zeng et al.,
2015). P. fluorescens biofilms have also been shown to have a high content of uronic
acid, where uronic acid content in EPS was found to be between 32.8 – 39.3% when
grown on glass and stainless steel (Kives et al., 2006). A major biofilm component of
P. fluorescens is the adhesive protein LapA (large protein A), which is required for
biofilm formation and cell surface localization. LapA is a large repeat surface protein
and has an estimated molecular weight of ~520 kDa (Boyd et al., 2014). When
knockout strains of LapA were compared to wild type, the cellular adhesive force was
found to drop by a factor of 2 (Ivanov et al., 2012). The rheology of P. fluorescens
has been studied using several different techniques. Interfacial rheology was used to
characterise the time dependent mechanical properties of P. fluorescens pellicle
(Patrick A Rühs et al., 2013), while CLSM microrheology was used to map local
mechanical properties of statically grown P. fluorescens, revealing heterogeneities
between the bacterial clusters and the void spaces (H. Cao et al., 2016). Recently P.
fluorescens was used in a co-culture experiment with Bacillus licheniformis and the
rheology of singular and mixed agar grown biofilms was compared. P. fluorescens
was seen to dominate the co-culture population, and the resulting mechanical
properties of the biofilm tended towards the properties of monoculture P. fluorescens
(Abriat et al., 2019).
Pseudomonas fluorescens was selected as the model species for the experiments in
chapter 1 due to the notable effect of chemical treatments on a bacterium found in
the same genus Pseudomonas aeruginosa. Pseudomonas fluorescens was selected
as a strain which was anticipated to respond to treatments with divalent cations and
urea. I wanted to demonstrate the applicability of LAOS rheological techniques in
characterising biofilm and detecting changes (in this case chemical composition) to
45
the biofilm microstructure. Pseudomonas fluorescens is also a soil dwelling strain
which may encounter elevated concentrations of CaCl2 and FeCl2 and urea. However,
the concentrations used within this chapter were increased beyond what would be
expected to be found in nature. This was done to maximise the putative effect on the
biofilm rheology. This is a commonly used method for chemical treatment studies on
biofilm, as will be discussed in the chapter introduction.
2.8.2 Pantoea sp.
Pantoea sp. YR343 is a rod shaped, gram negative, motile bacterium, originally
isolated from the rhiziosphere of Populus deltoides (Bible et al., 2016). Pantoea sp.
YR343 is a nonpathogenic root and a plant leaf coloniser. It can promote plant
growth through the biosynthesis of indole 3 acetic acid (IAA). IAA synthesis also
results in the upregulation of EPS substances. When grown under flow, Pantoea sp.
YR343 forms compact multicellular structures which can cause blockages in complex
porous geometries (Aufrecht et al., 2019). Pantoea YR343 UDP is a deletion mutant
of YR343 which is defective in EPS biosynthesis of amylovoran and stewartin, and
forms linked cellular structures in flow (Aufrecht et al., 2019). Stewartin and
amylovoran are both anionic polysaccharides; composed of glucose, galactose and
gluconic acid (Bellemann et al., 1994). Functional divergence between the two is
thought to have occurred at a protein level (Carlier et al., 2009). UDP is a gene that is
also found in both Pantoea stewartin and Pantoea amylovran. Pantoea stewartii and
Erwinia amylovora are known to agglomerate into structures known as symplasmata
(Tecon & Leveau, 2016; Jing Yang et al., 2017)
Symplasmata clusters form from single cells and grow to contain several hundred
densely aggregated cells, independent of the adhering surfaces, differentiating this
phenotype from a biofilm (Cindy & Jean-Michel, 2003). This phenotype can be
comparable to autoaggregation which occurs in a variety of different bacteria such as
Escherichia. coli and Staphylococcus aureus. Autoaggregation is typically mediated
by EPS surface molecules called autoagglutinins (Trunk et al., 2018). Autoagglutinins
are a broad term encompassing surface proteins, eDNA and exopolysaachrides
which promote aggregation and flocculation. Symplasmata formation has been
postulated to be a protective mode of bacterial growth formed in response to
environmental conditions, such as limited carbon sources and low pH. Typical
characteristics of symplasmata clusters include dense cell-cell packing, a reduced
46
metabolic rate and oxygen level, and a reduction in transmembrane protein
expression (Achouak et al., 1994; Feng et al., 2003; Yu et al., 2016). Various genes
linked with uptake or degradation of carbon sources and phase variation have been
linked to symplasmata (Duan et al., 2007; Jing Yang et al., 2017). In P. agglomerans
symplasmata formation is linked to the LysR – type transcription regulator lrhA. The
IrhA (LysRhomologue A) protein controls flagella motility and has been linked to
regulation of EPS production in Pantoea alhagi. Symplasmata formation has been
shown to be dependent upon c-di-GMP in Erwinia amylovora (Edmunds et al., 2013;
Jiang et al., 2015). An omnipresent feature of symplasmata is the production of
extracellular capsular polysaccharides (CPS) commonly associated with adhesion,
biofilm proliferation and virulence towards plants (Minogue et al., 2002).
Pantoea sp. YR343 was selected for experimentation to look into the effect of EPS
secretion on biofilm rheology and microstructure due to the large difference in EPS
production between the wild type and selected UDP mutant, which has a reduced
production of amylovoran, a capsular polysaccharide (details of mutation found
4.2.1). Pantoea sp. YR343 is also a plant root colonizer which is a plant growth
promoting rhizobacteria (PGPR). A comprehensive understanding the rheology of
Pantoea sp. YR343 may help to inform understanding of how soil networks are
affected by inclusion of Pantoea sp. YR343.
2.8.3 Neisseria polysaccharea
Neisseria polysaccharea is a diplococcus, gram negative bacterium closely related to
Neisseria meningitidis, and was originally isolated from the throats of healthy children
from Europe and Africa (J. Y. Riou et al., 1983). The EPS of N. polysaccharea is
known to be composed of NpAS (Neisseria polysaccharea amylosucrase), which can
synthesis an amylosucrose type polymer at high sucrose concentration (Daudé et al.,
2013; Potocki de Montalk et al., 2000). This exopolysaccharide is produced in
copious amounts in the presence of sucrose on agar plates and is composed of D-
glucose (J.-Y. Riou et al., 1986). This bacterium was selected for comparison against
P. fluorescens, Streptococcus epidermidis and Comamonas denitrificans due to its
diplococcus shape and predominant polysaccharide EPS matrix.
2.8.4 Staphylococcus epidermidis
Staphylococcus epidermidis is a cocci, gram positive bacterium which is commonly
found on the human skin and in infections associated with contaminated medical
equipment, such as catheters (Otto & Silhavy, 2002). The EPS of S. epidermidis is
47
mainly comprised of PIA (Polysaccharide intercellular adhesion) a 210 kDa
polysaccharide composed of repeating units of N- acetylglucosamine (chitosan)
which is deposited on the cell wall surface (Cramton et al., 1999; M Ganesan et al.,
2013). The network structure of PIA in S. epidermidis is thought to be predominantly
structured through associative mechanisms of PIA, as opposed to entanglements (M
Ganesan et al., 2013). The EPS of S. epidermidis also I known to be composed of a
large repeat surface protein and surface adhesion protein Bap (Biofilm associated
protein), which is a predominant component found in S. epidermidis biofilms isolated
from human infections (Piessens et al., 2012). Certain strains of S. epidermidis are
known to have large quantities of Embp (Extracellular matrix binding protein) a 1
MDa protein which promotes intercellular bonding and binds to the EPS matrix
(Christner et al., 2010). The viscoelasticity of S. epidermidis has been shown to vary
depending upon NaCl concentration; 86 and 135 mM NaCl results in increases to the
elastic and viscous moduli, whereas at high concentrations of 770 mM the moduli
decrease by an order of magnitude (Pavlovsky et al., 2013). The cause of this
rheological change is possibly explained by a separate experiment on S. epidermidis,
which used identical concentrations of NaCl, but focused upon microstructural
changes. Here local number density was used to identify distinct density structural
phenotypes. It was found that increasing NaCl resulted in lower packing fractions.
Interestingly the presence of vancomycin also resulted in a lower packing fraction
(Mahesh Ganesan et al., 2016; Stewart et al., 2015). S. epidermidis has been used
to test the hypothesis that biofilms behave and self-assembly like a colloidal polymer
gels. In this experiment S. epidermidis biofilms were compared with cultures of S.
epidermidis mixed with isolated PIA and a colloids - PIA mixture. The resulting
colloidal – PIA gel had a comparable microstructure and rheology to the S.
epidermidis biofilm. The rate of self-assembly of the colloid - PIA and S. epidermidis
biofilm was controlled by pH (Stewart et al., 2015).
S. epidermidis was selected for comparison against P. fluorescens, Neisseria
polysaccharea and Comamonas denitrificans due to its commonality with P.
fluorescens in having a major EPS component as a large repeat surface protein. Also
since S. epidermidis is a cocci strain it would be a suitable analogue to a sphere
colloidal gel system, which have an extensive literature regarding LAOS behavior.
This characteristic would provide a way of accessing how the cocci shape influences
breakdown in comparison to the rod-shaped strains. It was also selected due to the
48
known presence of intracellular adhesins within its EPS matrix, which were expected
to contribute to short range bonding.
2.8.5 Comamonas denitrificans
Comamonas denitrificans is a rod shaped, gram negative bacterium originally
isolated from activated sludge and commonly used as a biomarker for denitrification
in wastewater treatment plates due to its efficient denitrifying activity (Andersson et
al., 2008). C. denitrificans is a motile bacterium with a polar flagellum which forms
filamentous chains in liquid culture (Gumaelius et al., 2001). The EPS of C.
denitrificans is composed of proteins, polysaccharides and has a high content of
eDNA. A thick layer of polysaccharide is produced around cell chains when grown in
liquid, and the polysaccharide fraction is mainly composed of glucose and mannose
(Andersson et al., 2009). C. denitrificans is also known to be a dominant
exoelectrogenic bacterium (Xing et al., 2010) and have been detected as an anode
populating bacterium in a constructed wetland microbial fuel cell system (F. Xu et al.,
2019). This bacterium was selected for experimentation due to its filamentous
growth, which I hypothesized would involve a short-range bonding. This contrasted
with the other selected strains which were not filamentous. Additionally, it was
selected due to its increasingly apparent industrial relevance in wastewater systems
and application within microbial fuel cells.
49
Chapter 3 Rheology of P. fluorescens in different chemical environments
3.1 Introduction
Biofilms are a communal form of bacterial growth, which attach to and colonise
aqueous surfaces (Flemming & Wingender, 2010). A defining feature of biofilm
proliferation is the production of self-secreted extracellular polymeric substances
(EPS), which confer the encapsulated bacteria protection from external challenges
and determine biofilm architecture (Hobley et al., 2015). EPS is composed of
polysaccharides, eDNA, lipids and a multitude of proteins. The EPS/bacterial
composite material is a heterogeneous non equilibrium system, where structural
properties evolve with time and in response to environmental conditions (Nadell et
al., 2016). The dynamic combination of phenotypic responses and physicochemical
interactions within the EPS results in large inter and intra species structural
variability. The spatial organisation of biofilm contributes to specific biological
functions, such as protection from bacteriophage attack and antibiotic challenges
(Vidakovic et al., 2018). It has also been hypothesised that biofilms adapt the EPS
composition to their local environment to improve mechanical resistance to removal
(Kovach et al., 2017). It is therefore important to understand how EPS composition
and the chemical environment influence the microstructure and mechanics of
biofilms.
Biofilms characteristically exhibit viscoelastic mechanical behaviour, a time
dependent response to applied stresses. Viscoelastic behaviour confers mechanical
benefits to biofilm, such as resistance to erosion and the formation of complex
structures, such as streamers (Kundukad et al., 2016). Due to the species - species
variation in EPS matrix composition biofilms form a wide array of structures with
different mechanical characteristics. These characteristics are also influenced by
environmental physiochemical conditions. Microfluidic grown biofilms are highly
hydrated, while biofilms grown at the liquid/air interface result in highly packed
structures. Biofilms typically have viscoelastic properties akin to frustrated state
materials like glasses or gels. Self- assembly of these frustrated states within a
biofilm features numerous physicochemical interactions. EPS structure is determined
by the secretion of species dependent polymers and physicochemical interactions
between polymer chains, such as branching, crosslinking, protein aggregation and
folding. While interparticle interactions are mediated by ionic concentration, hydrogen
bonding, van de Waals forces and cell-cell mechanical interactions (Jing Yan et al.,
2019).
50
Biofilms grow in diverse chemical environments. In natural environments, such as
pipe systems, chemicals such as iron and calcium may be found in high
concentrations. In environments where biofilm formation has damaging
consequences, exogenous addition of metal salts can be used to disrupt the biofilm
structure. Therefore, it is important to understand how metal salts modify biofilm
rheology. Both Fe and Ca ions can be commonly found in the biofilms from different
environments (Das et al., 2014). The presence of metal ions within polymer solutions
can cause ionic crosslinking between the polymer chains within polymer networks
resulting in altered mechanical properties (Mccoy & Muthukumar, 2010). In B. subtilis
metal ions Fe2+ and Cu2+ have a fortification effect, due to effective crosslinking,
resulting in increased elasticity (Grumbein et al., 2014). Typically, rheological studies
investigating the effects of ion salts on biofilm viscoelasticity use higher molar
concentrations than typically found in nature in order to maximise the putative effect
on rheology. Studies applying chemical treatment using a 30-60 minutes soak in the
selected metal ions have ranged between 50 mM up to 1 M in B. subtilis (Grumbein
et al., 2016; Klotz et al., 2019). Metal ion studies on P. aeruginosa and S. epidermidis
used a concentration of 0.2 M for a soak of 60 minutes (Jones et al., 2011), whilst a
similar study on P. aeruginosa used concentrations ranging from 50 mM to 250 mM
for a 60 minutes soak (Lieleg et al., 2011). A concentration of 0.25 M was used for
various divalent cations for a 300 minutes soak of Azotobacter vinelandii (Kretschmer
& Lieleg, 2020a).
Urea is an organic compound and known ‘chaotropic agent’ used in the treatment of
biofilm and known to effect electrostatic interactions within polymer solutions through
disruption of hydrogen bonds. Urea reduces the quality of water as a solvent
reducing the solubility of polymer in water. S. epidermidis and P. aeruginosa biofilms
have both been shown to weaken when treated with urea (Brindle et al., 2011). The
treatment of flow cell grown S. epidermidis with 0.5 M urea was shown to cause
swelling of 53% and an increase in compliance which coincided with significant
biofilm removal. However, the effect of urea treatment on the rheology of P.
fluorescens biofilm is presently unknown.
Viscoelastic behaviour can be decomposed into two regions, the linear viscoelastic
region (LVER) and the non-linear region. Measurements in the linear region quantify
the quiescent structure of a system, whilst in the nonlinear region the elastic and
viscous properties of a material are a function of the applied strain. Typically, biofilms
51
are measured within the LVER however in the real-world biofilms experience large
shear forces, in which a biofilm will deform within the nonlinear regime. Therefore, to
understand this understudied rheological regime I propose to use large amplitude
oscillatory shear (LAOS).
Large amplitude oscillatory shear (LAOS) tests investigate the non-linear viscoelastic
behaviour of soft materials. Three main analytical techniques are used with LAOS
data, each approach; Fourier transform rheology, Chebychev analysis and the series
of physical processes (SPP) quantifies the nonlinear viscoelastic response at
different temporal scales within an oscillatory cycle. These respective approaches
can be categorised as; intercycle, intracycle and instantaneous methods of analysing
oscillatory shear data recorded by a rheometer. LAOS tests have been performed on
various colloidal, gel and polymer melt systems to investigate structure - property
relationship. Experiments using model materials mediate viscoelastic response and
material microstructure by varying physicochemical parameters such as ionic
concentration and packing fraction (Juntae et al., 2014; Kim et al., 2014). Adopting a
similar parametric approach for biofilms may help to improve the interpretation of
biofilm rheological studies. This may enable researchers to answer questions
regarding the range and strength of mechanical interactions within biofilms as well as
introducing an improved technique over conventional methods to access how
chemical treatments, polymer expression and environmental conditions effect biofilm
nonlinear viscoelastic behaviour.
In this chapter I establish protocols designed to investigate the non-linear viscoelastic
behaviour of biofilm using a model bacterium, P. fluorescens. I employed several
LAOS analytical methods to explain how the non-linear rheology of P. fluorescens
biofilms is affected by treatment with different chemical compounds. The chemical
concentrations used in this chapter are typically greater than seen in nature. This
was a conscious decision used to increase the putative effect of the chemical
treatment on the biofilm rheology as a proof of concept of applicability of LAOS
techniques.
3.2 Materials and Methods
3.2.1 Bacterial culture and sample collection
P. fluorescens (Migula 1895) was grown overnight in LB broth (Lennox, Sigma) from
glycerol stocks at 24 oC with shaking (150 rpm). Overnight cultures of P. fluorescens
(250 µL) was spread onto 1.5 % nutrient broth (24 g/L) agar plates with an L-shaped
52
spreader. The cultured agar plates were then incubated at 24 oC for 3 days. Before
rheological characterisation, biofilms were incubated with 2 ml of 100 mM of FeCl2,
CaCl2, urea or DDH2O for 60 mins. A concentration of 100mM was selected to
maximise the putative effect on biofilm rheology. The biofilm incubated with 2 ml
DDH2O was considered the control sample. After 60 mins the supernatant was
discarded and the was biofilm left for 15 mins before testing. Biofilm was collected
from the agar plates by scraping with a ground edge microscope slide. Biofilm was
collected from 3 plates and transferred to the rheometer. Approximately 0.3 ml of
biofilm was used for each test.
3.2.2 Linear rheological measurement
Rheological measurements were performed using a rheometer (Malvern Kinexus
Pro+,UK) mounted on a passive isolation plate. The rheometer was operated in a
strain-controlled mode. A 20 mm parallel plate geometry was used for all tests. To
minimise slip between the biofilm and the parallel plates, 120 grade waterproof grit
paper was attached to both the top and bottom plates. Biofilms were tested using a
gap height of 0.8-1.2 mm. Each sample was trimmed using a razor blade and the gap
height was adjusted to a normal force of 0.1 N. To prevent desiccation during
measurements a solvent trap was used. The temperature of the biofilm was
maintained at 25 oC using a Peltier plate which was built into the lower plate.
Frequency sweeps were performed from 0.1 Hz to 50 Hz at a strain amplitude (𝛾) of
1 %.
3.2.3 Non-linear rheological measurement
Samples were transferred to the rheometer as previously described and left to relax
for 5 minutes. Strain controlled LAOS measurements where performed for 24 strain 𝛾
amplitudes logarithmically spaced between 0.1 % and 250 %. All LAOS
measurements were performed at 1 Hz. Raw data for the time, the angular
displacement and the torque were sampled. For each strain 17 oscillatory cycles
were sampled to ensure steady state oscillations.The raw data was processed using
a custom matlab routine, found in appendix A. The Chebychev analysis was
performed using a matlab routine MITlaos, kindly provided by Prof Randy Ewoldt. For
each chemical treatment at least 3 biological replicate measurements were
performed to ensure the trends sampled were reproducible.
53
3.2.4 CLSM of chemically treated P. fluorescens biofilm
After respective treatments, biofilm samples were stained in situ with 10 µM Syto63
(Sigma, UK), a cell permeable DNA stain and incubated for 30 minutes. After
incubation biofilms were transferred from the agar surface to a 25 µL geneframe
(Sigma, UK) via scraping. The geneframe was sealed with a #1.5 coverslip. Imaging
was performed using a Leica SP8 confocal laser scanning microscopy (CLSM). Syto
63 was excited at a wavelength of 660 nm and an emission filter was set at 670-750
nm. A 100x oil immersion objective N/A 1.4 was used to image each biofilm. Random
fields of view (FOV) were selected for each treatment with a window size 101 µm
x101 µm. The pinhole was set at 1 airy units (AU). A total of n = 5 FOV were taken
for each treatment. An Image J and MATlab code was written for image analysis,
which are found in appendix B and C. Images were pre-processed by first applying a
contrast limited adaptive histogram equalization (CLAHE) filter with a box size of 127
for denoising and contract enhancement. The image was then further smoothed
using a Gaussian filter of radius 2. Then a Mexican hat filter of radius 3 was applied
to each image and result was thresholded using an Otsu threshold. Mexican hat
filtering, otherwise known as Laplacian of Gaussian filter (LoG), is a second
derivative filter used to filter areas of rapid change (Sotak & Boyer, 1989). This
method enables clear localisation of sharp edges and was the parameter with the
highest sensitivity effecting the packing fraction. Mexican hat kernel sizes of pixel
radius 2, 3 and 4 were compared. A radius of 4 resulted in an over estimation of
packing fraction, as 𝜙 > 0.68, above the random packing limit for rods with an aspect
ratio over 3 (Kyrylyuk et al., 2009). The kernel size was set at 3, as this had
substantially less noise than a kernel size of 2. To account for the cell membrane
after thresholding was completed a dilation step was performed, which corresponded
to an increase in cell width and cell length of 0.2 μm (Drescher et al., 2016). A
comparison of the different imaging parameters tested can be found in appendix D.
The packing fraction was then calculated as the ratio of cells to void space.
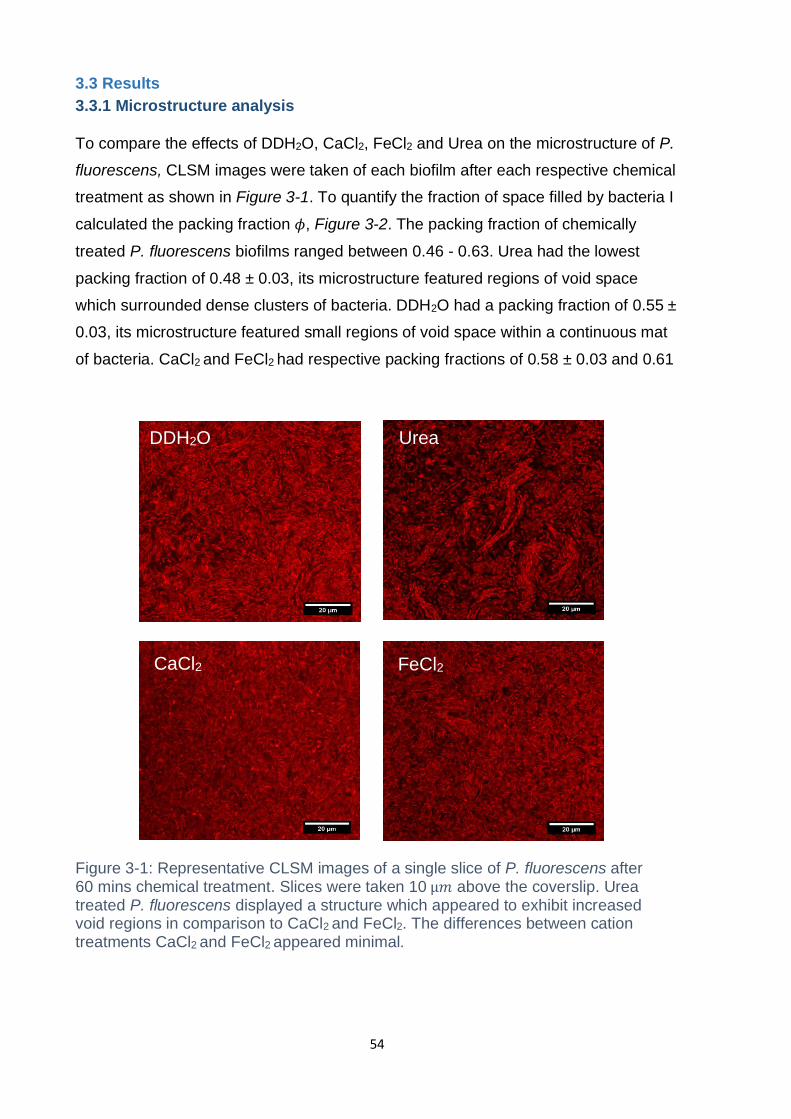
54
3.3 Results
3.3.1 Microstructure analysis
To compare the effects of DDH2O, CaCl2, FeCl2 and Urea on the microstructure of P.
fluorescens, CLSM images were taken of each biofilm after each respective chemical
treatment as shown in Figure 3-1. To quantify the fraction of space filled by bacteria I
calculated the packing fraction 𝜙, Figure 3-2. The packing fraction of chemically
treated P. fluorescens biofilms ranged between 0.46 - 0.63. Urea had the lowest
packing fraction of 0.48 ± 0.03, its microstructure featured regions of void space
which surrounded dense clusters of bacteria. DDH2O had a packing fraction of 0.55 ±
0.03, its microstructure featured small regions of void space within a continuous mat
of bacteria. CaCl2 and FeCl2 had respective packing fractions of 0.58 ± 0.03 and 0.61
DDH2O Urea
CaCl2 FeCl2
Figure 3-1: Representative CLSM images of a single slice of P. fluorescens after 60 mins chemical treatment. Slices were taken 10 µ𝑚 above the coverslip. Urea treated P. fluorescens displayed a structure which appeared to exhibit increased void regions in comparison to CaCl2 and FeCl2. The differences between cation treatments CaCl2 and FeCl2 appeared minimal.
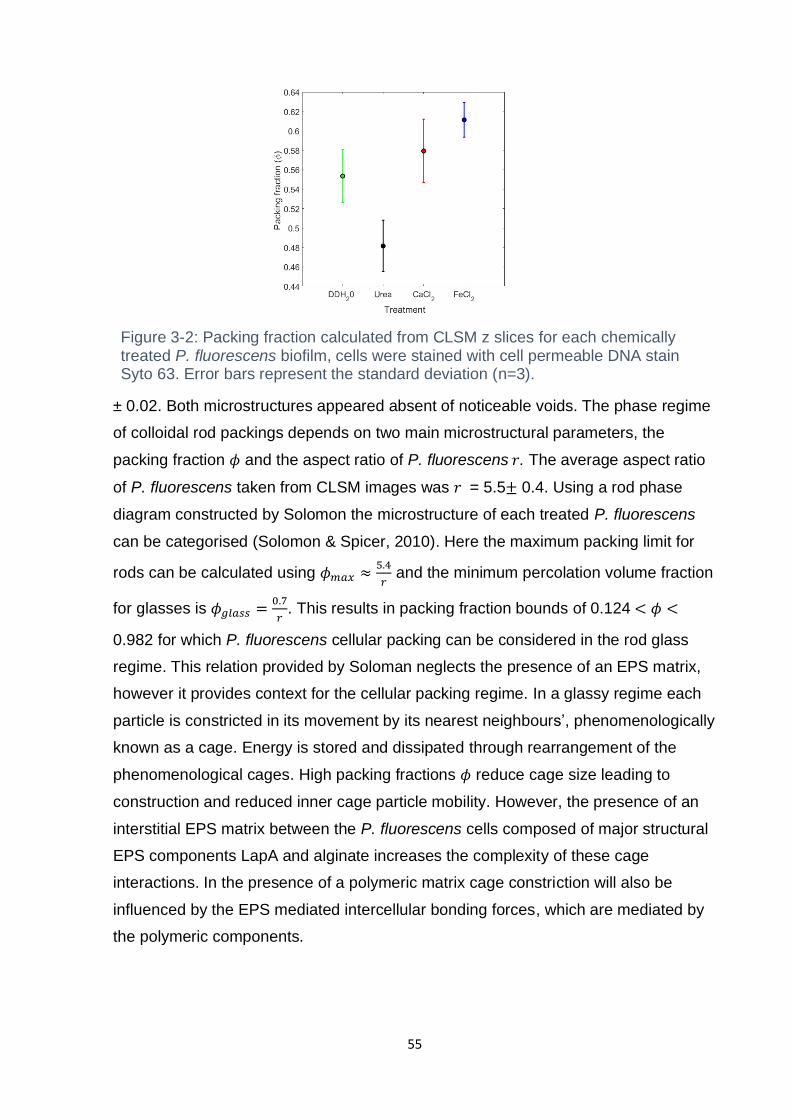
55
± 0.02. Both microstructures appeared absent of noticeable voids. The phase regime
of colloidal rod packings depends on two main microstructural parameters, the
packing fraction 𝜙 and the aspect ratio of P. fluorescens 𝑟. The average aspect ratio
of P. fluorescens taken from CLSM images was 𝑟 = 5.5± 0.4. Using a rod phase
diagram constructed by Solomon the microstructure of each treated P. fluorescens
can be categorised (Solomon & Spicer, 2010). Here the maximum packing limit for
rods can be calculated using 𝜙𝑚𝑎𝑥 ≈5.4
𝑟 and the minimum percolation volume fraction
for glasses is 𝜙𝑔𝑙𝑎𝑠𝑠 =0.7
𝑟. This results in packing fraction bounds of 0.124 < 𝜙 <
0.982 for which P. fluorescens cellular packing can be considered in the rod glass
regime. This relation provided by Soloman neglects the presence of an EPS matrix,
however it provides context for the cellular packing regime. In a glassy regime each
particle is constricted in its movement by its nearest neighbours’, phenomenologically
known as a cage. Energy is stored and dissipated through rearrangement of the
phenomenological cages. High packing fractions 𝜙 reduce cage size leading to
construction and reduced inner cage particle mobility. However, the presence of an
interstitial EPS matrix between the P. fluorescens cells composed of major structural
EPS components LapA and alginate increases the complexity of these cage
interactions. In the presence of a polymeric matrix cage constriction will also be
influenced by the EPS mediated intercellular bonding forces, which are mediated by
the polymeric components.
Figure 3-2: Packing fraction calculated from CLSM z slices for each chemically treated P. fluorescens biofilm, cells were stained with cell permeable DNA stain Syto 63. Error bars represent the standard deviation (n=3).
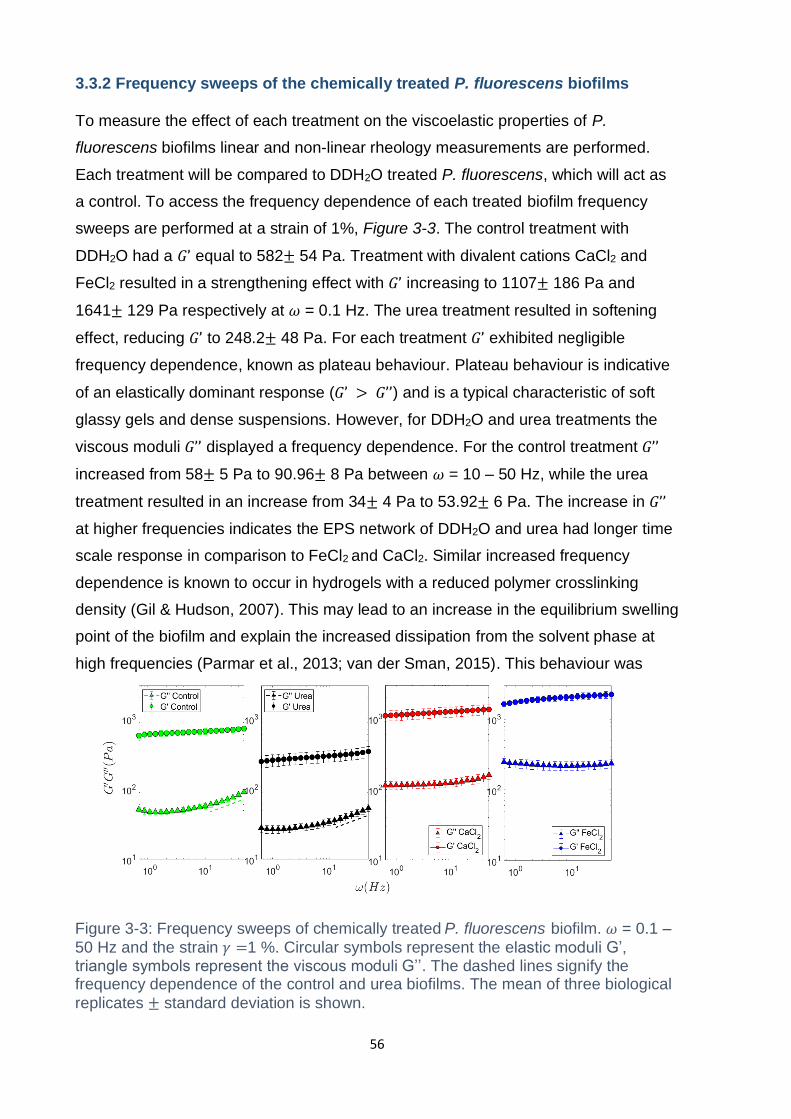
56
3.3.2 Frequency sweeps of the chemically treated P. fluorescens biofilms
To measure the effect of each treatment on the viscoelastic properties of P.
fluorescens biofilms linear and non-linear rheology measurements are performed.
Each treatment will be compared to DDH2O treated P. fluorescens, which will act as
a control. To access the frequency dependence of each treated biofilm frequency
sweeps are performed at a strain of 1%, Figure 3-3. The control treatment with
DDH2O had a 𝐺’ equal to 582± 54 Pa. Treatment with divalent cations CaCl2 and
FeCl2 resulted in a strengthening effect with 𝐺’ increasing to 1107± 186 Pa and
1641± 129 Pa respectively at 𝜔 = 0.1 Hz. The urea treatment resulted in softening
effect, reducing 𝐺’ to 248.2± 48 Pa. For each treatment 𝐺’ exhibited negligible
frequency dependence, known as plateau behaviour. Plateau behaviour is indicative
of an elastically dominant response (𝐺’ > 𝐺’’) and is a typical characteristic of soft
glassy gels and dense suspensions. However, for DDH2O and urea treatments the
viscous moduli 𝐺’’ displayed a frequency dependence. For the control treatment 𝐺’’
increased from 58± 5 Pa to 90.96± 8 Pa between 𝜔 = 10 – 50 Hz, while the urea
treatment resulted in an increase from 34± 4 Pa to 53.92± 6 Pa. The increase in 𝐺’’
at higher frequencies indicates the EPS network of DDH2O and urea had longer time
scale response in comparison to FeCl2 and CaCl2. Similar increased frequency
dependence is known to occur in hydrogels with a reduced polymer crosslinking
density (Gil & Hudson, 2007). This may lead to an increase in the equilibrium swelling
point of the biofilm and explain the increased dissipation from the solvent phase at
high frequencies (Parmar et al., 2013; van der Sman, 2015). This behaviour was
Figure 3-3: Frequency sweeps of chemically treated P. fluorescens biofilm. 𝜔 = 0.1 –
50 Hz and the strain 𝛾 =1 %. Circular symbols represent the elastic moduli G’, triangle symbols represent the viscous moduli G’’. The dashed lines signify the frequency dependence of the control and urea biofilms. The mean of three biological
replicates ± standard deviation is shown.
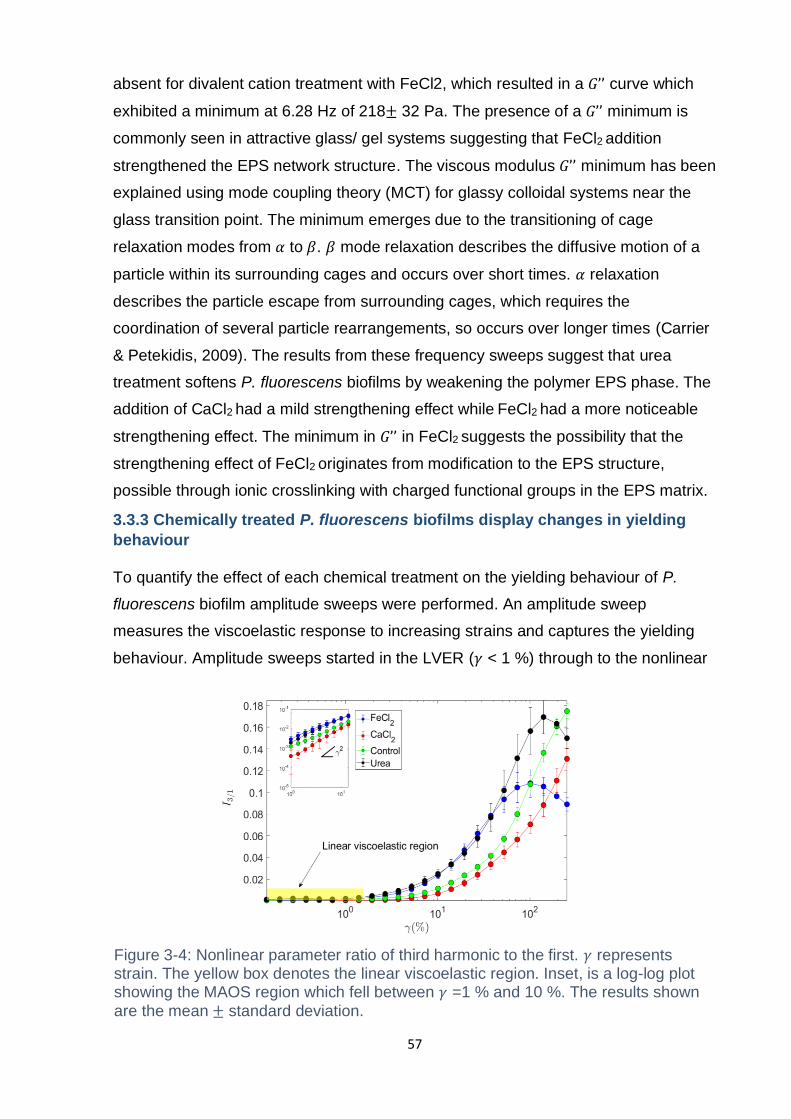
57
absent for divalent cation treatment with FeCl2, which resulted in a 𝐺’’ curve which
exhibited a minimum at 6.28 Hz of 218± 32 Pa. The presence of a 𝐺’’ minimum is
commonly seen in attractive glass/ gel systems suggesting that FeCl2 addition
strengthened the EPS network structure. The viscous modulus 𝐺’’ minimum has been
explained using mode coupling theory (MCT) for glassy colloidal systems near the
glass transition point. The minimum emerges due to the transitioning of cage
relaxation modes from 𝛼 to 𝛽. 𝛽 mode relaxation describes the diffusive motion of a
particle within its surrounding cages and occurs over short times. 𝛼 relaxation
describes the particle escape from surrounding cages, which requires the
coordination of several particle rearrangements, so occurs over longer times (Carrier
& Petekidis, 2009). The results from these frequency sweeps suggest that urea
treatment softens P. fluorescens biofilms by weakening the polymer EPS phase. The
addition of CaCl2 had a mild strengthening effect while FeCl2 had a more noticeable
strengthening effect. The minimum in 𝐺’’ in FeCl2 suggests the possibility that the
strengthening effect of FeCl2 originates from modification to the EPS structure,
possible through ionic crosslinking with charged functional groups in the EPS matrix.
3.3.3 Chemically treated P. fluorescens biofilms display changes in yielding
behaviour
To quantify the effect of each chemical treatment on the yielding behaviour of P.
fluorescens biofilm amplitude sweeps were performed. An amplitude sweep
measures the viscoelastic response to increasing strains and captures the yielding
behaviour. Amplitude sweeps started in the LVER (𝛾 < 1 %) through to the nonlinear
Figure 3-4: Nonlinear parameter ratio of third harmonic to the first. 𝛾 represents strain. The yellow box denotes the linear viscoelastic region. Inset, is a log-log plot showing the MAOS region which fell between 𝛾 =1 % and 10 %. The results shown
are the mean ± standard deviation.
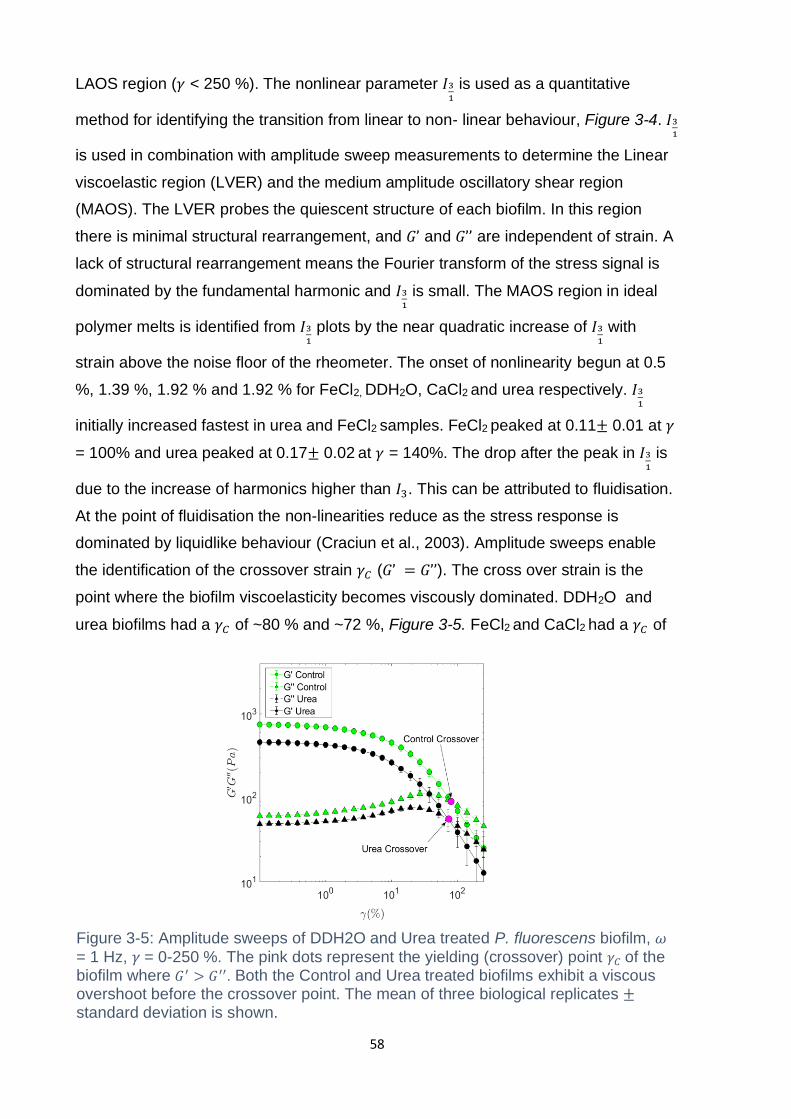
58
LAOS region (𝛾 < 250 %). The nonlinear parameter 𝐼31
is used as a quantitative
method for identifying the transition from linear to non- linear behaviour, Figure 3-4. 𝐼31
is used in combination with amplitude sweep measurements to determine the Linear
viscoelastic region (LVER) and the medium amplitude oscillatory shear region
(MAOS). The LVER probes the quiescent structure of each biofilm. In this region
there is minimal structural rearrangement, and 𝐺’ and 𝐺’’ are independent of strain. A
lack of structural rearrangement means the Fourier transform of the stress signal is
dominated by the fundamental harmonic and 𝐼31
is small. The MAOS region in ideal
polymer melts is identified from 𝐼31
plots by the near quadratic increase of 𝐼31
with
strain above the noise floor of the rheometer. The onset of nonlinearity begun at 0.5
%, 1.39 %, 1.92 % and 1.92 % for FeCl2, DDH2O, CaCl2 and urea respectively. 𝐼31
initially increased fastest in urea and FeCl2 samples. FeCl2 peaked at 0.11± 0.01 at 𝛾
= 100% and urea peaked at 0.17± 0.02 at 𝛾 = 140%. The drop after the peak in 𝐼31
is
due to the increase of harmonics higher than 𝐼3. This can be attributed to fluidisation.
At the point of fluidisation the non-linearities reduce as the stress response is
dominated by liquidlike behaviour (Craciun et al., 2003). Amplitude sweeps enable
the identification of the crossover strain 𝛾𝐶 (𝐺’ = 𝐺’’). The cross over strain is the
point where the biofilm viscoelasticity becomes viscously dominated. DDH2O and
urea biofilms had a 𝛾𝐶 of ~80 % and ~72 %, Figure 3-5. FeCl2 and CaCl2 had a 𝛾𝐶 of
Figure 3-5: Amplitude sweeps of DDH2O and Urea treated P. fluorescens biofilm, 𝜔
= 1 Hz, 𝛾 = 0-250 %. The pink dots represent the yielding (crossover) point 𝛾𝐶 of the biofilm where 𝐺′ > 𝐺′′. Both the Control and Urea treated biofilms exhibit a viscous overshoot before the crossover point. The mean of three biological replicates ± standard deviation is shown.
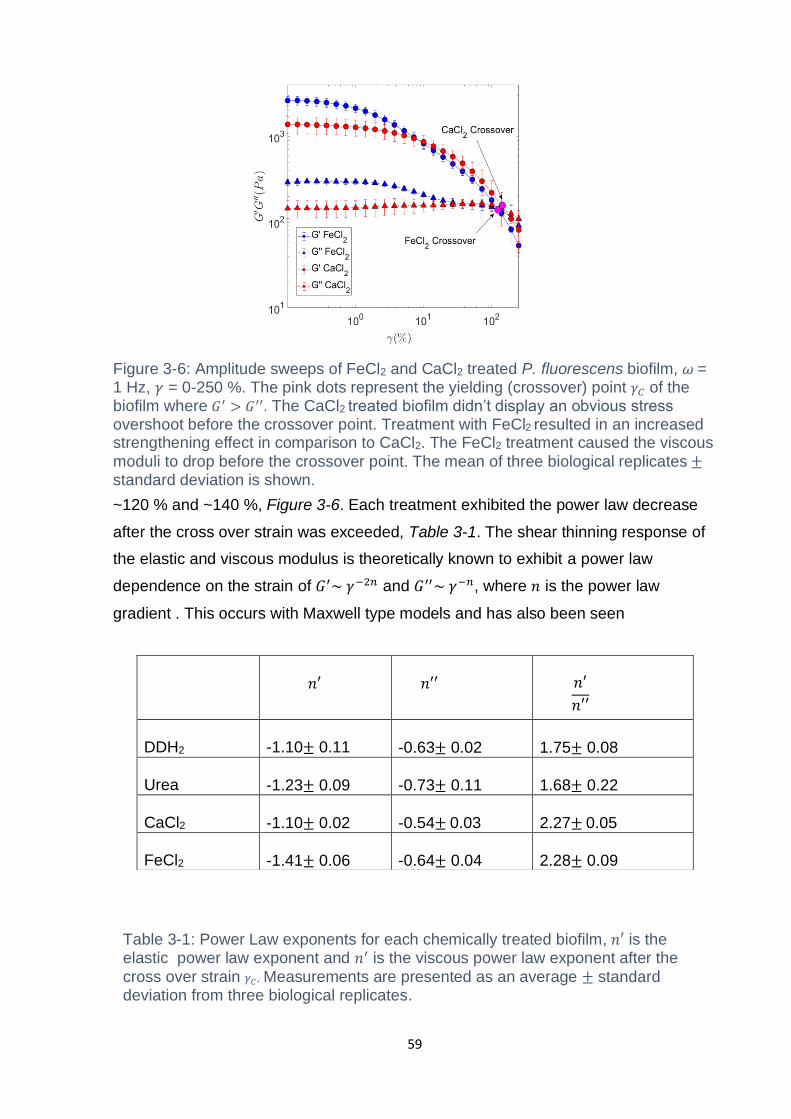
59
~120 % and ~140 %, Figure 3-6. Each treatment exhibited the power law decrease
after the cross over strain was exceeded, Table 3-1. The shear thinning response of
the elastic and viscous modulus is theoretically known to exhibit a power law
dependence on the strain of 𝐺′~ 𝛾−2𝑛 and 𝐺′′~ 𝛾−𝑛, where 𝑛 is the power law
gradient . This occurs with Maxwell type models and has also been seen
𝑛′ 𝑛′′ 𝑛′
𝑛′′
DDH2
O
-1.10± 0.11 -0.63± 0.02 1.75± 0.08
Urea -1.23± 0.09 -0.73± 0.11 1.68± 0.22
CaCl2 -1.10± 0.02
d
Type equation here.
-0.54± 0.03 2.27± 0.05
FeCl2 -1.41± 0.06 -0.64± 0.04 2.28± 0.09
Figure 3-6: Amplitude sweeps of FeCl2 and CaCl2 treated P. fluorescens biofilm, 𝜔 = 1 Hz, 𝛾 = 0-250 %. The pink dots represent the yielding (crossover) point 𝛾𝐶 of the biofilm where 𝐺′ > 𝐺′′. The CaCl2 treated biofilm didn’t display an obvious stress overshoot before the crossover point. Treatment with FeCl2 resulted in an increased strengthening effect in comparison to CaCl2. The FeCl2 treatment caused the viscous
moduli to drop before the crossover point. The mean of three biological replicates ± standard deviation is shown.
Table 3-1: Power Law exponents for each chemically treated biofilm, 𝑛′ is the elastic power law exponent and 𝑛′ is the viscous power law exponent after the
cross over strain 𝛾𝐶. Measurements are presented as an average ± standard deviation from three biological replicates.
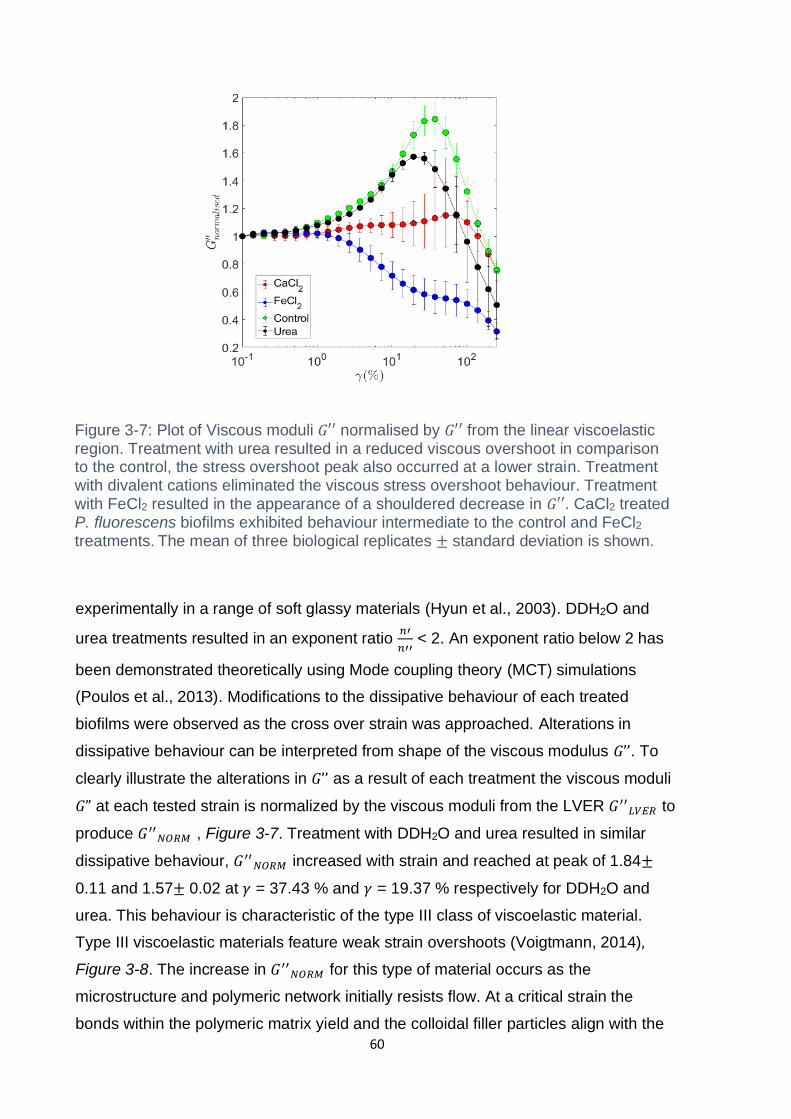
60
experimentally in a range of soft glassy materials (Hyun et al., 2003). DDH2O and
urea treatments resulted in an exponent ratio 𝑛′
𝑛′′ < 2. An exponent ratio below 2 has
been demonstrated theoretically using Mode coupling theory (MCT) simulations
(Poulos et al., 2013). Modifications to the dissipative behaviour of each treated
biofilms were observed as the cross over strain was approached. Alterations in
dissipative behaviour can be interpreted from shape of the viscous modulus 𝐺’’. To
clearly illustrate the alterations in 𝐺’’ as a result of each treatment the viscous moduli
𝐺” at each tested strain is normalized by the viscous moduli from the LVER 𝐺′′𝐿𝑉𝐸𝑅 to
produce 𝐺′′𝑁𝑂𝑅𝑀 , Figure 3-7. Treatment with DDH2O and urea resulted in similar
dissipative behaviour, 𝐺′′𝑁𝑂𝑅𝑀 increased with strain and reached at peak of 1.84±
0.11 and 1.57± 0.02 at 𝛾 = 37.43 % and 𝛾 = 19.37 % respectively for DDH2O and
urea. This behaviour is characteristic of the type III class of viscoelastic material.
Type III viscoelastic materials feature weak strain overshoots (Voigtmann, 2014),
Figure 3-8. The increase in 𝐺′′𝑁𝑂𝑅𝑀 for this type of material occurs as the
microstructure and polymeric network initially resists flow. At a critical strain the
bonds within the polymeric matrix yield and the colloidal filler particles align with the
Figure 3-7: Plot of Viscous moduli 𝐺′′ normalised by 𝐺′′ from the linear viscoelastic region. Treatment with urea resulted in a reduced viscous overshoot in comparison to the control, the stress overshoot peak also occurred at a lower strain. Treatment with divalent cations eliminated the viscous stress overshoot behaviour. Treatment with FeCl2 resulted in the appearance of a shouldered decrease in 𝐺′′. CaCl2 treated P. fluorescens biofilms exhibited behaviour intermediate to the control and FeCl2
treatments. The mean of three biological replicates ± standard deviation is shown.
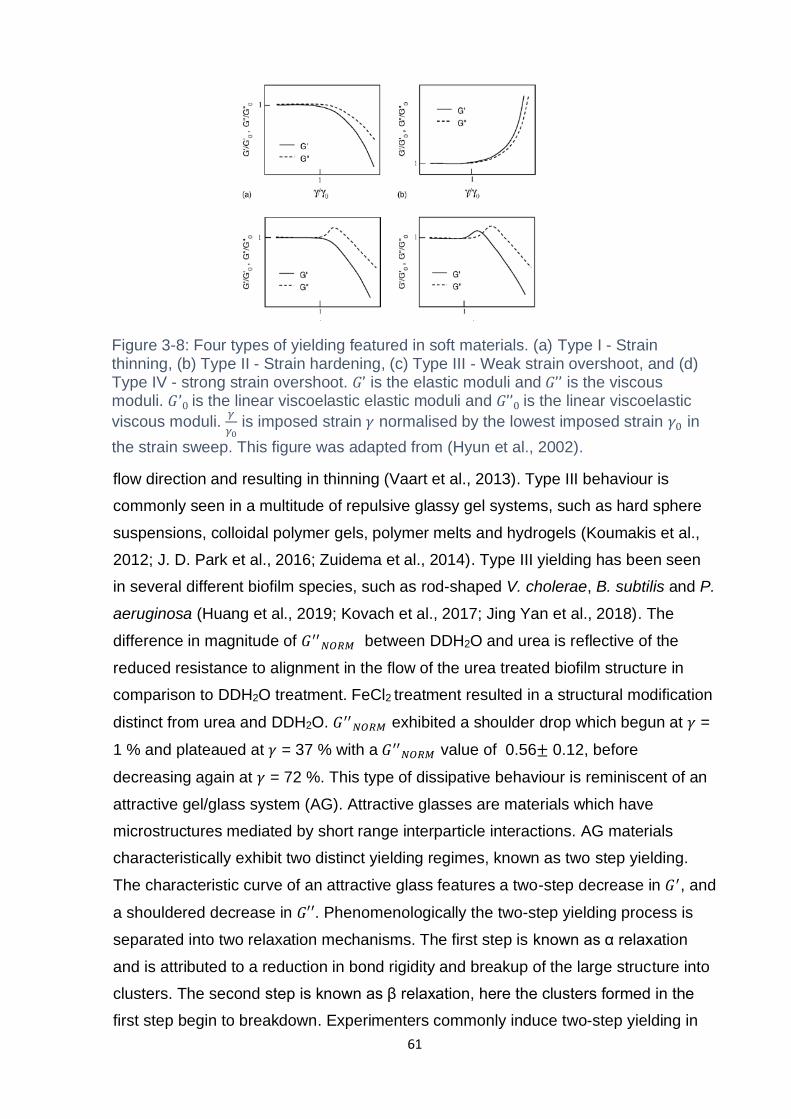
61
flow direction and resulting in thinning (Vaart et al., 2013). Type III behaviour is
commonly seen in a multitude of repulsive glassy gel systems, such as hard sphere
suspensions, colloidal polymer gels, polymer melts and hydrogels (Koumakis et al.,
2012; J. D. Park et al., 2016; Zuidema et al., 2014). Type III yielding has been seen
in several different biofilm species, such as rod-shaped V. cholerae, B. subtilis and P.
aeruginosa (Huang et al., 2019; Kovach et al., 2017; Jing Yan et al., 2018). The
difference in magnitude of 𝐺′′𝑁𝑂𝑅𝑀 between DDH2O and urea is reflective of the
reduced resistance to alignment in the flow of the urea treated biofilm structure in
comparison to DDH2O treatment. FeCl2 treatment resulted in a structural modification
distinct from urea and DDH2O. 𝐺′′𝑁𝑂𝑅𝑀 exhibited a shoulder drop which begun at 𝛾 =
1 % and plateaued at 𝛾 = 37 % with a 𝐺′′𝑁𝑂𝑅𝑀 value of 0.56± 0.12, before
decreasing again at 𝛾 = 72 %. This type of dissipative behaviour is reminiscent of an
attractive gel/glass system (AG). Attractive glasses are materials which have
microstructures mediated by short range interparticle interactions. AG materials
characteristically exhibit two distinct yielding regimes, known as two step yielding.
The characteristic curve of an attractive glass features a two-step decrease in 𝐺′, and
a shouldered decrease in 𝐺′′. Phenomenologically the two-step yielding process is
separated into two relaxation mechanisms. The first step is known as α relaxation
and is attributed to a reduction in bond rigidity and breakup of the large structure into
clusters. The second step is known as β relaxation, here the clusters formed in the
first step begin to breakdown. Experimenters commonly induce two-step yielding in
Figure 3-8: Four types of yielding featured in soft materials. (a) Type I - Strain thinning, (b) Type II - Strain hardening, (c) Type III - Weak strain overshoot, and (d) Type IV - strong strain overshoot. 𝐺’ is the elastic moduli and 𝐺’’ is the viscous moduli. 𝐺’0 is the linear viscoelastic elastic moduli and 𝐺’’0 is the linear viscoelastic
viscous moduli. 𝛾
𝛾0 is imposed strain 𝛾 normalised by the lowest imposed strain 𝛾0 in
the strain sweep. This figure was adapted from (Hyun et al., 2002).
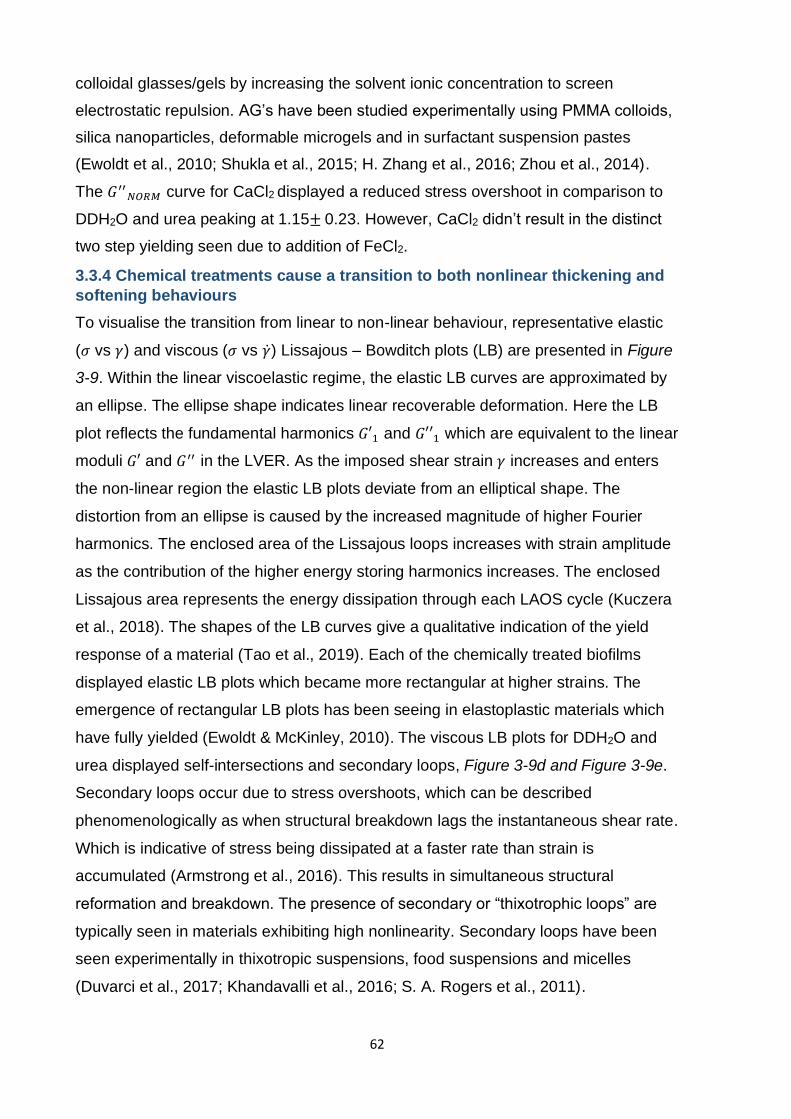
62
colloidal glasses/gels by increasing the solvent ionic concentration to screen
electrostatic repulsion. AG’s have been studied experimentally using PMMA colloids,
silica nanoparticles, deformable microgels and in surfactant suspension pastes
(Ewoldt et al., 2010; Shukla et al., 2015; H. Zhang et al., 2016; Zhou et al., 2014).
The 𝐺′′𝑁𝑂𝑅𝑀 curve for CaCl2 displayed a reduced stress overshoot in comparison to
DDH2O and urea peaking at 1.15± 0.23. However, CaCl2 didn’t result in the distinct
two step yielding seen due to addition of FeCl2.
3.3.4 Chemical treatments cause a transition to both nonlinear thickening and
softening behaviours
To visualise the transition from linear to non-linear behaviour, representative elastic
(𝜎 vs 𝛾) and viscous (𝜎 vs ��) Lissajous – Bowditch plots (LB) are presented in Figure
3-9. Within the linear viscoelastic regime, the elastic LB curves are approximated by
an ellipse. The ellipse shape indicates linear recoverable deformation. Here the LB
plot reflects the fundamental harmonics 𝐺′1 and 𝐺′′1 which are equivalent to the linear
moduli 𝐺′ and 𝐺′′ in the LVER. As the imposed shear strain 𝛾 increases and enters
the non-linear region the elastic LB plots deviate from an elliptical shape. The
distortion from an ellipse is caused by the increased magnitude of higher Fourier
harmonics. The enclosed area of the Lissajous loops increases with strain amplitude
as the contribution of the higher energy storing harmonics increases. The enclosed
Lissajous area represents the energy dissipation through each LAOS cycle (Kuczera
et al., 2018). The shapes of the LB curves give a qualitative indication of the yield
response of a material (Tao et al., 2019). Each of the chemically treated biofilms
displayed elastic LB plots which became more rectangular at higher strains. The
emergence of rectangular LB plots has been seeing in elastoplastic materials which
have fully yielded (Ewoldt & McKinley, 2010). The viscous LB plots for DDH2O and
urea displayed self-intersections and secondary loops, Figure 3-9d and Figure 3-9e.
Secondary loops occur due to stress overshoots, which can be described
phenomenologically as when structural breakdown lags the instantaneous shear rate.
Which is indicative of stress being dissipated at a faster rate than strain is
accumulated (Armstrong et al., 2016). This results in simultaneous structural
reformation and breakdown. The presence of secondary or “thixotrophic loops” are
typically seen in materials exhibiting high nonlinearity. Secondary loops have been
seen experimentally in thixotropic suspensions, food suspensions and micelles
(Duvarci et al., 2017; Khandavalli et al., 2016; S. A. Rogers et al., 2011).
63
To obtain quantitative metrics from the LB plots the thickening ratio (𝑇) [63] and the
softening ratio (𝑆) [62] are used. The thickening ratio represents viscous
thickening/thinning and the stiffening ratio (𝑆) represents elastic stiffening/softening.
Within the LVER both 𝑇 and 𝑆 are expected to be zero, when 𝑆 > 0 the material is
strain softening. Each treatment exhibited strain rate softening behaviour which
increased with increasing strain, Figure 3-10. Biofilms treated with DDH2O and urea
displayed rapid increases of 𝑆 with DDH2O biofilms peaking at 𝑆 = 2.95± 1.25 and
urea treated biofilms peaking at 𝑆 = 3.7± 1.9. After the respective peaks, the 𝑆 ratio
for DDH2O and urea both dropped below 0. The strain at which the 𝑆 drop occurred
Figure 3-9: Lissajous Bowditch (LB) curves, showing strains from 0.1 to 250%.Left column: Elastic Lissajous curves, Right column viscous Lissajous curves. (A,D): Control, (B,E): urea, (C,F): CaCl2, (D,G): FeCl2. LB curves represent the strain, strain rate and stress behaviour of the chemically treated biofilms through a single period of oscillation. Colour from blue to purple represents low to high strain amplitude values. The shear strain values are represented by 𝛾 and the shear strain rate values are
represented by ��. Red arrows in D and E highlight the presence of secondary loops.
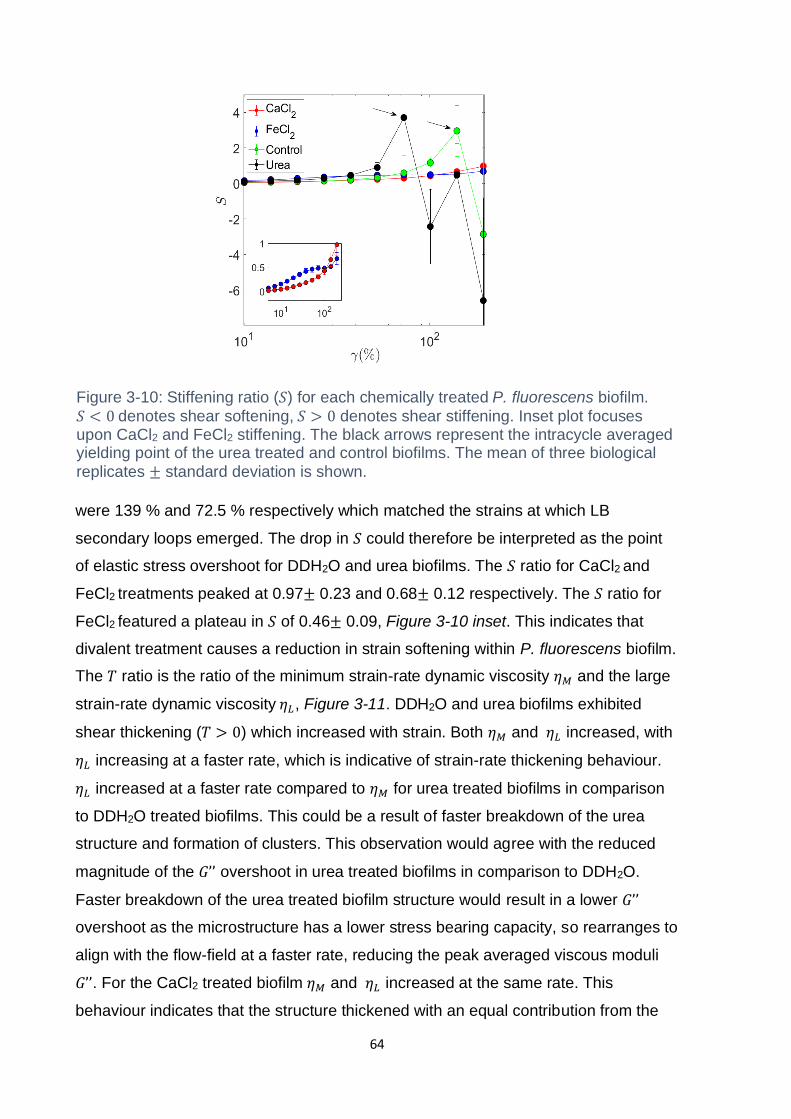
64
were 139 % and 72.5 % respectively which matched the strains at which LB
secondary loops emerged. The drop in 𝑆 could therefore be interpreted as the point
of elastic stress overshoot for DDH2O and urea biofilms. The 𝑆 ratio for CaCl2 and
FeCl2 treatments peaked at 0.97± 0.23 and 0.68± 0.12 respectively. The 𝑆 ratio for
FeCl2 featured a plateau in 𝑆 of 0.46± 0.09, Figure 3-10 inset. This indicates that
divalent treatment causes a reduction in strain softening within P. fluorescens biofilm.
The 𝑇 ratio is the ratio of the minimum strain-rate dynamic viscosity 𝜂𝑀 and the large
strain-rate dynamic viscosity 𝜂𝐿, Figure 3-11. DDH2O and urea biofilms exhibited
shear thickening (𝑇 > 0) which increased with strain. Both 𝜂𝑀 and 𝜂𝐿 increased, with
𝜂𝐿 increasing at a faster rate, which is indicative of strain-rate thickening behaviour.
𝜂𝐿 increased at a faster rate compared to 𝜂𝑀 for urea treated biofilms in comparison
to DDH2O treated biofilms. This could be a result of faster breakdown of the urea
structure and formation of clusters. This observation would agree with the reduced
magnitude of the 𝐺’’ overshoot in urea treated biofilms in comparison to DDH2O.
Faster breakdown of the urea treated biofilm structure would result in a lower 𝐺’’
overshoot as the microstructure has a lower stress bearing capacity, so rearranges to
align with the flow-field at a faster rate, reducing the peak averaged viscous moduli
𝐺’’. For the CaCl2 treated biofilm 𝜂𝑀 and 𝜂𝐿 increased at the same rate. This
behaviour indicates that the structure thickened with an equal contribution from the
Figure 3-10: Stiffening ratio (𝑆) for each chemically treated P. fluorescens biofilm.
𝑆 < 0 denotes shear softening, 𝑆 > 0 denotes shear stiffening. Inset plot focuses upon CaCl2 and FeCl2 stiffening. The black arrows represent the intracycle averaged yielding point of the urea treated and control biofilms. The mean of three biological
replicates ± standard deviation is shown.

65
strain thickening and the strain-rate thickening. This could be representative of the
increased elasticity within the microstructure due to the addition of CaCl2. For FeCl2
treated biofilms 𝜂𝑀 and 𝜂𝐿 initially increased at a similar rate. However at 𝛾 ~1 % 𝜂𝐿
peaked at 27.84± 1.97 Pa.s and began to drop. The drop in 𝜂𝐿 represents a
transitioning from strain rate thickening to strain rate thinning behaviour, thus the
thinning of the FeCl2 structure was predominantly driven by strain rate. Interestingly,
𝜂𝐿 exhibited a plateau region between 𝜂𝐿 = 21.20± 2.05 Pa.s, which coincided with a
peak in 𝜂𝑀 of 29.15± 1.20 Pa.s. This is representative of strain thickening where
strain rate thinning remained constant. This could be attributed to a second
breakdown mechanism in the FeCl2 structure. After the plateau region both 𝜂𝑀 and
𝜂𝐿 declined, indicating both strain and strain-rate thinning. The behaviours of 𝜂𝑀 and
𝜂𝐿 are represented using the 𝑇 ratio, found in Figure 3-12. Biofilms treated with urea
peaked at 𝑇 = 0.44± 0.04 and DDH2O treatment at 𝑇 = 0.25± 0.02. The 𝑇 ratio of the
FeCl2 treated biofilm displayed a minimum of -0.39± 0.08, after this point the ratio
Figure 3-11: The minimum strain rate dynamic viscosity 𝜂𝑀 (blue) and the large strain-rate viscosity 𝜂𝐿 (red) are plotted against strain amplitude 𝛾 for each
chemically treated biofilm. Strain rate thickening occurs when 𝜂𝐿 > 𝜂𝑀, whilst
strain rate thinning occurs when 𝜂𝐿 < 𝜂𝑀. Addition of divalent cations CaCl2 and FeCl2 eliminated strain rate thickening behaviour which was exhibited in the control and urea biofilm. Treatment with FeCl2 caused the emergence of strain rate thinning. The mean of three biological replicates ± standard deviation is shown.
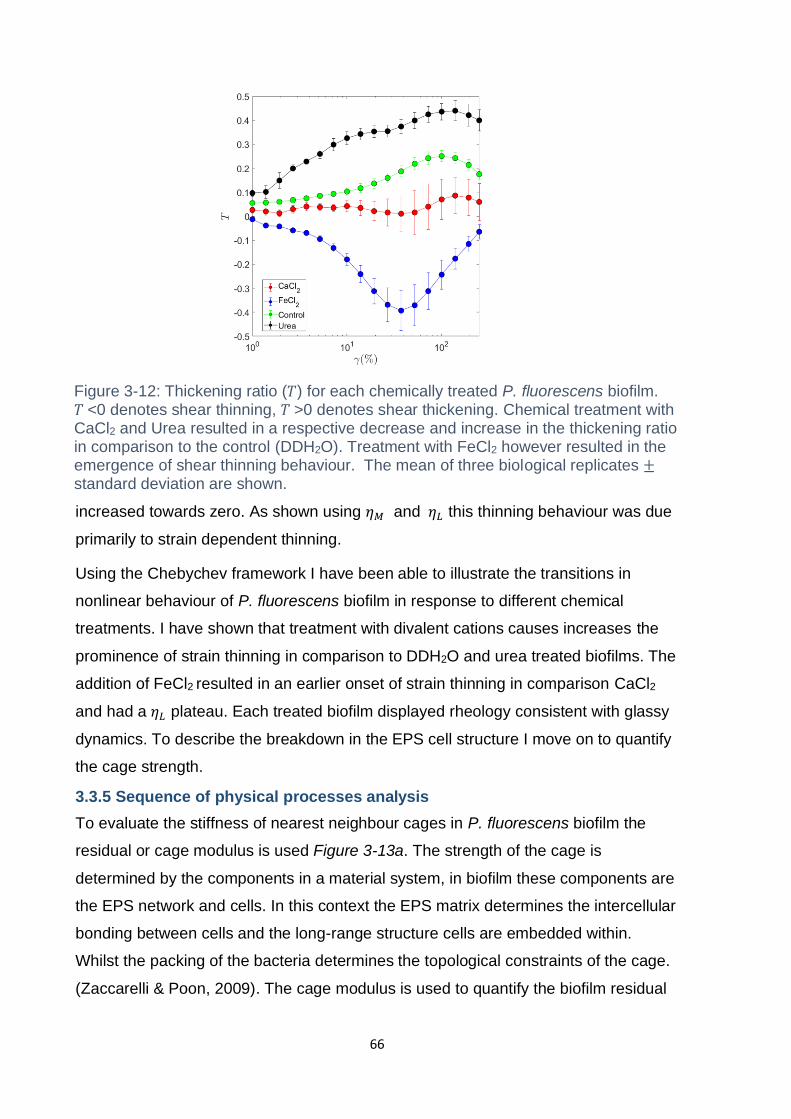
66
increased towards zero. As shown using 𝜂𝑀 and 𝜂𝐿 this thinning behaviour was due
primarily to strain dependent thinning.
Using the Chebychev framework I have been able to illustrate the transitions in
nonlinear behaviour of P. fluorescens biofilm in response to different chemical
treatments. I have shown that treatment with divalent cations causes increases the
prominence of strain thinning in comparison to DDH2O and urea treated biofilms. The
addition of FeCl2 resulted in an earlier onset of strain thinning in comparison CaCl2
and had a 𝜂𝐿 plateau. Each treated biofilm displayed rheology consistent with glassy
dynamics. To describe the breakdown in the EPS cell structure I move on to quantify
the cage strength.
3.3.5 Sequence of physical processes analysis
To evaluate the stiffness of nearest neighbour cages in P. fluorescens biofilm the
residual or cage modulus is used Figure 3-13a. The strength of the cage is
determined by the components in a material system, in biofilm these components are
the EPS network and cells. In this context the EPS matrix determines the intercellular
bonding between cells and the long-range structure cells are embedded within.
Whilst the packing of the bacteria determines the topological constraints of the cage.
(Zaccarelli & Poon, 2009). The cage modulus is used to quantify the biofilm residual
Figure 3-12: Thickening ratio (𝑇) for each chemically treated P. fluorescens biofilm. 𝑇 <0 denotes shear thinning, 𝑇 >0 denotes shear thickening. Chemical treatment with CaCl2 and Urea resulted in a respective decrease and increase in the thickening ratio in comparison to the control (DDH2O). Treatment with FeCl2 however resulted in the emergence of shear thinning behaviour. The mean of three biological replicates ± standard deviation are shown.
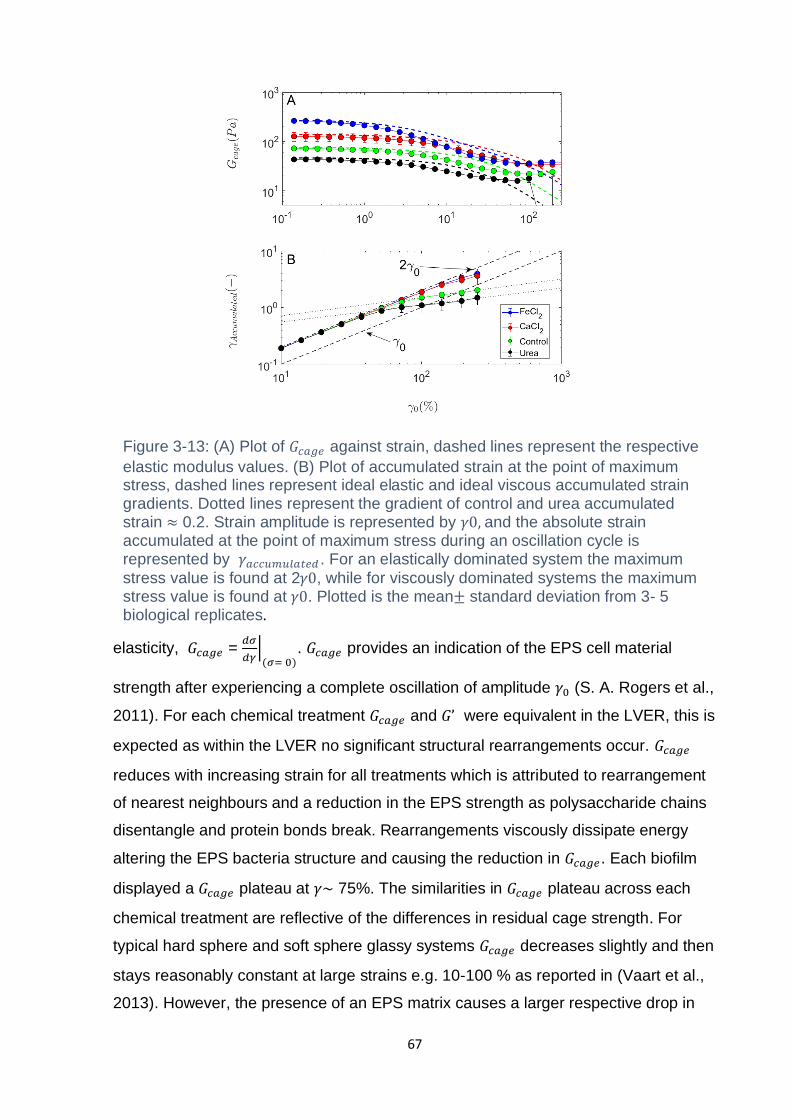
67
elasticity, 𝐺𝑐𝑎𝑔𝑒 = 𝑑𝜎
𝑑𝛾|(𝜎= 0)
. 𝐺𝑐𝑎𝑔𝑒 provides an indication of the EPS cell material
strength after experiencing a complete oscillation of amplitude 𝛾0 (S. A. Rogers et al.,
2011). For each chemical treatment 𝐺𝑐𝑎𝑔𝑒 and 𝐺’ were equivalent in the LVER, this is
expected as within the LVER no significant structural rearrangements occur. 𝐺𝑐𝑎𝑔𝑒
reduces with increasing strain for all treatments which is attributed to rearrangement
of nearest neighbours and a reduction in the EPS strength as polysaccharide chains
disentangle and protein bonds break. Rearrangements viscously dissipate energy
altering the EPS bacteria structure and causing the reduction in 𝐺𝑐𝑎𝑔𝑒. Each biofilm
displayed a 𝐺𝑐𝑎𝑔𝑒 plateau at 𝛾~ 75%. The similarities in 𝐺𝑐𝑎𝑔𝑒 plateau across each
chemical treatment are reflective of the differences in residual cage strength. For
typical hard sphere and soft sphere glassy systems 𝐺𝑐𝑎𝑔𝑒 decreases slightly and then
stays reasonably constant at large strains e.g. 10-100 % as reported in (Vaart et al.,
2013). However, the presence of an EPS matrix causes a larger respective drop in
Figure 3-13: (A) Plot of 𝐺𝑐𝑎𝑔𝑒 against strain, dashed lines represent the respective
elastic modulus values. (B) Plot of accumulated strain at the point of maximum stress, dashed lines represent ideal elastic and ideal viscous accumulated strain gradients. Dotted lines represent the gradient of control and urea accumulated strain ≈ 0.2. Strain amplitude is represented by 𝛾0, and the absolute strain accumulated at the point of maximum stress during an oscillation cycle is represented by 𝛾𝑎𝑐𝑐𝑢𝑚𝑢𝑙𝑎𝑡𝑒𝑑 . For an elastically dominated system the maximum
stress value is found at 2𝛾0, while for viscously dominated systems the maximum stress value is found at 𝛾0. Plotted is the mean± standard deviation from 3- 5 biological replicates.
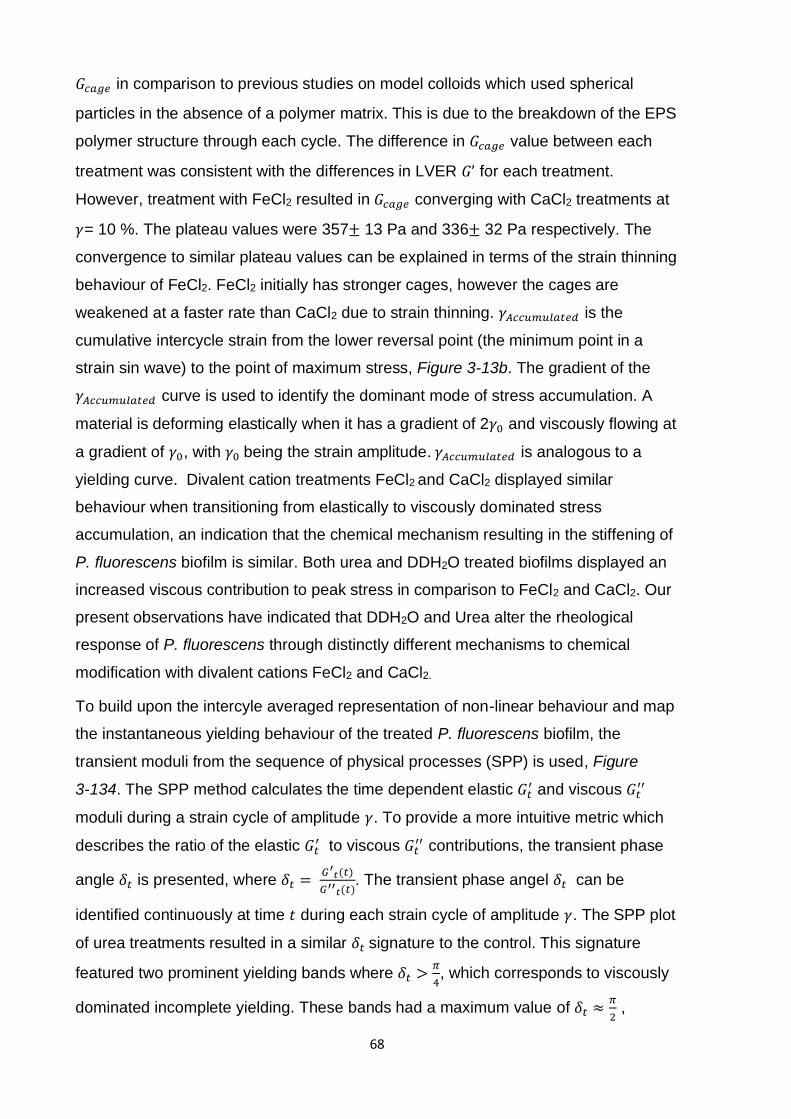
68
𝐺𝑐𝑎𝑔𝑒 in comparison to previous studies on model colloids which used spherical
particles in the absence of a polymer matrix. This is due to the breakdown of the EPS
polymer structure through each cycle. The difference in 𝐺𝑐𝑎𝑔𝑒 value between each
treatment was consistent with the differences in LVER 𝐺’ for each treatment.
However, treatment with FeCl2 resulted in 𝐺𝑐𝑎𝑔𝑒 converging with CaCl2 treatments at
𝛾= 10 %. The plateau values were 357± 13 Pa and 336± 32 Pa respectively. The
convergence to similar plateau values can be explained in terms of the strain thinning
behaviour of FeCl2. FeCl2 initially has stronger cages, however the cages are
weakened at a faster rate than CaCl2 due to strain thinning. 𝛾𝐴𝑐𝑐𝑢𝑚𝑢𝑙𝑎𝑡𝑒𝑑 is the
cumulative intercycle strain from the lower reversal point (the minimum point in a
strain sin wave) to the point of maximum stress, Figure 3-13b. The gradient of the
𝛾𝐴𝑐𝑐𝑢𝑚𝑢𝑙𝑎𝑡𝑒𝑑 curve is used to identify the dominant mode of stress accumulation. A
material is deforming elastically when it has a gradient of 2𝛾0 and viscously flowing at
a gradient of 𝛾0, with 𝛾0 being the strain amplitude. 𝛾𝐴𝑐𝑐𝑢𝑚𝑢𝑙𝑎𝑡𝑒𝑑 is analogous to a
yielding curve. Divalent cation treatments FeCl2 and CaCl2 displayed similar
behaviour when transitioning from elastically to viscously dominated stress
accumulation, an indication that the chemical mechanism resulting in the stiffening of
P. fluorescens biofilm is similar. Both urea and DDH2O treated biofilms displayed an
increased viscous contribution to peak stress in comparison to FeCl2 and CaCl2. Our
present observations have indicated that DDH2O and Urea alter the rheological
response of P. fluorescens through distinctly different mechanisms to chemical
modification with divalent cations FeCl2 and CaCl2.
To build upon the intercyle averaged representation of non-linear behaviour and map
the instantaneous yielding behaviour of the treated P. fluorescens biofilm, the
transient moduli from the sequence of physical processes (SPP) is used, Figure
3-134. The SPP method calculates the time dependent elastic 𝐺𝑡′ and viscous 𝐺𝑡
′′
moduli during a strain cycle of amplitude 𝛾. To provide a more intuitive metric which
describes the ratio of the elastic 𝐺𝑡′ to viscous 𝐺𝑡
′′ contributions, the transient phase
angle 𝛿𝑡 is presented, where 𝛿𝑡 = 𝐺′𝑡(𝑡)
𝐺′′𝑡(𝑡). The transient phase angel 𝛿𝑡 can be
identified continuously at time 𝑡 during each strain cycle of amplitude 𝛾. The SPP plot
of urea treatments resulted in a similar 𝛿𝑡 signature to the control. This signature
featured two prominent yielding bands where 𝛿𝑡 >𝜋
4, which corresponds to viscously
dominated incomplete yielding. These bands had a maximum value of 𝛿𝑡 ≈𝜋
2 ,
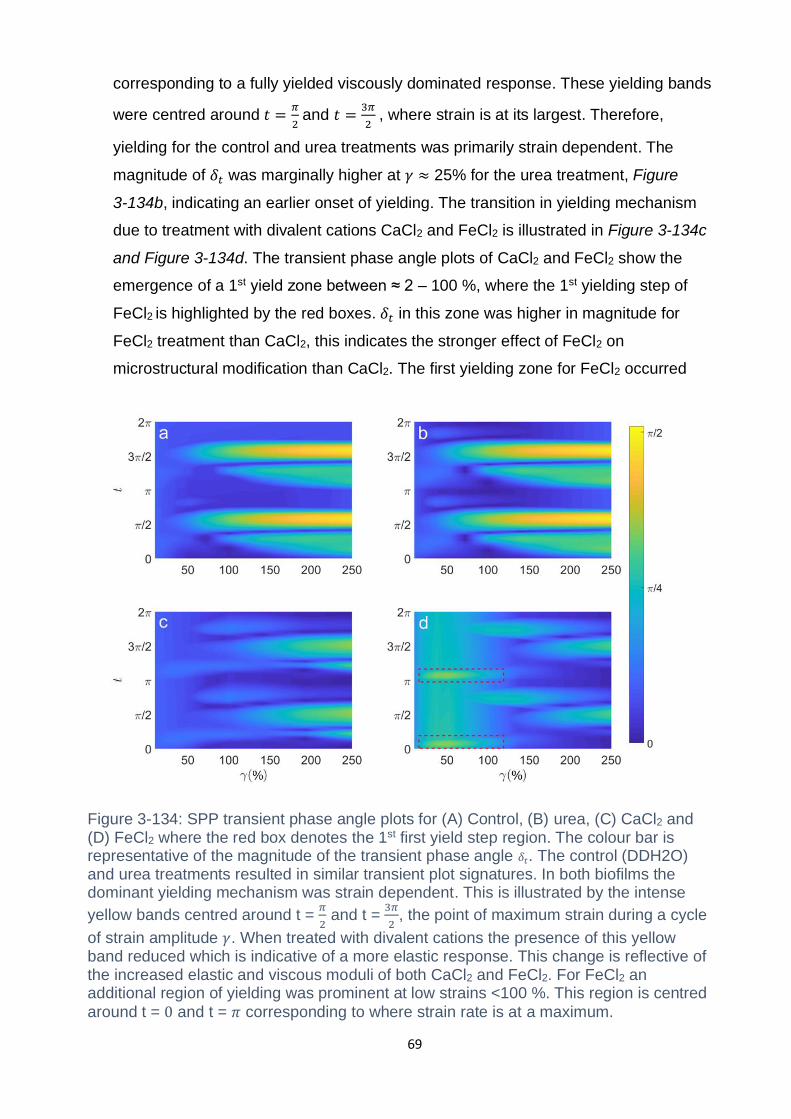
69
corresponding to a fully yielded viscously dominated response. These yielding bands
were centred around 𝑡 =𝜋
2 and 𝑡 =
3𝜋
2 , where strain is at its largest. Therefore,
yielding for the control and urea treatments was primarily strain dependent. The
magnitude of 𝛿𝑡 was marginally higher at 𝛾 ≈ 25% for the urea treatment, Figure
3-134b, indicating an earlier onset of yielding. The transition in yielding mechanism
due to treatment with divalent cations CaCl2 and FeCl2 is illustrated in Figure 3-134c
and Figure 3-134d. The transient phase angle plots of CaCl2 and FeCl2 show the
emergence of a 1st yield zone between ≈ 2 – 100 %, where the 1st yielding step of
FeCl2 is highlighted by the red boxes. 𝛿𝑡 in this zone was higher in magnitude for
FeCl2 treatment than CaCl2, this indicates the stronger effect of FeCl2 on
microstructural modification than CaCl2. The first yielding zone for FeCl2 occurred
Figure 3-134: SPP transient phase angle plots for (A) Control, (B) urea, (C) CaCl2 and (D) FeCl2 where the red box denotes the 1st first yield step region. The colour bar is representative of the magnitude of the transient phase angle 𝛿𝑡. The control (DDH2O) and urea treatments resulted in similar transient plot signatures. In both biofilms the dominant yielding mechanism was strain dependent. This is illustrated by the intense
yellow bands centred around t = 𝜋
2 and t =
3𝜋
2, the point of maximum strain during a cycle
of strain amplitude 𝛾. When treated with divalent cations the presence of this yellow band reduced which is indicative of a more elastic response. This change is reflective of the increased elastic and viscous moduli of both CaCl2 and FeCl2. For FeCl2 an additional region of yielding was prominent at low strains <100 %. This region is centred
around t = 0 and t = 𝜋 corresponding to where strain rate is at a maximum.
70
when 𝑡 centred around 0 and 𝜋. These two regions are where strain rate is largest
during the oscillation cycle. Therefore, the first yielding zone was predominantly
strain rate dependent. The 2nd yield zone occurred at 𝑡 =𝜋
2 and 𝑡 =
3𝜋
2 indicating the
second yielding step in FeCl2 treated biofilm was predominantly strain dependent,
which was constant with where CaCl2 also yielded. This behaviour agreed with
Chebyshev intercycle analysis of 𝜂𝑀 and 𝜂𝐿.
3.4 Discussion and Conclusions
In this chapter I adopted LAOS analysis techniques and applied them to
quantitatively analyse the effects of chemical treatment, on the nonlinear viscoelastic
response of P. fluorescens biofilms. Previous studies have investigated the effect of
chemical treatment on biofilm viscoelasticity (Brindle et al., 2011). However, these
studies used linear viscoelastic techniques which mainly enabled changes in stiffness
to be quantified (Klotz et al., 2019; Kovach et al., 2017; Kretschmer & Lieleg, 2020b).
These methods therefore neglect the non-linear regime. Analysing both the linear
and nonlinear regimes therefore provides a more complete assessment of biofilm
mechanical behaviour. The dynamics within the nonlinear regime lend themselves to
phenomenological arguments which can be compared to analogous systems such as
colloidal and polymer gels. Biofilms have been compared to double hydrogels,
however arguments applied to the field of glassy colloidal gel rheology are rarely fully
adopted to explain biofilm rheology (Jing Yan et al., 2018). In the following paragraph
I will summarise the effect of each chemical treatment in the context of non-linear
parameters.
P. fluorescens treated with urea displayed a reduction in packing fraction which
correlated with a reduction in elastic and viscous modulus. Urea caused an elastic
weakening of the microstructure as indicated by the increased magnitude of strain
softening and strain-rate dependent thickening. The increase in non-linear thickening
was reflected in the increase to of the 𝐺’’ overshoot. The EPS of P. fluorescens is
known to have a high uronic acid content, a component found in xanthan gum, which
also displays type III overshoot. Urea has been shown to cause swelling in several
types of biofilms such as S. epidermidis (Jones et al., 2011) and weakening effects to
P. aeruginosa (X. Chen & Stewart, 2002). Urea is a chaotropic compound which
interferes with hydrogen bonding, reducing the stability of proteins. The presence of
71
urea as a co solute can lead to an effect termed “cononsolvency”. Cononsolvency
has been demonstrated to occur in PNIPAm polymer colloidal gels when treated with
water/urea (Sagle et al., 2009). The presence of the co solute urea causes the
collapse of polymer chains, which then reswell at higher osmotic concentration.
Swelling results due to a reduction in network crosslinking which changes in the
equilibrium swelling point. This results in an increased solvent concentration which
increases polymer chain mobility and mobility of filler particles. The cage strength is
determined by the strength of the EPS matrix and the cellular network topology,
which was quantified using the packing fraction 𝜙. Within P. fluorescens this effect
could cause a reduction in the cohesiveness of the EPS, the bonding strength of
interparticle cages and reduced compaction of the bacterial topological network. This
effect could occur in P. fluorscens by reducing hydrogen bonding of the uronic acid
polysaccharide component. The cononsolvency effect may explain why the strain
thickening ratio 𝑇 was higher in urea than DDH2O, as increased mobility within the
polymer colloid system would result in higher energy dissipation due to the increased
alignment of polymer chains and bacteria with the flow.
Treatment with CaCl2 and FeCl2 caused an increased 𝜙 for both treatments in
comparison to DDH2O. The packing fractions of CaCl2 and FeCl2 were equivalent.
This indicated that the difference in linear and nonlinear behaviour of CaCl2 and
FeCl2 was predominantly caused by FeCl2 having a greater stiffening effect on EPS
elasticity. The major adhesin protein of P. fluorescens is LapA, which is a part of a
family of large repeat surface proteins known to bind calcium. The addition of CaCl2
may have increased the crosslinking between LapA proteins or increased the
stiffness of the protein (Boyd et al., 2014). The LapA polysaccharide is known to
contain calcium binding motif on its C terminal region (Fuqua, 2010). A stiffer EPS
structure through LapA crosslinking would result in stiffer interparticle cages. The
difference in action between CaCl2 and FeCl2 could further be explained by the
difference in the ionic radii of the two ions. This theory was recently posed after
Bacillus subtilis B-1 and Azotobacter vinelandii where shown to respond with different
degrees of stiffening to an array of metal ions (Kretschmer & Lieleg, 2020a). The
differences in stiffening behaviour between the strains and metal ion treatments were
postulated as being due to the differences in alginate conformation in the
aforementioned bacteria. Alginate has been shown to be present in the EPS certain
strains of P. fluorescens, however is known to be secreted only under certain
72
physiological conditions (Marshall et al., 2019). Non the less the probability of a
stiffing effect increases with a reduction in ion size which corresponds with the
increased stiffening effect, which is seen with FeCl2, where the ionic radii of FeCl2 is
small than CaCl2.
The rheology of FeCl2 treated P. fluorescens biofilms displayed thinning behaviour
which was mainly caused by strain-rate dependent thinning as indicated by the
relative drop in 𝜂𝐿 and coincided with the emergence of two step yielding. The
presence of two step yielding was depicted using the SPP framework, through the
emergence of an additional yielding band. The emergence of two yielding zones is a
characteristic of attractive glassy/colloidal gel systems. Yielding in attractive
glassy/colloidal gel systems occurs in two steps. The first step is densification which
occurs when short range interparticle bonds within the nearest neighbour cages
breakdown. The second step involves the breakdown of the topological constraints,
in a biofilms, the bacteria/bacteria jamming and breakdown of the longer-range EPS
matrix structure (Pham et al., 2006). The stiffening effect of FeCl2 has been seen
across several biofilm rheological studies (Grumbein et al., 2014; Klotz et al., 2019).
Addition of FeCl2 and FeCl3 have been shown to increase the erosion stability of B.
subtilis biofilms (Grumbein et al., 2014). These experiments test erosion detachment
at a constant shear stress. The work presented here has demonstrated shear rate
thinning behaviour in FeCl2 and that shear rate is the predominant cause of yielding
in FeCl2 treated biofilms. This behaviour could be due to ionic crosslinking of FeCl2 to
the side branches of polyanionic EPS polysaccharides such as alginate. Ionic
crosslinking would increase the elastic and viscous modulus in the linear regime but
reduce viscous dissipation in the non-linear regime due to reduced polymer chain
flexibility.
In this chapter I implemented a LAOS rheological framework towards the analysis of
P. fluorescens biofilms treated with divalent metal cations and a chaotropic
compound. By adopting LAOS techniques an in-depth characterisation of the
nonlinear rheological effects of these chemicals on biofilm was achieved. The
techniques applied provided increasingly sensitive measurements of the
thickening/thinning and stiffening/softening dynamics within each biofilm. The
intracycle (Chebychev method) and instantaneous (SPP) techniques enabled the
strain and strain rate dependence of these nonlinear behaviours to be revealed. The
improved sensitivity of these methods in comparison to solely using the elastic moduli
73
𝐺′ and viscous moduli 𝐺′′ meant that subtle differences in shear thinning behaviour
were detected between the divalent cation treatments. The difference in shear
thinning behaviour between CaCl2 and FeCl2 was due to increased strain rate
dependent thinning depicted by a relative change in 𝜂𝐿. The action of the chaotropic
compound urea resulted in modification to the shear thickening behaviour of P.
fluorescens. The main action of modification was reflected by the increase to the 𝑇
ratio in comparison to the control. The increased thickening is suggestive of
increased bacterial and EPS network rearrangement, which would result in increased
energy dissipation. The increase to EPS network mobility is due to increased mobility
of the polysaccharide chains and protein components such as alginate and LapA,
which could be due to the cononsolvency effect.
Unravelling the polymeric interactions occurring within the EPS structure of biofilm
which determine intercellular bonding strength and bacterial organisation requires the
subtle detection of changes to rheology. This work provides a demonstration of an
enhanced macroscale rheological characterisation platform for biofilms. The LAOS
framework used here increases the resolution of biofilm rheological characterisation
from cycle averaged properties to analysis using intercycle and instantaneous
properties. This framework could be applied to improving rheological diagnostics of
medically related biofilms such as CF sputum potentially providing a method of
detecting specific protein/ polymer rheological signatures. For fundamental studies
focused on accessing polysaccharide/ protein interactions the LAOS framework
developed here could helpful in quantifying alterations in stiffening/softening,
thickening/thinning behaviour assisting to improve interpretations of modified EPS
network interactions.
Chapter 4 Effect of the production of polysaccharides amylovoran and
stewartin on the microstructure and rheology of Pantoea sp. .
4.1 Introduction
In this chapter the rheological framework described in chapter 3 is applied to a plant
growth promoting rhizo bacteria (PGPR) called Pantoea sp. YR343. The rationale
behind this chapter is to demonstrate how the LAOS platform can be applied to
access biofilm rheological phase transitions as a function of a change in EPS
composition. In this case the EPS component which is modified is a capsular
polysaccharide closely related to amylovoran and stewartin. The LAOS principles and
framework are used to enhance the quantitative description of how polysaccharide
74
concentration impacts the phase behavior of this biofilm and the resulting rheology.
Plant growth promoting rhizo-bacteria (PGPR) are used as biocontrol agents and can
increase resilience against pathogens in suboptimal soil conditions (Allison & Martiny,
2008). These biofilms act as facilitators of biocontrol within the plant root rhizosphere
and an environment of elevated microbial density where bacterial ecology is actively
influenced by plant root exudates (Beauregard et al., 2013; Sasse et al., 2018;
Zhalnina et al., 2018). Root exudates drive symbiotic interactions between biofilm
and roots, triggering biofilm formation and producing chemotactic secretions resulting
in preferential, localised biofilm colonization (Y. Chen et al., 2012; Massalha et al.,
2017; N. Zhang et al., 2014). EPS is a characteristic component of biofilm formation,
excreted by bacterial cells and is composed of polysaccharides, proteins and DNA.
The composition of EPS is phenotypically dependent and highly heterogeneous in
mixed environments. The regulation of specific functional EPS components has been
demonstrated to improve plant fitness in response to increases in salinity (Kasim et
al., 2016), toxic soil contaminants (Mallick et al., 2018), plant - microbe adhesion
(Zhao et al., 2015), species - species interaction (Z. Xu et al., 2013) and resistance to
pathogenic attack (Molina-Santiago et al., 2019). Modulating specific EPS
components can result in productivity fluctuations (Dragoš, Kiesewalter, et al., 2018)
and changes to biofilm architecture (Hartmann et al., 2019).
In this chapter a combination of genetic modification, microscopy and rheometry is
applied to understand the structural composition and rheology of an EPS defective
strain Pantoea sp. YR343 UDP and an EPS producing strain Pantoea sp. YR343.
Using a combination of confocal microscopy and fluorescent staining, changes in
packing fraction and packing morphology caused by the deletion of amylovran and
stewartin are investigated. Small and Large Amplitude Oscillatory shear rheometry is
used to quantify the variations in the rheological characteristics of wild type and
mutant Pantoea sp. YR343 biofilms. The study demonstrates that changes in the
volume of secreted EPS has a drastic effect on the viscoelasticity and morphology of
biofilms. It is demonstrated that cellular packing fraction and polysaccharide
concentration can be controlled by varying the mixture ratio of Pantoea sp. YR343
and Pantoea sp. YR343 UDP, enabling the investigation of rheological phase
transitions.
75
4.2 Materials and methods
4.2.1 Bacteria growth in liquid cultures and agar plates
Salt optimized broth plus glycerol (SOBG) medium was prepared by dissolving 20 g
tryptone, 5 g yeast extract, 0.5 g NaCl, 2.4 g MgSO4, 0.186 g KCl, 50 ml of 40% v/v
glycerol (Sigma, UK) in 1 L of milli-Q water. SOBG agar had similar composition and
in addition contained 15 g of agar. The Pantoea strains used within this experiment
were kindly provided by the Oakridge national lab, Washington, USA. Pantoea sp.
UDP is a mutant strain of Pantoea sp. YR343 with a transposon insertion in the gene
PMI39_01848 which encodes UDP – galactose- lipid carrier transferase. This gene is
the first gene in an operon that is responsible for synthesizing a type of EPS closely
related to amylovoran and stewartin. This mutant has corresponding defects in
biofilm formation, pellicle formation and root colonization (Aufrecht et al., 2019).
Pantoea sp. YR 343 and the Pantoea sp. UDP mutant were grown overnight in
SOBG medium at 24 °C with shaking (150 rpm). 150 µL of the overnight culture was
pipetted on the sterile agar plates and was spread uniformly using a L shaped
spreader. The bacteria were then allowed to grow for 24 hrs and subsequently
scraped off from the surface of the agar using a glass slide.
4.2.2 Time lapse microscopy
Pantoea sp. YR343 and Pantoea sp. YR343 UDP were grown for 3 hrs in SOBG
medium at 24 oC with shaking (150 rpm). 1.5 % agarose pads replete with M9
minimal media and 0.5 % glucose were prepared using 25 µL gene frames (Sigma,
UK). Once the agarose had solidified, two strips were cut out to increase the air
volume in the sealed frame. Timelapses were performed with monocultures of
Pantoea sp. YR343 and Pantoea sp. YR343 UDP. For monocultures 1 µL of culture
adjusted to OD = 0.2 was pipetted onto the agarose pad. Dual cultures were
performed at a ratio of 10:1, Pantoea sp. YR343: Pantoea sp. YR343 UDP. Overnight
cultures were independently corrected to an OD = 0.2 before being combined, 1 µL of
dual culture was then pipetted onto the agarose pad. A #1.5 coverslip (Sigma, UK)
was used to seal the Gene frame. A razor blade was used to seal the coverslip being
careful to press outside the perimeter of the Gene frame so to avoid excessive
pressure on the agarose. Time lapse imaging was performed using a Nikon Eclipse
Ti-S microscope (Nikon, Japan) fitted with a CoolLED pE-4000 light source
(CoolLED, UK). A perfect focus system (Nikon Perfect Focus System (PFS)) was
used to minimize Z drift. The microscope was used in phase contrast mode. The
76
temperature was controlled using an environmental chamber which surrounded the
microscope and was set at 24 oC. Images (1024 x 1024) were taken with a 63x
objective oil immersion lens and acquired every 10 mins for 12 hrs. Fields of view
(FOV) were selected at random. For each condition timelapses were repeated 3
times.
4.2.3 Rheometry
A 20 mm plate-plate geometry and a Kinexus Pro+ rheometer as described in the
previous chapter were used for rheometric measurements. Circular adhesive backed
120 grit paper were adhered to both the plates to reduce the instances of slip. Biofilm
was scraped from agar plates using a ground edged microscope slides and (1 plate
per run) were placed onto the grit paper. The top plate was moved into contact with
the biofilm to ensure a uniformly loaded configuration. The plate gap was set at 1 mm
and samples were trimmed with a razor blade. A solvent trap was used to prevent
desiccation. Strain controlled frequency sweeps were performed at a strain of 𝛾 = 1%
and a frequency range of 𝜔 = 0.1 – 15 Hz was used for both the wild type and the
mutant. For large amplitude oscillatory shear (LAOS) experiments the rheometer was
operated in a strain-controlled mode and amplitude sweeps were performed from γ =
1 – 1000%. LAOS tests were performed at constant frequencies (0.15, 0.375, 0.5,
0.75, 1 Hz). A decimator setting of 5 was used for the UDP mutant and a decimator
setting of 30 was used for the WT. The decimator is an internal PID controller in the
Malvern Kinexus which can be adjusted to obtain distortion free sinusoidal input
strain waveforms. Internal details of the decimator haven’t been provided by Malvern.
Creep measurements were performed using the aforementioned rheometer with 20
mm grit paper and a plate-plate geometry at 𝜎 = 30 Pa for 300 seconds. Creep
curves were then fitted with the Burger model using a curve fitting code in MATlab.
Least squares regression was used for curve fitting. Creep curves were averaged
from n= 3 measurements.
4.2.4 Packing fraction calculation
The packing fraction for the WT, UDP and the respective mixture ratios was
calculated using the same method as chapter 1 with one modification. The dilation
step was eliminated as the cell membranes were stained with 1µg/ml of FM 1-43, a
lipophilic styryl compound which targets the plasma membrane of a cell. FM 1-43 has
an excitation wavelength of 488 nm (Thermofisher, UK) was used at a concentration
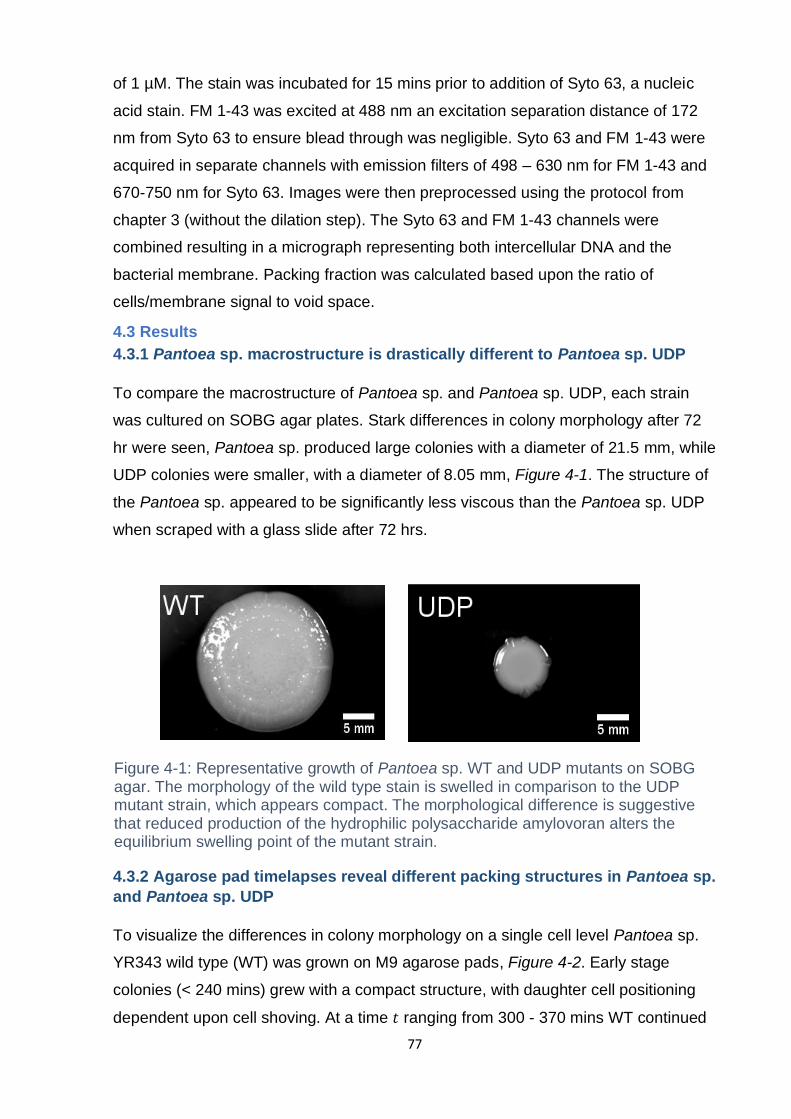
77
of 1 µM. The stain was incubated for 15 mins prior to addition of Syto 63, a nucleic
acid stain. FM 1-43 was excited at 488 nm an excitation separation distance of 172
nm from Syto 63 to ensure blead through was negligible. Syto 63 and FM 1-43 were
acquired in separate channels with emission filters of 498 – 630 nm for FM 1-43 and
670-750 nm for Syto 63. Images were then preprocessed using the protocol from
chapter 3 (without the dilation step). The Syto 63 and FM 1-43 channels were
combined resulting in a micrograph representing both intercellular DNA and the
bacterial membrane. Packing fraction was calculated based upon the ratio of
cells/membrane signal to void space.
4.3 Results
4.3.1 Pantoea sp. macrostructure is drastically different to Pantoea sp. UDP
To compare the macrostructure of Pantoea sp. and Pantoea sp. UDP, each strain
was cultured on SOBG agar plates. Stark differences in colony morphology after 72
hr were seen, Pantoea sp. produced large colonies with a diameter of 21.5 mm, while
UDP colonies were smaller, with a diameter of 8.05 mm, Figure 4-1. The structure of
the Pantoea sp. appeared to be significantly less viscous than the Pantoea sp. UDP
when scraped with a glass slide after 72 hrs.
4.3.2 Agarose pad timelapses reveal different packing structures in Pantoea sp.
and Pantoea sp. UDP
To visualize the differences in colony morphology on a single cell level Pantoea sp.
YR343 wild type (WT) was grown on M9 agarose pads, Figure 4-2. Early stage
colonies (< 240 mins) grew with a compact structure, with daughter cell positioning
dependent upon cell shoving. At a time 𝑡 ranging from 300 - 370 mins WT continued
Figure 4-1: Representative growth of Pantoea sp. WT and UDP mutants on SOBG agar. The morphology of the wild type stain is swelled in comparison to the UDP mutant strain, which appears compact. The morphological difference is suggestive that reduced production of the hydrophilic polysaccharide amylovoran alters the equilibrium swelling point of the mutant strain.
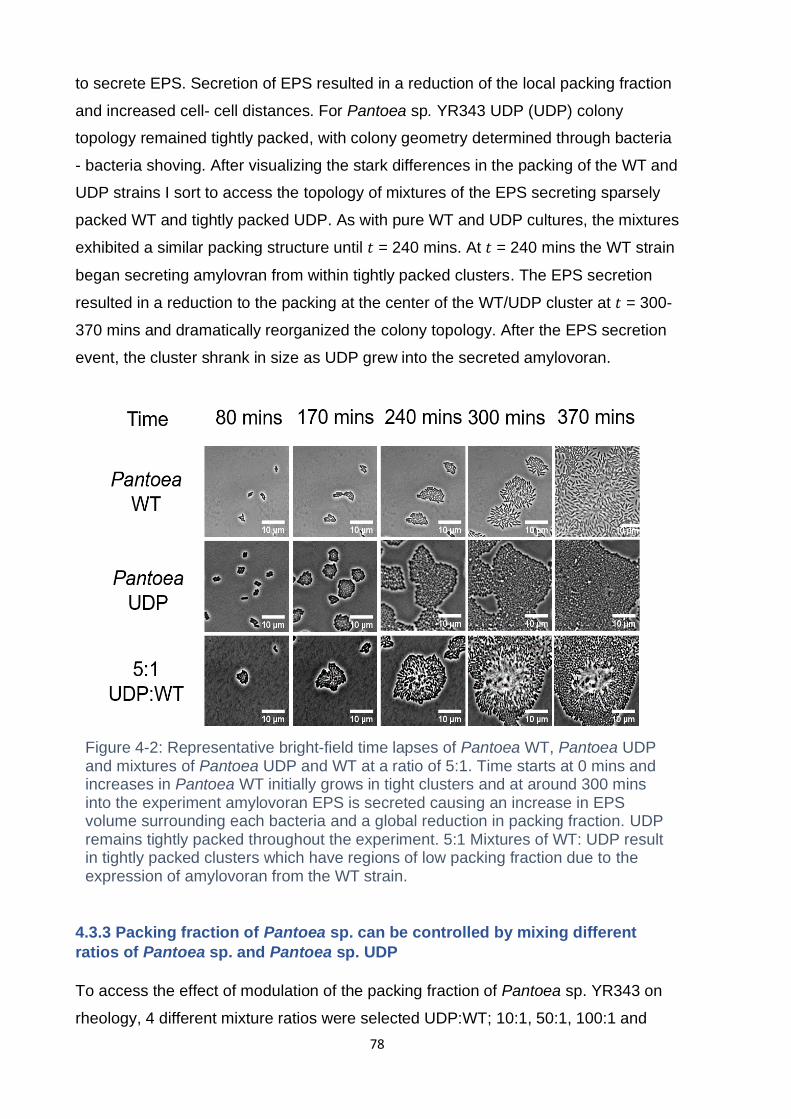
78
to secrete EPS. Secretion of EPS resulted in a reduction of the local packing fraction
and increased cell- cell distances. For Pantoea sp. YR343 UDP (UDP) colony
topology remained tightly packed, with colony geometry determined through bacteria
- bacteria shoving. After visualizing the stark differences in the packing of the WT and
UDP strains I sort to access the topology of mixtures of the EPS secreting sparsely
packed WT and tightly packed UDP. As with pure WT and UDP cultures, the mixtures
exhibited a similar packing structure until 𝑡 = 240 mins. At 𝑡 = 240 mins the WT strain
began secreting amylovran from within tightly packed clusters. The EPS secretion
resulted in a reduction to the packing at the center of the WT/UDP cluster at 𝑡 = 300-
370 mins and dramatically reorganized the colony topology. After the EPS secretion
event, the cluster shrank in size as UDP grew into the secreted amylovoran.
4.3.3 Packing fraction of Pantoea sp. can be controlled by mixing different
ratios of Pantoea sp. and Pantoea sp. UDP
To access the effect of modulation of the packing fraction of Pantoea sp. YR343 on
rheology, 4 different mixture ratios were selected UDP:WT; 10:1, 50:1, 100:1 and
Figure 4-2: Representative bright-field time lapses of Pantoea WT, Pantoea UDP and mixtures of Pantoea UDP and WT at a ratio of 5:1. Time starts at 0 mins and increases in Pantoea WT initially grows in tight clusters and at around 300 mins into the experiment amylovoran EPS is secreted causing an increase in EPS volume surrounding each bacteria and a global reduction in packing fraction. UDP remains tightly packed throughout the experiment. 5:1 Mixtures of WT: UDP result in tightly packed clusters which have regions of low packing fraction due to the expression of amylovoran from the WT strain.
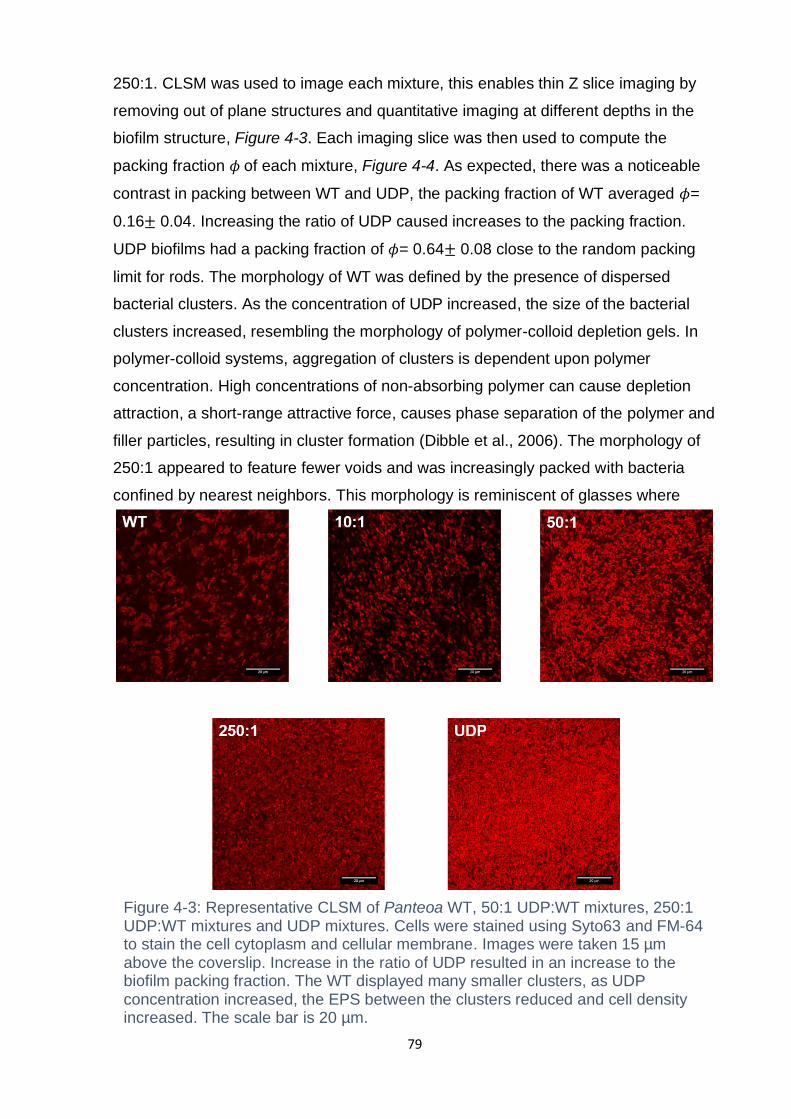
79
250:1. CLSM was used to image each mixture, this enables thin Z slice imaging by
removing out of plane structures and quantitative imaging at different depths in the
biofilm structure, Figure 4-3. Each imaging slice was then used to compute the
packing fraction 𝜙 of each mixture, Figure 4-4. As expected, there was a noticeable
contrast in packing between WT and UDP, the packing fraction of WT averaged 𝜙=
0.16± 0.04. Increasing the ratio of UDP caused increases to the packing fraction.
UDP biofilms had a packing fraction of 𝜙= 0.64± 0.08 close to the random packing
limit for rods. The morphology of WT was defined by the presence of dispersed
bacterial clusters. As the concentration of UDP increased, the size of the bacterial
clusters increased, resembling the morphology of polymer-colloid depletion gels. In
polymer-colloid systems, aggregation of clusters is dependent upon polymer
concentration. High concentrations of non-absorbing polymer can cause depletion
attraction, a short-range attractive force, causes phase separation of the polymer and
filler particles, resulting in cluster formation (Dibble et al., 2006). The morphology of
250:1 appeared to feature fewer voids and was increasingly packed with bacteria
confined by nearest neighbors. This morphology is reminiscent of glasses where
Figure 4-3: Representative CLSM of Panteoa WT, 50:1 UDP:WT mixtures, 250:1 UDP:WT mixtures and UDP mixtures. Cells were stained using Syto63 and FM-64 to stain the cell cytoplasm and cellular membrane. Images were taken 15 µm above the coverslip. Increase in the ratio of UDP resulted in an increase to the biofilm packing fraction. The WT displayed many smaller clusters, as UDP concentration increased, the EPS between the clusters reduced and cell density increased. The scale bar is 20 µm.
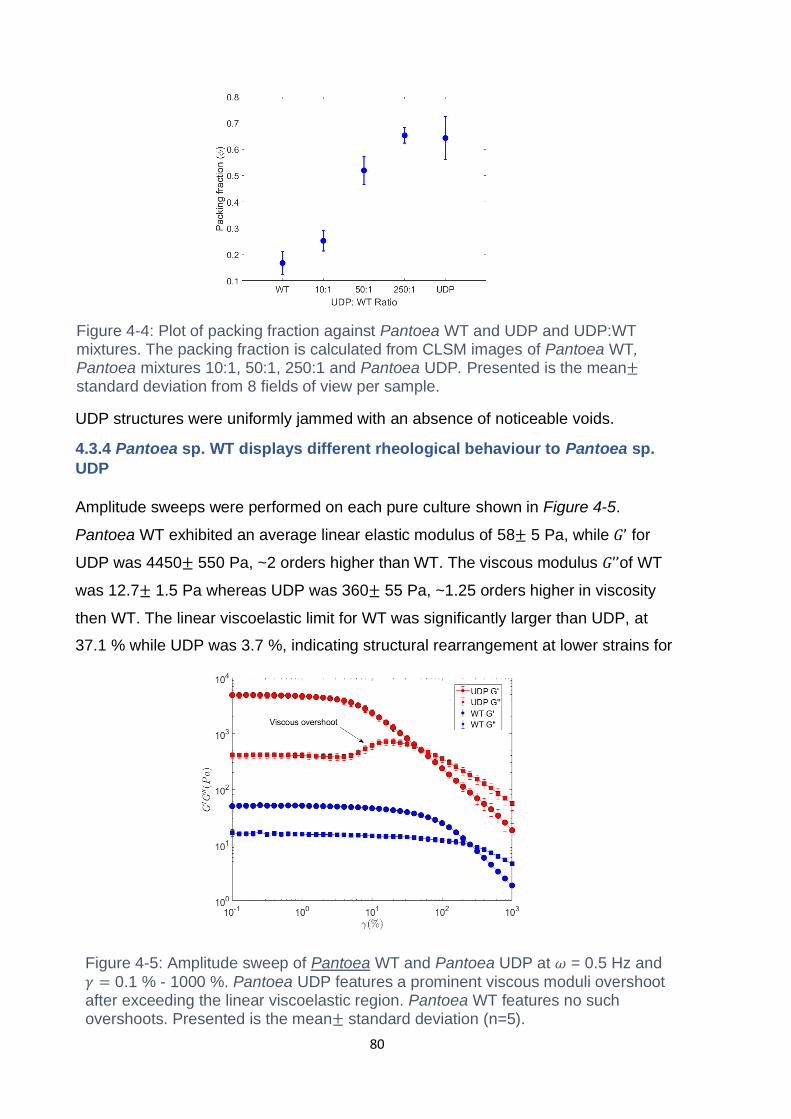
80
UDP structures were uniformly jammed with an absence of noticeable voids.
4.3.4 Pantoea sp. WT displays different rheological behaviour to Pantoea sp.
UDP
Amplitude sweeps were performed on each pure culture shown in Figure 4-5.
Pantoea WT exhibited an average linear elastic modulus of 58± 5 Pa, while 𝐺’ for
UDP was 4450± 550 Pa, ~2 orders higher than WT. The viscous modulus 𝐺’’of WT
was 12.7± 1.5 Pa whereas UDP was 360± 55 Pa, ~1.25 orders higher in viscosity
then WT. The linear viscoelastic limit for WT was significantly larger than UDP, at
37.1 % while UDP was 3.7 %, indicating structural rearrangement at lower strains for
Figure 4-4: Plot of packing fraction against Pantoea WT and UDP and UDP:WT mixtures. The packing fraction is calculated from CLSM images of Pantoea WT, Pantoea mixtures 10:1, 50:1, 250:1 and Pantoea UDP. Presented is the mean± standard deviation from 8 fields of view per sample.
Figure 4-5: Amplitude sweep of Pantoea WT and Pantoea UDP at 𝜔 = 0.5 Hz and
𝛾 = 0.1 % - 1000 %. Pantoea UDP features a prominent viscous moduli overshoot after exceeding the linear viscoelastic region. Pantoea WT features no such overshoots. Presented is the mean± standard deviation (n=5).
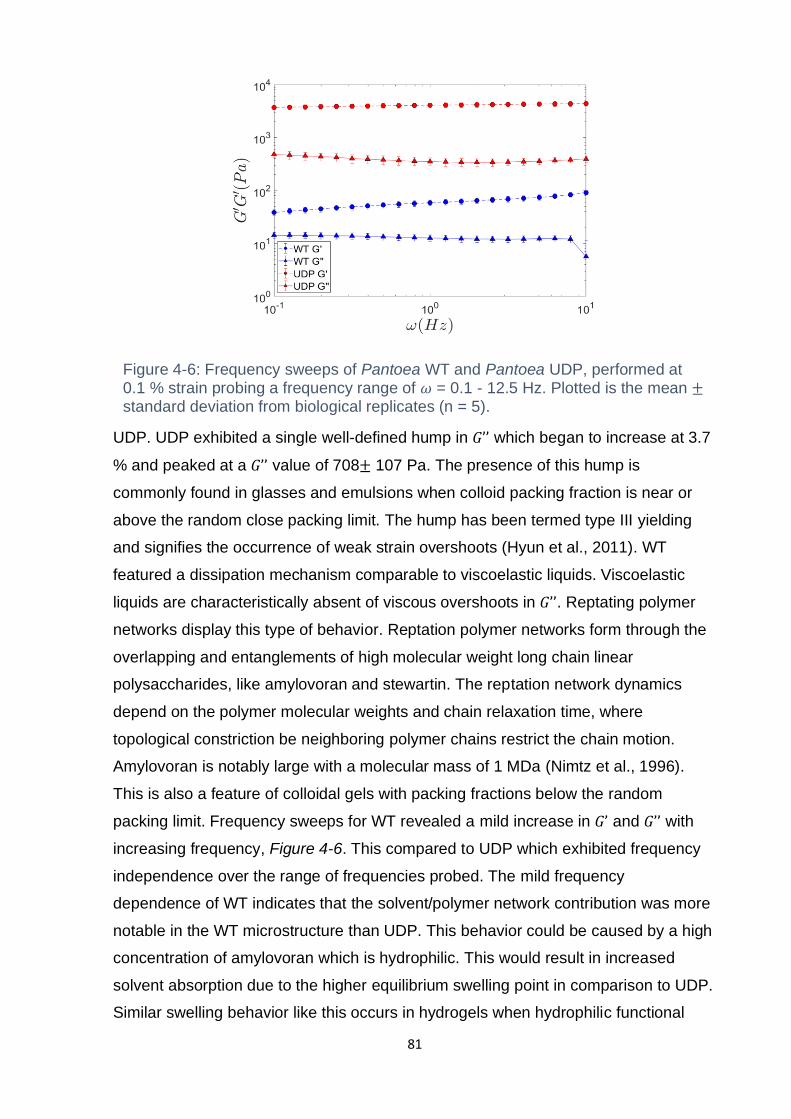
81
UDP. UDP exhibited a single well-defined hump in 𝐺’’ which began to increase at 3.7
% and peaked at a 𝐺’’ value of 708± 107 Pa. The presence of this hump is
commonly found in glasses and emulsions when colloid packing fraction is near or
above the random close packing limit. The hump has been termed type III yielding
and signifies the occurrence of weak strain overshoots (Hyun et al., 2011). WT
featured a dissipation mechanism comparable to viscoelastic liquids. Viscoelastic
liquids are characteristically absent of viscous overshoots in 𝐺’’. Reptating polymer
networks display this type of behavior. Reptation polymer networks form through the
overlapping and entanglements of high molecular weight long chain linear
polysaccharides, like amylovoran and stewartin. The reptation network dynamics
depend on the polymer molecular weights and chain relaxation time, where
topological constriction be neighboring polymer chains restrict the chain motion.
Amylovoran is notably large with a molecular mass of 1 MDa (Nimtz et al., 1996).
This is also a feature of colloidal gels with packing fractions below the random
packing limit. Frequency sweeps for WT revealed a mild increase in 𝐺’ and 𝐺’’ with
increasing frequency, Figure 4-6. This compared to UDP which exhibited frequency
independence over the range of frequencies probed. The mild frequency
dependence of WT indicates that the solvent/polymer network contribution was more
notable in the WT microstructure than UDP. This behavior could be caused by a high
concentration of amylovoran which is hydrophilic. This would result in increased
solvent absorption due to the higher equilibrium swelling point in comparison to UDP.
Similar swelling behavior like this occurs in hydrogels when hydrophilic functional
Figure 4-6: Frequency sweeps of Pantoea WT and Pantoea UDP, performed at 0.1 % strain probing a frequency range of 𝜔 = 0.1 - 12.5 Hz. Plotted is the mean ± standard deviation from biological replicates (n = 5).
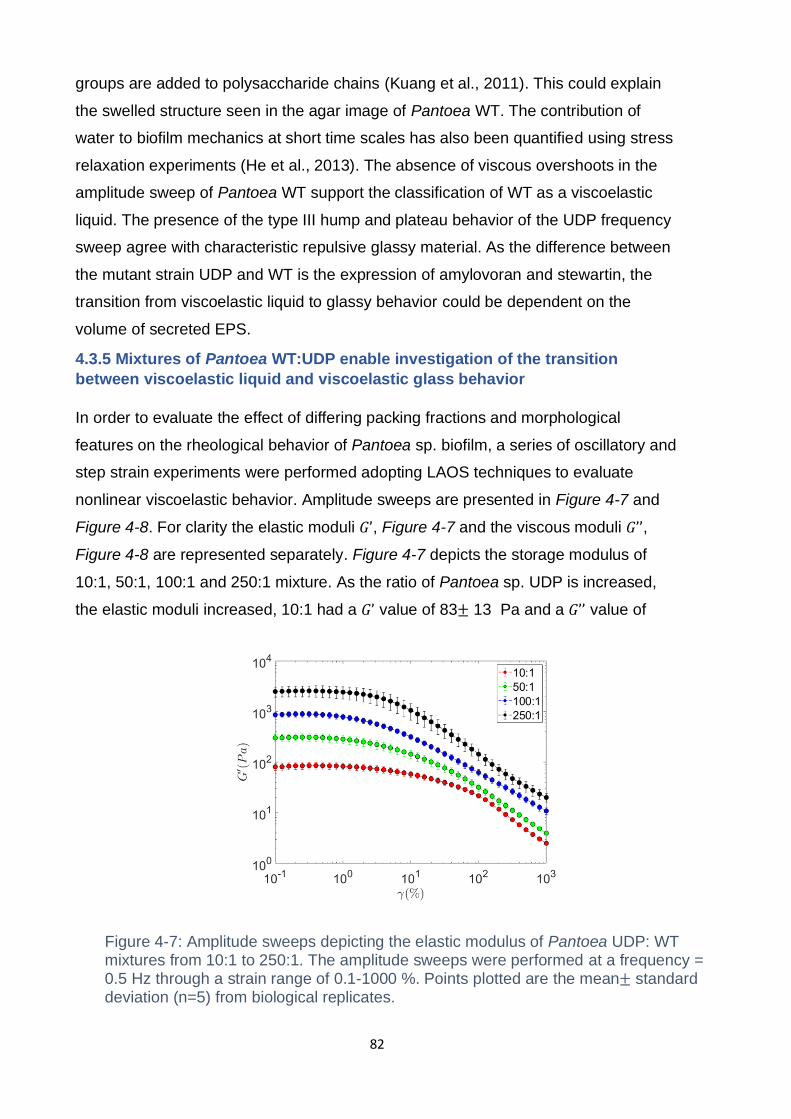
82
groups are added to polysaccharide chains (Kuang et al., 2011). This could explain
the swelled structure seen in the agar image of Pantoea WT. The contribution of
water to biofilm mechanics at short time scales has also been quantified using stress
relaxation experiments (He et al., 2013). The absence of viscous overshoots in the
amplitude sweep of Pantoea WT support the classification of WT as a viscoelastic
liquid. The presence of the type III hump and plateau behavior of the UDP frequency
sweep agree with characteristic repulsive glassy material. As the difference between
the mutant strain UDP and WT is the expression of amylovoran and stewartin, the
transition from viscoelastic liquid to glassy behavior could be dependent on the
volume of secreted EPS.
4.3.5 Mixtures of Pantoea WT:UDP enable investigation of the transition
between viscoelastic liquid and viscoelastic glass behavior
In order to evaluate the effect of differing packing fractions and morphological
features on the rheological behavior of Pantoea sp. biofilm, a series of oscillatory and
step strain experiments were performed adopting LAOS techniques to evaluate
nonlinear viscoelastic behavior. Amplitude sweeps are presented in Figure 4-7 and
Figure 4-8. For clarity the elastic moduli 𝐺’, Figure 4-7 and the viscous moduli 𝐺’’,
Figure 4-8 are represented separately. Figure 4-7 depicts the storage modulus of
10:1, 50:1, 100:1 and 250:1 mixture. As the ratio of Pantoea sp. UDP is increased,
the elastic moduli increased, 10:1 had a 𝐺’ value of 83± 13 Pa and a 𝐺’’ value of
Figure 4-7: Amplitude sweeps depicting the elastic modulus of Pantoea UDP: WT mixtures from 10:1 to 250:1. The amplitude sweeps were performed at a frequency = 0.5 Hz through a strain range of 0.1-1000 %. Points plotted are the mean± standard deviation (n=5) from biological replicates.
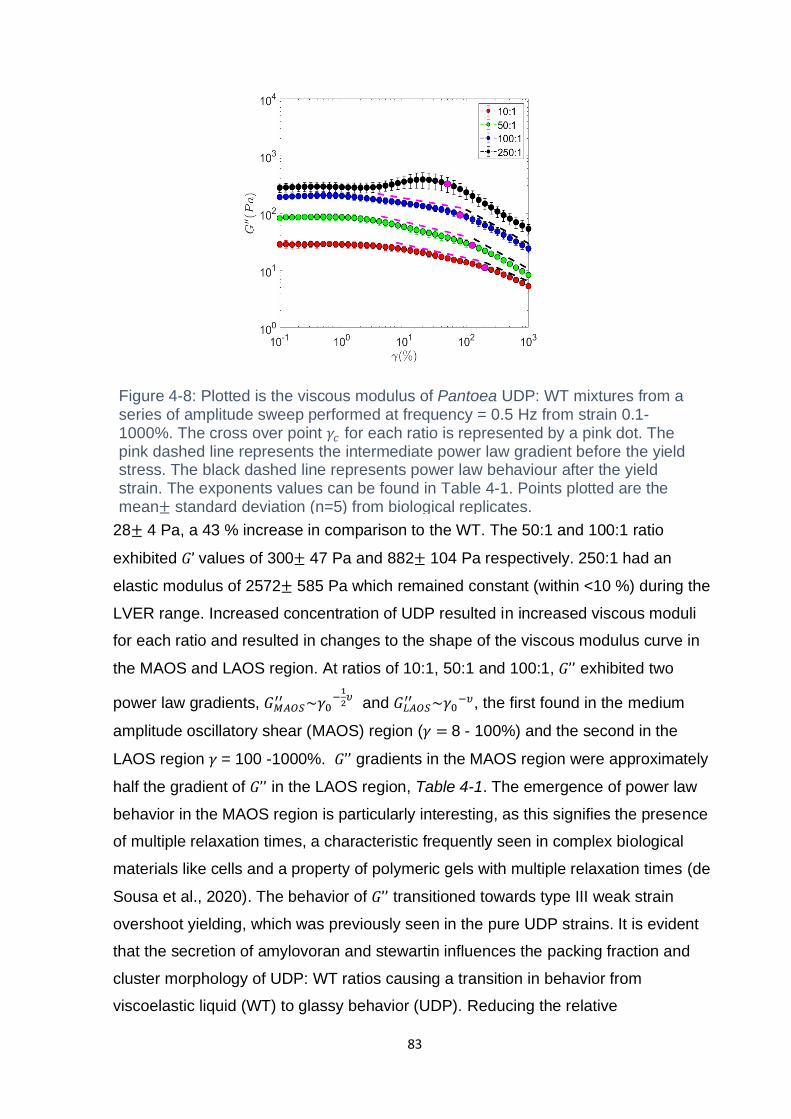
83
28± 4 Pa, a 43 % increase in comparison to the WT. The 50:1 and 100:1 ratio
exhibited 𝐺’ values of 300± 47 Pa and 882± 104 Pa respectively. 250:1 had an
elastic modulus of 2572± 585 Pa which remained constant (within <10 %) during the
LVER range. Increased concentration of UDP resulted in increased viscous moduli
for each ratio and resulted in changes to the shape of the viscous modulus curve in
the MAOS and LAOS region. At ratios of 10:1, 50:1 and 100:1, 𝐺’’ exhibited two
power law gradients, 𝐺𝑀𝐴𝑂𝑆′′ ~𝛾0
−1
2𝜐 and 𝐺𝐿𝐴𝑂𝑆
′′ ~𝛾0−𝜐, the first found in the medium
amplitude oscillatory shear (MAOS) region (𝛾 = 8 - 100%) and the second in the
LAOS region 𝛾 = 100 -1000%. 𝐺’’ gradients in the MAOS region were approximately
half the gradient of 𝐺’’ in the LAOS region, Table 4-1. The emergence of power law
behavior in the MAOS region is particularly interesting, as this signifies the presence
of multiple relaxation times, a characteristic frequently seen in complex biological
materials like cells and a property of polymeric gels with multiple relaxation times (de
Sousa et al., 2020). The behavior of 𝐺’’ transitioned towards type III weak strain
overshoot yielding, which was previously seen in the pure UDP strains. It is evident
that the secretion of amylovoran and stewartin influences the packing fraction and
cluster morphology of UDP: WT ratios causing a transition in behavior from
viscoelastic liquid (WT) to glassy behavior (UDP). Reducing the relative
Figure 4-8: Plotted is the viscous modulus of Pantoea UDP: WT mixtures from a series of amplitude sweep performed at frequency = 0.5 Hz from strain 0.1-1000%. The cross over point 𝛾𝑐 for each ratio is represented by a pink dot. The pink dashed line represents the intermediate power law gradient before the yield stress. The black dashed line represents power law behaviour after the yield strain. The exponents values can be found in Table 4-1. Points plotted are the mean± standard deviation (n=5) from biological replicates.
84
concentration of amylovoran and stewartin results in a change to the dissipative
behavior of Pantoea. sp as reflected in the viscous moduli 𝐺’’, which is seen in the
10:1, 50:1 and 100:1 mixture. The transition point between MAOS and LAOS regions
is marked by the cross over strain 𝛾𝑐 = (𝐺’ = 𝐺’’). The cross over strain is defined as
the strain at which viscous dissipative behavior of the material becomes equal to the
elastic stiffness. The cross over strain was seen to vary between mixture ratios. For
10:1 mixture 𝛾𝑐 = 199.55 %, for 50:1 𝛾𝑐 =125.88 %, 100:1 𝛾𝑐 = 79.42 % and 250:1
𝛾𝑐 = 50.11 %. Therefore, it’s apparent that 𝛾𝑐 reduced with increased elastic and
viscous moduli, increased packing fraction and reduced EPS concentration. The
decrease in crossover strain with increased packing fraction and emergence of the
hump at 250:1 is known as the Payne effect (Cassagnau, 2003). This effect was
discovered in rubber compounds where the cross over strain of rubber decreases
with increased filler volume. Presently there isn’t a singular proven theory which
explains the cause behind this phenomenon, there are two main hypotheses which
may explain this effect. The first is linked to agglomeration and de-agglomeration as
the filler network breaks down with increasing strain (Meera et al., 2009). The second
theory concerns the disentanglement of polymer chains (H. Xu et al., 2020).
Ratio Gradient (MAOS) Gradient (LAOS)
10:1 -0.40± 0.02 (7.94 - 158 %) -0.99± 0.03 (199 - 1000 %)
50:1 -0.43± 0.03 (2 - 100 %) -0.91± 0.04 (125 - 1000 %)
100:1 -0.46± 0.03 (1.25 - 100 %) -0.93± 0.04 (125- 1000 %)
Table 4-1: Table of the MAOS and LAOS power law gradients for different ratios of Pantoea sp. (UDP:WT) . The values in brackets represent the strain range the power
law gradient correspond to. Presented is the mean± standard deviation from 5 biological replicates.
4.3.6 Stress strain and creep response of Pantoea. sp mixtures
To gain insight into the stress response to imposed oscillatory strain, the total stress
at each strain amplitude was plotted on a stress strain plot, Figure 4-9a. At low strain
values, within the LVER, stress is proportional to strain and therefore has a linear
gradient. A deviation from the linear gradient signifies nonlinear material yielding and
structural breakdown.
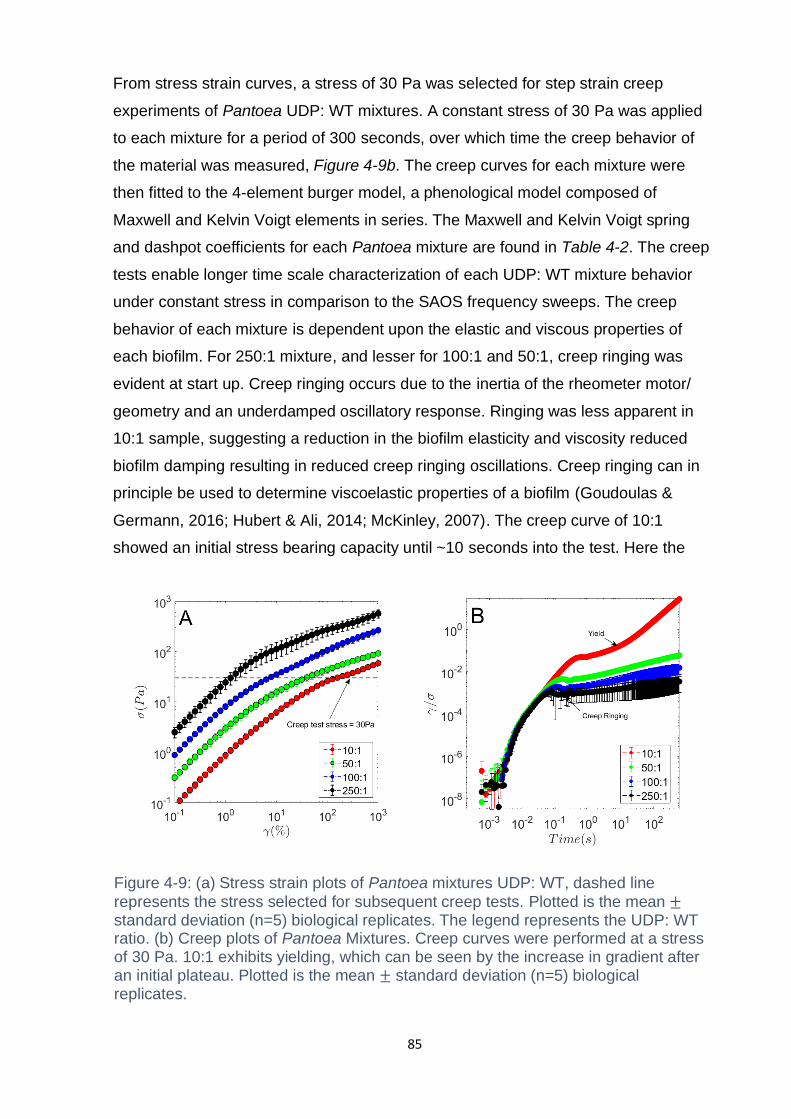
85
From stress strain curves, a stress of 30 Pa was selected for step strain creep
experiments of Pantoea UDP: WT mixtures. A constant stress of 30 Pa was applied
to each mixture for a period of 300 seconds, over which time the creep behavior of
the material was measured, Figure 4-9b. The creep curves for each mixture were
then fitted to the 4-element burger model, a phenological model composed of
Maxwell and Kelvin Voigt elements in series. The Maxwell and Kelvin Voigt spring
and dashpot coefficients for each Pantoea mixture are found in Table 4-2. The creep
tests enable longer time scale characterization of each UDP: WT mixture behavior
under constant stress in comparison to the SAOS frequency sweeps. The creep
behavior of each mixture is dependent upon the elastic and viscous properties of
each biofilm. For 250:1 mixture, and lesser for 100:1 and 50:1, creep ringing was
evident at start up. Creep ringing occurs due to the inertia of the rheometer motor/
geometry and an underdamped oscillatory response. Ringing was less apparent in
10:1 sample, suggesting a reduction in the biofilm elasticity and viscosity reduced
biofilm damping resulting in reduced creep ringing oscillations. Creep ringing can in
principle be used to determine viscoelastic properties of a biofilm (Goudoulas &
Germann, 2016; Hubert & Ali, 2014; McKinley, 2007). The creep curve of 10:1
showed an initial stress bearing capacity until ~10 seconds into the test. Here the
Figure 4-9: (a) Stress strain plots of Pantoea mixtures UDP: WT, dashed line
represents the stress selected for subsequent creep tests. Plotted is the mean ± standard deviation (n=5) biological replicates. The legend represents the UDP: WT ratio. (b) Creep plots of Pantoea Mixtures. Creep curves were performed at a stress of 30 Pa. 10:1 exhibits yielding, which can be seen by the increase in gradient after an initial plateau. Plotted is the mean ± standard deviation (n=5) biological replicates.
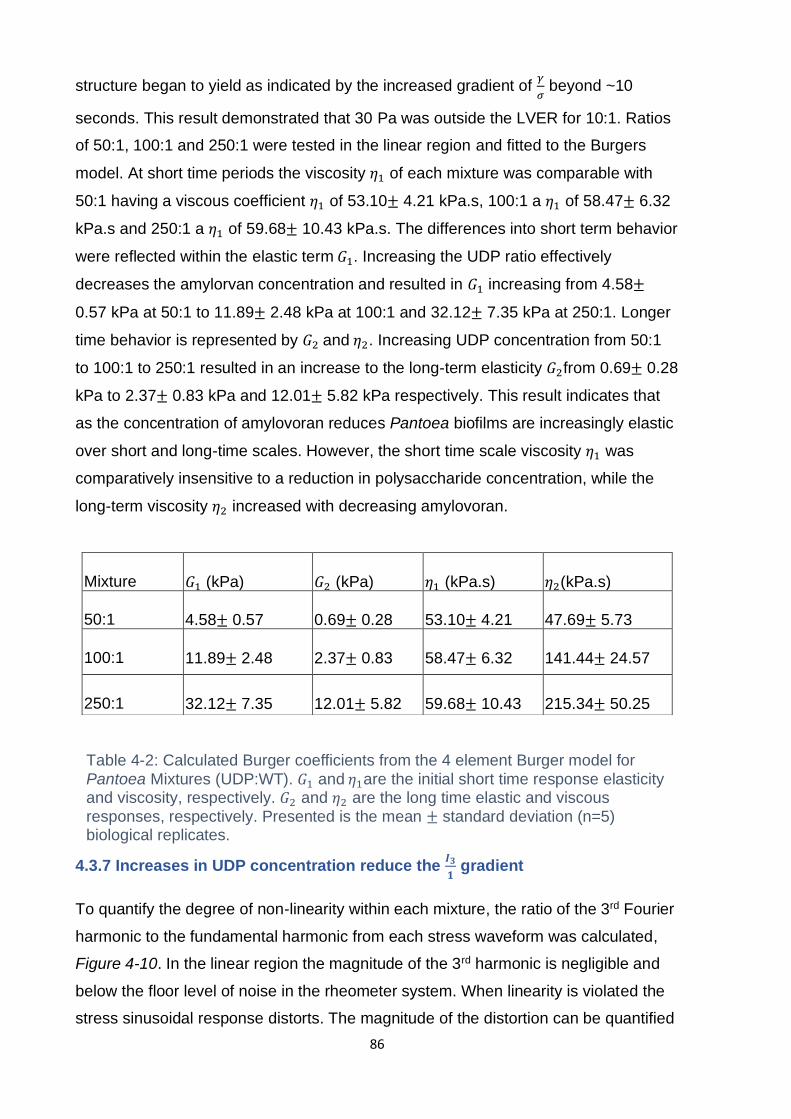
86
structure began to yield as indicated by the increased gradient of 𝛾
𝜎 beyond ~10
seconds. This result demonstrated that 30 Pa was outside the LVER for 10:1. Ratios
of 50:1, 100:1 and 250:1 were tested in the linear region and fitted to the Burgers
model. At short time periods the viscosity 𝜂1 of each mixture was comparable with
50:1 having a viscous coefficient 𝜂1 of 53.10± 4.21 kPa.s, 100:1 a 𝜂1 of 58.47± 6.32
kPa.s and 250:1 a 𝜂1 of 59.68± 10.43 kPa.s. The differences into short term behavior
were reflected within the elastic term 𝐺1. Increasing the UDP ratio effectively
decreases the amylorvan concentration and resulted in 𝐺1 increasing from 4.58±
0.57 kPa at 50:1 to 11.89± 2.48 kPa at 100:1 and 32.12± 7.35 kPa at 250:1. Longer
time behavior is represented by 𝐺2 and 𝜂2. Increasing UDP concentration from 50:1
to 100:1 to 250:1 resulted in an increase to the long-term elasticity 𝐺2from 0.69± 0.28
kPa to 2.37± 0.83 kPa and 12.01± 5.82 kPa respectively. This result indicates that
as the concentration of amylovoran reduces Pantoea biofilms are increasingly elastic
over short and long-time scales. However, the short time scale viscosity 𝜂1 was
comparatively insensitive to a reduction in polysaccharide concentration, while the
long-term viscosity 𝜂2 increased with decreasing amylovoran.
4.3.7 Increases in UDP concentration reduce the 𝑰𝟑
𝟏 gradient
To quantify the degree of non-linearity within each mixture, the ratio of the 3rd Fourier
harmonic to the fundamental harmonic from each stress waveform was calculated,
Figure 4-10. In the linear region the magnitude of the 3rd harmonic is negligible and
below the floor level of noise in the rheometer system. When linearity is violated the
stress sinusoidal response distorts. The magnitude of the distortion can be quantified
Mixture 𝐺1 (kPa) 𝐺2 (kPa) 𝜂1 (kPa.s) 𝜂2(kPa.s)
50:1 4.58± 0.57 0.69± 0.28 53.10± 4.21 47.69± 5.73
100:1 11.89± 2.48 2.37± 0.83 58.47± 6.32 141.44± 24.57
250:1 32.12± 7.35 12.01± 5.82 59.68± 10.43 215.34± 50.25
Table 4-2: Calculated Burger coefficients from the 4 element Burger model for
Pantoea Mixtures (UDP:WT). 𝐺1 and 𝜂1are the initial short time response elasticity and viscosity, respectively. 𝐺2 and 𝜂2 are the long time elastic and viscous
responses, respectively. Presented is the mean ± standard deviation (n=5) biological replicates.
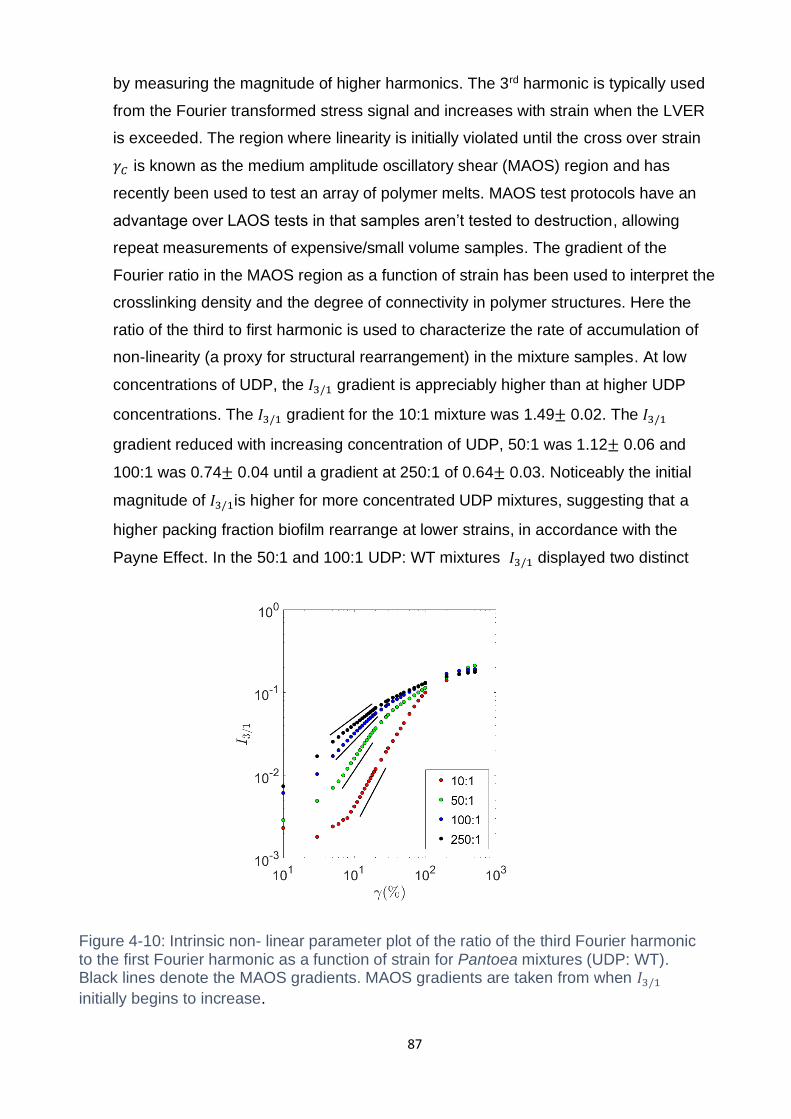
87
by measuring the magnitude of higher harmonics. The 3rd harmonic is typically used
from the Fourier transformed stress signal and increases with strain when the LVER
is exceeded. The region where linearity is initially violated until the cross over strain
𝛾𝐶 is known as the medium amplitude oscillatory shear (MAOS) region and has
recently been used to test an array of polymer melts. MAOS test protocols have an
advantage over LAOS tests in that samples aren’t tested to destruction, allowing
repeat measurements of expensive/small volume samples. The gradient of the
Fourier ratio in the MAOS region as a function of strain has been used to interpret the
crosslinking density and the degree of connectivity in polymer structures. Here the
ratio of the third to first harmonic is used to characterize the rate of accumulation of
non-linearity (a proxy for structural rearrangement) in the mixture samples. At low
concentrations of UDP, the 𝐼3/1 gradient is appreciably higher than at higher UDP
concentrations. The 𝐼3/1 gradient for the 10:1 mixture was 1.49± 0.02. The 𝐼3/1
gradient reduced with increasing concentration of UDP, 50:1 was 1.12± 0.06 and
100:1 was 0.74± 0.04 until a gradient at 250:1 of 0.64± 0.03. Noticeably the initial
magnitude of 𝐼3/1is higher for more concentrated UDP mixtures, suggesting that a
higher packing fraction biofilm rearrange at lower strains, in accordance with the
Payne Effect. In the 50:1 and 100:1 UDP: WT mixtures 𝐼3/1 displayed two distinct
Figure 4-10: Intrinsic non- linear parameter plot of the ratio of the third Fourier harmonic to the first Fourier harmonic as a function of strain for Pantoea mixtures (UDP: WT). Black lines denote the MAOS gradients. MAOS gradients are taken from when 𝐼3/1
initially begins to increase.
88
gradients. This differed from 10:1 and 250:1 mixture which featured less distinct
changes in gradient as the strain approached the LAOS transition points.
4.3.8 Intercycle Chebychev method reveals a transition in non-linear thickening
behavior
To explain the results from cycle averaged amplitude sweeps, 𝐼31
measures and
detect the nonlinear behavior contributing to the intermediate power law rheology for
the 50:1 and 100:1 samples, the intercycle Chebychev method from Ewoldt was
adopted. Nonlinear thickening and thinning behavior is represented using the 𝑇 ratio
plot, Figure 4-11. The Pantoea WT exhibited thickening (𝑇 > 0) between 𝛾 = 177 %-
501 % ranging between 𝑇 = 0.24± 0.01 – 0.29± 0.03. Adding UDP to WT resulted in
a transition from nonlinear viscoelastic thickening to thinning (𝑇 < 0). Increasing the
UPD concentration from 50:1 to 100:1 caused the emergence of thinning behavior to
reduce from 𝛾 = 89.1 % to 𝛾 = 31.6 % a result agreeing with our earlier observation
linked to the Payne effect. However, as the UDP ratio increased from 100:1 to 250:1,
the onset of thinning shifted back to 𝛾 = 89.1 %. In addition, thickening was also
observed which peaked at 0.11± 0.05 at 𝛾 = 8 % before the onset of thinning. The
change in rheological behavior coincides with the transition from a clustered
microstructure seen in the 50:1 mixtures to the homogeneously packed structure type
Figure 4-11: Thickening fingerprint for Pantoea mixtures (UDP:WT). Measurements were performed at a frequency of 0.5 Hz and at strains 𝛾 = 0.1 -1000%. The colour
bar represents the magnitude of the thickening ratio 𝑇. WT represents pure Pantoea WT biofilms and UDP represents pure Pantoea UDP biofilms.
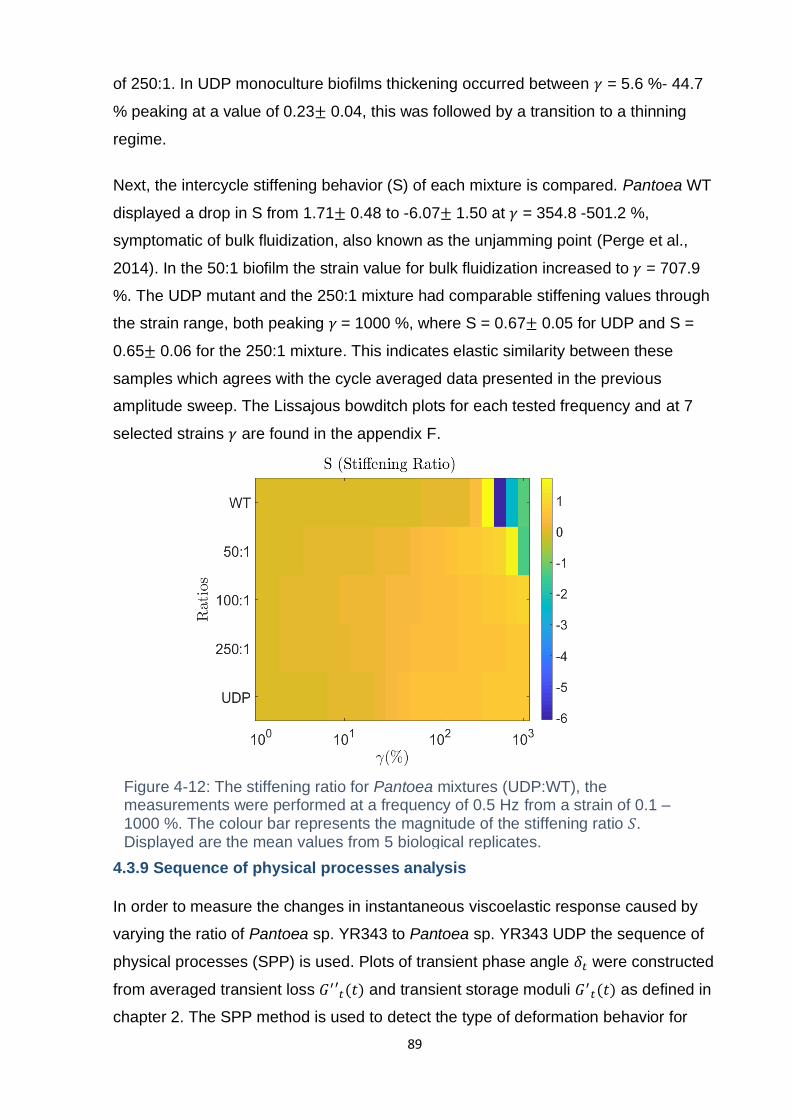
89
of 250:1. In UDP monoculture biofilms thickening occurred between 𝛾 = 5.6 %- 44.7
% peaking at a value of 0.23± 0.04, this was followed by a transition to a thinning
regime.
Next, the intercycle stiffening behavior (S) of each mixture is compared. Pantoea WT
displayed a drop in S from 1.71± 0.48 to -6.07± 1.50 at 𝛾 = 354.8 -501.2 %,
symptomatic of bulk fluidization, also known as the unjamming point (Perge et al.,
2014). In the 50:1 biofilm the strain value for bulk fluidization increased to 𝛾 = 707.9
%. The UDP mutant and the 250:1 mixture had comparable stiffening values through
the strain range, both peaking 𝛾 = 1000 %, where S = 0.67± 0.05 for UDP and S =
0.65± 0.06 for the 250:1 mixture. This indicates elastic similarity between these
samples which agrees with the cycle averaged data presented in the previous
amplitude sweep. The Lissajous bowditch plots for each tested frequency and at 7
selected strains 𝛾 are found in the appendix F.
4.3.9 Sequence of physical processes analysis
In order to measure the changes in instantaneous viscoelastic response caused by
varying the ratio of Pantoea sp. YR343 to Pantoea sp. YR343 UDP the sequence of
physical processes (SPP) is used. Plots of transient phase angle 𝛿𝑡 were constructed
from averaged transient loss 𝐺′′𝑡(𝑡) and transient storage moduli 𝐺′𝑡(𝑡) as defined in
chapter 2. The SPP method is used to detect the type of deformation behavior for
Figure 4-12: The stiffening ratio for Pantoea mixtures (UDP:WT), the measurements were performed at a frequency of 0.5 Hz from a strain of 0.1 – 1000 %. The colour bar represents the magnitude of the stiffening ratio 𝑆. Displayed are the mean values from 5 biological replicates.
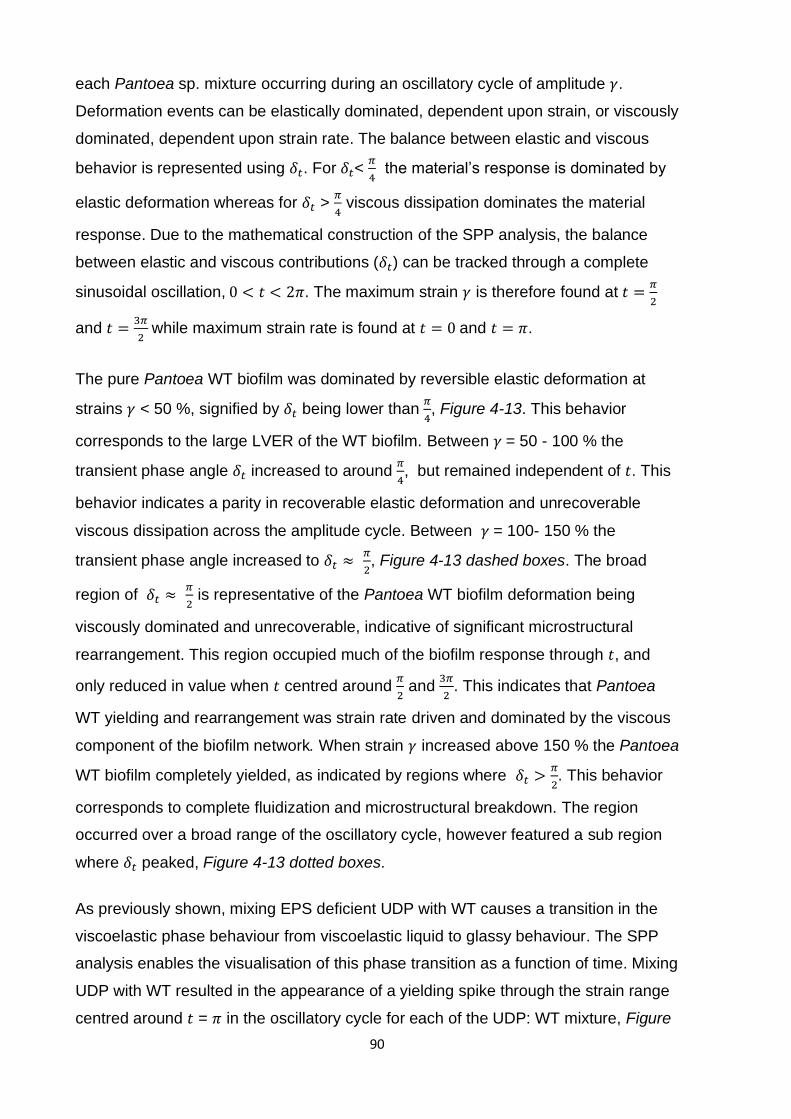
90
each Pantoea sp. mixture occurring during an oscillatory cycle of amplitude 𝛾.
Deformation events can be elastically dominated, dependent upon strain, or viscously
dominated, dependent upon strain rate. The balance between elastic and viscous
behavior is represented using 𝛿𝑡. For 𝛿𝑡< 𝜋
4 the material’s response is dominated by
elastic deformation whereas for 𝛿𝑡 > 𝜋
4 viscous dissipation dominates the material
response. Due to the mathematical construction of the SPP analysis, the balance
between elastic and viscous contributions (𝛿𝑡) can be tracked through a complete
sinusoidal oscillation, 0 < 𝑡 < 2𝜋. The maximum strain 𝛾 is therefore found at 𝑡 =𝜋
2
and 𝑡 =3𝜋
2 while maximum strain rate is found at 𝑡 = 0 and 𝑡 = 𝜋.
The pure Pantoea WT biofilm was dominated by reversible elastic deformation at
strains 𝛾 < 50 %, signified by 𝛿𝑡 being lower than 𝜋
4, Figure 4-13. This behavior
corresponds to the large LVER of the WT biofilm. Between 𝛾 = 50 - 100 % the
transient phase angle 𝛿𝑡 increased to around 𝜋
4, but remained independent of 𝑡. This
behavior indicates a parity in recoverable elastic deformation and unrecoverable
viscous dissipation across the amplitude cycle. Between 𝛾 = 100- 150 % the
transient phase angle increased to 𝛿𝑡 ≈ 𝜋
2, Figure 4-13 dashed boxes. The broad
region of 𝛿𝑡 ≈ 𝜋
2 is representative of the Pantoea WT biofilm deformation being
viscously dominated and unrecoverable, indicative of significant microstructural
rearrangement. This region occupied much of the biofilm response through 𝑡, and
only reduced in value when 𝑡 centred around 𝜋
2 and
3𝜋
2. This indicates that Pantoea
WT yielding and rearrangement was strain rate driven and dominated by the viscous
component of the biofilm network. When strain 𝛾 increased above 150 % the Pantoea
WT biofilm completely yielded, as indicated by regions where 𝛿𝑡 >𝜋
2. This behavior
corresponds to complete fluidization and microstructural breakdown. The region
occurred over a broad range of the oscillatory cycle, however featured a sub region
where 𝛿𝑡 peaked, Figure 4-13 dotted boxes.
As previously shown, mixing EPS deficient UDP with WT causes a transition in the
viscoelastic phase behaviour from viscoelastic liquid to glassy behaviour. The SPP
analysis enables the visualisation of this phase transition as a function of time. Mixing
UDP with WT resulted in the appearance of a yielding spike through the strain range
centred around 𝑡 = 𝜋 in the oscillatory cycle for each of the UDP: WT mixture, Figure
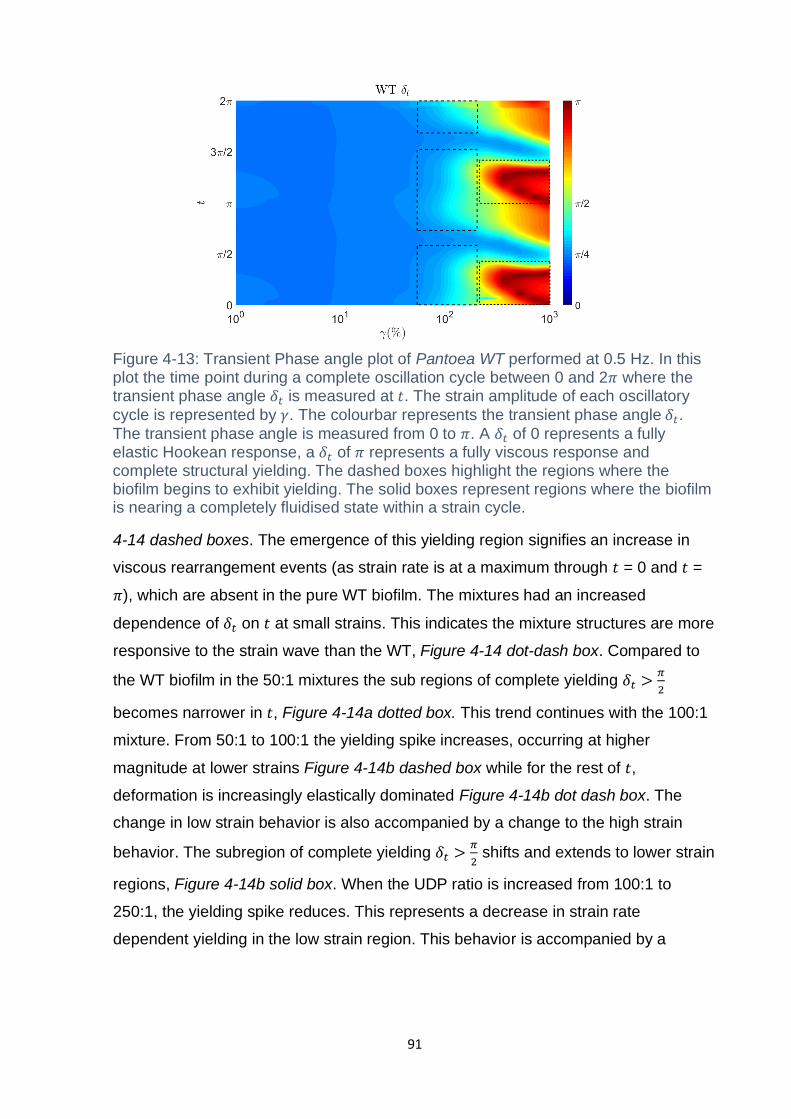
91
4-14 dashed boxes. The emergence of this yielding region signifies an increase in
viscous rearrangement events (as strain rate is at a maximum through 𝑡 = 0 and 𝑡 =
𝜋), which are absent in the pure WT biofilm. The mixtures had an increased
dependence of 𝛿𝑡 on 𝑡 at small strains. This indicates the mixture structures are more
responsive to the strain wave than the WT, Figure 4-14 dot-dash box. Compared to
the WT biofilm in the 50:1 mixtures the sub regions of complete yielding 𝛿𝑡 >𝜋
2
becomes narrower in 𝑡, Figure 4-14a dotted box. This trend continues with the 100:1
mixture. From 50:1 to 100:1 the yielding spike increases, occurring at higher
magnitude at lower strains Figure 4-14b dashed box while for the rest of 𝑡,
deformation is increasingly elastically dominated Figure 4-14b dot dash box. The
change in low strain behavior is also accompanied by a change to the high strain
behavior. The subregion of complete yielding 𝛿𝑡 >𝜋
2 shifts and extends to lower strain
regions, Figure 4-14b solid box. When the UDP ratio is increased from 100:1 to
250:1, the yielding spike reduces. This represents a decrease in strain rate
dependent yielding in the low strain region. This behavior is accompanied by a
Figure 4-13: Transient Phase angle plot of Pantoea WT performed at 0.5 Hz. In this plot the time point during a complete oscillation cycle between 0 and 2𝜋 where the transient phase angle 𝛿𝑡 is measured at 𝑡. The strain amplitude of each oscillatory
cycle is represented by 𝛾. The colourbar represents the transient phase angle 𝛿𝑡. The transient phase angle is measured from 0 to 𝜋. A 𝛿𝑡 of 0 represents a fully elastic Hookean response, a 𝛿𝑡 of 𝜋 represents a fully viscous response and complete structural yielding. The dashed boxes highlight the regions where the biofilm begins to exhibit yielding. The solid boxes represent regions where the biofilm is nearing a completely fluidised state within a strain cycle.
92
reduction in 𝛿𝑡 for the rest of 𝑡 through the oscillation cycle, Figure 4-14c dashdot
dash box. Compared to the 100:1 mixture the subregion of complete yielding for
250:1 occurred at lower strains, Figure 4-14c dotted box. The trend of a reducing
yield peak at small strains continued when the packing fraction was increased from
250:1 to the monoculture of UDP, Figure 4-14d dashed box. The small strain
behavior of UDP also was increasingly elastic in response of the oscillation cycle,
Figure 4-14d dashdot box, whist the region of complete yielding remained
comparable to the 250:1 mixture, Figure 4-14d solid.
4.4 Discussion and conclusions
In this chapter I have shown how the rheology of a bacterial biofilm is influenced by
the secretion of EPS. The EPS composition of Pantoea sp. was manipulated through
Figure 4-14: Transient Phase angle plot of Pantoea.sp at increasing UDP: WT ratios. In this plot the thick dash line boxes in the top left of each plot represent the region where strain 𝛾 for the respective strain amplitude is largest during an oscillation cycle. This region for each biofilm is elastically dominated. By reducing the amylovoran quantity in the biofilm this region grew increasingly elastically dominated. The dash box in each plot represents the region where strain rate was highest during the respective oscillation cycle. This region reduced in prominence as amylovoran concentration was reduced, signifying an increase in elasticity. The solid line box’s represent the region during an oscillation cycle at the respective strains where the material was completely yielded. With a reduction in amylovan this region grew to occur at lower strains. At high amylovoran concentration 50:1 the region of complete yielding grew to occur over a larger proportion of the oscillation.
A B
C D
93
genetic modification by deleting the UDP operon which controls the secretion of
amylovoran, a capsular acidic polysaccharide. The WT Pantoea sp. had a
macrostructure which was swelled and had a corresponding microstructure with a low
packing of 𝜙= 0.16± 0.04. This could be due to the high concentrations of
amylovoran, a hydrophilic exopolysaachride, which would increase the equilibrium
swelling point of the biofilm. The bacteria within the microstructure were separated
into small clusters. These microstructural characteristics are like other strains which
are known to have amylovoran as an EPS component such as Pantoea stewartii and
Erwinia pyrifoliae (Tecon & Leveau, 2016).
Pantoea WT was characteristic of a viscoelastic liquid and reptation polymer network
by displaying a constant viscous modulus 𝐺’’ until yielding and then shear thinning.
Repatating entangled polymer networks form in concentrated polymer solutions
through the constriction of polymer motion by topological constraints by neighboring
chains. The relaxation time of this network is influenced by polymer molecular weight
and chain relaxation. The molecular weight of amylovoran is between 1- 5 MDa
depending upon the culture conditions. When produced from agar plate culture
conditions amylovroan is known to have a molecular size of 5 MDa (Schollmeyer et
al., 2012). As the polysaccharide network is sheared entanglements break and
reform. When the strain rate is above the rate of entanglement formation the material
shear thins. If the rate of entanglement formation between different regions of the
chain is above the shear rate the viscosity of the solution remains constant.
Deletion of UDP which controls amylovoran production resulted in a microstructure
which tightly packed 𝜙= 0.64± 0.08. The rheological behavior of the UDP deletion
biofilm was typical of glasses and weak gels, exhibiting a prominent vicious
overshoot. In repulsive glassy systems, weak bonding interactions and physical
jamming and caging are primarily responsible for the stress bearing capacity of the
structure.
The difference in amylovoran production between WT and UDP meant that by
culturing mixtures of these two strains the amylovoran concentration and packing
fraction could be varied in a controlled manner. This framework enabled the study of
the phase transition between the viscoelastic liquid behavior of WT and glassy
rheology of the UDP mutant, analogous to the methodology used to study colloidal
gel phase transitions. In these studies, the control variables are colloid packing
94
fraction and colloidal bonding strength, which can be controlled using polymer
concentration, ionic concentration and pH (Mendoza et al., 2018).
The concentration of amylovoran was inversely linked to the packing fraction and
bacterial cluster size. Bacteria have been shown to aggregate due to various
mechanisms such as, interactions depletion attraction (Dorken et al., 2012) and
through autoagglutinins such as Ag43 in E. coli and PIA in S. aureus (Ageorges et
al., 2019; Haaber et al., 2012). Amylovoran is a cell surface bound capsular
exopolysaccharide, analogous to an absorbing polymer on a colloidal surface. The
timelapse images of the WT showed cell – cell repulsion with increasing polymer
concentration. Increased EPS secretion resulted in increased bacterial separation.
Computational studies of polymer bound colloidal mixtures have demonstrated that
colloidal packing density is reduced with an increase in polymer molecular weight and
concentration (Howard et al., 2019). However, the precise clustering mechanism of
Pantoea sp. warrants further study.
When the ratio of UDP in the mixture was increased thus decreasing amylovoran
concentration the elastic 𝐺’ and viscous moduli 𝐺’’ increased. The increase in 𝐺’ and
𝐺’’ coincided with an increase to the packing fraction. This is a commonly found
characteristic of colloidal gel systems, as the relative proportion of stiff (in comparison
to the polymer chains) colloids increases. In the case of a biofilm, the colloids being
the bacteria and the polymer chains being the EPS. It was also recently shown that
gel elasticity is a function of the concentration of interconnected clusters (Whitaker et
al., 2019). The yield strain of the Pantoea sp. mixtures reduced with increasing
concentrations of UDP, a phenomenon known as the Payne effect. The dynamics of
the Payne effect within the Pantoea sp. biofilm was revealed using the intercycle 𝑇
ratio. The 𝑇 ratio revealed a mild thickening behavior in the pure WT biofilm. The
magnitude of thickening reduced and the emergence of thinning (𝑇 < 0) occurred at
lower strains at intermediate packing fractions (50:1 and 100:1 ratios). This effect has
been seen in a variety of particle filled polymer networks and has been attributed to
the increasing hydrodynamics effect of the particles on the polymer network whereby
the associated effect amplifies the local strain of the polymer matrix (Y. Song & Zheng,
2016). When the packing fraction transitions from intermediate to high (250:1 or pure
UDP) the onset of thinning (𝑇 < 0) increases to higher strains. Preempting the onset
of thinning behavior is the emergence of a thickening region (𝑇 < 0). The transition in
95
𝑇 behavior from low, intermediate to high ratios of UDP could potentially be explained
by the considering the relative contribution of the EPS network against the bacteria
network at each ratio. The balance between these two networks could be noticed in
the viscous moduli 𝐺’’ curve of the 10:1, 50:1 and 100:1 mixture. These curves
exhibited two distinct regions of power law behavior. The first in the MAOS region
𝐺𝑀𝐴𝑂𝑆′′ ~𝛾0
−1
2𝜐 and the second in the LAOS region 𝐺𝐿𝐴𝑂𝑆
′′ ~𝛾0−𝜐 where 𝜐 is the exponent
for the power law behavior after the cross over point in the LAOS region for ratios.
The double power law gradient found in 𝐺’’ is symptomatic of a system with two
distinct processes which each are a confluence of multiple relaxation times.
Reptating polymer networks feature a spectrum of relaxation times due to the variety
of entanglement configurations present. The presence of two power law gradients
may relate to the presence of these two dominant networks within the biofilm. The
EPS network being predominantly structured through polysaccharide entanglements
and the second being the bacteria/bacteria jamming interactions.
The intercellular bonding strength within Pantoea sp. biofilms appears to be low due
to the repulsive glassy behavior of the UDP pure strain and viscoelastic liquid state of
the WT specimen. Thus a collision incident between clusters is likely to cause cluster
breakup, which is reflected through the reduced strain at which thinning behavior is
exhibited as the concentration of UDP is increased from 50:1 to 100:1. When the
ratio is increased to 250:1 the rheology becomes dominated by glassy jamming. This
is reflected by the emergence of the type III hump and an increased strain before the
crossover point and the onset of thinning. In this phase, thinning is preceded by
thickening (type III) which is caused by the increased energy required to rearrange
the jammed rod state.
This chapter demonstrated how the ratio of EPS to bacteria is a main determinant of
the biofilm rheological response in biofilms which feature an EPS with hydrophilic
capsular polysaccharides. The Pantoea sp. WT produced large quantities of EPS
containing amylovoran. The high concentrations of EPS and large molecular weight
of amylovoran appeared to form an entangled EPS network which dominated the
rheological response. This resulted in a viscoelastic liquid behavior akin to a reptating
gel network with a low strength (low 𝐺’ in the LVER) and a high yield strain. The
rheological response of Pantoea sp. UDP: WT mixtures displayed a two-stage power
law behavior which was attributed to the interplay between the EPS network and the
96
bacteria network, akin to a double network hydrogel (Jia Yang et al., 2018). The
balance between which of the two networks dominated the rheological response was
controlled by the EPS concentration of the biofilm. Reducing the polymer
concentration coincided with an increased packing fraction and shift in the 𝑇 behavior
of the biofilm. This shift was related to the Payne effect and hydrodynamic
interactions between the bacteria and EPS which amplified local strain of the polymer
matrix. The reduced polymer concentration resulted in an increase to nonlinear strain
thinning at intermediate packing fractions, which was depicted in the SPP analysis.
The thinning behavior was then suppressed at lower EPS concentration as
bacteria/bacteria constriction through increased topological caging increased in
prominence.
In this chapter I demonstrated how the secretion of a hydrophilic capsular
exopolysaccharide influences the microstructural and rheological phases behavior in
a PGPR bacterial strain. I showed that by controlling EPS through mixing a wild type
EPS producer with an EPS deficient mutant the controlled study of biofilm phase
transitions could be performed. The nonlinear techniques of LAOS provided detailed
information into to the thinning and thickening associated with the rheological phase
behavior which could be interpreted with reference to EPS network properties and
the constriction of the bacteria network.
The framework used here therefore could be relevant towards studying how EPS
components interact within the EPS network and used to access how changes in
entanglements and crosslinking between components alters biofilm behavior in high
shear environments. This frame work could be used to study EPS network modified
due to polymer/protein interactions, such as LecB and Psl in P. aeruginosa and the
impact of alginate on phase behavior and large strain deformation (Kovach et al.,
2017; Passos da Silva et al., 2019). The framework may also be relevant for
investigating how biofilm EPS concentration alters porous media hydrodynamics,
such as soil, where biofilm fluid interactions can substantially influence flow fields
(Aufrecht et al., 2018, 2019; Carrel et al., 2018). Conversely the concepts of LAOS
may have application in tailoring the rheological properties of synthetically modified
PGPR specifically for a target plant species and specific soil properties.

98
Chapter 5 Results: Multiplicity of yielding in bacterial biofilms
5.1 Introduction Over the previous two chapters it has been demonstrated how LAOS provides
insights into the yielding dynamics of chemically treated biofilms, where attraction
and packing influence macroscale rheology, and shown how EPS secretion
influences phase transitions in Pantoea sp. YR343 resulting in transitions between
viscoelastic liquid and glassy behavior. In this chapter I compared the rheology of 4
bacterial strains which exhibit contrasting rheology. I investigated 2 rod-shaped
bacteria: Comamonas denitrificans and Pseudomonas fluorescens, a cocci
bacterium, Staphylococcus epidermidis and a diplococcus bacterium, Neisseria
polysaccharea.
Biofilms display rheological behavior similar to colloidal glasses and gels. Depending
upon the culture method, air-solid interface, interfacial liquid-air or submerged liquid
flow, biofilms exhibit properties ranging from viscoelastic liquid to gel (Pavlovsky et
al., 2013; P A Rühs et al., 2014). The rheological behavior of a biofilm varies with the
physicochemical environment and the phenotypic expression of proteins and
polysaccharides. In corresponding soft matter systems, the rheology is mediated by
the colloidal packing fraction and the interaction strength. The magnitude of colloid
/colloid interaction strength and packing fraction determines the viscoelastic
response of soft matter systems which can be categorised into 3 distinct phases;
liquid, glass or gel (Y. Xu et al., 2018). These phases are widely studied in well
characterised colloidal systems where the packing fraction, electrolyte concentration,
pH and temperature are modulated to control interparticle interaction strength (Y. Xu
et al., 2018). As the packing density of a structure is increased, the interaction
strength between the particles becomes of increasing importance (Solomon & Spicer,
2010). Gels and glasses can be subcategorized as attractive or repulsive (Zaccarelli
& Poon, 2009). Glassy rheology is primarily driven by the self-confinement of
particles by their nearest neighbors and this structure is termed a cage. In an
unperturbed structure, particles remain within their cages, but as the material is
sheared particles hop and migrate in and out of the cages, resulting in structural
rearrangement and yielding. Glassy systems are primarily formed by repulsive long-
range interactions (Voigtmann, 2014). Gel systems have comparatively high particle
interaction strength, which results in the self-assembly of networked structures at low
packing fractions. Depending upon the strength of interaction, the gel is categorised
99
as either repulsive or attractive. In a repulsive system the attraction between particles
is weak, and systems display a single yielding process (Shao et al., 2013; Zhi et al.,
2015). With increasing interaction strength an additional yielding process occurs,
resulting in two step yielding. To fully capture the rich dynamics which occur in each
viscoelastic phase and construct structure property relationships, both linear and
nonlinear rheology need to be quantified. The type of rearrangement dynamics which
cause the transitioning from elastic to viscous dominant behavior can be captured
using Large amplitude oscillatory shear (LAOS). The LAOS techniques used here
enable us to quantitatively characterize emergent non-linear behavior, providing a
platform to compare gel/glassy rearrangement processes.
5.2 Materials and methods
5.2.1 Bacterial strain and growth
P. fluorescens Migula 1895 and Comamonas denitrificans 123 ATCC 700936 were
purchased from the ATCC and Staphylococcus epidermidis 096R was kindly
provided as a gift from Prof. Grant Burgess, Newcastle University, UK. Neisseria
polysaccharea 31001 was provided as a gift from Dr. Nick Jakubovics, Newcastle
University, UK. P. fluorescens Migula, Comamonas denitrificans 123 and
Staphylococcus epidermidis 096R were cultured overnight in Tryptic soy broth (TSB).
Cultures were adjusted to an OD of 0.2. 150 µl of culture was distributed over the
surface of 1 % TSA plates using an L-shaped spreader. P. fluorescens and C.
denitrificans were incubated at 24 oC for 48 hours. S. epidermidis was incubated at
37 oC for 48 hours. Neisseria polysaccharea 31001 was cultured in BHI broth
overnight anaerobically at 37 oC in candle jars and distributed over chocolate agar
plates in an anaerobic chamber for 48 hr at 37 oC.TSB agar (per 1 L) contained 30 g
tryptic soy broth (Sigma) and agar concentration dependent upon experiment
(ranging from 0.5 % - 1.5 %). Blood agar contained 37 g/L brain heart infusion
(Oxoid), 5 g/L yeast extract (Merck) and 15 g/L agar (Merck). After sterilization, 5 %
(v/v) defibrinated horse blood (TCS Biosciences) was added. Chocolate agar was
prepared using the same recipe except that, after the addition of horse blood, the
medium was heated to 70 °C for 10 min.
5.2.2 Non-linear rheology - LAOS
A strain-controlled rheometer (Malvern Kinexus Pro+) was mounted on a passive
isolation plate with a 20 mm parallel plate geometry. 120 grit paper was adhered to
the top and bottom geometries to prevent slip. The temperature was controlled at 25
100
oC using a Peltier plate and a solvent trap was used to prevent desiccation. Biofilm
samples were collected from the agar surface using a ground microscope slide. Tests
were performed at a gap height of 1 mm. Amplitude sweeps were taken at 𝜔= 0.5 Hz
at a strain 𝛾 = 0.1 – 1000 %. Samples were pre-sheared at 0.5 Hz for 120 seconds,
then left for 600 seconds to stabilise before performing amplitude sweeps. Raw data
was preprocessed using custom MATlab scripts and boxcar averaged with a window
size of 50. MITlaos, a MATlab based GUI was used to perform Chebychev analysis.
SPP analysis was performed using the MATlab routine SPP\_v1, kindly provided by
Dr Simon Rogers.
5.2.3 CLSM
48 hr biofilm samples were imaged ex situ. Briefly samples were stained with 0.25 ml
of 10µM Syto 63, a cell permeable DNA stain in for 30 mins. Biofilms were then
stained for 30 mins with 1µg/ml FM 1-43, a lipophilic styryl compound which targets
the plasma membrane of cells (Thermofisher,UK). 25 µL of sample was then
collected using a ground microscope slide and transferred to a 25 µL geneframe. A
#1.5 coverslip was used to seal the frame. Imaging was performed using a Leica SP8
stimulated emission depletion (STED) confocal microscope with 100 x 1.4 N/A oil
immersion lens. Biofilms were imaged at a depth of 10 µm from the zero position. FM
1-43 was excited at 488 nm and Syto 63 at 640nm. This corresponds to an excitation
separation distance of 172 nm to ensure blead through between channels was
negligible. Syto 63 and FM 1-43 were acquired in separate channels with emission
filters of 498 – 630 nm for FM 1-43 and 670-750 nm for Syto 63.
5.2.4 Image analysis
Images were processed using ImageJ and custom MATlab scripts. Briefly, images
were bandpass filtered, Mexican hat filtered then median filtered before an Otsu BW
threshold was applied. The packing fraction was calculated using equation,
𝜙𝑝𝑎𝑐𝑘 =𝑁𝑝𝑖𝑥𝑒𝑙=1
𝑁𝑡𝑜𝑡𝑎𝑙 𝑝𝑖𝑥𝑒𝑙𝑠, [80]
using the same method as was applied in chapter 4.
5.2.5 C. denitrificans flocculation protocol
C. denitrificans was cultured in TSB for 48 hr at 24 oC with shaking until an OD of 2,
measured at 595 nm using a photospectrometer (Cary 100 Bio). 4 ml of culture was
centrifuged for 90 seconds at 1000 g and 3 ml of culture media was discarded. The
culture was then pipette up and down 10 times with a 1000 µL pipette and vortex
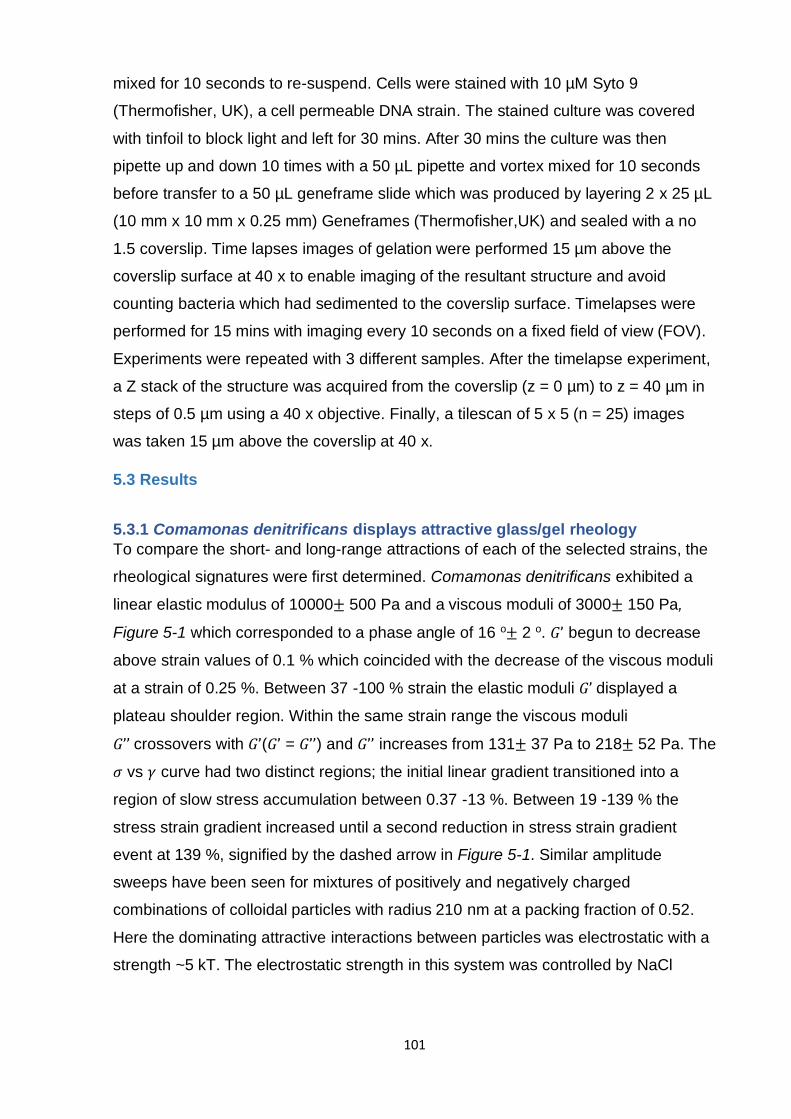
101
mixed for 10 seconds to re-suspend. Cells were stained with 10 µM Syto 9
(Thermofisher, UK), a cell permeable DNA strain. The stained culture was covered
with tinfoil to block light and left for 30 mins. After 30 mins the culture was then
pipette up and down 10 times with a 50 µL pipette and vortex mixed for 10 seconds
before transfer to a 50 µL geneframe slide which was produced by layering 2 x 25 µL
(10 mm x 10 mm x 0.25 mm) Geneframes (Thermofisher,UK) and sealed with a no
1.5 coverslip. Time lapses images of gelation were performed 15 µm above the
coverslip surface at 40 x to enable imaging of the resultant structure and avoid
counting bacteria which had sedimented to the coverslip surface. Timelapses were
performed for 15 mins with imaging every 10 seconds on a fixed field of view (FOV).
Experiments were repeated with 3 different samples. After the timelapse experiment,
a Z stack of the structure was acquired from the coverslip (z = 0 µm) to z = 40 µm in
steps of 0.5 µm using a 40 x objective. Finally, a tilescan of 5 x 5 (n = 25) images
was taken 15 µm above the coverslip at 40 x.
5.3 Results
5.3.1 Comamonas denitrificans displays attractive glass/gel rheology
To compare the short- and long-range attractions of each of the selected strains, the
rheological signatures were first determined. Comamonas denitrificans exhibited a
linear elastic modulus of 10000± 500 Pa and a viscous moduli of 3000± 150 Pa,
Figure 5-1 which corresponded to a phase angle of 16 o± 2 o. 𝐺’ begun to decrease
above strain values of 0.1 % which coincided with the decrease of the viscous moduli
at a strain of 0.25 %. Between 37 -100 % strain the elastic moduli 𝐺’ displayed a
plateau shoulder region. Within the same strain range the viscous moduli
𝐺’’ crossovers with 𝐺’(𝐺’ = 𝐺’’) and 𝐺’’ increases from 131± 37 Pa to 218± 52 Pa. The
𝜎 vs 𝛾 curve had two distinct regions; the initial linear gradient transitioned into a
region of slow stress accumulation between 0.37 -13 %. Between 19 -139 % the
stress strain gradient increased until a second reduction in stress strain gradient
event at 139 %, signified by the dashed arrow in Figure 5-1. Similar amplitude
sweeps have been seen for mixtures of positively and negatively charged
combinations of colloidal particles with radius 210 nm at a packing fraction of 0.52.
Here the dominating attractive interactions between particles was electrostatic with a
strength ~5 kT. The electrostatic strength in this system was controlled by NaCl
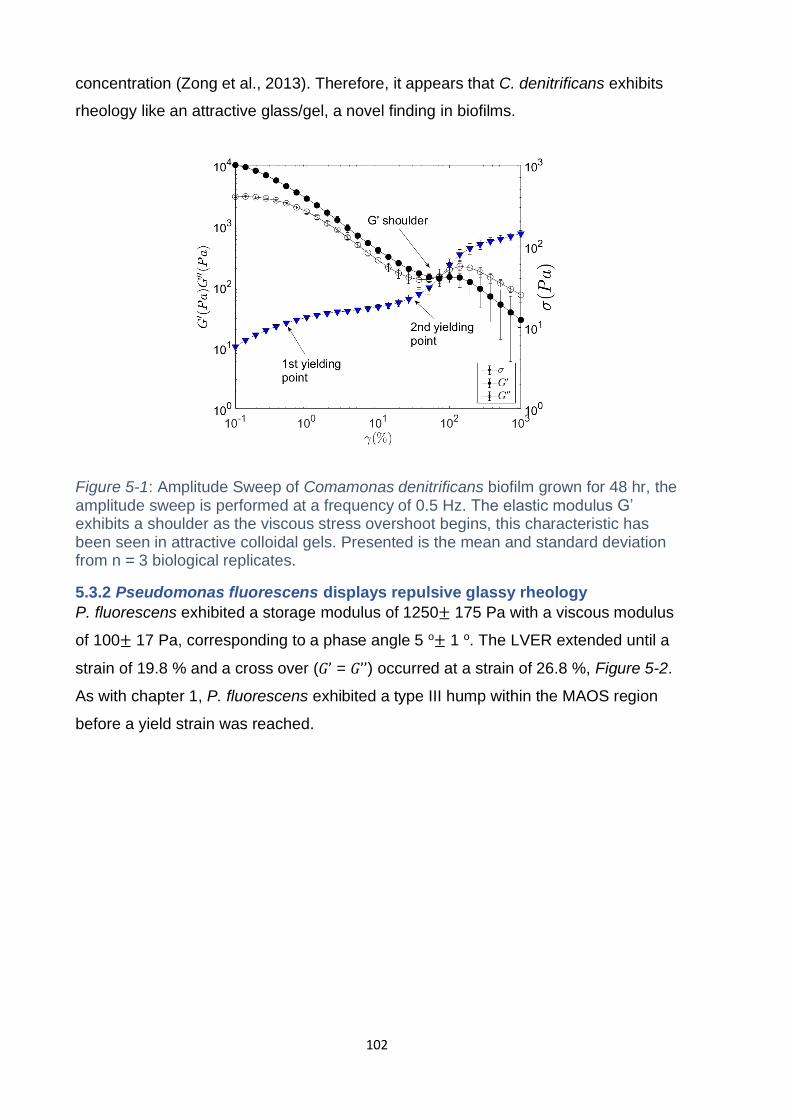
102
concentration (Zong et al., 2013). Therefore, it appears that C. denitrificans exhibits
rheology like an attractive glass/gel, a novel finding in biofilms.
Figure 5-1: Amplitude Sweep of Comamonas denitrificans biofilm grown for 48 hr, the amplitude sweep is performed at a frequency of 0.5 Hz. The elastic modulus G’ exhibits a shoulder as the viscous stress overshoot begins, this characteristic has been seen in attractive colloidal gels. Presented is the mean and standard deviation from n = 3 biological replicates.
5.3.2 Pseudomonas fluorescens displays repulsive glassy rheology
P. fluorescens exhibited a storage modulus of 1250± 175 Pa with a viscous modulus
of 100± 17 Pa, corresponding to a phase angle 5 o± 1 o. The LVER extended until a
strain of 19.8 % and a cross over (𝐺’ = 𝐺’’) occurred at a strain of 26.8 %, Figure 5-2.
As with chapter 1, P. fluorescens exhibited a type III hump within the MAOS region
before a yield strain was reached.
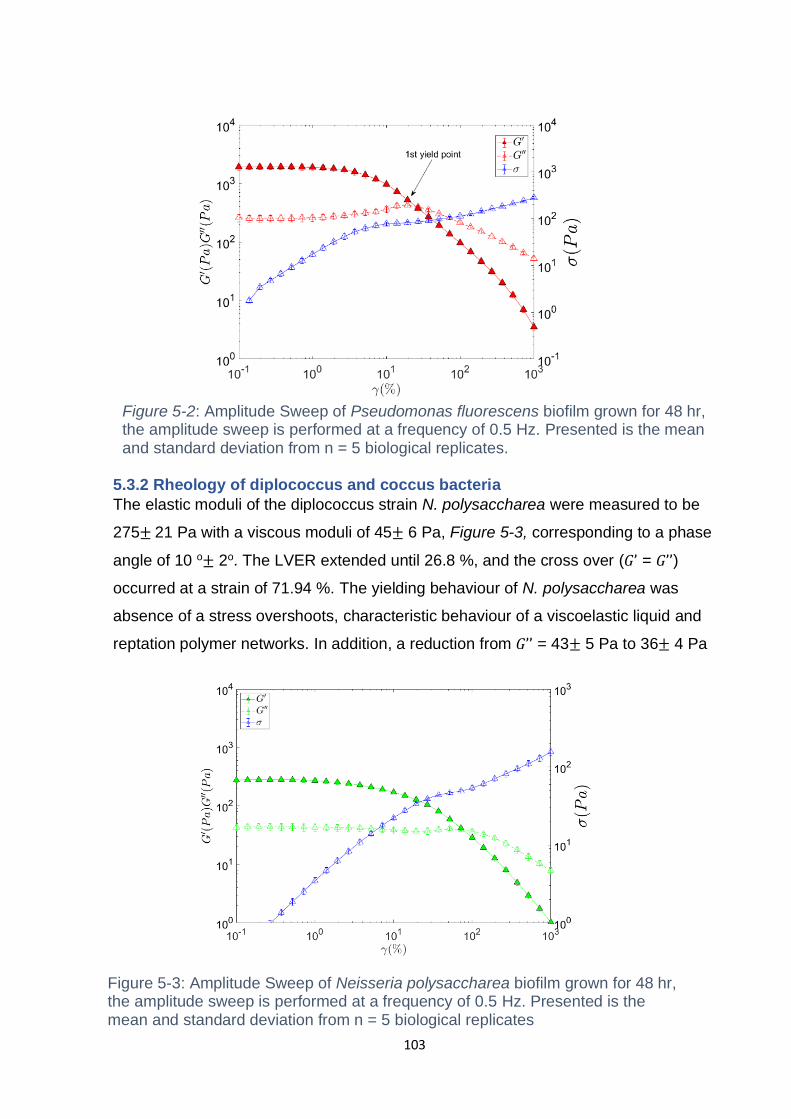
103
5.3.2 Rheology of diplococcus and coccus bacteria
The elastic moduli of the diplococcus strain N. polysaccharea were measured to be
275± 21 Pa with a viscous moduli of 45± 6 Pa, Figure 5-3, corresponding to a phase
angle of 10 o± 2o. The LVER extended until 26.8 %, and the cross over (𝐺’ = 𝐺’’)
occurred at a strain of 71.94 %. The yielding behaviour of N. polysaccharea was
absence of a stress overshoots, characteristic behaviour of a viscoelastic liquid and
reptation polymer networks. In addition, a reduction from 𝐺’’ = 43± 5 Pa to 36± 4 Pa
Figure 5-3: Amplitude Sweep of Neisseria polysaccharea biofilm grown for 48 hr, the amplitude sweep is performed at a frequency of 0.5 Hz. Presented is the mean and standard deviation from n = 5 biological replicates
Figure 5-2: Amplitude Sweep of Pseudomonas fluorescens biofilm grown for 48 hr, the amplitude sweep is performed at a frequency of 0.5 Hz. Presented is the mean and standard deviation from n = 5 biological replicates.
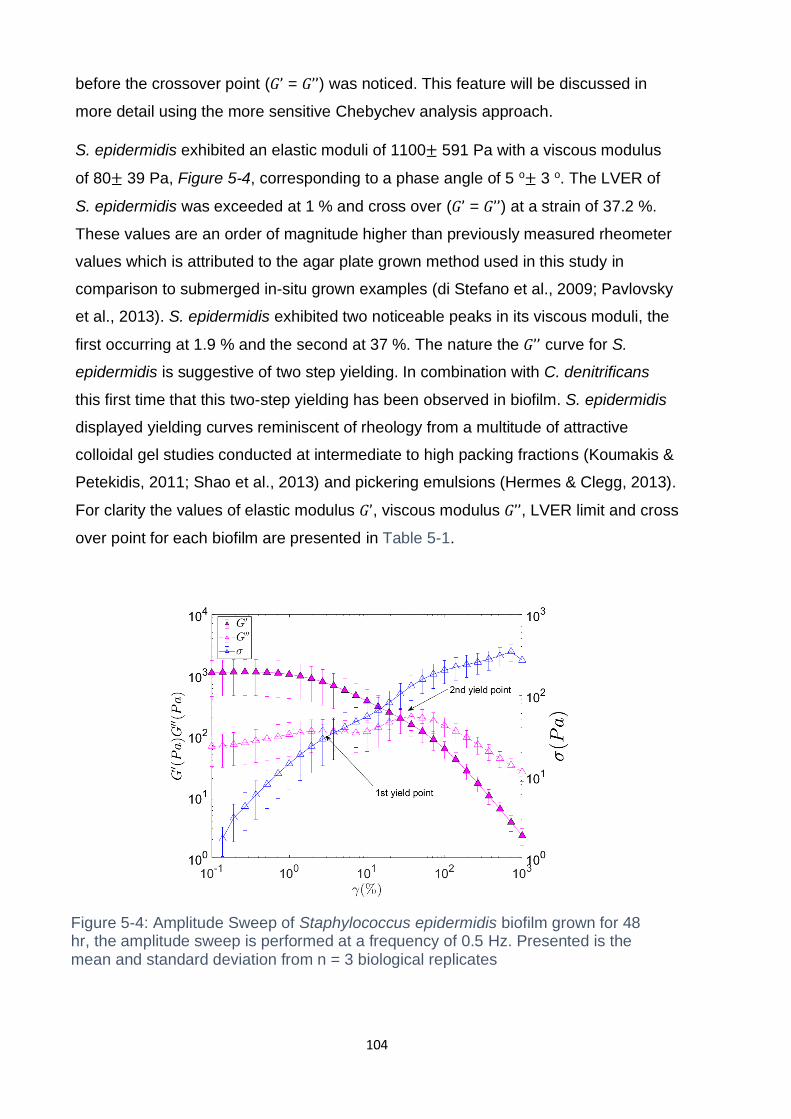
104
before the crossover point (𝐺’ = 𝐺’’) was noticed. This feature will be discussed in
more detail using the more sensitive Chebychev analysis approach.
S. epidermidis exhibited an elastic moduli of 1100± 591 Pa with a viscous modulus
of 80± 39 Pa, Figure 5-4, corresponding to a phase angle of 5 o± 3 o. The LVER of
S. epidermidis was exceeded at 1 % and cross over (𝐺’ = 𝐺’’) at a strain of 37.2 %.
These values are an order of magnitude higher than previously measured rheometer
values which is attributed to the agar plate grown method used in this study in
comparison to submerged in-situ grown examples (di Stefano et al., 2009; Pavlovsky
et al., 2013). S. epidermidis exhibited two noticeable peaks in its viscous moduli, the
first occurring at 1.9 % and the second at 37 %. The nature the 𝐺’’ curve for S.
epidermidis is suggestive of two step yielding. In combination with C. denitrificans
this first time that this two-step yielding has been observed in biofilm. S. epidermidis
displayed yielding curves reminiscent of rheology from a multitude of attractive
colloidal gel studies conducted at intermediate to high packing fractions (Koumakis &
Petekidis, 2011; Shao et al., 2013) and pickering emulsions (Hermes & Clegg, 2013).
For clarity the values of elastic modulus 𝐺’, viscous modulus 𝐺’’, LVER limit and cross
over point for each biofilm are presented in Table 5-1.
Figure 5-4: Amplitude Sweep of Staphylococcus epidermidis biofilm grown for 48 hr, the amplitude sweep is performed at a frequency of 0.5 Hz. Presented is the mean and standard deviation from n = 3 biological replicates
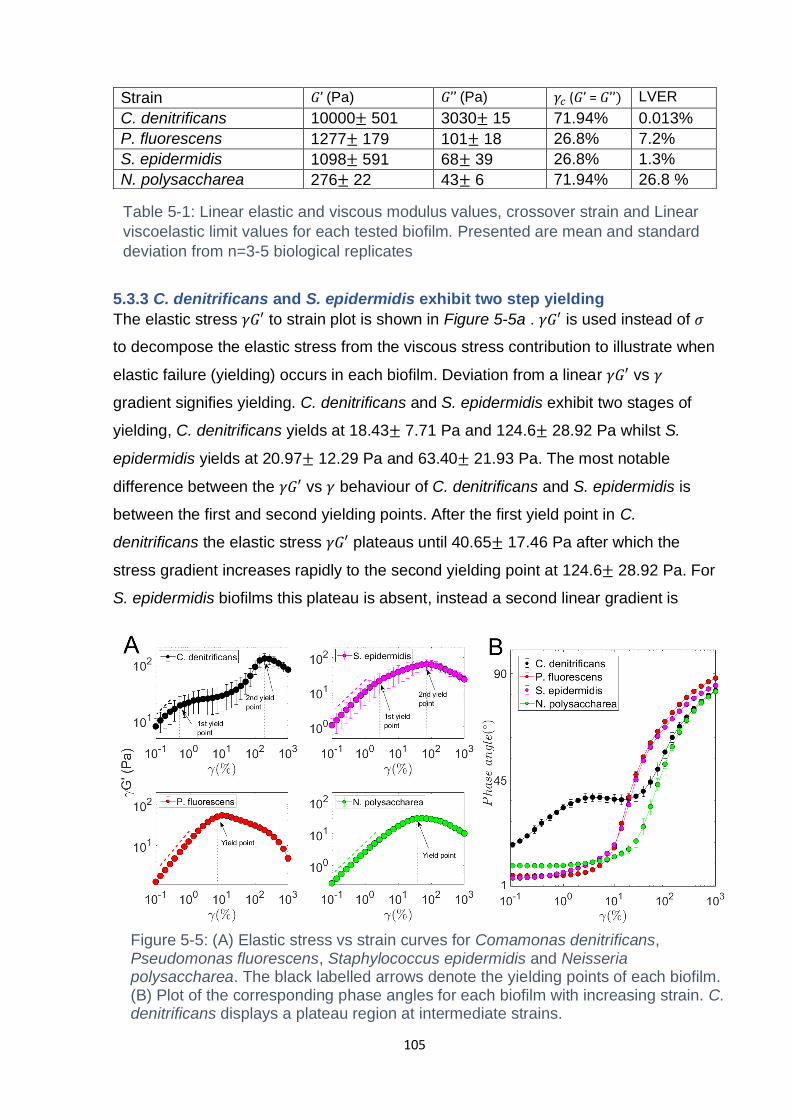
105
5.3.3 C. denitrificans and S. epidermidis exhibit two step yielding
The elastic stress 𝛾𝐺′ to strain plot is shown in Figure 5-5a . 𝛾𝐺′ is used instead of 𝜎
to decompose the elastic stress from the viscous stress contribution to illustrate when
elastic failure (yielding) occurs in each biofilm. Deviation from a linear 𝛾𝐺′ vs 𝛾
gradient signifies yielding. C. denitrificans and S. epidermidis exhibit two stages of
yielding, C. denitrificans yields at 18.43± 7.71 Pa and 124.6± 28.92 Pa whilst S.
epidermidis yields at 20.97± 12.29 Pa and 63.40± 21.93 Pa. The most notable
difference between the 𝛾𝐺′ vs 𝛾 behaviour of C. denitrificans and S. epidermidis is
between the first and second yielding points. After the first yield point in C.
denitrificans the elastic stress 𝛾𝐺′ plateaus until 40.65± 17.46 Pa after which the
stress gradient increases rapidly to the second yielding point at 124.6± 28.92 Pa. For
S. epidermidis biofilms this plateau is absent, instead a second linear gradient is
Strain 𝐺’ (Pa) 𝐺’’ (Pa) 𝛾𝑐 (𝐺’ = 𝐺’’) LVER
C. denitrificans 10000± 501 3030± 15 71.94% 0.013%
P. fluorescens 1277± 179 101± 18 26.8% 7.2%
S. epidermidis 1098± 591 68± 39 26.8% 1.3%
N. polysaccharea 276± 22 43± 6 71.94% 26.8 %
Figure 5-5: (A) Elastic stress vs strain curves for Comamonas denitrificans, Pseudomonas fluorescens, Staphylococcus epidermidis and Neisseria polysaccharea. The black labelled arrows denote the yielding points of each biofilm. (B) Plot of the corresponding phase angles for each biofilm with increasing strain. C. denitrificans displays a plateau region at intermediate strains.
Table 5-1: Linear elastic and viscous modulus values, crossover strain and Linear
viscoelastic limit values for each tested biofilm. Presented are mean and standard
deviation from n=3-5 biological replicates
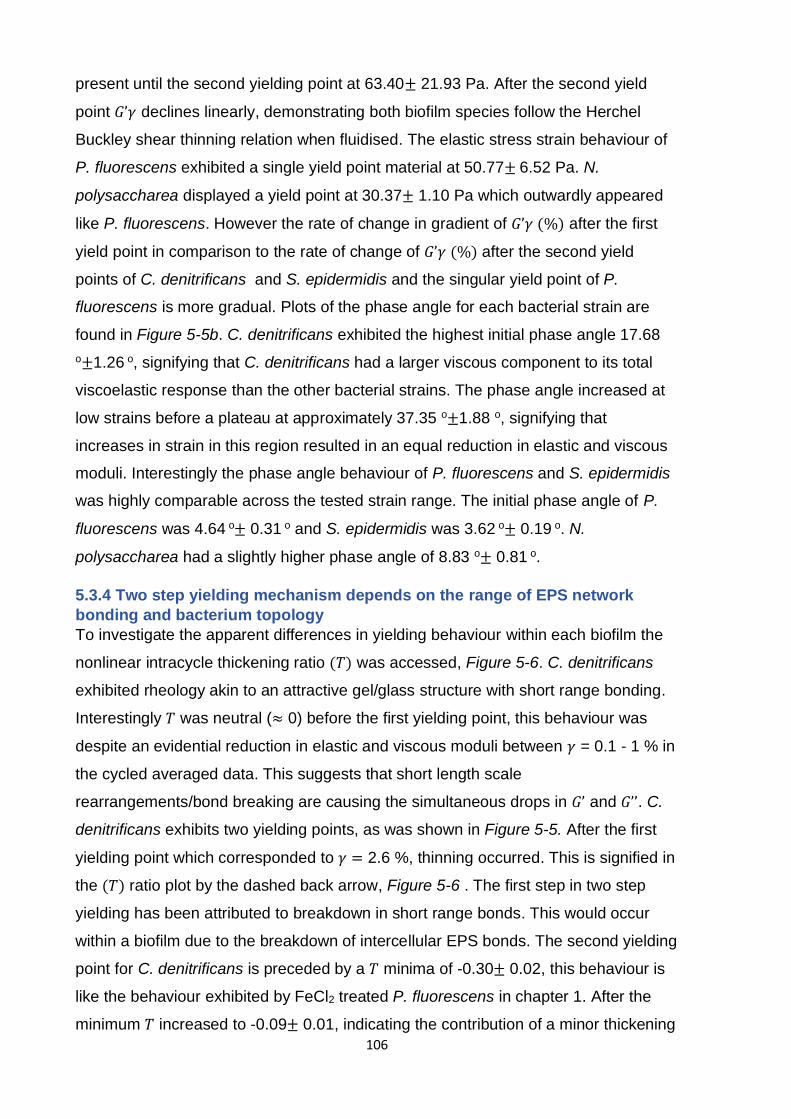
106
present until the second yielding point at 63.40± 21.93 Pa. After the second yield
point 𝐺’𝛾 declines linearly, demonstrating both biofilm species follow the Herchel
Buckley shear thinning relation when fluidised. The elastic stress strain behaviour of
P. fluorescens exhibited a single yield point material at 50.77± 6.52 Pa. N.
polysaccharea displayed a yield point at 30.37± 1.10 Pa which outwardly appeared
like P. fluorescens. However the rate of change in gradient of 𝐺’𝛾 (%) after the first
yield point in comparison to the rate of change of 𝐺’𝛾 (%) after the second yield
points of C. denitrificans and S. epidermidis and the singular yield point of P.
fluorescens is more gradual. Plots of the phase angle for each bacterial strain are
found in Figure 5-5b. C. denitrificans exhibited the highest initial phase angle 17.68
o±1.26 o, signifying that C. denitrificans had a larger viscous component to its total
viscoelastic response than the other bacterial strains. The phase angle increased at
low strains before a plateau at approximately 37.35 o±1.88 o, signifying that
increases in strain in this region resulted in an equal reduction in elastic and viscous
moduli. Interestingly the phase angle behaviour of P. fluorescens and S. epidermidis
was highly comparable across the tested strain range. The initial phase angle of P.
fluorescens was 4.64 o± 0.31 o and S. epidermidis was 3.62 o± 0.19 o. N.
polysaccharea had a slightly higher phase angle of 8.83 o± 0.81 o.
5.3.4 Two step yielding mechanism depends on the range of EPS network
bonding and bacterium topology
To investigate the apparent differences in yielding behaviour within each biofilm the
nonlinear intracycle thickening ratio (𝑇) was accessed, Figure 5-6. C. denitrificans
exhibited rheology akin to an attractive gel/glass structure with short range bonding.
Interestingly 𝑇 was neutral (≈ 0) before the first yielding point, this behaviour was
despite an evidential reduction in elastic and viscous moduli between 𝛾 = 0.1 - 1 % in
the cycled averaged data. This suggests that short length scale
rearrangements/bond breaking are causing the simultaneous drops in 𝐺’ and 𝐺’’. C.
denitrificans exhibits two yielding points, as was shown in Figure 5-5. After the first
yielding point which corresponded to 𝛾 = 2.6 %, thinning occurred. This is signified in
the (𝑇) ratio plot by the dashed back arrow, Figure 5-6 . The first step in two step
yielding has been attributed to breakdown in short range bonds. This would occur
within a biofilm due to the breakdown of intercellular EPS bonds. The second yielding
point for C. denitrificans is preceded by a 𝑇 minima of -0.30± 0.02, this behaviour is
like the behaviour exhibited by FeCl2 treated P. fluorescens in chapter 1. After the
minimum 𝑇 increased to -0.09± 0.01, indicating the contribution of a minor thickening
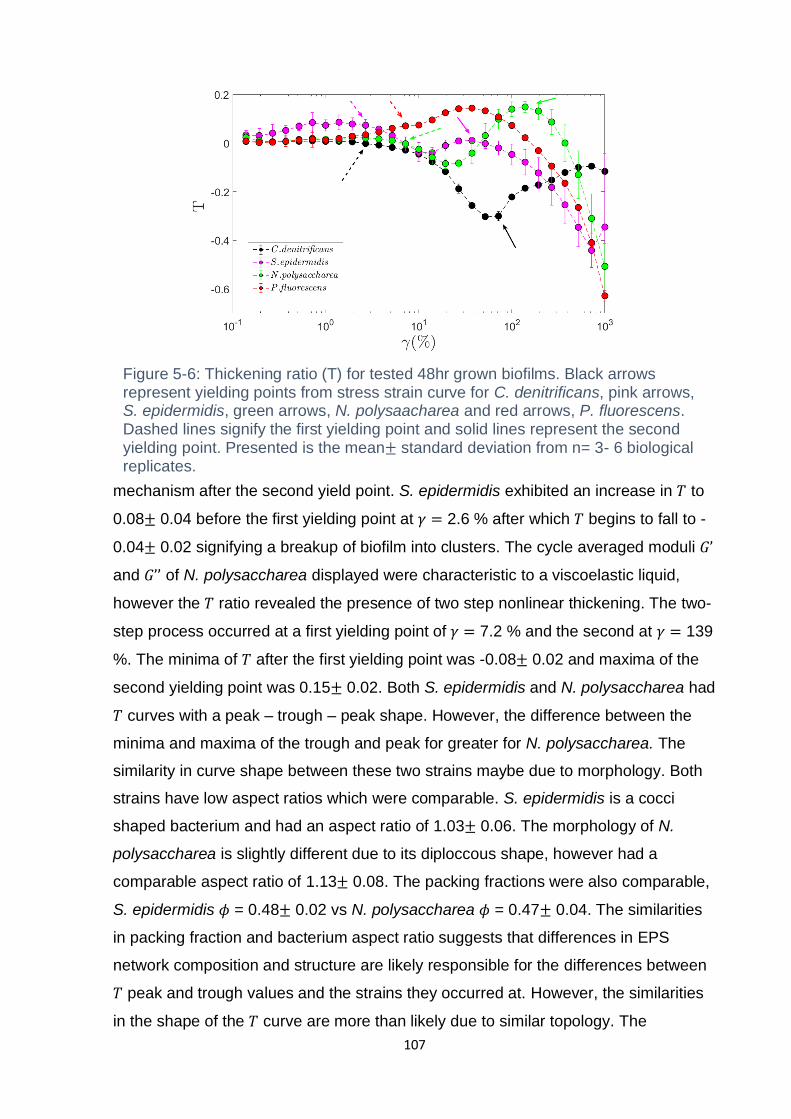
107
mechanism after the second yield point. S. epidermidis exhibited an increase in 𝑇 to
0.08± 0.04 before the first yielding point at 𝛾 = 2.6 % after which 𝑇 begins to fall to -
0.04± 0.02 signifying a breakup of biofilm into clusters. The cycle averaged moduli 𝐺’
and 𝐺’’ of N. polysaccharea displayed were characteristic to a viscoelastic liquid,
however the 𝑇 ratio revealed the presence of two step nonlinear thickening. The two-
step process occurred at a first yielding point of 𝛾 = 7.2 % and the second at 𝛾 = 139
%. The minima of 𝑇 after the first yielding point was -0.08± 0.02 and maxima of the
second yielding point was 0.15± 0.02. Both S. epidermidis and N. polysaccharea had
𝑇 curves with a peak – trough – peak shape. However, the difference between the
minima and maxima of the trough and peak for greater for N. polysaccharea. The
similarity in curve shape between these two strains maybe due to morphology. Both
strains have low aspect ratios which were comparable. S. epidermidis is a cocci
shaped bacterium and had an aspect ratio of 1.03± 0.06. The morphology of N.
polysaccharea is slightly different due to its diploccous shape, however had a
comparable aspect ratio of 1.13± 0.08. The packing fractions were also comparable,
S. epidermidis 𝜙 = 0.48± 0.02 vs N. polysaccharea 𝜙 = 0.47± 0.04. The similarities
in packing fraction and bacterium aspect ratio suggests that differences in EPS
network composition and structure are likely responsible for the differences between
𝑇 peak and trough values and the strains they occurred at. However, the similarities
in the shape of the 𝑇 curve are more than likely due to similar topology. The
Figure 5-6: Thickening ratio (T) for tested 48hr grown biofilms. Black arrows represent yielding points from stress strain curve for C. denitrificans, pink arrows, S. epidermidis, green arrows, N. polysaacharea and red arrows, P. fluorescens. Dashed lines signify the first yielding point and solid lines represent the second yielding point. Presented is the mean± standard deviation from n= 3- 6 biological replicates.
108
representative LB plots of each of the tested bacteria are found in the appendix G.
The first step in two-step yielding in attractive colloidal glass and microgels systems
has been attributed to in cage nearest neighbour motion, a process of colloids
constricted by nearest neighbours locally yielding and the breakdown short range
interparticle bonds. The second step has been attributed to the breakdown of the
stress bearing topological constrains of nearest neighbour cages (Genovese, 2012).
In a biofilm system the first yielding process would be analogous to short range
intercellular bonds breaking down locally between nearest neighbour cells at small
strains. The second process would then be due to breakdown of the longer-range
EPS polymer components which bind the together macrostructure of the nearest
neighbour cages. The macrostructural breakdown of the longer-range EPS network
would cause unjamming of the nearest neighbour cages, resulting in flow alignment
and shear thinning (Zong et al., 2013).
To compare the breakdown of cage strength the 𝐺𝑐𝑎𝑔𝑒 moduli is used. The cage
modulus of each biofilm is seen in Figure 5-7. For C. denitrificans, 𝐺𝑐𝑎𝑔𝑒 reduces
rapidly from 10590± 540 Pa at 𝛾 = 0.15 % to a minimum of 317± 8 Pa at 𝛾 = 37.33
%. After this point the cage moduli increases from the minimum to a stable value
centred around 639± 11 Pa. As with the 𝑇 ratio S. epidermidis and N. polysaccharea
display similar trends in 𝐺𝑐𝑎𝑔𝑒 behaviour. The curves are shifted, reflecting the higher
Figure 5-7: Gcage plot for each biofilm, C. denitrificans displays a significant drop as strain increases and converges around the plateau values of S. epidermidis and P. fluorescens. Shown are the mean± standard deviation from 3- 5 biological repeats.
109
strength of S. epidermidis 912± 398 Pa compared to 270± 26 Pa and both feature a
linear portion at low strains 𝛾 < 1 %. Both curves then decrease in value towards a
minimum of 282± 108 Pa and 88± 10 Pa before recovering to 382± 80 Pa and 117±
16 Pa respectively. Interestingly the respective ratio between the starting strength
and 𝐺𝑐𝑎𝑔𝑒 minimum of the cocci/ diplococcus strains was lower than for the rod
bacterium strain. S. epidermidis and N. polysaccharea had a reduction ratio of 3.46±
0.31 and 3.08± 0.15, which compared to 4.37± 0.41 and 33.47± 1.79 for P.
fluorescens and C. denitrificans. This observation suggests that biofilms with rod
bacterium lose an increased proportion of their residual strength in comparison to
cocci/diplococcus bacterium. This is likely due an interplay between the reorientation
and alignment of the rod geometry under flow. This effect would cause the
breakdown of topological constrains and bacterial jamming, resulting in a more
exaggerated reduction in cage strength in comparison to cocci and diplococci
bacterium. For P. fluorescens biofilms a singular well-defined drop in 𝐺𝑐𝑎𝑔𝑒 was
present, this suggesting a singular yielding mechanism. The convergence of 𝐺𝑐𝑎𝑔𝑒
values between C. denitrificans, S. epidermidis and P. fluorescens at high strains is
suggestive of comparable cage strength. This convergence occured when the short-
range components in the EPS matrix’s of C. denitrificans and S. epidermidis broke
down.
As with chapter 1 and 2 each biofilm species was fingerprinted using the SPP
method. This method is used to build phase maps which can fully describe the
occurrence of yielding events. Depending upon where yield occurs, we can make
assumptions as to the range of attraction controlling the rheology of each tested
bacterium. The phase plot of C. denitrificans highlights how yielding predominantly
occurs at low strain values Figure 5-8a red and cyan boxes. These two distinct bands
are present during each half cycle and the first centred around 𝑡 =𝜋
2,3𝜋
2 where strain
is largest and between 𝑡 = 0 and 𝑡 = 𝜋 and 𝑡 =3𝜋
2 and 2𝜋 denoting the occurrence of
both strain dependent (red boxes) and strain/strain rate dependent (cyan boxes)
yielding events. The magnitude of yielding in the cyan region was higher than the
strain dependent yielding events. These two yielding regions were out of phase with
each other, suggesting that the first yielding point in C. denitrificans could be a
confluence of two separate breakdown processes, one strain dependent, the other
strain/strain-rate dependent. It is possible the strain dependent mechanism (red box)
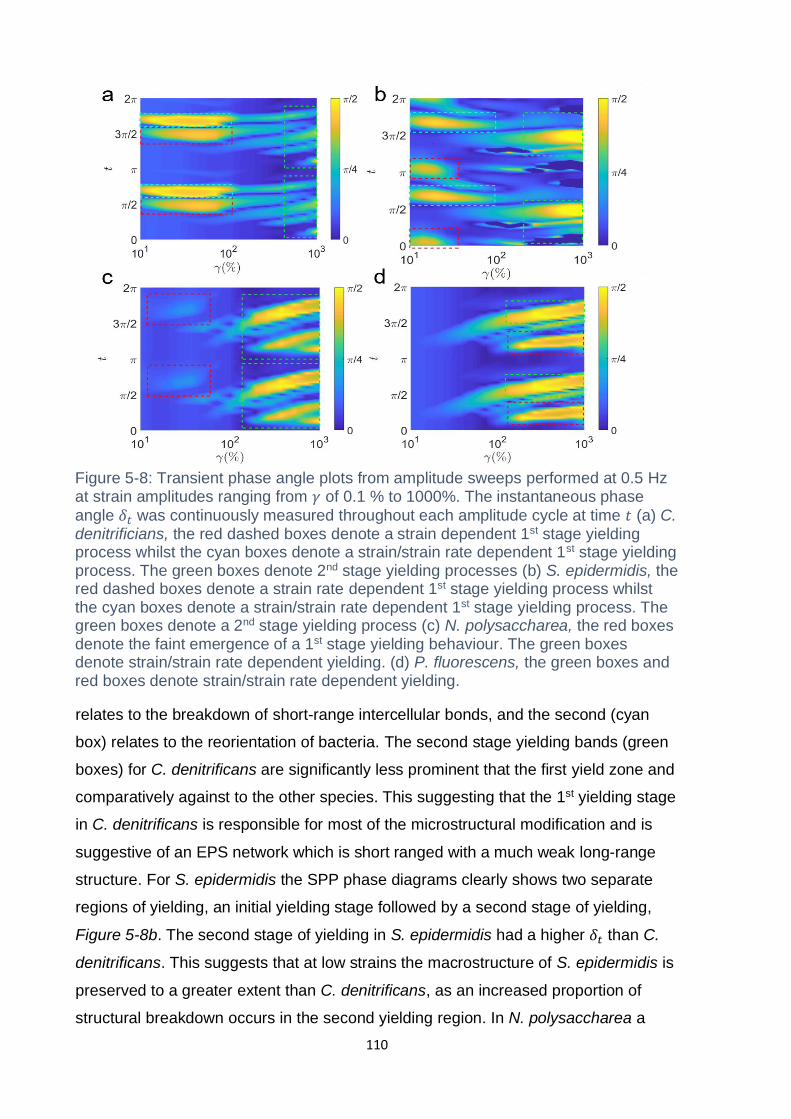
110
relates to the breakdown of short-range intercellular bonds, and the second (cyan
box) relates to the reorientation of bacteria. The second stage yielding bands (green
boxes) for C. denitrificans are significantly less prominent that the first yield zone and
comparatively against to the other species. This suggesting that the 1st yielding stage
in C. denitrificans is responsible for most of the microstructural modification and is
suggestive of an EPS network which is short ranged with a much weak long-range
structure. For S. epidermidis the SPP phase diagrams clearly shows two separate
regions of yielding, an initial yielding stage followed by a second stage of yielding,
Figure 5-8b. The second stage of yielding in S. epidermidis had a higher 𝛿𝑡 than C.
denitrificans. This suggests that at low strains the macrostructure of S. epidermidis is
preserved to a greater extent than C. denitrificans, as an increased proportion of
structural breakdown occurs in the second yielding region. In N. polysaccharea a
Figure 5-8: Transient phase angle plots from amplitude sweeps performed at 0.5 Hz at strain amplitudes ranging from 𝛾 of 0.1 % to 1000%. The instantaneous phase
angle 𝛿𝑡 was continuously measured throughout each amplitude cycle at time 𝑡 (a) C. denitrificians, the red dashed boxes denote a strain dependent 1st stage yielding process whilst the cyan boxes denote a strain/strain rate dependent 1st stage yielding process. The green boxes denote 2nd stage yielding processes (b) S. epidermidis, the red dashed boxes denote a strain rate dependent 1st stage yielding process whilst the cyan boxes denote a strain/strain rate dependent 1st stage yielding process. The green boxes denote a 2nd stage yielding process (c) N. polysaccharea, the red boxes denote the faint emergence of a 1st stage yielding behaviour. The green boxes denote strain/strain rate dependent yielding. (d) P. fluorescens, the green boxes and red boxes denote strain/strain rate dependent yielding.
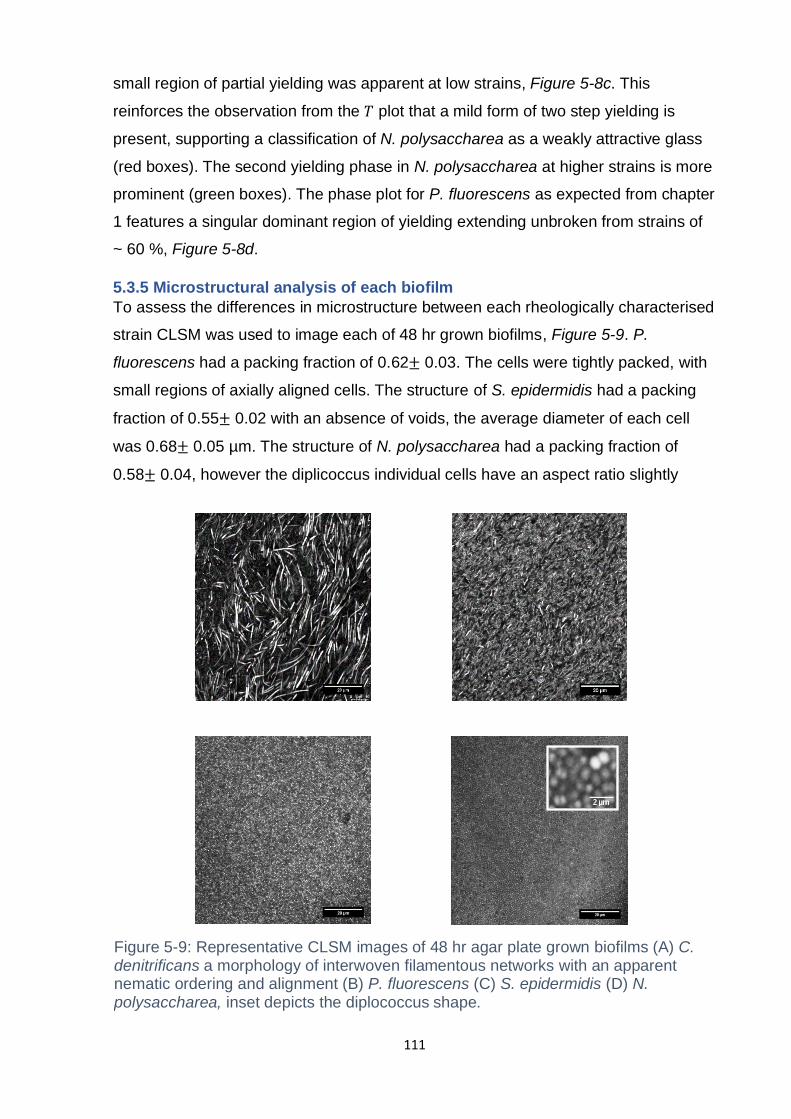
111
small region of partial yielding was apparent at low strains, Figure 5-8c. This
reinforces the observation from the 𝑇 plot that a mild form of two step yielding is
present, supporting a classification of N. polysaccharea as a weakly attractive glass
(red boxes). The second yielding phase in N. polysaccharea at higher strains is more
prominent (green boxes). The phase plot for P. fluorescens as expected from chapter
1 features a singular dominant region of yielding extending unbroken from strains of
~ 60 %, Figure 5-8d.
5.3.5 Microstructural analysis of each biofilm
To assess the differences in microstructure between each rheologically characterised
strain CLSM was used to image each of 48 hr grown biofilms, Figure 5-9. P.
fluorescens had a packing fraction of 0.62± 0.03. The cells were tightly packed, with
small regions of axially aligned cells. The structure of S. epidermidis had a packing
fraction of 0.55± 0.02 with an absence of voids, the average diameter of each cell
was 0.68± 0.05 µm. The structure of N. polysaccharea had a packing fraction of
0.58± 0.04, however the diplicoccus individual cells have an aspect ratio slightly
A B
C D
Figure 5-9: Representative CLSM images of 48 hr agar plate grown biofilms (A) C. denitrificans a morphology of interwoven filamentous networks with an apparent nematic ordering and alignment (B) P. fluorescens (C) S. epidermidis (D) N. polysaccharea, inset depicts the diplococcus shape.
D
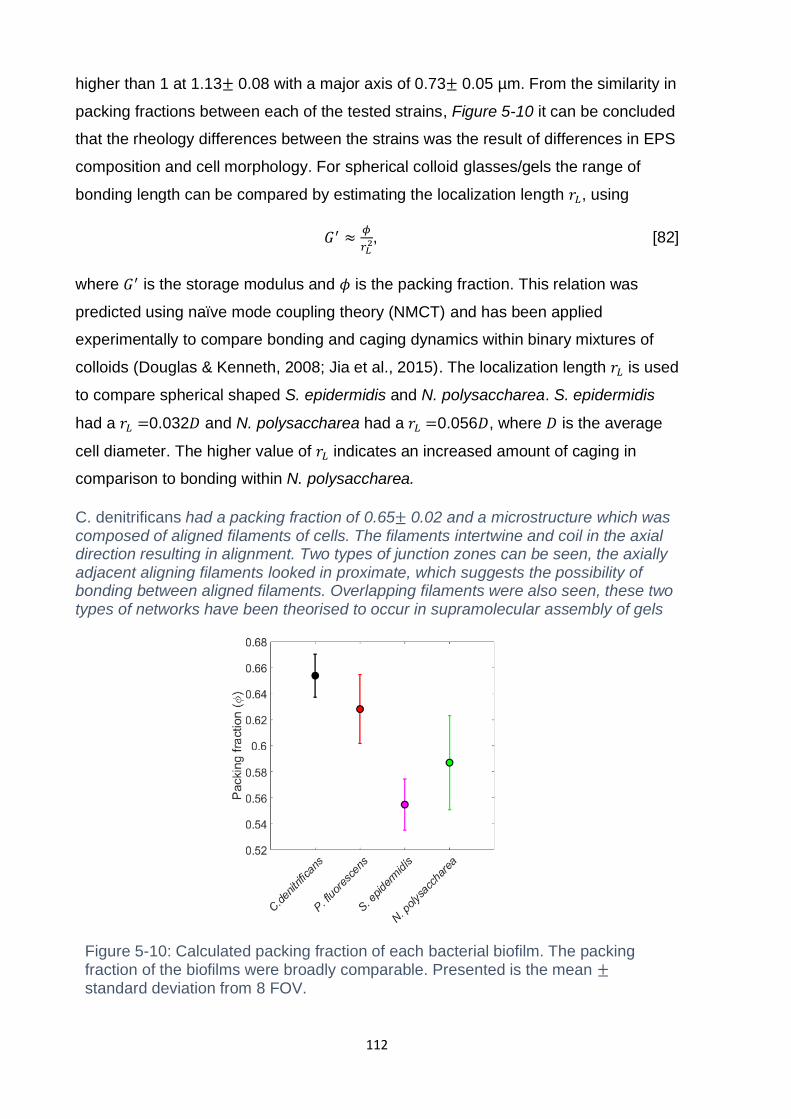
112
higher than 1 at 1.13± 0.08 with a major axis of 0.73± 0.05 µm. From the similarity in
packing fractions between each of the tested strains, Figure 5-10 it can be concluded
that the rheology differences between the strains was the result of differences in EPS
composition and cell morphology. For spherical colloid glasses/gels the range of
bonding length can be compared by estimating the localization length 𝑟𝐿, using
𝐺′ ≈𝜙
𝑟𝐿2, [82]
where 𝐺′ is the storage modulus and 𝜙 is the packing fraction. This relation was
predicted using naïve mode coupling theory (NMCT) and has been applied
experimentally to compare bonding and caging dynamics within binary mixtures of
colloids (Douglas & Kenneth, 2008; Jia et al., 2015). The localization length 𝑟𝐿 is used
to compare spherical shaped S. epidermidis and N. polysaccharea. S. epidermidis
had a 𝑟𝐿 =0.032𝐷 and N. polysaccharea had a 𝑟𝐿 =0.056𝐷, where 𝐷 is the average
cell diameter. The higher value of 𝑟𝐿 indicates an increased amount of caging in
comparison to bonding within N. polysaccharea.
C. denitrificans had a packing fraction of 0.65± 0.02 and a microstructure which was composed of aligned filaments of cells. The filaments intertwine and coil in the axial direction resulting in alignment. Two types of junction zones can be seen, the axially adjacent aligning filaments looked in proximate, which suggests the possibility of bonding between aligned filaments. Overlapping filaments were also seen, these two types of networks have been theorised to occur in supramolecular assembly of gels
Figure 5-10: Calculated packing fraction of each bacterial biofilm. The packing fraction of the biofilms were broadly comparable. Presented is the mean ± standard deviation from 8 FOV.
113
(Raghavan & Douglas, 2012). The occurrence of filamentous growth in C. denitrificans has been observed in liquid culture. Filamentous growth is known to occur due to several mechanisms. Filaments can form due to physical connection preventing disconnection of daughter cells, this can be caused by proteinaceous complexes. Additionally, an inability to separate from daughter cells can also be due to cells with defects in cell division (Claessen et al., 2014). The averaged dimensions and aspect ratio of each strain is summarised in
Table 5-2.
Bacteria Length (µm) Width (µm) Aspect Ratio (r)
C. denitrificans 2.79± 0.21 0.64± 0.08 4.38± 0.35
P. fluorescens 2.27± 0.19 0.43± 0.04 5.22± 0.17
S. epidermidis 0.68± 0.05 0.65± 0.04 1.03± 0.06
N. polysaccharea 0.73± 0.05 0.65± 0.06 1.13± 0.08
Table 5-2: Summary of the length, width and aspect ratio of individual bacteria taken
from 13 replicate CLSM images. Presented is the mean± standard deviation.
5.3.6 C. denitrificans forms gel like aggregates in culture
The striking similarities between the rheology of mixtures of oppositely charged
colloids with strong short-range attraction and attractive colloidal gels and the LAOS
behavior of C. denitrificans led me to hypothesis that cell-cell bonding and the
filamentous growth mode of C. denitrificans was a major contributing mechanism.
Since C. denitrificans exhibited attractive glassy/gel behaviour I hypothesised that the
short-range interactions between bacteria would be large in comparison to similarly
rod-shaped P. fluorescens. Colloidal gels with a high attractive strength form gelated
space spanning structures at low packing fractions, to test if C. denitrificans behaved
as an attractive colloidal gel the aggregation dynamics of concentrated cultures of C.
denitrificans and P. fluorescens (OD = 2 concentrated 3 x) were compared. To test
for the presence of network formation a series of microscopy experiments to visualise
aggregation were performed. Figure 5-11 shows representative images of a time-
lapse experiment comparing C. denitrificans and P. fluorescens aggregation. P.
fluorescens showed a homogeneous distribution of bacteria from T = 0 mins to T =
15 mins. C. denitrificans had a high initial presence of clusters interspersed with
single bacteria, after 7.5 mins a space spanning network had developed in length
and number of junctions (cell-cell attachment). The network densified and formation
plateaued after 15 mins. Junction formation in C. denitrificans was consistently higher
than P. fluorescens. After 15 mins tile scan imaging were performed which showed
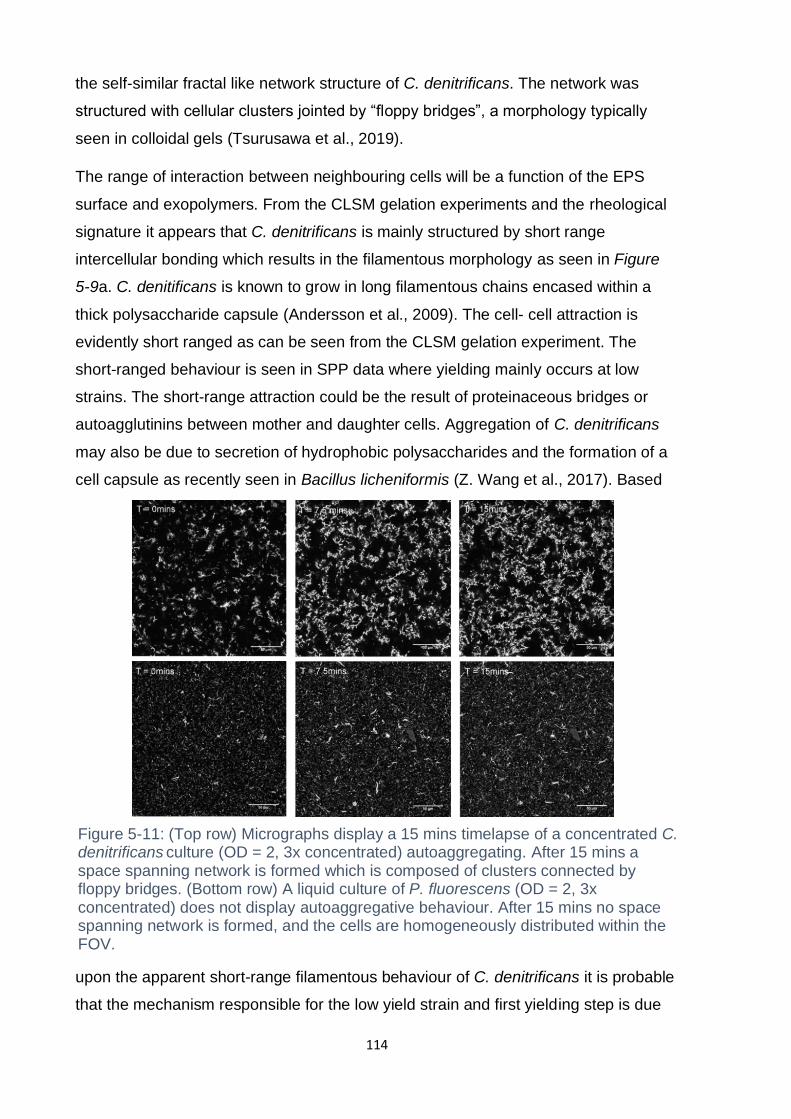
114
the self-similar fractal like network structure of C. denitrificans. The network was
structured with cellular clusters jointed by “floppy bridges”, a morphology typically
seen in colloidal gels (Tsurusawa et al., 2019).
The range of interaction between neighbouring cells will be a function of the EPS
surface and exopolymers. From the CLSM gelation experiments and the rheological
signature it appears that C. denitrificans is mainly structured by short range
intercellular bonding which results in the filamentous morphology as seen in Figure
5-9a. C. denitificans is known to grow in long filamentous chains encased within a
thick polysaccharide capsule (Andersson et al., 2009). The cell- cell attraction is
evidently short ranged as can be seen from the CLSM gelation experiment. The
short-ranged behaviour is seen in SPP data where yielding mainly occurs at low
strains. The short-range attraction could be the result of proteinaceous bridges or
autoagglutinins between mother and daughter cells. Aggregation of C. denitrificans
may also be due to secretion of hydrophobic polysaccharides and the formation of a
cell capsule as recently seen in Bacillus licheniformis (Z. Wang et al., 2017). Based
upon the apparent short-range filamentous behaviour of C. denitrificans it is probable
that the mechanism responsible for the low yield strain and first yielding step is due
Figure 5-11: (Top row) Micrographs display a 15 mins timelapse of a concentrated C. denitrificans culture (OD = 2, 3x concentrated) autoaggregating. After 15 mins a space spanning network is formed which is composed of clusters connected by floppy bridges. (Bottom row) A liquid culture of P. fluorescens (OD = 2, 3x concentrated) does not display autoaggregative behaviour. After 15 mins no space spanning network is formed, and the cells are homogeneously distributed within the FOV.
115
to the breakdown of bacterial filaments as strain is increased. An additional
contributing factor behind the strong shear thinning behaviour of C. denitrificans is
the highly aligned structure of the filaments. Strong alignment in the orientation fields
of many rod colloidal and disk mixtures results in increased shear thinning (Philippe
et al., 2013). C. denitrificans begins with a native structure with has high orientation
order which may explain its shear thinning behaviour at low strains. At low strains the
rotation and movement of bacterial filaments which lead to structural rearrangement
and viscous dissipation is minimal. The lack of viscous dissipation was reflected in
the low in the thickening ratio 𝑇 from 𝛾 = 0.1 - 10 %, which had a maximum at 10% of
0.05± 0.01. The breaking of the short range bacterial filaments bonds causes a
corresponding reduction in 𝐺′ from 10000± 502 Pa to 400± 47 Pa and 𝐺′′ from
3000± 110 Pa to 131± 38 Pa in the 𝛾 = 0.1 - 10 % region. The elastic modulus
initially reducing at a higher rate than viscous moduli up until a strain of 2 %, as see
in the initial increase in phase angle. Here the phase angle reaches a plateau value
of 37°. Similar behaviour of a low linear viscoelastic region (𝛾 < 0.4%) with
simultaneous declines in viscous and elastic modulus have been seen in systems of
oppositely charged colloidal particles (Yiwu et al., 2013). Here it was noted that for
binary mixtures, maintaining a stable cage is challenging due to geometric selection
where particles can only form bonds with oppositely charged particles when in a
specific orientation (Meakin & Djordjevic, 1986). C. denitrificans also exhibited weak
caging behaviour, as was shown in Figure 5-7, which could be due to geometric
selection of “sticky” regions on the bacterial surface. At low strains short range
broken bonds would accumulate, causing a reduction in elastic modulus 𝐺’. The low
strain values in this region preserving the long-range microstructure restricting
particle rotational mobility. As strain increases the number of bond breaking events
increases, reducing both 𝐺’ and 𝐺’’. The plateaued phase angle behaviour could be
due to the simultaneous occurrence of increased bacterial alignment with flow and
short-range bond breaking. At strains above the phase angle plateau the interaction
distance for short range bonding is exceeded, causing a rapid decline in 𝐺’ . The
increased alignment with flow causes intercycle thinning as the networked structure
of filament chains is destroyed, this is seen in the aforementioned 𝑇 plot. At this point
phase angle increases from the plateau, with a corresponding reduction in thinning
behaviour from 𝑇 = -0.30± 0.02 to 0.09± 0.01 and increase in 𝐺𝑐𝑎𝑔𝑒 from a minimum
of 317± 8 Pa to 632± 6 Pa. This signifies an increase in viscous dissipation and
116
rearrangement of the macrostructure. At this point in accordance with other two step
yielding phenological concepts the macrostructure will be composed of interspersed
clusters, with intercluster bacteria bound by short range bonds. The viscous
overshoot from 𝐺’’ = 131± 33 Pa to 218± 52 Pa could be attributed to the increased
mobility of clusters. Rearrangement and breakdown of filamentous microstructure
into clusters would increase dissipation though hydrodynamic interactions causing an
increase in viscous dissipation and thickening behaviour, seen in the shoulder of 𝐺’
and reduction in thinning ratio (𝑇). The simultaneous increase in 𝐺𝑐𝑎𝑔𝑒 could then be
attributed to cluster aggregation mediated by the depth of intercellular interaction
potential and sticking probability, which is a function of the depth of the potential well
and the kinetic energy of cluster – particle and cluster/cluster collisions (Linnes et al.,
2013; Veshchunov, 2015).
5.4 Discussions and Conclusions
In this chapter it was shown how EPS bonding range and cell morphology drive the
rheology of 4 different bacterial strains. The packing fraction for each of the biofilms
were comparable. The nonlinear rheology and mechanisms of stress relief of each
biofilm displayed geometry dependent characteristics, which was mainly noticeable in
the 𝑇 ratio. This can be explained by taking into consideration the degrees of
freedom of the spherical and rod morphologies, and how they orientate under flow.
The EPS matrix in biofilms suppresses Brownian diffusion by restricting translational
and rotational degrees of freedom (Drescher et al., 2016). A spheroid particle has
both rotational and translational degrees of freedom when constraint by nearest
neighbour cages. As the particle is spheroid stress is relieved through translational
movement. For the case of S. epidermidis and N. polysaccharea two main
mechanisms of stress rearrangement are seen. This manifests as two step yielding.
This type of yielding for spherical particles has been seen in several colloidal
rheology studies, but not until now within biofilm systems (Kramb & Zukoski, 2011).
N. polysaccharea exhibited nonlinear thickening behaviour similar S. epidermidis
which can be classified as an attractive glassy system. N. polysaccharea had an
aspect ratio of 1.13 which falls into the glass region as calculated by Zhang who
performed NMCT simulations comparing degrees of freedom in a glassy system
against particle aspect ratio and packing fraction (R. Zhang & Schweizer, 2009).
Further, the nonlinear thickening behaviour of N. polysaccharea appeared similar in
117
behaviour to S. epidermidis, but was shifted, which is attributed to a higher
intercellular bonding strength of the S. epidermidis biofilm. Rod shaped bacteria C.
denitrificans and P. fluorescens displayed different yielding behaviour in comparison
to spherical bacteria, this can be related to the increased aspect ratio, which was
4.38± 0.35 and 5.22± 0.17 respectively. Aspect ratios of this size in systems with
packing fractions 𝜙~ 0.6 correspond to double glassy systems. In this regime the
bacterial cages are localized both rotationally and in translation. However, C.
denitrificans and P. fluorescens have distinct differences between the EPS polymer
networks and consequently has distinctly different non-linear behaviour. P.
fluorescens displayed behaviour of a typical repulsive glassy system characterised
by a singular well-defined hump in viscous modulus before the yield point. The
singular hump is a consequence of both the breakdown of the EPS network
supporting the bacterial cages and the rotational and translational breakdown of the
bacterial cages. The yielding dynamics and similarities to other model repulsive
glassy materials leads us to believe that EPS network in P. fluorescens is long
ranged and evenly distributed around the perimeter of each cell, like a colloidal filled
polymer composite (Genovese, 2012). From this it is assumed that the EPS matrix of
P. fluorescens may not feature a particularly dominant autoagglutinin and the stress
bearing mechanism is mediated by polymer interactions within the EPS matrix. On
the other hand, C. denitrificans appears to have strong short-range intercellular
bonding, this behaviour was evident from SPP phase plot and in the aggregation
experiments. The combination of aggregation into a space spanning network at low
volume fractions and presence of two step yield lead us to classify C. denitrificans as
an attractive gel system. In comparison to P. fluorescens it seems that the stress
bearing structure of C. denitrificans is due to surface bound polymers, which controls
polymer bridging between bacteria. The surface bound polymer maybe linked to the
polysaccharide C. denitrificans is encapsulated within when grown in liquid cultures
and on agarose pads (Andersson et al., 2009).
The occurrence of two step yielding in S. epidermidis also indicated short range
intercellular bonding. The EPS matrix of S. epidermidis is known to feature two
autoagglutinins; PIA an exopolysaccharide encoded through the icaADBC
(intercellular adhesion) operon, Aap (accumulation associated protein) a 220 kDa
microbial surface components recognising adhesive matrix molecule (MSCRAMM)
(Rohde et al., 2005). Secretion of Aap has been shown to increase biofilm formation
118
under dynamic flow conditions and produce a more structured biofilm. Aap is
predominantly localised to the cell surface, causing direct nearest neighbour cell
bonding, whereas PIA forms longer string like attachments between multiple bacteria
(Schommer et al., 2011). Since PIA and Aap both contribute to short-range
intercellular bonding they could be the biofilm components which yield during the first
step of the two-step yield process. The second step yielding process of S.
epidermidis was more prominent than C. denitrificans, which could be seen in the
SPP phase plot. This indicates that S. epidermidis had an EPS network also with
longer ranged stress bearing components. A possible candidate component is Embp,
a 1 MDa protein which binds to the extracellular matrix, however, is secreted in low
volumes unless induced environmental factors such as osmotic stress (Linnes et al.,
2013). The long string like attachment of PIA to multiple cells may also be
responsible for the second longer range yielding step.
The work performed within this chapter demonstrated the application of LAOS
towards the quantification and characterisation of short- and long-range EPS
bonding. The nonlinear signatures of these biofilms were also used to compare the
effects of bacteria shape. In colloidal gels the colloid geometry is known to influence
yielding and breakdown of the macrostructure, the main difference being an increase
flow alignment effect and nematic ordering in rod systems. This work demonstrated
the application of the SPP method, where it was applied to detect differences in
short- and long-range bonding interactions within the EPS matrix of each bacterial
strain. From the SPP fingerprints it was easily noticeable that C. denitrificans had
strong short-range interactions, this resulted in a biofilm with a very high strength (𝐺’
= 10000 ± 501 Pa) but extensive yielding behaviour at low strain values. The short-
range behaviour of C. denitrificans was reflected by the autoaggregation behaviour in
liquid culture and the formation of space spanning networks (gelation). SPP analysis
also revealed that S. epidermidis displayed short range bonding. S. epidermidis is
also known to autoaggregate in liquid culture through the EPS autoagglutins PIA and
Aap. Thus, from this work we have shown that SPP analysis maybe a promising
method to detect the autoaggregation potential of bacterial strains. SPP analysis
could be used as a macroscale probe for deciphering between short range and
longer-range EPS network strength. This could be a promising technique to link
macroscale rheological behaviour to microscale aggregation dynamics.
119
Chapter 6 Conclusions and future work
6.1 Conclusions
In this work I performed a series of rheological studies, using several different
bacteria each with distinct properties. In addition to performing standard linear
rheological protocols, I have applied analytical techniques of LAOS to quantify the
nonlinear behaviour of each biofilm. I was able to relate changes in EPS network
composition and bacterial arrangement to the yielding behaviour of each biofilm.
These behaviours where then explained using concepts from model polymer gels
and colloidal gel studies. I have assessed the effect of bacteria morphology and
strength and locality of EPS networks on biofilm mechanics and demonstrated how
biofilm rheology can be explained using analogies to well characterised colloidal soft
matter systems. In doing so, I have begun to demonstrate an agreement between the
principles which govern both biofilm and well characterised colloidal soft matter
systems.
This thesis has demonstrated that biofilms have a wide spectrum of rheological
responses characteristic of several different phases. The first bacterium
experimented upon was P. fluorescens, a rod-shaped bacterium with an EPS matrix
known to be composed of alginate and LapA. This bacterium demonstrated
behaviour akin to a soft glass or a filled polymer network. This was characterised by
the viscous overshoot behaviour the biofilm exhibited in its viscous modulus as the
cross over strain was approached. The presence of the viscous modulus overshoot
upon approaching the cross over strain was also seen in the similarity rod shaped
Pantoea sp. YR343 UDP mutant strain. This bacterium had a mutation to the UDP
operon, which resulted in the suppression of the production of a major EPS
polysaccharide component, amylovoran. The emergence of the viscous overshoot is
commonly seen in repulsive glass systems, where interparticle bonding strength is
weak. The commonality of nonlinear thickening behaviour of both these strains
suggest that these two bacteria are absent of EPS components with strong
intercellular bonding functionalities. This point can be supported when the bacterium
C. denitrificans is considered. C. denitrificans, like P. fluorescens and Pantoea sp. is
a rod-shaped bacterium, with a comparable aspect ratio to P. fluorescens, 4.38±
0.35 vs 5.22± 0.17 respectively. However, C. denitrificans displayed two-step
yielding behaviour, the first yielding point was at very low strains < 1%, then the
120
second yielding point was at 139 %. This transition in behaviour, from a single
yielding point with a viscous overshoot, to a two-step yielding behaviour is commonly
seen in colloidal glasses and gels, when interparticle bonding strength is increased.
Therefore, it was suspected that C. denitrificans featured an EPS component which
produced strong short-range intercellular bonds. This hypothesis was supported by
its rapid autoaggregation dynamics in liquid culture, which resulted in fractal like
space spanning networks. The presence of autoaggregation suggested that the
short-ranged EPS component could be a possible autoagglutinin, contributing to the
attractive glass/gel behaviour. The range and prominence of the single or two step
yielding processes were precisely mapped using the series of physical processes
(SPP) method. This analysis technique produced distinct phase maps which clearly
showed the regions where the “soft repulsive glass” and “soft attractive glass”
biofilms yielded. The difference between the soft repulsive glass and attractive
glass/gel therefore appears to due be the range of bonding due to the EPS matrix, as
the relative packing fractions of Pantoea sp. UDP (𝜙 = 0.64± 0.08), P. fluorescens (𝜙
= 0.62± 0.03), and C. denitrificans (𝜙 = 0.65± 0.02) are comparable. The range of
bonding in the EPS matrix was studied in chapter 3 through treatment with two
different types of chemical compounds: divalent cations and a chaotropic agent to P.
fluorescens. The divalent cations CaCl2 and FeCl2 produced a stiffening effect. The
stiffening effect was likely due to ionic crosslinking with negatively charged EPS
components. However, the two divalent cation compounds increased stiffness to
different degrees. FeCl2 had a larger stiffening effect. The increase in stiffness was
accompanied by the presence of strain rate thinning in the nonlinear region and the
emergence of two-step yielding. The two-step yielding in the FeCl2 treated P.
fluorescens shared similar nonlinear thinning behaviour with the two-step yielding of
C. denitrificans. Both biofilms displayed a 𝑇 ratio which featured a drop to a thinning
minimum and then increased back to neutrality. The 𝑇 minimum of C. denitrificans
was slightly smaller, -0.30± 0.02 in comparison to FeCl2 treated P. fluorescens, -
0.39± 0.08. However, the dependency of the thinning behaviour on strain and strain
rate are different. The SPP plots for C. denitrificans show that the first yielding
process for C. denitrificans is centred around 𝑡 =𝜋
2,3𝜋
2, where strain is highest.
Whereas the first yielding process for FeCl2 treated P. fluorescens was centred
around 𝑡 = 0, 𝜋, where strain rate is highest. The differences between the first
yielding point between these two biofilms could be due to the way in which the
121
respective EPS networks structure the biofilm. C. denitrificans appears to be
dominantly structured through intercellular bonding between neighbouring bacteria. A
polymer network like this would have a small interaction range, meaning that lower
length scales are required to breakdown the network (Pham et al., 2006). This form
of structural breakdown would be strain dependent, as when the structure is sheared
beyond the interaction range, structural breakdown occurs. On the other hand the
stiffening effect on P. fluorescens treated with FeCl2 is likely dominated by ionic
crosslinking of the EPS network which supports the cells, instead of intercellular
bonding.
This thesis has also shown that biofilms can transition between viscoelastic liquid
and viscoelastic glassy phases by mediating the production of specific EPS
molecules. This was demonstrated using mixtures of Pantoea sp. YR343 and
Pantoea sp. YR343 UDP, a mutant deficient in production of the capsular acidic
polysaccharide amylovoran. Biofilm polysaccharide concentration was varied by
mixing different ratios of wild type and mutant strains. This provided a system in
which the phase transitions from viscoelastic liquid to soft repulsive glassy rheology
could be rheologically investigated. This platform was able to highlight the transition
from a polymer network dominated rheological response to a glassy response which
was increasingly dominated by bacteria/bacteria jamming. Using the chebychev
method and the SPP method I was able to reveal in detail how the nonlinear thinning
and thickening behaviour evolved during the phase transition. This phase transition
also exhibited behaviour akin to the Payne effect, where the onset of a reduction in
elasticity occurs at lower strains with increasing packing fraction. The exact
mechanism behind this yielding mode is still debated. However, the chebychev and
SPP method revealed the nonlinear dynamics which accompanied this effect. These
two methods were able to provide extra information, used to decipher the double
power law behaviour which was detected in the 𝐺′′ curve. This double power law
behaviour was attributed to the interplay between the polymer network and the
bacteria network at low, intermediate and high packing fractions. The evolution in the
nonlinear thickening behaviour was described using the 𝑇 ratio and depicted in the
phase behaviour plots from the SPP method. These results suggested that the
transition, from a polymer network dominated response was increasingly dominated
by the restriction in motion of the bacterial network, as packing fraction increased
towards the random packing limit.
122
The methodology used throughout this thesis has a series of limitations which need
to be considered. The biofilms throughout this thesis were cultured ex situ on agar
plates. They were then transferred to the rheometer via mechanical scrapping.
Scrapping was carefully performed with ground edge microscope slides to avoid
cutting and accidently collecting the agar. The action of perturbing the native
structure of each biofilm may have altered the biofilm mechanical properties.
However, this is a commonly used method when studying biofilm macroscale
rheology (Gloag et al., 2018; Kretschmer & Lieleg, 2020a). It is also expected that
biofilms grown using the agar culture method at the solid gas interface may vary in
EPS composition and component molecular mass in comparison biofilms grown on
solid- liquid interfaces (Schollmeyer et al., 2012). This change of environment may
alter bacteria gene expression, resulting in a change to polymer network composition
and bacterial arrangement within the biofilm microstructure. The difference between
being grown on a solid gas interface and solid liquid interface would also be expected
to result in differences in solvent concentration within the EPS network (Jing Yan et
al., 2018). Biofilms grown at the solid liquid interface would have an increased
solvent concentration, which may explain why biofilms grown at solid gas interfaces
exhibit elasticity and viscosity, values sometimes several magnitudes higher. Biofilms
throughout this thesis were imaged using CLSM in order to calculate packing
fraction. In chapter 3 the cytoplasm of the bacteria was stained, this was
compensated for by applying a dilation step in the image processing pipeline to
account for the cell membrane. Therefore, there remains a possibility that the
packing fraction was underestimated. However, the packing fractions in this chapter
were used to compare the effect of treatment with divalent cations and a chaotropic
compound. In chapters 4 and 5 a cell membrane stain, FM 1-43 was used in addition
to Syto 63, a cell permeable DNA stain. These two channels were then combined,
which provided a more representative estimation of the biofilm packing fractions.
The approach outlined in this thesis centred around improving our understanding of
biofilm rheological behaviour by using nonlinear high-fidelity methods. This approach
enabled rheological fingerprinting, which captured the range and strength of bonding
within the EPS matrix. This approach has potential applications for both fundamental
investigations of how matrix components interact to determine structure and as an
initial characterisation step for environmental isolates. However, the concept of
mechanically fingerprinting biofilms also has potential applications within medical
123
diagnostics. For instance, biofilms isolated from cystic fibrosis patients show a highly
variable rheological properties (Kovach et al., 2017). The mechanical properties of
these biofilms is known to influence the cough clearance index of patients (Gloag et
al., 2018). The application of the techniques used within this thesis may have
relevance in fingerprinting these types of biofilms over time, to access how
treatments effect the range and strength of the EPS matrix. On the other hand, the
LAOS techniques applied here could also have industrial relevance. For instance,
rheological fingerprinting be used as a characterisation stage in the tailoring of biofilm
genetic mutants for use in the 3D printing of functional biofilm materials
(Balasubramanian et al., 2019).
6.2 Future work
To build upon the approach and findings of this thesis and develop our understanding
of biofilm rheology several future tasks and avenues could be explored.
1. Apply rheo-optical methods to visualise the yielding mechanisms of C.
denitrificians and S. epidermidis. Performing simultaneous characterisation of
structure and viscoelastic response. This experiment would assist in
understanding how structural properties such as radial distribution function,
packing, cluster size and porosity correlate with biofilm viscoelastic response.
Imaging the microstructural behaviour of these biofilms in parallel the non-
linear methods would provide a deeper understanding of two step yielding,
and the process by which these biofilms breakdown. It would be particularly
interesting to use EPS deletion mutants of S. epidermidis, as the major
polymeric components are well characterised and this biofilm displayed two-
step yielding. A catalogue of mutants deficient in PIA, Aap, Embp or Bap
would provide a set of strains with varying interaction strengths and ranges.
The fingerprints and microstructural breakdown of these biofilms could then be
used to understand the bonding range of each EPS component. This
knowledge could then be applied towards understanding if S. epidermidis
adapts its matrix composition in response to its mechanical environmental.
2. Identify the polysaccharide/protein secreted by C. denitrificans which results in
short range polar attraction and flocculation behaviour. By identifying this EPS
molecule genetic variants with inducible expression could be constructed. An
inducible mutant would allow regulation of the intercellular bonding strength of
C. denitrificans. This mutant could then be used as an analogous rod shaped
patchy colloidal particle with a controllable pairwise interaction potential. The
124
system of C. denitrificans can be used to investigate the emergence of
elasticity within colloidal gel networks. The two main questions this system
could assist in answering would be related to why viscoelastic materials yield
in a brittle mode and why others yield like a viscoelastic liquid. Using the
aforementioned mutant would enable the investigation into the effect of short-
range bonding on yielding mode. The second fundamental question which
could be investigated using C. denitrificans is how the influence of local
hydrodynamics influences gelation and microstructure of the space spanning
structure. This is an important fundamental question in understanding how
active particles influence the mechanical properties of gels and has industrial
and fundamental importance. This could be studied by tracking the motion of
C. denitrificans during the formation of the space spanning structure and
mapping the flow fields using PIV. This data could then be used to investigate
how fluid structure interactions influence the network microstructure and
parameters such as nematic order, pairwise correlation function and co-
ordination number.
3. Perform co- culture experiments with C. denitrificans which is dominated by
short range interactions and P. fluorescens which is dominated by long range
interactions. It would be interesting to evaluate the competition between these
two strains which display contrasting ranges in interaction. Does the short-
range nature of C. denitrificans which has a slower growth rate than P.
fluorescens confer survival advantages? How would the long-range P.
fluorescens microstructure interact with C. denitrificans? Would mixing these
two species at different ratios result in a system in which I can controllably shift
between two step and one step yielding? If so this system could be evaluated
using rheo- optical methods mentioned in point 1.
4. Access the feasibility of using C. denitrificans as a bio- ink for 3D printing
functional denitrifying wastewater treatment filters and pre seeding filter
systems. Over the past few years, a couple of groups have experimented with
using genetically engineered biofilm forming strains such as Pseudomonas
putida, Acetobacter slinum and E. coli as bio inks within 3d printing systems
(Balasubramanian et al., 2019; Huang et al., 2019; Schaffner et al., 2017).
There are two main concepts used to produce these printed functional living
materials. The first is to mix concentrated bacterial cultures with a synthetic
hydrogel, where the bacteria produce the functionality, and the hydrogel
125
provides the supporting polymer network (Schaffner et al., 2017). The
printability of the material is therefore mainly determined by the viscoelastic
properties of the hydrogel. The second method negates the addition of a
supporting synthetic hydrogel polymer network and directly prints biofilms
which have been collected from agar plates (Huang et al., 2019). Printable
biofilms therefore need to viscously flow during the printing process and have
enough stiffness to maintain the desired morphology. This technique was
attempted using various genetic mutants of B. subtilis, where genetic
manipulation of EPS composition was used to control viscoelasticity and
subsequent printability. As shown in this thesis C. denitrificans has a very high
stiffness 𝐺′ ~ 10000 Pa, which is approximately an order of magnitude higher
than the B. subtilis biofilms used in the aforementioned study. However as
demonstrated with B. subtilis, the printability of biofilms improves with a
reduced stiffness. I hypothesise that the first step yield point of C. denitrificans
at very low strains < 1 % and resulting shear thinning properties would
mitigate the increased stiffness of C. denitrificans biofilm during printing. This
rheological characteristic could mean that its feasible to print C. denitrificans
structures which have a stiffness up to an order of magnitude higher than
contemporary studies. This could yield benefits in the manufacture of 3d
printed denitrification filters and microbial fuel cells.
5. Investigate the applicability of the Flory- Rehner model to calculate the
crosslinking density within biofilms (van der Sman, 2015). This model is
applied by calculating the weight difference between a saturated network and
the network after it has been dried out. The Flory Rehner model is typically
applied to the swelling of rubber networks. However, I believe this thesis has
shown that polymer rheology theory for rubber and colloidal systems can be
closely related to the rheological responses of bacterial biofilms. If I can show
that the Flory – Rehner model is applicable to biofilms this may be a simple
way of calculating cross linking and EPS component cross linker affinities in
biofilm. For example, this theory could be used to investigate the affinity of
protein – polysaccharide crosslinkers which are already known to interact, but
quantitative evidence of their affinities is less well known.
126
References Abbà, A., Collivignarelli, M. C., Manenti, S., Pedrazzani, R., Todeschini, S., &
Bertanza, G. (2017). Rheology and Microbiology of Sludge from a Thermophilic
Aerobic Membrane Reactor. Journal of Chemistry, 2017, 8764510.
https://doi.org/10.1155/2017/8764510
Abriat, C., Virgilio, N., Heuzey, M.-C., & Daigle, F. (2019). Microbiological and real-
time mechanical analysis of Bacillus licheniformis and Pseudomonas fluorescens
dual-species biofilm. Microbiology, 165(7), 747–756.
https://doi.org/10.1099/mic.0.000819
Achouak, W., Heulin, T., Villemin, G., & Balandreau, J. (1994). Root colonization by
symplasmata-forming Enterobacter agglomerans. FEMS Microbiology Ecology,
13(4), 287–294. https://doi.org/10.1111/j.1574-6941.1994.tb00075.x
Ageorges, V., Schiavone, M., Jubelin, G., Caccia, N., Ruiz, P., Chafsey, I., Bailly, X.,
Dague, E., Leroy, S., Paxman, J., Heras, B., Chaucheyras-Durand, F., Rossiter,
A. E., Henderson, I. R., & Desvaux, M. (2019). Differential homotypic and
heterotypic interactions of antigen 43 (Ag43) variants in autotransporter-
mediated bacterial autoaggregation. Scientific Reports, 9(1), 11100.
https://doi.org/10.1038/s41598-019-47608-4
Aggarwal, S., & Hozalski, R. M. (2010). Determination of biofilm mechanical
properties from tensile tests performed using a micro-cantilever method.
Biofouling, 26(4), 479–486. https://doi.org/10.1080/08927011003793080
Allison, S. D., & Martiny, J. B. H. (2008). Resistance, resilience, and redundancy in
microbial communities. Proceedings of the National Academy of Sciences,
105(Supplement 1), 11512–11519. https://doi.org/10.1073/pnas.0801925105
Anderson, B. N., Ding, A. M., Nilsson, L. M., Kusuma, K., Tchesnokova, V., Vogel, V.,
Sokurenko, E. v, & Thomas, W. E. (2007). Weak rolling adhesion enhances
bacterial surface colonization. Journal of Bacteriology, 189(5), 1794–1802.
https://doi.org/10.1128/JB.00899-06
Anderson, V. J., & Lekkerkerker, H. N. W. (2002). Insights into phase transition
kinetics from colloid science. Nature, 416(6883), 811–815.
https://doi.org/10.1038/416811a
127
Andersson, S., Dalhammar, G., Land, C. J., & Kuttuva Rajarao, G. (2009).
Characterization of extracellular polymeric substances from denitrifying organism
Comamonas denitrificans. Applied Microbiology and Biotechnology, 82(3), 535.
https://doi.org/10.1007/s00253-008-1817-3
Andersson, S., Kuttuva Rajarao, G., Land, C. J., & Dalhammar, G. (2008). Biofilm
formation and interactions of bacterial strains found in wastewater treatment
systems. FEMS Microbiology Letters, 283(1), 83–90.
https://doi.org/10.1111/j.1574-6968.2008.01149.x
Angelaalincy, M. J., Navanietha Krishnaraj, R., Shakambari, G., Ashokkumar, B.,
Kathiresan, S., & Varalakshmi, P. (2018). Biofilm Engineering Approaches for
Improving the Performance of Microbial Fuel Cells and Bioelectrochemical
Systems. Frontiers in Energy Research, 6, 63.
https://doi.org/10.3389/fenrg.2018.00063
Armstrong, M. J., Beris, A. N., Rogers, S. A., & Wagner, N. J. (2016). Dynamic shear
rheology of a thixotropic suspension: Comparison of an improved structure-
based model with large amplitude oscillatory shear experiments. Journal of
Rheology, 60(3), 433–450. https://doi.org/10.1122/1.4943986
Aufrecht, J. A., Fowlkes, J. D., Bible, A. N., Morrell-Falvey, J., Doktycz, M. J., &
Retterer, S. T. (2019). Pore-scale hydrodynamics influence the spatial evolution
of bacterial biofilms in a microfluidic porous network. PLoS ONE, 14(6),
e0218316. https://doi.org/10.1371/journal.pone.0218316
Aufrecht, J. A., Timm, C. M., Bible, A., Morrell-Falvey, J. L., Pelletier, D. A., Doktycz,
M. J., & Retterer, S. T. (2018). Quantifying the Spatiotemporal Dynamics of Plant
Root Colonization by Beneficial Bacteria in a Microfluidic Habitat. Advanced
Biosystems, 2(6), 1800048. https://doi.org/doi:10.1002/adbi.201800048
Balasubramanian, S., Aubin-Tam, M.-E., & Meyer, A. S. (2019). 3D Printing for the
Fabrication of Biofilm-Based Functional Living Materials. ACS Synthetic Biology,
8(7), 1564–1567. https://doi.org/10.1021/acssynbio.9b00192
Ballesta, P., Koumakis, N., Besseling, R., Poon, W. C. K., & Petekidis, G. (2013). Slip
of gels in colloid–polymer mixtures under shear. Soft Matter, 9(12), 3237–3245.
https://doi.org/10.1039/C3SM27626K
128
Beauregard, P. B., Chai, Y., Vlamakis, H., Losick, R., & Kolter, R. (2013). Bacillus
subtilis biofilm induction by plant polysaccharides. Proceedings of the National
Academy of Sciences, 110(17), E1621.
https://doi.org/10.1073/pnas.1218984110
Beenken, K. E., Spencer, H., Griffin, L. M., & Smeltzer, M. S. (2012). Impact of
extracellular nuclease production on the biofilm phenotype of Staphylococcus
aureus under in vitro and in vivo conditions. Infection and Immunity, 80(5),
1634–1638. https://doi.org/10.1128/IAI.06134-11
Belas, R. (2014). Biofilms, flagella, and mechanosensing of surfaces by bacteria.
Trends in Microbiology, 22(9), 517–527.
https://doi.org/https://doi.org/10.1016/j.tim.2014.05.002
Bellemann, P., Bereswill, S., Berger, S., & Geider, K. (1994). Visualization of capsule
formation by Erwinia amylovora and assays to determine amylovoran synthesis.
International Journal of Biological Macromolecules, 16(6), 290–296.
https://doi.org/https://doi.org/10.1016/0141-8130(94)90058-2
Beroz, F., Yan, J., Meir, Y., Sabass, B., Stone, H. A., Bassler, B. L., & Wingreen, N.
S. (2018). Verticalization of bacterial biofilms. Nature Physics, 14(9), 954–960.
https://doi.org/10.1038/s41567-018-0170-4
Bible, A. N., Fletcher, S. J., Pelletier, D. A., Schadt, C. W., Jawdy, S. S., Weston, D.
J., Engle, N. L., Tschaplinski, T., Masyuko, R., Polisetti, S., Bohn, P. W.,
Coutinho, T. A., Doktycz, M. J., & Morrell-Falvey, J. L. (2016). A Carotenoid-
Deficient Mutant in Pantoea sp. YR343, a Bacteria Isolated from the
Rhizosphere of Populus deltoides, Is Defective in Root Colonization. Frontiers in
Microbiology, 7, 491. https://doi.org/10.3389/fmicb.2016.00491
Birjiniuk, A., Billings, N., Nance, E., Hanes, J., Ribbeck, K., & Doyle, P. S. (2014).
Single particle tracking reveals spatial and dynamic organization of the
Escherichia coli biofilm matrix. New Journal of Physics, 16(8), 85014.
https://doi.org/10.1088/1367-2630/16/8/085014
Biswas, I., Ghosh, R., Sadrzadeh, M., & Kumar, A. (2016). Nonlinear deformation
and localized failure of bacterial streamers in creeping flows. Scientific Reports,
6(1), 32204. https://doi.org/10.1038/srep32204
129
Blauert, F., Horn, H., & Wagner, M. (2015). Time-resolved biofilm deformation
measurements using optical coherence tomography. Biotechnology and
Bioengineering, 112(9), 1893–1905. https://doi.org/10.1002/bit.25590
Boyd, C. D., Smith, T. J., El-Kirat-Chatel, S., Newell, P. D., Dufrêne, Y. F., &
O'Toole, G. A. (2014). Structural Features of the Pseudomonas
fluorescens; Biofilm Adhesin LapA Required for LapG-Dependent Cleavage,
Biofilm Formation, and Cell Surface Localization. Journal of Bacteriology,
196(15), 2775. https://doi.org/10.1128/JB.01629-14
Brindle, E. R., Miller, D. A., & Stewart, P. S. (2011). Hydrodynamic deformation and
removal of Staphylococcus epidermidis biofilms treated with urea, chlorhexidine,
iron chloride, or DispersinB. Biotechnology and Bioengineering, 108(12), 2968–
2977. https://doi.org/10.1002/bit.23245
Brugnoni, L. I., Tarifa, M. C., Lozano, J. E., & Genovese, D. (2014). In situ rheology
of yeast biofilms. Biofouling, 30(10), 1269–1279.
https://doi.org/10.1080/08927014.2014.981165
Burns, J. L., Yan, Y., Jameson, G. J., & Biggs, S. (2002). The Effect of Molecular
Weight of Nonadsorbing Polymer on the Structure of Depletion-Induced Flocs.
Journal of Colloid and Interface Science, 247(1), 24–32.
https://doi.org/https://doi.org/10.1006/jcis.2001.8115
Burrows, L. L. (2012). Pseudomonas aeruginosa Twitching Motility: Type IV Pili in
Action. Annual Review of Microbiology, 66(1), 493–520.
https://doi.org/10.1146/annurev-micro-092611-150055
Busscher, H. J., & van der Mei, H. C. (2012). How do bacteria know they are on a
surface and regulate their response to an adhering state? PLoS Pathogens,
8(1), e1002440–e1002440. https://doi.org/10.1371/journal.ppat.1002440
Cao, H., Habimana, O., Safari, A., Heffernan, R., Dai, Y., & Casey, E. (2016).
Revealing region-specific biofilm viscoelastic properties by means of a micro-
rheological approach. Npj Biofilms And Microbiomes, 2, 5.
https://doi.org/10.1038/s41522-016-0005-y
Cao, M., & Goodrich-Blair, H. (2017). Ready or Not: Microbial Adaptive Responses in
Dynamic Symbiosis Environments. Journal of Bacteriology, 199(15), e00883-16.
https://doi.org/10.1128/jb.00883-16
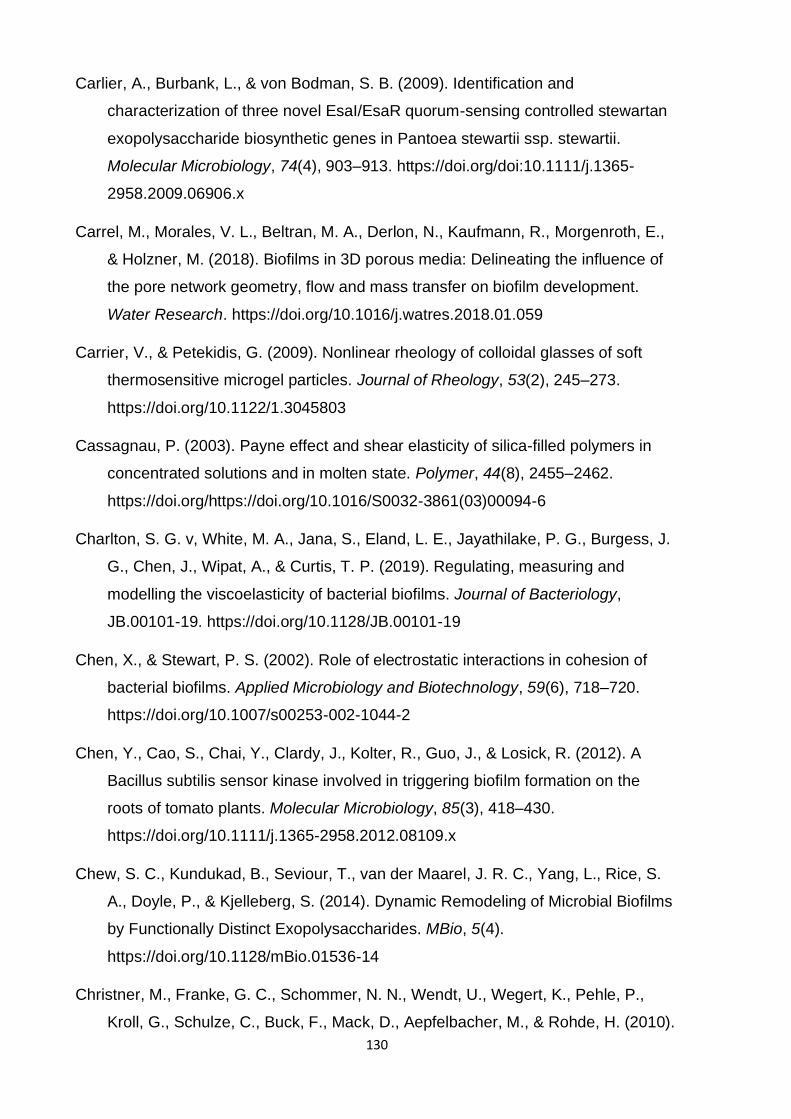
130
Carlier, A., Burbank, L., & von Bodman, S. B. (2009). Identification and
characterization of three novel EsaI/EsaR quorum-sensing controlled stewartan
exopolysaccharide biosynthetic genes in Pantoea stewartii ssp. stewartii.
Molecular Microbiology, 74(4), 903–913. https://doi.org/doi:10.1111/j.1365-
2958.2009.06906.x
Carrel, M., Morales, V. L., Beltran, M. A., Derlon, N., Kaufmann, R., Morgenroth, E.,
& Holzner, M. (2018). Biofilms in 3D porous media: Delineating the influence of
the pore network geometry, flow and mass transfer on biofilm development.
Water Research. https://doi.org/10.1016/j.watres.2018.01.059
Carrier, V., & Petekidis, G. (2009). Nonlinear rheology of colloidal glasses of soft
thermosensitive microgel particles. Journal of Rheology, 53(2), 245–273.
https://doi.org/10.1122/1.3045803
Cassagnau, P. (2003). Payne effect and shear elasticity of silica-filled polymers in
concentrated solutions and in molten state. Polymer, 44(8), 2455–2462.
https://doi.org/https://doi.org/10.1016/S0032-3861(03)00094-6
Charlton, S. G. v, White, M. A., Jana, S., Eland, L. E., Jayathilake, P. G., Burgess, J.
G., Chen, J., Wipat, A., & Curtis, T. P. (2019). Regulating, measuring and
modelling the viscoelasticity of bacterial biofilms. Journal of Bacteriology,
JB.00101-19. https://doi.org/10.1128/JB.00101-19
Chen, X., & Stewart, P. S. (2002). Role of electrostatic interactions in cohesion of
bacterial biofilms. Applied Microbiology and Biotechnology, 59(6), 718–720.
https://doi.org/10.1007/s00253-002-1044-2
Chen, Y., Cao, S., Chai, Y., Clardy, J., Kolter, R., Guo, J., & Losick, R. (2012). A
Bacillus subtilis sensor kinase involved in triggering biofilm formation on the
roots of tomato plants. Molecular Microbiology, 85(3), 418–430.
https://doi.org/10.1111/j.1365-2958.2012.08109.x
Chew, S. C., Kundukad, B., Seviour, T., van der Maarel, J. R. C., Yang, L., Rice, S.
A., Doyle, P., & Kjelleberg, S. (2014). Dynamic Remodeling of Microbial Biofilms
by Functionally Distinct Exopolysaccharides. MBio, 5(4).
https://doi.org/10.1128/mBio.01536-14
Christner, M., Franke, G. C., Schommer, N. N., Wendt, U., Wegert, K., Pehle, P.,
Kroll, G., Schulze, C., Buck, F., Mack, D., Aepfelbacher, M., & Rohde, H. (2010).
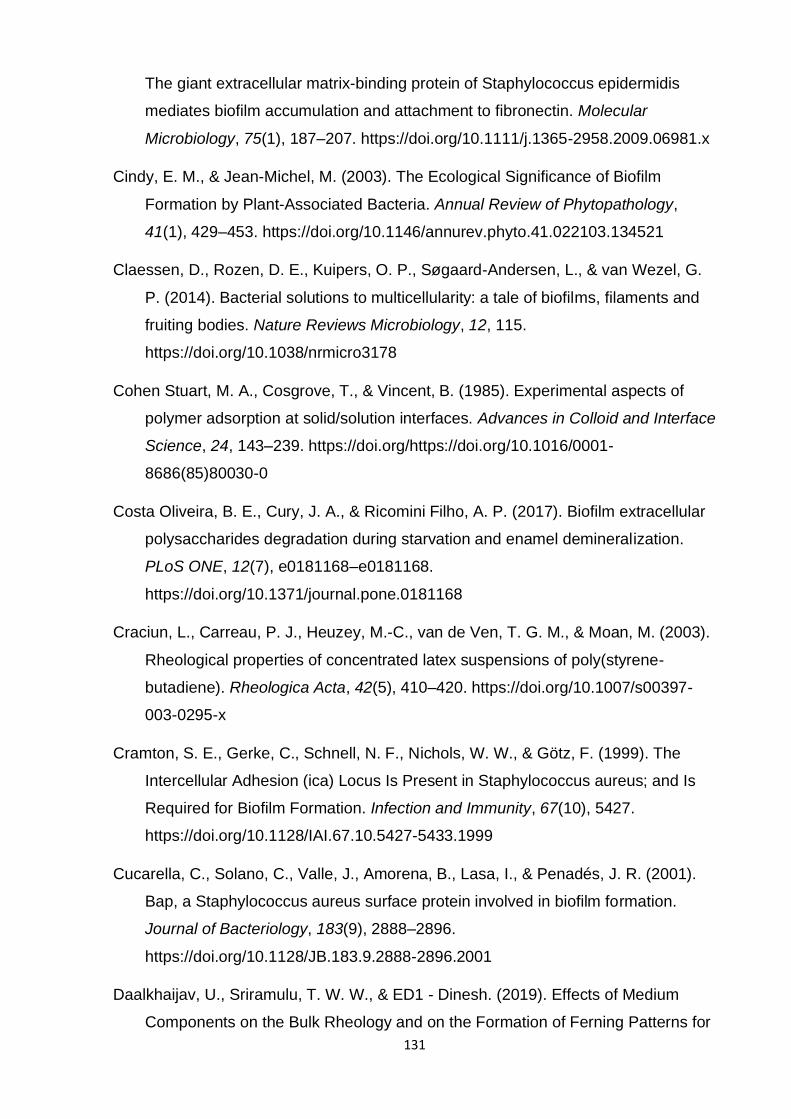
131
The giant extracellular matrix-binding protein of Staphylococcus epidermidis
mediates biofilm accumulation and attachment to fibronectin. Molecular
Microbiology, 75(1), 187–207. https://doi.org/10.1111/j.1365-2958.2009.06981.x
Cindy, E. M., & Jean-Michel, M. (2003). The Ecological Significance of Biofilm
Formation by Plant-Associated Bacteria. Annual Review of Phytopathology,
41(1), 429–453. https://doi.org/10.1146/annurev.phyto.41.022103.134521
Claessen, D., Rozen, D. E., Kuipers, O. P., Søgaard-Andersen, L., & van Wezel, G.
P. (2014). Bacterial solutions to multicellularity: a tale of biofilms, filaments and
fruiting bodies. Nature Reviews Microbiology, 12, 115.
https://doi.org/10.1038/nrmicro3178
Cohen Stuart, M. A., Cosgrove, T., & Vincent, B. (1985). Experimental aspects of
polymer adsorption at solid/solution interfaces. Advances in Colloid and Interface
Science, 24, 143–239. https://doi.org/https://doi.org/10.1016/0001-
8686(85)80030-0
Costa Oliveira, B. E., Cury, J. A., & Ricomini Filho, A. P. (2017). Biofilm extracellular
polysaccharides degradation during starvation and enamel demineralization.
PLoS ONE, 12(7), e0181168–e0181168.
https://doi.org/10.1371/journal.pone.0181168
Craciun, L., Carreau, P. J., Heuzey, M.-C., van de Ven, T. G. M., & Moan, M. (2003).
Rheological properties of concentrated latex suspensions of poly(styrene-
butadiene). Rheologica Acta, 42(5), 410–420. https://doi.org/10.1007/s00397-
003-0295-x
Cramton, S. E., Gerke, C., Schnell, N. F., Nichols, W. W., & Götz, F. (1999). The
Intercellular Adhesion (ica) Locus Is Present in Staphylococcus aureus; and Is
Required for Biofilm Formation. Infection and Immunity, 67(10), 5427.
https://doi.org/10.1128/IAI.67.10.5427-5433.1999
Cucarella, C., Solano, C., Valle, J., Amorena, B., Lasa, I., & Penadés, J. R. (2001).
Bap, a Staphylococcus aureus surface protein involved in biofilm formation.
Journal of Bacteriology, 183(9), 2888–2896.
https://doi.org/10.1128/JB.183.9.2888-2896.2001
Daalkhaijav, U., Sriramulu, T. W. W., & ED1 - Dinesh. (2019). Effects of Medium
Components on the Bulk Rheology and on the Formation of Ferning Patterns for
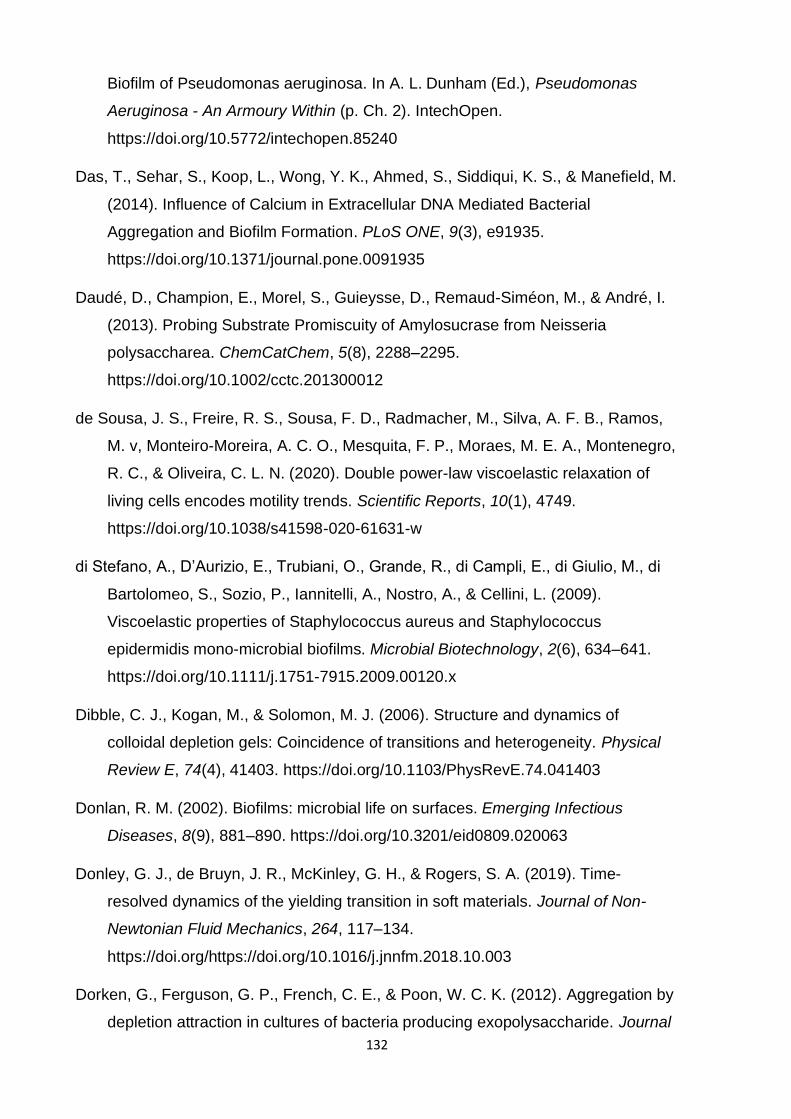
132
Biofilm of Pseudomonas aeruginosa. In A. L. Dunham (Ed.), Pseudomonas
Aeruginosa - An Armoury Within (p. Ch. 2). IntechOpen.
https://doi.org/10.5772/intechopen.85240
Das, T., Sehar, S., Koop, L., Wong, Y. K., Ahmed, S., Siddiqui, K. S., & Manefield, M.
(2014). Influence of Calcium in Extracellular DNA Mediated Bacterial
Aggregation and Biofilm Formation. PLoS ONE, 9(3), e91935.
https://doi.org/10.1371/journal.pone.0091935
Daudé, D., Champion, E., Morel, S., Guieysse, D., Remaud-Siméon, M., & André, I.
(2013). Probing Substrate Promiscuity of Amylosucrase from Neisseria
polysaccharea. ChemCatChem, 5(8), 2288–2295.
https://doi.org/10.1002/cctc.201300012
de Sousa, J. S., Freire, R. S., Sousa, F. D., Radmacher, M., Silva, A. F. B., Ramos,
M. v, Monteiro-Moreira, A. C. O., Mesquita, F. P., Moraes, M. E. A., Montenegro,
R. C., & Oliveira, C. L. N. (2020). Double power-law viscoelastic relaxation of
living cells encodes motility trends. Scientific Reports, 10(1), 4749.
https://doi.org/10.1038/s41598-020-61631-w
di Stefano, A., D’Aurizio, E., Trubiani, O., Grande, R., di Campli, E., di Giulio, M., di
Bartolomeo, S., Sozio, P., Iannitelli, A., Nostro, A., & Cellini, L. (2009).
Viscoelastic properties of Staphylococcus aureus and Staphylococcus
epidermidis mono-microbial biofilms. Microbial Biotechnology, 2(6), 634–641.
https://doi.org/10.1111/j.1751-7915.2009.00120.x
Dibble, C. J., Kogan, M., & Solomon, M. J. (2006). Structure and dynamics of
colloidal depletion gels: Coincidence of transitions and heterogeneity. Physical
Review E, 74(4), 41403. https://doi.org/10.1103/PhysRevE.74.041403
Donlan, R. M. (2002). Biofilms: microbial life on surfaces. Emerging Infectious
Diseases, 8(9), 881–890. https://doi.org/10.3201/eid0809.020063
Donley, G. J., de Bruyn, J. R., McKinley, G. H., & Rogers, S. A. (2019). Time-
resolved dynamics of the yielding transition in soft materials. Journal of Non-
Newtonian Fluid Mechanics, 264, 117–134.
https://doi.org/https://doi.org/10.1016/j.jnnfm.2018.10.003
Dorken, G., Ferguson, G. P., French, C. E., & Poon, W. C. K. (2012). Aggregation by
depletion attraction in cultures of bacteria producing exopolysaccharide. Journal
133
of The Royal Society Interface, 9(77), 3490–3502.
https://doi.org/10.1098/rsif.2012.0498
Douglas, C. V., & Kenneth, S. S. (2008). Theory of gelation, vitrification, and
activated barrier hopping in mixtures of hard and sticky spheres. The Journal of
Chemical Physics, 128(8), 84509. https://doi.org/10.1063/1.2837295
Dragoš, A., Kiesewalter, H., Martin, M., Hsu, C.-Y., Hartmann, R., Wechsler, T.,
Eriksen, C., Brix, S., Drescher, K., Stanley-Wall, N., Kümmerli, R., & Kovács, Á.
T. (2018). Division of Labor during Biofilm Matrix Production. Current Biology,
28(12), 1903-1913.e5. https://doi.org/https://doi.org/10.1016/j.cub.2018.04.046
Dragoš, A., Martin, M., Garcia, C. F., Kricks, L., Pausch, P., Heimerl, T., Bálint, B.,
Maróti, G., Bange, G., López, D., Lieleg, O., & Kovács, Á. T. (2018). Collapse of
genetic division of labour and evolution of autonomy in pellicle biofilms. Nature
Microbiology. https://doi.org/10.1038/s41564-018-0263-y
Drescher, K., Dunkel, J., Nadell, C. D., van Teeffelen, S., Grnja, I., Wingreen, N. S.,
Stone, H. A., & Bassler, B. L. (2016). Architectural transitions in Vibrio cholerae
biofilms at single-cell resolution. Proceedings of the National Academy of
Sciences, 113(14), E2066. https://doi.org/10.1073/pnas.1601702113
Drescher, K., Shen, Y., Bassler, B. L., & Stone, H. A. (2013). Biofilm streamers cause
catastrophic disruption of flow with consequences for environmental and medical
systems. Proceedings of the National Academy of Sciences, 110(11), 4345.
https://doi.org/10.1073/pnas.1300321110
Drozdov, A. D., & Dorfmann, A. (2002). The payne effect for particle-reinforced
elastomers. Polymer Engineering & Science, 42(3), 591–604.
https://doi.org/10.1002/pen.10974
Duan, J., Yi, T., Lu, Z., Shen, D., & Feng, Y. (2007). Rice endophyte Pantoea
agglomerans YS19 forms multicellular symplasmata via cell aggregation. FEMS
Microbiology Letters, 270(2), 220–226. https://doi.org/10.1111/j.1574-
6968.2007.00677.x
Duvarci, O. C., Yazar, G., & Kokini, J. L. (2017). The SAOS, MAOS and LAOS
behavior of a concentrated suspension of tomato paste and its prediction using
the Bird-Carreau (SAOS) and Giesekus models (MAOS-LAOS). Journal of Food
Engineering, 208, 77–88. https://doi.org/10.1016/j.jfoodeng.2017.02.027
134
Eckert, T., & Bartsch, E. (2002). Re-entrant Glass Transition in a Colloid-Polymer
Mixture with Depletion Attractions. Physical Review Letters, 89(12), 125701.
https://doi.org/10.1103/PhysRevLett.89.125701
Edmunds, A. C., Castiblanco, L. F., Sundin, G. W., & Waters, C. M. (2013). Cyclic Di-
GMP modulates the disease progression of Erwinia amylovora. Journal of
Bacteriology, 195(10), 2155–2165. https://doi.org/10.1128/JB.02068-12
Ellison, C. K., Kan, J., Dillard, R. S., Kysela, D. T., Ducret, A., Berne, C., Hampton, C.
M., Ke, Z., Wright, E. R., Biais, N., Dalia, A. B., & Brun, Y. v. (2017). Obstruction
of pilus retraction stimulates bacterial surface sensing. Science, 358(6362), 535.
https://doi.org/10.1126/science.aan5706
Eric, R. B., David, A. M., & Philip, S. S. (2011). Hydrodynamic deformation and
removal of Staphylococcus epidermidis biofilms treated with urea, chlorhexidine,
iron chloride, or DispersinB. Biotechnology and Bioengineering, 108(12), 2968–
2977. https://doi.org/doi:10.1002/bit.23245
Ewoldt, R. H., Johnston, M. T., & Caretta, L. M. (2015). Experimental Challenges of
Shear Rheology: How to Avoid Bad Data. In S. E. Spagnolie (Ed.), Complex
Fluids in Biological Systems: Experiment, Theory, and Computation (pp. 207–
241). Springer New York. https://doi.org/10.1007/978-1-4939-2065-5_6
Ewoldt, R. H., & McKinley, G. H. (2010). On secondary loops in LAOS via self-
intersection of Lissajous–Bowditch curves. Rheologica Acta, 49(2), 213–219.
https://doi.org/10.1007/s00397-009-0408-2
Ewoldt, R. H., Winter, P., Maxey, J., & McKinley, G. H. (2010). Large amplitude
oscillatory shear of pseudoplastic and elastoviscoplastic materials. Rheologica
Acta, 49(2), 191–212. https://doi.org/10.1007/s00397-009-0403-7
Feng, Y., Shen, D., Dong, X., & Song, W. (2003). In vitro symplasmata formation in
the rice diazotrophic endophyte Pantoea agglomerans YS19. Plant and Soil,
255(2), 435–444. https://doi.org/10.1023/a:1026079203474
Fish, K. E., Collins, R., Green, N. H., Sharpe, R. L., Douterelo, I., Osborn, A. M., &
Boxall, J. B. (2015). Characterisation of the physical composition and microbial
community structure of biofilms within a model full-scale drinking water
distribution system. PloS One, 10(2), e0115824–e0115824.
https://doi.org/10.1371/journal.pone.0115824
135
Fleming, D., Chahin, L., & Rumbaugh, K. (2017). Glycoside Hydrolases Degrade
Polymicrobial Bacterial Biofilms in Wounds. Antimicrobial Agents and
Chemotherapy, 61(2), e01998-16. https://doi.org/10.1128/AAC.01998-16
Flemming, H.-C. (2011). The perfect slime. Colloids and Surfaces B: Biointerfaces,
86(2), 251–259. https://doi.org/http://dx.doi.org/10.1016/j.colsurfb.2011.04.025
Flemming, H.-C., Neu, T. R., & Wozniak, D. J. (2007). The EPS matrix: the “house of
biofilm cells.” Journal of Bacteriology, 189(22), 7945–7947.
https://doi.org/10.1128/JB.00858-07
Flemming, H.-C., & Wingender, J. (2010). The biofilm matrix. Nature Reviews
Microbiology, 8(9), 623–633. https://doi.org/10.1038/nrmicro2415
Flemming, H.-C., & Wuertz, S. (2019). Bacteria and archaea on Earth and their
abundance in biofilms. Nature Reviews Microbiology, 17(4), 247–260.
https://doi.org/10.1038/s41579-019-0158-9
Frølund, B., Palmgren, R., Keiding, K., & Nielsen, P. H. (1996). Extraction of
extracellular polymers from activated sludge using a cation exchange resin.
Water Research, 30(8), 1749–1758.
https://doi.org/http://dx.doi.org/10.1016/0043-1354(95)00323-1
Fuqua, C. (2010). Passing the baton between laps: adhesion and cohesion in
Pseudomonas putida biofilms. Molecular Microbiology, 77(3), 533–536.
https://doi.org/10.1111/j.1365-2958.2010.07250.x
Galy, O., Latour-Lambert, P., Zrelli, K., Ghigo, J.-M., Beloin, C., & Henry, N. (2012).
Mapping of bacterial biofilm local mechanics by magnetic microparticle actuation.
Biophysical Journal, 103(6), 1400–1408.
https://doi.org/10.1016/j.bpj.2012.07.001
Ganesan, M, Stewart, E. J., Szafranski, J., Satorius, A. E., Younger, J. G., &
Solomon, M. J. (2013). Molar mass, entanglement, and associations of the
biofilm polysaccharide of Staphylococcus epidermidis. Biomacromolecules,
14(5), 1474–1481. https://doi.org/10.1021/bm400149a
Ganesan, Mahesh, Knier, S., Younger, J. G., & Solomon, M. J. (2016). Associative
and Entanglement Contributions to the Solution Rheology of a Bacterial
136
Polysaccharide. Macromolecules, 49(21), 8313–8321.
https://doi.org/10.1021/acs.macromol.6b01598
Genovese, D. B. (2012). Shear rheology of hard-sphere, dispersed, and aggregated
suspensions, and filler-matrix composites. In Advances in Colloid and Interface
Science. https://doi.org/10.1016/j.cis.2011.12.005
Gentile, L. (2020). Protein–polysaccharide interactions and aggregates in food
formulations. Current Opinion in Colloid & Interface Science, 48, 18–27.
https://doi.org/https://doi.org/10.1016/j.cocis.2020.03.002
Ghosh, P., Mondal, J., Ben-Jacob, E., & Levine, H. (2015). Mechanically-driven
phase separation in a growing bacterial colony. Proceedings of the National
Academy of Sciences, 112(17), E2166.
https://doi.org/10.1073/pnas.1504948112
Gil, E. S., & Hudson, S. M. (2007). Effect of Silk Fibroin Interpenetrating Networks on
Swelling/Deswelling Kinetics and Rheological Properties of Poly(N-
isopropylacrylamide) Hydrogels. Biomacromolecules, 8(1), 258–264.
https://doi.org/10.1021/bm060543m
Gjermansen, M., Nilsson, M., Yang, L., & Tolker-Nielsen, T. (2010). Characterization
of starvation-induced dispersion in Pseudomonas putida biofilms: genetic
elements and molecular mechanisms. Molecular Microbiology, 75(4), 815–826.
https://doi.org/10.1111/j.1365-2958.2009.06793.x
Gloag, E. S., German, G. K., Stoodley, P., & Wozniak, D. J. (2018). Viscoelastic
properties of Pseudomonas aeruginosa variant biofilms. Scientific Reports, 8(1),
9691. https://doi.org/10.1038/s41598-018-28009-5
Gordon, V. D., Davis-Fields, M., Kovach, K., & Rodesney, C. A. (2017). Biofilms and
mechanics: a review of experimental techniques and findings. Journal of Physics
D: Applied Physics, 50(22), 223002. https://doi.org/10.1088/1361-6463/aa6b83
Goudoulas, T. B., & Germann, N. (2016). Viscoelastic properties of polyacrylamide
solutions from creep ringing data. Journal of Rheology, 60(3), 491–502.
https://doi.org/10.1122/1.4945819
137
Grumbein, S., Opitz, M., & Lieleg, O. (2014). Selected metal ions protect Bacillus
subtilis biofilms from erosion. Metallomics, 6(8), 1441–1450.
https://doi.org/10.1039/C4MT00049H
Grumbein, S., Werb, M., Opitz, M., & Lieleg, O. (2016). Elongational rheology of
bacterial biofilms in situ. Journal of Rheology, 60(6), 1085–1094.
https://doi.org/10.1122/1.4958667
Guilhen, C., Charbonnel, N., Parisot, N., Gueguen, N., Iltis, A., Forestier, C., &
Balestrino, D. (2016). Transcriptional profiling of Klebsiella pneumoniae defines
signatures for planktonic, sessile and biofilm-dispersed cells. BMC Genomics,
17(1), 237. https://doi.org/10.1186/s12864-016-2557-x
Gumaelius, L., Magnusson, G., Pettersson, B., & Dalhammar, G. (2001).
Comamonas denitrificans sp. nov., an efficient denitrifying bacterium isolated
from activated sludge. International Journal of Systematic and Evolutionary
Microbiology, 51(3), 999–1006. https://doi.org/doi:10.1099/00207713-51-3-999
Ha, D.-G., & O’Toole, G. A. (2015). c-di-GMP and its Effects on Biofilm Formation
and Dispersion: a Pseudomonas Aeruginosa Review. Microbiology Spectrum,
3(2), 10.1128/microbiolspec.MB-0003-2014–2014.
https://doi.org/10.1128/microbiolspec.MB-0003-2014
Haaber, J., Cohn, M. T., Frees, D., Andersen, T. J., & Ingmer, H. (2012). Planktonic
aggregates of Staphylococcus aureus protect against common antibiotics. PloS
One, 7(7), e41075–e41075. https://doi.org/10.1371/journal.pone.0041075
Hart, J. W., Waigh, T. A., Lu, J. R., & Roberts, I. S. (2019). Microrheology and Spatial
Heterogeneity of Staphylococcus aureus Biofilms Modulated by Hydrodynamic
Shear and Biofilm-Degrading Enzymes. Langmuir, 35(9), 3553–3561.
https://doi.org/10.1021/acs.langmuir.8b04252
Hartmann, R., Singh, P. K., Pearce, P., Mok, R., Song, B., Díaz-Pascual, F., Dunkel,
J., & Drescher, K. (2019). Emergence of three-dimensional order and structure in
growing biofilms. Nature Physics, 15(3), 251–256.
https://doi.org/10.1038/s41567-018-0356-9
Harvey Thomas Banks, S. H. and Z. R. K. (2010). A Brief Review of Elasticity and
Viscoelasticity for Solids. Advances in Applied Mathematics and Mechanics, Vol.
3(No. 1), 1–51.

138
He, Y., Peterson, B. W., Jongsma, M. A., Ren, Y., Sharma, P. K., Busscher, H. J., &
van der Mei, H. C. (2013). Stress relaxation analysis facilitates a quantitative
approach towards antimicrobial penetration into biofilms. PLoS ONE, 8(5),
e63750–e63750. https://doi.org/10.1371/journal.pone.0063750
Heinrich, G., & Klüppel, M. (2002). Recent Advances in the Theory of Filler
Networking in Elastomers. In Filled Elastomers Drug Delivery Systems (pp. 1–
44). Springer Berlin Heidelberg. https://doi.org/10.1007/3-540-45362-8_1
Hellström, L. H. O., Samaha, M. A., Wang, K. M., Smits, A. J., & Hultmark, M. (2014).
Errors in parallel-plate and cone-plate rheometer measurements due to sample
underfill. Measurement Science and Technology, 26(1), 15301.
https://doi.org/10.1088/0957-0233/26/1/015301
Hengge, R. (2009). Principles of c-di-GMP signalling in bacteria. Nature Reviews
Microbiology, 7(4), 263–273. https://doi.org/10.1038/nrmicro2109
Hermes, M., & Clegg, P. S. (2013). Yielding and flow of concentrated Pickering
emulsions. Soft Matter, 9(31), 7568–7575. https://doi.org/10.1039/C3SM50889G
Hobley, L., Harkins, C., MacPhee, C. E., & Stanley-Wall, N. R. (2015). Giving
structure to the biofilm matrix: an overview of individual strategies and emerging
common themes. FEMS Microbiology Reviews, 39(5), 649–669.
https://doi.org/10.1093/femsre/fuv015
Hofer, U. (2018). New diversity in the sulfur cycle. Nature Reviews Microbiology, 16,
260. https://doi.org/10.1038/nrmicro.2018.32
Høiby, N., Bjarnsholt, T., Givskov, M., Molin, S., & Ciofu, O. (2010). Antibiotic
resistance of bacterial biofilms. International Journal of Antimicrobial Agents,
35(4), 322–332. https://doi.org/https://doi.org/10.1016/j.ijantimicag.2009.12.011
Hollenbeck, E. C., Douarche, C., Allain, J.-M., Roger, P., Regeard, C., Cegelski, L.,
Fuller, G. G., & Raspaud, E. (2016). Mechanical Behavior of a Bacillus subtilis
Pellicle. The Journal of Physical Chemistry B, 120(26), 6080–6088.
https://doi.org/10.1021/acs.jpcb.6b02074
Hooper, J. B., & Schweizer, K. S. (2005). Contact Aggregation, Bridging, and Steric
Stabilization in Dense Polymer−Particle Mixtures. Macromolecules, 38(21),
8858–8869. https://doi.org/10.1021/ma051318k
139
Hou, J., Veeregowda, D. H., van de Belt-Gritter, B., Busscher, H. J., & van der Mei,
H. C. (2018). Extracellular Polymeric Matrix Production and Relaxation under
Fluid Shear and Mechanical Pressure in Staphylococcus aureus Biofilms.
Applied and Environmental Microbiology, 84(1), e01516-17.
https://doi.org/10.1128/AEM.01516-17
Houari, A., Picard, J., Habarou, H., Galas, L., Vaudry, H., Heim, V., & di Martino, P.
(2008). Rheology of biofilms formed at the surface of NF membranes in a
drinking water production unit. Biofouling, 24(4), 235–240.
https://doi.org/10.1080/08927010802023764
Howard, M. P., Jadrich, R. B., Lindquist, B. A., Khabaz, F., Bonnecaze, R. T.,
Milliron, D. J., & Truskett, T. M. (2019). Structure and phase behavior of
polymer-linked colloidal gels. The Journal of Chemical Physics, 151(12),
124901. https://doi.org/10.1063/1.5119359
Huang, J., Liu, S., Zhang, C., Wang, X., Pu, J., Ba, F., Xue, S., Ye, H., Zhao, T., Li,
K., Wang, Y., Zhang, J., Wang, L., Fan, C., Lu, T. K., & Zhong, C. (2019).
Programmable and printable Bacillus subtilis biofilms as engineered living
materials. Nature Chemical Biology, 15(1), 34–41.
https://doi.org/10.1038/s41589-018-0169-2
Hubert, K. C., & Ali, M. (2014). An instrument design concept to minimize creep
ringing during step-stress experiments with viscoelastic materials. Applied
Physics Letters, 105(3), 34102. https://doi.org/10.1063/1.4890739
Hudson, R. E., Holder, A. J., Hawkins, K. M., Williams, P. R., & Curtis, D. J. (2017).
An enhanced rheometer inertia correction procedure (ERIC) for the study of
gelling systems using combined motor-transducer rheometers. Physics of Fluids,
29(12), 121602. https://doi.org/10.1063/1.4993308
Hug, L. A., Baker, B. J., Anantharaman, K., Brown, C. T., Probst, A. J., Castelle, C.
J., Butterfield, C. N., Hernsdorf, A. W., Amano, Y., Ise, K., Suzuki, Y., Dudek, N.,
Relman, D. A., Finstad, K. M., Amundson, R., Thomas, B. C., & Banfield, J. F.
(2016). A new view of the tree of life. Nature Microbiology, 1(5), 16048.
https://doi.org/10.1038/nmicrobiol.2016.48
140
Humphries, J., Xiong, L., Liu, J., Prindle, A., Yuan, F., Arjes, H. A., Tsimring, L., &
Suel, G. M. (2017). Species-Independent Attraction to Biofilms through Electrical
Signaling. Cell, 168(1–2), 200-209 e12. https://doi.org/10.1016/j.cell.2016.12.014
Hyun, K., Ahn, K. H., Lee, S. J., Sugimoto, M., & Koyama, K. (2006). Degree of
branching of polypropylene measured from Fourier-transform rheology.
Rheologica Acta, 46(1), 123–129. https://doi.org/10.1007/s00397-006-0098-y
Hyun, K., Baik, E. S., Ahn, K. H., Lee, S. J., Sugimoto, M., & Koyama, K. (2007).
Fourier-transform rheology under medium amplitude oscillatory shear for linear
and branched polymer melts. Journal of Rheology, 51(6), 1319–1342.
https://doi.org/10.1122/1.2790072
Hyun, K., G. Nam, J., Wilhelm, M., H Ahn, K., & J Lee, S. (2003). Nonlinear response
of complex fluids under LAOS (large amplitude oscillatory shear) flow. Korea-
Australia Rheology Journal, 15(2), 97-105. http://hdl.handle.net/11858/00-001M-
0000-000F-6307-F
Hyun, K., Kim, W., Joon Park, S., & Wilhelm, M. (2012). Numerical simulation results
of the nonlinear coefficient Q from FT-Rheology using a single mode pom-pom
model. Journal of Rheology, 57(1), 1–25. https://doi.org/10.1122/1.4754444
Hyun, K., Wilhelm, M., Klein, C. O., Cho, K. S., Nam, J. G., Ahn, K. H., Lee, S. J.,
Ewoldt, R. H., & McKinley, G. H. (2011). A review of nonlinear oscillatory shear
tests: Analysis and application of large amplitude oscillatory shear (LAOS).
Progress in Polymer Science, 36(12), 1697–1753.
https://doi.org/https://doi.org/10.1016/j.progpolymsci.2011.02.002
Ivanov, I. E., Boyd, C. D., Newell, P. D., Schwartz, M. E., Turnbull, L., Johnson, M.
S., Whitchurch, C. B., O’Toole, G. A., & Camesano, T. A. (2012). Atomic force
and super-resolution microscopy support a role for LapA as a cell-surface biofilm
adhesin of Pseudomonas fluorescens. Research in Microbiology.
https://doi.org/10.1016/j.resmic.2012.10.001
Jayathilake, P. G., Gupta, P., Li, B., Madsen, C., Oyebamiji, O., González-Cabaleiro,
R., Rushton, S., Bridgens, B., Swailes, D., Allen, B., McGough, A. S., Zuliani, P.,
Ofiteru, I. D., Wilkinson, D., Chen, J., & Curtis, T. (2017). A mechanistic
Individual-based Model of microbial communities. PLoS ONE, 12(8), e0181965.
https://doi.org/10.1371/journal.pone.0181965
141
Jennings, L. K., Storek, K. M., Ledvina, H. E., Coulon, C., Marmont, L. S.,
Sadovskaya, I., Secor, P. R., Tseng, B. S., Scian, M., Filloux, A., Wozniak, D. J.,
Howell, P. L., & Parsek, M. R. (2015). Pel is a cationic exopolysaccharide that
cross-links extracellular DNA in the Pseudomonas aeruginosa biofilm matrix.
Proceedings of the National Academy of Sciences, 112(36), 11353.
https://doi.org/10.1073/pnas.1503058112
Jia, D., Cheng, H., & Han, C. C. (2018). Interplay between Caging and Bonding in
Binary Concentrated Colloidal Suspensions. Langmuir, 34(9), 3021–3029.
https://doi.org/10.1021/acs.langmuir.7b03965
Jia, D., Hollingsworth, J. v, Zhou, Z., Cheng, H., & Han, C. C. (2015). Coupling of
gelation and glass transition in a biphasic colloidal mixture—from gel-to-
defective gel-to-glass. Soft Matter, 11(45), 8818–8826.
https://doi.org/10.1039/C5SM01531F
Jiang, J., Wu, S., Wang, J., & Feng, Y. (2015). AHL-type quorum sensing and its
regulation on symplasmata formation in Pantoea agglomerans YS19. Journal of
Basic Microbiology, 55(5), 607–616. https://doi.org/10.1002/jobm.201400472
Johnston, M. T., & Ewoldt, R. H. (2013). Precision rheometry: Surface tension effects
on low-torque measurements in rotational rheometers. Journal of Rheology,
57(6), 1515–1532. https://doi.org/10.1122/1.4819914
Jones, W. L., Sutton, M. P., McKittrick, L., & Stewart, P. S. (2011). Chemical and
antimicrobial treatments change the viscoelastic properties of bacterial biofilms.
Biofouling, 27(2), 207–215. https://doi.org/10.1080/08927014.2011.554977
Juntae, K., Dimitri, M., Manfred, W., & Matthew, E. H. (2014). Microstructure and
nonlinear signatures of yielding in a heterogeneous colloidal gel under large
amplitude oscillatory shear. Journal of Rheology, 58(5), 1359–1390.
https://doi.org/10.1122/1.4882019
Kallmeyer, J., Pockalny, R., Adhikari, R. R., Smith, D. C., & D’Hondt, S. (2012).
Global distribution of microbial abundance and biomass in subseafloor sediment.
Proceedings of the National Academy of Sciences, 109(40), 16213–16216.
https://doi.org/10.1073/pnas.1203849109
Kasim, W. A., Gaafar, R. M., Abou-Ali, R. M., Omar, M. N., & Hewait, H. M. (2016).
Effect of biofilm forming plant growth promoting rhizobacteria on salinity
142
tolerance in barley. Annals of Agricultural Sciences, 61(2), 217–227.
https://doi.org/https://doi.org/10.1016/j.aoas.2016.07.003
Kesel, S., Grumbein, S., Gümperlein, I., Tallawi, M., Marel, A.-K., Lieleg, O., & Opitz,
M. (2016). Direct Comparison of Physical Properties of Bacillus subtilis NCIB
3610 and B-1 Biofilms. Applied and Environmental Microbiology, 82(8), 2424–
2432. https://doi.org/10.1128/aem.03957-15
Kevin Kim, M., Drescher, K., Shun Pak, O., Bassler, B. L., & Stone, H. A. (2014).
Filaments in curved streamlines: rapid formation ofStaphylococcus aureusbiofilm
streamers. New Journal of Physics, 16(6), 65024. https://doi.org/10.1088/1367-
2630/16/6/065024
Khandavalli, S., Hendricks, J., Clasen, C., & Rothstein, J. P. (2016). A comparison of
linear and branched wormlike micelles using large amplitude oscillatory shear
and orthogonal superposition rheology. Journal of Rheology, 60(6), 1331–1346.
https://doi.org/10.1122/1.4965435
Kim, J., Merger, D., Wilhelm, M., & Helgeson, M. E. (2014). Microstructure and
nonlinear signatures of yielding in a heterogeneous colloidal gel under large
amplitude oscillatory shear. Journal of Rheology, 58(5), 1359–1390.
https://doi.org/10.1122/1.4882019
Kives, J., Orgaz, B., & SanJosé, C. (2006). Polysaccharide differences between
planktonic and biofilm-associated EPS from Pseudomonas fluorescens B52.
Colloids and Surfaces B: Biointerfaces.
https://doi.org/10.1016/j.colsurfb.2006.04.018
Klemuk, S. A., & Titze, I. R. (2009). Determining motor inertia of a stress-controlled
rheometer. Journal of Rheology, 53(4), 765–780.
https://doi.org/10.1122/1.3119056
Klotz, M., Kretschmer, M., Goetz, A., Ezendam, S., Lieleg, O., & Opitz, M. (2019).
Importance of the biofilm matrix for the erosion stability of Bacillus subtilis NCIB
3610 biofilms. RSC Advances, 9(20), 11521–11529.
https://doi.org/10.1039/C9RA01955C
Kobayashi, K., & Iwano, M. (2012). BslA(YuaB) forms a hydrophobic layer on the
surface of Bacillus subtilis biofilms. Molecular Microbiology, 85(1), 51–66.
https://doi.org/10.1111/j.1365-2958.2012.08094.x
143
Komatsu, H., Mitsui, T., & Onogi, S. (1973). Nonlinear Viscoelastic Properties of
Semisolid Emulsions. Transactions of the Society of Rheology, 17(2), 351–364.
https://doi.org/10.1122/1.549285
Körstgens, V., Flemming, H.-C., Wingender, J., & Borchard, W. (2001). Uniaxial
compression measurement device for investigation of the mechanical stability of
biofilms. Journal of Microbiological Methods, 46(1), 9–17.
https://doi.org/https://doi.org/10.1016/S0167-7012(01)00248-2
Koumakis, N., Pamvouxoglou, A., Poulos, A. S., & Petekidis, G. (2012). Direct
comparison of the rheology of model hard and soft particle glasses. Soft Matter,
8(15), 4271–4284. https://doi.org/10.1039/C2SM07113D
Koumakis, N., & Petekidis, G. (2011). Two step yielding in attractive colloids:
transition from gels to attractive glasses. Soft Matter, 7(6), 2456–2470.
https://doi.org/10.1039/C0SM00957A
Kovach, K., Davis-Fields, M., Irie, Y., Jain, K., Doorwar, S., Vuong, K., Dhamani, N.,
Mohanty, K., Touhami, A., & Gordon, V. D. (2017). Evolutionary adaptations of
biofilms infecting cystic fibrosis lungs promote mechanical toughness by
adjusting polysaccharide production. Npj Biofilms And Microbiomes, 3(1), 1.
https://doi.org/10.1038/s41522-016-0007-9
Kramb, R. C., & Zukoski, C. F. (2011). Exploration of the volume fraction above
which suspensions of spherical and weakly anisotropic colloid particles cannot
flow. Journal of Rheology, 55(5), 1085–1101. https://doi.org/10.1122/1.3613983
Kretschmer, M., & Lieleg, O. (2020a). Chelate chemistry governs ion-specific
stiffening of Bacillus subtilis B-1 and Azotobacter vinelandii biofilms. Biomaterials
Science. https://doi.org/10.1039/C9BM01763A
Kretschmer, M., & Lieleg, O. (2020b). Chelate chemistry governs ion-specific
stiffening of Bacillus subtilis B-1 and Azotobacter vinelandii biofilms. Biomaterials
Science. https://doi.org/10.1039/C9BM01763A
Kuang, J., Yuk, K. Y., & Huh, K. M. (2011). Polysaccharide-based superporous
hydrogels with fast swelling and superabsorbent properties. Carbohydrate
Polymers, 83(1), 284–290.
https://doi.org/https://doi.org/10.1016/j.carbpol.2010.07.052
144
Kuczera, S., Gentile, L., Brox, T. I., Olsson, U., Schmidt, C., & Galvosas, P. (2018).
Multilamellar Vesicle Formation Probed by Rheo-NMR and Rheo-SALS under
Large Amplitude Oscillatory Shear. Langmuir, 34(28), 8314–8325.
https://doi.org/10.1021/acs.langmuir.8b01510
Kundukad, B., Schussman, M., Yang, K., Seviour, T., Yang, L., Rice, S. A.,
Kjelleberg, S., & Doyle, P. S. (2017). Mechanistic action of weak acid drugs on
biofilms. Scientific Reports, 7(1), 4783. https://doi.org/10.1038/s41598-017-
05178-3
Kundukad, B., Seviour, T., Liang, Y., Rice, S. A., Kjelleberg, S., & Doyle, P. S.
(2016). Mechanical properties of the superficial biofilm layer determine the
architecture of biofilms. Soft Matter, 12(26), 5718–5726.
https://doi.org/10.1039/C6SM00687F
Kuypers, M. M. M., Marchant, H. K., & Kartal, B. (2018). The microbial nitrogen-
cycling network. Nature Reviews Microbiology, 16(5), 263–276.
https://doi.org/10.1038/nrmicro.2018.9
Kwang Soo, C., Kyu, H., Kyung Hyun, A., & Seung Jong, L. (2005). A geometrical
interpretation of large amplitude oscillatory shear response. Journal of Rheology,
49(3), 747–758. https://doi.org/10.1122/1.1895801
Kyrylyuk, A. v, Wouterse, A., & Philipse, A. P. (2009). Random Packings Of Rod‐
Sphere Mixtures Simulated By Mechanical Contraction. AIP Conference
Proceedings, 1145(1), 211–214. https://doi.org/10.1063/1.3179895
Lau, P. C. Y., Dutcher, J. R., Beveridge, T. J., & Lam, J. S. (2009). Absolute
quantitation of bacterial biofilm adhesion and viscoelasticity by microbead force
spectroscopy. Biophysical Journal, 96(7), 2935–2948.
https://doi.org/10.1016/j.bpj.2008.12.3943
Läuger, J., & Stettin, H. (2016). Effects of instrument and fluid inertia in oscillatory
shear in rotational rheometers. Journal of Rheology, 60(3), 393–406.
https://doi.org/10.1122/1.4944512
Laurati, M., Egelhaaf, S. U., & Petekidis, G. (2011). Nonlinear rheology of colloidal
gels with intermediate volume fraction. Journal of Rheology, 55(3), 673–706.
https://doi.org/10.1122/1.3571554
145
Lee, C. K., de Anda, J., Baker, A. E., Bennett, R. R., Luo, Y., Lee, E. Y., Keefe, J. A.,
Helali, J. S., Ma, J., Zhao, K., Golestanian, R., O’Toole, G. A., & Wong, G. C. L.
(2018). Multigenerational memory and adaptive adhesion in early bacterial
biofilm communities. Proc Natl Acad Sci U S A, 115(17), 4471–4476.
https://doi.org/10.1073/pnas.1720071115
Lee, C.-W., & Rogers, S. A. (2017). A sequence of physical processes quantified in
LAOS by continuous local measures. Korea-Australia Rheology Journal, 29(4),
269–279. https://doi.org/10.1007/s13367-017-0027-x
Lee, K. Y., & Mooney, D. J. (2012). Alginate: properties and biomedical applications.
Progress in Polymer Science, 37(1), 106–126.
https://doi.org/10.1016/j.progpolymsci.2011.06.003
Lei, K., Li, Z., Zhu, D., Sun, C., Sun, Y., Yang, C., Zheng, Z., & Wang, X. (2020).
Polysaccharide-based recoverable double-network hydrogel with high strength
and self-healing properties. Journal of Materials Chemistry B, 8(4), 794–802.
https://doi.org/10.1039/C9TB01679A
Lieleg, O., Caldara, M., Baumgärtel, R., & Ribbeck, K. (2011). Mechanical robustness
of Pseudomonas aeruginosa biofilms. Soft Matter, 7(7), 3307–3314.
https://doi.org/10.1039/c0sm01467b
Likos, C. N. (2001). Effective interactions in soft condensed matter physics. Physics
Reports, 348(4), 267–439. https://doi.org/https://doi.org/10.1016/S0370-
1573(00)00141-1
Linnes, J. C., Ma, H., & Bryers, J. D. (2013). Giant Extracellular Matrix Binding
Protein Expression in Staphylococcus epidermidis is Regulated by Biofilm
Formation and Osmotic Pressure. Current Microbiology, 66(6), 627–633.
https://doi.org/10.1007/s00284-013-0316-7
Lushi, E., Wioland, H., & Goldstein, R. E. (2014). Fluid flows created by swimming
bacteria drive self-organization in confined suspensions. Proceedings of the
National Academy of Sciences, 111(27), 9733.
https://doi.org/10.1073/pnas.1405698111
Maddah, H., & Chogle, A. (2017). Biofouling in reverse osmosis: phenomena,
monitoring, controlling and remediation. Applied Water Science, 7(6), 2637–
2651. https://doi.org/10.1007/s13201-016-0493-1
146
Madsen, J. S., Burmølle, M., Hansen, L. H., & Sørensen, S. J. (2012). The
interconnection between biofilm formation and horizontal gene transfer. FEMS
Immunology & Medical Microbiology, 65(2), 183–195.
https://doi.org/10.1111/j.1574-695X.2012.00960.x
Magami, S. M., & Williams, R. L. (2019). Gelation via cationic chelation/crosslinking
of acrylic-acid-based polymers. Polymer International, 68(12), 1980–1991.
https://doi.org/10.1002/pi.5910
Mallick, I., Bhattacharyya, C., Mukherji, S., Dey, D., Sarkar, S. C., Mukhopadhyay, U.
K., & Ghosh, A. (2018). Effective rhizoinoculation and biofilm formation by
arsenic immobilizing halophilic plant growth promoting bacteria (PGPB) isolated
from mangrove rhizosphere: A step towards arsenic rhizoremediation. Science of
The Total Environment, 610–611, 1239–1250.
https://doi.org/https://doi.org/10.1016/j.scitotenv.2017.07.234
Marenduzzo, D., Finan, K., & Cook, P. R. (2006). The depletion attraction: an
underappreciated force driving cellular organization. Journal of Cell Biology,
175(5), 681–686. https://doi.org/10.1083/jcb.200609066
Marshall, D. C., Arruda, B. E., & Silby, M. W. (2019). Alginate genes are required for
optimal soil colonization and persistence by Pseudomonas fluorescens Pf0-1.
Access Microbiology, 1(3), e000021. https://doi.org/10.1099/acmi.0.000021
Martinez-Corral, R., Liu, J., Süel, G. M., & Garcia-Ojalvo, J. (2018). Bistable
emergence of oscillations in growing <em>Bacillus subtilis</em>
biofilms. Proceedings of the National Academy of Sciences, 115(36), E8333.
https://doi.org/10.1073/pnas.1805004115
Massalha, H., Korenblum, E., Malitsky, S., Shapiro, O. H., & Aharoni, A. (2017). Live
imaging of root–bacteria interactions in a microfluidics setup. Proceedings of the
National Academy of Sciences, 114(17), 4549–4554.
https://doi.org/10.1073/pnas.1618584114
Mathias, J. D., & Stoodley, P. (2009). Applying the digital image correlation method
to estimate the mechanical properties of bacterial biofilms subjected to a wall
shear stress. Biofouling, 25(8), 695–703.
https://doi.org/10.1080/08927010903104984
147
Mccoy, J. L., & Muthukumar, M. (2010). Dynamic light scattering studies of ionic and
nonionic polymer gels with continuous and discontinuous volume transitions.
Journal of Polymer Science Part B: Polymer Physics, 48(21), 2193–2206.
https://doi.org/10.1002/polb.22101
McKinley, R. H. E. and G. H. (2007). Creep Ringing in Rheometry or How to Deal
with Oft-discarded Data in Step Stress Tests! Rheology Bulletin, 76(1) 4-6.
Meakin, P., & Djordjevic, Z. B. (1986). Cluster-cluster aggregation in two-monomer
systems. Journal of Physics A: Mathematical and General, 19(11), 2137–2153.
https://doi.org/10.1088/0305-4470/19/11/023
Meera, A. P., Said, S., Grohens, Y., & Thomas, S. (2009). Nonlinear Viscoelastic
Behavior of Silica-Filled Natural Rubber Nanocomposites. The Journal of
Physical Chemistry C, 113(42), 17997–18002. https://doi.org/10.1021/jp9020118
Mendoza, L., Batchelor, W., Tabor, R. F., & Garnier, G. (2018). Gelation mechanism
of cellulose nanofibre gels: A colloids and interfacial perspective. Journal of
Colloid and Interface Science, 509, 39–46.
https://doi.org/https://doi.org/10.1016/j.jcis.2017.08.101
Miller, M. B., Skorupski, K., Lenz, D. H., Taylor, R. K., & Bassler, B. L. (2002).
Parallel Quorum Sensing Systems Converge to Regulate Virulence in Vibrio
cholerae. Cell, 110(3), 303–314. https://doi.org/https://doi.org/10.1016/S0092-
8674(02)00829-2
Minogue, T. D., Trebra, M. W., Bernhard, F., & Bodman, S. B. von. (2002). The
autoregulatory role of EsaR, a quorum-sensing regulator in Pantoea stewartii
ssp. stewartii: evidence for a repressor function. Molecular Microbiology, 44(6),
1625–1635. https://doi.org/10.1046/j.1365-2958.2002.02987.x
Mitrofanova, O., Mardanova, A., Evtugyn, V., Bogomolnaya, L., & Sharipova, M.
(2017). Effects of Bacillus Serine Proteases on the Bacterial Biofilms. BioMed
Research International, 2017, 8525912. https://doi.org/10.1155/2017/8525912
Miwa, Y., Kurachi, J., Kohbara, Y., & Kutsumizu, S. (2018). Dynamic ionic crosslinks
enable high strength and ultrastretchability in a single elastomer.
Communications Chemistry, 1(1), 5. https://doi.org/10.1038/s42004-017-0004-9
148
Molina-Santiago, C., Pearson, J. R., Navarro, Y., Berlanga-Clavero, M. V., Caraballo-
Rodriguez, A. M., Petras, D., García-Martín, M. L., Lamon, G., Haberstein, B.,
Cazorla, F. M., de Vicente, A., Loquet, A., Dorrestein, P. C., & Romero, D.
(2019). The extracellular matrix protects Bacillus subtilis colonies from
Pseudomonas invasion and modulates plant co-colonization. Nature
Communications, 10(1), 1919. https://doi.org/10.1038/s41467-019-09944-x
Mosier, A. P., Kaloyeros, A. E., & Cady, N. C. (2012). A novel microfluidic device for
the in situ optical and mechanical analysis of bacterial biofilms. Journal of
Microbiological Methods, 91(1), 198–204.
https://doi.org/http://dx.doi.org/10.1016/j.mimet.2012.07.006
Myung, D., Waters, D., Wiseman, M., Duhamel, P.-E., Noolandi, J., Ta, C. N., &
Frank, C. W. (2008). Progress in the development of interpenetrating polymer
network hydrogels. Polymers for Advanced Technologies, 19(6), 647–657.
https://doi.org/10.1002/pat.1134
Nadell, C. D., Drescher, K., & Foster, K. R. (2016). Spatial structure, cooperation and
competition in biofilms. Nature Reviews Microbiology, 14(9), 589–600.
https://doi.org/10.1038/nrmicro.2016.84
Ni, L., Yang, S., Zhang, R., Jin, Z., Chen, H., Conrad, J. C., & Jin, F. (2016). Bacteria
differently deploy type-IV pili on surfaces to adapt to nutrient availability. Npj
Biofilms And Microbiomes, 2, 15029. https://doi.org/10.1038/npjbiofilms.2015.29
https://www.nature.com/articles/npjbiofilms201529#supplementary-information
Nimtz, M., Mort, A., Domke, T., Wray, V., Zhang, Y., Qui, F., Coplin, D., & Geider, K.
(1996). Structure of amylovoran, the capsular exopolysaccharide from the fire
blight pathogen Erwinia amylovora. Carbohydrate Research.
https://doi.org/10.1016/0008-6215(96)00070-5
Orazi, G., & O’Toole, G. A. (2017). Pseudomonas aeruginosa Alters Staphylococcus
aureus Sensitivity to Vancomycin in a Biofilm Model of Cystic Fibrosis Infection.
MBio, 8(4), e00873-17. https://doi.org/10.1128/mBio.00873-17
Otto, K., & Silhavy, T. J. (2002). Surface Sensing and Adhesion of Escherichia coli
Controlled by the Cpx-Signaling Pathway. Proceedings of the National Academy
of Sciences of the United States of America, 99(4), 2287–2292.
http://www.jstor.org/stable/3057957
149
Ozkan, S., Gillece, T. W., Senak, L., & Moore, D. J. (2012). Characterization of yield
stress and slip behaviour of skin/hair care gels using steady flow and LAOS
measurements and their correlation with sensorial attributes. International
Journal of Cosmetic Science, 34(2), 193–201. https://doi.org/10.1111/j.1468-
2494.2012.00702.x
Pakkulnan, R., Anutrakunchai, C., Kanthawong, S., Taweechaisupapong, S.,
Chareonsudjai, P., & Chareonsudjai, S. (2019). Extracellular DNA facilitates
bacterial adhesion during Burkholderia pseudomallei biofilm formation. PLoS
ONE, 14(3), e0213288. https://doi.org/10.1371/journal.pone.0213288
Paquet-Mercier, F., Parvinzadeh Gashti, M., Bellavance, J., Taghavi, S. M., &
Greener, J. (2016). Effect of NaCl on Pseudomonas biofilm viscosity by
continuous, non-intrusive microfluidic-based approach. ArXiv E-Prints.
Park, A., Jeong, H.-H., Lee, J., Kim, K. P., & Lee, C.-S. (2011). Effect of shear stress
on the formation of bacterial biofilm in a microfluidic channel. BioChip Journal,
5(3), 236. https://doi.org/10.1007/s13206-011-5307-9
Park, J. D., Ahn, K. H., & Wagner, N. J. (2016). Structure-rheology relationship for a
homogeneous colloidal gel under shear startup. Journal of Rheology, 61(1),
117–137. https://doi.org/10.1122/1.4971993
Parmar, A. S., Hill, S., Vidyasagar, A., Bello, C., Toomey, R., & Muschol, M. (2013).
Frequency and temperature dependence of poly(N-isopropylacrylamide) gel
rheology. Journal of Applied Polymer Science, 127(3), 1527–1537.
https://doi.org/10.1002/app.37561
Passos da Silva, D., Matwichuk, M. L., Townsend, D. O., Reichhardt, C., Lamba, D.,
Wozniak, D. J., & Parsek, M. R. (2019). The Pseudomonas aeruginosa lectin
LecB binds to the exopolysaccharide Psl and stabilizes the biofilm matrix. Nature
Communications, 10(1), 2183. https://doi.org/10.1038/s41467-019-10201-4
Paul Stoodley, John D. Boyle, Z. L., & Lappin-Scott, H. M. (1999). Structural
Deformation of Bacterial Biofilms Caused by Short-Term Fluctuations in Fluid
Shear: An In Situ Investigation of Biofilm Rheology. Biotechnology and
Bioengineering, 65, 83–92. https://doi.org/10.1002/(SICI)1097-
0290(19991005)65:1<83::AID-BIT10>3.0.CO;2-B
150
Pavlovsky, L., Sturtevant, R. A., Younger, J. G., & Solomon, M. J. (2015). Effects of
Temperature on the Morphological, Polymeric, and Mechanical Properties of
Staphylococcus epidermidis Bacterial Biofilms. Langmuir, 31(6), 2036–2042.
https://doi.org/10.1021/la5044156
Pavlovsky, L., Younger, J. G., & Solomon, M. J. (2013). In situ rheology of
Staphylococcus epidermidis bacterial biofilms. Soft Matter, 9(1), 122–131.
https://doi.org/10.1039/C2SM27005F
Pearson, D. S., & Rochefort, W. E. (1982). Behavior of concentrated polystyrene
solutions in large-amplitude oscillating shear fields. Journal of Polymer Science:
Polymer Physics Edition, 20(1), 83–98.
https://doi.org/10.1002/pol.1982.180200107
Perera-Costa, D., Bruque, J. M., González-Martín, M. L., Gómez-García, A. C., &
Vadillo-Rodríguez, V. (2014). Studying the Influence of Surface Topography on
Bacterial Adhesion using Spatially Organized Microtopographic Surface
Patterns. Langmuir, 30(16), 4633–4641. https://doi.org/10.1021/la5001057
Perge, C., Taberlet, N., Gibaud, T., & Manneville, S. (2014). Time dependence in
large amplitude oscillatory shear: A rheo-ultrasonic study of fatigue dynamics in
a colloidal gel. Journal of Rheology, 58(5), 1331–1357.
https://doi.org/10.1122/1.4887081
Peterson, B. W., van der Mei, H. C., Sjollema, J., Busscher, H. J., & Sharma, P. K.
(2013). A Distinguishable Role of eDNA in the Viscoelastic Relaxation of
Biofilms. MBio, 4(5). https://doi.org/10.1128/mBio.00497-13
Pham, K. N., Petekidis, G., Vlassopoulos, D., Egelhaaf, S. U., Pusey, P. N., & Poon,
W. C. K. (2006). Yielding of colloidal glasses. Europhysics Letters (EPL), 75(4),
624–630. https://doi.org/10.1209/epl/i2006-10156-y
Philippe, A. M., Baravian, C., Bezuglyy, V., Angilella, J. R., Meneau, F., Bihannic, I.,
& Michot, L. J. (2013). Rheological Study of Two-Dimensional Very Anisometric
Colloidal Particle Suspensions: From Shear-Induced Orientation to Viscous
Dissipation. Langmuir, 29(17), 5315–5324. https://doi.org/10.1021/la400111w
Philippoff, W. (1966). Vibrational Measurements with Large Amplitudes. Transactions
of the Society of Rheology, 10(1), 317–334. https://doi.org/10.1122/1.549049
151
Picioreanu, C., Blauert, F., Horn, H., & Wagner, M. (2018). Determination of
mechanical properties of biofilms by modelling the deformation measured using
optical coherence tomography. Water Research, 145, 588–598.
https://doi.org/https://doi.org/10.1016/j.watres.2018.08.070
Piessens, V., de Vliegher, S., Verbist, B., Braem, G., van Nuffel, A., de Vuyst, L.,
Heyndrickx, M., & van Coillie, E. (2012). Intra-species diversity and epidemiology
varies among coagulase-negative Staphylococcus species causing bovine
intramammary infections. Veterinary Microbiology, 155(1), 62–71.
https://doi.org/https://doi.org/10.1016/j.vetmic.2011.08.005
Potocki de Montalk, G., Remaud-Simeon, M., Willemot, R.-M., Sarçabal, P.,
Planchot, V., & Monsan, P. (2000). Amylosucrase from Neisseria polysaccharea:
novel catalytic properties. FEBS Letters, 471(2–3), 219–223.
https://doi.org/10.1016/S0014-5793(00)01406-X
Poulos, A. S., Stellbrink, J., & Petekidis, G. (2013). Flow of concentrated solutions of
starlike micelles under large-amplitude oscillatory shear. Rheologica Acta, 52(8),
785–800. https://doi.org/10.1007/s00397-013-0703-9
Powell, L. C., Sowedan, A., Khan, S., Wright, C. J., Hawkins, K., Onsøyen, E.,
Myrvold, R., Hill, K. E., & Thomas, D. W. (2013). The effect of alginate
oligosaccharides on the mechanical properties of Gram-negative biofilms.
Biofouling, 29(4), 413–421. https://doi.org/10.1080/08927014.2013.777954
Raghavan, S. R., & Douglas, J. F. (2012). The conundrum of gel formation by
molecular nanofibers, wormlike micelles, and filamentous proteins: gelation
without cross-links? Soft Matter, 8(33), 8539–8546.
https://doi.org/10.1039/C2SM25107H
Randy, H. E., Hosoi, A. E., & Gareth, H. M. (2008). New measures for characterizing
nonlinear viscoelasticity in large amplitude oscillatory shear. Journal of
Rheology, 52(6), 1427–1458. https://doi.org/10.1122/1.2970095
Reichhardt, C., Wong, C., Passos da Silva, D., Wozniak, D. J., & Parsek, M. R.
(2018). CdrA Interactions within the Pseudomonas aeruginosa Biofilm Matrix
Safeguard It from Proteolysis and Promote Cellular Packing. MBio, 9(5), e01376-
18. https://doi.org/10.1128/mBio.01376-18
152
Riou, J. Y., Guibourdenche, M., & Popoff, M. Y. (1983). A new taxon in the genus
Neisseria. Annales de l’Institut Pasteur / Microbiologie, 134(2, Supplement B),
257–267. https://doi.org/https://doi.org/10.1016/S0769-2609(83)80038-6
Riou, J.-Y., Guibourdenche, M., Perry, M. B., MacLan, L. L., & Griffith, D. W. (1986).
Structure of the exocellular D-glucan produced by Neisseria polysaccharea.
Canadian Journal of Microbiology, 32(12), 909–911.
https://doi.org/10.1139/m86-167
Rmaile, A., Carugo, D., Capretto, L., Zhang, X., Wharton, J. A., Thurner, P. J.,
Aspiras, M., Ward, M., & Stoodley, P. (2013). Microbial tribology and disruption
of dental plaque bacterial biofilms. Wear, 306(1), 276–284.
https://doi.org/https://doi.org/10.1016/j.wear.2013.02.010
Rochex, A., Massé, A., Escudié, R., Godon, J.-J., & Bernet, N. (2009). Influence of
abrasion on biofilm detachment: evidence for stratification of the biofilm. Journal
of Industrial Microbiology & Biotechnology, 36(3), 467–470.
https://doi.org/10.1007/s10295-009-0543-x
Rogers, S. A. (2017). In search of physical meaning: defining transient parameters
for nonlinear viscoelasticity. Rheologica Acta, 56(5), 501–525.
https://doi.org/10.1007/s00397-017-1008-1
Rogers, S. A., Erwin, B. M., Vlassopoulos, D., & Cloitre, M. (2011). A sequence of
physical processes determined and quantified in LAOS: Application to a yield
stress fluid. Journal of Rheology, 55(2), 435–458.
https://doi.org/10.1122/1.3544591
Rogers, S. A., & Lettinga, M. P. (2011). A sequence of physical processes
determined and quantified in large-amplitude oscillatory shear (LAOS):
Application to theoretical nonlinear models. Journal of Rheology, 56(1), 1–25.
https://doi.org/10.1122/1.3662962
Rogers, S. S., van der Walle, C., & Waigh, T. A. (2008). Microrheology of Bacterial
Biofilms In Vitro: Staphylococcus aureus and Pseudomonas aeruginosa.
Langmuir, 24(23), 13549–13555. https://doi.org/10.1021/la802442d
Rohde, H., Burdelski, C., Bartscht, K., Hussain, M., Buck, F., Horstkotte, M. A.,
Knobloch, J. K.-M., Heilmann, C., Herrmann, M., & Mack, D. (2005). Induction of
Staphylococcus epidermidis biofilm formation via proteolytic processing of the
153
accumulation-associated protein by staphylococcal and host proteases.
Molecular Microbiology, 55(6), 1883–1895. https://doi.org/10.1111/j.1365-
2958.2005.04515.x
Roth, M. (2012). Rheology of arrested colloids: a parameter study using novel
experimental methods. http://ubm.opus.hbz-
nrw.de/volltexte/2012/3009/pdf/doc.pdf.
Rozenbaum, R. T., van der Mei, H. C., Woudstra, W., de Jong, E. D., Busscher, H.
J., & Sharma, P. K. (2019). Role of Viscoelasticity in Bacterial Killing by
Antimicrobials in Differently Grown Pseudomonas aeruginosa Biofilms.
Antimicrobial Agents and Chemotherapy, 63(4), e01972-18.
https://doi.org/10.1128/AAC.01972-18
Rühs, P A, Böcker, L., Inglis, R. F., & Fischer, P. (2014). Studying bacterial
hydrophobicity and biofilm formation at liquid–liquid interfaces through interfacial
rheology and pendant drop tensiometry. Colloids and Surfaces B: Biointerfaces,
117, 174–184. https://doi.org/https://doi.org/10.1016/j.colsurfb.2014.02.023
Rühs, Patrick A, Böni, L., Fuller, G. G., Inglis, R. F., & Fischer, P. (2013). In-Situ
Quantification of the Interfacial Rheological Response of Bacterial Biofilms to
Environmental Stimuli. PLoS ONE, 8(11), e78524.
https://doi.org/10.1371/journal.pone.0078524
Rupp, C. J., Fux, C. A., & Stoodley, P. (2005). Viscoelasticity of Staphylococcus
aureus Biofilms in Response to Fluid Shear Allows Resistance to Detachment
and Facilitates Rolling Migration. Applied and Environmental Microbiology, 71(4),
2175–2178. https://doi.org/10.1128/aem.71.4.2175-2178.2005
Rusconi, R., Lecuyer, S., Autrusson, N., Guglielmini, L., & Stone, H. A. (2011).
Secondary Flow as a Mechanism for the Formation of Biofilm Streamers.
Biophysical Journal, 100(6), 1392–1399.
https://doi.org/https://doi.org/10.1016/j.bpj.2011.01.065
Rutherford, S. T., & Bassler, B. L. (2012). Bacterial quorum sensing: its role in
virulence and possibilities for its control. Cold Spring Harbor Perspectives in
Medicine, 2(11), a012427. https://doi.org/10.1101/cshperspect.a012427
154
Safari, A., Habimana, O., Allen, A., & Casey, E. (2014). The significance of calcium
ions on Pseudomonas fluorescens biofilms – a structural and mechanical study.
Biofouling, 30(7), 859–869. https://doi.org/10.1080/08927014.2014.938648
Safari, A., Tukovic, Z., Cardiff, P., Walter, M., Casey, E., & Ivankovic, A. (2016).
Interfacial separation of a mature biofilm from a glass surface – A combined
experimental and cohesive zone modelling approach. Journal of the Mechanical
Behavior of Biomedical Materials, 54, 205–218.
https://doi.org/http://dx.doi.org/10.1016/j.jmbbm.2015.09.013
Sagle, L. B., Zhang, Y., Litosh, V. A., Chen, X., Cho, Y., & Cremer, P. S. (2009).
Investigating the Hydrogen-Bonding Model of Urea Denaturation. Journal of the
American Chemical Society, 131(26), 9304–9310.
https://doi.org/10.1021/ja9016057
Sanchez, T., Chen, D. T. N., DeCamp, S. J., Heymann, M., & Dogic, Z. (2012).
Spontaneous motion in hierarchically assembled active matter. Nature,
491(7424), 431–434. https://doi.org/10.1038/nature11591
Sasse, J., Martinoia, E., & Northen, T. (2018). Feed Your Friends: Do Plant Exudates
Shape the Root Microbiome? Trends in Plant Science, 23(1), 25–41.
https://doi.org/https://doi.org/10.1016/j.tplants.2017.09.003
Sauer, K., Cullen, M. C., Rickard, A. H., Zeef, L. A. H., Davies, D. G., & Gilbert, P.
(2004). Characterization of nutrient-induced dispersion in Pseudomonas
aeruginosa PAO1 biofilm. Journal of Bacteriology, 186(21), 7312–7326.
https://doi.org/10.1128/JB.186.21.7312-7326.2004
Schaffner, M., Rühs, P. A., Coulter, F., Kilcher, S., & Studart, A. R. (2017). 3D
printing of bacteria into functional complex materials. Science Advances, 3(12),
eaao6804. https://doi.org/10.1126/sciadv.aao6804
Schiffer, C., Hilgarth, M., Ehrmann, M., & Vogel, R. F. (2019). Bap and Cell Surface
Hydrophobicity Are Important Factors in Staphylococcus xylosus Biofilm
Formation. Frontiers in Microbiology, 10(1387).
https://doi.org/10.3389/fmicb.2019.01387
Schollmeyer, M., Langlotz, C., Huber, A., Coplin, D. L., & Geider, K. (2012).
Variations in the molecular masses of the capsular exopolysaccharides
155
amylovoran, pyrifolan and stewartan. International Journal of Biological
Macromolecules. https://doi.org/10.1016/j.ijbiomac.2012.01.003
Schommer, N. N., Christner, M., Hentschke, M., Ruckdeschel, K., Aepfelbacher, M.,
& Rohde, H. (2011). Staphylococcus epidermidis uses distinct mechanisms of
biofilm formation to interfere with phagocytosis and activation of mouse
macrophage-like cells 774A.1. Infection and Immunity, 79(6), 2267–2276.
https://doi.org/10.1128/IAI.01142-10
Schrag, J. L. (1977). Deviation of Velocity Gradient Profiles from the “Gap Loading”
and “Surface Loading” Limits in Dynamic Simple Shear Experiments.
Transactions of the Society of Rheology, 21(3), 399–413.
https://doi.org/10.1122/1.549445
Schultz, M. P., Bendick, J. A., Holm, E. R., & Hertel, W. M. (2011). Economic impact
of biofouling on a naval surface ship. Biofouling, 27(1), 87–98.
https://doi.org/10.1080/08927014.2010.542809
Schwartz, K., Ganesan, M., Payne, D. E., Solomon, M. J., & Boles, B. R. (2016).
Extracellular DNA facilitates the formation of functional amyloids in
Staphylococcus aureus biofilms. Molecular Microbiology, 99(1), 123–134.
https://doi.org/10.1111/mmi.13219
Secor, P. R., Sweere, J. M., Michaels, L. A., Malkovskiy, A. V., Lazzareschi, D.,
Katznelson, E., Rajadas, J., Birnbaum, M. E., Arrigoni, A., Braun, K. R., Evanko,
S. P., Stevens, D. A., Kaminsky, W., Singh, P. K., Parks, W. C., & Bollyky, P. L.
(2015). Filamentous Bacteriophage Promote Biofilm Assembly and Function.
Cell Host & Microbe, 18(5), 549–559.
https://doi.org/https://doi.org/10.1016/j.chom.2015.10.013
Serra, D. O., Richter, A. M., & Hengge, R. (2013). Cellulose as an Architectural
Element in Spatially Structured Escherichia coli Biofilms. Journal of Bacteriology,
195(24), 5540. https://doi.org/10.1128/JB.00946-13
Shao, Z., Negi, A. S., & Osuji, C. O. (2013). Role of interparticle attraction in the
yielding response of microgel suspensions. Soft Matter, 9(22), 5492–5500.
https://doi.org/10.1039/C3SM50209K
156
Shen, Yi, Siryaporn, A., Lecuyer, S., Gitai, Z., & Stone, H. A. (2012). Flow directs
surface-attached bacteria to twitch upstream. Biophysical Journal, 103(1), 146–
151. https://doi.org/10.1016/j.bpj.2012.05.045
Shen, Yun, Huang, C., Monroy, G. L., Janjaroen, D., Derlon, N., Lin, J., Espinosa-
Marzal, R., Morgenroth, E., Boppart, S. A., Ashbolt, N. J., Liu, W.-T., & Nguyen,
T. H. (2016). Response of Simulated Drinking Water Biofilm Mechanical and
Structural Properties to Long-Term Disinfectant Exposure. Environmental
Science & Technology, 50(4), 1779–1787.
https://doi.org/10.1021/acs.est.5b04653
Sherman, E., Bayles, K., Moormeier, D., Endres, J., & Wei, T. (2019). Observations
of Shear Stress Effects on Staphylococcus aureus Biofilm Formation. MSphere,
4(4), e00372-19. https://doi.org/10.1128/mSphere.00372-19
Shukla, A., Arnipally, S., Dagaonkar, M., & Joshi, Y. M. (2015). Two-step yielding in
surfactant suspension pastes. Rheologica Acta, 54(5), 353–364.
https://doi.org/10.1007/s00397-015-0845-z
Smith, W. P. J., Davit, Y., Osborne, J. M., Kim, W., Foster, K. R., & Pitt-Francis, J. M.
(2017). Cell morphology drives spatial patterning in microbial communities.
Proceedings of the National Academy of Sciences, 114(3), E280.
https://doi.org/10.1073/pnas.1613007114
Smith-Palmer, T., Lin, S., Oguejiofor, I., Leng, T., Pustam, A., Yang, J., Graham, L.
L., Wyeth, R. C., Bishop, C. D., DeMont, M. E., & Pink, D. (2016). In Situ
Confocal Raman Microscopy of Hydrated Early Stages of Bacterial Biofilm
Formation on Various Surfaces in a Flow Cell. Applied Spectroscopy, 70(2),
289–301. https://doi.org/10.1177/0003702815620539
Solomon, M. J., & Spicer, P. T. (2010). Microstructural regimes of colloidal rod
suspensions, gels, and glasses. Soft Matter, 6(7), 1391–1400.
https://doi.org/10.1039/B918281K
Song, H. Y., Salehiyan, R., Li, X., Lee, S. H., & Hyun, K. (2017). A comparative study
of the effects of cone-plate and parallel-plate geometries on rheological
properties under oscillatory shear flow. Korea-Australia Rheology Journal, 29(4),
281–294. https://doi.org/10.1007/s13367-017-0028-9
157
Song, J. L., Au, K. H., Huynh, K. T., & Packman, A. I. (2014). Biofilm responses to
smooth flow fields and chemical gradients in novel microfluidic flow cells.
Biotechnology and Bioengineering, 111(3), 597–607.
https://doi.org/10.1002/bit.25107
Song, Y., & Zheng, Q. (2016). A Guide for Hydrodynamic Reinforcement Effect in
Nanoparticle-filled Polymers. Critical Reviews in Solid State and Materials
Sciences, 41(4), 318–346. https://doi.org/10.1080/10408436.2015.1135415
Sotak, G. E., & Boyer, K. L. (1989). The laplacian-of-gaussian kernel: A formal
analysis and design procedure for fast, accurate convolution and full-frame
output. Computer Vision, Graphics, and Image Processing, 48(2), 147–189.
https://doi.org/https://doi.org/10.1016/S0734-189X(89)80036-2
Staudt, C., Horn, H., Hempel, D. C., & Neu, T. R. (2004). Volumetric measurements
of bacterial cells and extracellular polymeric substance glycoconjugates in
biofilms. Biotechnology and Bioengineering, 88(5), 585–592.
https://doi.org/10.1002/bit.20241
Stewart, E. J., Ganesan, M., Younger, J. G., & Solomon, M. J. (2015). Artificial
biofilms establish the role of matrix interactions in staphylococcal biofilm
assembly and disassembly. Scientific Reports, 5, 13081.
https://doi.org/10.1038/srep13081
Stewart, E. J., Satorius, A. E., Younger, J. G., & Solomon, M. J. (2013). Role of
Environmental and Antibiotic Stress on Staphylococcus epidermidis Biofilm
Microstructure. Langmuir, 29(23), 7017–7024. https://doi.org/10.1021/la401322k
Stoodley, P., Cargo, R., Rupp, C. J., Wilson, S., & Klapper, I. (2002). Biofilm material
properties as related to shear-induced deformation and detachment phenomena.
Journal of Industrial Microbiology and Biotechnology, 29(6), 361–367.
https://doi.org/10.1038/sj.jim.7000282
Sun, W., Xue, B., Li, Y., Qin, M., Wu, J., Lu, K., Wu, J., Cao, Y., Jiang, Q., & Wang,
W. (2016). Polymer-Supramolecular Polymer Double-Network Hydrogel.
Advanced Functional Materials, 26(48), 9044–9052.
https://doi.org/10.1002/adfm.201603512
Sutherland, I. W. (2001). Biofilm exopolysaccharides: a strong and sticky framework.
Microbiology, 147(1), 3–9. https://doi.org/10.1099/00221287-147-1-3
158
Swenson, J., Smalley, M. v, & Hatharasinghe, H. L. M. (1998). Mechanism and
Strength of Polymer Bridging Flocculation. Physical Review Letters, 81(26),
5840–5843. https://doi.org/10.1103/PhysRevLett.81.5840
Tanaka, H., Meunier, J., & Bonn, D. (2004). Nonergodic states of charged colloidal
suspensions: Repulsive and attractive glasses and gels. Physical Review E,
69(3), 31404. https://doi.org/10.1103/PhysRevE.69.031404
Tanner, R. I. (2000). Engineering rheology (2nd ed..). New York : Oxford University
Press.
Tao, R., Rice, K. D., Djakeu, A. S., Mrozek, R. A., Cole, S. T., Freeney, R. M., &
Forster, A. M. (2019). Rheological Characterization of Next-Generation Ballistic
Witness Materials for Body Armor Testing. Polymers, 11(3).
https://doi.org/10.3390/polym11030447
Tasaki, S., Nakayama, M., & Shoji, W. (2017). Self-organization of bacterial
communities against environmental pH variation: Controlled chemotactic motility
arranges cell population structures in biofilms. PLoS ONE, 12(3), e0173195.
https://doi.org/10.1371/journal.pone.0173195
Tecon, R., & Leveau, J. H. J. (2016). Symplasmata are a clonal, conditional, and
reversible type of bacterial multicellularity. Scientific Reports, 6, 31914.
https://doi.org/10.1038/srep31914
Teodósio, J. S., Simões, M., Melo, L. F., & Mergulhão, F. J. (2011). Flow cell
hydrodynamics and their effects on E. coli biofilm formation under different
nutrient conditions and turbulent flow. Biofouling, 27(1), 1–11.
https://doi.org/10.1080/08927014.2010.535206
Towler, B. W., Cunningham, A., Stoodley, P., & McKittrick, L. (2007). A model of
fluid–biofilm interaction using a Burger material law. Biotechnology and
Bioengineering, 96(2), 259–271. https://doi.org/10.1002/bit.21098
Towler, B. W., Rupp, C. J., Cunningham, A. L. B., & Stoodley, P. (2003). Viscoelastic
Properties of a Mixed Culture Biofilm from Rheometer Creep Analysis.
Biofouling, 19(5), 279–285. https://doi.org/10.1080/0892701031000152470
Trunk, T., Khalil, H. S., & Leo, J. C. (2018). Bacterial autoaggregation. AIMS
Microbiology, 4(1), 140–164. https://doi.org/10.3934/microbiol.2018.1.140
159
Tsurusawa, H., Leocmach, M., Russo, J., & Tanaka, H. (2019). Direct link between
mechanical stability in gels and percolation of isostatic particles. Science
Advances, 5(5), eaav6090. https://doi.org/10.1126/sciadv.aav6090
Vaart, K. van der, Yasser, R., Rojman, Z., Zhibing, H., Daniel, B., & Peter, S. (2013).
Rheology of concentrated soft and hard-sphere suspensions. Journal of
Rheology, 57(4), 1195–1209. https://doi.org/10.1122/1.4808054
Vadillo-Rodrıguez, V., Busscher, H. J., Norde, W., de Vries, J., & van der Mei, H. C.
(2004). Atomic force microscopic corroboration of bond aging for adhesion of
Streptococcus thermophilus to solid substrata. Journal of Colloid and Interface
Science, 278(1), 251–254.
https://doi.org/https://doi.org/10.1016/j.jcis.2004.05.045
Valiei, A., Kumar, A., Mukherjee, P. P., Liu, Y., & Thundat, T. (2012). A web of
streamers: biofilm formation in a porous microfluidic device. Lab Chip, 12(24),
5133–5137. https://doi.org/10.1039/C2LC40815E
van der Sman, R. G. M. (2015). Biopolymer gel swelling analysed with scaling laws
and Flory–Rehner theory. Food Hydrocolloids, 48, 94–101.
https://doi.org/https://doi.org/10.1016/j.foodhyd.2015.01.025
van Oosten, A. S. G., Chen, X., Chin, L., Cruz, K., Patteson, A. E., Pogoda, K.,
Shenoy, V. B., & Janmey, P. A. (2019). Emergence of tissue-like mechanics
from fibrous networks confined by close-packed cells. Nature, 573(7772), 96–
101. https://doi.org/10.1038/s41586-019-1516-5
Veshchunov, M. S. (2015). Extension of the new kinetic approach to slow Brownian
coagulation with finite sticking probability. Journal of Engineering
Thermophysics, 24(1), 1–11. https://doi.org/10.1134/S1810232815010014
Vidakovic, L., Singh, P. K., Hartmann, R., Nadell, C. D., & Drescher, K. (2018).
Dynamic biofilm architecture confers individual and collective mechanisms of
viral protection. Nature Microbiology, 3(1), 26–31.
https://doi.org/10.1038/s41564-017-0050-1
Vinogradov, A. M., Winston, M., Rupp, C. J., & Stoodley, P. (2004). Rheology of
biofilms formed from the dental plaque pathogen Streptococcus mutans.
Biofilms, 1(01), 49–56. https://doi.org/doi:10.1017/S1479050503001078
160
Voigtmann, T. (2014). Nonlinear glassy rheology. Current Opinion in Colloid &
Interface Science, 19(6), 549–560.
https://doi.org/https://doi.org/10.1016/j.cocis.2014.11.001
Walls, H. J., Caines, S. B., Sanchez, A. M., & Khan, S. A. (2003). Yield stress and
wall slip phenomena in colloidal silica gels. Journal of Rheology, 47(4), 847–868.
https://doi.org/10.1122/1.1574023
Walter, M., Safari, A., Ivankovic, A., & Casey, E. (2013). Detachment characteristics
of a mixed culture biofilm using particle size analysis. Chemical Engineering
Journal, 228, 1140–1147.
https://doi.org/https://doi.org/10.1016/j.cej.2013.05.071
Wang, X., Hao, M., Du, X., Wang, G., & Matsushita, J.-I. (2016). The Mechanical
Analysis of the Biofilm Streamer Nucleation and Geometry Characterization in
Microfluidic Channels. Computational and Mathematical Methods in Medicine,
2016, 7819403. https://doi.org/10.1155/2016/7819403
Wang, Z., Chen, Z., Yang, L., Tan, F., Wang, Y., Li, Q., Chang, Y.-I., Zhong, C.-J., &
He, N. (2017). Effect of surface physicochemical properties on the flocculation
behavior of Bacillus licheniformis. RSC Advances, 7(26), 16049–16056.
https://doi.org/10.1039/C6RA28057A
Waters, M. S., Kundu, S., Lin, N. J., & Lin-Gibson, S. (2014). Microstructure and
Mechanical Properties of In Situ Streptococcus mutans Biofilms. ACS Applied
Materials & Interfaces, 6(1), 327–332. https://doi.org/10.1021/am404344h
Weeks, J. R., Duijneveldt, J. S. van, & Vincent, B. (2000). Formation and collapse of
gels of sterically stabilized colloidal particles. Journal of Physics: Condensed
Matter, 12(46), 9599–9606. https://doi.org/10.1088/0953-8984/12/46/307
Whitaker, K. A., Varga, Z., Hsiao, L. C., Solomon, M. J., Swan, J. W., & Furst, E. M.
(2019). Colloidal gel elasticity arises from the packing of locally glassy clusters.
Nature Communications, 10(1), 2237. https://doi.org/10.1038/s41467-019-
10039-w
Wilhelm, M. (2002). Fourier-Transform Rheology. Macromolecular Materials and
Engineering, 287(2), 83–105. https://doi.org/10.1002/1439-
2054(20020201)287:2<83::AID-MAME83>3.0.CO;2-B
161
Wilking, J. N., Zaburdaev, V., de Volder, M., Losick, R., Brenner, M. P., & Weitz, D.
A. (2013). Liquid transport facilitated by channels in Bacillus subtilis biofilms.
Proceedings of the National Academy of Sciences of the United States of
America, 110(3), 848–852. https://doi.org/10.1073/pnas.1216376110
William N. Findley, J. S. L. and K. O. (1989). Creep and relaxation of nonlinear
viscoelastic materials. Dover publications.
Wu, C., Lim, J. Y., Fuller, G. G., & Cegelski, L. (2012). Quantitative Analysis of
Amyloid-Integrated Biofilms Formed by Uropathogenic Escherichia coli at the
Air-Liquid Interface. Biophysical Journal, 103(3), 464–471.
https://doi.org/10.1016/j.bpj.2012.06.049
Xiao, J., Hara, A. T., Kim, D., Zero, D. T., Koo, H., & Hwang, G. (2017). Biofilm three-
dimensional architecture influences in situ pH distribution pattern on the human
enamel surface. International Journal of Oral Science, 9(2), 74–79.
https://doi.org/10.1038/ijos.2017.8
Xing, D., Cheng, S., Logan, B. E., & Regan, J. M. (2010). Isolation of the
exoelectrogenic denitrifying bacterium Comamonas denitrificans based on
dilution to extinction. Applied Microbiology and Biotechnology, 85(5), 1575–
1587. https://doi.org/10.1007/s00253-009-2240-0
Xu, F., Ouyang, D., Rene, E. R., Ng, H. Y., Guo, L., Zhu, Y., Zhou, L., Yuan, Q.,
Miao, M., Wang, Q., & Kong, Q. (2019). Electricity production enhancement in a
constructed wetland-microbial fuel cell system for treating saline wastewater.
Bioresource Technology, 288, 121462.
https://doi.org/10.1016/J.BIORTECH.2019.121462
Xu, H., Fan, X., Song, Y., & Zheng, Q. (2020). Reinforcement and Payne effect of
hydrophobic silica filled natural rubber nanocomposites. Composites Science
and Technology, 187, 107943.
https://doi.org/https://doi.org/10.1016/j.compscitech.2019.107943
Xu, Y., Atrens, A. D., & Stokes, J. R. (2018). “Liquid, gel and soft glass” phase
transitions and rheology of nanocrystalline cellulose suspensions as a function of
concentration and salinity. Soft Matter, 14(10), 1953–1963.
https://doi.org/10.1039/C7SM02470C
162
Xu, Z., Shao, J., Li, B., Yan, X., Shen, Q., & Zhang, R. (2013). Contribution of
bacillomycin D in Bacillus amyloliquefaciens SQR9 to antifungal activity and
biofilm formation. Applied and Environmental Microbiology, 79(3), 808–815.
https://doi.org/10.1128/AEM.02645-12
Yan, F., Zhu, Z., Dong, X., Wang, C., Meng, X., Xie, Y., Zhang, G., & Qiu, D. (2018).
Kinetics of Polymer Desorption from Colloids Probed by Aggregation-Induced
Emission Fluorophore. Langmuir, 34(24), 7006–7010.
https://doi.org/10.1021/acs.langmuir.7b04215
Yan, J, Sharo, A. G., Stone, H. A., Wingreen, N. S., & Bassler, B. L. (2016). Vibrio
cholerae biofilm growth program and architecture revealed by single-cell live
imaging. Proc Natl Acad Sci U S A, 113(36), E5337-43.
https://doi.org/10.1073/pnas.1611494113
Yan, Jing, Fei, C., Mao, S., Moreau, A., Wingreen, N. S., Košmrlj, A., Stone, H. A., &
Bassler, B. L. (2019). Mechanical instability and interfacial energy drive biofilm
morphogenesis. ELife, 8, e43920. https://doi.org/10.7554/eLife.43920
Yan, Jing, Moreau, A., Khodaparast, S., Perazzo, A., Feng, J., Fei, C., Mao, S.,
Mukherjee, S., Košmrlj, A., Wingreen, N. S., Bassler, B. L., & Stone, H. A.
(2018). Bacterial Biofilm Material Properties Enable Removal and Transfer by
Capillary Peeling. Advanced Materials, 30(46), 1804153.
https://doi.org/doi:10.1002/adma.201804153
Yan, Jing, Nadell, C. D., Stone, H. A., Wingreen, N. S., & Bassler, B. L. (2017).
Extracellular-matrix-mediated osmotic pressure drives Vibrio cholerae biofilm
expansion and cheater exclusion. Nature Communications, 8(1), 327.
https://doi.org/10.1038/s41467-017-00401-1
Yang, Jia, Li, Y., Zhu, L., Qin, G., & Chen, Q. (2018). Double network hydrogels with
controlled shape deformation: A mini review. Journal of Polymer Science Part B:
Polymer Physics, 56(19), 1351–1362. https://doi.org/10.1002/polb.24735
Yang, Jing, Yu, J., Jiang, J., Liang, C., & Feng, Y. (2017). D-tyrosine affects
aggregation behavior of Pantoea agglomerans. Journal of Basic Microbiology,
57(2), 184–189. https://doi.org/10.1002/jobm.201600455
Yiwu, Z., Guangcui, Y., Chuanzhuang, Z., & Charles, C. H. (2013). Differentiating
bonding and caging in a charged colloid system through rheological
163
measurements. The Journal of Chemical Physics, 138(18), 184902.
https://doi.org/10.1063/1.4803857
Yosick, J. A., Giacomin, J. A., Stewart, W. E., & Ding, F. (1998). Fluid inertia in large
amplitude oscillatory shear. Rheologica Acta, 37(4), 365–373.
https://doi.org/10.1007/s003970050123
Yu, X., Jiang, J., Liang, C., Zhang, X., Wang, J., Shen, D., & Feng, Y. (2016). Indole
affects the formation of multicellular aggregate structures in Pantoea
agglomerans YS19. The Journal of General and Applied Microbiology, 62(1),
31–37. https://doi.org/10.2323/jgam.62.31
Zaccarelli, E. (2007). Colloidal gels: equilibrium and non-equilibrium routes. Journal
of Physics: Condensed Matter, 19(32), 323101. https://doi.org/10.1088/0953-
8984/19/32/323101
Zaccarelli, E., & Poon, W. C. K. (2009). Colloidal glasses and gels: The interplay of
bonding and caging. Proceedings of the National Academy of Sciences, 106(36),
15203. https://doi.org/10.1073/pnas.0902294106
Zeng, G., Vad, B. S., Dueholm, M. S., Christiansen, G., Nilsson, M., Tolker-Nielsen,
T., Nielsen, P. H., Meyer, R. L., & Otzen, D. E. (2015). Functional bacterial
amyloid increases Pseudomonas biofilm hydrophobicity and stiffness. Frontiers
in Microbiology, 6, 1099. https://doi.org/10.3389/fmicb.2015.01099
Zhalnina, K., Louie, K. B., Hao, Z., Mansoori, N., da Rocha, U. N., Shi, S., Cho, H.,
Karaoz, U., Loqué, D., Bowen, B. P., Firestone, M. K., Northen, T. R., & Brodie,
E. L. (2018). Dynamic root exudate chemistry and microbial substrate
preferences drive patterns in rhizosphere microbial community assembly. Nature
Microbiology, 3(4), 470–480. https://doi.org/10.1038/s41564-018-0129-3
Zhang, C., Huang, J., Zhang, J., Liu, S., Cui, M., An, B., Wang, X., Pu, J., Zhao, T.,
Fan, C., Lu, T. K., & Zhong, C. (2019). Engineered Bacillus subtilis biofilms as
living glues. Materials Today.
https://doi.org/https://doi.org/10.1016/j.mattod.2018.12.039
Zhang, H., Yu, K., Cayre, O. J., & Harbottle, D. (2016). Interfacial Particle Dynamics:
One and Two Step Yielding in Colloidal Glass. Langmuir, 32(50), 13472–13481.
https://doi.org/10.1021/acs.langmuir.6b03586

164
Zhang, N., Wang, D., Liu, Y., Li, S., Shen, Q., & Zhang, R. (2014). Effects of different
plant root exudates and their organic acid components on chemotaxis, biofilm
formation and colonization by beneficial rhizosphere-associated bacterial strains.
Plant and Soil, 374(1), 689–700. https://doi.org/10.1007/s11104-013-1915-6
Zhang, R., & Schweizer, K. S. (2009). Theory of coupled translational-rotational
glassy dynamics in dense fluids of uniaxial particles. Physical Review E, 80(1),
11502. https://doi.org/10.1103/PhysRevE.80.011502
Zhang, W., Sileika, T., & Packman, A. I. (2013). Effects of fluid flow conditions on
interactions between species in biofilms. FEMS Microbiology Ecology, 84(2),
344–354. https://doi.org/10.1111/1574-6941.12066
Zhang, W., Sileika, T. S., Chen, C., Liu, Y., Lee, J., & Packman, A. I. (2011). A novel
planar flow cell for studies of biofilm heterogeneity and flow-biofilm interactions.
Biotechnology and Bioengineering, 108(11), 2571–2582.
https://doi.org/10.1002/bit.23234
Zhang, X., & Bishop, P. L. (2003). Biodegradability of biofilm extracellular polymeric
substances. Chemosphere, 50(1), 63–69.
https://doi.org/http://dx.doi.org/10.1016/S0045-6535(02)00319-3
Zhao, X., Wang, Y., Shang, Q., Li, Y., Hao, H., Zhang, Y., Guo, Z., Yang, G., Xie, Z.,
& Wang, R. (2015). Collagen-like proteins (ClpA, ClpB, ClpC, and ClpD) are
required for biofilm formation and adhesion to plant roots by Bacillus
amyloliquefaciens FZB42. PLoS ONE, 10(2), e0117414–e0117414.
https://doi.org/10.1371/journal.pone.0117414
Zhi, Z., Di, J., Javoris, V. H., He, C., & Charles, C. H. (2015). From repulsive to
attractive glass: A rheological investigation. The Journal of Chemical Physics,
143(23), 234901. https://doi.org/10.1063/1.4937796
Zhou, Z., Hollingsworth, J. v, Hong, S., Cheng, H., & Han, C. C. (2014). Yielding
Behavior in Colloidal Glasses: Comparison between “Hard Cage” and “Soft
Cage.” Langmuir, 30(20), 5739–5746. https://doi.org/10.1021/la500866d
Ziemba, C., Shabtai, Y., Piatkovsky, M., & Herzberg, M. (2016). Cellulose effects on
morphology and elasticity of Vibrio fischeri biofilms. Npj Biofilms And
Microbiomes, 2(1), 1. https://doi.org/10.1038/s41522-016-0001-2
165
Zong, Y., Yuan, G., Zhao, C., & Han, C. C. (2013). Differentiating bonding and caging
in a charged colloid system through rheological measurements. J Chem Phys,
138(18), 184902. https://doi.org/10.1063/1.4803857
Zuidema, J. M., Rivet, C. J., Gilbert, R. J., & Morrison, F. A. (2014). A protocol for
rheological characterization of hydrogels for tissue engineering strategies.
Journal of Biomedical Materials Research Part B: Applied Biomaterials, 102(5),
1063–1073. https://doi.org/10.1002/jbm.b.33088
Appendix
A) LAOS data pre-processing script
clear all
A = dir(''); %This is LAOS raw directory
B = dir(''); %This is Averaged data
saveroute = '' %This is your savepath
%% !!!Do not adjust below!!!
A(1:2,:) = []
B(1:2,:) = []
A = struct2cell(A)';
B = struct2cell(B)';
A = sortrows(A,3,'ascend');
B = sortrows(B,3,'ascend');
MaxStrain = []
cut_mat = []
for i = 1:length(A)
%% Import Files
flname = strcat(B{i,2},'\',B{i,1});
d = csv2struct(flname);
flname = strcat(A{i,2},'\',A{i,1});
c = csv2struct(flname);
cut_mat = [d.Time__action__s_];
166
%% Determine Colunm numbers
Ang = find(ismember(fieldnames(c),'Angular_displacement_rad_'));
Tim = find(ismember(fieldnames(c),'Time__action__s_')); % For stain DOWN
change to Time__sequence__s_
Torq = find(ismember(fieldnames(c),'Torque_N_m_'));
A{i,5} = dlmread(flname,',',1,0);
%% Remove y shift
Torque = A{i,5}(:,Torq)-A{i,5}(1,Torq);
Q_F = []
%% Segment waves into individual strain events
bg = round(A{i,5}(:,Tim),4);
col = [1:size(A{i,5},2)];
e= 0.2;
for ii = 1:length(cut_mat)-1
cut_val = round(cut_mat(ii),4);
if ii == length(cut_mat)
Q_F{ii,1} = A{i,5}([find(bg ==cut_val):end],col) ;
elseif ii == 1
Q_F{ii,1} = A{i,5}([1:find(bg >=cut_val-e & bg <=cut_val+e)],col) ;
else
seq_begin = find(bg <=round(cut_val,4)+e & bg >=round(cut_val,4)-e);
seq_end = find(bg <=round(cut_mat(ii+1),4)+e & bg>=
round(cut_mat(ii+1),4)-e);
Q_F{ii,1} = A{i,5}([seq_begin(1):seq_end(1)],col) ;
end
Displacement = Q_F{ii,1}(:,Ang);
Time = Q_F{ii,1}(:,Tim);
Torque = Q_F{ii,1}(:,Torq);
167
%% BoxCar average
Scale = size(Displacement,1);
NoPoints = 4000 %6000 for 2Hz, 4000 for 1Hz, 2000 for 0.5Hz
windowSize = 100; %For 0.5Hz 150 for 1Hz 100
b = (1/windowSize)*ones(1,windowSize)
a = 1
TorqueF = filter(b,a,Torque)
n = round(Scale/NoPoints) ;
M = Scale - mod(Scale,n);
Time_Cut = reshape(Time(1:M),n,[]);
Time_Cut = transpose(sum(Time_Cut, 1) / n);
Time_Cut = Time_Cut([50:end])
Displacement_Cut = reshape(Displacement(1:M),n,[])
Displacement_Cut = transpose(sum(Displacement_Cut, 1) / n);
Displacement_Cut =Displacement_Cut([50:end])
Torque_Cut = reshape(TorqueF(1:M),n,[])
Torque_Cut = transpose(sum(Torque_Cut, 1) / n);
Torque_Cut = Torque_Cut([50:end])
if min(Torque_Cut) < 0
Y_Shift_T = max(Torque_Cut) -((max(Torque_Cut) + abs(min(Torque_Cut)))/2)
else
Y_Shift_T = max(Torque_Cut) -((max(Torque_Cut) - abs(min(Torque_Cut)))/2)
end
if min( Displacement_Cut) < 0
Y_Shift_S = max( Displacement_Cut) -((max( Displacement_Cut) + abs(min(
Displacement_Cut)))/2)
else
Y_Shift_S = max( Displacement_Cut) -((max( Displacement_Cut) - abs(min(
Displacement_Cut)))/2)
end
if Y_Shift_T > 0
Torque_Cut = Torque_Cut - Y_Shift_T;
168
else
Torque_Cut = Torque_Cut - Y_Shift_T
end
if Y_Shift_S > 0
Displacement_Cut = Displacement_Cut - Y_Shift_S;
else
Displacement_Cut = Displacement_Cut - Y_Shift_S
end
%Torque_Cut = Torque_Cut - Torque_Cut(40)
%Displacement_Cut = Displacement_Cut + 3.5e-4
[pks,loc]= findpeaks(Torque_Cut,'MinPeakDistance',50,'MinPeakHeight',0)
%% Filter out low frequencies - if present
% if size(pks,1) == 0
% Ts = mean(diff(Time_Cut)); % Sampling Interval
% Fs = 1/Ts; % Sampling Frequency
% Fn = Fs/2; % Nyquist Frequency
% L = size(Time_Cut,1); % Signal Length
% FTwle = fft([Displacement_Cut Torque_Cut])/L; % Fourier
Transform
% Fv = linspace(0, 1, fix(L/2)+1)*Fn; % Frequency Vector
% Iv = 1:numel(Fv);
% Wp = 0.25/Fn; % Stopband Frequency
(Normalised)
% Ws = 0.20/Fn; % Passband Frequency
(Normalised)
% Rp = 1; % Passband Ripple (dB)
% Rs = 50; % Stopband Ripple (dB)
% [n,Ws] = cheb2ord(Wp,Ws,Rp,Rs); % Filter Order
% [z,p,k] = cheby2(n,Rs,Ws,'high'); % Filter Design, Sepcify
Bandstop
% [sos,g] = zp2sos(z,p,k);
% Dis_Tor_filtered = filtfilt(sos, g, [Displacement_Cut Torque_Cut]);
169
% [pks,loc]=
findpeaks(Dis_Tor_filtered(:,1),'MinPeakDistance',100,'MinPeakHeight',0)
% Displacement_Cut = Dis_Tor_filtered(:,1)
% Torque_Cut = Dis_Tor_filtered(:,2)
% end
%% Save Proprocessed Data to Savepath
L_loc = length(loc)
Begin = loc(L_loc-5)%-41
Time_Cut = Time_Cut([Begin:loc(L_loc)])
Strain_Cut = Displacement_Cut([Begin:loc(L_loc)]) * (0.01 /
d.Gap_mm_(1)*0.001);
Stress_Cut = Torque_Cut([Begin:loc(L_loc)])*6.3662e+05
Inputfile = [Time_Cut Strain_Cut Stress_Cut];
file_name = A{i,1};
file_number = ii
name = strcat(saveroute,file_name,num2str(file_number),'.mat')
savename = char(name)
save(savename,'Inputfile')
Eq = fit(Time_Cut,Strain_Cut, 'sin1');
StrainRate_Cut = differentiate(Eq, Time_Cut);
SPP_In = [Time_Cut Strain_Cut StrainRate_Cut Stress_Cut]
%% Enter SPP save directory
file_name = strcat(saveroute,file_name,num2str(file_number))
fileID = fopen('SPP.txt','w')
fprintf(fileID,'%6.8f %12.8f %12.8f %12.8f\n',SPP_In )
save(horzcat(file_name,'SPP','.txt'),'SPP_In','-ascii','-tabs')
end
end
170
% %% Save Absolute strain for each Proprocessed Dataset
% MaxStrain{i,1}(ii,1) = max(Displacement_Cut([loc(5):loc(L_loc-2)]))
% end
B) ImageJ preprocessing macroscript path ="";
output = "";
list=getFileList(path);
for(i=1;i<list.length;i++){
open(path+list[i]);
filename = list[i];
filename_Res = list[i];
run("Enhance Local Contrast (CLAHE)", "blocksize=127 histogram=256
maximum=3 mask=*None* fast_(less_accurate)");
run("Gaussian Blur...", "sigma=2");
run("Mexican Hat Filter", "radius=2");
run("8-bit");
setAutoThreshold("Otsu dark");
getThreshold(lower,upper);
setThreshold(lower,upper);
run("Convert to Mask");
setOption("BlackBackground", false);
run("Dilate");
saveAs("Tiff", output+filename_Res);
close();
}
C) Matlab quantification – packing fraction from ImageJ processed
images A = dir() %%Input file directory
A(1:2,:)=[]
A = struct2cell(A)
A = A'
for i = 1:length(A)
171
flname = strcat(A{i,2},'\',A{i,1});
I = imread(flname);
phi(i,1) = sum(BW(:)==1)/(size(BW,1)^2)
phi= mean(phi)
phi= std(phi,0)
end
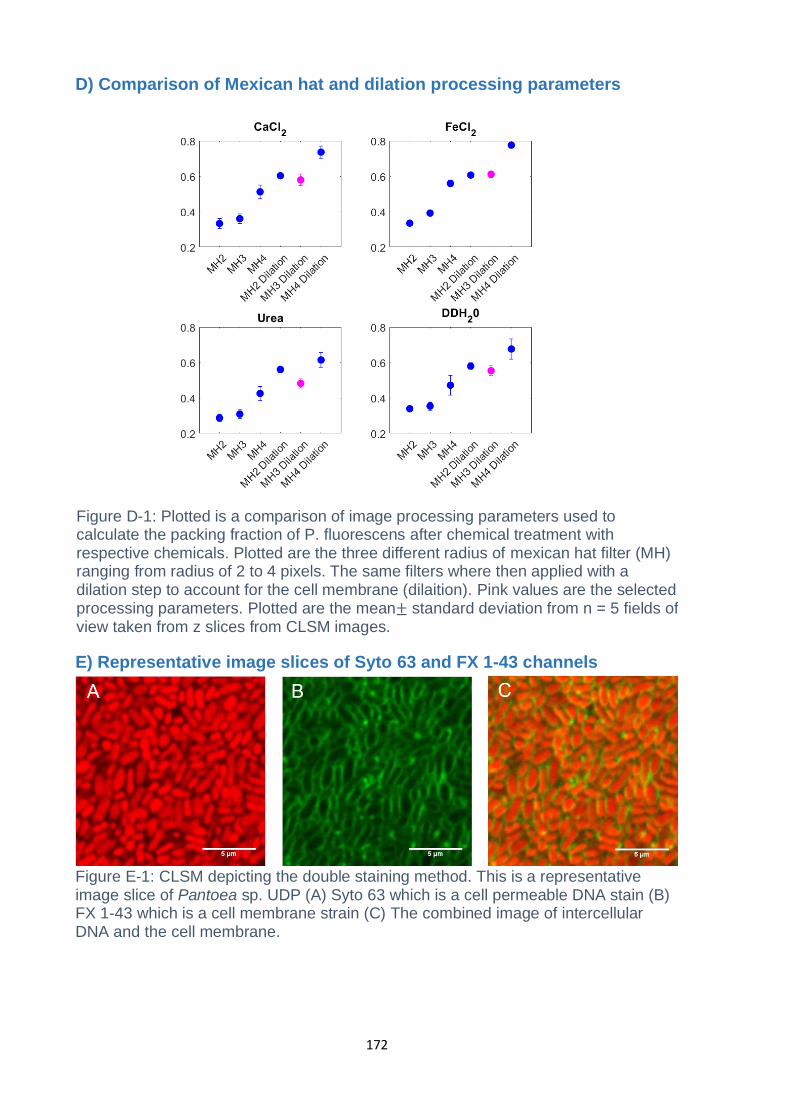
172
D) Comparison of Mexican hat and dilation processing parameters
E) Representative image slices of Syto 63 and FX 1-43 channels
Figure E-1: CLSM depicting the double staining method. This is a representative image slice of Pantoea sp. UDP (A) Syto 63 which is a cell permeable DNA stain (B) FX 1-43 which is a cell membrane strain (C) The combined image of intercellular DNA and the cell membrane.
Figure D-1: Plotted is a comparison of image processing parameters used to calculate the packing fraction of P. fluorescens after chemical treatment with respective chemicals. Plotted are the three different radius of mexican hat filter (MH) ranging from radius of 2 to 4 pixels. The same filters where then applied with a dilation step to account for the cell membrane (dilaition). Pink values are the selected processing parameters. Plotted are the mean± standard deviation from n = 5 fields of view taken from z slices from CLSM images.
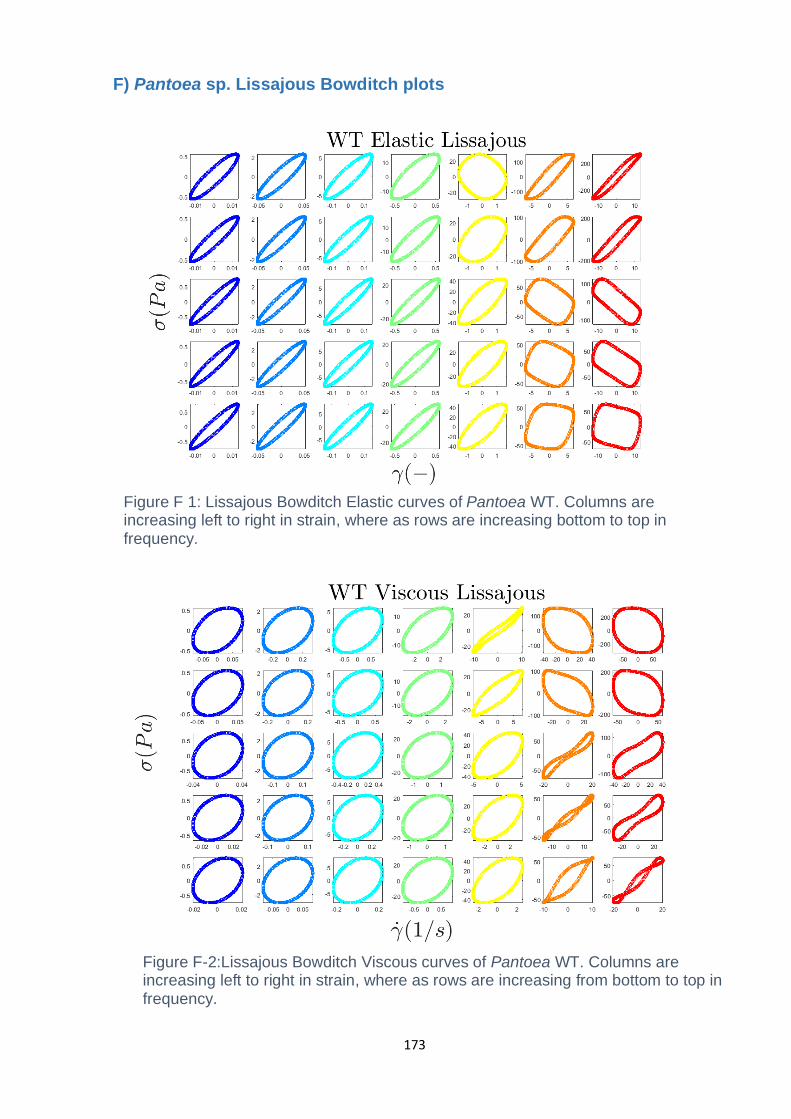
173
F) Pantoea sp. Lissajous Bowditch plots
Figure F-2:Lissajous Bowditch Viscous curves of Pantoea WT. Columns are increasing left to right in strain, where as rows are increasing from bottom to top in frequency.
Figure F-1 Figure F 1: Lissajous Bowditch Elastic curves of Pantoea WT. Columns are increasing left to right in strain, where as rows are increasing bottom to top in frequency.

174
Figure F-4: Lissajous Bowditch Viscous curves of 50:1 UDP:WT. Columns are increasing left to right in strain, where as rows are increasing bottom to top in frequency.
Figure F-3: Lissajous Bowditch Elastic curves of 50:1 UDP:WT. Columns are increasing left to right in strain, where as rows are increasing bottom to top in frequency.
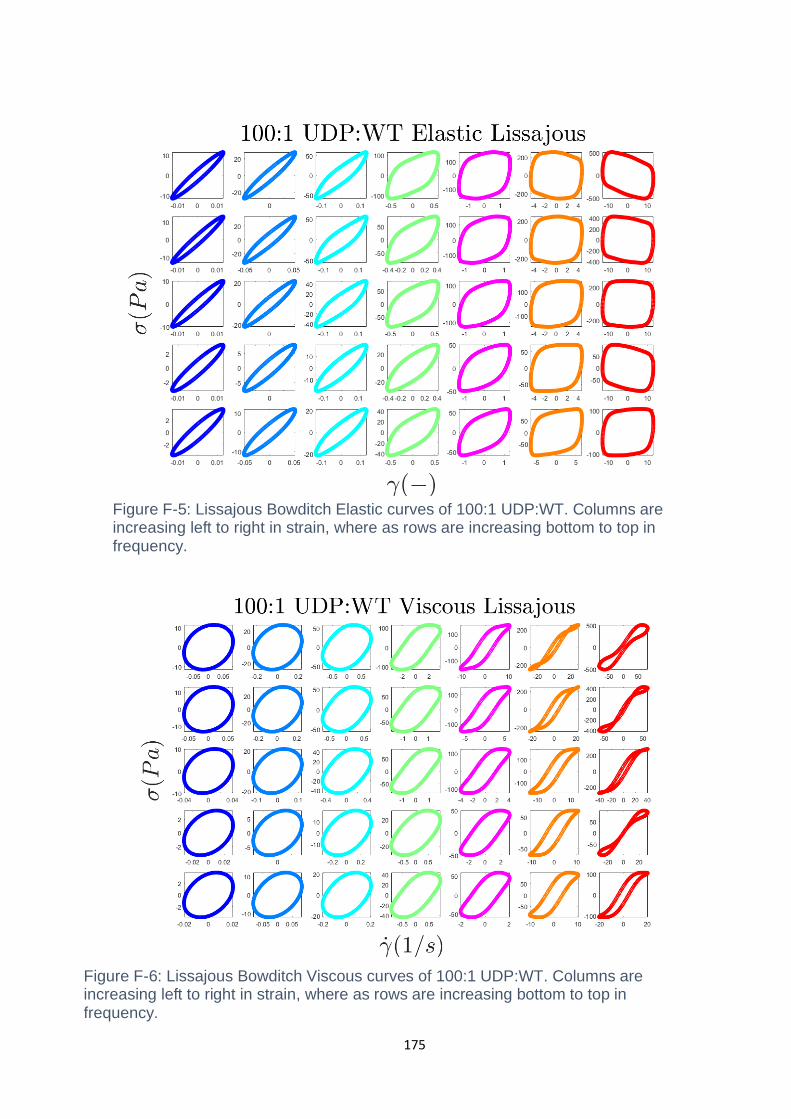
175
Figure F-6: Lissajous Bowditch Viscous curves of 100:1 UDP:WT. Columns are increasing left to right in strain, where as rows are increasing bottom to top in frequency.
Figure F-5: Lissajous Bowditch Elastic curves of 100:1 UDP:WT. Columns are increasing left to right in strain, where as rows are increasing bottom to top in frequency.
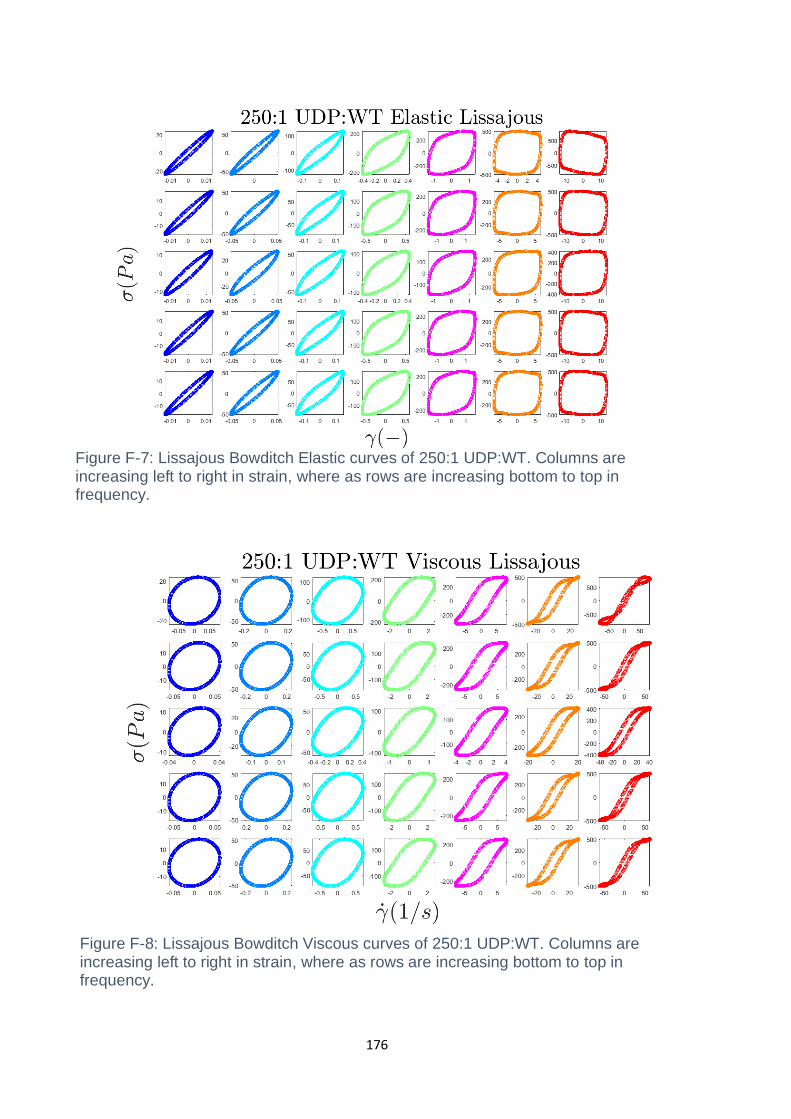
176
Figure F-8: Lissajous Bowditch Viscous curves of 250:1 UDP:WT. Columns are increasing left to right in strain, where as rows are increasing bottom to top in frequency.
Figure F-7: Lissajous Bowditch Elastic curves of 250:1 UDP:WT. Columns are increasing left to right in strain, where as rows are increasing bottom to top in frequency.
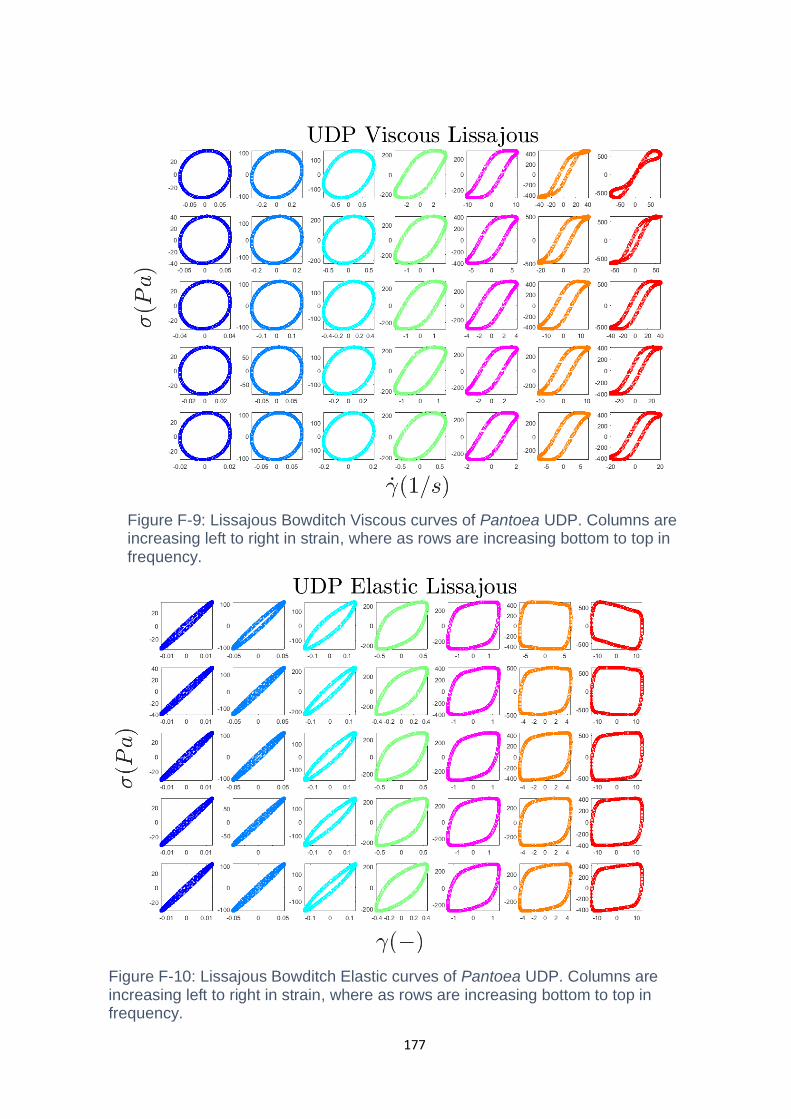
177
Figure F-9: Lissajous Bowditch Viscous curves of Pantoea UDP. Columns are increasing left to right in strain, where as rows are increasing bottom to top in frequency.
Figure F-10: Lissajous Bowditch Elastic curves of Pantoea UDP. Columns are increasing left to right in strain, where as rows are increasing bottom to top in frequency.
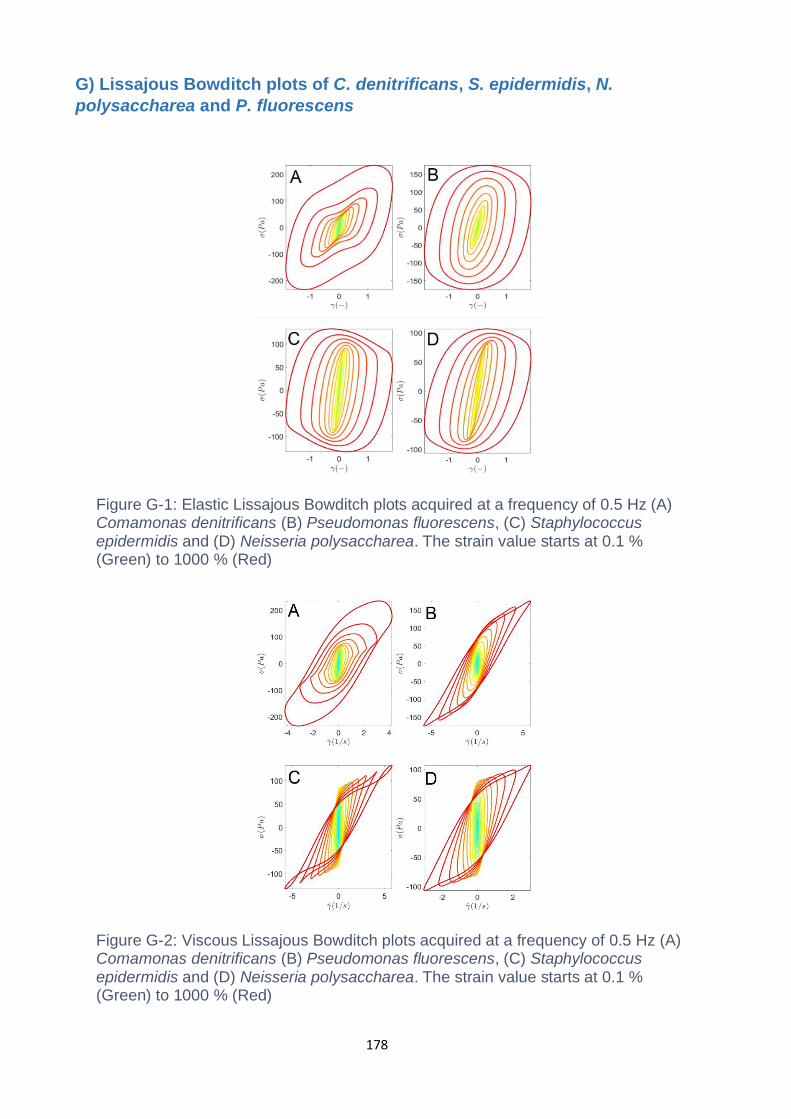
178
G) Lissajous Bowditch plots of C. denitrificans, S. epidermidis, N.
polysaccharea and P. fluorescens
Figure G-1: Elastic Lissajous Bowditch plots acquired at a frequency of 0.5 Hz (A) Comamonas denitrificans (B) Pseudomonas fluorescens, (C) Staphylococcus epidermidis and (D) Neisseria polysaccharea. The strain value starts at 0.1 % (Green) to 1000 % (Red)
Figure G-2: Viscous Lissajous Bowditch plots acquired at a frequency of 0.5 Hz (A) Comamonas denitrificans (B) Pseudomonas fluorescens, (C) Staphylococcus epidermidis and (D) Neisseria polysaccharea. The strain value starts at 0.1 % (Green) to 1000 % (Red)