RGD-Receptor with Enhanced Water Solubility · suitable and active agent for therapy purposes....
197
RGD-RECEPTOR WITH ENHANCED WATER SOLUBILITY DISSERTATION zur Erlangung des akademischen Grades eines Doktors der Naturwissenschaften – Dr. rer. nat. – vorgelegt von Diplom-Chemiker Johannes Hofmann geboren in Fulda Institut für Organische Chemie der Universität Duisburg-Essen Essen 2017
Transcript of RGD-Receptor with Enhanced Water Solubility · suitable and active agent for therapy purposes....

RGD-RECEPTOR WITH ENHANCED
WATER SOLUBILITY
DISSERTATION
zur Erlangung des akademischen Grades eines Doktors der Naturwissenschaften
– Dr. rer. nat. –
vorgelegt von Diplom-Chemiker
Johannes Hofmann geboren in Fulda
Institut für Organische Chemie der Universität Duisburg-Essen
Essen 2017


RGD-RECEPTOR WITH ENHANCED
WATER SOLUBILITY
Gutachter: Prof. Dr. Carsten Schmuck
Prof. Dr. Thomas Schrader
Prüfungsvorsitzender: Prof. Dr. Christian Mayer
Tag der Disputation: 12. Oktober 2017

Die vorliegende Arbeit wurde von August 2009 bis November 2015 an der
Universität Duisburg-Essen im Institut für Organische Chemie unter der Anleitung
von Herrn Prof. Dr. Carsten Schmuck angefertigt.
Ich erkläre hiermit an Eides statt, dass ich die vorliegende Arbeit selbständig
verfasst und mich dabei keiner anderen als der von mir bezeichneten Quellen und
Hilfen bedient habe. Die aus fremden Quellen direkt oder indirekt übernommenen
Gedanken wurden als solche kenntlich gemacht.
Weiterhin erkläre ich hiermit, dass ich weder an einer anderen Stelle ein
Prüfungsverfahren beantragt noch die Dissertation in dieser oder einer anderen Form
bereits als Prüfungsarbeit verwendet. Auch wurde diese Dissertation an keiner
anderen Fakultät vorgelegt.
Essen, im Juli 2017 …………………………………….. Johannes Hofmann

DANKSAGUNG
An erster Stelle möchte ich mich bei meiner Familie bedanken, welche mir den
größten Halt und die meiste Unterstützung gegeben hat. Insbesondere in der
Bereitschaft meinen Wunsch des Studiums der Chemie zu ermöglichen.
Einen ganz besonderen Dank möchte ich natürlich meinem Doktorvater Prof. Dr.
Carsten Schmuck aussprechen, der mir die Gelegenheit gegeben hat mich auf dem
Gebiet der Supramolekularen Chemie zu verwirklichen. Ich danke ihm für die
Unterstützung bei meinen Aktivitäten im Bereich des Jungchemikerforums der
Universität Duisburg-Essen. Vor allem aber auch für die Möglichkeit in seinem
Arbeitskreis aktiv mitzuwirken.
Mein weiterer Dank gilt unserem Kooperationspartner dieser Arbeit Prof. Dr.
Thomas Schrader sowie Dr. Thomas Gersthagen, die mit vielen neue Ideen und
Entwicklungen zu dieser Arbeit beigetragen haben. Bei Prof. Dr. Thomas Schrader
bedanke ich mich auch für die Übernahme des zweiten Gutachtens.
Allen meinen Arbeitskollegen möchte ich für ihre Unterstützung und die schönen
und abwechslungsreichen Jahre im Arbeitskreis danken. Besonders bedanke ich mich
bei Dr. Gerd Gröger, Dr. Barbara Geibel und Dr. Michael Merschky für die besonders
nette Aufnahme in den Arbeitskreis. Zusätzlich waren sie mir eine große Hilfe mich
mit den analytischen Geräten wie beispielsweise der HPLC vertraut zu machen. Für
die große Unterstützung der teilweise doch recht zeitaufwendigen Berechnungen
von Molekül-Geometrien bedanke ich mich besonders bei Herrn Wilhelm Sicking.
Auch möchte ich mich bei Dr. Julian Oeljeklaus bedanken, der mich während seiner
Promotion im Arbeitskreis von Prof. Dr. Markus Kaiser tatkräftig mit HPLC-MS
Messungen unterstützt hat.
Ohne die Mithilfe vieler einzelner Personen aus dem eigenen wie auch aus anderen
Arbeitskreisen und wissenschaftlichen Abteilungen hätte diese Arbeit nicht
fertiggestellt werden können. Daher möchte ich mich bei allen Angestellten in den
analytischen Abteilungen, Kollegen aus anderen Arbeitskreisen wie auch der
Verwaltung und allen, die mich irgendwann in irgendeiner Form unterstützt haben,
bedanken. Jeden einzelnen namentlich zu erwähnen würde wohl den Rahmen der
Danksagung sprengen.


CONTENT
1. Introduction 1
2. Background
2.1 Focus of this Work .......................................................................................................... 3
2.2 Cell Adhesion and Signaling ....................................................................................... 3
2.3 Structure and Function of the RGD-Integrins ...................................................... 5
2.4 Antagonists of RGD-Integrins and Potential RGD-Receptors ..................... 8
3. Concept
3.1 The Principle of Host-Guest Complexes ................................................................ 13
3.2 Concept of the Ditopic Binding Motif for RGD-Peptides ............................... 15
3.3 Objective of this Work .................................................................................................. 16
4. Results and Discussion
4.1 Projected Synthesis Strategies and First Calculations ....................................... 21
4.2 Receptor Syntheses
4.2.1 Syntheses of Basic Building Blocks of the Tweezer ..................................... 26
4.2.2 Syntheses of Un-Symmetrical Tweezers .......................................................... 31
4.2.3 Syntheses of Azido Guanidiniocarbonyl Pyrroles ........................................ 35
4.2.4 Synthesis of the 1st Generation RGD-Receptor ............................................. 42
4.2.5 Synthesis of the 2nd Generation RGD-Receptor ........................................... 46
4.2.6 Syntheses of the RGD-Peptides .......................................................................... 56
4.3 Measurements and Results
4.3.1 Determination of Association Constants of Host-Guest Systems ……... 59
4.3.2 Results of the UV-Titration Experiments with Receptor 46 ...................... 64
4.3.3 Imaging of Supramolecular Structures with AFM ....................................... 66
4.3.4 Results of AFM-Measurements of Receptor 46 ............................................ 68
4.3.5 Size Determination of Supramolecular Structures with DLS ……………... 71
4.3.6 Results of the UV-Titration Experiments with Receptor 56 ...................... 73
4.3.7 Results of AFM-Measurements of Receptor 56 .......................................... 80
4.4 Conclusions ........................................................................................ ............................... 81

5. Summary and Outlook 85
6. Experimental Section
6.1 General Procedures of Synthesis and Analysis .................................................... 89
6.2 Syntheses of Basic Molecules of the Tweezer ...................................................... 93
6.3 Syntheses of Guanidiniocarbonyl Pyrroles ............................................................ 103
6.4 Syntheses of Un-Symmetrical Tweezer Building Blocks .................................. 118
6.5 Synthesis of the 1st Generation RGD-Receptor .................................................. 130
6.6 Synthesis of the 2nd Generation RGD-Receptor ................................................. 136
6.7 Syntheses of Guest RGD-Peptides ........................................................................... 137
6.8 UV-Binding Studies
6.8.1 General Procedure of the Titration Experiments …………………………........ 147
6.8.2 Evaluation of the Binding Constants …………………………............................... 148
6.9 AFM Images of the Synthesized RGD-Receptors ………………………..……....... 153
7. Appendix
7.1 Zusammenfassung und Ausblick .............................................................................. 159
7.2 Purity Control via NMR ................................................................................................. 163
7.3 2D NMR Spectra .............................................................................................................. 171
7.4 Purity Control via HPLC ................................................................................................. 174
7.5 Table of Abbreviations .................................................................................................. 177
8. Bibliography 181
Curriculum Vitae 187


INTRODUCTION
Finding new efficient therapeutics is the major goal in pharmaceutical chemistry. A
lot of efforts are made in understanding how pharmaceuticals interfere in
etiopathologies. For example a disease like malignant tumor growth is based on a
plurality of single supramolecular processes. Most likely these mechanisms of
interaction occur in a reversible equilibrium. Therefore they are dependent on many
weak particular intermolecular interactions to form rather stable host-guest systems.
Interfering with those supramolecular interactions would permit to treat diseases at
their origin instead of curing their symptoms.
Such key could be lying in the interaction of integrins, a family of cell surface
receptors. The cornerstone in cancer research was set by Folkman et al. in the 1970´s.
Based on experiments of Greene et al.1 and Algire et al.2, he assumed that further
tumor growth beyond a particular size of 2 mm in diameter necessitates a trigger of
formation of new blood vessels. In animal experiments he adduced the evidence of
this kind of trigger. He investigated a diffusible substance mediated by tumors. The
isolated supernatant fluid caused neovascularization on specially prepared tissue. In
a postulate Folkman assumed that neovascularization is a consequence of this fluid
containing a tumor-angiogenesis-factor (TAF).3
Nearly one decade later the hypothesis of Folkman received an increased interest
among scientific research and number of publications raised exponentially. From
there on several angiogenesis factors have been identified and it turned out that
Folkman s TAF comprised different growth factors,4 which were identified as
receptors of the endothelium tissue. The evidence of upregulation of these cell
surface receptors triggered by oncogenes was adduced by Rak et al.5 One important
receptor-family promoting cell signaling and adhesion events are the integrins.6
Since 1984 it was approved by Ruoslathi et al. that contributing glycoproteins like
laminin, van Willebrand factor (vWF), osteopontin, vitronectin and fibrinogen have a
1

2 1 – INTRODUCTION
particular peptide sequence in common. This specific sequence is eponymous for the
sub-family of RGD-integrins (arginine-glycine-aspartic acid).7,8
From the origin of Folkman s idea of an anti-angiogenesis switch to keep a tumor
in a non-vascularized and dormant state9,10 it took more than three decades to find a
suitable and active agent for therapy purposes. Bevacizumab, a monoclonal antibody
distributed by Roche under the name Avastin® was investigated. The drug is able to
inhibit neovascularization by interfering with the vascularization endothelial growth
factor (VEGF-A formerly known as VEGF).11,12
Realization of an anti-angiogenesis effect based on molecular recognition and
inhibition of signaling processes would be a major goal in cancer therapy.
Recognition with regard to biological systems is one of the three fundamental
functional features of supramolecular species.13
A selective intermolecular recognition is based on several interactions including
electrostatic, ion-dipole, dipole-dipole interactions and van-der Waals forces.
Considered that the RGD-recognition unit combines different intermolecular
interaction possibilities it is a suited target for inhibition. The charged residues of
RGD-peptides provide electrostatic interactions as well as hydrogen bonding. The
rational design of a well-balanced inhibitor with complementary binding sites should
help understanding pathological processes on a molecular level. One big advantage
of tailor-made active agents would be fewer side effects to organisms. Such benefits
are the goal for each therapy. Supramolecular chemistry could help to understand
biological active principles. Therefore it is indispensable to understand biological
active principles. But before new selective antiangiogenic therapies could be
established a better understanding of contribution of single supramolecular
interactions need to be generated.
A possible approach is the synthesis of model systems that work in an analogous
way but were reduced to the binding sites. These binding sites are most likely
relevant for the recognition process. Smaller model-systems can be synthesized
more easily than the originally involved particles. Even studies on binding properties
can be carried out. Within this work the synthesis of a water-soluble RGD-receptor
should be realized. The structure of the receptor should be influenced by the dipolar
structure of RGD-peptides. Some previous reported artificial RGD-receptors would
provide a poor bioavailability due to an insufficient water-solubility. The purpose of
such artificial RGD-receptors is there potential application in biological systems.

BACKGROUND
2.1 Focus of this Work
The most important part of this work is the development and evaluation of a
water-soluble RGD-receptor. In terms of simplification of a host-guest-system the
guest RGD-peptides should be as small as possible. In the model system the receptor
should have the function of a ditopic binding motif. In the following chapters some
background information about the RGD-integrins, their relevance in biological
systems and malfunctions are given.
2.2 Cell Adhesion and Signaling
During the evolution from protozoa (unicellular organisms) to complex metazoa
(multicellular organisms) specialized cells for well-defined tasks became a necessity.
The organization and survival of higher life organisms is crucially dependent on well-
organized organs and individual cells like immune system cells. Therefrom cells
cannot arrange themselves randomly. The correct position of a specified cell in order
to fulfill its tasks correctly is essential.
A well-structured recognition and signaling system becomes very important in
another context too. Threats from bacteria or viruses need to be recognized and
combatted by the immune system of an organism. Repelling such threats is only
possible, if immune cells can recognize bacteria and viruses specifically.
Communication of immune cells among each other enables to transfer information
about invaders to support a long-term protection, which is mainly accomplished by
the adaptive part of the immune system, the effector T cells.14,15
2

4 2 – BACKGROUND
Therefore a suitable immune response is dependent on cell adhesion and cell
signaling processes. All these phenomena of cellular migration and recognition with
their different purposes of wound healing, morphogenic movements and metastasis
are crucially dependent on the ability of cell adherence to extracellular matrix (ECM)
and mutual recognition. This task is mostly adopted by glycoproteins which act as
cell adhesion molecules (CAM). These processes take benefit from high affinity and
binding constants towards molecules of the extracellular matrix which also show a
remarkable selectivity between different receptors.
Some representatives of these CAMs primarily mediate adherence like cadherins
which are calcium dependent glycoproteins.16 The superfamily of immunoglobulins
incorporates a whole set of structures which are involved in simple cell-cell
recognition processes including the neural cell adhesion molecule (N-CAM), myelin-
associated glycoproteins (MAG). Even immunoglobulin-related molecules are
assigned to this family because classification is based on similarities of their peptide
sequences.17
Figure 2-1. Overview of different integrins-subfamilies: A single integrin is represented by a
connection line between two subunits. The largest subfamily of RGD-receptors consists of 8
(purple) members (modified graphic in style of Patterson and Sheldrake 19).
Among other glycoproteins the integrins represent a class of cell surface receptors
mediating adherence as well as signaling. The term integrin was proposed in 1986 by
Tamkun and Hynes to indicate the characteristic of this protein group building a
complex with the membrane.18 Between various other cell surface receptors the
integrins represent a superfamily providing communication of cell´s interior with its
environment and vice versa.
The family of integrins consists of 24 different transmembrane receptors which are
combinations of heterodimeric pairs out of 18 α- and 8 -subunits (fig. 2-1). The
subunits are combined in a non-covalent complex. Based on evolutionary
RGD
receptors
Leucocyte-
specific
receptors
Laminin
receptors
Collagen
receptors I-domain receptors

2 – BACKGROUND 5
relationships or restricted expression on specific cells the integrins can be divided
into several subfamilies. Some of the α-subunits carry I-domains which allow another
subgrouping into the I-domain receptors. For instance leucocyte specific receptors
(green) are limited to be expressed on white blood cells.20 Beside the collagen
receptors (blue) and laminin receptors (brown), which are more localized, the RGD-
receptors (purple) are exceptional due to their ubiquitous occurrence. They can
recognize various ligands from extracellular matrix containing the tripeptide RGD for
adhesion phenomena or signal purpose.21,22 Therefore they appear on many different
cell types like cells of the immune system and platelets. Many physiological
processes are dependent on proteins with embedded RGD-sequence as recognition
criterion which raise the RGD-integrins to a key position.6
For this reason the RGD-sequence is an interesting target in terms of
investigations on different interfering possibilities. Studies on binding affinities are
possible through the use of antagonistic designed receptors. This might be helpful to
get a general understanding in these recognition processes.
2.3 Structure and Function of the RGD-Integrins
Generally the structure of an integrin can be divided into three main domains. The
ecto-, the transmembrane and the cytoplasmic domain contain different amounts of
amino acids respectively (fig. 2-2). The classification is made corresponding to their
position whereas a fine fragmentation leads to smaller fragments. These are also
called domains and mainly appear in the extracellular region with long peptide
chains of around 1100 amino acids. Their names originate from their typical shape or
some characteristic feature. For example a certain amount and orientation of –sheets lead to a particular appearance like propeller shaped unit. Even the
embedding of metal ions for functional purpose is eponymous for such domains. The
functions of different domains serve primarily the stability of formed complexes. For
instance I-domains enclose divalent metal ions which themselves are important to
complex acidic side chains of peptides.23
A common characteristic of integrins is their heterodimeric composition. The α- and -subunit are non-covalently associated which makes them flexible and shiftable
against each other. Due to the distinct arrangements of subunits domains like propellers and -domains integrins can occur in three conformational states, one
bent, one extended closed and one extended open conformation. Only the last
mentioned conformation is accessible to ligands and called the ON-state . It needs some trigger to convert the non-active conformations into the ligand accessible
6 2 – BACKGROUND
conformation. These three major conformations were suggested by evaluation of a
huge quantity of data from EM, SAXS, chrystallographic studies and affinity
experiments.21
Figure 2-2. Scheme of a heterodimeric transmembrane receptor shows a αV-subunit (blue) and
3-subunit (red). Extracellular domains like thigh, calf-1, calf-2 and β-propeller are indicated with
red balls ( -subunit) and blue ellipsoids and cylinder (αV-subunit). The ligand binding site
(orange) is located at the interface of both subunits extending in the ECM (modified figure in
style of Sun and Springer ). 21,24
The most interesting part in terms of this work is the binding site for extrinsic
ligands like RGD-peptides. It is located in the head region of the integrin (orange ball
in fig. 2-2) pointing towards the extracellular matrix (ECM). Integrin αV 3 incorporates
the binding site at the interface of the -propeller of the -subunit and an
I-like-domain at the α-subunit.25
The electrostatic potential of αV 3 integrin baring a highly negative charge in the
binding pocket of the RGD-sequence is shown in figure 2-3. This high negative
charge is needed to attract the guanidinium residue of the arginine. The distances
among the central guanidinium carbon atom and the surrounding oxygen atoms of
the peptide s residues range between .5 to 5.4 Å. This environment provides a
suitable binding site with respect to the strength of ion-ion interactions. A
characteristic of I-domains is their incorporated metal-ion-dependent adhesive site
(MIDAS) which plays an important role in the attraction of the aspartate residue of
the RGD-sequence.22
In this case the metal ion is Mn2+ which originates from an excess of manganese
during preparation process.26 In the body the divalent cation of I-domains plays a
crucial role in integrin activation. If Ca2+ is embedded inside the I-domain, the
Cyto-
plasm
ECM
cytoplasmic-domain
40-50 AAs
ecto-domain
1000-1150 AAs
transmembrane-domain
20 AAs
RGD-binding site

2 – BACKGROUND 7
integrin remains in an inactive state. In contrast the ligand binding affinity increases
dramatically by an exchange of Ca2+ with Mg2+.28 This exchange triggers the change
from the extended closed to the extended open conformation. As well inside-out
signaling processes can activate integrins like talin, a major cytoskeletal protein, is
doing, if it is overexpressed.29 In sum there are two strong binding sites to host a
RGD-peptide. This facilitates the integrins to a powerful tool for signaling and
adhesion processes. An artificial receptor should be designed in a similar way
containing two binding sites.
Figure 2-3. Top view of the extracellular part of integrin αV 3 (a) in complex with the antagonist
cyclo(-RGDf-N{Me}V-), a cyclic penta-peptide (b). The peptide is bound at the interface of
propeller- and A domain interface. The arginine residue is surrounded by carboxylic residues of
the α-subunit (blue) in contrast to the aspartate residue which is mostly complexed by Mn2+
(violet spheres) embedded in the 3-subunit (red). The exchange of Ca2+ and Mg2+ by Mn2+
refers to a buffer solution containing 5 mM MnCl2. The ligand cyclo(RGDf-N(Me)V-) is shown
light blue stick model. The glycine residue is positioned at the interface between α- and -
subunits (c). Due to clearness hydrogens are hidden in the scheme. Pictures are derived from the
crystal structure (pdb 1L5G).26,27
Within the group of RGD-receptors the common binding motif is the tripeptide
sequence arginine-glycine-aspartic acid (RGD). The receptors can recognize an
overlapping range but distinct set of extracellular ligands. For instance the human
integrins αV 3 and αIIb 3 attract similar ligands such as fibrinogen, vitronectin,
fibronectin, thrombospondin, vWF and others. All of these ligands present the RGD-
sequence at a solvent exposed loop. Due to different three dimensional orientation
of the RDG sequence presented the ligands can be discriminated by individual
integrins specifically. Among the RGD-integrins the functions are diverse. The major
platelet receptor is the αIIb 3 integrin which is mostly found on mobile platelets.
Although the receptor recognizes fibrinogen it is also accessible for ligands like von
a
b
c
8 2 – BACKGROUND
Willebrand factor and fibronectin. So the hemostasis needs the activation of αIIb 3
integrin to initiate coagulation of blood cells.30
The complexity and functional diversity allows the integrins playing a pivotal role
in nearly all biological contexts stretching from tissue morphogenesis, regulation of
cell growth, wound healing to inflammatory processes. But malfunction in signaling
and adhesion processes due to overexpression of integrins or activation triggers can
lead to a dysregulation of their functions with severe consequences. Predominantly
αV 3, αV 5, αV 6, αV 8, αV 1, and αIIb 3, are involved in pathogenesis of a multiplicity of
diseases states. In particular malfunction of the platelet receptor αIIb 3 cause arterial
thrombosis.31 Others like αV 3 and αV 5 are involved in cancer diseases by
contributing in tumor progression and angiogenesis.32,33 Angiogenic processes
induced by basic fibroblast growth factor (bFGF) or tumor necrosis factor α (TNF-α) necessitate integrin αV 3. Any wrong stimulation by vascular endothelial growth
factor (VEGF) or transforming growth factor α (TGF-α) is dependent on the function
of integrin αV 5.34 These basic requirements raise the two integrins αV 3 and αV 5,
responsible for angiogenic tumor progression, to suitable targets for anticancer
therapeutics.35,36
2.4 Antagonists of RGD-Integrins and Potential RGD-Receptors
Several glycoproteins that carry the RGD-sequence act as antagonists and
regulate integrin-mediated processes like thrombospondin, vitronectin, fibronectin,
vWF or fibrinogen. If the growth of tissue starts to get malignant, inhibition of
integrins can help to stop signaling processes that cause angiogenesis, promoting
tumors, inducing metastasis or obstructing apoptosis of melanoma cells. By blocking
either RGD-containing glycoproteins or integrins respectively a purposeful
obstruction of signaling or adhesion processes can be performed.24
Research for disintegrins that make use of the RGD-sequence as it is a ubiquitous
binding motif lead to different approaches. One is the use of monoclonal antibodies
as it was mentioned in the introduction. A major problem of this approach is the
overcoming resistance to antiangiogenic therapies as the title of an article published in 2012 is announcing.37 Herein the authors denote that treatment of
tumors with bevacizumab directed against the growth factor VEGF-A has an
unwanted side effect. The authors claim that the dramatic loss of efficacy of the
VEGF-A-pathway is caused by alternative angiogenic pathways. The inhibition of
neovascularization leads to an increase of tumor invasiveness and metastasis. As a

2 – BACKGROUND 9
major response tumors start to spread stem cells to overcome the problem of
hypoxia. This fact leads to a high rate of phase III failures in clinical trial.37,38
Another promising approach is the development of small molecules with a high
affinity towards RGD-integrins. Two promising approaches are concerned with
synthesis of non-peptidic integrin ligands39 and cyclic peptides40 respectively. Both
concepts have a competitive inhibition in common. The interactions of the peptidic
structures are mainly based on the binding motif RGD. The non-peptidic
diacylhydrazines 3 contain a guanidinium and a carboxylate group at the edges
(fig. 2-4). In the last case both groups mimic the functional groups of arginine and
aspartic acid as they appear in the RGD-sequence. It was investigated to improve the
coating mechanism of implant materials. In an experiment it could be shown that the
adhesion of osteoblasts on titanium surfaces could be increased if diacyl-
hydrazines (3) were incorporated on the titanium surface before. The incorporation
was carried out via thiols that were used as residues. The cell adhesion efficiency
could be increased up to 40 % compared to material that was not treated before.39
Figure 2-4. RGD-triad (arginine in blue, glycine in green and aspartic in red) in cyclic peptides
cyclo(RGDfV) 1a for R1=H and cyclo(RGDf-N(Me)V-) 1b for R1=CH3. The α, -locked -amino-
butanoic acid (GABA) supplies highly strained cyclic tetra-peptides 2a-c.41 The non-peptidic
diacylhydrazines 3 contains a guanidinium (dark blue) and a carboxylate (dark red) group. The
residues R3 and R4 are possible linker positions for anchoring the molecule to surface (c).39
Due to an unknown bioactive conformation of the RGD-sequence in biological
systems Kessler and coworkers synthesized peptide libraries. By spatial screening
they explored a cyclic penta-peptide as lead structure. The cyclic arrangement of the
peptides forces the RGD-sequence in a precise orientation so that the peptide s
3
1a 2a
1b 2b
2c

10 2 – BACKGROUND
residues are fixed in a specific orientation to each other. As a most promising
candidate the cyclic penta-peptide cyclo(RGDfV) was evaluated. As an intriguing
result of the structure-activity studies the existence of the artificial aminoacid D-Phe
lead to increased receptor specificity. The reason for such an impact is announced by
the authors by a well-defined orientation of the RGD-loop. Kessler and coworkers tried different variations of cyclic polypeptides such as cyclo(RGDfK) or cyclo(RGDf-
N(Me)V-) 1b. The cyclic peptide 1b with a methylated valine is shown in figure 2-4.
Additional to the RGD-triad the best candidates contain the lipophilic amino acid
phenylalanine within the cycle. The use of the non-proteinogenic D-configuration of
phenylalanine contributes pivotal to the conformation of the cyclic peptide.
Inhibitory measurements of vitronectin towards integrins αIIb 3 and αV 3 using the
peptide cyclo(RGDfV) resulted in IC50-values in nanomolar range. A striking selectivity
ratio of 415 to 1 of α IIb 3 towards α V 3 integrin could be obtained.40
An advanced class of integrin cyclopeptide ligands 2a-c invented by Casiraghi et
al. show the highest binding affinity towards integrins at present (fig. 2-4). In
competition with echiastin, a viper venom from Echis carinatus, some of the
developed cyclic tetrapeptides could achieve IC50 values in a subnanomolar range.
Thereby the venom, which has a low molecular weight, counts as a very potent
irreversible αV 3 antagonist with an inhibitory binding constant of Ki= 0.27 nM.41,42
Figure 2-5. Ditopic RGD-receptor in complex with schematic RGD-peptide (due to clearness only
residues of amino acids arginine and aspartic are shown).43
In a complementary method the capturing of ligand molecules is realized by an
artificial receptor. The first class of receptors tailor-made for RGD-sequences is based
on a xylylene skeletal structure. The three phosphonate groups attract positively
charged ammonium or guanidinium groups by electrostatic, hydrogen bond and π-
cation-interactions. With a second binding site composed of a meta substituted
aniline residue (fig. 2-5) Schrader could obtain a complex stoichiometry of 1:1 with
different RGD-substrates. For example binding constants of 700 M-1 and 1300 M-1
(determined via NMR titration in aqueous solutions) could be obtained with Kessler s

2 – BACKGROUND 11
peptide cyclo(RGDfV) 1a and a linear RGD-peptide respectively.43 In this case the
binding pocket of the receptor is mimicked to offer a ditopic binding site for integrin
antagonists.43,44
The charged residues of the RGD-peptide direct towards the binding sites offered
from the receptor. One important aspect is the rigidity of the RGD receptor with its
two antagonistic binding sites. The trisphosphonate receptor suffers from a generally
high flexibility. In a collaboration of the two working groups Schrader and Schmuck
an enhanced ditopic RGD-receptor was investigated. Through the linkage of the
bisphosphonate with a guanidinio carbonylpyrrole a versatile receptor was designed.
The challenging part of finding a suitable linker which provides enough rigidity to
prevent intramolecular interactions was synthesized by Rupprecht (fig. 2-6). In
independent binding studies via UV- and fluorescence titration experiments this
enhanced receptor could achieve binding constants of around 2700 M-1 against a
linear RGD-sequence in aqueous solution. In control experiments it could be shown
that peptides enclosing only one charged peptide (arginine or aspartate) no binding
affinity could be detected with the enhanced RGD-receptor of Rupprecht. One
remarkable in this study was the fact that the methyl ester precursor showed a
slightly higher binding constant (4700 M-1). Therefore the precursor is only single
charged. The authors proposed that the higher charged receptor (fig. 2-6) might be
better solvated than the methyl ester protected one.44
Figure 2-6. Enhanced Ditopic RGD-receptor with rigid aryl linker in complex with schematic
RGD-peptide (due to clearness only residues of amino acids arginine and aspartic are shown).45
In figure 2-7 a new class of receptor is shown. In a collaborative research of both
working groups Schrader and Schmuck this new type of receptor was developed. It
combines the idea of a ditopic RGD-receptor as it was shown before and an
additional concept of a cavity which provides a pre-organized binding site. The cage-
like structure is provided by a tweezer which has shown before to be a versatile host
for cationic guests like lysine and arginine.46

12 2 – BACKGROUND
Generally the tweezer receptors shown in figure 2-7 suffered from a rather low
affinity towards RGD-peptides. In comparative studies they showed the same
efficiency like a monotopic tweezer. In proton NMR experiments it could be shown
that rather no inclusion of the guest peptides into the cavity occurred. 47 Another
inevitable problem deficiency was the low water-solubility especially of the single
methyl ester protected receptor. Herewith solutions containing 50 % DMSO were
used for the affinity studies.
Figure 2-7. New class of ditopic RGD-receptor different linker molecules contains a tweezer as
an arginine binding site. Connected via a linker a guanidiniocarbonyle pyrrole is used as
aspartate binding site. 47
Keeping the above mentioned advantages some further improvements in terms of
binding affinity and selectivity towards different RGD-peptides can be done. Through
the use of a more rigid binding site for the arginine residue like a pre-orientated
cavity could enhance binding affinities significantly. The focus should be the
development of a water-soluble receptor as this fact is essential with respect to
biological systems and a prospective application in such systems. Additionally a
ditopic binding site should enhance the binding facilities of the receptor like a
chelating effect. Therefore a receptor structure consisting of two individual binding
sites for the aspartic acid and the arginine respectively should be considered similar
to the integrins and the receptors shown previously. If each binding site is
considered to be part of an individual building block a target specific design by the
use of different linker molecules could be possible. Due to a well-defined distance of
both sites specific RGD-peptides could be preferred in terms of recognition. Further
details and the concept of the work will be explained in chapter 3.

CONCEPT
3.1 The Principle of Host-Guest-Complexes
The principle of host-guest-systems is originated from receptor theory, which was
developed by Langley and Ehrlich over a period of 30 years beginning from the
1870s.48 From thereon theory evolved to a subfield of supramolecular chemistry,
which was mainly advocated by Lehn, Cram and Pedersen and awarded with the
nobel prize in 1987.49,50 And the field of supramolecular chemistry is still a popular
and innovative for research. This is even shown by the current Nobel prize in
chemistry (2016) which was awarded to Jean-Pierre Sauvage, Sir J. Fraser Stoddart
and Bernard L. Feringa "for the design and synthesis of molecular machines".
Supramolecular chemistry may be defined as the chemistry beyond the molecule , the chemistry of the intermolecular interactions. 51 With this conclusion
Lehn refers to the fact that supramolecular chemistry concerns itself with non-
covalent but rather weak intermolecular interactions. They range from the strongest
ion-ion interactions (100 to 300 kJ/mol) over ion-dipole-, dipole-dipole interactions
and hydrogen bonding to van der Waals forces and hydrophobic effects (< 5 kJ/mol),
which are determined as the weakest ones. But nevertheless combination and
accumulation of these interactions facilitates rather strong complex formations. One
of the most prominent structures is the DNA double strand which is held together by
a multiplicity of base pairs, guanine-cytosine and adenine-thymine. The base pairing
itself is driven by supramolecular interactions in a noncovalent fashion. The main
interactions that contribute are hydrogen bonds and hydrophobic interactions
between the base pairs.52
The example of a double-stranded DNA is one of many other self-assembling
processes which occur in biological systems. A quick and efficient response to
environmental changes is essential for organisms. These responses include
3

14 3 – CONCEPT
exchanges of information and recognition processes. The formation of complexes
between receptor and substrate enables recognition events. The reversibility of such
complex formation is an outstanding advantage of supramolecular interactions. The
general working mechanism of a host-guest-complex is illustrated in figure 3-1. Due
to their specific complementary binding sites only appropriate guests are bound to
the receptor or host molecule. Size and shape of the substrate as well as a
multiplicity of supramolecular interactions contribute to selectivity in host-guest-
systems.
Figure 3-1. The molecular recognition with a high specificity towards different guest molecules is
shown by the equilibrium above. Only suitable substrate molecules (guest = red ball) can form a
host-guest-system with the receptor (host = blue half-shell). Small black cones and balls define
functional groups that act as binding sites.
In the upper graphic only the red ball-shaped guest with a suitable orientation of
binding sites is favored to build a complex. Although the other guest molecules have
some suitable binding sites they would be less favored. As shown in chapter 2.2
integrin receptors utilize several intermolecular interactions to distinguish between
different RGD-peptides in a similar manner. Two prominent representatives are
vitronectin and fibronectin. Realizing a biomimetic receptor with similar selectivity
necessitates a good balance of conformational flexibility and fixed orientation of
binding sites. The form and the orientation of those binding sites of the synthesized
RGD-receptor could be used to distinguish between the different RGD-peptides.
Having an increased contact area between guest and host provides more space
for supplementary supramolecular interactions. The more attracting binding sites a
receptor can offer to a substrate the stronger and more specific the complex should
be. Sensing of molecular size, shape and architecture rises with increased number of
hydrogen binding, electrostatic and van der Waals interactions.53
Even the small binding motif of the RGD-triad incorporates the challenge of
selective recognition of complementary binding sites within one molecule. These
could lead to self-recognition and self-association. Therefore the composition of the
artificial receptor needs to be well-considered. But some principles should be obeyed
to obtain a molecular receptor with a high recognition capability. Subsequently two

3 – CONCEPT 15
complementary binding sites for the RGD-sequence are considered. The arginine
could be addressed by a negatively charged tweezer, whereas the aspartic acid could
be recognized by a guanidiniocarbonyl pyrrole, a carboxylate binder.54 Small RGD-
peptides as analogs of the RGD-peptides as they appear in vivo could be used to
validate the binding affinity and the binding selectivity of an artificial RGD-receptor.
For example peptides shown in chapter 2.4 could be some useful candidates.
3.2 Concept of the Ditopic Binding Motif for RGD-Peptides
Guanidiniocarbonyl pyrrole carboxylates work as self-complementary systems and
form stable dimers. They have been developed by Schmuck. The dimerization is
mostly based on electrostatic interactions due to opposite charges of functional
groups. Additional hydrogen bonds contribute to a strong dimerization constant of
an estimated value of 1012 M-1 in DMSO. Guanidinio and carboxylate function
connected via a pyrrole moiety act as complementary binding partners. Due to their
rational design the hydrogen donors line up in rather flat molecular geometry
(fig. 3-2). This enables guanidiniocarbonyl pyrroles to act as proper oxoanion
receptors, especially for carboxylates having a planar structure either. Even in
aqueous media complexation constants in the range of 103 M-1 could be reached.
Therefore the guanidiniocarbonyl pyrrole is a highly efficient carboxylate binder.54
Figure 3-2. Oxoanions such as carboxylates provide an opportune complementary binding
partner for guanidiniocarbonyl pyrroles based on their planar orientation (left side). The
tweezer s cavity is highly suitable for entrapping positively charged moieties such as arginine or lysine side chain (right side).
As an attractive binding partner for the guanidine moiety of the arginine side
chain a molecular tweezer consisting of an aromatic backbone is considered.
Invented by Klärner and further developed by Schrader it is a well-known binding
site for primary and secondary alkylammonium guests (fig. 3-2). Due to two attached
phosphonate groups at the tweezer s central part, also named as bisphosphonate
tweezer, it is sufficiently water soluble. It shows a remarkable affinity towards

16 3 – CONCEPT
N/C-protected amino acids like lysine and arginine as guests in aqueous solutions.
The bisphosphonate tweezer yielded association constants of around 5000 M-1 and
2000 M-1 for the protected amino acids lysine and arginine respectively.46 The affinity
towards the arginine residue is supported by the cavity of the tweezer too. In
analogy to the guanidiniocarbonyl pyrrole binding site the intermolecular
interactions are mainly based on electrostatic interactions. Additionally hydrogen
bonds and hydrophobic effects contribute to the association event. The hydrogen
bonds are formed between the oxygen atoms of phosphonate groups and
guanidinium. Hydrophobic effects arise from the tweezer cavity, which serves as an
environment shielded from solvent. The release of water molecules from this
hydrophobic environment has a striking entropic advantage.55,56
To obtain a molecular receptor with a high recognition efficiency it is
recommended to have an increased contact area between guest and host.53 By
addressing both side chains of the RGD-sequence simultaneously a ditopic receptor
containing previously introduced binding sites can be designed. The benefit of a
ditopic binding motif should be an increased binding affinity towards RGD-peptides.
As mentioned before, recognizing the RGD-sequence is challenging due to the
complementarity of their binding sites. Guanidinium residue of the guanidinio-
carbonyl pyrrole represents a highly suitable guest for the tweezer cavity. Thus
intramolecular association would be entropically favored, if both binding sites are
allowed to come into contact. An indispensable condition is the use of a suitable
linker molecule. On the one hand it needs to provide enough space for RGD-
substrates on the other hand intramolecular self-aggregation needs to be prevented.
3.3 Objective of this Work
With the help of computational chemistry appropriate linker molecules to connect
the anion and cation binding sites were considered. Methods on a very basic level
were used to calculate molecular structures of the desired complexes. With the use
of MacroModel simple force field calculations of possible receptors were made to
visualize, if intra- or intermolecular interactions are favored. Comparisons of
calculations of the receptors with RGD-substrates, e.g. Kessler s cyclic RGD-penta-
peptides, could give advices for synthetic approaches. Even the kind of the
connective groups of the linker molecule needs to be preconceived. For this purpose
the guanidiniocarbonyl pyrrole 4 offers three positions (R) for a conjunction with the
second binding site (fig. 3-3). A connection of both binding sites providing best
preorganization for recognition of the RGD-sequence is required. In principle

3 – CONCEPT 17
attachment of the linker can be carried out as ester or amide function at the carboxyl
group at position 5 of the pyrrole 4.
But nevertheless attaching the linker at the tweezers (5a and 6) will result in a loss
of symmetry. Thus synthesis might be challenging in terms of a good yield for a
mono-functionalized tweezer. Selectivity control of a mono-functionalization of the
tweezer should be achieved by reaction management, e.g. by dilution of reactants or
insufficient use of a reagent.
Figure 3-3. Structures of the binding sites pyrrole 4, monophosphate tweezer 5a and
diphosphate tweezer 6. Possible positions to connect linker molecule are marked by the
residues R.
In figure 3-3 two approaches for an unsymmetrical tweezer are shown. The
residue R represents the connected linker molecule. Pre-considerations led to the
result that monophosphate tweezer 5a could originate from an unsymmetrical
tweezer central part 5b (fig. 3-4) thus dissymmetry could be achieved at an early step
in syntheses pathway. This might circumvent problems of selectivity and low yield at
advanced synthesis steps.
Figure 3-4. Central part 5b as an appropriate precursor for monophosphate tweezer 5a.
With regard to possible applications under physiological conditions the receptor
needs to be water soluble. As a result the positions of solubility enhancing groups
need to be considered as well as pH-stability due to work up at acidic conditions.
Therefore the peripheral positions of the guanidiniocarbonyl pyrroles moiety provide
some space for such groups. In figure 3-4 possible positions of water solubility
enhancing groups are shown. In addition a diphosphate tweezer 6 could be used.57
In this case the second phosphate group provides an additional negative charge. This
4 5a
6
5b

18 3 – CONCEPT
might increase water-solubility in the same manner as attractiveness towards
positively charged guest molecules like arginine.
Within this work a basic synthesis strategy taking advantage a convergent
synthesis should be applied. Therewith the overall yield should be improved because
multistep syntheses will have a negative impact on the yield anyway. A suitable
linkage of both binding sites supporting such a convergent synthesis strategy needs
to be considered as well. In figure 3-5 the proposed receptor structure is shown in
principle. Similar to the receptor shown in figure 2-7 the tweezer should be
connected to a guanidiniocarbonyl pyrrole. But beside the functional groups used as
binding sites for arginine and aspartic acid solubility enhancing groups should be
considered. In general these groups could be attached at the periphery of the
guanidiniocarbonyl pyrrole as well as the linker molecule provide space for
supplementary solubility enhancing groups.
Figure 3-5. Suitable positions for solubility enhancing groups are highlighted in in blue.
In a subsequent step the association constants of the receptor with different RGD-
peptides should be determined. To quantify association constants and therefore the
affinity towards RGD-peptides different methods can be used depending on the
molecular properties of the receptor. Typically titration experiments of the host with
guest substrate will be carried out under acquisition of a changing observable.58,59
The use of NMR, ITC and UV/VIS are generally suitable methods to evaluate the
host-guest-system. With respect to the expected range of binding constant some
methods suit better than others. For instance NMR- and UV/Vis-techniques can be
used for binding constants smaller than 104 M-1 and smaller than 105 M-1
respectively. Measurements that are based on fluorescence and isothermal titration
calorimetry (ITC) cover a broad range of binding constants from 102 M-1 to 108 M-1.
The reason for these ranges is justified by the different concentrations the different

3 – CONCEPT 19
methods require.60 The used concentration range should be set around the invers of
the expected binding constant.58,61
Due to the fact that the RGD-receptor is considered to carry chromophore
moieties UV/VIS-measurements seem to be highly versatile. Both binding sites, the
tweezer as well as the pyrrole contain chromophores nearby the positions of the
binding event. Through the association with the substrate the electronic environment
within the chromophore should change. As a result the properties of UV-absorption
should be influenced too. The change of this observable can be measured and used
for a further evaluation. The absorbance maxima of the pyrrole and the tweezer
moieties are around 300 nm and 280 nm respectively and will be most suitable as
observable. NMR measurements which follow shifts of specific proton signals
involved in the binding event might be useful as a second method. The ITC as the
third method records the heat change during the stepwise addition of the guest
molecule and could be used too, if the contribution of the enthalpy is high enough.
As a prerequisite of the binding studies the complex stoichiometry of different host-
guest-systems needs to be determined individually. Thereby a correct evaluation of
complexation constants is ensured. Determination of complexation stoichiometry
could occur via JOB-Plot measurements.62,63 One problem is, that binding constants
cannot be obtained directly from such measurements. Therefore non-linear analysis
needs to be done with the recorded experimental data. Subsequently results should
be reviewed with respect to generally accepted conclusions. In the following chapter
all results of syntheses and measurements of this project are discussed.


RESULTS AND DISCUSSION
4.1 Projected Synthesis Strategies and First Calculations
The development of artificial receptors reaches its borders in a precise prediction
of their binding affinities to substrates. Many different influences like solvent, salt
concentration, enthalpic and entropic effects determine the efficiency of formation of
a receptor substrate complex. Theoretical calculations can give good evidences for
syntheses thus they minimize energies of structures due to conformational changes
of the participating molecules. By comparison of the energies and the conformations
of differently formed complexes one can propose favored associations. This method
was used to get some qualitative hints for the receptor design. Thereby the focus
was set on calculated conformations of structures. Due to the charged residues of
the peptide sequence and the binding sites unlikely geometries were obtained
sometimes. These results were skipped and not presented in this work.
All calculations in this work were carried out with MacroModel 9.6. The structures
of molecules were imported with Maestro, the molecular modeling interface of
Schrödinger software. For comparability all minimizations were executed with
OPLS2005 force field, water as solvent and the conjugate gradient minimizer PRCG
as minimization method. The value for maximum iterations was set to 10,000. The
energies of the RGD-receptor and the substrate alone as well as in a complex were
calculated separately. The results of particular calculations were compared to receive
an objective quality of the receptor. Because of the low level of the calculations all
results were used only as hints for the following receptor syntheses. The structures of
the complexes were pre-orientated in order to prevent from local minima, which
might entrap some unlikely configuration. Therefore the RGD-recognition unit of the
peptide was positioned alongside the supposed binding sites of the receptor.
4

22 4 – RESULTS AND DISCUSSION
With the first calculations the focus was set on finding suitable linkers that provide
enough rigidity. Such rigid linker should prevent the receptor from an auto-
recognition. This is necessary because of the complementarity of the used binding
sites. Additionally the positions of both binding sites to each other are determined
by the length of the linker. Consequently the linker provides a preorganization of the
receptor. Due to the use of a tricarboxylic acid pyrrole building block reasonable
linker conjunctions would be an ester or amide group. Depending on the functional
group X-H the connection to the monophosphate tweezer 5 could be realized as
ether, ester, amine or amide (fig. 3-3).
Based on these ideas different linker molecules, shown in figure 4-1, were
designed and computational calculations were carried out. Inter alia a convergent
synthesis strategy was planned taking advantage of the click chemistry.
Figure 4-1. Prospective RGD-receptors with various linker molecules. Linker molecules C and D
are elongated homologs of A and B respectively.
The click chemistry provides orthogonality towards other functional groups with
respect to their reactivity. The functional groups of the receptor, which are necessary
for the recognition of the RGD-sequence, should not be influenced by reaction
conditions of a copper catalyzed variant of the Huisgen Cycloaddition.64 The
pronounced improvement is the separate synthesis of two building blocks, the
guanidinium and the aspartic acid binding sites. A comparable linear synthesis
strategy often suffers from a very low overall yield. But the efficiency of multi-step
synthesis sequence will be enhanced by a convergent approach instead. First
receptors were calculated separately without any substrate molecule to check their
affinity of auto-recognition. Calculations of receptors with the 4-(aminomethyl)
homologues of cinnamic acid and the 1,2,3-triazolyl (linker C and D) derivative

4 – RESULTS AND DISCUSSION 23
resulted in too many unfavored conformations (fig. 4-1). Due to the additional
methylene group the molecules showed too much flexibility and underwent some
self-aggregation. Initially the methylene group was considered to allow a further
adjustement of length so that the receptors with different linkers could fit selectively
to specific RGD-peptides.
In contrast the calculations of receptors with the linker molecules 4-azidoaniline
and 4-aminocinnamic acid (A and B) led to better results. Their structures and most
favored conformation in a complexe with the cyclic RGD-ligand 1a are illustrated in
figure 4-2. Especially their improved pre-orientation of the binding sites revealed
reasonably better conformations in complex with the penta-peptide 1a.
In a direct comparison of receptors 7 and 8 different favored orientations in
association with cyclo(-RGDfV-) 1a could be discovered. Receptor 8 with the
1,2,3-triazolylaniline linker B is more twisted than receptor 7 with the
4-aminocinnamic acid linker A. Position of the twist is highlighted in green in
schemes a and b (fig. 4-2). Although similar starting geometries were used for both
structures this remarkable change appeared.
Figure 4-2. Prospective RGD-receptors with two different linker moieties. Receptor 7 contains
4-aminocinnamon acid A (a) and receptor 8 comprises the 1,2,3-triazolylaniline linker B (b).
Pictures c and d reproduce results of calculations of receptors in complex with cyclic peptide 1a.
Pictures were obtained from MacroModel calculations.
The twist occurs along the binding of carbonyl C and pyrrole with a dihedral angle
of around 37° for receptor 8. Receptor 7 shows a twist of 7° only. Due to a longer
linker the distance between both binding sites gets larger in a flat receptor
geometry. Therefore this increased twist is necessary to form a stable complex with
7*1 8*1
7 8
a b
c d
π-cation interaction

24 4 – RESULTS AND DISCUSSION
the substrate. The different orientation and the twist of the receptor resulted in a loss
of π-cation interaction (dashed line) between the phenyl group of phenylalanine and
the guanidinium of the arginine (fig. 4-2d).
But this is only one of many others contributing intermolecular interactions.
According to the principles of Lehn enhanced recognition capability for biomimetic
receptors comes along with an increased contact area of the receptor and the
ligand.53 In both cases the RGD-receptors revealed conformations with a reasonable
contact area. In addition complex of receptor 8 was compared with a complex
structure obtained from crystallographic data of integrin αV 3 in association with
cyclic peptide 1b. These data were obtained from the RCSB protein data bank (pdb).
With the use of Maestro65 both complex structures were compared by their two
dimensional projection plot. This function reduces the three dimensions of the
examined volume to two dimensions. Of course this feature suffers from a lack of
information. But the striking advantage is an easier method to compare contact
areas of different complexes.
Figure 4-3. Two dimensional scheme of substrate cyclo(-RGDf-N{Me}V-) 1b in the binding
pocket of integrin αV 3 (a) was derived from crystal structure (pdb 1L5G).27 The binding site for
guanidinium residue is negatively charged due to two aspartic acids (D 150 and D 218). Binding
of carboxylic residue is mostly facilitated by metal ion (MN 4001). 2D-plot of cyclo(-RGDfV-) 1a
in the environment of the artificial RGD-receptor 8 (b) was derived from conformational
calculations with MacroModel. The black line indicates only unspecified interactions with the
artificial receptor in a distance range of ≤ 4 Å. The tool ligand interaction diagram of Maestro
is not able to identify charges of non-peptidic structures like pyrrole and tweezer moieties.65
In figure 4-3 the two dimensional plots of previous mentioned complexes are
visualized. Left side (a) shows the substrate peptide inside the binding pocket of
integrin αV 3. The guanidinium of the arginine residue is nicely buried in a cave that
a b

4 – RESULTS AND DISCUSSION 25
is negatively charged. The negatively charged environment results from two aspartic
acids (D 150 and D 218) of the integrin.
Outstandingly the salt bridge of aspartic acid D 218 contributes to a strong
complexation of the guanidinium residue. The aspartic acid of the RGD-triad is
mostly attracted by a metal ion-dependent adhesion site (MIDAS). In this case the
MIDAS is represented by a divalent manganese cation (Mn2+). This manganese cation
(MN 4001) originates from preparation method. During the crystallization process of
the extracellular segment it was inserted. But under physiological conditions Mn2+ is
replaced by Mg2+, if integrin is in the active mode. Although this might bring some
changes in association of RGD-substrate the following considerations are based on
the integrin structure containing Mn2+. Predominantly positively charged and polar
amino acids like arginine, serine and asparagine represent the rest of the binding
site.25 Some additional hydrophobic interactions of the phenylalanine of the cyclic
substrate with tyrosine (T 122) are present in this plot.
The second two dimensional plot (right side) shows the result obtained from the
calculation of the complex between the receptor 8 and the cyclic substrate 1a. By a
comparison of the two dimensional schemes (fig. 4-3) striking similarities could be
revealed. Both plots show a similar contact area between the substrate and the
respective receptor. Although the plot derived from the calculated structure reveals
unspecified interactions, the plotted contact area is lower or equal to a distance of
4 Å. Especially the functional groups aspartic acid and guanidinium of the RGD-
sequence are in an attractive intermolecular contact with the binding sites of the
receptor. Indeed the interactions do not seem to be equal to those of the crystal
structure but specific interactions like salt bridges or polar interactions are not
supported by the program Maestro for non-peptidic structures.
Figure 4-4. The ditopic RGD-receptor containing the 1,2,3-triazolylaniline linker was considered
after the evaluation of the theoretical calculations.
Consequently the shape of the binding pocket formed by the receptor is almost
similar to the shape of the integrin αV 3 and therefore results were used as starting
point for planning the syntheses strategy. In figure 4-4 the projected RGD-receptor is

26 4 – RESULTS AND DISCUSSION
shown. The positions R1 and R2 are considered for an attachment of further groups in
order to enhance the water-solubility of the receptor. At the position X different
linkage options are possible. Generally the connection between the tweezer and the
linker molecule can occur via oxygen or nitrogen atom which needed to be
introduced as a hydroxy or amin group respectively. The idea to attach solubility
enhancing groups to the linker molecule was dropped. The approach of a suitable
guest molecule might be restrained by these groups. Another option could be the
introduction of a second phosphate group beside the cavity of the tweezer. The
advantage of an additional phosphate at position X is discussed in section 3.3. The
synthesis of the artificial ditopic RGD-receptor started with the two building blocks,
the pyrrole and the tweezer. Because of the high versatility of click chemistry the
approach using 1,2,3-triazolylaniline linker was preferred (receptor 8, fig. 4-2 b).
4.2 Receptor Syntheses
4.2.1 Syntheses of Basic Building Blocks of the Tweezer
One challenging part of this receptor synthesis is the synthesis of an un-
symmetrical tweezer as it was shown in figure 3-3. The critical point is the synthesis
of a dissymmetrical tweezer at an advanced step of synthesis pathway.
If one compares the two possibilities of the functional groups next to the linker in
molecule 5b (fig. 3-4) it becomes clear, that a selectivity problem occurs for a central
molecule with two hydroxyl groups. Most reactions even protection or deprotection
of hydroxyl groups would have the same effect on both positions. A selective
reaction of one group or a selective attachment of a linker is not possible in an easy
way. Only through suitable reaction conditions the desired mono-functionalization
could be obtained.
An appropriate loophole could be the synthesis of un-symmetric tweezer core
part. In this case the central part will be designed with two distinguishable functional
groups. This slight change could be realized by a replacement of one hydroxyl by an
amino group for example. Nucleophilic reactions can be realized much easier with
amines than with alcohols for instance.66 This difference allows a selective protection
or further functionalization of the amino function for instance. Thus tweezer 9
(fig. 4-5) was considered carrying a p-aminophenol central part instead of a p-
hydroquinone.
The modification with respect to the overall shape of the receptor compared to
receptor 8 should be negligible. Therefore the property of complexation of RGD-

4 – RESULTS AND DISCUSSION 27
substrates should be similar. The synthesis of un-symmetric tweezer 9 was
deliberated in a comparable fashion to synthesis of standard dihydroxy tweezer but
with the use of N-chloro-p-benzoquinoneimine (13) instead of quinone.
Figure 4-5. Retro-synthesis scheme shows unsymmetric tweezer 9. The central part was
considered to be asymmetric thus using N-chloro-p-benzoquinoneimine 13 in the first Diels-
Alder-reaction step.
After twofold Diels-Alder reaction to the p-chloroimino hexahydro-
dimethanoantracen-one 12 the chloroimine should be converted into imine by
hydrolysis.67 Subsequent selective protection of the amine followed by tweezer
synthesis or vice versa can be performed.
Unfortunately the reaction of N-chloro-p-benzoquinoneimine and freshly distilled
cyclopentadiene was not successful. Neither the desired product nor starting
material could be detected in the tarlike mixture. Decomposition took place,
although the reaction conditions were kept very mild and the mixture was not
heated above 30 °C.
Figure 4-6. Retro-synthesis scheme shows the hydroquinone tweezer 14. Twofold Diels-Alder-
reaction of sidewall 10 with center part 15 followed by an oxidation step leads to the fully
aromatized tweezer.
Direct usage of quinoneimine was considered as well. However this reaction
already described in literature seems to be an unsuccessful underpinning. The
authors described that mostly unwieldy mixtures or cokelike mass were produced. As
a reason they assumed a polymerization process.68 Therefore the synthesis pathway
of a dicyclopentadienequinonimine (11) and an easy access to an un-symmetrical
9
10 10 11
12 13
14 10 10 15

28 4 – RESULTS AND DISCUSSION
tweezer was dropped again. Instead of tweezer 9 the synthesis of dihydroxy
tweezer 14 according to well-known synthesis protocol was executed.46
The synthesis route was processed via diacetyl protected precursor 15 (fig. 4-6).
Most of the steps were executed according to literature described procedures. In the
beginning of synthesis pathway the side-wall 10 and core part 15 were synthesized
separately. The central molecule was synthesized according to the literature
described procedure (fig. 4-7).46 Synthesis of the tweezers core part started with a
Diels-Alder reaction of p-benzoquinone and cyclopentadiene. Diketone 16 could be
obtained in moderate yield of 56 % due some side reactions of cyclopentadiene. The
purified diketone was oxidized with p-benzoquinone to benzoquinone 17
subsequently. Purification of quinone 17 occurred via column chromatography and
yielded 65 % of desired product.
In a second Diels-Alder reaction molecule 17 was transferred to dimethano-
anthracenedion 19a. The reaction was carried out with one equivalent of
cyclopentadiene and resulted in a 1:1 mixture of syn- (19a) and anti-product (20).
Due to the nonselective synthesis step theoretical yield of the favored syn-product
was halved. After purification of the mixture syn-dimethanoanthracenedion 19a was
obtained in a yield of 47 %.
Figure 4-7. Synthesis scheme shows the acetylated central building block 15 of the tweezer.
Obtained yields of the core were similar to literature documented ones.46
Separation of both products was carried out by repeated crystallization from
cyclohexane/ethyl acetate (1/1). Thereby fractions with enriched syn- and anti-
dimethanoanthracenedion were obtained. Purification was pursued until a
proportion of 35:1 or higher with respect to the syn-product could be realized. The
ratio was controlled via 1H NMR (fig 7-4). In a final acetylation step building block 15
was synthesized in a yield of 94 %. Therewith the synthesis of protected core
molecule could be executed in similar yields to the literature described synthesis.
15 18 19a
17 16

4 – RESULTS AND DISCUSSION 29
In contrast to the synthesis of core building block 15 some improvements could
be made for the synthesis of tweezer s sidewall 10 (fig. 4-8). In the initial reaction
step the yield could be doubled compared to reported yield.46 Therewith an increase
of more than 25 % could be achieved. Basically this improvement could be
accomplished through the change of the polymerization inhibitor. Phenothiazine was
used instead of previous used hydroquinone. This inhibitor was applied in catalytic
amounts in the first Diels-Alder reaction of maleic anhydride and freshly distilled
indene in a slight excess.69
By partial crystallization 1,4-methano-1,2,3,4-tetrahydronaphthalene-2,3-
dicarbonacid anhydride (20) was obtained in a good purity. Even further purification
for the next reaction step was not necessary. The following reduction to the tetra-
hydronaphthalene diol 21 was executed directly according to literature described
procedure.70 Thus the described tweezer synthesis was shortened by two
intermediate steps. Those proceeded via opening of anhydride to the di-ester 24
with a consecutive isomerization of the cis-tetrahydronaphthalene to the thermo-
dynamically favored trans-tetrahydronaphthalene 25 (fig. 4-8, right side).
Figure 4-8. Newly investigated synthesis of tweezer s sidewall is shown on left side. Hitherto
described synthesis pathway is shown at the right side with dashed arrows. The yields of the
previous trail are underlined.46
A subsequent reduction to trans-diol 26 followed by a transformation to the
trans-dichloride 27 and a final elimination to diene 10 is described in this synthesis
protocol.46 The overall yield could be increased from 15 % to almost 40 % based on
24 20
26 27
25 10
22
21

30 4 – RESULTS AND DISCUSSION
these changes. In the newly developed synthesis pathway the cis-configuration of
the anhydride 20 is retained until the elimination step to diene 10. Tedious
purification methods with one exception after the chlorination step were not
necessary. Opening of the anhydride 20 with subsequent reduction to cis-diol 21
was carried out in a one pot synthesis according to reported reduction reaction of
the di-ester 25.46
These shortening allowed a faster proceeding, so that the cis-diol 21 could be
obtained in two steps less compared to trans-diol 26. One of the most critical steps
in this reaction scheme was the transformation from the diol 21 to the dichloro-
compound 22. In various approaches different results with respect to the yield were
obtained. At first a difference in the reactivity of nucleophilic substitution at the cis-
diol compared to trans-diol was considered. But in analogous reaction with the
trans-diol 26 similar problems appeared. Finally it turned out, that different batches
of commercially purchased triphenylphosphine dichloride showed significant
changes in reactivity. Some batches dropped down yields dramatically, so that only
starting material or single chlorinated product could be isolated. Best results of the
chlorination to compound 22 varied from 60 to 85 % yield. The highest obtained
yield was comparable to the reported yield.46
Another circumstance that diminished the yield arose from some practical issues
during the workup process. The huge amount of byproduct triphenylphosphine
oxide was not easy to remove. Separation problems originated from an excessive use
of three equivalents of triphenylphosphine chloride in addition with good solubility
of its oxide in the product oil. Dichloride 22 was obtained as colorless oil, which
served as a proper solvent for triphenylphosphine oxide. Even filtration of a solution
of 22 in DCM over silica did not result in an efficient separation of the favorite
product from its side-product. The reason again is the ability of dichloride 22 to act
as an eluent for triphenylphosphine oxide. To solve this separation problem a
successive precipitation of the oxide was required. By a stepwise removal of DCM
from the solution precipitation could be executed repeatedly. The major amount of
triphenylphosphine oxide could be removed by this procedure. For a complete
removal of this byproduct repeated normal phase chromatography were carried out
afterwards. A yield of 85 % could be obtained as best result.
Final elimination to diene 10 revealed the problem of an incomplete elimination.
Partially elimination of a single chloride group took place. Again it was considered
that the different stereoisomer was responsible for this unpopular result. The
incomplete reaction resulted in mixtures of starting material, single elimination and
the desired product. Even longer reaction times or slight heating of the mixture did
not improve the elimination. To overcome this problem of incomplete reaction some

4 – RESULTS AND DISCUSSION 31
modifications in reaction auxiliary agents were tried. Potassium tert-butoxide, a
stronger base, was used instead of potassium hydroxide according to similar reaction
described in literature.71 But elimination of hydrochloric acid on both positions could
not be improved unless 18-crown-6 ether in combination with a catalytic amount of
potassium iodide was used. Finally a mixture of potassium hydroxide, 18-crown-6
ether and potassium iodide in catalytic amounts led to a full conversion to diene 10
at room temperature. The functional role of potassium iodide might be an inter-
halogen exchange. Comparable to a Finkelstein reaction the iodide could attack the
dichloride 22 via SN2-mechanism. Subsequently a faster cleavage of iodide would
speed up the elimination because of iodide being a better leaving group than
chloride.66 The obtained product was purified by column chromatography in order to
obtain a salt-free product.
Hence the bicyclic diene 10 could be obtained in a yield of 39 % over all four
steps. The new developed route is much more economical compared to the
published synthesis route with a total yield of 15 % over six steps.
4.2.2 Syntheses of Un-Symmetrical Tweezers
The last two Diels-Alder reactions to build up the tweezer backbone were carried
out in a similar fashion to published protocol.46 During this twofold cyclisation
reaction one acetyl group protected core 15 and two diene sidewalls 10 form the
tweezer precursor 28.
Figure 4-9. Reaction scheme of hydroquinone tweezer 14.46 A subsequent DDQ-oxidation of
Diels-Alder product 28 lead to the fully aromatic diacetyl tweezer 29. Final reductive removal of
acetyl groups result in hydroquinone tweezer 14.
10 10 15
28
14 29

32 4 – RESULTS AND DISCUSSION
One important change was the use of a heavy-walled Schlenk tube with a screw
plug as reaction vessel instead of a sealed glass tube for one time usage. The
advantage was that the reaction could be carried out under Argon according to
Schlenck technique and monitored by TLC and HPLC. Even samples for reaction
monitoring were taken under inert gas conditions. Unfortunately the yield of tweezer
precursor 28 could not be improved furthermore (fig. 4-9).
After purification via crystallization 61 % of desired product could be obtained.
Therewith the achieved yield was comparable to the reported one of 67 %.72 After
subsequent oxidation with an excess of DDQ the acetyl protected tweezer 29 could
be obtained. After purification via column chromatography the diacetyl tweezer 29
with an entire aromatic backbone was obtained in 44 % yield.73 Further byproducts
were not determined. Compared to published results (71 %)72 the yield of this
oxidation step was nearly decreased by half. Based on separation problems from
oxidation agents DDQ and DDB repeated column chromatography was mandatory.
As a consequence the yield was reduced compared to reported results.
Figure 4-10. Synthesis route to monophosphate tweezer 5a developed by Gersthagen.47,72
To obtain an un-symmetrical tweezer 5a shown in figure 3-3 several approaches
are conceivable. One possibility is a partly removal of one acetyl group to obtain a
single protected tweezer. This procedure was developed by Gersthagen47,72 and
synthesis of tweezer 5a was carried out via four reaction steps (fig. 4-10). The
reaction sequence consists of an initial deprotection reaction to the mono acetyl
tweezer followed by a phosphorylation to the intermediate dimethyl phosphate
tweezer and finally two deprotection steps of acetyl and methyl groups respectively.
29
5a

4 – RESULTS AND DISCUSSION 33
The overall yield of the full sequence is reported with 79 % and seemed to be a
promising pathway.
But unfortunately tries to carry out a selective deprotection of one acetyl group
failed. Mostly mixtures of mono and double de-acetylated product were obtained
and resulted in low yields of the mono-functionalized tweezer.
Due to this dilemma another approach via a fully de-protected hydroquinone
tweezer 14 was tested. A direct cleavage of both acetyl groups was performed with
10 eq. of LiAlH4 in THF solution (fig. 4-9). The unprotected molecule 14 could be
obtained in quantitative yield nearly. Thereby the overall yield of tweezer 14 could be
increased slightly from 8 to 10 % with respect to sidewall synthesis.46 Mainly this
could be achieved by shortening of two steps in the tweezer s sidewall synthesis. The
de-symmetrizing step was shifted to the next reaction step.
As it was mentioned before different approaches to an un-symmetrical mono
phosphate tweezer 5a are conceivable. Due to the orthogonality and versatility
provided by the click chemistry synthesis strategy was modified with regard to the
method Gersthagen presented. Insertion of the phosphate group should be
subordinated with respect to the linker attachment. This order could prevent
undesirable side-reactions of the phosphate group in subsequent reaction steps.
Therefore the attachment of an alkyne function at the tweezer s central position was considered. Different attempts to esterify the dihydroxy tweezer 14 led to
mixtures containing mostly starting material. Even the usage of coupling agents like
HATU or activated carboxyl functions like acid chlorides were attempted. Unluckily
none of the desired esters (A-D, fig. 4-1) could be obtained in a satisfying amount.
This result led to the assumption that access to the hydroxyl positions of the tweezer
is sterically hindered. But also reactions with sterically less hindered molecules, e.g.
with the truncated tweezer 19b, did not lead to a positive result either (fig. 4-11). The
synthesis of ester 30a could not be carried out satisfyingly. In this case desired esters
suffered from low stability and decomposition took place during work-up and
purification processes.
Stability problems of ester functions at the tweezer were already reported by
Gersthagen.72 Instead of the esterification reaction an analogous etherification via
Williamson ether synthesis was considered to connect the tweezer with the linker
molecule. For that purpose preliminary test reactions with the hydroquinone 19b, the
tautomeric form of molecule 19a, were executed (fig. 4-11). The reaction was carried
out in a highly diluted acetone solution of 19b. To the alkaline solution 0.8 eq. of
propargyl bromide were added dropwise. The reaction mixture was heated for
24 hours and yielded mono-, di-ethers and diol.

34 4 – RESULTS AND DISCUSSION
Through a well-considered reaction management the desired core alkyne 30b
could be obtained in a yield of approximately 50 %. Additionally separation by
chromatography could be realized easily.
Figure 4-11. Synthesis schemes for esterification and etherification at hydroxyl group of the
truncated tweezer 19b. The mono-alkyne of the core 30b could be obtained through a
Williamson ether synthesis.
Unconverted starting material (approx. 10 %) could be recovered by
chromatography. A transfer of developed reaction conditions to hydroquinone
tweezer 14 led to lower results as expected (fig. 4-12). The corresponding mono-
alkyne tweezer 31 could be synthesized in a yield of 15 %. Separation from di-alkyne
tweezer and diol-tweezer 14 could be achieved via chromatography. The ratio of bis-
alkyne to mono-alkyne changed dramatically from 1/3 for the truncated tweezer 19b
to 2/1 for hydroquinone tweezer 14. The explanation for this change might be a
solubility problem of the tweezer 14 which resulted in a slight suspension. Therefore
the concentration of propargyl bromide was slightly higher with respect to dispensed
amount of tweezer. In addition the solubility of mono-alkyne tweezer 31 might be
considerably better compared to the hydroquinone tweezer 14 so that a second
alkynylation could occur easily.
Figure 4-12. Synthesis schemes of un-symmetrical tweezer building block 31 for click chemistry.
The mono-alkyne tweezer 31 could be obtained through a Williamson ether synthesis.
14
19a
19b
30a
31
30b

4 – RESULTS AND DISCUSSION 35
This reaction nicely showed the difference in reactivity of full versus truncated
tweezer. Although the same quantity of equivalents was used, significantly less
hydroquinone tweezer 14 was converted to desired mono-alkyne 31. A
supplementary effect might be the sterically unfavored position of the hydroxyl
groups towards electrophiles. It was assumed that the hydroxyl groups are more
shielded by the extended aromatic skeleton in full tweezer 14 compared to the
truncated tweezer 19b.
Nevertheless the newly discovered access towards unsymmetrical tweezers
established a ubiquitous building block for further receptor synthesis. Although the
yield of mono-alkyne 31 was pretty low (15 %) unconverted starting material 14
could be regained by chromatography and re-used. Supplementary improvement in
reaction management might lead to better ratio of mono-alkyne to bis-alkyne. The
big advantage of the mono-alkyne tweezer is its versatility in advanced synthesis
route with respect to the orthogonality of click chemistry.
4.2.3 Syntheses of Azido Guanidiniocarbonyl Pyrroles
In figure 4-13 three different azido guanidiniocarbonyl pyrrole building blocks are
shown. The guanidiniocarbonyl pyrrole building block 32 is part of receptor 8 used in
the previous calculations (fig. 4-2). In this molecule peripheral positions do not
facilitate further attaching of solubility enhancing groups.
Figure 4-13. Different pyrrole building blocks coupled with linker molecule 4 azido aniline.
Guanidiniocarbonyl pyrrole 34 carries additional ethylene diamine in periphery to enhance
solubility problems.
Therefore the guanidiniocarbonyl pyrrole 33 was considered as it enables addition
of further solubility enhancing groups. In azido guanidiniocarbonyl pyrrole 34 the
attachment of an ethylene diamine as an example is given. Due to the possibility of
an additional positive charge the water solubility could be increased. This fact
becomes very important as receptors should work under physiological conditions.
On the other hand sterically overcrowded groups need to be avoided in order to
provide substrate peptides an excellent access to their host. Based on these
32 33 34

36 4 – RESULTS AND DISCUSSION
considerations syntheses of the pyrrole building blocks shown in figure 4-13 were
carried out corresponding to literature protocols.54,74 Only minor changes in work-up
and purification processes led to better purities of the desired product in some
reactions. By using the alkyne function at the tweezer the azide function needs to be
attached at the pyrrole moiety. Therefore the commercially available 4-azido aniline
was used to prepare pyrroles 32 to 34. The use of an azide as an orthogonal
protection group to most other reactions expanded the scope of synthesis strategies.
The desired click reaction could occur at the final synthesis step.
Initially the synthesis of pyrrole building block 33 was considered to have the
opportunity to add further solubility enhancing groups at the backbone of the
guanidiniocarbonyl pyrrole, if necessary. Starting from the fully orthogonal protected
pyrrole 35 preparation of the azido-pyrrole 37 was carried out (fig. 4-14). Preliminary
quantitative deprotection of tertiary butyl ester under standard reaction conditions
resulted in the pyrrole 36.
Figure 4-14. Synthesis pathways of pyrroles 37 and 39 starting from fully orthogonal protected
Cbz-guanidinocarbonyl pyrrole 35.
The generated acid function was attached to azide carrying linker molecule. The
following formation of amide bonding with 4-azido aniline was evaluated under
different reaction conditions due to problems in obtaining the desired product.
Therefore different coupling reagents and reaction parameters were tested to obtain
at least moderate yields and feasible purities. The coupling reagents HATU, Cl-HOBt
35 36
37
38
39
4 – RESULTS AND DISCUSSION 37
and PyBOP were tried with variation of reaction times and temperature. Reaction
progress was controlled via TLC. Mostly mixtures of starting material, product and
some indefinite side products were obtained. Final purification via column
chromatography of those mixtures led to yields of around 20-30 %. Purification of
product was not easy due to many different side products with similar retention time.
Even purified material still showed impurities again after TLC check. The reaction
time could be identified as a critical parameter with respect to yield. The longer the
reaction time was the more side-product was generated. The heat-up phases were
considered as a key point to increase the yield. Therefore reaction management was
changed and coupling reaction was executed under microwave conditions. The
phases of heating the mixtures are much faster compared to conventional ones with
oil bath or heating mantle.75 Therefore the necessary reaction temperature should be
reached faster.
The amide formation was carried out via PyBOB as a coupling reagent. With
PyBOP best results with respect to the yield could be achieved. Even in conventional
reaction management alike in the microwave-assisted coupling reaction. Through
reaction control by TLC heat phases could be reduced to a minimum of time. Even
cooldown phases were kept as short as possible due to an additional cooling by air
stream. During the evaluation of the best conditions the periods of heating did not
last longer than 45 min. The temperature controlled by an infrared sensor, was not
allowed to exceed above 81 °C. After each heating period the mixture was cooled
down with a cooled air stream and TLC control monitored reaction progress. The fast
cooling process was used to prevent the product from further decomposition. As a
result of changing to microwave conditions the yield of pyrrole 37 increased from
32 % to 52 %. Thereby the yield could be nearly doubled and the amount of
unwanted byproducts decreased drastically compared to previous reactions carried
out under conventional heating.
Reviewing the purity of azido guanidinocarbonyl pyrrole 37, analytical HPLC
revealed impurities which should have been removed completely by previous
purification. The only reason for this phenomenon could be a degradation process of
desired product. And indeed decomposition of a purified sample could be proofed
with the help of HPLC. A freshly prepared sample of pyrrole 37 with an initial purity
of 93 % started to decompose within hours remarkably. A stability check made with
HPLC revealed that by keeping samples at room temperature decomposition took
place. In a re-check of a freshly prepared sample more than 90 % of initial substance
was decomposed after 10 days.

38 4 – RESULTS AND DISCUSSION
The protected guanidinocarbonyl pyrrole 37 was dissolved in water/methanol
(1/1) and stored in a closed HPLC vial at room temperature. Chromatograms of
freshly prepared and 10 days old sample are reviewed below (fig. 4-15).
Figure 4-15. HPLC-chromatograms of Cbz-protected 4-azido guanidinocarbonyl pyrrole 37 were
prepared under reversed phase conditions. Left side (a) shows freshly prepared sample of
pyrrole 37 with negligible amounts of impurities. Right side (b) reveals a crude mixture after
keeping the sample for 10 days.
The chromatogram at the right side shows a crude mixture of different substances.
This mixture was obtained after storing the sample for 10 days at room temperature.
No further analyzation of this mixture was carried out. Presumably the newly
generated impurities originated from derivatization of the azido group. The time-
dependent degradation explained synthesis problems of previously described
coupling reaction. Trying to raise the yield over 30 % by conventional heating did not
lead to successful results due to long reaction times. Through the use of microwave
assistance the heat dependent impact on degradation of product could be
minimized. The degradation of already purified compound occurred during the
solvent evaporation process due to moderate heating probably.
Time dependent 1H NMR-measurements in contrast revealed, that substance 37
dissolved in DMSO-d6 did not show any disintegration for days. But unluckily most
of following reactions could not be executed in such inert medium. In consequence
of the fast degradation of azido pyrrole 37 all following reactions needed to be
faster. Even the heat impact needed to be minimized. To pursue the aim of a
convergent synthesis strategy, the triazole formation needs to be last synthesis step
of the azido guanidiniocarbonyle pyrrole building block 33. Removal of Cbz-
protection group of pyrrole 37 was tried under various reaction conditions but
without success (fig. 4-16).76
a b

4 – RESULTS AND DISCUSSION 39
The most critical point was a selective deprotection at a reasonable time. If the
reaction conditions were too mild and reaction time was too short, generally no
remarkable conversion took place.
Figure 4-16. Cleavage of Cbz-group of guanidinocarbonyl pyrrole 37 by different conditions did
not lead to free guanidine function while keeping an intact azide group.
Longer reaction times under reductive conditions77 led to typical decomposition
of starting material. Even strong acidic conditions usually used to cleave benzyl
carbamates led to formation of an amine primarly.78 Because all attempts of cleaving
the Cbz-group were unsuccessful, protected pyrrole 37 was used for cycloaddition
with tweezer alkyne. Results of receptor synthesis are described in chapter 4.3.4.
Additionally synthesis of pyrrole building block 34 with an ethylene diamine in the
periphery was tried for improved water solubility. Therefore the methyl ester of fully
protected guanidinocarbonyl pyrrole 35 was cleaved (fig. 4-14). The cleavage was
carried out in aqueous THF solution containing 3 eq LiOH and the product was
obtained in a quantitative yield. In an additional approach trimethyltin hydroxide was
used to yield 96 % of desired product.79 Both procedures required final column
chromatography to obtain salt-free substance. The introduction of mono-protected
ethylene diamine was carried out under standard amide coupling conditions with
PyBOP as coupling reagent.80,81 The coupling product 38 could be obtained in a yield
of 87 %. A subsequent cleavage of the tertiary butyl ester yielded guanidinocarbonyl
pyrrole with a free acid group in position 5 quantitatively (fig. 4-14).
The successional microwave-assisted coupling of 4–azidoaniline under previous
described conditions revealed the double Cbz-protected azido guanidinocarbonyl
pyrrole 39 in a poor yield of 18 % after purification via column chromatography.
Similarly to the azido guanidinocarbonyl pyrrole 37, pyrrole building block 39
contained many unidentified byproducts and a rapid decomposition appeared again.
The time dependent decay of purified substance in solution was monitored by TLC,
which reasonably explained the decreased yield. To circumvent problems in cleavage
of the two Cbz functions pyrrole 39 was not used for further receptor synthesis.
37 33

40 4 – RESULTS AND DISCUSSION
Another approach was pursued to overcome the aforementioned stability
problems of Cbz-protected azido guanidinocarbonyl pyrroles 37 and 39. Therefore a
new synthesis strategy was considered. The Cbz-protection group should be
exchanged with a BOC-group at the guanidine moiety. Cleavage of tertiary butyl
carbamate occur under acidic conditions typically.76 Slightly acidic conditions should
result in a free guanidinium moiety in moderate reaction times. For that purpose the
smaller pyrrole building block 40 was used and coupled with 4-azidoaniline
(fig. 4-17).
Figure 4-17. Alternative synthesis pathway of the azido pyrrole 32.
The reaction was carried out with PyBOP at room temperature and yielded only
23 % of the BOC-protected azido pyrrole 41. A further improvement of the reaction
was not attempted due problems in cleaving the BOC-protection group later on. The
idea that the BOC-group should be cleaved more easily and much faster than the
Cbz-group was a false conclusion. Although different deprotection methods were
used the t-butyl carbamate could not be cleaved. Instead of desired reaction starting
material was reobtained or molecule 41 again started to decompose. This particular
BOC protection group was resistant against acidic solutions like TFA in DCM at room
temperature. Even cleavage at moderate heating up to 40 °C was tried but the BOC
group could not be removed either. In another approach stronger cleavage
conditions were tried. Freshly generated HBr-gas or HCl-gas in DCM solution was
used in different approaches as cleavage conditions. Under these conditions
decomposition of azido pyrrole 41 appeared and therefore no further attempts in
deprotection of the BOC group were made.
40 41
32 42
43

4 – RESULTS AND DISCUSSION 41
A new synthesis route starting from pyrrole building block 40 was deliberated to
circumvent described deprotection problems of protected azido guanidinocarbonyl
pyrrole 41. Under consideration of the stability problems of pyrrole 37 the insertion
of an azide group was planned in a progressed synthesis. Therewith no unexpected
side reactions could occur during deprotection step. In the last synthesis step of the
receptor the obtained pyrrole building block 32 should be used.
Starting from the BOC protected guanidinocarbonyl pyrrole 40 the aromatic linker
4-iodo aniline was coupled at free acid function by usual amide formation (fig 4-17).
The reaction could be carried out at room temperature with the coupling reagent Cl-
HOBt in a moderate yield of 45 %. In a subsequent step the BOC-protection of the
guanidine moiety was removed before transformation of the iodo-aryl into the
azido-aryl residue was executed. In a solution of TFA in DCM the desired iodo-aryl
guanidiniocarbonyl pyrrole 43 was obtained quantitatively.
The final synthesis step of pyrrole building block 32 was performed under copper
catalysis. This reaction is not affected by free amines or guanidine moieties. A
positive influence of previous mentioned functional groups is a stabilizing effect of
the catalytic active species Cu(I).82,83
The azido guanidiniocarbonyl pyrrole 32 was synthesized by a copper catalyzed
nucleophilic aromatic substitution (SNAr-) reaction. Pyrrole building block 32 could
be obtained in a yield of 80 % after its purification from coupling salts. This Ullmann-
type coupling reaction is described by several proposed mechanisms found in the
literature.83 The synthesis of 4-azido aniline starting from 4-iodo aniline was carried
out successfully according to a reported procedure.84 This became necessary due to
a supply shortfall of the commercially available compound 4-azido aniline
hydrochloride. In the previous synthesis pathway of the 1st generation receptor the
synthesized 4-azido aniline hydrochloride was used. A common side reaction, the
copper promoted azide reduction to amines, which could occur under specific
reaction conditions, could be excluded. The reason is that usually electron deficient
aromatics are affected by this phenomenon.85,86
Luckily the reaction conditions could be transferred to the iodo-aryl
guanidiniocarbonyl pyrrole 43. Thus the insertion of an azide function occurred in
the last step of pyrrole building block synthesis in line with a convergent synthesis
strategy. The obtained guanidiniocarbonyl pyrrole 32 was used in 2nd generation
receptor synthesis, which is described in chapter 4.3.5.

42 4 – RESULTS AND DISCUSSION
4.2.4 Synthesis of the 1st Generation RGD-Receptor
The RGD-receptor of the 1st generation was synthesized by a copper catalyzed
1,3-dipolar cycloaddition between the mono-alkyne tweezer 31 and the Cbz-
protected guanidinocarbonyl pyrrole 37. (fig. 4-18) The copper (I) catalyzed reaction
was set up according to described procedure in literature.87 Because of a fast
conversion of the reagents to the desired triazole 44 no further heating of the
reaction mixture was necessary. Reaction monitoring was carried out by TLC and the
end of reaction was indicated after one hour of stirring. Purification was executed via
filtration of an ethyl acetate solution over silica. The triazole was obtained in a yield
of 95 % and purity was checked via normal phase chromatography.
Figure 4-18. Reaction scheme of the precursor 45 of the 1st generation RGD-receptor. A full
convergent synthesis strategy was not possible due to problems of Cbz-deprotection of
pyrrole 37.
All 1H NMR signals could be assigned with exception of the nitrogen attached
protons. With the help of two dimensional NMR experiments like HMBC and HSQC a
distinct assignment could be made. Some proton signals showed overlaying of each
other but still they were sharp and distinguishable, so that the molecule could be
31
44
37
45

4 – RESULTS AND DISCUSSION 43
identified clearly. A purity check via normal phase HPLC revealed a purity of 99 % at
different wavelengths. A subsequent phosphorylation of cyclisation product 44 was
carried out similarly to the synthesis described for the tweezer diphosphate.88 The
phosphorylation took place at the free hydroxyl group at the tweezer central position
and yielded 54 % of the purified compound 45 (fig. 4-18).
The purification was done by a liquid-liquid extraction with dichloromethane and
diethyl ether. Unfortunately some precipitate containing partly product occurred
during workup process. Further purification of the precipitate could not be executed
satisfyingly. By 1H NMR and mass analysis of the precipitate the amount of desired
product was estimated to be around 20 %. Nevertheless receptor synthesis was
continued with the purified portion. A full characterization of phosphorylated
precursor 45 turned out to be challenging due to peak broadening in the 1H NMR
spectrum.
Through the use of hetero single quantum correlation spectroscopy (HSQC) and in
comparison with precursor 44 the assignment of the 1H NMR-spectrum could be
done properly. In figure 4-19 aromatic regions and methylene groups in
neighborhood of phenyl and triazole groups of both molecules 44 and 45 are
displayed.
Figure 4-19. Aromatic region (a-c) of 1H NMR of receptor precursors 44 (black) and 45 (red) on
the left-hand side revealed clearly a change in peak widths. The upfield region of the 1H NMR
spectra show the methylene groups at 5.24 ppm (d) and at 5.04 ppm (e) of the Cbz-protection
group (d) and of the triazole (e) respectively.
Both 1H NMR-spectra were measured in DMSO as solvent, so that the signals
occurred at comparable positions. Signals of the precursor molecule 44 (black
spectrum) appeared clearly. Even the signals of methylene groups exhibit a
symmetric shape. But after the phosphorylation reaction was carried out all signals
become more diffuse. The red spectrum obtained from the Cbz-protected
receptor 45 show a typical peak broadening as it appears due to aggregation. The
signals of the Cbz-protection group in the aromatic region at 7.40 ppm (a) and at
5.24 ppm (d) for the methylene group showed the most significant effect
Methylene signals Aromatic region
d e b a c

44 4 – RESULTS AND DISCUSSION
interestingly. These signals became indistinct so that they nearly disappeared in the
noise.
Even the symmetrical shape of triazole methylene group (e) is lost after the phos-
phorylation. All these changes presumably result from partial intermolecular
interactions which have a crucial influence on multiplicity and chemical shifts of
signals. With the deprotection of guanidine function intermolecular interaction
became more important, which was fortified by a further peak broadening in
phosphorus NMR.
The 31P NMR was recorded in the proton decoupled mode. Therefore only a
singlet peak was expected due to a single phosphate group within the molecule. In
figure 4-20 the spectrum of compound 45 (left side) shows a narrow peak
at -1.03 ppm and a very broad peak at -5.05 ppm. Initially it was assumed that the
origin of the broad peak is caused by some residual phosphorylation side product.
But in comparison with 31P NMR of the RGD-receptor 46 it turned out to be an
additional signal of the same compound.
Figure 4-20. 31P NMR spectra of compounds 45 (left) and 46 (right) reveal a shift in the peak
proportion. The proportion of peaks A and B became inverse after the deprotection of the
guanidine function. This shift indicated some self-aggregation of receptor 46.
In principle an effect caused by different concentrations could be estimated. But
the solutions of both compounds were prepared in the similar concentration range
of. The CBZ-protected compound 45 was measured in a concentration of around
4.20 mM whereas the concentration of the DMSO solution of the RGD-receptor 46
was lower (3.00 mM). In comparison the concentration of compound 46 was a bit
lower than of precursor 45. Therefore the beginning of a self-aggregation process
was considered. But this will be discussed later in detail. The final Cbz-deprotection
of the guanidine function was executed in a THF-solution in the presence of Pd/C
under hydrogen atmosphere and yielded 83 % of receptor 46 (fig. 4-21). A TLC
control could not be carried out due to solubility problems.
A
B
A
B

4 – RESULTS AND DISCUSSION 45
Figure 4-21. Synthesis pathway of 1st generation receptor 46. Cbz-deprotection was carried out
in the last reaction due to previous mentioned problems.
The synthesized compound 46 exhibited extremely bad water solubility. Especially
no proper eluent could be found to carry out either normal or reversed phase
chromatography. The complete conversion to the final product could be estimated
only. Via TLC control no shifts of any substance could be found after the cleavage.
The characterization via 1H NMR became even more complicated because of an
extreme peak broadening compared to compound 45. The 31P NMR spectrum
(fig. 4-20) shows exemplarily the broadening. Due to this broadening a superposition
of signals occurred, which made a distinct assignment impossible.
Figure 4-22. 31P NMR of compounds 46 at room temperature (left side) and 90 °C (right side).
Proportion of peaks A and B became inverse after deprotection of guanidine function.
But interestingly the 31P NMR spectra at different temperatures of compound 46
revealed a change in the proportions of the sharp signal A and the broadened signal
B (fig. 4-22). The temperature dependent NMR experiments of receptor 46 were
45
46
A
B
A
B

46 4 – RESULTS AND DISCUSSION
carried out at room temperature (left side) and at 90 °C (right side) respectively. Peak
B decreased significantly compared to peak A. The integrals exhibit nearly an
inversion. The signal ratio A/B changed in favor of signal A from 1:3 to 2:1. The
hypothesis is that the deprotection of the guanidine function enabled the molecule
to carry a positive charge and therefore facilitated the molecule to form aggregates
with the complementary phosphate group. Most interestingly signal B reveals a
lower broadening compared to the room temperature spectrum.
This investigation confirmed the hypothesis that compound 46 is able to form
aggregates. Even the solubility of the final RGD-receptor in most solvents was too
low for any further analysis. DMSO turned out to be the best solvent for molecule 46.
The low solubility in most solvents might be a result of the affinity to undergo self-
aggregation. To obtain at least suitable mass spectra from molecule 46 aqueous
DMSO solutions with a content of at least 10 % DMSO were necessary to detect the
molecule via ESI method. Especially in pure water receptor 46 was nearly insoluble.
All other solvent mixtures with lower DMSO content resulted in suspensions even at
a µM concentration range. To obtain a proper solution for mass spectrometry a
50 µM DMSO-d6 stock solution was prepared and diluted in the ratio 1 to 10 with
methanol. The molecule could be detected as single charged and double charged
ion in negative ionization mode.
For further measurements like UV-experiments or AFM-measurements some
previous solubility checks were done. A feasible solution of Water/DMSO mixtures
were obtained from pure DMSO stock solutions. Thereby the content of DMSO could
be minimized to 10 %. Further measurements and binding studies of receptor 46 are
described in chapter 4.3.2. Facing the problem of low water solubility of first
generation RGD-receptor synthesis of receptor with enhanced water solubility was
deliberated. The synthesis of an improved RGD-receptor is described in the following
chapter.
4.2.5 Synthesis of the 2nd Generation RGD-Receptor
Additional water solubility enhancing groups at key-positions for an improved RGD-receptor were considered. The reduced solubility of receptor 46 in aqueous
media is mainly caused by the extended aromatic skeleton of the tweezer. One
phosphate group in the vicinity is obviously not enough for compensation. Even the
linker molecule, containing a triazole and a benzene ring did not provide any
improvement of water solubility.

4 – RESULTS AND DISCUSSION 47
Figure 4-23. Suitable positions for an introduction of a solubility enhancing group are marked in
blue. The region of the aromatic linker (beige) needs to remain unsubstituted to avoid any steric
hindrance for substrates.
But these unsubstituted aromatics are necessary to prevent intramolecular self-
recognition. Any further addition of sterically demanding groups to prevent self-
recognition of the binding motif would decrease the ability to recognize RGD-
substrates probably. Calculations of substituted aromatics showed indeed a negative
influence on the recognition potential, but are not reported in this work. Therefore
only the positions highlighted in blue were considered for a reasonable attachment
of an additional group (fig. 4-23). A supplementary functional group at the periphery
of the pyrrole building block is discussed in chapter 4.3.3. Because of stability
problems with azide carrying pyrrole building blocks, the focus was set to the
tweezer moiety. Here the bay positions of the tweezer offer suitable possibilities for
an insertion of solvent enhancing groups.
As a suitable functional group a second phosphate group was considered. The
addition of a second phosphate group in the vicinity to the tweezer skeleton might
solve solubility problems as bisphosphonate and bisphosphate tweezers show an
inherent better water solubility.46,89 Furthermore a tweezer moiety containing two
phosphate groups might be more attractive to the guanidine residue of arginine. The
two most promising positions are right at the central part of the tweezer. Although
an additional phosphate attached to the first one like in a pyrophosphate could be
obtained via phosphoroimidazolides,90 the insertion of the second phosphate
between aromatic linker and tweezer was favored. The synthesis scheme of an un-
symmetrical diphosphate 50 is shown in figure 4-24.
Two different synthesis strategies were developed. As a first idea a synthesis
deduced from the normal diphosphate tweezer should lead to the diphosphate
tweezer mono-alkyne. The insertion of the alkyne function should occur during the
quenching process of the bis(phohoroxydichloride) tweezer 48 (fig. 4-24). The
addition of propargyl alcohol to a highly diluted solution of tweezer 48 is important.

48 4 – RESULTS AND DISCUSSION
Therewith a multiple substitution at the tweezer should be suppressed mostly.
Subsequently the diphosphate mono-alkyne tweezer 50 should be generated by a
hydrolysis of the residual chlorides.
Figure 4-24. The left side shows the analogous pathway of described synthesis protocol.91
Proposed one-pot synthesis of the mono-alkyne diphosphate tweezer 50 is shown on the right.
The second pathway takes advantage of a selective mono esterification with
trichloroacetonitrile as an activating agent (fig. 4-24, left side). The phosphate ester
synthesis is described with a monophosphate compound under microwave
conditions.91 Compared to the reported synthesis the pathway via the diphosphate
tweezer 47 would suffer from the similar problem of a multiple functionalization.
A supplementary esterification of the second phosphate could not be excluded.
After some test reactions in collaboration with Gersthagen and Schrader on
diphosphate aryls this method was skipped due to problems with selectivity of mono
functionalization and purification problems. The previous reaction pathway, shown
on the right side in figure 4-24, was pursued instead. Therefore the pathway was
tried on the truncated tweezer 19b (fig. 4-25). The results should be used to check
the efficiency of the proposed one pot synthesis.
47 48
50 49
14

4 – RESULTS AND DISCUSSION 49
Reaction conditions Reaction A Reaction B Reaction C Reaction D
Initial concentration of starting material 33 mM 84 mM 84 mM 168 mM
Equivalents of added POCl3 11.0 20.0 10.0 5.00
Equivalents of added propargyl alcohol 0.80 1.00 1.03 1.00
Equivalents of triethylamine 4.40 40.0 x 10.0
Temperature before the addition of
propargyl alcohol only rt
rt, 40 min at
50 °C
1.5 h at
66 °C
30 min at
50 °C
Yields of compound 51 after
purification ~10 % 40 % traces 15 %
Figure 4-25. One-pot synthesis of central diphosphate mono-alkyne 51 worked in moderate
yield with respect to the selectivity of a mono functionalization. The table shows different
reaction conditions of the parallel synthesis batches.
In parallel synthesis batches single parameters like temperature, concentration of
reagents and reaction time were changed. The table in figure 4-25 summarizes the
different conditions that were changed between the different reaction batches.
Generally all reactions were carried out under argon and started with an ice cold
THF-solution of molecule 19b. As best conditions those of reaction B could be
identified in this parallel synthesis approach. It yielded 40 % of the purified mono-
alkyne diphosphate 51. The most critical part seemed to be the temperature control
during the reaction process. If the mixture was too cold most of the intermediates
were not converted properly. This could be revealed with the conditions of
reaction A. With the use of mass spectroscopy some chloric compounds could be
detected. If the reaction mixture was treated too hot (more than 60 °C over a period
of 1.5 h) most of the intermediates decomposed obviously (Reaction C). As a hint of
this assumption only some traces of the desired mono-alkyne diphosphate 51 could
be detected. The optimized reaction was carried out under Schlenck technique.
A solution with a concentration of 84 mM of the hydroquinone 19b in previous
dried THF was cooled down to 0 °C. The addition of an excess of phosphorus
oxychloride (20 eq.) as well as triethylamine (40 eq.) was done fast by syringe.
19b 51

50 4 – RESULTS AND DISCUSSION
The mixture was allowed to warm-up to room temperature for 4 hours. To ensure
a full conversion the solution was heated to 50 °C for 40 min. Subsequently solvent
and residual phosphorus oxychloride were evaporated in high vacuum. The following
addition of 1 equivalent of propargyl alcohol was done very slowly at 0 °C. The final
hydrolysis in THF/water solution for 24 h led to the desired product 51.
Separation of the mono-alkyne 51 from starting material as well from the double
alkynylated side product could be achieved via MPLC under reverse phase
conditions. As a result from this approach of parallel syntheses some critical points
could be figured out. Beside the necessary exclusion from water an excess of 20 eq.
of phosphorus oxychloride revealed to be essential. The reaction processes were
controlled via mass spectrometry and HPLC. Therefore small amounts of the reaction
mixture were treated in a small scale work-up. The crude material was filtered over
small syringe filters to remove insoluble parts. The solvent of the filtrate was
removed under vacuum and the samples were prepared for analyses.
All attempts to transfer these reaction conditions to dihydroxy tweezer 14 failed.
Unluckily all tries resulted in crude mixtures, which did not give any reason of hope
to obtain a useful amount of product. Further changes in reaction control by
temperature or speed of addition of phosphorus oxychloride and propargyl alcohol
did not lead to improved results.
Figure 4-26. Synthesis of mono alkyne diphosphate tweezer 50 via SN2 reaction with propargyl
bromide.
A selective mono alkynylation of the diphosphate tweezer 47 was tried in analogy
to Williamson ether synthesis in an another approach. The deprotonated phosphate
was supposed to react with the propargyl bromide (fig 4-26) in a nucleophilic
substitution reaction. A similar reaction was realized before to obtain the mono-
alkyne tweezer 31, which was synthesized for 1st generation RGD-receptor. The
desired mono-alkyne diphosphate tweezer could be obtained in a yield of 20% after
purification.
Initially a promotion of the SN2-reaction with potassium carbonate as base was
tried. The propargyl bromide was added slowly to the reaction mixture as a
47 50

4 – RESULTS AND DISCUSSION 51
DMF-solution. But no conversion of starting material could be observed with
HPLC-MS. In a small-scale reaction with reobtained and purified starting material
sodium hydride as a stronger base was used. The stronger base should ensure a full
deprotonation of phosphate groups and enhance nucleophilicity consequently.
Figure 4-27. Due to 4 hydroxy positions different degree of alkynylation could occur. The exact
masses of the three different alkynylation products are given below corresponding molecule.
The small-scale reaction yielded a mixture of mono- (50) and di-alkyne (52)
products (fig 4-27) in a ratio of approximately 2.5:1. All products could be detected
via HPLC-MS in an acceptable resolution for a supplementary preparative separation.
The tri-alkynylated diphosphate tweezer 53 or even higher alkynylated compound
could not be detected.
Using the Schlenck technique the reaction was repeated on a bigger scale. The
reaction progress of alkynylation was monitored via HPLC-MS. The addition of a
200 mM propargyl bromide solution to a 35 mM solution of the diphosphate
tweezer 47 was carried out stepwise. The previous test reaction revealed that the
reagent propargyl bromide was necessary in a large excess in order to obtain a
suitable amount of mono-alkynylation product. To control the reaction progress and
find the right amount of propargyl bromide, reaction control via HPLC was done
after each addition step.
In figure 4-28 the reaction progress after addition of 1.0 equivalent of sodium
hydride and 2.4 equivalents of propargyl bromide is shown. The chromatogram of
the HPLC-MS analysis reflects the composition of alkynylation products in reaction
mixture after stirring the reaction mixture overnight.
The three peaks in UV-chromatogram (a) belong to the starting material 47 at a
retention time of 5.63 min, the mono-alkyne diphosphate tweezer 50 at 5.96 min and
the di-alkyne diphosphate tweezer (52) at 6.24 min. respectively. This assignment
could be made by the additional total ion chromatogram shown in figure 4-28 c and
the extracted mass spectra at the individual peaks. The masses were obtained via an
Ion Trap Mass Spectrometer of Thermo Fisher which had a lower performance than
50 52 53

52 4 – RESULTS AND DISCUSSION
the Q-TOF mass spectrometer from Bruker. Therefore the masses were not that exact
compared to the high resolution mass spectrometer from Bruker. Finally more than
12 equivalents of propargyl bromide were added until a maximum of mono
alkynylation could be achieved. It was assumed that the high amount of propargyl
bromide was needed due to some internal side-reaction of propargyl bromide by
itself. The reaction was stopped at a ratio of 3:5:2 of starting material (47), mono
alkyne tweezer (50) and di alkyne tweezer (52) respectively.
Figure 4-28. The reaction control of the synthesis of the mono alkyne diphosphate tweezer 50
via HPLC-MS carried out on reversed phase revealed three peaks in UV-chromatogram at a
wavelength of 210 nm (a). The total ion chromatogram (TIC) (c) shows the same peaks in a time
shift compared to the UV-chromatogram (a) due to a delay of the successive measurement
technique. The mass spectrum at 6.02 min (b) and 6.31 min (d) pictures represent the mono-
alkyne (50) and the di-alkynylated compound (52) respectively.
The purification of desired mono alkynylated product was executed with
preparative HPLC on reversed phase silica. Transferring the separation conditions
from analytical HPLC-MS to preparative separation method led to a general problem.
The additive ammonium acetate was used to buffer the eluent and guarantee a
complete removal via lyophilization afterwards. But unfortunately some blueish
complex with the tweezer molecules especially with the alkynylated ones was
generated. New separation conditions were investigated with triethylamine to adjust
pH-value to slightly basic conditions only.
Additionally a significant decrease of peak resolution occurred with higher
amounts of substance, so that only 1-2 mg of raw material could be purified in one
run. The chromatograms of the crude mixture (preparative run) as well as of the
purified mono-alkyne tweezer 50 are shown in the appendix (fig. 7-24).
a
c
b
d

4 – RESULTS AND DISCUSSION 53
The chromatogram of the preparative run revealed the ratio mentioned above. To
achieve an improved peak resolution the separation method was adjusted to step
gradients. Therewith the desired peaks could be eluted from the column separately.
Especially the separation of unconverted starting material from alkynylated products
could be enhanced.
Unluckily the purified starting material contained small amounts of the mono- and
di-alkyne diphosphate tweezer, although the column was washed carefully after each
separation step. This phenomenon could not be explained by problems due to an
overloaded column capacity compared to the analytical separation. Rather a possible
self-assembly process of the different tweezer species might explain this separation
problem.92 This effect might be more severe at higher concentrations of the tweezer
as they were used for a preparative purification process. The purification of the
truncated tweezer 51 could be achieved easily via MPLC in contrast. The yield of the
diphosphate mono-alkyne tweezer 50 was pretty low. Compared to the small
diphosphate mono-alkyne tweezer 51 the yield was only half. Beside the different
synthesis procedure the reduced yield originated mostly from problems of
separation.
Figure 4-29. A possible access to the water-soluble RGD-receptor 54 or receptor precursor 55
via a cycloaddition of tweezer 50 and azido pyrrole 32 and 41 respectively is shown.
Further formation of the triazoles 55 and 54 by cycloaddition of mono-alkyne
tweezer 50 and guanidinocarbonyl pyrroles 41 and 32 were performed in DMF under
copper catalysis respectively (fig. 4-29). Under stirring at room temperature a
suspension developed in both cases. TLC revealed that initial starting materials were
converted completely, but unluckily the obtained product could not be eluted on
50
41 32
55 54

54 4 – RESULTS AND DISCUSSION
solid phase with an appropriate solvent. 1H NMR of precipitate and filtrate showed
abnormal signals which were obviously caused by paramagnetic copper(II)-ions
which led to unpredictable chemical shifts and modified relaxation times.93 Therefore
no reliable analysis via NMR could be done. The only analytical proof of a successful
synthesis could be accomplished via mass spectrometry. Mass samples were
prepared as methanol solution of substance containing 5 % TFA. Interestingly the
mass could not be found in high performance mass spectrometer but clear evidence
could be found in nominal mass spectrometer. Therewith the desired precursor 55
could be detected as a single negativly charged species.
To remove undesired copper salts different attempts were made. The addition of
sodium sulfide or the addition of QuadraSil® MP to scavenge the copper did not
lead to a good result. The use of QuadraSil® MP led to absorption of most of the
product. The silica based scavenger showed the same problems such as other
purification methods based on silica like chromatography. Due to additional
solubility problems scavenging of copper with sodium sulfide was not reasonable.
Elsewise loss of desired product would be too big. Even solubility problems of
unprotected receptor 54 might be caused by a strong self-aggregation and inhibited
MS-analysis. By reasons of all the problems of insufficient analysis and purity check
no further investigations in binding studies of compounds 54 and 55 were made.
Because of an easier access and purification of the small tweezer 51 synthesis was
progressed according to a fully convergent synthesis method.
Figure 4-30. Convergent synthesis of the water-soluble RGD-receptor 56 of the truncated
tweezer 51 and unprotected pyrrole 32 was realized via copper catalyzed cycloaddition.
The 2nd generation RGD-receptor 56 was assembled in last synthesis step by a
cycloaddition of the unprotected azido pyrrole 32 and diphosphate mono-alkyne 51
(fig. 4-30). The reaction was carried out in THF/water solution at room temperature
and yielded receptor 56 in 49 %. The initial suspension of azido pyrrole 32 dissolved
32 51
56

4 – RESULTS AND DISCUSSION 55
with progress of the reaction. The precipitation of copper sulfide from aqueous
solution via sodium sulfide did not lead to a sufficient removal of the copper.
Chelating agents like EDTA with the purpose to act as a suitable scavenger were also
tried unsuccessfully. As a consequence the proton NMR could not be evaluated
properly. Again the paramagnetic copper(II) led to a broadening of resonances due
to slow relaxation times.94 Therefore it was tried to remove the copper by
precipitation of obtained product. An almost neutral solution of crude mixture was
adjusted to pH 2 by addition of 0.1 M solution of hydrochloric acid. The precipitated
product could be obtained easily by filtration afterwards. A repeated dissolving and
precipitation resulted in a yield of 49 % of purified receptor 56.
Again 1H NMR suffered from peak broadening, so that evaluation was not easy
either. Signal broadening was mostly assumed by intermolecular interactions of free
binding sites. But most promising the 31P NMR experiment at neutral pH conditions
and at 80 °C showed two distinct signals with similar integrals at 0.98 and -3.39 ppm
(fig. 4-31). The 2 different signals could be expected due to different substituted
phosphate groups.
Figure 4-31. 31P NMR of RGD-receptor 56 at 25 °C (left) and at 80 °C (right) showed two
different species.
Remarkably the measurement of the 31 P-NMR at room temperature led to a
down-field shift paired with an increase of signal A. In contrast signal B underwent a
high-field shift paired with a decrease of signal. The ratio of signals A and B turned
from 1:1 at high temperature to 2:1. This might be a hint for of aggregate formation
like a dimerization process. At 80 °C the compound seems to appear monomolecular
in solution as the ratio of both signals is 1:1. It could be assumed that the self-
aggregation is less distinct compared to the 1st generation RGD-receptor 46.
The purity control via HPLC failed due to the inapplicability of eluents for the solid
phase material. But the TLC check on reversed phase revealed that receptor 56
remained at the starting position while the starting materials could be moved
forward. Thus a full conversion was considered. The reduced yield could be explained
A
B
A B

56 4 – RESULTS AND DISCUSSION
by purification method. Through precipitation by pH change some substance still
maintained in solution with unwanted copper salts.
Within the last reaction step a convergent synthesis to the ditopic receptor 56
could be investigated. The first approach to a receptor containing a full tweezer did
not lead to a water soluble molecule. Unluckily the introduction of a second
phosphate to the tweezer to enhance solubility and realize receptor 54 and receptor
precursor 55 was unsuccessful due to problems in purification. The most significant
problem was a decrease of solubility after the cyclisation to the triazoles. Presumably
this was caused by a strong self-aggregation tendency of the obtained molecules.
A clear improvement could be achieved through the truncation of the aromatic
skeleton of the tweezer. In combination with a second phosphate group a full water
soluble receptor 56 could be synthesized. Additionally the synthesis of the building
blocks could be carried out separately to fulfill a convergent synthesis. A significant
step was the introduction of the azide at the pyrrole moiety which turned to out as
an interim problem with respect to stability (fig. 4-15). Both building blocks the azido
guanidiniocarbonyl pyrrole 3295 and the truncated diphosphate mono-alkyne
tweezer 51 could be synthesized in similar yields of 6.5 %. In particular some
unselective reactions like the formation of syn-dimethanoanthracenedion 19a
reduced the yield by more than 50 %. Nevertheless the application of a convergent
synthesis strategy led to an acceptable overall yield of more than 3 % of the RGD-
receptor 56 with respect to each of both building blocks. The new designed
receptor 56 with an improved water-solubility was used in UV-binding studies which
are described in chapter 4.3.6. The preparation of the guest peptides that were used
in these studies is described in the following chapter.
4.2.6 Syntheses of the RGD-Peptides
For binding studies of the developed RGD-receptors 46 and 56 three different
RGD-peptides were synthesized, one linear tripeptide and two cyclopeptides
containing the RGD-sequence in a fixed conformation (fig. 4-32). The linear
tripeptide P1 has both end positions capped. At the C-terminus an amide is obtained
after cleavage from resin. The N-terminus carries an acetylated amine function, which
was synthesized after last deprotection of the Fmoc-group. The capping of both
termini was done to prevent from possible interactions of the free functional groups
in the binding event with the RGD-receptor. A competition of the free acid position
of the C-terminus and the acid function of side chain of aspartic acid for
guanidiniocarbonyl pyrrole moiety might be the consequence.

4 – RESULTS AND DISCUSSION 57
Figure 4-32. Overview of peptides used for receptor evaluation. RGD sequence is more bent in
the penta-peptide cyclo(-RGDfV-) (P2) than in the hexa-peptide cyclo(-RGDfLG-) (P3).
Conformation of last one is more closed to conformation of the linear peptide P1.
In analogous way a free N-terminus might be in a competition with the
guanidinium function of the arginine. To eliminate these interaction possibilities
enables comparable conditions between linear and cyclic RGD-peptides. Through the
cyclisation the latter do not carry any free carboxylate or amino group elsewise than
within their side chains.
The main difference between the cyclic peptides P2 and P3 is given by the
bending of their RGD-sequence. In the hexa-peptide the bending is more relaxed
and approximates the fully flexible and linear RGD-tripeptide P1 whereas the
peptide P2 has a smaller radius because of one amino acid less than in P3. This
difference should be significantly measureable by checking the association constants
with a proper receptor. It is assumed, that a more bent substrate will show a smaller
association constant compared to a more relaxed or linear peptide substrate, if
receptor s binding sites are stretched by a linker molecule like it is in RGD-
receptor 56.
The peptide syntheses were carried out under standard peptide synthesis on solid
phase (SPPS). The progress of each step in peptide synthesis was observed with a
Kaiser test.96 All coupling steps were done twice to ensure an enhanced yield.
Synthesis of the linear peptide P1 was executed with Rink Amide MBHA resin
followed by an acetylation reaction of the free amine function. Purification was done
with MPLC under reversed phase conditions to yield 56 % of P1.
The synthesis of the cyclic peptides was carried out with chlorotrityl chloride resin.
The resin takes advantage from very mild cleaving conditions. Slight acidic conditions
led to cleavage from the resin but spared all side chain protection groups. These

58 4 – RESULTS AND DISCUSSION
protection groups are essential during the following cyclisation reaction of the linear
peptide strand. After cleaving the linear peptide sequence with a solution of DCM,
2,2,2-trifluoroethane (TFE) and acetic acid (3:1:1), cyclisation was done in a very low
concentration with the use the coupling agent propylphosphonic anhydride in
solution, also known as T3P. The peptide strand synthesis followed by cyclisation was
carried out according to literature known synthesis protocol.97
In a first purification step the protected cyclic peptides were separated from
byproducts of the cyclisation reagent T3P via normal phase chromatography. Further
deprotection under classical conditions with DCM/TFA solution was followed by a
final purification via MPLC under reversed phase conditions. Purified cyclic RGD-
peptides cyclo(RGDfV) (P2) and cyclo(GRDGfL) (P3) were obtained in yields of 5.2 %
and 2.2 % respectively. All peptides were obtained as TFA-salts after purification
because 0.05 % TFA was added to the eluent. Due to evaporation of the solvent after
purification process the TFA-salt was obtained and considered in yield and preparing
of solutions for UV binding studies. Purity checks of obtained peptides were carried
out with analytical HPLC. The purity refers to the UV-absorbance and detection was
done at different wavelengths due to different absorbance maxima. For the linear
peptide P1 220 nm was used as an observing wavelength. For the cyclic peptides
containing the chromophore phenylalanine the wavelength 258 nm was used
additionally.
The linear peptide P1 could be obtained in a purity of almost 96 % whereas purity
check of cyclic peptides discovered particular impurities at 220 nm (fig. 4-33). At a
wavelength of 220 nm the cyclic peptides P2 and P3 revealed purities of 92 % and
88 % respectively. At a wavelength of 258 nm purity of cyclic peptides looked much
better and reached values of 93-95 %.
The low yields of the cyclic peptides were expected due to their longer peptide
chain compared to the tripeptide P1. In addition their synthesis required a cyclisation
step. In general the reaction conditions under high dilution should diminish inter-
molecular coupling of the peptide chains and enhance the intramolecular head-to-
tail reactions. Although the cyclisation reactions were carried out carefully some
peptide chains might have reacted to longer chains or bigger cycles than the desired
penta or hexa-cycles. Therefore the obtained yields are in a reasonable yield. For a
similar peptide sequence a yield of 79 % with respect to the amount of glycine
coupled to the resin.97 The reported yield sounds rather high with respect to the
problems that accompany cyclisation reactions generally.
Consequently the most impurities originated from byproducts of coupling or
cyclisation reaction and did not contain aromatic residues like phenylalanine. Even

4 – RESULTS AND DISCUSSION 59
side-products from cleaved protection groups might be contained. Most probably
the impurities did not consist of bigger cycles than the desired one.
Figure 4-33. The HPLC-Chromatograms of the obtained RGD-peptides showed different purities
depending on the observing wavelength. Particularly the purity of the cyclic peptides showed
some differences at 220 nm compared to 258 nm.
The Impurities, which could not be removed completely by chromatography, most
probably contained coupling agents from linear peptide synthesis and cyclisation
reaction. Peptides were stored as TFA salt in freezer at -20 °C.
4.3 Measurements and Results
4.3.1 Determination of Association Constants of Host-Guest-Systems
Determination of the non-covalent association between a host molecule and its
guest substrate requires some preliminary consideration. Depending on the expected
value of the binding constant KA the concentration range of initial concentration of
the receptor [R ]i is preassigned and given by equation 4.1.
0
* 1AR K (4.1)
N-Ac-RGD-NH2 (P1) cyclo(RGDfV) (P2)
cyclo(GRGDfL) (P3)

60 4 – RESULTS AND DISCUSSION
The higher the expected KA is the lower the chosen starting concentration [R ]i for
the receptor needs to be. Within this constraint different measurement methods hold
their range of reliability. With NMR technique concentrations of substrate and guest
in the low mM range are necessary. Therefore association constants KA < 104 M-1 are
reasonable to identify.59 In contrast to this the UV-Vis spectroscopy can manage
concentrations in middle µM range due to a higher sensitivity of this method.
Herewith complexation constants KA up to 105 M-1 can be determined.
* * k R m S k mR S (4.2)
1 : 1
*
*
k m
A Ak m
complexR S RSK K
R SR S
(4.3)
A typical element of supramolecular associations is their reversibility which is
expressed by the balance equation 4.2. All contributing species reside in an
equilibrium state, which allows derivation of association constant via the law of mass
action (equation. 4.3). Thereby R and [R ] indicate the receptor and receptor concen-
tration whereas S and [S ] represent substrate and substrate concentration,
respectively. Because of a lack of knowledge about the complex concentration [RkSm ]
the association constant KA could not be determined directly by equation 4.3. Even a
determination via correlation of standard-state free energy G (equation 4.4) and
natural logarithm of association constant requires information about the binding
enthalpy H and the entropy S at the equilibrium of the host-guest-system.
* * * ln AG H T S R T K (4.4)
These parameters could be obtained by isothermal titration calorimetry (ITC)
whereas parameters R and T represent ideal gas constant and temperature,
respectively. Because of a chromophoric receptor and problems with signal
resolution in NMR UV-absorption was used as the preferred method to determine
association constants KA. Due to the fact that this method does not allow any direct
access to KA some mathematical transformations need to be done previously. The
formulation of the mathematical model was described in literature in the past so that
only a brief version will be recapitulated with annotation to the used literature.56,59,98
The problem that association constants could not be derived from equation 4.2
due to an unknown concentration of the host-guest-complex need to be
circumvented. For that reason the method of gradually titration of one component
(e.g. the guest) to a fixed concentration of the other component (e.g. host) is used.
For the following considerations a 1:1 host-guest-system is assumed with the

4 – RESULTS AND DISCUSSION 61
advantage that the descriptors k and m get simplified to the value of 1. Thus the
complex concentration [RS ] is given by the difference of total receptor concentration
[R ]t and concentration of free receptor [R ] in equilibrium state equally to the
difference of total substance concentration [S ]t and concentration of free substrate
[S ].
t t
RS R R S S (4.5)
t
R R RS (4.6)
t
S S RS (4.7)
Accordingly receptor and substrate concentration within equilibrium are given by
difference of their total concentrations and concentration of complex respectively. All
above-mentioned relations are expressed by the equations 4.5 to 4.7. Substitution of
complex concentration [RS ], which is given in equation 4.5, in law of mass action
(formula 4.3) results in equation 4.8. Herein the association constant is only related to
the concentrations of the receptor at the beginning labeled by an i and the free
receptor [R ] and substrate [S ] concentrations during the titration experiment.
1
* *t t
A
R R RK
R S R S S
(4.8)
The mathematical approach to obtain KA takes advantage from the fact that a
physical change of an observable, which is correlated to the complex concentration,
occurs during the titration steps. Generally this change can be a shift of a NMR signal
as well as a change in UV-absorption. Beside the capability of UV-light absorbance
the observed substances need to follow the Beer-Lambert Law (equation 4.9). The
mathematical method is based on this law. This law describes a linear dependency of
absorption A on concentration c at a given layer thickness of cuvette d. This
dependency is necessary for all participating substances including the complex.
* *A c d (4.9)
The observed absorption can exhibit an enforced increase or decrease due to
changes in the electrostatic environment of the chromophore. The latter will be
influenced by the complexation of substrate molecules because the complexation
itself is driven by electrostatic interactions between receptor and substrate.
Consequently any difference in the behavior of UV-absorption than the normal

62 4 – RESULTS AND DISCUSSION
dilution effect has its origin in the formation of a new species, the complex. In
UV-titration experiments the observed absorption Aobs results from the sum of all
absorptions of the single species, which are present in the mixture.
3 3
1 1
* *obs x x xx x
A A c d
(4.10)
This additive behavior of single UV-spectra of individual species (fig. 4-34) can be
expressed by equation 4.10. If the necessity of linearity of the absorption behavior
for any substance is not fulfilled this mathematical method cannot be applied.
Figure 4-34. Observed spectrum (continuous line) at advanced titration step is a result of
addition of single UV-spectra of all present species.
With the premise of a fixed cuvette length of d=1 cm the previous formula is
simplified to equation 4.11 containing the three species receptor R, substrate S and
receptor-substrate complex RS.59,58
* * *obs R S RS R S RSA A A A R S RS (4.11)
For lack of information about the concentrations of the three species receptor [R ],
substrate [S ] and complex [RS ] within the equilibrium some transformations and
simplifications need to be done to substitute these three unknown parameters by
known ones. Further transformations and derivation can be reviewed in literature
given by annotations.56,58,98 As a result one obtains equation 4.12. Therefore
unknown parameters will be substituted by known ones and the normal dilution by
addition of substrate is taken into acount. This formula requires only initial
concentrations of free substrate [S ]i and receptor [R ]i respectively. Initial absorption
Ai and absorptivity coefficients ɛ of pure receptor and substrate solutions could be
obtained from pre-measurements.
With aid of the program origin this formula enables a determination of KA via the
mathematical method of a non-linear regression. An alternative evaluation could be

4 – RESULTS AND DISCUSSION 63
executed via a linear regression method. In contrast to previously shown method
linear regression methods suffer from unfavorable assumptions due to linearization.
Most popular linear regression methods are in particular Benesi-Hildebrand,
Lineweaver-Burk and the Scatchard plot. The linear regression approaches suffer
from a different weighting of the data. Therefore the results obtained from linear
regressions could differ significantly in comparison to non-linear regression
analyses.59
2
2
2
2
1
1 1
1 1
1
1
11
1 1
1
A i i
i iA
A Ai i
iobs
A i
iA
A Ai i
K R S x
R S x xK
x x K S K R
x xAA
x K R S x
S x xK
x K S x K R
x x
x
1
1
S iS x
x
Equation 4.12 incorporates dilutive effect with the term x/(1+x) caused by gradual titration of
substrate to receptor solution. The x represents proportion of added Va to initial volume Vi per
titration step.
As it was mentioned before evaluation according to the presented equation 4.12
is only valid for a complex stoichiometry of 1:1. If another complex stoichiometry or
even mixed complexes are existing determination of association constants gets more
sophisticated and different computer programs especially made for analysis of
spectroscopy data like SpecFit need to be used.60 Nevertheless the stoichiometry of
the analyzed complex needed to be determined before. The common technique of
continuous variation called the Job s method was used.
The method of Job uses the corrected absorbance of a single wavelength most
likely the maximum of the absorption of the receptor, which is affected by
associating the substrate. The corrected absorbance Acorr is defined as the observed
absorbance reduced by absorbance caused by compounds not being involved in the
complexation process [equation 4.13].62
corr S Rt tA A S R d (4.13)
(4.12)

64 4 – RESULTS AND DISCUSSION
tS
t t
Sx
R S (4.14)
In the Job plot the corrected absorbance Acorr is plotted as a function of molar
fraction of substrate χS , which is given by equation 4.14. The molar fraction can range
from zero to one (fig. 4-35). Concentrations are used as total ones for all calculations.
The maximum of the bell-shaped curve determines stoichiometry by corresponding
molar fraction.
Figure 4-35. Plotting of corrected absorption against molar fraction yields the Job plot. The
maximum of fitted curve reflects complex stoichiometry. Here the maximum at a molar fraction
of 0.5 indicates a 1:1 complex.
Some further conditions need to be fulfilled to carry out Job s method correctly.
Beside the previous mentioned Beer-Lambert Law this method assumes the
formation of a single complex predominately. If more than one kind of complex is
formed at the same time evaluation of complex stoichiometry gets more
sophisticated and needs more assumptions. But the more assumptions are necessary
the higher the uncertainty about determined binding constant is.99 In addition to the
previous mentioned requirements pH-value and ionic strength need to be kept
constant as well as the total concentration during experiment.
4.3.2 Results of the UV-Titration Experiments with Receptor 46
Preliminary conditions like solubility and Beer-Lambert behavior were tested
before binding studies were carried out. As mentioned before (chapter 4.2.4) a
micro-molar solution of receptor 46 with the addition of 10 % DMSO could be
generated. Increasing the proportion of water was always accompanied with
precipitation of the receptor at any pH-value. Although a content of 10 % DMSO is
not suitable in biological systems first UV measurements were carried out to give
some hints for further receptor improvement. Validation of the Beer-Lambert Law

4 – RESULTS AND DISCUSSION 65
was checked with the water/DMSO-solution. The dilution experiment was initiated
with a starting concentration of 103 µM of the receptor 46. The pH was adjusted to
pH 6.0 and controlled during the stepwise dilution of the pure receptor solution. For
all UV-measurements a Quartz glass cuvette with a maximum volumetric capacity of
approximately 1.3 ml was used. The concentrated stock solution was diluted by
substitution of 100 µL of the previous solution with 100 µL of clear water/DMSO
mixture (9/1) adjusted to pH 6.0 to avoid pH dependent UV-shifts. Under
consideration of volume expansion all adjustments of pH were done with 0.1 M
hydrochloric acid and sodium hydroxide solution respectively.
Figure 4-36. Dilution experiment of receptor 46 is shown in left graph. The legend refelects the
concentration of sample for each single measurement. The right graph reveals the good
accordance to the linear concentration dependent absorbance with 0.9996 as coefficient of
determination.
The dilution experiment of receptor 46 (fig. 4-36) revealed a linear dependency of
the absorption towards concentration. The screened concentration range reached
from 103 µM to 2.81 µM. The analysis was done at the absorption maximum
(286 nm) of the receptor, which is corresponding to literature known values for
tweezer molecules.72 As a result of the dilution experiment no concentration
dependent UV shifts occurred. The coefficient of the trend line confirmed an almost
linear behavior with a value of 0.9996 (fig. 4-36, right side). Only in the low micro-
molar region below 10 µM the linear behavior seems to deviate. Therefore no
change of aggregation state in the concentration region of interest for binding
studies was assumed. This assumption is based on the fact that aggregation of
receptor molecules itself will have a significant change in absorption due to changes
in electrostatic environment of chromophores. Such systems are crucially influenced
by changes of their concentration.
Preliminary binding studies were carried out with the most flexible RGD triad P1.
The initial concentration of the receptor 46 was 36.8 µM. The pH-value (pH = 6.6) of

66 4 – RESULTS AND DISCUSSION
the ligand solution was adjusted in same way as for the receptor solution. Although
the titration of the ligand peptide was done carefully no distinct and useful UV-shifts
were recorded (fig. 4-37). At the left side the overlays of UV-spectra show some
unexpected changes. Generally the whole shape of the single UV-spectrum changed
during the addition of the quest peptide P1. At the right side the change of the
absorbance maximum at 286 nm is plotted in dependency of the addition of further
substrate.
Figure 4-37. On the left side UV titration experiment of receptor 46 with linear RGD-peptide P1
is shown. Equivalents of added substrate are given in the legend. On the right side absorbance
at 286 nm is plotted as a function of added substrate equivalents.
These observed changes were rather unexpected and did not show any clear
trend. In principle the absorbance change was rather small so that the significance of
these changes is very low. Even a repetition at a higher host concentration of around
50 µM did not yield better results.
In summary the generated data of the first binding studies were not good enough
for any continued evaluation. The reason for this phenomenon might be a strong
self-association of the RGD-receptor 46. During the dilution experiment (fig. 4-36) no
hint of a self-association could be detected. Within the concentration range that was
used to check the validity of the Beer-Lambert Law no concentration dependent
changes occurred. To get some more information about aggregation behavior of
molecule 46 DLS and AFM measurements were executed.
4.3.3 Imaging of Supramolecular Structures with AFM
Imaging structures of solids in sub-nanometer resolution is the power of AFM. The
technique is based on investigations of scanning tunneling microscopy (STM)
Equivalents of substrate
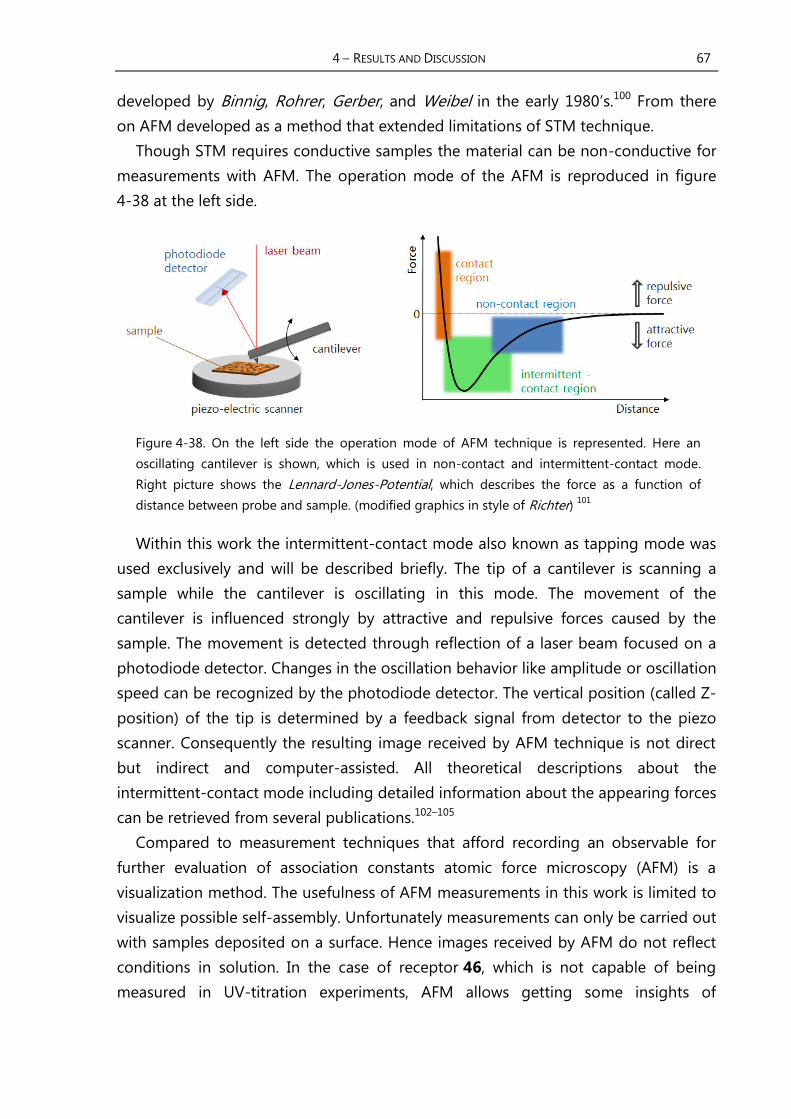
4 – RESULTS AND DISCUSSION 67
developed by Binnig, Rohrer, Gerber, and Weibel in the early s.100 From there
on AFM developed as a method that extended limitations of STM technique.
Though STM requires conductive samples the material can be non-conductive for
measurements with AFM. The operation mode of the AFM is reproduced in figure
4-38 at the left side.
Figure 4-38. On the left side the operation mode of AFM technique is represented. Here an
oscillating cantilever is shown, which is used in non-contact and intermittent-contact mode.
Right picture shows the Lennard-Jones-Potential, which describes the force as a function of
distance between probe and sample. (modified graphics in style of Richter) 101
Within this work the intermittent-contact mode also known as tapping mode was
used exclusively and will be described briefly. The tip of a cantilever is scanning a
sample while the cantilever is oscillating in this mode. The movement of the
cantilever is influenced strongly by attractive and repulsive forces caused by the
sample. The movement is detected through reflection of a laser beam focused on a
photodiode detector. Changes in the oscillation behavior like amplitude or oscillation
speed can be recognized by the photodiode detector. The vertical position (called Z-
position) of the tip is determined by a feedback signal from detector to the piezo
scanner. Consequently the resulting image received by AFM technique is not direct
but indirect and computer-assisted. All theoretical descriptions about the
intermittent-contact mode including detailed information about the appearing forces
can be retrieved from several publications.102–105
Compared to measurement techniques that afford recording an observable for
further evaluation of association constants atomic force microscopy (AFM) is a
visualization method. The usefulness of AFM measurements in this work is limited to
visualize possible self-assembly. Unfortunately measurements can only be carried out
with samples deposited on a surface. Hence images received by AFM do not reflect
conditions in solution. In the case of receptor 46, which is not capable of being
measured in UV-titration experiments, AFM allows getting some insights of

68 4 – RESULTS AND DISCUSSION
intermolecular interaction behavior. Thus AFM is used to get a better understanding
of aggregation affinity.
4.3.4 Results of AFM-Measurements of Receptor 46
All AFM images were recorded with an Innova SPM equipped with an AFM
NanoDrive. Evaluation of the obtained pictures was done with the computer program
Gwyddion. In general samples were dissolved in appropriate solvents and applied to
a mica surface via spin coating process. 1 µL of the sample solution was applied with
an Eppendorf pipette to the target surface. The mica target was rotated at 60 rps
during the application. Afterwards the prepared sample was allowed to dry for 1 min
at the same rotation speed.
Figure 4-39. The RGD-receptor 46 shown with fully protonated (left side) and deprotonated
functional groups (right side) respectively.
To get a better understanding of the aggregation behavior of receptor 46 several
AFM images were recorded under basic, neutral and acidic conditions respectively.
Because of receptor s tendency to precipitate in acidic aqueous solutions it was dissolved in pure DMSO to ensure comparable concentrations at the different
protonation states. The aim was a comparative study on the self-aggregation
behavior under diverse protonation states. Especially the contribution of both
binding sites depending on the protonation states should be analyzed. Under acidic
conditions the phosphate group is supposed to be almost fully protonated and
therefore less attractive for guanidinium groups (Fig. 4-39). At basic conditions a fully
deprotonated phosphate, which is accessible for positive charged molecules, and a
guanidino group are present.
46 ·HCl
46 ·2 NHEt3+

4 – RESULTS AND DISCUSSION 69
Initially an aqueous suspension of molecule 46 was prepared. Basic and acidic
conditions were achieved by addition of triethylamine and hydrochloric acid in slight
excess respectively. Slightly acidic conditions as they appear in malignant tissue
(pH 6.0) were realized by pH adjustment. A suspension of receptor 46 in water was
controlled by a Hamilton electrode. The complete removal of water was realized by
lyophilization of the suspension afterwards. The residual solids were diluted in pure
DMSO to obtain the final solutions of the receptor 46 in desired protonation state
for AFM-measurements.
Figure 4-40 AFM-pictures. Tapping amplitude images 1-3 give an overview whereas second row
phase images 4-6 show more detailed receptor 46 under alkaline (1, 4), marginally acidic (2, 5)
and acidic (3, 6) conditions respectively. The white scale bars were standardized at 1 µm.
Measurements were repeated at least three times at different positions of a single
sample. To ensure regularity of results each sample was prepared two or three times
newly and measurements were done repeatedly. An overview of the images at
different conditions is given in figure 4-40. Alkaline and neutral DMSO solutions
yielded almost similar spherical structures at concentrations up to 829 µM.
Exclusively under strong acidic conditions RGD-receptor 46 showed an inherent
affinity to extended branched columnar structures. The images are made from a
solution at a concentration of 377 µM (fig. 4-40, picture 3 and 6). In border regions
some smaller particles could be found too. But most parts of the samples revealed a
network like structure with similar dimensions. Their height varied between 5 to
10 nm and the width between 200 - 500 nm approximately (fig. 4-41). In contrast
basic and almost neutral conditions led to significant smaller particles with a
1
4 6 5
2 3
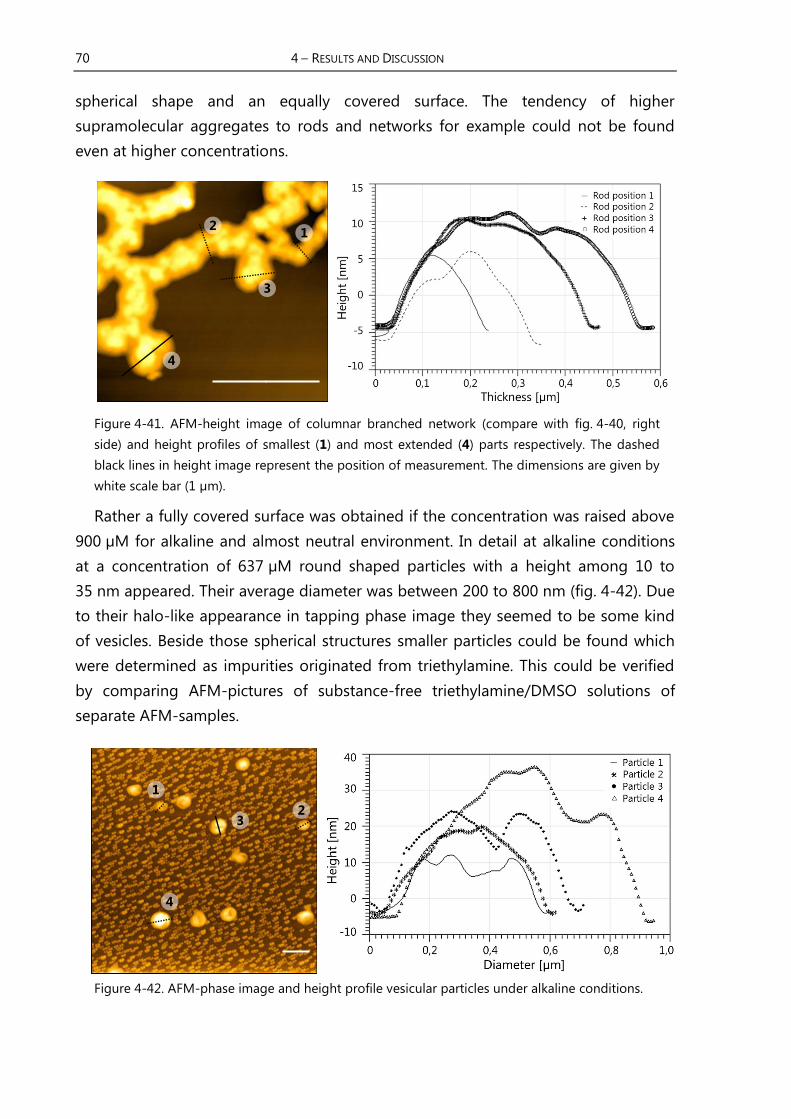
70 4 – RESULTS AND DISCUSSION
spherical shape and an equally covered surface. The tendency of higher
supramolecular aggregates to rods and networks for example could not be found
even at higher concentrations.
Figure 4-41. AFM-height image of columnar branched network (compare with fig. 4-40, right
side) and height profiles of smallest (1) and most extended (4) parts respectively. The dashed
black lines in height image represent the position of measurement. The dimensions are given by
white scale bar (1 µm).
Rather a fully covered surface was obtained if the concentration was raised above
900 µM for alkaline and almost neutral environment. In detail at alkaline conditions
at a concentration of 637 µM round shaped particles with a height among 10 to
35 nm appeared. Their average diameter was between 200 to 800 nm (fig. 4-42). Due
to their halo-like appearance in tapping phase image they seemed to be some kind
of vesicles. Beside those spherical structures smaller particles could be found which
were determined as impurities originated from triethylamine. This could be verified
by comparing AFM-pictures of substance-free triethylamine/DMSO solutions of
separate AFM-samples.
Figure 4-42. AFM-phase image and height profile vesicular particles under alkaline conditions.
1
2 3
4
1 2
3
4

4 – RESULTS AND DISCUSSION 71
A similar behavior of formation of smaller structures was seen under neutral
conditions. At a concentration of 829 µM kind of vesicular architecture appeared too.
Strikingly the size distribution is narrow compared to other conditions. Heights of
particles varied from 10 to 30 nm and particle diameters from 100 to 250 nm could
be found. Particles obtained under neutral and alkaline conditions showed a
remarkably similarity. Their surface did not appear homogenous but showed kind of
a grooved structure. Some of the particles showed a higher degree of engraving than
the others. The profile plots extracted from the measurements under neutral and
alkaline conditions revealed this characteristical shape of the structures (spherical
structure 3 in fig. 4-42 and fig. 4-43).
Figure 4-43. AFM-phase image and height profile vesicular particles under almost neutral
conditions.
Most probably those smaller structures arose from oligomers building up some
accumulated aggregates. Those aggregates could have a more loosely structure to
explain the grooved particles. A more detailed and enhanced study via AFM of the
aggregates was not made. But AFM-pictures showed impressively, that receptor 46
has the ability to form aggregates. Even though the solvent and concentration is
different to those used for UV/ViS-binding studies the results from AFM pictures
might explain, why previous binding studies on receptor 46 failed. Because AFM
pictures reflected only solidified particles additional method for determination of
particle size in solution was considered.
4.3.5 Size Determination of Supramolecular Structures with DLS
Dynamic light scattering (DLS) is most commonly used for the analysis of
nanoparticles like colloids. The measurement technique is based on random changes
in intensity of laser light scattered from particles in solution. Those changes are
1
2
3
4
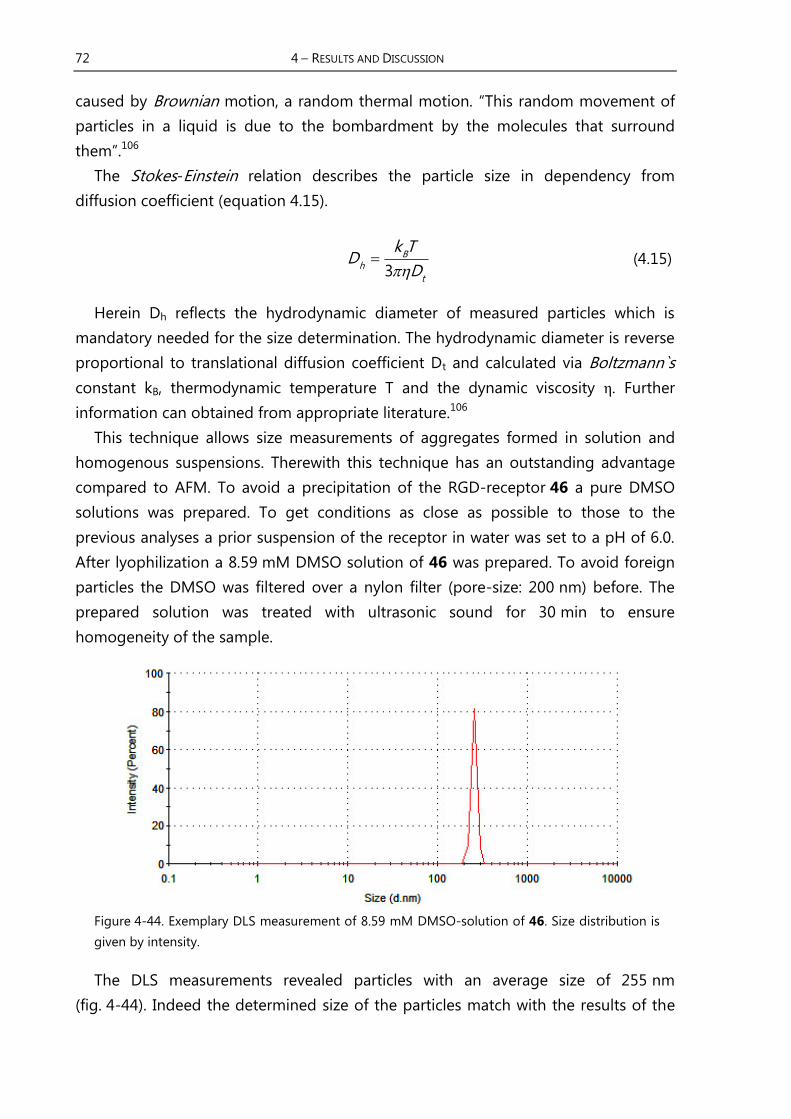
72 4 – RESULTS AND DISCUSSION
caused by Brownian motion, a random thermal motion. This random movement of
particles in a liquid is due to the bombardment by the molecules that surround
them .106
The Stokes-Einstein relation describes the particle size in dependency from
diffusion coefficient (equation 4.15).
3
Bh
t
k TD
D (4.15)
Herein Dh reflects the hydrodynamic diameter of measured particles which is
mandatory needed for the size determination. The hydrodynamic diameter is reverse
proportional to translational diffusion coefficient Dt and calculated via Boltzmann`s
constant kB, thermodynamic temperature T and the dynamic viscosity η. Further
information can obtained from appropriate literature.106
This technique allows size measurements of aggregates formed in solution and
homogenous suspensions. Therewith this technique has an outstanding advantage
compared to AFM. To avoid a precipitation of the RGD-receptor 46 a pure DMSO
solutions was prepared. To get conditions as close as possible to those to the
previous analyses a prior suspension of the receptor in water was set to a pH of 6.0.
After lyophilization a 8.59 mM DMSO solution of 46 was prepared. To avoid foreign
particles the DMSO was filtered over a nylon filter (pore-size: 200 nm) before. The
prepared solution was treated with ultrasonic sound for 30 min to ensure
homogeneity of the sample.
Figure 4-44. Exemplary DLS measurement of 8.59 mM DMSO-solution of 46. Size distribution is
given by intensity.
The DLS measurements revealed particles with an average size of 255 nm
(fig. 4-44). Indeed the determined size of the particles match with the results of the

4 – RESULTS AND DISCUSSION 73
previous AFM experiments. The particles obtained from a neutral solution showed an
average size of around 230 nm (fig. 4-43, spherical structure 2). Coincidental a very
high PDI of around 0.8 was calculated by the Zetasizer software. A polydispersity
index of 0.7 and higher is equivalent to a very broad size distribution of particles in
the measured sample. In contrast to this result the AFM revealed a rather small size
distribution at slightly acidic conditions. In comparison of both methods it needs to
be considered that DLS measurements were executed on solutions of the receptor.
The data of the AFM-measurements were recorded from solid material. With respect
to these differences the results of the average size of the particles were similar in a
first approximation.
Although the obtained size distribution in figure 4-44 looks promising another
source of problem might have some influence on the quality of the measurements.
The receptor solution shows some brownish color. The observed color resulted from
the chromophore of the spacer molecule azido aniline. Generally the solutions need
to be free of suspended particles and colorless to prevent wrong analysis of the
software. Further measurements with diluted solutions did not lead to other results.
Therefore no additional investigations on DLS-measurements were done.
In combination with results from previous AFM studies the molecule 46 is
suggested to undergo self-assembly at even low concentrations. If the receptor
molecules tend to build aggregates and did not appear as single species initial UV-
titration experiments can be interpreted better. The self-assembly character of
receptor 46 might lead to a mixture of different species. During the titration
experiment oligomeric aggregates like vesicles, dimers and receptor guest
complexes might be in a special mixture. Due to the titration of an antagonistic
ligand this previous order becomes imbalanced. Some aggregates would become
more favored than others and these changes might lead to a change in UV-
absorption and the shape of the single spectrum shown in figure 4-37. Therefore no
reliable evaluation of binding constant was possible. To conclude the artificial RGD-
receptor 46 turned out to be useless for further binding studies.
4.3.6 Results of the UV-Titration Experiments with Receptor 56
Before the binding studies of the RGD-receptor 56 (fig. 4-45) were carried out the
validity of the Beer-Lambert Law was checked. At a pH range from 5 to 8 the
receptor showed a good water-solubility so that a 5 mM aqueous solution at pH 6.0
could be realized. This stock solution was used for further UV-binding studies. The
dilution experiment started with a 228 µM solution of receptor molecule at a pH of

74 4 – RESULTS AND DISCUSSION
6.0. Buffered solutions during the titration experiments were not used due to
possible interactions of buffer salts with the binding sites of receptor or substrate
respectively. Phosphate buffers e.g. could be in direct competition with the
phosphate groups of the tweezer.
Figure 4-45. Structure of the 2nd generation RGD-receptor 56 showed a significantly better
water-solubility compared to the 1st generation receptor.
Therefore the pH value was controlled by a Hamilton Minitrode between the
single UV-measurements. The concentration of the receptor 56 was reduced
stepwise by replacing aliquots of receptor solution with water at pH of 6.0 (fig. 4-46).
The limit of a good quality absorbance was reached at a concentration of 11.5 µM. In
the second graph the absorbance of each measurement was plotted against the
receptor concentration. The coefficient of the linear regression indicated a linear
absorption behavior in dependency of the concentration at the maximum of 306 nm.
240 280 320 360 400 4400.0
0.5
1.0
1.5
2.0
2.5
Ab
sorb
ance
[a.
u.]
Wavelenght [nm]
228 µM 159 µM
128 µM 102 µM
81.5 µM 65.2 µM
52.2 µM 41.8 µM
33.1 µM 23.3 µM
16.2 µM 11.5 µM
Figure 4-46. Dilution experiment in the range from 228 µM to 11.5 µM. The good quality of
linearity of concentration dependent absorbance is given by the coefficient of determination in
the right graph.
In a next step the UV-titration experiments of the receptor 56 with the RGD-
peptides P1 to P3 were carried out respectively. In figure 4-47 the UV-spectra of two
titration experiments are shown exemplarily. The spectrum of the linear peptide P1
at the left side shows only one maximum at 306 nm. This maximum originated from
the chromophore of the receptor molecule and decreased during the titration
56

4 – RESULTS AND DISCUSSION 75
experiment. All data points of the titration experiment obtained at 306 nm were used
for further analysis of the binding constant. The decrease can be explained in parts
by the dilution of the receptor. Any further changes referred to additional interfering
effects. These effects are supposed to be caused by the interaction of the receptor
with the guest substrate.
240 280 320 3600.2
0.3
0.4
0.5
0.6
Ab
sorb
ance
[a.
u.]
Wavelenght [nm]
240 280 320 360
0.5
0.6
0.7
0.8
0.9
1.0
Ab
sorb
ance
[a.
u.]
Wavelength [nm]
Figure 4-47. UV-spectra from UV-titration experiments of receptor 56 and peptide P1 (left side)
and the cyclic hexa-peptide P3 (right side). Determination of binding constant occurred at
absorbance maximum at 306 nm indicated by arrow pointing downwards. Absorbance increase
(arrow pointing upwards) at 260 nm resulted from phenylalanine in the cyclic peptides.
The determination of the binding constants was done in accordance to equation
4.11 which was introduced in chapter 4.4.1. Therefore the intensity at the absorbance
maximum is plotted versus the equivalents of substrate that were added. These
equivalents are represented by the ratio of volumes of substrate to receptor
(V(S)/V(R)) (fig. 4-48).
Figure 4-48. The decrease of absorbance is observed at 306 nm and plotted against the ratio of
volumes of substrate to receptor [V(S)/V(R)]. The diagramm displays the fitted binding isotherm
(red line).
0.0 0.1 0.2 0.3 0.4 0.5
1.0
1.1
1.2
1.3
1.4
Ab
sorb
ance
@30
6 n
m [
a.u
.]
V(S)/V(R)

76 4 – RESULTS AND DISCUSSION
In the first experiment the total amount of the added peptide P1 was
73.2 equivalents with respect to the used quantity of the receptor. With the
assumption of a 1:1 complex formed by the receptor and the guest peptide this
experiment yielded a binding constant of 34,300 ± 4,900 M-1. All repetitions of this
titration experiment resulted in an averaged binding constant of 33,700 M-1 with a
standard error of 5,280 M-1. The same procedure was done with the circular
peptides P2 and P3. With an average binding constant of 12,700 ± 5,960 M-1 the
interaction of the hexa-peptide P3 was three times stronger than with the penta-
peptide P2. With the guest peptide P2 an average binding constant of
4,300 ± 980 M-1 could be determined.
In comparison the titration experiment of the guest peptide P3 showed the
highest relative standard error compared to the other peptides. The relative error is
nearly 50% of the evaluated binding constant KA. For both cyclic peptides the relative
error showed the highest values. On grounds of this and because of a relative small
KA value of 4,300 M-1 the titration experiments of the cyclic peptides were repeated
with slightly higher concentrations of the guest peptides. However the repetition of
the titration experiment with an increased concentration of guest peptide P2 led to
unexpected shifts in the UV-spectrum compared to peptide P3. The used peptide
concentration for the repetition was 150°times higher than the receptor
concentrations.
In figure 4-49 the irregular shifting is shown. The increase of the maximum at
258 nm and the decrease of the maximum at 306 nm showed an abnormal strong
shifting in the beginning and after addition of around 8 equivalents of substrate. The
magnification of the UV-spectrum (right spectrum) showed the clear aberration of
the expected shifting (blue arrow in the left spectrum).
240 280 320 360
1.0
1.2
1.4
1.6
1.8
Ab
sorb
ance
[a.
u.]
Wavelength [nm] 250 260 270 280 290 300
1.0
1.2
1.4
1.6
Ab
sorb
ance
[a.
u.]
Wavelength [nm]
Figure 4-49. UV-titration experiment of penta-peptide P2 and RGD-receptor 56 with an
increased peptide concentration showed some divergences of UV-shifts during the titration. The
enlargement (light blue area) in right picture revealed some unusual increase of absorption (red
arrow).

4 – RESULTS AND DISCUSSION 77
The red arrow in figure 4-49 indicates the regions that reveal these unexpected
strong shifts. Most strikingly some UV-measurements showed some complete
different spectra. Due to these shifts the non-linear regression analysis could not be
carried out. Even with disregarding those measurements the regression analysis
could not be carried out normally. The observed shifts were similar to those that
were found with receptor 46 and peptide P1 (fig. 4-37). It is assumed that additional
interactions than the desired complex formation occurred. For the circular
peptide P3 these affects did not appear and same binding constants were found as
before.
Figure 4-50. Scheme of assumed 1:1 complexes of receptor 56 with peptide P3 (left side) and P2
(right side) revealed that shown complex geometry with P2 seemed to be less favored.
Another effect might be an unfavored geometry of the penta-peptide P2 which
might lead to a lower affinity towards the RGD-receptor 56. This effect might
increases the tendency to form aggregates with other peptide molecules. As it was
mentioned in chapter 4.3.6 the RGD-sequence of P2 is even more curved than in the
cyclic hexa-peptide P3 (fig. 4-50). Additionally it needs to be considered as well that
the water-soluble receptor 56 carried one phosphate group more than the previous
calculated receptor 8 in chapter 4.1. Obviously the additional phosphate group
changed the geometry of binding sites to each other so that a 1:1 complex formation
like shown above could be less favored.
To validate the complex stoichiometry of the previous receptor-substrate-systems
the Job s method of continuous variation was executed. Job plots were carried out at
least two times on each RGD-peptide receptor system. To fulfill the conditions of the
used method of continuous variation small amounts of initial receptor solutions were
replaced by peptide solution of the same concentration. Thereby the stoichiometry
of complex at equilibrium could be obtained from the inflection point of the curve.
Under consideration of a dilution effect the net change in UV-absorption at the
maximum of 306 nm was used and plotted against the molar fraction.
56 · P3 56 · P2

78 4 – RESULTS AND DISCUSSION
In figure 4-51 the Job plot of the linear RGD-peptide P1 is displayed. The
differential absorbance ΔA =Aobs-AR-AS is plotted against the molar fraction xs of the
substrate. Unfortunately the recorded data did not give a clear evidence of the
complex stoichiometry. The maximum of the absorbance difference is located at a
molar fraction of around 0.38. Therefore a complex stoichiometry of 1:2 of guest
peptide to host receptor could be assumed. But indeed the complex could have a
stoichiometry between 1:1 and 1:2 of guest peptide to host receptor. With respect to
some outlying data which are shown in brackets the data in general seems not to be
very significant. For example if the data point of the molar fraction xs = 0.5 would be
0.004 units higher the Job plot would indicate a 1:1 complex. Even the dimension of
values of the differential absorbance is rather small. The full absorbance difference
stretches over 0.01 units.
Figure 4-51. The Job plot of the linear RGD-peptide P1 shows the inflection at around 0.38 if
some data in brackets were marked as outliers.
Consequently the complex stoichiometry could be between 1:1 and 1:2 with
respect to guest peptide to host receptor. The quality of the measurements could
not be improved unluckily. Even the repetition of the Job plots did not yield better
results. Attempts with increased concentrations of the receptor and the substrate
yielded even worse distributed data. The Job plots of the circular peptides P2 and P3
suffer from the same problem of a rather small absorbance difference. In figure 4-52
both plots are shown. Although the inflection point is not pronounced in the Job plot
of peptide P2 (left side) a stoichiometry of the peptide-receptor-complex of 2:1 is
could be estimated. But the maximum could be located between the molar fractions
of 0.5 to 0.7. Again the error is quite high and a rather small shift of a single data
point around the proposed maximum could be crucial. For the linear peptide P3 the
Job plot gives a rather clear evidence for a 1:2 receptor-substrate-complex.
0
0.2
0.4
0.6
0.8
1
0 0.1 0.2 0.3 0.4 0.5 0.6 0.7 0.8 0.9 1
Δ A
[10
-2]
Molar Fraction xs

4 – RESULTS AND DISCUSSION 79
Thus an analysis with the computer programs SpecFit and ReactLab Equilibria
were tried. The advantage of both programs is that they can carry out the regression
analysis with data from multi-wavelength and of competitive complex formation.
Inopportunely the algorithms of both programs did not lead to any suitable results
due the problem in finding a minimum during the iteration steps.
Figure 4-52. Job plots of the penta-peptide P2 (left) revealed a nearly a complex stoichiometry
of 2:1 of peptide to receptor whereas the hexa-peptide P3 (right)
In general it turned out that the obtained data of Job plot showed a significance
that is too low to obtain trustful results from. The main reason might be that the
complex formation did not influence the chromophore of the receptor that much
that the UV-absorption is a proper observable. Additionally a mixture of different
binding modes that could have a dissimilar complex stoichiometry was assumed to
be present at the same time. With the reasonable assumption that the 1:1 complex is
one of the main components the previous results of the non-linear regression
analyses done with origin were considered.
All tries to obtain a higher absorption difference by usage of increased
concentrations of the receptor and the substrate did not lead to better results. One
problem that accompanied measurements with higher concentrations was the
amplified absorption. The absolute absorbance was raised to maximal 2.25 a.u. to
keep to the linearity absorbance behavior but without a successful improvement of
the obtained Job plots. Even more concentrated solutions were not tried. Because
the linear absorbance behavior will not be fulfilled anymore with a significant higher
absolute absorbance level and the Beer-Lambert Law will not be valid anymore. With
modern spectrometers a limit is reached at a value of 3 a.u. The limit of a linear
relationship between concentration and absorbance is caused by stray light and an
asymptotic flattening of the standard curve would occur.107
In summary the obtained results from UV-titration experiments with an estimated
stoichiometry of a 1:1 complex yielded reasonable binding constants for all 3
RGD-peptides. Due to the unsatisfying results of Job plots some additional AFM
-0.1
0.1
0.3
0.5
0.7
0 0.1 0.2 0.3 0.4 0.5 0.6 0.7 0.8 0.9 1
Δ A
[10
-2]
Molar Fraction xs
0
0.2
0.4
0.6
0.8
1
1.2
0 0.1 0.2 0.3 0.4 0.5 0.6 0.7 0.8 0.9 1
Δ A
[10
-2]
Molar Fraction xs
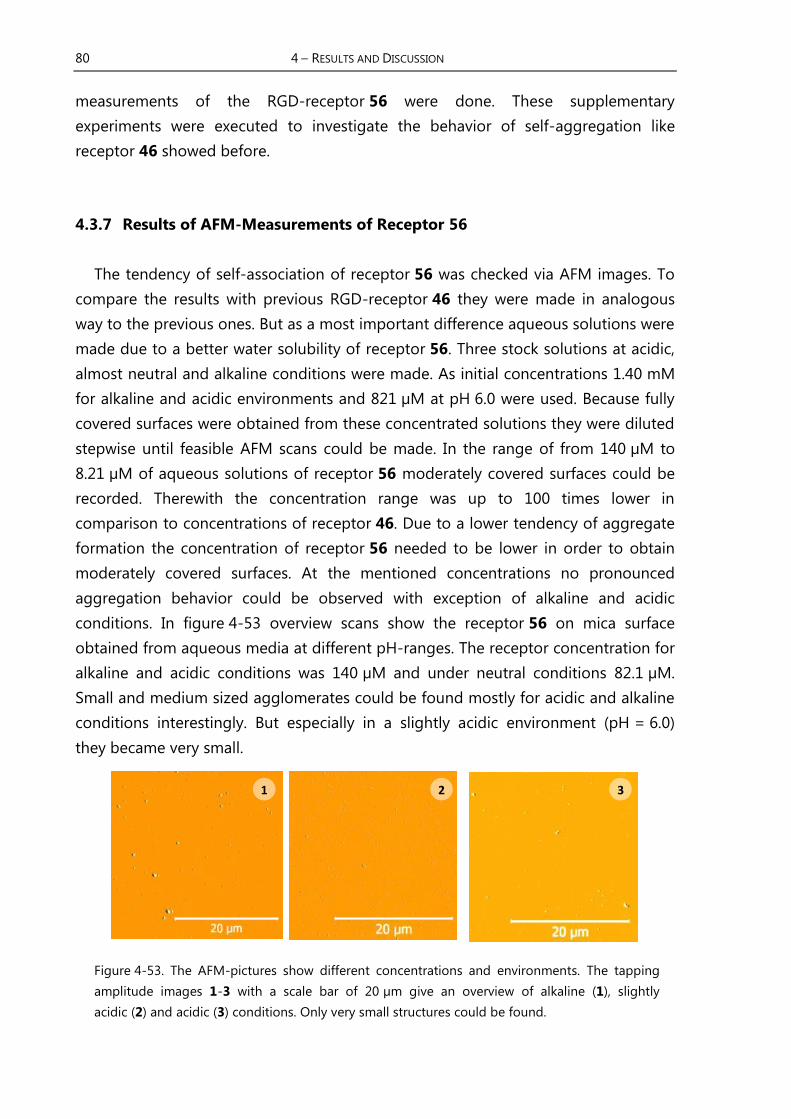
80 4 – RESULTS AND DISCUSSION
measurements of the RGD-receptor 56 were done. These supplementary
experiments were executed to investigate the behavior of self-aggregation like
receptor 46 showed before.
4.3.7 Results of AFM-Measurements of Receptor 56
The tendency of self-association of receptor 56 was checked via AFM images. To
compare the results with previous RGD-receptor 46 they were made in analogous
way to the previous ones. But as a most important difference aqueous solutions were
made due to a better water solubility of receptor 56. Three stock solutions at acidic,
almost neutral and alkaline conditions were made. As initial concentrations 1.40 mM
for alkaline and acidic environments and 821 µM at pH 6.0 were used. Because fully
covered surfaces were obtained from these concentrated solutions they were diluted
stepwise until feasible AFM scans could be made. In the range of from 140 µM to
8.21 µM of aqueous solutions of receptor 56 moderately covered surfaces could be
recorded. Therewith the concentration range was up to 100 times lower in
comparison to concentrations of receptor 46. Due to a lower tendency of aggregate
formation the concentration of receptor 56 needed to be lower in order to obtain
moderately covered surfaces. At the mentioned concentrations no pronounced
aggregation behavior could be observed with exception of alkaline and acidic
conditions. In figure 4-53 overview scans show the receptor 56 on mica surface
obtained from aqueous media at different pH-ranges. The receptor concentration for
alkaline and acidic conditions was 140 µM and under neutral conditions 82.1 µM.
Small and medium sized agglomerates could be found mostly for acidic and alkaline
conditions interestingly. But especially in a slightly acidic environment (pH = 6.0)
they became very small.
Figure 4-53. The AFM-pictures show different concentrations and environments. The tapping
amplitude images 1-3 with a scale bar of 20 µm give an overview of alkaline (1), slightly
acidic (2) and acidic (3) conditions. Only very small structures could be found.
1 2 3

4 – RESULTS AND DISCUSSION 81
Higher concentrations at neutral conditions resulted in overcrowded surfaces but
the particle size kept the same. Even diluted solutions up to 8.21 µM revealed similar
particle sizes. Increased pictures with more detailed scans of figure 4-53 are shown in
figures 6-13, 6-14 and 6-15: There are presented in the experimental section in
chapter 6.9. Although AFM experiments did not represent molecules in solution
results are in accordance to UV-binding studies. Even the tendency of precipitation
of molecule 56 can be explained with these results easily. In the previous purification
of the prepared 56 this property was used to purify the receptor. And finally the
most important result is that RGD-receptor 56 did not show aggregate formation in
the desired pH region of pH 6. The first generation RGD-receptor 46 instead
revealed those problems.
4.4 Conclusions
Synthesis and evaluation of an artificial RGD-receptor which should be able to
recognize RGD-substrates specifically under physiological conditions turned out to
be challenging. Although the results of the theoretical calculations looked promising
with respect to good binding facilities towards RGD-peptides the receptor 46 was
inappropriate (fig. 4-54).
Figure 4-54. Molecule 46 shows the approach to a water-soluble RGD-receptor containing a
guanidiniocarbonyl pyrrole and a phosphate tweezer. The development to a fully water soluble
and RGD-receptor 56 could be achieved by truncation of the aromatic backbone and the
introduction of an additional phosphate group.
First of all the water solubility of the receptor was restricted by the need of
additional 10 % DMSO. The tendency to form rather stable aggregates was assumed
by the evaluation of the first binding studies via UV-titration experiments. Due to the
56 46

82 4 – RESULTS AND DISCUSSION
irregular increases and decreases of the light absorption a competitive aggregation
behavior instead of a defined receptor-substrate-complex formation was considered.
The presence of aggregates could be depicted with supplementary AFM
measurements. Under alkaline conditions some rod-like structures and more
important the presence of spherical particles under acidic and slightly acidic
conditions could be visualized. The estimated size of these particles could be found
in supplemental DLS measurements.
A fully convergent synthesis route with an improvement of the water-solubility
could be developed to yield the ditopic RGD-receptor 56 (fig. 4-54). Secondary the
affinity to form aggregates could be reduced. These assumptions were supported by
additional AFM experiments which revealed no bigger aggregates like molecule 46
revealed.
The second phosphate group might be seen as most important reason for the
improved solubility. But another aspect might be taken into account as well. The
binding site for positively charged guanidinium residue was truncated from the first
RGD-receptor 46 to the enhanced receptor 56. Obviously the cavity of the tweezer
facilitated strong intermolecular interactions of the RGD-receptor 46 itself.
Although the same problem of auto recognition might be possible with
receptor 56 this aspect seemed to play an inferior role. In receptor 46 the backbone
of tweezer residue plays another role called the hydrophobic effect. As shown by
Biedermann et al. the contribution of the hydrophobic effect could not be neglected.
The reason is that high energy water hosted by tweezer s cavity is easy to replace by
an even more suitable quest. Thus an intermolecular complex with a guanidinium
residue is enthalpically and entropically favored.55
Unfortunately the guanidinio function of another receptor molecule could be
trapped within the cavity so that an exchange of guest molecules could be kinetically
hindered. If a kinetical hindrance occurred the exchange with a suitable substrate
molecule might be very slow or nearly impossible. It is assumed that different
aggregates co-exist in solution. The dilution experiment of first RGD–receptor 46
indicated a linear behavior of absorption against concentration (fig. 4-36). This result
could be a false conclusion and rather a stable ratio of different aggregates over a
broad concentration range might be thinkable. In general the absorption behavior
might be less influenced by aggregation formation.
Structures of the self-association could be dimers as well as oligomers arranged in
a head-to-tail arrangement. Last mentioned could be responsible for the rod-like
structures (fig. 4-40 and fig. 4-41) formed under acidic conditions. In figure 4-55 the
receptor 46 is shown in two ways of imaginable self-aggregation states. In both
cases the guanidinio function of the pyrrole residue is hosted by the tweezer. In

4 – RESULTS AND DISCUSSION 83
solution a mixture of different aggregates containing a various number of
molecules 46 is assumed.
The adjusted balance of aggregates in a solution would be in a competition with
the binding sites of titrated quest peptides during the UV-binding study. Even if the
shifts are not significant the overall shape of the UV absorption spectrum varied
unexpectedly (fig. 4-37). This observed behavior could originate from a disturbance
in the composition of aggregates in the mixture.
Figure 4-55. Two proposed kind of aggregates of RGD-receptor 46 are shown. A dimer at the
left side and an oligomer composed by a head-to-tail aggregation at the right side.
Generally the aggregation behavior could be influenced by variation of conditions
like solvent, pH value and competitive guest molecules. Macroscopically the results
could be visualized by AFM experiments. Through the change of protonation state of
molecule 46 different macroscopic aggregates could be obtained. Thereby it could
be shown that receptor 46 was unsuitable for recognition of RGD-sequence.
The improvement of the RGD-receptor showed a striking selectivity towards RGD-
substrates with different extensions of their RGD-loops. Due to the low significance
of the results of the Job plot analyses the evaluation of the data obtained from the
UV-binding studies was done with the assumption of 1:1 complexes being formed
between the host receptor and the guest peptides correspondingly. Therewith
comparisons among the 3 different peptides with respect to their binding affinity
towards the receptor could be estimated only. Even attempts to use fluorescence or
NMR as an observable failed. No significant change during some test titration
experiments could be recorded.
46 · 46 dimer
head-to-tail oligomer

84 4 – RESULTS AND DISCUSSION
The complexation constant of molecule 56 with the linear peptide was inherently
higher than those with cyclic peptides. The constraints of the cyclic peptides forced
the RGD-sequence in a specific conformation. The observed selectivity revealed one
order of magnitude between the penta-peptide P2 and the hexa-peptide P3. This
difference is not really huge compared to other natural receptors. But the obtained
results allow further investigations for improvement to obtain target specific RGD-
receptors in the end.

SUMMARY AND OUTLOOK
The objective of this work was the development of a water-soluble receptor for
small molecular weight peptides containing the RDG-sequence as a recognition unit.
The focus was set on the synthesis of a receptor with a ditopic binding motif and the
evaluation of its binding affinity towards RGD-peptides. Both binding motifs should
be designed in a complementary fashion. Therewith it should be possible to
recognize the negatively charged side chain of the aspartic acid residue and the
positively charged guanidinium group which is part of the arginine amino acid
simultaneously.
Figure 5-1. Structures of the bicyclic diene 10 and the RGD-receptor 46.
In a first approach the 1st generation RGD-receptor 46 (fig. 5-1) could be realized
in a 22-step-synthesis. Partially the synthesis could be managed via convergent
reaction steps like the formation of the tweezer or the triazole. Some further
improvements in the tweezer synthesis could be made. Especially a more efficient
synthesis strategy of the diene 10 could be developed. The yield of the bicyclic
diene 10 could be improved by the change of the polymerization inhibitor in the
initial synthesis step significantly. In addition with the shortening from 6 to 4
5
10 46

86 5 – SUMMARY AND OUTLOOK
synthesis steps the overall yield of the diene 10 (fig. 5-1) was improved from 15 % to
almost 40 %.
Additionally an easy access to un-symmetrical tweezers could be realized within
this work. During the synthesis of the first RGD-receptor 46 the synthesis of the
mono-alkyne tweezer 31 (fig. 5-2) could be developed. But unluckily the water
solubility of the 1st generation RGD-receptor (fig. 5-1) was too low and unsatisfying
for further binding studies with RGD-peptides. Even the characterization of the
receptor precursor 45 and of receptor 46 revealed some problems that were related
to the poor water-solubility of molecule 46. Under acidic, slightly acidic and alkaline
conditions the molecules trended to form aggregates that could be visualized nicely
via AFM. With DLS measurements the size of the aggregates under almost neutral
conditions could be confirmed.
Figure 5-2. Both mono-alkynes the mono-alkyne tweezer 31 and the diphosphate mono-alkyne
tweezer 50 were synthesized via a Williamson ether synthesis and an analogous Williamson
ether synthesis respectively.
In a second approach a supplemental water solubility enhancing group in
combination with a reduced size of the aromatic backbone of the tweezer was
considered. For the realization of a completely water-soluble RGD-receptor an access
towards un-symmetrical tweezers and truncated tweezers containing two phosphate
groups needed to be developed.
The introduction of a second phosphate group yielded the water-soluble
diphosphate mono-alkyne tweezer 50 and the guanidinium binding site 51. The
synthesis of molecule 51 could be realized as a one pot synthesis starting with the
diol 19b (fig. 5-3). In the final synthesis step the RGD-receptor 56 was assembled in a
copper-catalyzed cyclisation reaction. This last reaction facilitated a smart linkage of
both binding motifs in a convergent syntheses strategy. The low molecular weight
RGD-receptor 56 was synthesized in an overall yield of 3 % with respect to the
synthesis of molecule 51.
Generally the syntheses of the basic building blocks followed the standard
synthesis protocols. Some improvements with respect to the yield and the efficiency
could be made. Especially the synthesis route of the tweezer building block was
31 50

5 – SUMMARY AND OUTLOOK 87
shortened by two reaction steps. The synthesis of azido pyrrole 32 revealed some
stability problems. The fast decomposition of azido pyrrole 37 during the
deprotection step could be circumvented by an introduction of the azide at the
unprotected pyrrole 43.
Figure 5-3. The synthesis of the truncated mono alkyne diphosphate tweezer 51 was carried out
in a one pot synthesis. The convergent synthesis of the diphosphate mono-alkyne 51 with the
pyrrole azide 32 was executed via a 1,3-dipolar cycloaddition.
The characterization of both synthesized RGD-receptors turned out to be
complicated. Due to intermolecular interactions caused by processes of self-
assembly the NMR spectrum was influenced for example. The more functional
groups became unprotected the more distinct the peak broadening appeared in the
spectrum. Within the second approach the aim of a totally convergent synthesis
strategy could be applied. This allowed an easier characterization of the separated
building blocks until the last reaction step.
The UV-binding studies of the receptor 56 under slightly acidic conditions could
be carried without further problems. The evaluation of the complex stoichiometry via
Job s method yielded insignificant results so that host-guest systems with
stoichiometry of a 1:1 were assumed. This new receptor showed somehow a specific
recognition affinity towards cyclic RGD-peptides. This could be seen by an increase
of the association constant from the penta-peptide P2 towards the hexa-peptide P3
and the linear RGD-peptide P1. The highest binding constants could be recorded
using the linear RGD-tripeptide P1. Herewith an association constant of KA = 3.4*104
M-1 was found taking a 1:1 complex into account. Compared to the first synthetic
RGD-receptor the KA -value with linear RGD-peptide could be improved by two
orders of magnitude. This first receptor was the trisphosphonate receptor developed
by Schrader et al. (fig. 2-5). It showed even the same trend to form stronger
51 19b
56
32

88 5 – SUMMARY AND OUTLOOK
complexes with the flexible and linear RGD peptide (KA = 1300 M-1) compared to the
cyclic peptide cyclo(RGDfV) (KA = 700 M-1).43
Last mentioned receptor showed rather marginal affinity difference between the
cyclic and the free RGD peptide. Only half an order of magnitude could be achieved
in difference of selectivity. Whereas the newly developed water-soluble RGD-
receptor 56 showed a slightly higher selectivity between the penta-peptide
(KA = 4,300 M-1) towards linear peptide (KA = 34,000 M-1).
One big advantage of the newly developed receptor synthesis is the flexibility in
the linker length. Based on the concept of separated binding sites connected via a
linker and a convergent synthesis this strategy enables a rather fast development of
new receptor molecules. This method can be used efficiently to generate different
RGD-receptors with dissimilar selectivity and binding properties towards different
RGD-peptides more efficiently. Although the objective intended the synthesis of a
RGD-receptor containing a full tweezer as binding site for guanidinium residue, it
could be shown that a truncated version of the tweezer could afford easier synthesis
impressively. Even solubility problems could be circumvented by the diminishment of
the tweezer building block.
Nevertheless the results of this work can be used to design tailor-made RGD-
receptors by the additional usage of space demanding residues at the linker.
Through the truncation of the tweezer and therefore the loss of the hydrophobic
aromatic backbone the solubility should not suffer by further residue attachment.
The introduction of small residues like methyl or ethyl-side chains for example might
have some impact on the selectivity between different RGD-peptide due to their
different conformation.
For further research promising results can be expected. Especially when the
selectivity of new RGD-receptors can be triggered easily the new receptors could be
tested against integrin peptides like vitronectin or fibronectin. This route of research
might lead in final application for pharmaceuticals or their evaluation, if they are
based on RGD-recognition.

EXPERIMENTAL SECTION
6.1 General Procedures of Synthesis and Analysis
Syntheses. All air and moisture sensitive reactions were carried out under argon
(purity: 99,996 %) from Linde. Obtained solid products were either dried over silica
gel (orange) or were freeze dried with an Alpha 1-4 LD Plus lyophilizer from Christ. A
magnetic stirrer with heating function MR 3001K 800W from Heidolph was used for
conventional syntheses. High temperature reactions were performed with a heating
mantle PILZ® from Heraeus. Microwave-assisted syntheses were carried out with a
Discover SPS System from CEM. Temperature controls of those reactions were
performed by infrared sensor. For all vacuum techniques membrane pumps and oil
pumps from Vacuubrand were used. Removal of solvents from reaction mixtures
were performed under reduced pressure with rotary evaporator Laborota 4000
efficient and HB digital water bath from Heidolph.
Peptide syntheses were carried out on solid phase. The used synthesis strategy of
solid phase peptide synthesis (SPPS) is based on already reported procedure.60 As
main difference the coupling reaction was carried out at room temperature in a
Rotamax 120 peptide shaker from Heidolph. During the reaction all vessels were
flushed with argon to prevent from any side reactions by moisture. As coupling
agent PyBOP was used. For cyclic peptides the very labile chlorotrityl chloride resin
was used to prevent from loss of sidechain protection of the linear peptide strand.
Solvents. Water was always used as fully desalinated water, which was obtained by
Barnstead™ MicroPure™ from Thermo Fisher (formerly TKA). The electric
conductance of the used water was below 0.070 µS. Other used solvents for reactions
agreed the specification of American Chemical Society (ACS). If needed pure solvents
were obtained by distillation of ACS-grade solvents. Subsequently purified solvents
6

90 6 – EXPERIMENTAL SECTION
were stored over molecular sieves and flushed with argon. Water-free solvents were
obtained by following procedures108:
Diethyl ether was refluxed with sodium and benzophenone as indicator and
distilled afterwards. Dichloromethane was heated to reflux with calcium carbonate
and distilled subsequently. Dimethylformamide and tert-butanol were refluxed with
calcium hydride and distilled afterwards.
Solvents used for analytical purpose with HPLC-grade were purchased by VWR and
Waters. Deuterated solvents for NMR-measurements were obtained from Deutero
and Sigma Aldrich.
NMR spectroscopy. 1H-, 13C- and 31P NMR spectra of solutions were recorded with
DMX300, DRX500 and an Advance III HD 600 from Bruker. If not mentioned elsewise
the spectra were recorded at 298 K (corresponding to room temperature). High
temperature and two dimensional measurements like DEPT135, COSY90, HSQC and
HMBC were recorded with the DRX500 machine respectively. Acquisition of 31P NMR
was done in proton decoupled mode except it is mentioned differently. Chemical
shifts are given in ppm and refer to the δ-scale were standardized by the following
solvent residual peaks: 1H NMR: CDCl3 (δ = 7.26), DMSO-d6 (δ = 2.50), CD3OD
(δ = 3.31), DMF-d7 (δ = 2.75, 2.92, 8.03); 13C NMR: CDCl3 (δ = 77.16), DMSO-d6
(δ = 39.52) and CD3OD (δ = 49.00), DMF-d7 (δ = 29.76, 34.89, 163.15). The
multiplicities of signals are abbreviated as followed: s = singlet, bs = broad singlet,
d = duplet, t = triplet, q = quartet, m = multiplet. Evaluation of the spectra was done
with the programs TOPSPIN versions 2.1 and 3.0.b.7 and ACD/NMR Processor
Academic Edition. The latter one was mainly used to evaluate the J-coupling-values
of 1H NMR spectra with poor resolution.
High performance liquid chromatography-mass spectrometry (HPLC-MS).
HPLC-MS-analyses for reaction control were performed with a combined system of
an Accela HPLC and a LCQ Fleet™ Ion Trap Mass Spectrometer of Thermo Fisher. For
chromatography a Zorbax Eclipse XDB-C18 with a length of 150 mm and an inner
diameter of 4.6 mm from phenomenex was used. Particle size of stationary phase
was 5 µm and pore size was 8 nm. UV-detection occurred at 210 nm. For negative
ionization mode a standardized gradient run with 5 mM ammonia acetate solutions
of water and acetonitrile as eluent was used.
High performance liquid chromatography (HPLC). Analytical reversed phase
HPLC-experiments were performed on Thermo Fisher (formerly Dionex) system
consisting of a HPLC-pump, model P680, an auto sampling injection system, model

6 – EXPERIMENTAL SECTION 91
ASI 100 Automated Sample Injector and an UV detection device, model UVD 340U.
Analytical and semi-preparative chromatography was done with columns from YMC.
Analytical columns had a length of 150 mm and inner diameter of 3.0 mm. The semi-
preparative column had a length of 250 mm and an inner diameter of 4.6 mm. Both
kinds of columns were filled with RP-18 YMC-Pack ODS-A solid phase with a particle
size of 5 µm and a pore size of 12 nm. Evaluation was done with the program
Chromeleon 6.80 developed by Dionex. Normal phase HPLC was performed on a
multicomponent system containing a Hitachi L-6200A Intelligent pump from Merck,
degasser ERC-3512 from Erma and a Knauer UV Detector 2600. Assembled by SCPA
the HPLC was controlled by the program Chromstar 7 from SCPA. For separation a
column with a length of 250 mm and an inner diameter of 4 mm filled with
NUCLEOSIL® 100-7 with particle size of 7 µm and a pore size of 100 Å from
Macherey-Nagel.
Preparative HPLC was carried out with two different multicomponent systems. Both
systems were assembled by SCPA and run under the program PrepCon 5. The first
preparative system consisted of a Septech pump from Merck, a single UV-detector
SPD-10A from Shimadzu. The second HPLC system consisted of a HPLC pump Azura
P 2.1L from Knauer, a UV/VIS diode array detector TIDAS S 500 from J&M and a
Vario 4000 fraction collector from LABOCOL. Both preparative HPLC machines were
equipped with a manual injection valve from Rheodyne. Columns used for
preparative purification were obtained from YMC and had same specification of silica
like analytical column.
Medium performance liquid chromatography (MPLC). Quantitative MPLC with
reversed phase was elaborated on a device from Armen Instrument, model Liquid
Chromatography Flash. For purifying reusable glass columns ECOPLUS model
TAC25/500LS0-SR-2 and TAC25/250LS0-SR-2 from Kronlab were used. RP-18 bulk
material from YMC with particle size of 50 µm or 15 µm and a pore size of 12 nm
respectively was used as solid phase.
Thin layer chromatography (TLC). Different sorts of TLC plates from Macherey-
Nagel were used for reaction control: For normal phase POLYGRAM® SIL G/UV254
(TLC plastic sheets coated with 0.2 mm silica gel and fluorescent indicator, UV-
detection at λ = 254 nm) were used. For reversed phase ALUGRAM® RP-18W/UV254
(TLC aluminum sheets coated with 0.15 mm silica gel and fluorescent indicator, UV-
detection at λ = 254 nm) were applied. Eluent mixtures are given in volume fractions
of the used solvents (v1/v2). For UV-detection a Nu-4 KL UV lamp with wavelengths
254 nm and 366 nm from Benda was used.

92 6 – EXPERIMENTAL SECTION
Column chromatography. Quantitative column chromatography was carried out
with normal phase silica gel from Macherey-Nagel: MN silica gel 60 M,
0.04-0.063 mm / 230-240 mesh ASTM. Mixtures of eluents are specified in volumetric
contents of used solvents (v1/v2).
Mass spectroscopy. Samples were diluted in a 1 to 10 micro-molar solution of
methanol (HPLC-grade) and injected automatically via HPLC-Pump 1100 Series from
Agilent Technologies and a Gerstel CTC-MPS3-auto-sampler (flow injection). The
IonTrap mass spectrometer amaZon SL form Bruker was used for reaction control.
High resolution measurements of purified products were recorded with maXis 4G, a
Q-TOF mass spectrometer, or with a BioTOF III from Bruker. GC-MS experiments
were performed with the quadrupole spectrometer HP 5973N MSD from Agilent.
Chromatographic separation was supported by a DB5-MS-column with a length of
50 m, an inner diameter of 200 µm and a coating thickness of 330 nm. Masses
obtained by GC-MS represent only nominal masses.
IR-infrared spectroscopy. IR-spectra were recorded by a JASCO-spectrometer
model FT/IR 430 with diamond equipped optics. Absorption bands were given in
wave numbers ( ) [cm-1] and intensities with the following abbreviations: vs = very
strong, s = strong, m = medium, w = weak, br = broad.
UV-Measurements. To obtain binding constants from UV measurement a V-660
spectrophotometer from Jasco was used. Adjustment of pH-values was done with
standard solutions of sodium hydroxide (1.0 M and 0.1 M) and hydrochloric acid
(1.0 M and 0.1 M). With a calibrated Hamilton Minitrode attached to a pH-Meter 766
Calimatic from Knick the pH-value was monitored. Transfers of volumes were
executed with calibrated pipettes from Eppendorf.
AFM-Measurements. AFM-images were obtained by an Innova Scanning Probe
Microscope (SPM) equipped with an Atomic Force Microscope (AFM) Nano Drive.
The machine is provided by Veeco company and acquired by Bruker. N-doped silicon
cantilevers of type AC 160TS from Olympus were used as scanning probes. Samples
were prepared via spin coating with 60 rps on mica surfaces acquired from Plano.
Analysis of all images was done with computer program Gwiddion 2.40.

6 – EXPERIMENTAL SECTION 93
Melting Point. A Melting Point B-540 apparatus from Büchi was used to determine
melting points with open glass capillaries. All measured melting points are
uncorrected.
DLS-Measurements. A Zetasizer Nano ZS from Malvern with a 633-nm He-Ne was
used. Measurements were performed at an operation angle of 173° with noninvasive
back scattering (NIBS) technology. The software used to collect and analyze the data
was the Dispersion Technology Software version 7.02 from Malvern. Each sample was
measured 5 times with automatically selected measurement duration at 20 °C, 25 °C
and 40 °C respectively.
6.2 Syntheses of Basic Molecules of the Tweezer
Synthesis of endo-1,4-methano-1,2,3,4-tetrahydronaphthalene-2,3-dicar-
boxylic acid anhydride (20)
A solution of 50.0 g (430 mmol) of freshly distilled indene and 200 ml tetraline was
added to 42.2 g (430 mmol) of maleic anhydride and 748 mg (3.75 mmol) of pheno-
thiacine under inert gas. The reaction mixture was stirred and heated under reflux for
3.5 h with a heating mantle. After cooling down to 100°C the mixture was poured
into 200 ml 70 – 80 °C warm toluene under rigorous stirring. The precipitate was
filtered off with a G4-frit (pore size 10-16 µm) until a temperature of 40 – 50 °C was
reached. The filtrate was kept in the fridge overnight to give a precipitating
crystalline solid. The solid was filtered and dried over silica gel. Recrystallization from
hexane/ethyl acetate resulted in a colorless crystalline solid (20) with a yield of 50%
(45.9 g, 214 mmol).
Molecular Weight: 214.22 g/mol.
Formula: C13H10O3.
Rf-value: 0.74; SiO2, n-hexane/ethyl acetate (1/1).
Melting point: 187 °C (ethyl acetate).

94 6 – EXPERIMENTAL SECTION
Spectroscopic data and assignment of molecule positions:
1H NMR: (300.1 MHz, DMSO-d6): δ [ppm] = 1.94 - 1.95 (t, 3JH-9a,H-9s/H-1,H-4 =
1.36 Hz, 2 H, H-9a, H-9s), 3.78 (m, 2 H, H-2, H-3), 3.93 (dd, 3JH-1,H-4/H-2,H-3 = 3.32 Hz, 3JH-1,H-4/H-9a,H-9s = 1.36 Hz, 2 H, H-1, H-4),
7.14 - 7.22 (m, 4 H, H-5, H-6, H-7, H-8).
HRMS: (ESI pos., methanol/water): m/z = 215.0703 (calculated) for
C13H10O3 + H+, 215.0733 (found), m/z = 269.0784 (calculated) for
C14H14O4 + Na+, 269.0818 (found).*
* Additional mass resulted from nucleophilic opening of
anhydride by methanol, which occurred during ionization
process probably.
Synthesis of endo-cis-2,3-bis(hydroxymethyl)-1,4-methano-1,2,3,4-tetrahydro-
naphthalene (21)
A solution of 38.1 g (178 mmol) of anhydride 20 in 500 ml THF abs. was added to a
0° C cold suspension of 23.1 g (609 mmol) lithium aluminum hydride in 200 ml THF
abs. by a syringe under inert gas. The reaction mixture was stirred for 30 min at 0° C
and additional 18.5 h under reflux. Afterwards the mixture was cooled down to 0° C
again and hydrolyzed by a magnesium sulfate solution of 20 ml slowly. The mixture
was heated under reflux for 30 min. The remained solid was separated by filtration
and washed with diethyl ether until no product remained in the filtrate (via TLC!) The
collected organic layers were evaporated under reduced pressure. The remained
solid was lyophilized to yield 99 % (35.8 g, 12 mmol) of diol 21.
Molecular Weight: 204.27 g/mol.
Formula: C13H16O2.

6 – EXPERIMENTAL SECTION 95
Rf-value: 0.21; SiO2, n-hexane/ethyl acetate (1/1).
Melting point: 100-102 °C (diethyl ether).
Spectroscopic data and assignment of molecule positions:
1H NMR: (300.1 MHz, DMSO-d6): δ [ppm] = 1.63 - 1.70 (m, 2 H, H-9a,
H-9s), 2.41 - 2.46 (m, 2 H, H-2, H-3), 2.60-2.68 (m, 2 H, H-10,
H-11)*, 2.82 - 2.90 (m, 2 H, H-10, H-11)*, 3.29 (m, 2 H, H-1, H-4),
4.33 - 4.36 (m, 2 H, H-12, H-13), 7.01 - 7.06 (m, 2 H, H-6, H-7),
7.13 - 7.18 (m, 2 H, H-5, H-8).
* Double signal set resulted from the diastereotopic protons.
13C NMR: (75.5 MHz, DMSO-d6): δ [ppm] = 42.9 (C-2, C-3), 46.4 (C-1, C-4),
48.7 (C-9), 60.1 (C-10, C-11), 122.6 (C-5, C-8), 125.0 (C-6, C-7),
145 (C-4a, C-8a).
HRMS: (ESI pos., methanol/water):
m/z = 227.1043 (calculated) for C13H16O2 + Na+, 227.1066
(found),
m/z = 243.0782 (calculated) for C13H16O2 + K+, 243.0714 (found).
Synthesis of endo-cis-2,3-bis(chloromethyl)-1,4-methano-1,2,3,4-tetrahydro-
naphthalene (22)
Under inert gas 64.2 g (193 mmol) triphenylphosphine dichloride were dissolved in
150 ml DCM. The mixture was added dropwise to a solution of 27.8 g (408 mmol)
imidazole dissolved in 75 ml acetonitrile and 78 ml pyridine. During the addition the

96 6 – EXPERIMENTAL SECTION
temperature was kept at 0 °C. After 20 min of further stirring at room temperature a
solution of 10.5 g (51.4 mmol) of the diol 21 in 8 ml DCM was added. The addition
occurred in small portions within 10 min. Afterwards the reaction mixture was heated
to 55 °C for 5 h. The end of the reaction was indicated by TLC-control. The reaction
mixture was cooled to room temperature and hydrolyzed with a mixture of 200 ml of
half conc. HCL and ice water in a 1:1 ratio. The different phases were separated after
further addition of 150 ml DCM. The aqueous phase was extracted 5 times with
150 ml DCM. The combined organic phases were washed one time with 150 ml of
2 M HCl-solution, water and saturated NaHCO3-solution respectively. Subsequently
the organic phases were dried over sodium sulfate and filtrated. The filtrate was kept
in a fridge overnight and the precipitate was filtered off. After washing the filtration
residue with ice cold DCM the volume of the filtrate was reduced by evaporation
under reduced pressure. By repeated crystallization and subsequent washing the
amount of the side-product triphenylphosphine oxide could be reduced. After
3 times of repetitive crystallization the solvent was removed and the obtained raw
product (15.5 g) was purified by flash chromatography (SiO2, n-hexane/ethyl acetate
3/1). Because of an insufficient purity the chromatography was done repeatedly to
yield 82 % (10.2 g, 42.1 mmol) of dichloride 22 as colorless oil.
Molecular Weight: 241.16 g/mol.
Formula: C13H14Cl2.
Rf-value: 0.77; SiO2, n-hexane/ethyl acetate (3/1).
Boiling point: 97-100 °C (0.5 mbar).
Spectroscopic data and assignment of molecule positions:
1H NMR: (300.1 MHz, CDCl3): δ [ppm] = 1.83 (dt, 2JH-9s/H-9a = 8.79 Hz,
3JH-9s/H-1,H-4 = 1.41 Hz, 1 H, H-9s), 1.97 (dt, 2JH-9a/H-9s = 8.79 Hz, 3JH-9a/H-1,H-4 = 1.41 Hz, 1 H, H-9a), 3.02-3.05 (m, 2 H, H-2, H-3),
3.20-3.27 (m, 4 H, H-10, H-11), 3.32-3.38 (m, 2 H, H-1, H-4), 7.10-
7.15 (m, 2 H, H-6, H-7), 7.20-7.23 (m, 2 H, H-5, H-8).

6 – EXPERIMENTAL SECTION 97
Synthesis of 2,3-dimethylen-1,4-methano-1,2,3,4-tetrahydronaphthalene (10)
A mixture of 3.72 g (15.4 mmol) of the dichloride 22 and 900 mg (3.40 mmol) of
crown ether (18-Crown-6) dissolved in 150 ml of dry THF was cooled to 0 °C. 1.49 g
(265 mmol) of powdered potassium hydroxide and 644 mg (3.88 mmol) of potassium
iodide were added in one portion and reaction mixture was stirred for 18 h at room
temperature. The end of the reaction was indicated by TLC. Subsequently the solvent
was evaporated under reduced pressure and the obtained raw product was purified
by flash chromatography (SiO2, n-hexane). The diene 10 was obtained as a colorless
and crystalline solid in a yield of 99 % (2.56 g, 15.2mmol).
Molecular Weight: 168.24 g/mol.
Formula: C13H12.
Rf-value: 0.43; SiO2, n-hexane.
Melting point: 84 °C (n-hexane).
Spectroscopic data and assignment of molecule positions:
1H NMR: (300.1 MHz, DMSO-d6): δ [ppm] = 1.94 (dt, 2JH-9s/H-9a = 8.68 Hz,
3JH-9s/H-1,H-4 = 1.57 Hz, 1 H, H-9s), 2.12 (dt, 2JH-9a/H-9s = 8.68 Hz, 3JH-9a/H-1,H-4 = 1.54 Hz, 1 H, H-9a), 3.84 (t, 3JH-1,H-4/H-9s,H-
9a = 1.54 Hz, 2 H, H-1, H-4), 5.06 (s, 2 H, H-10e, H-11e), 5.20 (s,
2 H, H-10z, H-11z), 7.06-7.09 (m, 2 H, H-6, H-7), 7.20-7.23 (m,
2 H, H-5, H-8).
GC-MS: (EI neg., 70 eV): m/z = 167.23 (calculated) for C13H12-, 167 (found)
at a retention time of 35.18 min.

98 6 – EXPERIMENTAL SECTION
Synthesis of 1,4,4a,8a-tetrahydro-endo-1,4-methanonaphthalene-5,8-dione
(16)
A suspension of 77.7 g (719 mmol) of p-benzoquinone in 415 ml methanol was
cooled to 0 °C. To this suspension 47.5 g (719 mmol) of freshly distilled cyclo-
pentadiene kept at -78 °C was added slowly via dropping funnel. The reaction
mixture was stirred for 3 h at room temperature after addition of the cyclopenta-
diene. The reaction mixture was stored in a fridge overnight. The precipitate of
greenish yellow crystals was filtered by a glass frit G4 (pore size 10-16 µm).
Precipitation was done repeatedly with consequent reducing of the volume of
previous filtrate by evaporation. The total yield of naphtalene dione 16 was 56 %
(70.4 g, 404 mmol).
Molecular Weight: 174.20 g/mol.
Formula: C11H10O2.
Rf-value: 0.41; SiO2, n-hexane/ethyl acetate (2/1).
Melting point: 72-73 °C (methanol).
Spectroscopic data and assignment of molecule positions:
1H NMR: (300.1 MHz, CDCl3): δ [ppm] = 1.35 (dt, 2JH-9s/H-9a = 8.45 Hz,
3JH-9s/H-1,H-4 = 1.77 Hz, 1 H, H-9s), 1.45 (dm, 2JH-9a/H-9s = 8.45 Hz,
1 H, H-9a), 3.27-3.28 (m, 2 H, H-4a, H-8a), 3.34-3.38 (m, 2 H, H-1,
H-4), 6.02 (t, 3JH-2,H-3/H-1,H-4 = 1.77 Hz, 2 H, H-2, H-3), 6.62 (s, 2 H,
H-6, H-7).
HRMS: (ESI, pos., methanol/water): m/z = 175.0754 (calculated) for
C11H10O2 + H+, 175.0761 (found), m/z = 197.0573 (calculated) for
C11H10O2 + Na+, 197.0589 (found).

6 – EXPERIMENTAL SECTION 99
Synthesis of (1R,4S)-1,4-dihydro-1,4-methanonaphthalene-5,8-dione (17)
In 85 ml chloroform 12.0 g (68.9 mmol) of dione 16 were dissolved and 135 µl
(97.9 mg, 968 µmol) triethylamine were added. After stirring the mixture for 90 min
at room temperature 7.45 g (68.9 mmol) of p-benzoquinone dissolved in 10 ml
chloroform were added. The reaction was heated to 49 °C for 21.5 h. A full
conversion was indicated by TLC. The mixture was cooled in a fridge for two hours
and the precipitate was filtered. The filtrate was washed once with 100 ml of 1 %
sodium hydroxide solution. After additional washing with 40 ml water the remaining
organic phase was dried with magnesium sulfate. Afterwards the solvent was
evaporated under reduced pressure until brownish oil remained. The purification of
the raw product (11.5 g) occurred via flash chromatography (SiO2, n-hexane/ ethyl
acetate 2/1) to yield 65 % (7.66 g, 44.5 mmol) of the dione 17.
Molecular Weight: 172.18 g/mol.
Formula: C11H8O2.
Rf-value: 0.38; SiO2, n-hexane/ethyl acetate (2/1).
Melting point: 68 °C (ethyl acetate).
Spectroscopic data and assignment of molecule positions:
1H NMR: (300.1 MHz, CDCl3): δ [ppm] = 2.26 (dt, 2JH-9s/H-9a = 7.09 Hz,
3JH-9s/H-1,H-4 = 1.45 Hz, 1 H, H-9s), 2.33 (dt, 2JH-9a/H-9s = 7.09 Hz, 3JH-9a/H-1,H-4 = 1.49 Hz, 1 H, H-9a), 4.09-4.11 (m, 2 H, H-1, H-4),
6.57 (s, 2 H, H-6, H-7), 6.93 (t, 3JH-2,H-3/H-1,H-4 = 1.92 Hz, 2 H, H-2,
H-3).
13C NMR: (75.5 MHz, CDCl3) : δ [ppm] = 48.6 (C-1, C-4), 74.0 (C-9), 135.9
(C-6, C-7), 142.7 (C-2, C-3), 160.9 (C-4a, C-8a), 184.2 (C-5, C-8).

100 6 – EXPERIMENTAL SECTION
Synthesis of (1R,4S,4aR,5R,8S,9aS)-1,4,4a,5,8,9a-hexahydro-1,4:5,8-dimethano-
anthracene-9,10-dione (19a)
In an argon flushed reaction vessel 6.42 g (37.3 mmol) of p-quinone 17 were
dissolved in 35 ml toluene and cooled to -78 °C. After dropwise addition of 3.63 ml
(2.90 g, 43.9 mmol) of freshly distilled cyclopentadiene the mixture was stirred at
room temperature for 24 h. Subsequently the precipitate was filtered and the filtrate
was treated separately. Toluene was removed under reduced pressure from filtrate
and both solids were dried over silica under reduced pressure. The yield of syn- and
anti-product in total was 99 % (8.82 g, 37.0 mmol). Separation of syn-product 19a
from undesired anti-product 18 was performed by recrystallization from cyclo-
hexane/ethyl acetate (1/1). After five recrystallization processes a syn/anti ratio of
46.3 : 1 could be obtained from the first precipitate. The second precipitate yielded a
syn/anti ratio of 35.0 : 1. The calculation of the ratio was done by 1H NMR-signal of
newly formed double bond (see appendix). The obtained yield of the purified syn-
dione 19a was 47 % (4.19 g, 17.6 mmol).
Molecular Weight: 238.29 g/mol.
Formula: C16H14O2.
Rf-value: 0.49; SiO2, n-hexane/ethyl acetate (3/1).
Melting point: 155 °C (cyclohexane/ethyl acetate (1/1)).
Spectroscopic data and assignment of molecule positions:
1H NMR: (300 MHz, CDCl3): δ [ppm] = 1.40 (dt, 2JH-12s/H-12a = 8.77 Hz,
3JH-12s/H-1,H-4 = 1.35 Hz, 1 H, H-12s), 1.49 (dt, 2JH-12a/H-12s = 8.77 Hz, 3JH-12a/H-1,H-4 = 1.79 Hz, 1 H, H-12a), 2.14 (dt, 2JH-11s/H-11a = 7.25 Hz, 3JH-11s/H-5,H-8 = 1.46 Hz, 1 H, H-11s), 2.22 (dt, 2JH-11a/H-11s = 7.25 Hz, 3JH-11a/H-5,H-8 = 1.43 Hz, 1 H, H-11a), 3.22-3.27 (m, 2 H, H-4a,
H-9a), 3.45-3.49 (m, 2 H, H-1, H-4), 3.96-3.99 (m, 2 H, H-5, H-8),

6 – EXPERIMENTAL SECTION 101
5.79 (t, 3JH-2,H-3/H-1,H-4 = 1.76 Hz, 2 H, H-2, H-3), 6.77 (t, 3JH-6,H-7/H-5,H-8 = 1.91 Hz, 2 H, H-6, H-7).
Synthesis of (1R,4S,5R,8S)-1,4,5,8-tetrahydro-1,4:5,8-dimethanoanthracene-
9,10-diol (19b)
Under argon 2.43 g (10.2 mmol) of syn-dione 19a were dissolved in 250 ml dried
ethanol. The solution was degassed and 50 ml of sodium hydroxide solution (10 %)
were added. By stirring for 10 min at room temperature the mixture changed the
colour from colorless to an intense orange. The color changed to colorless again
after addition of 45 ml of hydrochloric acid (15 %) and stirring for 5 min.
Subsequently reaction mixture was poured on 150 g ice. The precipitate was filtered
over a G4-glass frit (pore size 10-16 µm) and washed with 30 ml cold water. Because
of very fine crystals of the precipitate it was dissolved in THF and solvent was
evaporated to yield 94 % (2.28 g, 9.06 mmol) of diol 19b.
Molecular Weight: 238.29 g/mol.
Formula: C16H14O2.
Rf-value: 0.35; SiO2, n-hexane/ethyl acetate (3/1).
Melting point: 260 °C (decomposition).
Spectroscopic data and assignment of molecule positions:
1H NMR: (300.1 MHz, DMOS-d6): δ [ppm] = 1.96 (dt, 2JH-11s,H-12s/H-11a,H-12a =
6.53 Hz, 3J H-11s,H-12s/H-1,H-4,H-5,H-8 = 1.35 Hz, 2 H, H-12s), 2.26 (dt, 2JH-11a,H-12a/H-11a,H-12s = 6.53 Hz, 3JH-11a,H-12a/ H-1,H-4,H-5,H-8= 1.51 Hz,
2 H, H-11a, H-12a), 3.97-3.99 (m, 4 H, H-1, H-4, H-5, H-8), 6.75 (t,

102 6 – EXPERIMENTAL SECTION
3JH-2,H-3,H-6,H-7/H-1,H-4,H-5,H-8 = 1.67 Hz, 4 H, H-2, H-3, H-6, H-7), 8.03
(s, 2 H, H-9, H-10). 13C NMR: (75.5 MHz, DMSO-d6) : δ [ppm] = 46.2 (C-1, C-4, C-5, C-8), 69.3
(C-11, C-12), 135.2 (C-4a, C-8a, C-9a, C-10a), 139.7 (C-9, C-10),
142.7 (C-2, C-3, C-6, C-7).
Synthesis of (1R,4S,5R,8S)-1,4,5,8-tetrahydro-1,4:5,8-dimethanoanthracene-
9,10-diyl acetate (15)
A suspension of 3.50 g (14.7 mmol) of syn-dione 19a, 180 mg (1.47 mmol) DMAP
and 25 ml of dry pyridine was cooled to 0 °C. Under inert gas 9 ml (9.72 g,
95.2 mmol, 6.5 eq) of acetic anhydride were added dropwise to the previous
suspension. The reaction mixture was stirred for 2 h at room temperature and further
8 h at 50 °C. The reaction was quenched by pouring the mixture into 70 ml of a
mixture of ice and water. The precipitate was filtered by a G4-frit (pore size
10-16 µm). The obtained solid was washed with ice cold water until a neutral
pH-value could be reached. The solid was dried over silica under reduced pressure.
The recrystallization was carried out with chloroform/ethanol (1/4) to yield 94 %
(4.40 g, 13.8 mmol) of diacetoxy anthracene 15.
Molecular Weight: 322.36 g/mol.
Formula: C20H18O4.
Rf-value: 0.32; SiO2, n-hexane/ethyl acetate (3/1).
Spectroscopic data and assignment of molecule positions:

6 – EXPERIMENTAL SECTION 103
1H NMR: (300.1 MHz, CDCl3): δ [ppm] = 2.21 (dt, 2JH-11s,H-12s/ H-11a,H-12a =
7.10 Hz, 3JH-11s,H-12s/H-1,H-4,H-5,H-8 = 1.47 Hz, 2 H, H-11s, H-12s), 2.26
(dt, 2JH-11a,H-12a/H-11s,H-12s = 7.10 Hz, 3JH-11a,H-12a/H-1,H-4,H-5,H-8 =
1.34 Hz, 2 H, H-11a, H-12a), 2.34 (s, 6 H, H-13, H-14), 3.80-3.82
(m, 4 H, H-1, H-4, H-5, H-8), 6.75 (t, 3JH-2,H-3,H-6,H-7/H-1,H-4,H-5,H-8 =
1.81 Hz, 4 H, H-2, H-3, H-6, H-7).
6.3 Syntheses of Guanidiniocarbonyl Pyrroles
Syntheses of fully orthogonal protected guanidinocarbonyl pyrrole 35 have been
described before in diploma thesis in 2009. Therefore it will not be described here
again. The initial synthesis steps of guanidinocarbonyl pyrrole 40 will not be
explained either because the BOC-protected precursor was mainly synthesized by
supervised apprentices and regular laboratory staff. Therefore only further
modifications of the guanidinocarbonyl pyrroles will be explained in following
syntheses.
Synthesis of 5-((N-((benzyloxy)carbonyl)carbamimidoyl)carbamoyl)-4-(3-
methoxy-3-oxopropyl)-3-methyl-1H-pyrrole-2-carboxylic acid (36)
A solution of the orthogonal protected pyrrole 35 (900 mg, 1.85 mmol) in DCM
(14.0 ml) and TFA (4.50 ml) was stirred for 20 h at room temperature. The reaction
was quenched through the addition of 10 ml of water. The product started to
precipitate as a colorless solid immediately. The volatile solvent was evaporated
under reduced pressure subsequently. The remaining suspension was lyophilized to
yield the pyrrole 36. Without supplementary purification a yield of 94 % (750 mg,
1.74 mmol) could be obtained.
Molecular Weight: 430.42 g/mol.
Formula: C20H22O7N4.

104 6 – EXPERIMENTAL SECTION
Rf-value: 0.00; SiO2, n-hexane/ethyl acetate (1/1).
Melting point: 270 °C (decomposition).
Spectroscopic data and assignment of molecule positions:
1H NMR: (300.1 MHz, DMOS-d6): δ [ppm] = 2.20 (s, 3 H, H-19), 2.48 (t,
3JH-15/ H-14 = 7.50 Hz, 2 H, H-15), 2.96 (t, 3JH-14/ H-15 = 7.50 Hz, 2 H,
H-14), 3.56 (s, 3 H, H-17), 5.16 (s, 2 H, H-9), 7.34-7.41 (m, 5 H,
H-11, H-12, H-13), 8.21 (bs, 1 H, gua-NH), 8.70 (bs, 1 H, gua-NH),
9.50 (bs, 1 H, gua-NH), 11.03 (s, 1 H, NH, H-1), 11.96 (s, 1 H,
H-20).
FT-IR: (ATR): [cm-1] = 3359 (w), 3184 (w), 1733 (w), 1675 (m), 1614
(m), 1452 (w), 1341 (m), 1249 (m), 1222 (m), 1155 (m), 1091 (m),
960 (m), 771 (m), 733 (m).
HRMS: (ESI, pos., methanol/water): m/z [M]+ calcd for C20H23N4O7+:
431.1561; found: 431.1561.
Synthesis of 4-azidoaniline hydrochloride (57)
Under inert gas 4.38 g (20.0 mmol) of 4-iodo aniline were dissolved in 50 ml
ethanol. After an iterative addition of 318µl (260 mg, 2.95 mmol, 0.15 eq) of N,N-
Dimethylethylenediamine, 9 drops of a 1 M sodium hydroxide solution, 226 mg,
(1.14 mmol, 0.06 eq) of sodium ascorbate, 2.60 g (40.0 mmol, 2.0 eq) of sodium azide
and 499 mg (2.62 mmol, 0.13 eq) of copper(I) iodide the mixture was stirred for 24 h
at 37 °C. The mixture was stirred for further 20 h at 55 °C. Via TLC control the
reaction progress was observed until a full conversion was indicated. The reaction

6 – EXPERIMENTAL SECTION 105
was quenched by pouring the mixture on 200 ml of brine/ethyl acetate mixture (1/1).
The organic phase was separated and the aqueous phase was extracted trice with
50 ml ethyl acetate respectively. The combined organic phases were dried over
magnesium sulfate. The separation by filtration and subsequent evaporation of the
solvent under reduced pressure led to a brown oil which was filtrated over normal
phase silica with ethyl acetate. The final addition of aqueous hydrochloric and
subsequent lyophilization yielded 92 % (3.14 g, 18.5 mmol) of 4-azidoaniline
hydrochloride (57). The purity of the synthesized 4-azidoaniline hydrochloride was
similar to that which was purchased by Sigma-Aldrich.
Molecular Weight: 170.06 g/mol.
Formula: C6H7ClN4.
Rf-value: 0.47; SiO2, n-hexane/ethyl acetate (3/2).
Melting point: 163 °C (ethyl acetate).
Spectroscopic data and assignment of molecule positions:
1H NMR: (300 MHz, DMOS-d6): δ [ppm] = 7.18-7.23 (m, 2 H, H-2), 7.36-
7.38 (m, 2 H, H-3), 9.64 (br. s, 3 H, H-1).
Synthesis of 4-azidoaniline (salt free) (58)
920 mg (5.39 mmol) of 4-azidoanilline hydrochloride were dissolved in water (5 ml)
and cooled to 3 C with an ice bath. A dropwise addition of a sodium hydroxide
solution (10 %, 1.20 ml) led to a slightly yellowish precipitate which was filtered over
G4-glass frit (pore size 10-16 µm). The precipitate was washed with ice-cold water
(10 ml) and transferred to a flask by dissolving the residue in DCM (10-15 ml). After
evaporation of the solvent under reduced pressure the remained solid was
lyophilized to yield 92 % (665 mg, 4.96 mmol) of a yellow powder. The obtained
4-azidoanilline (58) was used in the next synthesis step directly after lyophilization.

106 6 – EXPERIMENTAL SECTION
Molecular Weight: 134.14 g/mol.
Formula: C6H6N4.
Spectroscopic data and assignment of molecule positions:
1H NMR: (300 MHz, DMOS-d6): δ [ppm] = 5.13 (br. s, 2 H, H-1), 6.56-6.61
(m, 2 H, H-2), 6.74-6.79 (m, 2 H, H-3).
Synthesis of 2-(N-(4-azidophenyl)carbamoyl)-5-((N-((benzyloxy)carbonyl)carb-
amimidoyl)carbamoyl)-4-(3-methoxy-3-oxopropyl)-3-methyl-1H-pyrrole (37)
The synthesis of azido pyrrole 37 was carried out in an argon flushed flask under
microwave-assistance according to the following synthesis protocol:
Under inert gas 1.61 g (3.74 mmol) of pyrrole 36, 650 mg (4.85 mmol) of freshly
prepared 4-azidoanilline (58) (according to the procedure mentioned before) and
3.78 g, (7.26 mmol, 1.9 eq) PyBOP were suspended in 40 ml of a DCM/DMF mixture
(1/1). The addition of 1.90 ml (1.75 g, 17.3 mmol, 4.6 eq) NMM was carried out with a
subsequent degassing of the mixture. After an initial stirring of the reaction mixture
the heating program was started. In a pre-heating step the mixture was heated to
50°C with maximum power (300 W) max. for 2 min under stirring at the highest
speed level. In the next step the reaction mixture was heated to 80 C with a power of
250 W for 35 min. Subsequently the mixture was cooled to room temperature. The
previous mentioned procedure was carried out 3 times. Reaction control via TLC
showed maximum conversion to the desired product after a reaction time of almost
2 h. The solvent was reduced by evaporation. After addition of further 3 ml of DCM
the mixture was stored in a fridge over night for crystallization. A repeated
precipitation yielded 52% (1.06 g, 1.95 mmol) of pyrrole 37 as a pale brown powder.

6 – EXPERIMENTAL SECTION 107
Molecular Weight: 546.54 g/mol.
Formula: C26H26O6N8.
Rf-value: 0.67; SiO2, n-hexane/ethyl acetate (3/2).
Spectroscopic data and assignment of molecule positions:
1H NMR: (500.1 MHz, DMOS-d6): δ [ppm] = 2.24 (s, 3 H, H-19), 2.48* (m,
2 H, H-15), 3.07 (br. s, 2 H, H-14), 3.56 (s, 3 H, H-17), 5.21 (br. s,
2 H, H-9), 7.11 (d, 3JH-21/ H-22 = 9.14 Hz, 2 H, H-21), 7.30 - 7.52 (m,
5 H, H-11, H-12, H-13), 7.74 (d, 3JH-22/ H-21 = 9.14 Hz, 2 H, H-22),
8.58 (br. s, 1 H, NH), 9.61 (br. s, 1 H, NH), 10.04 (s, 1 H, NH), 10.82
(s, 1 H, NH), 11.27 (br. s, 1 H, NH, H-1).
* (peak showed an overlay with solvent-residual peak at
2.50 ppm; high temperature NMR was used to shift signals and
calculate coupling constants as well)
13C NMR: (125.8 MHz, DMSO-d6) δ = 9.9 (1 C, C-19), 19.8 (1 C, C-14), 34.7
(1 C, C-15), 51.1 (1 C, C-17), 66.9 (1 C, C-9), 119.4 (2 C, C-21),
121.2 (2 C, C-22), 128.2, 128.5 (5 C, C-11, C-12, C-13), 133.9,
136.4, 158.0, 159.2 (4 C, Cq), 173.2 (C-16).
The assignment of the carbon atoms was done by two
dimensional NMR spectroscopy (HSQC). The correct number of
quaternary carbon atoms could not be determined.
HRMS: (ESI, pos., methanol/water): m/z [M]+ calcd for C26H26O6N8+:
545.1892; found: 545.1830.

108 6 – EXPERIMENTAL SECTION
Synthesis of tert-butyl 5-((N-((benzyloxy)carbonyl)carbamimidoyl)carbamoyl)-
4-(3-carboxypropyl)-3-methyl-1H-pyrrole-2-carboxylate (59)
52.0 mg (2.17 mmol) LiOH were added to a solution of 350 mg (719 µmol) of
pyrrole 35 in 15 ml of THF/H2O (2/1). The mixture was stirred for 6 h at room
temperature. The volatile solvent was removed by evaporation under reduced
pressure and the remaining suspension was lyophilized. The obtained raw product
was purified via column chromatography (SiO2, n-hexane/ethyl acetate (1/1) to yield
99 % (339 mg, 717 µmol) of pyrrole 59.
Molecular Weight: 472.50 g/mol.
Formula: C23H28O4N7.
Rf-value: 0.22; SiO2, n-hexane/ethyl acetate (1/1).
Spectroscopic data and assignment of molecule positions:
1H NMR: (300.2 MHz, DMOS-d6): δ [ppm] = 1.52 (s, 9 H, H-21), 2.17 (s,
3 H, H-19), 2.32 (t, 2 H, 3JH-15/ H-14 = 7.24 Hz, H-15), 2.88 (t, 2 H, 3JH-14/ H-15 = 7.24 Hz, H-14), 5.14 (s, 2 H, H-9), 7.35 - 7.40 (m, 5 H,
H-11, H-12, H-13), 8.71 (br. s, 1 H, NH), 9.46 (br. s, 1 H, NH),
10.91 (s, 1 H, NH, H-1).
The hydrogen of the carboxylic acid and one of the hydrogens of
the guanidinium function could not be assigned but an
extremely broadened water signal could be revealed. Therefore a
fast exchange with water protons was assumed at least with the
acidic proton.

6 – EXPERIMENTAL SECTION 109
FT-IR: (ATR): [cm-1] = 2927 (w), 1691 (s), 1632 (m), 1556 (m), 1454
(m), 1367 (m), 1254 (s), 1214 (s), 1134 (s), 909 (w).
HRMS: (ESI, pos., methanol/water): m/z [M]+ calcd for C23H29O4N7+:
473.2031; found: 473.2031; calcd for C23H28O4N7Na+: 495.1872;
found: 495.1850.
Synthesis of benzyl (2-aminoethyl)carbamate (60)109
A solution of 6.00 g (24.1 mmol) of N-(Benzyloxycarbonyloxy)succinimide in 40 ml
CHCl3 was cooled to 0 °C and added to an ice cooled solution of 40 ml (36.0 g, 598)
ethylene diamine in 300 ml CHCl3. The addition was carried out under inert gas over
a period of 8 h. After stirring for further 8 h under room temperature the mixture was
three times washed with 70 ml of brine. The obtained aqueous phase was washed
with 40 ml CHCl3. All organic phases were washed three times with 70 ml of
saturated NaHCO3-solution and three times with 70 ml of water. Subsequently the
solvent was evaporated under reduced pressure. The raw product was purified via
MPLC (RP-18-silica, MeOH/H2O/TFA) to yield 45 % (2.11 g, 10.9 mmol) of 60.
Molecular Weight: 194.23 g/mol.
Formula: C10H14O2N2.
Rf-value: 0.22; SiO2, n-hexane/ethyl acetate (1/1).
Spectroscopic data and assignment of molecule positions:
1H NMR: (300.2 MHz, DMOS-d6): δ [ppm] = 2.54 (t, 2 H, 3JH-2/ H-1 = 6.72 Hz,
H-2), 2.99 (t, 2 H, 3JH-1/ H-2 = 6.72 Hz, H-1), 4.99 (s, 2 H, H-5), 6.64
(br. s, 1 H, NH), 7.18 (br. s, 1 H, NH), 7.29 - 7.35 (m, 5 H, H-6, H-7,
H-8), 8.30 (br. s, 1 H, NH).

110 6 – EXPERIMENTAL SECTION
Synthesis of tert-butyl 4-(3-((2-(((benzyloxy)carbonyl)amino)ethyl)amino)-3-
oxopropyl)-5-((N-((benzyloxy)carbonyl)carbamimidoyl)carbamoyl)-3-methyl-
1H-pyrrole-2-carboxylate (38)
A solution of 27.0 mg (57.0 µmol) of 59, 13.4 mg (69.0 µmol) of 60 and 39.4 mg
(75.7 µmol) of PyBOP were dissolved in 4 ml DCM/DMF (1/1). The reaction mixture
was stirred under inert gas and 15 µL (13.8 mg, 136.0 µmol) of NMM were added by
syringe in two portions. TLC control showed a full conversion after stirring for 12 h at
room temperature. The solvent was removed under reduced pressure to yield the
raw product which was further purified via column chromatography (SiO2, n-
hexane/ethyl acetate (1/1). After purification 87 % (32.2 mg, 49.6 µmol) of 38 could
be obtained.
Molecular Weight: 648.29 g/mol
Formula: C33H40O8N6
Rf-value: 0.17; SiO2, n-hexane/ethyl acetate (1/1).
Spectroscopic data and assignment of molecule positions:
1H NMR: (500.1 MHz, DMOS-d6): δ [ppm] = 1.52 (s, 9 H, H-27), 2.16 (s,
3 H, H-24), 2.23 (t, 2 H, 3JH-15/ H-14 = 7.80 Hz, H-15), 2.93 (t, 2 H, 3JH-14/ H-15 = 7.80 Hz, H-14), 2.99 - 3.09 (m, 4 H, H-17, H-18), 5.00
(s, 2 H, H-19), 5.17 (br. s, 2 H, H-9), 7.23 (t, 1 H, NH), 7.30 - 7.35
(m, 5 H, H-21, H-22, H-23), 7.37 - 7.42 (m, 5 H, H-11, H-12, H-13),

6 – EXPERIMENTAL SECTION 111
7.80 (t, 1 H, NH), 8.65 (br. s, 1 H, NH), 9.48 (br. s, 1 H, NH), 11.07
(br. s, 1 H, NH, H-1).
Not all amine and amide protons could be assigned.
13C NMR: (125.8 MHz, DMSO-d6) δ = 9.8 (1 C, C-24), 20.5 (1 C, C-14), 28.0
(3 C, C-27), 36.9 (1 C, C-15), 38.5 (1 C, C-17), 40.0 (1 C, C-18), 65.2
(2 C, C-9, C-19), 80.8 (1 C, C-26), 125.3 (2 C, Cq), 127.7, 128.1,
128.4 (10 C, C-11, C-12, C-13, C-21, C-22, C-23), 137.1 (2 C, C-10,
C-20), 156.1, 160.2 (2 C, Cq), 172.1 (1 C, C-16).
The correct number of quaternary carbon atoms could not be
assigned.
HRMS: (ESI, pos., methanol/water): m/z [M]+ calcd for C33H40O8N6Na+:
671.2800; found: 671.2791; calcd for (C33H40O8N6)2Na+:
1319.5707; found: 1319.5687.
Synthesis of tert-butyl 4-(3-((2-(((benzyloxy)carbonyl)amino)ethyl)amino)-3-
oxopropyl)-5-((N-((benzyloxy)carbonyl)carbamimidoyl)carbamoyl)-3-methyl-
1H-pyrrole-2-carboxylic acid (61)
28.1 mg (43.3 µmol) of 38 were dissolved in 4 ml of DCM/TFA (1/1). The reaction
mixture was stirred for 5 h at room temperature. The solvent was removed under
reduced pressure and the residue was lyophilized to yield 98 % (25.2 mg, 42.5 µmol)
of 38 could be obtained.
Molecular Weight: 592.60 g/mol
Formula: C29H32O8N6
Rf-value: 0.82; RP-18 silica, acetonitrile/water (1/1).

112 6 – EXPERIMENTAL SECTION
Spectroscopic data and assignment of molecule positions:
1H NMR: (500.1 MHz, DMOS-d6): δ [ppm] = 2.19 (s, 3 H, H-24), 2.24 (t, 2 H,
3JH-15/ H-14 = 7.77 Hz, H-15), 2.93 (t, 2 H, 3JH-14/ H-15 = 7.77 Hz,
H-14), 3.00 - 3.09 (m, 4 H, H-17, H-18), 5.00 (s, 2 H, H-19), 5.16
(br. s, 2 H, H-9), 7.23 (t, 1 H, NH), 7.30 - 7.35 (m, 5 H, H-21, H-22,
H-23), 7.37 - 7.40 (m, 5 H, H-11, H-12, H-13), 7.79 (t, 1 H, NH),
7.68 (br. s, 1 H, NH, H-1), 8.66 (br. s, 1 H, NH), 9.48 (br. s, 1 H,
NH).
13C NMR: (125.8 MHz, DMSO-d6) δ = 9.6 (1 C, C-24), 20.5 (1 C, C-14), 36.4
(1 C, C-15), 38.5 (1 C, C-17), 40.0 (1 C, C-18), 65.2 (2 C, C-9, C-19),
125.3 (2 C, Cq), 127.7, 128.1, 128.4 (10 C, C-11, C-12, C-13, C-21,
C-22, C-23), 137.1 (2 C, C-10, C-20), 156.1, 160.2 (2 C, Cq), 172.1
(1 C, C-16).
Not all quaternary carbon atoms could be assigned.
Synthesis of 4-(3-((2-(((benzyloxy)carbonyl)amino)ethyl)amino)-3-oxopropyl)-
5-((n-((benzyloxy)carbonyl)carbamimidoyl)carbamoyl)-3-methyl-1h-pyrrole-2-
amido-(para-phenyl) azide (39)
The synthesis of azido pyrrole 37 was executed in an argon flushed flask under
microwave-assistance according to the following synthesis protocol:

6 – EXPERIMENTAL SECTION 113
A solution of 23.0 mg (39.0 µmol) of 61 and 11.0 mg (82.0 µmol) of freshly
prepared 4-azidoaniline (58) in 5 ml DCM/DMF (1/1) was degassed and stirred at
room temperature. Under inert gas 38.5 mg (74.0 µmol) of PyBOP and 15.0 µl
(13.8 mg 136 µmol) of NMM were added to the solution. After an initial stirring of
the reaction mixture the heating program was started. With a maximum power of
60 W the reaction mixture was heated to 90 °C for 30 min. in intervals of 10 min.
intermediate reaction control via TLC was made. The reaction was stopped via
evaporation of the solvent reduced pressure. After lyophilization the crude was
purified via chromatography (SiO2, n-hexane/ ethyl acetate (2/1)) and yielded 18 %
(5.00 mg, 7.06 µmol) of 39.
Molecular Weight: 708.28 g/mol
Formula: C35H36O7N10
Rf-value: 0.17; SiO2, n-hexane/ethyl acetate (1/1).
Spectroscopic data and assignment of molecule positions:
1H NMR: (600.1 MHz, DMOS-d6): δ [ppm] = 2.25 (s, 3 H, H-24), 2.30 (m,
2 H, H-15), 3.02 (m, 4 H, H-14, H-18), 3.09 - 3.11 (m, 2 H, H-17),
5.00 (s, 2 H, H-19), 5.20 (br. s, 2 H, H-9), 7.11 (d, 3JH-27/ H-28 = 8.84
Hz, 2 H, H-27), 7.23 (t, 1 H, NH), 7.30 - 7.36 (m, 5 H, H-21, H-22,
H-23), 7.38 - 7.46 (m, 5 H, H-11, H-12, H-13), 7.74 (d, 3JH-28/
H-27 = 8.84 Hz, 2 H, H-28), 7.95 (m, 1 H, NH), 8.60 (br. s, 1 H, NH),
9.51 (br. s, 1 H, NH), 10.03 (s, 1 H, NH), 10.96 (br. s, 1 H, NH),
11.46 (s, 1 H, NH, H-1).
13C NMR: (150.9 MHz, DMSO-d6) δ = 9.7 (1 C, C-24), 20.8 (1 C, C-14), 36.6
(1 C, C-15), 38.4 (1 C, C-17), 39.7 (1 C, C-18), 65.0 – 66.5 (2 C, C-9,
C-19), 118.9 (2 C, Cq), 119.1 – 120.9 (4 C, C-27, C-28), 125.3 (2 C,
Cq), 127.5, 127.9, 128.1, 128.2 (10 C, C-11, C-12, C-13, C-21, C-22,

114 6 – EXPERIMENTAL SECTION
C-23), 133.8 (Cq), 137.1 (2 C, C-10, C-20), 142.8 (Cq), 156.1, 159.1
(2 C, Cq), 172.9, 174.3, 206.5 (3 C, Cq).
The correct number of quaternary carbon atoms could not be
assigned.
HRMS: (ESI, pos., methanol/water): m/z [M]+ calcd for C35H36O7N10Na+:
731.2661; found: 731.2672; calcd for (C35H36O7N10)2Na+:
1439.5429; found: 1319.5466.
Synthesis of 5-((N-(tert-butoxycarbonyl)carbamimidoyl)carbamoyl)-1H-
pyrrole-2-amido-para-phenyl azide (41)
In an inert gas atmosphere 266.0 mg (670 µmol) of 40, 90.0 mg (671 µmol) of
4-azidoanilline and 430 mg (826 µmol) of PyBOP were dissolved in 15 ml DCM/DMF
(1/2). After addition of 70 µL (52.0 mg, 402 µmol) of DIPEA via syringe the reaction
mixture was stirred for 14 h at room temperature. The solvent was evaporated under
reduced pressure until a residual amount of 7 ml remained. After addition of 15 ml of
water the precipitate was filtered and washed with ice water. The crude was dried
over silica and purified via column chromatography (SiO2, n-hexane/ ethyl acetate
(2/1)) to yield 23 % (62.7 mg, 152 µmol) of 41.
Molecular Weight: 412.41 g/mol
Formula: C18H20O4N8
Rf-value: 0.68; SiO2, n-hexane/ethyl acetate (1/1).
Spectroscopic data and assignment of molecule positions:
1H NMR: (600.1 MHz, DMOS-d6): δ [ppm] = 1.47 (s, 9 H, H-10), 6.86 (br. s,
1 H, H-3), 7.01 (s, 1 H, H-4), 7.13 (d, 3JH-13/ H-14 = 8.87 Hz, 2 H,

6 – EXPERIMENTAL SECTION 115
H-13), 7.78 (d, 3JH-14/ H-13 = 8.87 Hz, 2 H, H-14), 8.58 (br. s, 1 H,
NH), 9.37 (br. s, 1 H, NH), 10.16 (s, 1 H, NH, H-1), 10.84 (br. s, 1 H,
NH), 11.36 (br. s, 1 H, NH).
13C NMR: (150.9 MHz, DMSO-d6) δ = 27.7 (3 C, C-10), 113.2 (1 C, C-9),
119.4 – 121.4 (4 C, C-13, C-14), 134.1, 136.1 (2 C, C-3, C-4), 158.0,
158.4 (2 C, Cq).
The correct number of quaternary carbon atoms could not be
assigned.
HRMS: (ESI, pos., methanol/water): m/z [M]+ calcd for C18H21O4N8+:
413.1678; found: 413.1680.
Synthesis of 5-((N-(tert-butoxycarbonyl)carbamimidoyl)carbamoyl)-1H-
pyrrole-2-amido-para-phenyl iodide (42)
In an inert gas atmosphere 95.4 mg (240 µmol) of 40, 57.9 mg (246 µmol) of
4-iodoanilline and 47.0 mg (277 µmol) of Cl-HOBt were dissolved in 5 ml DMF. After
the addition of 40 µL (32.8 mg, 260 µmol) of DIC via syringe the reaction mixture was
stirred for 24 h at room temperature. After addition of 15 ml of water the precipitate
was filtered and washed with ice water. The crude was dried over silica and purified
via column chromatography (SiO2, n-hexane/ ethyl acetate (3/2)) to yield 45 %
(51.7 mg, 108 µmol) of 42.
Molecular Weight: 497.29 g/mol
Formula: C18H20O4N5I
Rf-value: 0.47; SiO2, n-hexane/ethyl acetate (3/2).
Spectroscopic data and assignment of molecule positions:

116 6 – EXPERIMENTAL SECTION
1H NMR: (300.2 MHz, DMOS-d6): δ [ppm] = 1.47 (s, 9 H, H-10), 6.85 (br. s,
1 H, H-3), 7.01 (s, 1 H, H-4), 7.57 (d, 3JH-13/ H-14 = 8.99 Hz, 2 H,
H-13), 7.69 (d, 3JH-14/ H-13 = 8.99 Hz, 2 H, H-14), 8.58 (br. s, 1 H,
NH), 9.36 (br. s, 1 H, NH), 10.15 (s, 1 H, NH, H-1), 10.82 (br. s, 1 H,
NH), 11.39 (br. s, 1 H, NH).
MS: (ESI, neg., methanol/water): m/z [M]- calcd for C18H20O4N8I-:
496.0493; found: 496.18.
Synthesis of the TFA salt of 5-((N-carbamimidoyl)carbamoyl)-1H-pyrrole-2-
amido-para-phenyl iodide (43)
50.0 mg (100 µmol) of pyrrole 42 were dissolved in 5 ml DCM. After addition of
1 mL TFA the reaction mixture was stirred for 1 h at room temperature. The solvent
was evaporated under reduced pressure to yield 99 % (49.3 mg, 99 µmol) of 43.
Molecular Weight: 397.18 g/mol
Formula: C13H12O2N5I
Rf-value: 0.54; SiO2, ethyl acetate/iso-propanol (2/1).
Spectroscopic data and assignment of molecule positions:
1H NMR: (600.1 MHz, DMOS-d6): δ [ppm] = 7.10 (m, 1 H, H-3), 7.13 (br. s,
1 H, H-4), 7.57 (d, 3JH-10/ H-11 = 8.83 Hz, 2 H, H-10), 7.71 (d, 3JH-11/
H-10 = 8.83 Hz, 2 H, H-11), 8.32 (br. s, 4 H, NH, H-7), 10.27 (s, 1 H,
H-8), 11.20 (s, 1 H, NH,), 12.62 (br. s, 1 H, NH, H-1).
Proton H-8 could be identified via selective NOESY-, HSQC- and
HMBCexperiments. See detailed spectrum in the appendix.

6 – EXPERIMENTAL SECTION 117
13C NMR: (150.9 MHz, DMSO-d6) δ = 87.5 (1 C, C-12), 113.6 (1 C, C-3),
115.3 (1 C, C-4), 122.1 (2 C, C-10), 126.3, 132.1 (2 C, C-2, C-5),
137.4 (2 C, C-11), 138.4 (1 C, C-9), 154.9, 157.7, 159.5 (3 C, Cq).
HRMS: (ESI, pos., methanol/water): m/z [M]+ calcd for C13H13O2N5I+:
398.0108; found: 398.0121; calcd for (C13H12O2N5I)2H+: 795.0144;
found: 795.0128.
Synthesis of 5-((N-carbamimidoyl) carbamoyl)-1H-pyrrole-2-amido-para-
phenyl azide (32)
In an inert gas atmosphere 48.0 mg (97.3 µmol) of 43, 14.5 mg (223 µmol) of
sodium azide, 3.32 mg (16.8 µmol) of sodium ascorbate and 2 µL mg (1.64 mg,
18.6 µmol) of 1,2-N,N-dimethylen diamine were dissolved in 2.5 ml DCM. After
addition of 2 drops of 1 M sodium hydroxide solution and 6.00 mg (31.5 µmol) of
copper iodide the reaction mixture was stirred at room temperature. The mixture was
heated to 40 °C after addition of 4 µL mg (3.28 mg, 37.2 µmol) of 1,2-N,N-
dimethylen diamine, 6.00 mg (31.5 µmol) of sodium azide, 2.20 mg (11.1 µmol) of
sodium ascorbate and 3.30 mg (17.3 µmol) of copper iodide the mixture was stirred
16 h at 40 °C and 4 h at 50 °C. The reaction control was carried out via TLC. The
crude product was precipitated with 15 ml of water. The precipitate was separated by
filtration and dissolved in 25 ml ethyl acetate afterwards. The organic phase was
washed successively with of saturated sodium sulfide solution (5 ml), water (5 ml)
and brine (5 ml). The solvent was evaporated under reduced pressure and the
remaining residue was lyophilized. The azide 32 was obtained in a yield of 80 %
(24.2 mg, 77.4 µmol).
Molecular Weight: 312.29 g/mol
Formula: C12H12O2N5
Rf-value: 0.65; SiO2, ethyl acetate/iso-propanol (2/1).

118 6 – EXPERIMENTAL SECTION
Spectroscopic data and assignment of molecule positions:
1H NMR: (600.1 MHz, DMOS-d6): δ [ppm] = 6.63 (d, 3JH-3/ H-4 = 3.49 Hz,
1 H, H-3), 6.93 (d, 3JH-4/ H-3 = 3.49 Hz, 1 H, H-4), 7.11 (d, 3JH-11/
H-10 = 8.83 Hz, 2 H, H-11), 7,21 (s, 1 H, NH), 7.78 (d, 3JH-10/
H-11 = 8.83 Hz, 2 H, H-10), 8.32 (br. s, 3 H, NH, H-7), 10.16 (s, 1 H,
H-8), 11.16 (s, 1 H, NH, H-1).
Proton H-8 could be identified via selective NOESY-, HSQC- and
HMBCexperiments. See detailed spectrum in the appendix.
13C NMR: (150.9 MHz, DMSO-d6) δ = 111.7 (1 C, C-3), 113.5 (1 C, C-4),
119.4 (2 C, C-11), 121.2 (2 C, C-10), 133.9 (1 C, C-9), 127.2, 135
(2 C, C-2, C-5) 136.4 (1 C, C-12), 158.1, 162.7, 169.7 (3 C, Cq).
HRMS: (ESI, pos., methanol/water): m/z [M]+ calcd for C12H13O2N8+:
313.1156; found: 313.1159.
6.4 Syntheses of Un-Symmetrical Tweezer Building Blocks
This section describes the syntheses of unsymmetrical building blocks of the
tweezer 14 as well as of the truncated tweezer 19b. Starting with the synthesis of the
hydroquinone tweezer 14 the syntheses of the unsymmetrical tweezers 31 and 50
will be shown first.
The synthesis of the hydroquinone tweezer 14 was done in style of reported
procedure. The formation of the tweezer skeleton via a twofold Diels-Alder reaction
was carried out in reusable Schlenk vessels. In the reported procedure capsuled glass
ampullae were used. The advantage compared to the described version was the
possibility of reaction monitoring via TLC and mass spectroscopy.

6 – EXPERIMENTAL SECTION 119
Synthesis of 8,19-Diacetoxy-5,6,6a,7,9,10,11,16,17,17a,18,20,21,22-hexadeca-
hydro-5,22:7,20:9,18:11,16-tetramethanononacene (28)
In an inert gas atmosphere 501.0 mg (1.55 mmol) of diyl acetate 15, 1.01 g
(5.97 mmol) of diene 10 were dissolved in 10 ml of toluene and 5 ml of acetonitrile.
After stirring for 5 min. 200 µl (145.2 mg, 1.43 mmol) of triethylamine were added via
syringe and the mixture was slowly degassed and cooled to -196 °C. The vacuumed
Schlenk vessel was heated up to 190 °C in an oil bath. The reaction was monitored
via TLC and mass spectroscopy. After 65 h the reaction mixture was cooled to room
temperature and the solvent was reduced to 5 ml. The slight suspension was cooled
in a fridge to precipitate. After filtration the product 28 was washed with 20 ml of
ice-cold cyclohexane and tried to obtain a yield of 61 % (622 mg, 944 µmol).
Molecular Weight: 658.84 g/mol
Formula: C46H42O4
Rf-value: 0.39; SiO2, n-hexan/ethyl acetate (3/1).
Spectroscopic data and assignment of molecule positions:
1H NMR: (300.1 MHz, CDCl3): δ [ppm] = 1.65 – 1.68 (m, 4 H, H-24, H-25),
1.95 – 1.98 (m, 2 H, H-23a, H-26a), 2.08 -2.35 (m, 14 H, H-6, H-6a,
H-9a, H-10, H-17, H-17a, H-20a, H-21, H-23s, H-26s), 2.29 (s, 6 H,
H-28, H-30), 2.83 (s, 4 H, H-7, H-9, H-18, H-20), 3.54 (s, 4 H, H-5,
H-11, H-16, H-22), 6.83 (m, 4 H, H-2, H-3, H-13, H-14), 7.11 (m,
4 H, H-1, H-4, H-12, H-15).
13C NMR: (75.5 MHz, CDCl3) δ = 20.9 (2 C, C-28, C-30), 29.8 (4 C, C-6, C-10,
C-17, C-21), 38.9 (4 C, C-6a, C-9a, C-17a, C-20a), 45.8 (2 C, C-24,

120 6 – EXPERIMENTAL SECTION
C-25), 49.9 (4 C, C-7, C-9, C-18, C-20), 53.6 (4 C, C-5, C-11, C-16,
C-22), 67.3 (2 C, C-23, C-26), 120.8 (4 C, C-1, C-4, C-12, C-15),
124.1 (4 C, C-2, C-3, C-13, C-14), 135.2 (4 C, C-7a, C-8a, C-18a,
C-19a), 139.3 (2 C, C-8, C-19), 147.1 (4 C, C-4a, C-11a, C-15a,
C-22a), 152.6 (4 C, C-5a, C-10a, C-16a, C-21a), 169.1 (2 C, C-27,
C-29).
MS: (ESI, pos., methanol/water): m/z [M]+ calcd for C46H42O4Na+:
681.2975; found: 681.29.
Synthesis of 8,19-Diacetoxy-5,7,9,11,16,18,20,22-octahydro-5,22:7,20:9,18:11,
16-tetramethanononacene (29)
In an inert gas atmosphere 928 mg (1.41 mmol) of 28 and 1.50 g (6.60 mmol) of
DDQ were suspended in 30 ml of toluene. The mixture was heated to relux for 2 h.
After cooling to 60 °C and an addition of 450 µl (387 mg, 4.83 mmol) of 1,4-
cyclohexadiene the mixture was stirred for further 30 min. The red-colored
precipitate was filtered and washed with toluene carefully. The obtained crude was
lyophilized and purified via column chromatography (SiO2, n-hexane/ ethyl acetate
(5/4)) to yield 44 % (399 mg, 613 µmol) of 29.
Molecular Weight: 650.77 g/mol
Formula: C46H34O4
Rf-value: 0.72; SiO2, n-hexan/ethyl acetate (1/1).

6 – EXPERIMENTAL SECTION 121
Spectroscopic data and assignment of molecule positions:
1H NMR: (300.1 MHz, CDCl3): δ [ppm] = 2.45 (m, 2 H, H-24a, H-25a), 2.48
(s, 6 H, H-28, H-30), 2.54 (m, 4 H, H-23, H-26), 2.62 -2.65 (m, 2 H,
H-24s, H-25s), 4.11 (s, 4 H, H-7, H-9, H-18, H-20), 4.18 (s, 4 H,
H-5, H-11, H-16, H-22), 6.86 - 6.88 (m, 4 H, H-2, H-3, H-13, H-14),
7.18 (m, 4 H, H-1, H-4, H-12, H-15).
13C NMR: (75.5 MHz, CDCl3) δ = 20.9 (2 C, C-28, C-30), 48.8 (4 C, C-7, C-9,
C-18, C-20), 51.4 (4 C, C-5, C-11, C-16, C-22), 68.9 (2 C, C-24,
C-25), 70.2 (2 C, C-23, C-26), 116.6 (4 C, C-6, C-10, C-17, C-21),
121.5 (4 C, C-1, C-4, C-12, C-15), 124.7 (4 C, C-2, C-3, C-13, C-14),
137.2 (4 C, C-7a, C-8a, C-18a, C-19a), 141.5 (2 C, C-8, C-19), 146.4
(4 C, C-6a, C-9a, C-17a, C-20a), 147.8 (4 C, C-5a, C-10a, C-16a,
C-21a), 150.4 (4 C, C-4a, C-11a, C-15a, C-22a), 169.0 (2 C, C-27,
C-29).
HRMS: (ESI, pos., methanol/water): m/z [M]+ calcd for C46H34O4Na+:
673.2349; found: 673.2296.

122 6 – EXPERIMENTAL SECTION
Synthesis of 8,19-Dihydroxy-(5,7,9,11,16,18,20,22)octahydro-5,22:7,20:9,18:
11,16-tetramethanononacene (14)
In an argon gas atmosphere 124 mg (3.79 mmol) of LiAlH4 were suspended in 20 ml
of THF (abs.) and cooled to -10 °C. Without increasing the temperature above 0 °C a
suspension of 255 mg (392 µmol) of 29 in 30 ml THF (abs.) were added dropwise to
the previous suspension. The reaction mixture was stirred for 5 h under reflux and
cooled to 0 °C afterwards. 22 ml of a saturated NH4Cl solution were added via
syringe and the mixture was stirred for 12 h at room temperature. After adjustment
of the pH value to 1 with half conc. HCl the phases were separated and the aqueous
phase was extracted twice with CHCl3 (50 ml). The combined organic phases were
dried over sodium sulfate and the solvent was evaporated under vacuum. The crude
product (300 mg) was lyophilized before purification via MPLC was carried out (SiO2,
n-hexane/ ethyl acetate (3/1)). The dihydroxy tweezer 14 was obtained in a yield of
97 % (215 mg, 380 µmol).
Molecular Weight: 566.70 g/mol
Formula: C42H30O2
Rf-value: 0.78; SiO2, n-hexan/ethyl acetate (3/1).
Spectroscopic data and assignment of molecule positions:
1H NMR: (300.1 MHz, CDCl3): δ [ppm] = 2.37 – 2.43 (dm, 8 H, H-23, H-24,
H-25, H-26), 4.06 (br. s, 4 H, H-7, H-9, H-18, H-20), 4.13 (s, 2 H,
H-27, H-28), 4.17 (m, 4 H, H-5, H-11, H-16, H-22), 6.73 - 6.76 (m,

6 – EXPERIMENTAL SECTION 123
4 H, H-2, H-3, H-13, H-14), 7.05 – 7.08 (m, 4 H, H-1, H-4, H-12,
H-15), 7.14 (s, 4 H, H-6, H-10, H-17, H-21).
13C NMR: (75.5 MHz, CDCl3) δ = 47.4 (4 C, C-7, C-9, C-18, C-20), 51.3 (4 C,
C-5, C-11, C-16, C-22), 68.7 (4 C, C-23, C-24, C-25, C-26), 116.3
(4 C, C-6, C-10, C-17, C-21), 121.5 (4 C, C-1, C-4, C-12, C-15),
124.6 (4 C, C-2, C-3, C-13, C-14), 136.5 (4 C, C-7a, C-8a, C-18a,
C-19a), 146.9 (4 C, C-6a, C-9a, C-17a, C-20a), 147.9 (4 C, C-5a,
C-10a, C-16a, C-21a), 148.4 (2 C, C-8, C-19), 150.7 (4 C, C-4a,
C-11a, C-15a, C-22a).
MS: (ESI, pos., methanol/water): m/z [M]+ calcd for C42H30O2Na+:
689.21; found: 689.22.
Synthesis of 8-prop-2-yn-1-yloxy-19-monohydroxy-(5,7,9,11,16,18,20,22)-
octahydro-5,22:7,20:9,18:11,16-tetramethanononacene (14)
In an atmosphere of argon gas 195 mg (344 µmol) of 14 and 262 mg (1.89 mmol)
of K2CO3 were suspended in 6 ml of acetone. The mixture was heated to 80 °C for
30 min. and cooled to room temperature afterwards. A solution of propargyl
bromide in 264 µl acetone (31.4 mg, 264 µmol, 0.77 eq.) was added dropwise via
syringe over a period of 2 h. The reaction was heated to reflux for 12 h. After cooling
to room temperature the mixture was filtrated over nylon filter and the precipitate
was washed thoroughly with acetone (45 ml). The solvent of the filtrate was
evaporated under reduced pressure and the remaining solid was lyophilized.
Purification of the crude product (224 mg) via column chromatography (SiO2,
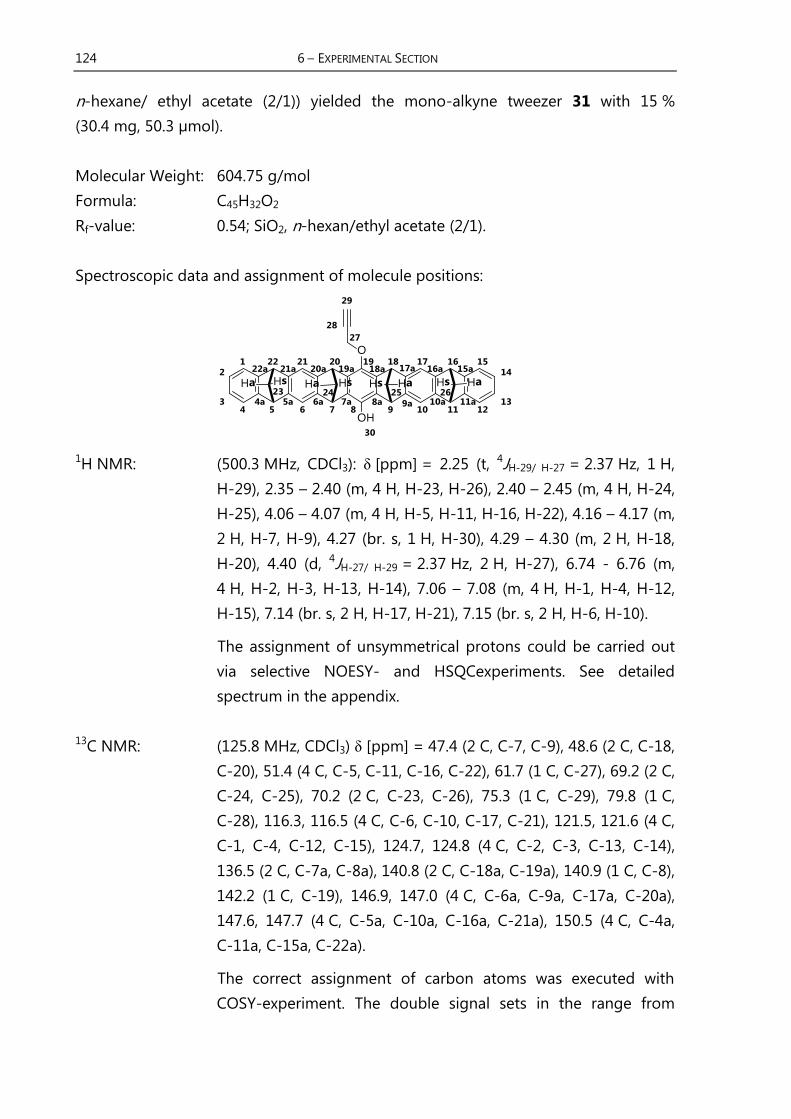
124 6 – EXPERIMENTAL SECTION
n-hexane/ ethyl acetate (2/1)) yielded the mono-alkyne tweezer 31 with 15 %
(30.4 mg, 50.3 µmol).
Molecular Weight: 604.75 g/mol
Formula: C45H32O2
Rf-value: 0.54; SiO2, n-hexan/ethyl acetate (2/1).
Spectroscopic data and assignment of molecule positions:
1H NMR: (500.3 MHz, CDCl3): δ [ppm] = 2.25 (t, 4JH-29/ H-27 = 2.37 Hz, 1 H,
H-29), 2.35 – 2.40 (m, 4 H, H-23, H-26), 2.40 – 2.45 (m, 4 H, H-24,
H-25), 4.06 – 4.07 (m, 4 H, H-5, H-11, H-16, H-22), 4.16 – 4.17 (m,
2 H, H-7, H-9), 4.27 (br. s, 1 H, H-30), 4.29 – 4.30 (m, 2 H, H-18,
H-20), 4.40 (d, 4JH-27/ H-29 = 2.37 Hz, 2 H, H-27), 6.74 - 6.76 (m,
4 H, H-2, H-3, H-13, H-14), 7.06 – 7.08 (m, 4 H, H-1, H-4, H-12,
H-15), 7.14 (br. s, 2 H, H-17, H-21), 7.15 (br. s, 2 H, H-6, H-10).
The assignment of unsymmetrical protons could be carried out
via selective NOESY- and HSQCexperiments. See detailed
spectrum in the appendix.
13C NMR: (125.8 MHz, CDCl3) δ [ppm] = 47.4 (2 C, C-7, C-9), 48.6 (2 C, C-18,
C-20), 51.4 (4 C, C-5, C-11, C-16, C-22), 61.7 (1 C, C-27), 69.2 (2 C,
C-24, C-25), 70.2 (2 C, C-23, C-26), 75.3 (1 C, C-29), 79.8 (1 C,
C-28), 116.3, 116.5 (4 C, C-6, C-10, C-17, C-21), 121.5, 121.6 (4 C,
C-1, C-4, C-12, C-15), 124.7, 124.8 (4 C, C-2, C-3, C-13, C-14),
136.5 (2 C, C-7a, C-8a), 140.8 (2 C, C-18a, C-19a), 140.9 (1 C, C-8),
142.2 (1 C, C-19), 146.9, 147.0 (4 C, C-6a, C-9a, C-17a, C-20a),
147.6, 147.7 (4 C, C-5a, C-10a, C-16a, C-21a), 150.5 (4 C, C-4a,
C-11a, C-15a, C-22a).
The correct assignment of carbon atoms was executed with
COSY-experiment. The double signal sets in the range from

6 – EXPERIMENTAL SECTION 125
116.3 to 124.8 are caused by the asymmetry of the molecule. See
more detailed spectrum in the appendix.
HRMS: (ESI, pos., methanol/water): m/z [M]+ calcd for C45H32O2Na+:
627.2295; found: 627.2309.
Synthesis of (5,7,9,11,16,18,20,22) octahydro-5,22:7,20:9,18:11,16-tetra-
methanononacene-8,19-bis-(dihydrogenphosphat) (47)
In an argon gas atmosphere 100 mg (176 µmol) of tweezer 14 were dissolved in
10 ml of THF and cooled to 0 °C in an ice bath. Via a syringe 218 µl (365 mg,
2.38 mmol, 13.5 eq) of phosphoryl chloride were added within some minutes. The
mixture was stirred for 10 min at 0 °C. Via Hamilton syringe 65.0 µl (47.5 mg,
469 mmol) of triethylamine were added within 15 min and the mixture was stirred for
4 h under room temperature. The yellowish solution revealed some cloudiness. After
filtration the filtrate was evaporated under reduced pressure. The remaining residue
was suspended in diluted HCl solution and stirred overnight. After lyophilization the
purification of the crude via MPLC (RP-18, 50 µm, 12 nm, gradient run:
water/acetonitrile with additional 0.05 % NEt3) yielded the diphosphate 47 in 88 %
(112 mg, 154 µmol).
Molecular Weight: 726.16 g/mol
Formula: C42H32O8P2

126 6 – EXPERIMENTAL SECTION
Spectroscopic data and assignment of molecule positions:
1H NMR: (300.1 MHz, CD3OD): δ [ppm] = 2.28 – 2.44 (m, 8 H, H-23, H-24,
H-25, H-26), 4.03 (s, 4 H, H-5, H-11, H-16, H-22), 4.37 (s, 4 H, H-7,
H-9, H-18, H-20), 6.80 – 6.84 (m, 4 H, H-2, H-3, H-13, H-14), 7.02
– 7.05 (m, 4 H, H-1, H-4, H-12, H-15), 7.15 (s, 4 H, H-6, H-10,
H-17, H-21).
31P NMR: (121.5 MHz, CD3OD): δ [ppm] = -3.12 (1 P).
HRMS: (ESI, neg., methanol/water): m/z [M]+ calcd for C42H30O8P22-:
362.0702; found: 362.0693.
Synthesis of (5,7,9,11,16,18,20,22) octahydro-5,22:7,20:9,18:11,16-tetra-
methanononacene-8 (propargylhydrogenphosphat) 19-(dihydrogenphosphat)
(50)
51.0 mg (70.2 µmol) of tweezer 14 were dissolved in 2 ml DMF. A solution of
sodium hydride in DMF (0.84 mg, 35.0 µmol per 100 µl solution) was added via

6 – EXPERIMENTAL SECTION 127
syringe slowly in portions of 100 µl. Via a second syringe a solution of propargyl
bromide in DMF (1.80 µl, 2.48 mg, 20.8 µmol per 100 µl solution) was added slowly in
small portions. The reaction progress was controlled via HPLC. Therefore a small
sample of reaction volume was diluted in a highly diluted hydrochloric solution and
lyophilized.
After a total addition of 5 eq. of sodium hydride (350 µmol) and 12 eq. of propargyl
bromide (835 µmol) the solvent was evaporated under reduced pressure and the
remaining solid was lyophilized 3 times. Purification of raw product was executed via
MPLC (RP-18, ACN/ water/NEt3 (0.01%)) in a gradient run to yield 20 % (10.9 mg) of
the diphosphate mono-alkyne 50.
Molecular Weight: 764.71 g/mol
Formula: C45H34O8P2
Spectroscopic data and assignment of molecule positions:
1H NMR: (600.1 MHz, DMSO-d6): δ [ppm] = 2.08 – 2.12, 2.26 – 2.38 (m,
8 H, H-23, H-24, H-25,H-26), 3.47 (d, 4JH-29/ H-27 = 2.35 Hz, 1 H,
H-29), 4.05 – 4.07 (m, 4 H, H-5, H-11, H-16, H-22), 4.32 – 4.35 (m,
4 H, H-7, H-9, H-18, H-20), 4.44 (d, 4JH-27/ H-29 = 2.35 Hz, 2 H,
H-27), 6.75 – 6.77 (m, 4 H, H-2, H-3, H-13, H-14), 7.07 – 7.10 (m,
8 H, H-1, H-4, H-6, H-10, H-12, H-15, H-17, H-21), 8.09 (br. s, 3 H,
OH).
13C NMR: (150.9 MHz, DMSO-d6) δ [ppm] = 46.8 (2 C, C-7, C-9), 48.1 (2 C,
C-18, C-20), 50.3, 53.2 (4 C, C-5, C-11, C-16, C-22), 61.7 (1 C,
C-27), 71.9 (4 C, C-23, C-24, C-25, C-26), 78.8 (1 C, C-29), 87.8
(1 C, C-28), 114.2, 116.5 (4 C, C-6, C-10, C-17, C-21), 121.5, 122.3
(4 C, C-1, C-4, C-12, C-15), 124.6 (4 C, C-2, C-3, C-13, C-14), 136.5
(2 C, C-7a, C-8a), 140.8 (2 C, C-18a, C-19a), 150.4 (4 C, C-4a,
C-11a, C-15a, C-22a).

128 6 – EXPERIMENTAL SECTION
Not all quaternary carbon atoms could be identified. The
intensity of signals of the quaternary carbons was too low to
assign them all.
31P NMR: (242.9 MHz, DMSO-d6): δ [ppm] = -4.83 (1 P), -3.93 (1 P).
HRMS: (ESI, neg., methanol/water): m/z [M]+ calcd for C45H34O8P2-:
763.1645; found: 763.1634; calcd for C45H33O8P2Na-: 785.1465;
found: 763.1455.
Synthesis of (1R,4S,5R,8S)-1,4,5,8-tetrahydro-1,4:5,8-dimethanoanthracene-9-
(propargylhydrogenphosphat)-10-(dihydrogenphosphat) (51)
Under an argon gas atmosphere 100 mg (420 µmol) of diol 19b were dissolved in
5 ml of THF and cooled to 0 °C. Via syringe 782 µl (1.29 g, 8.39 mmol, 20.0 eq) of
phosphoryl chloride were added within some minutes. After 10 min 2.33 ml (1.70 g,
16.8mmol) of triethylamine were added within 15 min and the mixture was stirred for
4 h under room temperature. Further stirring at 50 °C for 40 min led to a yellowish
color of the mixture. The solvent was removed completely under reduced pressure
and the residue was dried for 1 h under reduced pressure. Afterwards the dried
residue was suspended in 5 ml of THF and cooled to 0 °C before 24.2 µl (23.5 mg,
420 µmol, 1 eq) of propargylic alcohol was added via syringe over 20 min. The
reaction mixture was stirred for 3 h at room temperature. Subsequently the solvent
was removed under reduced pressure and the remaining solid was lyophilized to
yield 150 mg of raw product. Purification of the crude via MPLC (RP-18, MeOH/
water/TFA (0.05%)) via gradient run yielded 40 % (72.9 mg) of the mono-alkyne 51.
Molecular Weight: 436.29 g/mol
Formula: C19H18O8P2

6 – EXPERIMENTAL SECTION 129
Spectroscopic data and assignment of molecule positions:
1H NMR: (600.1 MHz, DMSO-d6): δ [ppm] = 2.06 – 2.11 (m, 4 H, H-11,
H-12), 3.66 (t, 4JH-15/ H-13 = 2.45 Hz, 1 H, H-15), 4.05 – 4.06 (m, 4 H,
H-1, H-4, H-5, H-8), 4.67 (dd, 3JH-13/ P-9 = 9.08 Hz, 2JH-13/
H-15 = 2.45 Hz, 2 H, H-13), 5.04 (br. s. 3 H, OH), 6.71 – 6.75 (m,
4 H, H-2, H-3, H-6, H-7).
13C NMR: (150.9 MHz, DMSO-d6) δ [ppm] = 47.5, 47.6 (4 C, C-1, C-4, C-5,
C-8), 54.5 (1 C, C-13), 69.1 (2 C, C-11, C-12), 78.3 (1 C, C-15), 78.9
(1 C, C-14), 136.6, 137.3 (4 C, C-4a, C-8a, C-9a, C-10a), 141.6,
142.3 (2 C, C-9, C-10), 142.8, 143.1 (4 C, C-2, C-3, C-6, C-7).
31P NMR: (242.9 MHz, DMSO-d6): δ [ppm] = -5.71 – -5.63 (td, 3JP-9/
H-13 = 9.08 Hz, 2JP-9/ OH = 1.94 Hz, 1 P, P-9) -5.39 (d, 2JP-9/
OH = 1.94 Hz, 1 P, P-10)
MS: (ESI, neg., methanol/water): m/z [M]+ calcd for C19H18O8P-:
435.04; found: 435.12.
Molecule 51 could not be detected with HRMS.

130 6 – EXPERIMENTAL SECTION
6.5 Synthesis of the 1st Generation RGD-Receptor
Synthesis of receptor precursor 44
Under inert gas 24.8 mg (41.0 µmol) of 31 and 22.5 mg (41.2 µmol) of 37 were
dissolved in 2 ml of DMSO. After 2 min. of steering 2.06 mg (10.4 µmol) of sodium
ascorbate and 1.35 mg (5.41 µmol) of copper sulfate pentahydrate (CuSO4 * 5 H2O)
were added. The greenish mixture was stirred at room temperature. After 1 h the
mixture turned into a bluewish colour and TLC indicated the complete conversion of
starting materials. Addition of 5 ml of water led to a precipitation which was filtrated
over a nylon filter. The crude (87.6 mg) was lyophylized and purified via filtration
column (SiO2, ethyl acetate) to yield 95 % (45.5 mg, 39.5 µmol) of precursor 44.
Molecular Weight: 1151.29 g/mol
Formula: C71H58O8N8
Rf-value: 0.08; SiO2, n-hexan/ethyl acetate (2/1).
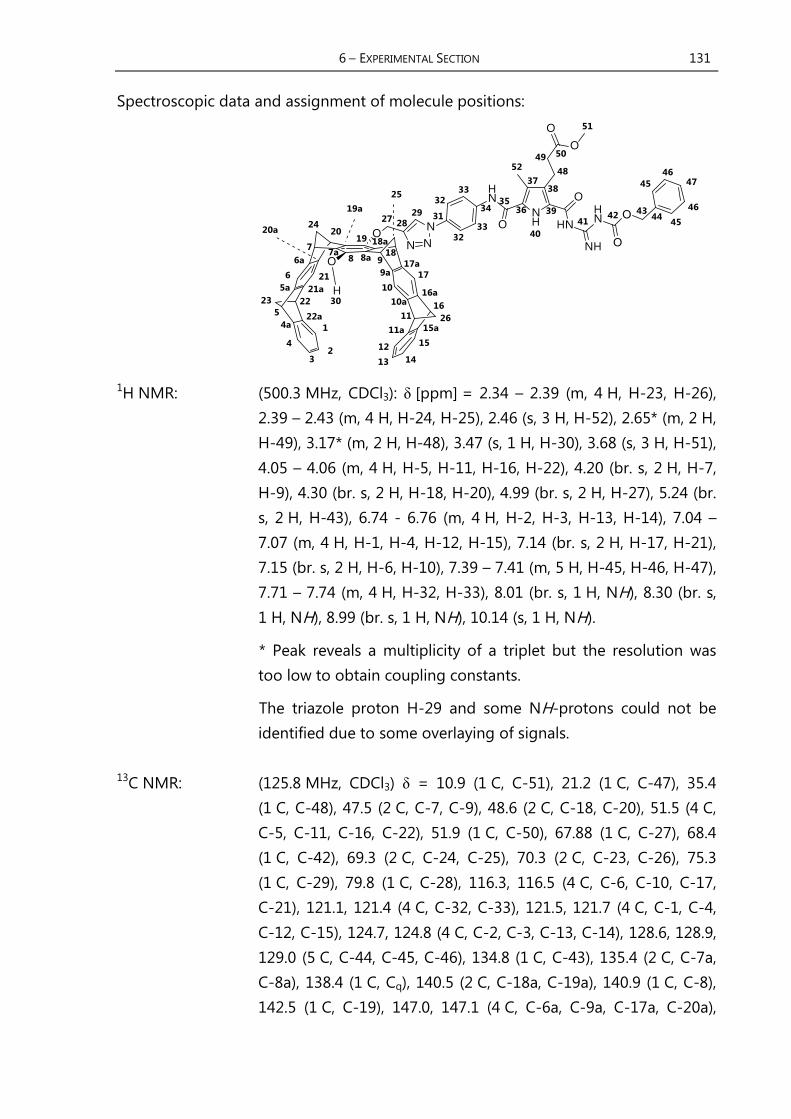
6 – EXPERIMENTAL SECTION 131
Spectroscopic data and assignment of molecule positions:
1H NMR: (500.3 MHz, CDCl3): δ [ppm] = 2.34 – 2.39 (m, 4 H, H-23, H-26),
2.39 – 2.43 (m, 4 H, H-24, H-25), 2.46 (s, 3 H, H-52), 2.65* (m, 2 H,
H-49), 3.17* (m, 2 H, H-48), 3.47 (s, 1 H, H-30), 3.68 (s, 3 H, H-51),
4.05 – 4.06 (m, 4 H, H-5, H-11, H-16, H-22), 4.20 (br. s, 2 H, H-7,
H-9), 4.30 (br. s, 2 H, H-18, H-20), 4.99 (br. s, 2 H, H-27), 5.24 (br.
s, 2 H, H-43), 6.74 - 6.76 (m, 4 H, H-2, H-3, H-13, H-14), 7.04 –
7.07 (m, 4 H, H-1, H-4, H-12, H-15), 7.14 (br. s, 2 H, H-17, H-21),
7.15 (br. s, 2 H, H-6, H-10), 7.39 – 7.41 (m, 5 H, H-45, H-46, H-47),
7.71 – 7.74 (m, 4 H, H-32, H-33), 8.01 (br. s, 1 H, NH), 8.30 (br. s,
1 H, NH), 8.99 (br. s, 1 H, NH), 10.14 (s, 1 H, NH).
* Peak reveals a multiplicity of a triplet but the resolution was
too low to obtain coupling constants.
The triazole proton H-29 and some NH-protons could not be
identified due to some overlaying of signals.
13C NMR: (125.8 MHz, CDCl3) δ = 10.9 (1 C, C-51), 21.2 (1 C, C-47), 35.4
(1 C, C-48), 47.5 (2 C, C-7, C-9), 48.6 (2 C, C-18, C-20), 51.5 (4 C,
C-5, C-11, C-16, C-22), 51.9 (1 C, C-50), 67.88 (1 C, C-27), 68.4
(1 C, C-42), 69.3 (2 C, C-24, C-25), 70.3 (2 C, C-23, C-26), 75.3
(1 C, C-29), 79.8 (1 C, C-28), 116.3, 116.5 (4 C, C-6, C-10, C-17,
C-21), 121.1, 121.4 (4 C, C-32, C-33), 121.5, 121.7 (4 C, C-1, C-4,
C-12, C-15), 124.7, 124.8 (4 C, C-2, C-3, C-13, C-14), 128.6, 128.9,
129.0 (5 C, C-44, C-45, C-46), 134.8 (1 C, C-43), 135.4 (2 C, C-7a,
C-8a), 138.4 (1 C, Cq), 140.5 (2 C, C-18a, C-19a), 140.9 (1 C, C-8),
142.5 (1 C, C-19), 147.0, 147.1 (4 C, C-6a, C-9a, C-17a, C-20a),

132 6 – EXPERIMENTAL SECTION
147.6, 147.7 (4 C, C-5a, C-10a, C-16a, C-21a), 150.5 (4 C, C-4a,
C-11a, C-15a, C-22a), 174.8 (1 C, C-49).
The assignment of carbon atoms was executed with HSQC- and
HMBC-experiment. The correct number of quaternary carbon
atoms could not be determined.
MS: (ESI, pos., methanol/water): m/z [M]- calcd for C71H57O8N8-:
1149.43; found: 1149.55.
Molecule 44 could not be detected with HRMS.
Synthesis of receptor precursor 45
Under inert gas 20.0 mg (17.4 µmol) of 44 were dissolved in 1 ml of DMSO and the
mixture was cooled to -3 °C. 50 µl (82. 0 mg, 535 µmol) of phosphorus oxychloride
and 50 µl (36.5 mg, 360 µmol) of triethylamine were added via syringe. The reaction
mixture was allowed to warm to room temperature and was stirred for 90 min. 1 ml
of 1 M hydrochloric acid were added to the reaction mixture. After addition of 10 ml
of water the mixture was extracted twice with DCM (20 ml) and twice with diethyl
ether (20 ml). The combined organic phases were dried over Na2SO4. After filtration
the filter residue was washed with further 10 ml of DCM and the solvent of organic

6 – EXPERIMENTAL SECTION 133
phases was evaporated under reduced pressure to yield 63 % (13.6 mg, 11.0 µmol)
of 45.
Molecular Weight: 1231.27 g/mol
Formula: C71H59O11N8P
Rf-value: 0.00; RP-18, MeOH.
Spectroscopic data and assignment of molecule positions:
1H NMR: (500.3 MHz, DMSO-d6): δ [ppm] = 2.15 – 2.23 (m, 4 H, H-24,
H-25), 2.27 – 2.29 (m, 4 H, H-23, H-26), 2.30 (s, 3 H, H-52), 2.62 –
2.64 (m, 2 H, H-49), 3.15 – 3.17 (m, 2 H, H-48), 3.47 (s, 1 H, H-30),
3.64 (s, 3 H, H-51), 3.99 (br. s, 2 H, H-5, H-11), 4.07 (br. s, 2 H,
H-16, H-22), 4.22 (br. s, 2 H, H-7, H-9), 4.34 (br. s, 2 H, H-18,
H-20), 5.04 (br. s, 2 H, H-27), 5.19 – 5.21 (m, 2 H, H-42), 6.74 -
6.76 (m, 4 H, H-2, H-3, H-13, H-14), 7.03 – 7.07 (m, 8 H, H-1, H-4,
H-6, H-10, H-12, H-15, H-17, H-21), 7.12 (br. s, 1 H, H-29), 7.31 –
7.44 (m, 5 H, H-45, H-46, H-47), 7.97 – 8.05 (m, 4 H, H-32, H-33),
8.09 (br. s, 1 H, NH), 8.20 (s, 1 H, NH), 8.26 (s, 1 H, NH), 8.96 (br. s,
1 H, NH), 10.04 (br. s, 2 H, H-30).
Some NH-protons could not be assigned due to some
overlaying of signals.
13C NMR: (125.8 MHz, CDCl3) δ = 9.9 (1 C, C-51), 21.7 (1 C, C-47), 47.7 (2 C,
C-7, C-9), 48.0 (2 C, C-18, C-20), 50.3 (4 C, C-5, C-11, C-16, C-22),
52.0 (1 C, C-50), 64.2 (1 C, C-27), 68.2 (1 C, C-42), 120.6, 121.5
(4 C, C-32, C-33), 128.2, 128.5, 132.5 (5 C, C-44, C-45, C-46),
146.8, 150.2 (Cq).

134 6 – EXPERIMENTAL SECTION
Not all carbon atoms could be determined especially those
carbon atoms of the aromatic backbone of the tweezer. These
signals disappeared in the noise. Signals of secondary carbon
atoms (CH2) could be assigned via DEPT-135 experiment.
31P NMR: (202.5 MHz, DMSO-d6): δ [ppm] = -5.05, -1.03.
MS: (ESI, pos., methanol/water): m/z [M]- calcd for C71H59O11N8P-:
1230.40; found: 1149.55.
Molecule 44 could not be detected via HRMS.
Synthesis of the 1st generation RGD-receptor 46
In an argon flushed reaction vessel 11.6 mg (9.42 µmol) of 45 and 1.70 mg
(1.60 µmol) Pd/C were suspended in 4 ml of THF. After degassing the argon
atmosphere was replaced with hydrogen. The mixture was stirred for 2 d at room
temperature under slight overpressure of hydrogen. After separation from Pd/C the
filter residue was washed with THF (5 ml) and acetone (5 ml). The solvent of the
filtrate was evaporated under reduced pressure and the remaining solid was
lyophilized 4 times to yield 83 % (8.58 mg, 7.82 µmol) of receptor 46.

6 – EXPERIMENTAL SECTION 135
Molecular Weight: 1097.13 g/mol
Formula: C63H53O9N8P
Rf-value: 0.92; RP-18, MeOH.
Spectroscopic data and assignment of molecule positions:
1H NMR: The resolution of proton signals was too low for any assignment.
13C NMR: The resolution of signals of the carbon atoms was too low for a
distinct assignment.
31P NMR: (202.5 MHz, DMSO-d6): δ [ppm] = -0.99.
MS: (ESI, pos., methanol/water): m/z [M]- calcd for C63H52O9N8P-:
1095.36; found: 1095.47.
Molecule 46 could not be detected with HRMS.

136 6 – EXPERIMENTAL SECTION
6.6 Synthesis of the 2nd Generation RGD-Receptor
Synthesis of (1R,4S,5R,8S)-10-((((1-(4-(5-(carbamimidoylcarbamoyl)-1H-
pyrrole-2-carboxamido)phenyl)-1H-1,2,3-triazol-4-yl)methoxy)(hydroxy)phos-
phoryl)oxy)-1,4,5,8-tetrahydro-1,4:5,8-dimethanoanthracen-9-yl dihydrogen
phosphate 56
A brownish mixture of 11.4 mg (36.5 µmol) of azido pyrrole 32 in 2 ml THF was
stirred in an argon atmosphere. After addition of 16.0 mg (36.7 µmol) of diphosphate
mono-alkyne 51, 1.29 mg (5.16 µmol) of copper sulfate pentahydrate and 1.94 mg
(9.79 µmol) of sodium ascorbate dissolved in 4 ml H2O/THF (1/1) the color of the
reaction mixture turned immediately to light brownish and orange. After stirring the
mixture for 2.5 d the easily volatile parts were removed by evaporation under
reduced pressure. The residual mixture was treated with 2.00 mg (25.6 µmol) of
sodium sulfide. The precipitate was filtered over viscose and the filtrate was
lyophilized to yield 49.7 mg of raw product. Dissolving the crude in 10 ml of water
and treatment with 0.1 M hydrochloric acid led to a precipitation. Only few drops of
hydrochloric acid were used until pH 2 was reached. The precipitate was filtered and
washed with ice cold water to yield 49 % 13.9 mg (17.7 µmol) of 56 as chloride salt.
Molecular Weight: 748.59 g/mol
Formula: C32H30O10N8P2
Melting point: 197 °C decomposition (water).

6 – EXPERIMENTAL SECTION 137
Spectroscopic data and assignment of molecule positions:
1H NMR: (600.1 MHz, DMF-d7): δ [ppm] = 1.98 (m, 4 H, H-11, H-12), 3.73
(m, 2 H, H-1, H-8), 4.82 (m, 2 H, H-4, H-5), 5.26 (br. s, 2 H, H-13),
7.13 – 7.17 (m, 2 H, H-23, H-24), 7.87 – 7.90 (m, 4 H, H-17, H-18),
8.19 (s, 1 H, H-15), 9.06 (br. s, 2 H, N-H), 9.19 (br. s, 2 H, N-H),
9.49, 10.65 (2 H, N-H), 12.93, 12.95 (3 H, H-29, H-30).
13C NMR: (150.9 MHz, DMF-d7) δ = 64.4 (1 C, C-13), 73.7 (2 C, C-11, C-12),
117.1, 119.9, 121.5 122.2 (4 C, C-17, C-18), 157.6, 160.9 (2 C, Cq).
Most of the carbon atom signals could not be assigned due to
extreme peak broadening.
31P NMR: (202.5 MHz, DMF-d7): δ [ppm] = -4.91.
MS: (ESI, pos., methanol/water): m/z [M]- calcd for C63H52O9N8P2-:
747.15; found: 747.24.
Molecule 56 could not be detected with HRMS.
FT-IR: (ATR): [cm-1] = 3307 (w), 2116 (w), 1698 (m), 1542 (m), 1510
(m), 1473 (m), 1312 (m), 1238 (m), 1042 (m).
6.7 Syntheses of Guest RGD-Peptides
All peptide syntheses were carried out on solid phase (SPPS) with a peptide shaker
in an inert gas atmosphere. The used solvents in the peptide synthesis were dried,
distilled and kept under argon before usage. The used equivalents of reagents refer
to the loading of the resin. The synthesis procedure is described as follows. In a first
step the resins were swollen with 10 ml DCM for 1.5 h and 6 h for cyclic and linear
peptides respectively. Afterwards the resin beads were washed twice with 5 ml DMF.

138 6 – EXPERIMENTAL SECTION
The deprotection of Fmoc-group was carried out by a twofold treatment of the resin
with 5 ml of piperidine for 20 min. After cleavage the resin was washed six times with
5 ml and 10 ml of DMF with respect to linear and cyclic peptides.
The coupling reaction of each amino acid was executed twice with 3 eq of PyBOP,
6 eq of DIPEA and 3 eq of the relevant amino acid. The first coupling was done for
6 h and the second one was carried out overnight (at least for 12 h). Between both
coupling steps the resin was washed two times with 5 ml of DMF. Potentially free
amine functions of the resins were capped after first coupling step. A full occupation
of amine functions was verified via Kaiser Test. Before the coupling reaction of the
next amino acid was executed the Fmoc-deprotection was carried out twofold with
an excess of piperidine. Detailed peptide synthesis procedures will be explained in
successional sections.
Synthesis of the linear peptide sequence N-Ac-RGD (P1)
In an argon atmosphere 100 mg of Rink Amide MBHA Resin (loading of the resin:
0.84 mmol·g-1, 84.0 µmol, 1 eq) were pre-treated in accordance to above mentioned
procedure. The first coupling step was carried out with 104 mg (252 µmol) Fmoc-
L-Asp(OtBu)-OH, 131 mg (252 µmol) PyBOP and 88 µl (65.3 mg, 505 µmol) DIPEA in
5 ml DMF. The end-capping of unreacted amines was executed with 55 µl (59.4 mg,
7 eq) acetic anhydride and 150 µL (138 mg, 16 eq) NMM in 5 ml DMF for 4 h. After a
negative result of the Kaiser Test the deprotection of the Fmoc protection group was
carried out with a twofold excess of piperidine. Afterwards the resin beads were
washed for 5 min with 5 ml DMF and the washing procedure was repeated another
five times. The coupling reaction of the second amino acid was executed with
75.0 mg (252 µmol) Fmoc-Gly-OH, 131 mg (252 µmol) PyBOP and 88 µl (65.3 mg,
505 µmol) DIPEA in 5 ml DMF. The arginine was coupled as the last amino acid.
Therefore 163 mg (252 µmol) Fmoc-Arg-(Pbf)-OH, 131 mg (252 µmol) PyBOP and
88 µl (65.3 mg, 505 µmol) DIPEA in 5 ml DMF were used. Afterwards the Fmoc-group
was cleaved and the resin was washed carefully according to the previous described

6 – EXPERIMENTAL SECTION 139
procedure. The tripeptide sequence was capped by acetylation at the N-terminus
before cleavage from the resin was carried out. Thus the resin bounded peptide was
treated with a mixture of 55 µl (59.4 mg, 7 eq) of acetic anhydride and 150 µL
(138 mg, 16 eq) of NMM in 5 ml DMF. The resin was washed carefully trice with
10 ml of DCM, trice with 10 ml of methanol and trice with 10 ml of DCM in
succession. The resin beads were treated for 3 h with 10 ml of a cleaving solution
containing TFA/TIS/DCM 95/2.5/2.5. Subsequently the resin was washed with DCM to
separate the N-acetylated RGD-peptide P1 from resin beads several times. The
volume of the combined filtrates of peptide solution was diminished under reduced
pressure to approximately 3 ml. Through the addition of 25 ml of cold diethyl ether
the linear peptide P1 could be precipitated. The precipitate was filtered over a nylon
filter and the obtained crude product was lyophilized. The final purification was done
by MPLC (RP-18, 50 µm, 12 nm, gradient run: water/acetonitrile with additional
0.05 % TFA respectively; 100/0 to 98/2 within 18 min) to yield 56 % (22.9 mg,
47.3 µmol) of P1 as TFA-salt.
Molecular Weight: 387.40 g/mol.
Formula: C14H25O6N7
Retention time: 8.79 min at HPLC, RP-18, particle size 5 µm, pore size 12 nm,
eluent water/methanol with additional 0.05 % TFA respectively;
gradient run from 100/0 to 98/2 in 15min.
Spectroscopic data and assignment of molecule positions:
1H NMR: (300.1 MHz, DMSO-d6): δ [ppm] = 1.46 (m, 4 H, H-3, H-4), 1.83
(s, 3 H, H-1), 3.05 – 3.07 (m, 4 H, H-5, H-8), 4.19 (m, 2 H, H-6),
4.37 (m, 1 H, H-2), 4.44 (m, 1 H, H-7), 6.85, 7.14, 7.37, 7.48, 8.09,
8.35 (10 H, N-H).
HPLC-purity: 94 % at 220 nm; RP-18, gradient run, methanol/water/TFA.

140 6 – EXPERIMENTAL SECTION
Synthesis of the penta peptide cyclo(RGDfV) (P2)
The synthesis of the circular peptide P2 was performed with the use of
o-chlorotrityl chloride (loading of the resin: 1.55 mmol·g-1, 406 mg, 630 µmol, 1.00
eq). As in analog to the synthesis of the linear tripeptide the resin was allowed to
swell in 10 ml of dichloromethane for 1.5 h and washed two times with 5 ml of
dimethylformamide for 15 min afterwards. The incorporation of the first amino acid
glycine was done with Fmoc-Gly-OH (562 mg, 1.89 mmol, 3.00 eq), DIPEA (643 µl,
489 mg, 3.78 mmol, 6.00 eq) in 10 ml of dimethylformamide. Afterwards the resin
was washed three times with 5 ml of Dimethylformamide. The end capping of free
positions at the resin was performed with methanol (1.50 ml, 1.19 g, 37.0 mmol,
58 eq) and DIPEA (643 µl, 489 mg, 3.78 mmol, 6.00 eq) in 8 ml of
Dimethylformamide. The mixture was shaken for 16.5 h before the resin was washed
thoroughly six times with 5 ml of dimethylformamide. The cleavage of the Fmoc-
group was carried out twice with piperidine (2.00 ml) in 8.00 ml of dichloromethane
for 20 min followed by a careful washing of the resin with 10 ml of
dimethylformamide for six times. These iterative steps were performed after each
coupling of the following amino acids L-arginine, L-valine, D-phenylalanine and L-
aspartic acid. From the second amino acid on coupling was done twice analog to the
linear peptide synthesis to ensure fully covering of free amines. Intermediate checks
were done via the Kaiser Test. The second coupling step of a particular amino acid
was done overnight while the first step lasted for 6-8 h. In the following the amino
acids Fmoc-L-Arg(Pbf)-OH (1.23 g, 1.89 mmol, 3.00 eq), Fmoc-L-Val-OH (641 mg,
1.89 mmol, 3.00 eq), Fmoc-D-Phe-OH (731 mg, 1.89 mmol, 3.00 eq) and Fmoc-
L-Asp(OtBu)-OH (777 mg, 1.89 mmol, 3.00 eq) were added via the described
procedure. All coupling reactions were carried out using PyBOP (984 mg, 1.89 mmol,
3 eq), DIPEA (643 µl, 489 mg, 3.78 mmol, 6 eq) dissolved dichloromethane (10 ml)
per coupling step respectively. To release the peptide strand from the resin 10 ml of
the cleavage solution 2,2,2-trifuoroethane (TFE)/ acidic acid/ dichloromethane (1/1/3)
were added to the resin and the mixture was shaken overnight. After separation of

6 – EXPERIMENTAL SECTION 141
the peptide solution from the resin beads the residual resin was washed finally three
times with dichloromethane (10 ml) for 10 min each time. The combined filtrates
were evaporated under reduced pressure to lead to a colorless solid. For the
subsequent cyclisation reaction the solid was dissolved in dichloromethane (15 ml).
The prepared solution was added dropwise to a second solution of T3P (1.93 ml,
1.00 g, 3.15 mmol, 5 eq), TEA (2.18 ml, 1.59 mg, 15 mmol, 25 eq), DMAP (7.70 mg,
63.0 µmol, 0.1 eq) in dichloromethane (220 ml) within 20 h. Afterwards the mixture
was stirred for 1.5 d at room temperature. Subsequently the solvent was removed by
rotary evaporation under reduced pressure yielding a sticky, oily and some orange
colored residue.
In a small scale work up 3.00 mg of the raw material were treated with a solution of
water/TFA 1/1 (400µl) and stirred for 12 h at room temperature. The analysis via
HPLC-MS confirmed the formation of the desired peptide sequence. The remaining
crude product was diluted in chloroform (20 ml) and extracted with water (25 ml).
The organic phase was dried over sodium sulfate after phase separation. After final
filtration and washing with further chloroform (5 ml) the solvent was evaporated and
the residual solid was freeze dried. The obtained raw product (319 mg) was purified
via column chromatography (SiO2, dichloromethane/methanol 12/1 and could be
obtained as compound protected peptide in a yield of 12 % (41.4 mg, 73.8 µmol).
The cleavage of the protection groups was performed by the addition of water/TFA
1/19 (4.00 ml). The mixture was stirred for 3.5 h at room temperature. The azeotropic
distillation with toluene resulted in a colorless solid which was freeze dried to yield
compound P2 in a crude quality (33.2 mg). The final purification was done with
chromatography (MPLC, RP-18, 50 g, nm, 5 μm, 5 x .5 cm, nm, 25 ml·min-1,
gradient run with methanol/water with add on of 0.05 % TFA to yield 5 % (21.8 mg,
31.7 µmol) of P2.
Molecular Weight: 574.64 g/mol.
Formula: C26H38O7N8
Retention time: 13.10 min at HPLC, RP-18, particle size 5 µm, pore size 12 nm,
eluent water/methanol with additional 0.05 % TFA respectively; gradient run from 100/0 to 98/2 in 15min.
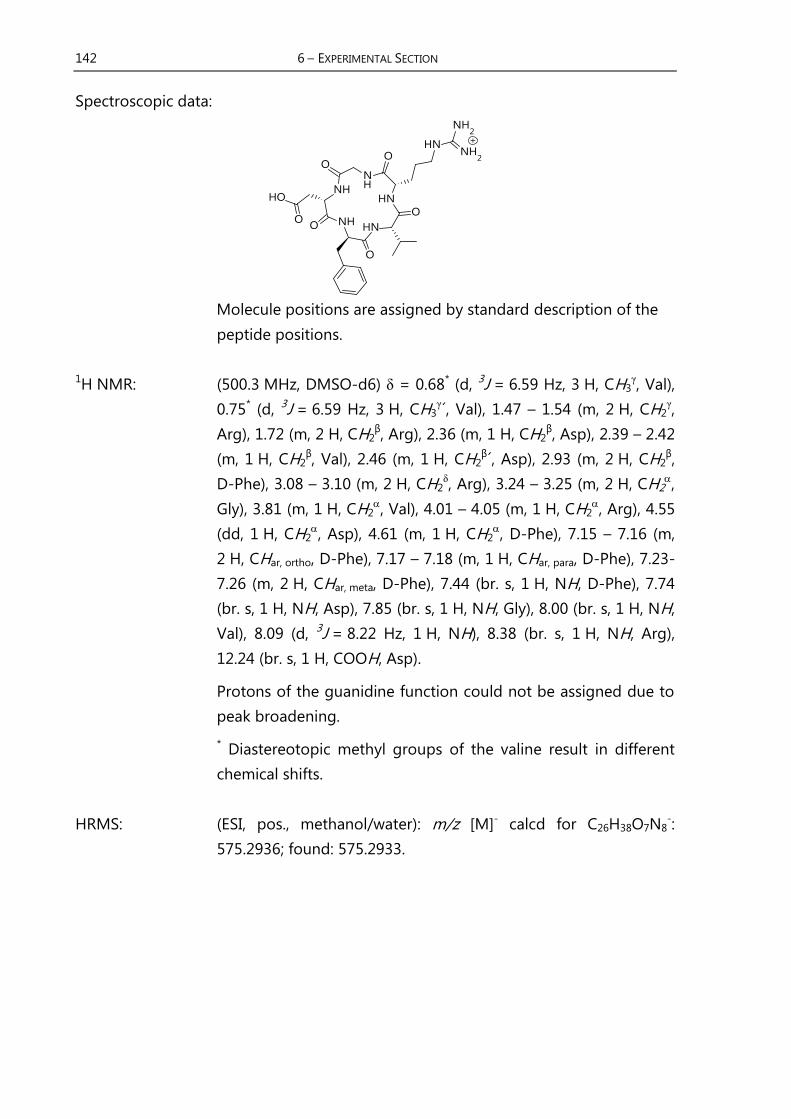
142 6 – EXPERIMENTAL SECTION
Spectroscopic data:
Molecule positions are assigned by standard description of the
peptide positions.
1H NMR: (500.3 MHz, DMSO-d6) δ = 0.68* (d, 3J = 6.59 Hz, 3 H, CH3 , Val),
0.75* (d, 3J = 6.59 Hz, 3 H, CH3 ´, Val), 1.47 – 1.54 (m, 2 H, CH2 ,
Arg), 1.72 (m, 2 H, CH2β, Arg), 2.36 (m, 1 H, CH2
β, Asp), 2.39 – 2.42
(m, 1 H, CH2β, Val), 2.46 (m, 1 H, CH2
β´, Asp), 2.93 (m, 2 H, CH2β,
D-Phe), 3.08 – 3.10 (m, 2 H, CH2δ, Arg), 3.24 – 3.25 (m, 2 H, CH2
,
Gly), 3.81 (m, 1 H, CH2, Val), 4.01 – 4.05 (m, 1 H, CH2
, Arg), 4.55
(dd, 1 H, CH2, Asp), 4.61 (m, 1 H, CH2
, D-Phe), 7.15 – 7.16 (m,
2 H, CHar, ortho, D-Phe), 7.17 – 7.18 (m, 1 H, CHar, para, D-Phe), 7.23-
7.26 (m, 2 H, CHar, meta, D-Phe), 7.44 (br. s, 1 H, NH, D-Phe), 7.74
(br. s, 1 H, NH, Asp), 7.85 (br. s, 1 H, NH, Gly), 8.00 (br. s, 1 H, NH,
Val), 8.09 (d, 3J = 8.22 Hz, 1 H, NH), 8.38 (br. s, 1 H, NH, Arg),
12.24 (br. s, 1 H, COOH, Asp).
Protons of the guanidine function could not be assigned due to
peak broadening.
* Diastereotopic methyl groups of the valine result in different
chemical shifts.
HRMS: (ESI, pos., methanol/water): m/z [M]- calcd for C26H38O7N8-:
575.2936; found: 575.2933.

6 – EXPERIMENTAL SECTION 143
Synthesis of hexa peptide cyclo(RGDfLG) (P3)
Synthesis of the cyclic peptide P3 was carried out in analogous manner to the
preparation of the cyclic peptide P2. The amino acids glycine, L-arginine, glycine,
L-leucine, D-phenylalanine and L-aspartic acid were incorporated on O-chlorotrityl
chloride (loading 1.55 mmol·g-1, 406 mg, 630 µmol, 1.00 eq) iteratively using Fmoc-
Gly-OH (562 mg, 1.89 mmol, 3.00 eq), Fmoc-L-Arg(Pbf)-OH (1.23 g, 1.89 mmol,
Fmoc-Gly-OH (562 mg, 1.89 mmol, 3.00 eq), 3.00 eq), Fmoc-L-Leu-OH (668 mg,
1.89 mmol, 3.00 eq), Fmoc-D-Phe-OH (731 mg, 1.89 mmol, 3.00 eq) and Fmoc-
L-Asp(OtBu)-OH (777 mg, 1.89 mmol, 3.00 eq). Furthermore DIPEA (643 µl, 489 mg,
3.78 mmol, 6.00 eq) in 10 ml dimethylformamide was added to each coupling
reaction. The second coupling reaction of each amino acid was done overnight. After
washing three times with 5 ml dimethylformamide the end capping of free positions
at the resin was performed with methanol (1.50 ml, 1.19 g, 37.0 mmol, 58 eq) and
DIPEA (643 µl, 489 mg, 3.78 mmol, 6.00 eq) in 8 ml dimethylformamide shaking for
16.5 h. Subsequently washing the resin six times with 5 ml dimethylformamide
cleavage of Fmoc was carried out twice with piperidine (2.00 ml) in 8.00 ml
dichloromethane for 20 min followed by a careful washing of the resin six times with
10 ml dimethylformamide. These iterations were performed after each coupling of
the following amino acids L-arginine, L-valine, D-phenylalanine and L-aspartic acid.
From the second amino acid on coupling was done twice similar to linear peptide
synthesis to ensure fully covering of free amines. The second coupling of a particular
amino acid was reacted overnight while the first lasted for 6-8 h. Amounts of the
used amino acids are announced below. Fmoc-L-Arg(Pbf)-OH (1.23 g, 1.89 mmol,
3.00 eq), Fmoc-L-Leu-OH (668 mg, 1.89 mmol, 3.00 eq), Fmoc-D-Phe-OH (731 mg,
1.89 mmol, 3.00 eq) and Fmoc-L-Asp(OtBu)-OH (777 mg, 1.89 mmol, 3.00 eq). The
couplings were carried out using same amounts of PyBOP (984 mg, 1.89 mmol, 3 eq),
DIPEA (643 µl, 489 mg, 3.78 mmol, 6 eq) dissolved dichloromethane (10 ml)
respectively. To keep the protection groups of the side chains of the peptides for
further cyclisation a very mild cleavage method using 10 ml solution of
2,2,2-trifuoroethane (TFE)/ acidic acid/ dichloromethane (1/1/3) was added to the

144 6 – EXPERIMENTAL SECTION
resin and the mixture was shaken overnight. Washing the resin finally three times
with 10 ml dichloromethane for 10 min respectively led to a colorless solid after
evaporation of the solvents. A solution of the residue in dichloromethane (15 ml) was
added within 20 h to a solution of T3P (1.93 ml, 1.00 g, 3.15 mmol, 5 eq), TEA
(2.18 ml, 1.59 mg, 15 mmol, 25 eq), DMAP (7.70 mg, 63.0 µmol, 0.1 eq) in
dichloromethane (220 ml) The mixture was stirred for 1.5 d at room temperature.
Subsequently the solvent was removed by rotary evaporation under reduced
pressure yielding a sticky, oily and orange colored residue.
In a small scale work up 3.00 mg of the raw material were treated with a solution
water/TFA 1/1 (400µl) and stirred for 12 h at room temperature. An analysis via
HPLC-MS confirmed the formation of the correct peptide sequence.
The sticky residue was diluted in chloroform (20 ml) and extracted with water
(25 ml). Organic phase was dried over sodium sulfate after phase separation. Finally
filtrating and washing with further chloroform (5 ml) the solvent was evaporated and
the residual solid was freeze dried. The obtained raw product (319 mg) was purified
via column chromatography (SiO2, dichloromethane/methanol 12/1 and could be
received as compound P3 12 % (41.4 mg, 73.8 µmol).
Cleavage of protection groups were performed by addition of water/TFA 1/19
(4.00 ml) and stirring for 3.5 h at room temperature. Azeotropic distillation with
toluene. The remained solid was freeze dried to yield compound xx in a crude quality
33.2 mg. Purification was done with chromatography (MPLC, RP-18, 50 g, 12 nm, 15
μm, 5 x .5 cm, nm, 5 ml·min–1, gradient run with methanol/water with add on
of 0.05 % TFA. Yield 8.30 mg
Molecular Weight: 645.72 g/mol
Formula: C29H43O8N9
Retention time: 4.61 min at HPLC, RP-18, particle size 5 µm, pore size 12 nm,
eluent water/methanol with additional 0.05 % TFA respectively;
gradient run from 40/60 to 0/100 in 15min.

6 – EXPERIMENTAL SECTION 145
Spectroscopic data:
Molecule positions are assigned by standard description of the
peptide positions.
1H NMR: (600 MHz, DMSO-d6) δ = 0.63* (m, 3 H, CH3
δ, Leu), 0.72* (m, 3 H,
CH3δ´, Leu), 1.06 (m, 1 H, CH , Leu), 1.35* (m, 1 H, CH2
β, Leu),
1.41* (m, 1 H, CH2β´, Leu), 1.46 (m, 2 H, CH2 , Arg), 1.56* (m, 1 H,
CH2β, Arg), 1.74* (m, 1 H, CH2
β´, Arg), 2.54 (2 H, CH2β, Asp), 2.85*
(m, 1 H, CH2β, D-Phe), 3.00* (m, 1 H, CH2
β´, D-Phe), 3.08 – 3.10 (m,
2 H, CH2δ, Arg), 3.55-3.56* (d, 2J = 15.2 Hz, 1 H, CH2
, Gly [A]),
3.63* (m, 1 H, CH2, Gly [B]), 3.78-3.80* (d, 2J = 15.2 Hz, 1 H, CH2
´,
Gly [A]), 3.91* (m, 1 H, CH2´, Gly [B]), 3.95 (br. s., 1 H, CH2
, Arg),
4.07 (1 H, CH , Leu), 4.37 (br. s. 1 H, CH , D-Phe), 4.54 (1 H, CH ,
Asp), 7.15 – 7.16 (m, 2 H, CHar, ortho, D-Phe), 7.18 – 7.19 (m, 1 H,
CHar, para, D-Phe), 7.22-7.25 (m, 2 H, CHar, meta, D-Phe), 7.42 (br. s,
1 H, CH2δNH, Arg), 7.68 (br. s, 1 H, NH, Asp), 7.94 (br. s, 1 H, NH,
Gly [B]), 8.20 (br. s, 1 H, NH, Leu), 8.38 (br. s, 1 H, NH, Gly [A]),
8.38 (br. s, 1 H, NH, Arg), 8.43 (br. s, 1 H, NH, D-Phe), 12.26 (br. s,
1 H, COOH, Asp).
* Diastereotopic protons of the corresponding amino acids result
in different chemical shifts.
COSY, HMBC and HSQC experiments facilitated assignment of
the signals especially to separate signals of the 2 glycine amino
acids A and B.
Protons of the guanidine function could not be assigned due to
peak broadening.
13C NMR: (150.9 MHz, DMSO-d6) δ = 21.4* (1 C, CH3
δ, Leu), 23.6* (1 C,
CH3δ´, Leu), 24.2 (1 C, CH , Leu), 25.6 (1 C, CH2 , Arg), 27.6 (1 C,

146 6 – EXPERIMENTAL SECTION
CH2β, Arg), 36.5, (1 C, CH2
β, Asp), 37.0 (1 C, CH2β, D-Phe), 40.1
(1 C, CH2β, Leu), 40.8 (1 C, CH2
δ, Arg), 42.2 (1 C, CH2, Gly [B]),
43.2 (1 C, CH2, Gly [A]), 49.9 (1 C, CH, Asp), 51.5 (1 C, CH, Leu),
53.9 (1 C, CH, Arg), 55.5 (1 C, CH, D-Phe), 126.8 (1 C, CHpara,
D-Phe), 128.6, (2 C, CHmeta, D-Phe), 129.6 (2 C, CHortho, D-Phe),
137.4 (1 C, Cq, D-Phe), 157.0, 158.2, 169.8, 170.7, 172.0, 172.3,
173 (Cq, carbonyle and guanidinium).
* Diastereotopic methyl groups of the amino acids leucine result
in different chemical shifts.
The classification of the carbon atoms was completed by two
dimensional NMR spectroscopy (HSQC). The correct number of
quaternary carbon atoms could not be determined.
HRMS: (ESI, pos., methanol/water): m/z [M]- calcd for C29H42O8N9-:
644.3151; found: 644.3134.

6 – EXPERIMENTAL SECTION 147
6.8 UV-Binding Studies
6.8.1 General Procedure of the Titration Experiments
Solutions of receptor and peptide were prepared according to the following
procedure. Desalinated water was adjusted to pH 6.6 with 0.01 M sodium hydroxide
and 0.01 M hydrochloric acid solutions. After the preparation of the aqueous
solutions of the receptor and the substrate the pH value was controlled again. If
necessary the adjustment of pH was done with previous mentioned alkaline and
acidic solutions. Thereby the increase of the total volume was considered for the
calculation of the final concentration. The UV-measurements were executed in a
quartz glass cuvette with a length of 1 cm and a maximum volume of 1200 µL. Each
series of measurement was started with an initial volume of 800 µL of pure receptor
solution. In the beginning added amounts of the substrate were kept small whereas
amounts were increased with progress of the titration experiment.
Thereby it was ensured that strong interactions could be determined in the
beginning of experiment. The high substrate concentration was chosen to have the
possibility to obtain high ratios of substrate to receptor at the end of the experiment
which is mandatory for weaker interactions. In table shown below (figure 6-1) the
progress of an exemplary titration experiment is shown.
Step VS Substrate Vtotal Ratio Aobs Aexp
# [µL] [eq] [µL] VS / VR at λmax (dilution)
1 0 0 800 0.000 1.419 1.419
2 5 0.92 805 0.006 1.377 1.410
3 10 1.83 810 0.013 1.356 1.401
4 15 2.75 815 0.019 1.348 1.393
5 20 3.66 820 0.025 1.339 1.384
6 30 5.49 830 0.038 1.321 1.367
7 40 7.32 840 0.050 1.309 1.351
… … … … … … …21 280 51.25 1080 0.350 1.063 1.051
22 320 58.57 1120 0.400 1.029 1.013
23 360 65.9 1160 0.450 1.001 0.978
24 400 73.22 1200 0.500 0.975 0.946
Figure 6-1. Exemplarily UV-titration experiment of receptor 56 with a peptide substrate. The
expected absorption Aexp without any effect was calculated considering only the dilution effect
of the added receptor solution during the experiment.

148 6 – EXPERIMENTAL SECTION
After each addition step the solution was mixed by shaking it for 5 to 10 seconds
and measurement was carried out after 2 min. During this delay the mixture was
allowed to equilibrate. Therefore the sample was tempered at 25°C within the heated
thermos-block of the UV-machine. The measurement was carried out with a
tempered sample too.
6.8.2 Evaluation of the Binding Constants
All titration experiments started with an initial volume of 700-800 µl of the pure
receptor solution in a UV cuvette at a pH of 6.0. The concentration of the receptor
solution at the beginning of the experiments varied from 5.575 · 10-5 M to
1.173 · 10-4 M. All peptide solutions used in the UV-experiments were approximately
100 to 150°times higher concentrated than the receptor solution. The total amount
of added substrate peptides varied from 18 to 80 equivalents. Generally small
quantities of 2.5 µl to 5 µl of peptides were added at the beginning of an experiment.
With progress of the titration experiment the amounts were increased up to 40 µl
per step.
The UV spectrum of the UV-titration experiment of receptor 56 with the linear
peptide P1 is shown in figure 6-2. The single measurements are shown on the left
side. The plot of the binding isotherm in figure 4-48 (red line) was obtained from a
non-linear regression analysis with the computer program origin. The experiment
was done with a ligand concentration of 8.16 ·10-3 M and a receptor concentration of
5.575 ·10-5 M.
240 260 280 300 320 340 360 380 400 420
0.6
0.8
1.0
1.2
1.4
Ab
sorb
ance
[a.
u.]
Wavelength [nm]
0 12.8
0.46 14.6
0.92 18.3
1.37 22.0
1.83 25.6
2.75 29.3
3.66 36.6
4.58 43.9
5.49 51.3
7.32 58.6
9.15 65.9
11.0 73.2
Figure 6-2. UV-measurements of the titration experiment of receptor 56 and ligand P1. The
added equivalents of substrate are given in the table at the right side.
After the addition of 73.2 equivalents of the substrate peptide the measurement
was stopped (fig. 6-1). The effect of the dilution was taken into account for analysis.
0.0 0.1 0.2 0.3 0.4 0.5
1.0
1.1
1.2
1.3
1.4
Ab
sorb
ance
@30
6 n
m [
a.u
.]
V(S)/V(R)

6 – EXPERIMENTAL SECTION 149
Some constraints were made before non-linear regression analysis was started.
The variables of substrate concentration [S] and receptor concentration [R] were set
to fixed values. Additionally the initial absorption Ai and the extinction coefficient of
the receptor 56 were fixed. From the preliminary dilution experiment of receptor 56
an extinction coefficient ɛ of 2500 L·mol−1·cm−1 could be derived via the Beer-
Lambert Law which was set as constraint too. For the final evaluation the ratio of
VS/VR, synonymic to equivalents of added substrate, was plotted against observed
absorption Aobs at maximum wavelength λmax. The non-linear regression analysis
revealed an average binding constant of 33.7 10-3 M-1 for the RGD-peptide P1 with a
standard error of 5.3 10-3 M-1. In an analogous way the cyclic peptides P2 and P3
were evaluated. Their UV-measurements and binding isotherms are shown in
figure 6-3.
Figure 6-3. Left side: UV-measurements of titration experiment of receptor 56 and cyclic peptide
P2 (top) and P3 (bottom). Respective binding isotherms are displayed at the right side. The
black curls represent the single measurements.
In both cases the receptor concentration was 1.173 ·10-4 M. The concentration of
the peptide solutions were 7.9 ·10-3 M and 1.057 ·10-2 M for the penta-peptide (P2)
and the hexa-peptide (P3) respectively. The average binding constants of 13.3 ·10-3
M-1 for hexa-peptide P3 and 4.3 ·103* M-1 for penta-peptide P2 were calculated via
non-linear regression analysis. In particular the average values were obtained from at

150 6 – EXPERIMENTAL SECTION
least 2 different and independent titration experiments. In figure 6-3 UV-spectra and
binding isotherms of particular measurements of both cyclic peptides are shown.
The extinction coefficients at a wavelength of 306 nm of the receptor-peptide
complexes were estimated at around 2300 L·mol−1·cm−1. The estimated values were
not obtained from any experimental data. They could only be derived from non-
linear curve fitting with origin. In figure 6-4 the proposed peptide receptor complex
of the hexa-peptide P3 and receptor 56 is shown. Here the complementary binding
sites are positioned in opposite of each other.
Figure 6-4. Proposed binding motif for a 1:1 association between receptor 56 and peptide P3.
The repeated titration experiment of RGD-peptide P2 at a higher concentration of
the substrate revealed some interesting results. In this experiment a peptide concen-
tration 150 times higher than the initial receptor concentration was used. In figure
6-5 the full experiment is shown.
240 280 320 360 400 440
1.0
1.2
1.4
1.6
1.8
Ab
sorb
ance
[a.
u.]
Wavelength [nm]
0.0 0.50 0.99
1.49 1.99 2.49
2.98 3.48 3.98
4.47 4.97 5.47
5.97 6.46 6.96
7.46 7.95 8.95
9.94 10.94 11.93
12.93 13.92 14.91
15.91 17.90 19.88
21.87 23.86 25.85
27.84 29.83 31.82
33.80 35.79 37.78
39.77 43.75 47.72
51.70 55.68 59.61
67.56 75.50 83.45
Figure 6-5. UV titration experiment of receptor 56 and peptide P2 with increased concentration.

6 – EXPERIMENTAL SECTION 151
The experiment was carried out under same conditions as the previous
experiments. Due to the higher concentration of peptide solution 83.45 equivalents
were added in total. For the non-linear regression analysis the unfeasible
measurements that revealed strange shifts were deleted. The plot of the linear
regression analysis with the adjusted data set is shown in figure 6-5.
Figure 6-6. Plot of the linear regression after elimination of the most unfeasible measurement
data.
Although the plot looked quite acceptable (fig. 6-6) no suitable binding constant
could be evaluated from the acquired data. The Job plots were carried out with
equimolar solutions of receptor and substrate. For the Job plots a concentration
range between 55.7 µM and 139 µM was used. The adjustment of the molar specific
molar fractions occurred via volume exchange. In the initial step the pure receptor
solution was measured.
Step Vexchanged Substrate Vtotal
Molar
fractionAobs
# [µL] [eq] [µL] [xs] at λmax
1 0 0 800 0 1.434
2 80 0.1 800 0.1 1.282
3 88.9 0.2 800 0.2 1.135
4 100 0.3 800 0.3 0.994
5 114.29 0.4 800 0.4 0.855
6 133.33 0.5 800 0.5 0.719
7 160 0.6 800 0.6 0.570
8 200 0.7 800 0.7 0.433
9 266 0.8 800 0.8 0.293
10 400 0.9 800 0.9 0.156
11 800 1 800 1 0.039
Figure 6-7. Table of an exemplary Job plot analysis.

152 6 – EXPERIMENTAL SECTION
For further steps the adjustment of the molar fraction occurred via exchange of
the initial solution. The individual steps are shown in figure 6-7 exemplarily.
240 280 320 360 400 4400.00
0.25
0.50
0.75
1.00
1.25
1.50
1.75
Ab
sorb
ance
[a.
u.]
Wavelenght [nm]
0.0
0.1
0.2
0.3
0.4
0.5
0.6
0.7
0.8
0.9
240 280 320 360 400 4400.00
0.25
0.50
0.75
1.00
1.25
1.50
Ab
sorb
ance
[a.
u.]
Wavelenght [nm]
0.0
0.1
0.2
0.3
0.4
0.5
0.6
0.7
0.8
0.9
240 280 320 360 400 4400.00
0.25
0.50
0.75
1.00
1.25
1.50
Ab
sorb
ance
[a.
u.]
Wavelength [nm]
0.0
0.1
0.2
0.3
0.4
0.5
0.6
0.7
0.8
0.9
Figure 6-8. Exemplarily the UV-spectrum of the second titration experiment with a higher
concentration for Job plots of peptide P1 (top), P2 (middle) and P3 (bottom) are shown
respectively.

6 – EXPERIMENTAL SECTION 153
In figure 6-8 the Job plots of the RG-receptor 56 and the 3 respective peptides are
shown. The individual curves represent the single measurements at the specific molar
fraction given in the legend beside the plot. The data of the maxima at 306 nm were
used to calculate the differential absorbance ΔA. The observed absorption of the last
step (fig. 6-7) was calculated from previous measurements of the pure peptide
solutions. To obtain the Job plots shown in chapter 4.3.6 the differential absorbance
ΔA was plotted against the molar fraction of the substrate. The results of higher and
lower concentrated sample solution were equivalent.
6.9 AFM Images of the Synthesized RGD-Receptors
Generally the preparation of samples was carried out via the spin coating method.
Through the spinning process a complete removal of solvent could be guaranteed.
Tentatively samples were prepared via drop casting method. But unfortunately they
suffered from an incomplete drying of the DMSO solvent. Although the samples
were dried carefully under reduced pressure for several days no complete removal of
solvent could be obtained. As a consequence no structures or aggregate could be
imaged except some droplets of DMSO.
As the best method a spin coating process with a rotation speed of 60 rps could
be developed. The duration of one minute of spin coating could be investigated to
be sufficient enough for a complete remove of the solvent. The preparation of the
solutions was carried from aqueous suspensions initially. With hydrochloric acid and
triethylamine the suspensions were adjusted to the acidic (pH 3), neutral (pH 6) and
alkaline (pH 11) conditions. After removal of the water via lyophilization the residue
was dissolved in DMSO. The DMSO was filtered over a nylon filter with a pore-size of
200 nm to avoid contamination with foreign particles. The same was done with the
water before suspensions were prepared.
The samples were measured directly after their preparation. The following AFM
images (fig. 6-9) show further results of the previous shown pictures (fig 4-41).
Beside the described structures some smaller aggregates could be found. In an
experiment to check the purity of the DMSO solvent and DMSO solutions of
triethylamine the same small aggregates could be found too. Even in highly diluted
DMSO solutions of triethylamine these small aggregates could be found.

154 6 – EXPERIMENTAL SECTION
Figure 6-9. Tapping phase pictures show alkaline DMSO solution of receptor 46 on the left side
and DMSO solution of pure NEt3 on the right side.
Figure 6-10 shows AFM pictures of a highly diluted DMSO solution of
triethylamine. These particles were supposed to result from triethylamine salts that
were already in the purchased bottle. At a pH of 6.0 those round shaped and noted
particles could be obtained in a rather narrow size distribution (fig. 6-11).
Figure 6-10. Surface covered by small particles obtained from a highly diluted triethylamine
solution in DMSO. On the left side height images and on the right side pictures of the tapping
phase are represented.
These particles were distributed rather equally over the surface. In some cases
bigger conglomerates could be found too. They were assumed to originate from
many of these small particles that dominated. Under acidic conditions rarely small
agglomerates appeared. Generally these network structures (fig. 4-39) appeared.
Only in border regions smaller particles appeared more randomly. The AFM images
of height and tapping phase are shown in figure 6-12.
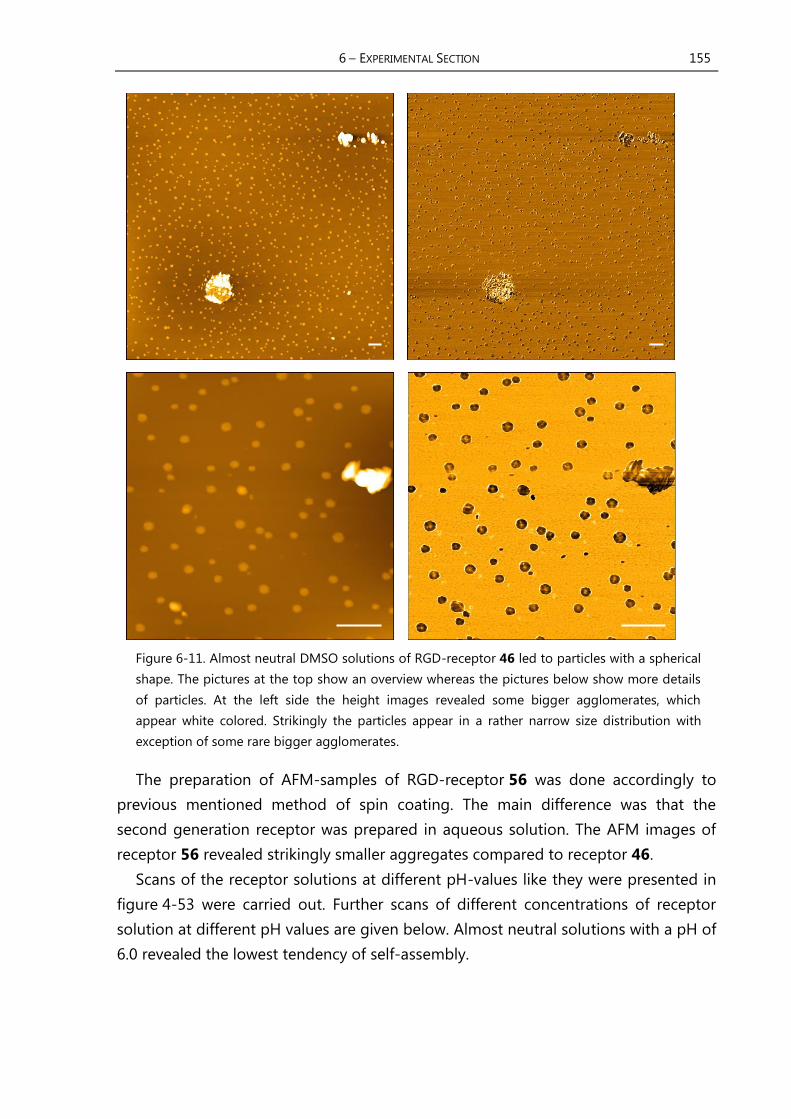
6 – EXPERIMENTAL SECTION 155
Figure 6-11. Almost neutral DMSO solutions of RGD-receptor 46 led to particles with a spherical
shape. The pictures at the top show an overview whereas the pictures below show more details
of particles. At the left side the height images revealed some bigger agglomerates, which
appear white colored. Strikingly the particles appear in a rather narrow size distribution with
exception of some rare bigger agglomerates.
The preparation of AFM-samples of RGD-receptor 56 was done accordingly to
previous mentioned method of spin coating. The main difference was that the
second generation receptor was prepared in aqueous solution. The AFM images of
receptor 56 revealed strikingly smaller aggregates compared to receptor 46.
Scans of the receptor solutions at different pH-values like they were presented in
figure 4-53 were carried out. Further scans of different concentrations of receptor
solution at different pH values are given below. Almost neutral solutions with a pH of
6.0 revealed the lowest tendency of self-assembly.

156 6 – EXPERIMENTAL SECTION
Figure 6-12. Height image at left side and corresponding tapping phase of receptor 46 under
acidic conditions. The white scale bar measures 1 µm.
In figure 6-13 almost neutral conditions are shown. The pictures show an
overcrowded surface if concentration is too high. The tapping phase image at the left
side shows a sample with a concentration of 821 µM. If the concentration is
decreased ten times lower some very tiny spots appeared only. The image at the
right side shows the tapping phase of a nearly unpopulated mica surface.
…
Figure 6-13. Overview scans revealed that receptor 56 did not tend to form aggregates under
slightly acidic conditions (pH 6). Tapping phase images of concentrated solution (821 µM) on
the left side and diluted solution (82.1 µM) at the right side are displayed. The white scale bar
measures 1 µm.
Acidic conditions were obtained via addition of hydrochloric acid until a pH of 3.0
was reached. Alkaline conditions were obtained via addition of triethylamine until a
pH value of 11.0 was obtained. In figure 6-14 concentrated and diluted solutions are

6 – EXPERIMENTAL SECTION 157
shown. In both pictures bigger agglomerates could be found. At lower
concentrations they became more scattered over the mica surface as it is shown
below.
Figure 6-14. Detailed scan at pH 3 exhibited a clear aggregation behavior of receptor 56. Both
pictures show scans of the tapping phase at a concentration of 821 µM at the left and 82.1 µM
at the right side. The white scale bar measures 1 µm.
Even at alkaline conditions (ph 11) the tendency to form smaller aggregates
increased as it is shown in figure 6-15. Here the tapping phase of receptor 56 at a
concentration of 82.1 µM is shown. Compared to the aggregates of the receptor
under neutral conditions this picture reveals bigger agglomerates.
Figure 6-15. Tapping phase of receptor 56 at pH 11 with a concentration of 82.1 µM. The white
scale bar measures 1 µm.

158 6 – EXPERIMENTAL SECTION
In summary these AFM study showed impressively that the second generation
receptor does not suffer from an enhanced self-assembly as the first generation
receptor 46 is did.

APPENDIX
7.1 Zusammenfassung und Ausblick
Die Zielsetzung dieser Arbeit war die Entwicklung eines wasserlöslichen Rezeptors
zur Erkennung von niedermolekularen Peptiden, welche die RGD-Sequenz als
Erkennungseinheit tragen. Im Focus standen die Synthese eines Rezeptors bestehend
aus einem doppelten Bindungsmotiv sowie die Bestimmung seiner Bindungsaffinität
gegenüber RGD-Peptiden. Beiden Bindungsmotive sollten in einer komplementären
Art und Weise gestaltet sein. Dadurch sollte die simultane Erkennung der negativ
geladenen Seitenkette der Asparaginsäure sowie die positiv geladene funktionelle
Guanidiniumgruppe, die Teil der Aminosäure Arginin ist, ermöglicht werden.
Abbildung 7-1. Struktur des bizyklischen Diens 10 und des RGD-Rezeptors 46.
In einem ersten Ansatz wurde der RGD-Rezeptor 46 der ersten Generation in einer
22 stufige Synthese dargestellt (Abbildung 7-1). Teilweise konnte die Synthese über
konvergente Reaktionen wie beispielsweise die Darstellung des Tweezers oder des
Triazols durchgeführt werden. Weiterhin konnten Verbesserungen in der
Tweezersynthese etabliert werden. Besonders zu erwähnen ist die effizientere
Herstellung des Diens 10. So konnte die Ausbeute in der ersten Synthesestufe durch
den Tausch des Polymerisations-Inhibitors deutlich gesteigert werden.
7
10 46

160 7 – APPENDIX
In Kombination mit einer Syntheseverkürzung von 6 auf 4 Stufen konnte die
Ausbeute von 15 % auf nahezu 40 % erhöht werden (Abbildung 7-1). Weiterhin
konnte ein einfacher Zugang zu unsymmetrischen Tweezern innerhalb dieser Arbeit
entwickelt werden. Während der Synthese des ersten RGD-Rezeptors 46 konnte ein
Weg zum Mono-Alkin Tweezer 31 (Abbildung 7-2) gefunden werden.
Abbildung 7-2. Beide abgebildeten Mono-Alkine konnten mit Hilfe einer Williamson Ether
Synthese bzw. einer analogen Williamson Ether Synthese hergestellt werden.
Wie sich herausgestellt hatte, war die Wasserlöslichkeit des RGD-Rezeptors der
ersten Generation für weitere Bindungsstudien mit RGD-Peptiden ungenügend
(Abbildung 7-1). Selbst die Charakterisierung des Rezeptor-Vorgängers 45 und des
Rezeptors 46 zeigte einige Probleme, die im Zusammenhang mit der schlechten
Löslichkeit im Allgemeinen zu sehen sind. Unter sauren, leicht sauren wie auch
basischen Bedingungen zeigte sich, dass Aggregate gebildet wurden. Diese konnten
mittels AFM veranschaulicht werden. Mit Hilfe von DLS-Messungen konnte die Größe
der gebildeten Aggregate unter nahezu neutralen Bedingungen bestätigt werden.
In einem zweiten Ansatz wurde über eine weitere Phosphatgruppe in
Zusammenhang mit einer Größenreduzierung des aromatischen Grundgerüstes des
Tweezer-Moleküls nachgedacht. Für die Realisierung eines komplett wasserlöslichen
RGD-Rezeptors musste eine Synthese von unsymmetrischen Tweezern wie auch
deren kleineren Homologen entwickelt werden. Die Einführung einer zweiten
Phosphatgruppe ergab den wasserlöslichen Diphosphat-Tweezer 50 und die
Bindungsstelle (51) für die Guanidiniumfunktion. Dabei konnte die Synthese des
verkürzten Tweezers 51 sogar als Eintopf-Reaktion ausgehend vom Diol 19b
(Abbildung 7-3) durchgeführt werden. Im letzten Syntheseschritt wurde der RGD-
Rezeptor 56 durch eine kupfer-katalysierte Cycloadditions-Reaktion zusammen-
gefügt. Dieser letzte Reaktionsschritt ermöglichte eine elegante Verknüpfung beider
Bindungsmotive in Verbindung mit einer konvergenten Synthesestrategie. Der
niedermolekulare RGD-Rezeptor 56 wurde in einer Gesamtausbeute von 3 % in
Bezug auf Molekül 51 synthetisiert.
Im Allgemeinen wurden die Synthesen der Grundbausteine nach den
protokollierten Standardsynthesen durchgeführt. Dabei konnten einige
31 50

7 – APPENDIX 161
Verbesserungen mit Hinblick auf Ausbeute und Effizienz gemacht werden. Besonders
die Synthese des Tweezerbausteines konnte um 2 Reaktionsschritte verkürzt werden.
Bei der Synthese des Pyrrolbausteines 32 zeigten sich Stabilitätsprobleme. Eine
schnelle Zersetzung des Pyrrols 37 bei der Entschützung der Guanidin-Funktion
konnten durch die spätere Einführung des Azides am ungeschützten Pyrrol 43
umgangen werden.
Abbildung 7-3. Die konvergente Synthese zwischen dem Diphosphat Mono-Alkin 51 und dem
Pyrrolazid 32 wurde mit Hilfe einer 1,3-dipolaren Cycloaddition durchgeführt.
Eine Charakterisierung beider hergestellten RGD-Rezeptoren stellte sich als
schwierig heraus. Aufgrund intermolekularer Wechselwirkungen durch Selbstassem-
blierungsprozesse wurden beispielsweise NMR-Spektren beeinflusst. Je mehr
funktionelle entschützt vorlagen, desto deutlicher war eine Peakverbreiterung in den
Spektren zu sehen.
Die UV-Bindungsstudien des RGD-Rezeptor 56 konnten ohne weitere
Löslichkeitsprobleme unter leicht sauren Bedingungen durchgeführt werden. Die
Ermittlung der Komplexstöchiometrie mittels der Methode nach Job lieferte nicht
besonders signifikante Ergebnisse. Daher wurden 1:1 Stöchiometrien für die Wirt-
Gast-Systeme angenommen. Dieser neue Rezeptor zeigte eindrucksvoll eine
spezifische Erkennungsaffinität gegenüber dem linearen RGD-Peptid und zwischen
den zyklischen RGD-Peptiden, die von Kessler et al. entwickelt wurden. Das konnte
durch einen Anstieg der Bindungskonstante vom zyklischen Penta-Peptid P2 über
das zyklische Hexa-Peptid P3 bis hin zum linearen RGD-Peptid P1 gezeigt werden.
Die größte Bindungskonstante wurde mit dem Peptid P1 erzielt, mit dem unter
Annahme eines 1:1 Komplexes eine Konstante von KA = 3.4*104 M-1 gefunden
werden konnte. Im Vergleich zum ersten synthetischen RGD-Rezeptor konnte die
Bindungskonstante mit einem linearen RGD-Peptid um zwei Größenordnungen
verbessert werden. Dieser erste Rezeptor war der von Schrader et al. entwickelte
Triphosphonat-Rezeptor (Abbildung 2-5). Er verdeutlichte den gleichen Trend
32 51
56

162 7 – APPENDIX
stärkere Komplexe mit einem flexibleren und linearen RGD-Peptid (KA = 1300 M-1) im
Vergleich zum zyklischen Peptid cyclo(RGDfV) (KA = 700 M-1) zu bilden.43
Der zuletzt genannte Rezeptor wies einen geringen Affinitätsunterschied zwischen
dem zyklischem und dem freiem RGD-Peptid auf. Nur eine halbe Größenordnung an
Selektivitätsunterschied wurden damit berichtet. Dagegen zeigte der in dieser Arbeit
neue entwickelte wasserlösliche RGD-Rezeptor 56 von Natur aus eine höhere
Selektivität zwischen dem Penta-Peptid (KA = 4,300 M-1) und dem linearen RGD
(KA = 34,000 M-1).
Ein besonders großer Vorteil des neu entwickelten Rezeptors ist seine Flexibilität
durch die variable Länge des Linker-Moleküls. Basierend auf dem Konzept von
separierten Bindungsstellen, die über ein Linker-Molekül verknüpft sind, und einer
konvergenten Synthese können schnell neuen RGD-Rezeptoren entwickelt werden.
Diese Methode kann effizient zur Entwicklung verschiedener RGD-Rezeptoren mit
unterschiedlichen Selektivitäts- und Bindungseigenschaften gegenüber
verschiedenen RGD-Peptiden verwendet werden. Trotz der zuvor angestrebten
Zielsetzung, einen RGD-Rezeptor mit einem kompletten Tweezer als Guanidium-
Bindungsstelle zu entwickeln, konnte eindrucksvoll gezeigt werden, dass eine
verkürzte Version des Tweezers eine einfachere Synthese bedeutet. Besonders die
Löslichkeitsproblematik konnte damit umgangen werden. Letztlich können die
Ergebnisse dieser Arbeit dazu beitragen maßgeschneiderte RGD-Rezeptoren durch
die Verwendung von raumfüllenden Resten am Linker-Molekül zu kreieren. Durch die
Verkleinerung des Tweezer-Moleküls und dem damit verbundenen Verlust des
hydrophoben aromatischen Grundgerüstes können weitere Reste ohne größeren
Einfluss auf die Löslichkeit eingeführt werden. Die Einführung von beispielsweise
kleineren Resten wie Methyl oder Ethyl-Seitenketten kann einen Einfluss auf die
Selektivität zwischen unterschiedlichen RGD-Peptiden haben.
Für eine weitere Forschung können erfolgreiche Ergebnisse erwartet werden.
Besonders wenn eine Einstellung der Selektivität möglich ist, könnten Tests
gegenüber größeren Proteinen wie Vitronectin oder Fibronectin durchgeführt
werden. Dieser Ansatz ermöglicht dann einmal die Anwendung in Arzneimitteln oder
deren Bewertung, wenn diese RGD-basiert sind.

7 – APPENDIX 163
7.2 Purity Control via NMR
1H NMR of the syn-dione 19a
Figure 7-4. The syn/anti ratio after Diels-Alder-reaction to molecule 19a is shown in the proton
NMR spectra above. Here the selective crystallization was used for purification. From the first
NMR spectrum (1) to the last one (5) the progress of purification is shown by an increased
syn/anti ratio. After 5 crystallization steps a ratio of 46:1 of syn- (19a) to anti-dione (18) could
be obtained.
1 2
3 4
5

164 7 – APPENDIX
Figure 7-5. Full 1H NMR of the purified syn-dione 19a. The purification process was controlled
via 1H NMR shown in figure 7-4. The syn to anti ratio in this case is almost 1 to 38. The
calculation occurred via the ratio of the integrals of the signals at 6.04 (anti-dione 18) and 5.79
(syn-dione 19a).
1H and 13C NMR of the mono-alkyne tweezer 31
Figure 7-6. 1H NMR of the un-symmetrical mono-alkyne tweezer 31.

7 – APPENDIX 165
Figure 7-7. Double signal set in the 13C NMR of the un-symmetrical mono-alkyne tweezer 31.
1H NMR spectra of the azido pyrroles 32 and 37
Figure 7-8. 1H NMR of the purified azido pyrrole 32.

166 7 – APPENDIX
Figure 7-9. 1H NMR of the purified azido pyrrole 37.
Figure 7-10. 1H NMR of the purified diphosphate mono-alkyne tweezer 50.

7 – APPENDIX 167
Figure 7-11. 1H NMR of the purified truncated diphosphate mono-alkyne tweezer 51.
31P NMR of receptor 56 in DMF and DMSO
Figure 7-12. In fully deuterated DMF (left side) as well as in DMSO (right side) the 31P-NMR
spectra of 56 revealed some broadening. It is assumed that the different signals belong to
different species formed by aggregation.

168 7 – APPENDIX
1H NMR of the RGD-receptor 56
Figure 7-13. The 1H-NMR spectra of molecule 56 showed some huge signal at a chemical shift
reaching from 5.70 ppm to 7.70 ppm. The maximum at 6.65 ppm is centered so that the signal
appeared rather symmetrical. Due to the missing water signal this signal seems to be the
residual water signal in interaction with the negatively charged phosphate groups. All other
molecule signals appeared in a moderate resolution. The reason might be some intermolecular
interactions of 2 or more receptor molecules.

7 – APPENDIX 169
Figure 7-14. Full 1H-NMR spectra of the penta-peptide P2 in DMSO-d6.

170 7 – APPENDIX
Figure 7-15. Full 1H-NMR spectra of the hexa-peptide P3 in DMSO-d6.

7 – APPENDIX 171
7.3 2D NMR Spectra
Two dimensional NMR soectra were recorded with a DRX500 and an Advance III
HD 600 from Bruker for assignment purposes.
Figure 7-16. Selective NOESY-spectra of guanidiniocarbonyl pyrrole 32 showed the coupling
interactions of the aniline proton with the pyrrole NH and the pyrrole CH proton.
Figure 7-17. HSQC-spectra of the guanidiniocarbonyl pyrrole 32.

172 7 – APPENDIX
Figure 7-18. HMBC-spectra of the guanidiniocarbonyl pyrrole 32.
Figure 7-19. Selective NOESY-spectra of the dihydroxy mono-alkyne tweezer 31.

7 – APPENDIX 173
Figure 7-20. HSQC-spectra of the dihydroxy mono-alkyne tweezer 31.
Figure 7-21. HMBC of the RGD-receptor precursor 44.

174 7 – APPENDIX
7.4 Purity Control via HPLC
The purity of the obtained building blocks was checked with HPLC too. The purity
checks were done under either normal phase or reversed phase conditions.
Figure 7-22. HPLC runs of the azido pyrrole 37 were carried out with analytical column (reversed
phase) of YMC. Chromatograms at the top and bottom show freshly prepared and aged (after
10 days) sample respectively. Gradient runs started from methanol/water 80/20 to 100/0 within
12.5 min. Freshly prepared sample revealed a purity of 93 % whereas aged one contained only
10 % of pyrrole 37.
The purity check of the RGD-receptor precursor 44 (fig. 7-18) was carried out via
HPLC under normal phase conditions. The detection occurred at 4 different wave
lengths, 220 nm, 258 nm, 285 nm and 327 nm. At the absorption maximum of the
tweezer at 285 nm a purity of 99 % could be found. At 220 nm some impurities were
found with an overall purity of more than 92 %. In figure 7-20 the individual
chromatograms are shown.

7 – APPENDIX 175
Figure 7-23. The HPLC runs under normal phase conditions revealed a purity of precursor 44 up
to 99 % at 258 nm (2), 285 nm (3) and 327 nm (4). At 220 nm (1) a purity of around 94 % could
be detected.
The mono alkyne tweezer diphosphate 50 (B) was purified with a multicomponent
system consisting of the Merck Septech pump. In figure 7-24 the preparative run (left
side) and the purity check (right side) done with the Dionex system are shown.
Figure 7-24. The preparative HPLC run (left) reveals a ratio of 3:5:2 of starting material (A), mono
alkyne tweezer 50 (B) and bis alkyne tweezer 52 (C). The HPLC purity control (right side) of the
mono alkyne tweezer 50 revealed a purity of more than 94 % at 235 nm.
1 2
3 4
A B
C
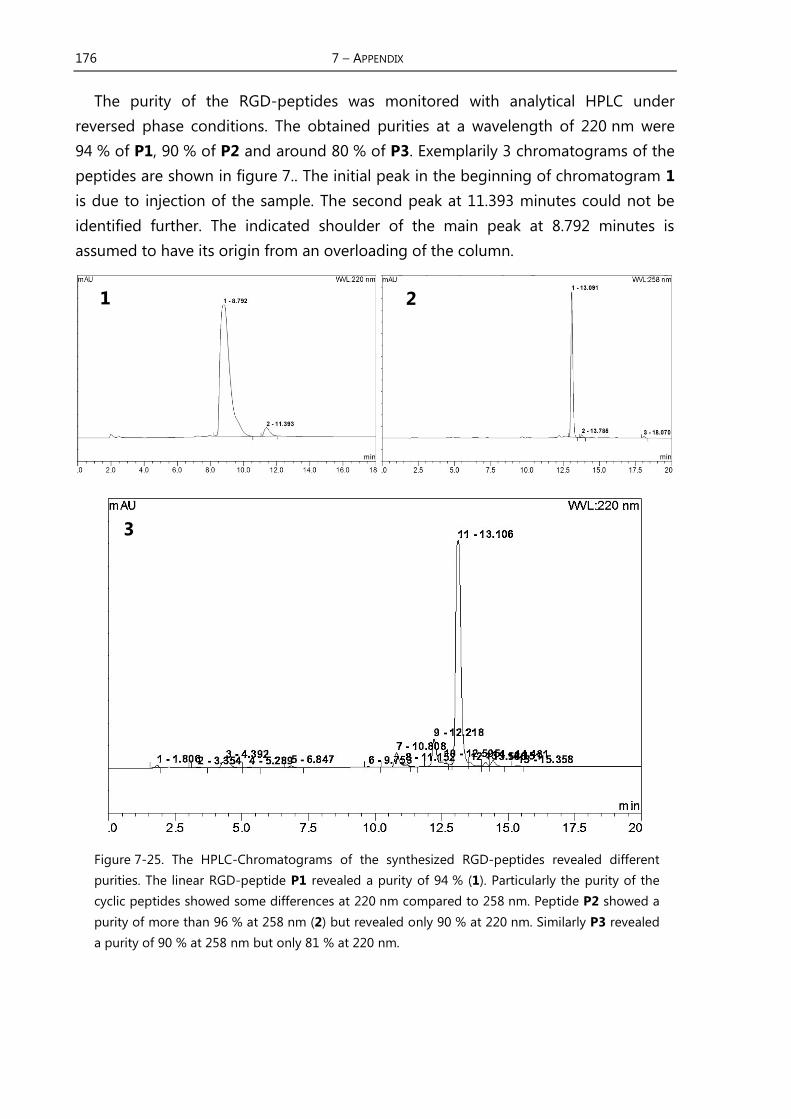
176 7 – APPENDIX
The purity of the RGD-peptides was monitored with analytical HPLC under
reversed phase conditions. The obtained purities at a wavelength of 220 nm were
94 % of P1, 90 % of P2 and around 80 % of P3. Exemplarily 3 chromatograms of the
peptides are shown in figure 7.. The initial peak in the beginning of chromatogram 1
is due to injection of the sample. The second peak at 11.393 minutes could not be
identified further. The indicated shoulder of the main peak at 8.792 minutes is
assumed to have its origin from an overloading of the column.
Figure 7-25. The HPLC-Chromatograms of the synthesized RGD-peptides revealed different
purities. The linear RGD-peptide P1 revealed a purity of 94 % (1). Particularly the purity of the
cyclic peptides showed some differences at 220 nm compared to 258 nm. Peptide P2 showed a
purity of more than 96 % at 258 nm (2) but revealed only 90 % at 220 nm. Similarly P3 revealed
a purity of 90 % at 258 nm but only 81 % at 220 nm.
1 2
3

7 – APPENDIX 177
7.5 Table of Abbreviations
α alpha
AA amino acid
abs. absoluted
Ac acetyl
AFM atomic force microscopy
AMIDAS adjacent to MIDAS
approx. approximately
Ar aryl
Arg arginine
arom. aromatic
Asp aspartic acid
β beta
bFGF basic fibroblast growth
factor
br broad
bs broad singlet
CAM cell adhesion molecule
C2O2Cl2 oxalyle chloride
ca. circa
calc. calculated
cat. catalytical
Cbz benzyloxycarbonyl
Cbz-OSu Nα-(benzyloxycarbonyl-
oxy) succinimide
CDCl3 deuterated chloroform
CF cyanuric fluoride
conc. concentrated
Cl-HOBt 6-chloro-1-hydroxy-
benzotriazole dihydrate
d day/days
duplet
(ref. to NMR)
DCM dichloromethane
dd duplet of duplet
DDQ 2,3-dichloro-5,6-dicyano-
benzoquinone
δ delta
°C degree Celsius
DIC N,N′-diisopropylcarbo-
diimide
DIPEA N,N-diisopropylethyl-
amine
DMAP N,N-dimethylpyridin-4-
amine
DMF dimethyl formamide
DMSO dimethyl sulfoxide
DMSO-d6 fully deuterated DMSO
ECM extracellular matrix
e.g. exempli gratia
EM electron microscopy
ESI electrospray ionization
eq equivalents
f D-phenylalanine
F phenylalanine (L-
conformation)
Fmoc 9H-fluoren-9-yl-
methoxycarbonyl
Fmoc-Cl 9H-fluoren-9-yl-methoxy-
carbonyl chloride
FT fourier transformation
g gram
Gly glycine
gua guanine
h hour
HATU (2-(7-Aza-1H-benzo-
triazole-1-yl)-1,1,3,3-
tetramethyluronium
hexafluorophosphate)

178 7 – APPENDIX
HCTU (2-(6-Chloro-1H-
benzotriazole-1-yl)-
1,1,3,3-tetramethyl-
aminium hexafluoro-
phosphate)
HPLC High performance liquid
chromatography
HRMS high resolution mass
spectroscopy
HSQC Heteronuclear Single
Quantum Coherence
Hz hertz
i iso
Im imidazole
IR infra-red
J coupling constant
Ka binding constant
l liter
Leu leucine
m medium (ref. to IR)
multiplet (ref. to NMR)
M mega
m/z mass per charge
M-1 1 per mol
MAG myelin-associated
glycoproteins
max maximum
mbar millibar
MBHA 4-methylbenzhydrylamine
mg milligram
MHz megahertz
MIDAS metal ion-dependent
adhesion site
min minute
ml milliliter
mm millimeter
mmol millimol
MPLC medium performance
liquid chromatography
MS mass spectroscopy
µg microgram
µl microliter
µm micrometer
n normal
N normality
NaHCO3 sodium bicarbonate
NaOH sodium hydroxide
N-CAM neural adhesion
molecules
NEt(iPr)2 N,N-
diisopropylethylamine
NEt3 triethylamin
nm nanometer
NMM 4-methylmorpholine
nmol nanomol
NMR nuclear magnetic
resonance
OtBu tert-butyl ester
Pbf 2,2,4,6,7-pentamethyl-
2,3-dihydrobenzofuran-5-
ylsulfonyl
pH negative decade loga-
rithm of oxonium cations
Ph phenyl
Phe phenylalanine
ppm parts per million
py pyrrole
PyBOP 1-benzotriazolyloxytri-
pyrrolidino-phosphonium
hexafluorophosphate
pyr pyridine
q quaternary (context of
labeling carbon atoms)
quartet (ref. to NMR)
Rf retention factor

7 – APPENDIX 179
RP-18 reversed phase octadecyl-
SiO2 (octadecyl silica gel)
rps rounds per second
rt room temperature
s singlet (ref. to NMR)
strong (ref. to IR)
SAXS small angle X-ray
scattering
SiO2 silica gel
SO2Cl2 sulfuric dichloride
SOCl2 thionyl chloride
T temperature
t triplet
t, tert tertiary
TBDMS tert-butyldimethylsilane
TBDMS-Cl tert-butyldimethyl-
chlorosilane
TBPP Tetrabenzylpyrophos-
phate
TEA triethyl amine
TFA trifluoro acetic acid
TFE 2,2,2-trifuoroethane
TFFH tetramethylfluoro-form-
amidinium hexafluoro-
phosphate
TIS triisopropylsilane
TLC thin layer chromate-
graphy
TNF-α tumor necrosis factor α T3P propylphosphonic an-
hydride
UV ultra violet
V valine
VEGF-A vascular endothelial
growth factor
vs very strong
~ wave number
W watt
w weak


BIBLIOGRAPHY
(1) Greene, H. S. N. J. Exp. Med. 1941,
73 (4), 475–486. (2) Glenn H. Algire, Harold W.
Chalkley, Wilton R. Earle, Frances Y.
Legallais, Helen D. Park, Emma
Shelton, Edward L. Schilling. JNCI J. Natl. Cancer Inst. 1950, 11 (3), 555–579.
(3) Folkman, J. J. Exp. Med. 1971, 133
(2), 275–288.
(4) Plank, M. J.; Sleeman, B. D. J. Theor. Med. 2003, 5 (3-4), 137–153.
(5) Rak, J.; Yu, J. L.; Klement, G.; Kerbel,
R. S. J. Investig. Dermatol. Symp. Proc. 2000, 5 (1), 24–33.
(6) Clemetson, K. J. Cell. Mol. Life Sci. CMLS 1998, 54 (6), 499–501.
(7) Wang, F.; Li, Y.; Shen, Y.; Wang, A.;
Wang, S.; Xie, T. Int. J. Mol. Sci. 2013, 14 (7), 13447–13462.
(8) Pierschbacher, M. D.; Ruoslahti, E.
Nat. Lond. U. K. 1984, 309 (Copyright (C) 2015 American
Chemical Society (ACS). All Rights
Reserved.), 30–33.
(9) Folkman, J. Ann. Surg. 1972, 175 (3), 409–416.
(10) Tumor angiogenesis: basic mechanisms and cancer therapy;
Marmé, D., Fusenig, N. E., Eds.;
Springer: New York, 2008. (11) Springer International Publishing.
Drugs R. D. 2002, 3 (1), 28–30.
(12) Angiogenese-Hemmer AVASTIN(R)
erhält EU-Zulassung - Neues
Wirkprinzip gegen Darmkrebs http://www.presseportal.de/pm/74
31/637275/angiogenese-hemmer-
avastin-r-erh-lt-eu-zulassung-
neues-wirkprinzip-gegen-
darmkrebs (accessed Jan 23, 2015). (13) Lehn, J. Science 1993, 260 (5115),
1762–1763.
(14) Crespo, J.; Sun, H.; Welling, T. H.;
Tian, Z.; Zou, W. Curr. Opin. Immunol. 2013, 25 (2), 214–221.
(15) Delgoffe, G. M.; Powell, J. D. Mol. Immunol. 2015.
(16) Hulpiau, P.; van Roy, F. Int. J. Biochem. Cell Biol. 2009, 41 (2),
349–369. (17) Williams, A. F. Immunol. Today
1987, 8 (10), 298–303.
(18) Tamkun, J. W.; DeSimone, D. W.;
Fonda, D.; Patel, R. S.; Buck, C.; Horwitz, A. F.; Hynes, R. O. Cell 1986, 46 (2), 271–282.
8

182 8 – BIBLIOGRAPHY
(19) Sheldrake, H. M.; Patterson, L. H. J. Med. Chem. 2014, 57 (15), 6301–6315.
(20) Hynes, R. O. Cell 2002, 110 (6),
673–687.
(21) Dong, X.; Mi, L.-Z.; Zhu, J.; Wang,
W.; Hu, P.; Luo, B.-H.; Springer, T. A. Biochemistry (Mosc.) 2012, 51 (44),
8814–8828.
(22) Takada, Y.; Ye, X.; Simon, S.
Genome Biol. 2007, 8 (5), 215.
(23) Vorup-Jensen, T.; Waldron, T. T.; Astrof, N.; Shimaoka, M.; Springer,
T. A. Biochim. Biophys. Acta 2007,
1774 (9), 1148–1155.
(24) Sun, C.-C.; Qu, X.-J.; Gao, Z.-H. Anticancer. Drugs 2014, 25 (10),
1107–1121.
(25) Xiong, J.-P. Science 2002, 296
(5565), 151–155.
(26) Xiong, J.-P. Science 2002, 296 (5565), 151–155.
(27) Research Collaboratory for
Structural Bioinformatics (RCSB)
Protein Data Bank (PDB). Crystal
Structure of the Extracellular Segment of Integrin α(V)β(3) in
Complex with an Arg-Gly-Asp
Ligand
http://www.rcsb.org/pdb/explore/e
xplore.do?structureId=1L5G (accessed Feb 13, 2015).
(28) Zhang, K.; Chen, J. Cell Adhes. Migr. 2012, 6 (1), 20–29.
(29) Tadokoro, S.; Shattil, S. J.; Eto, K.;
Tai, V.; Liddington, R. C.; de Pereda, J. M.; Ginsberg, M. H.; Calderwood,
D. A. Science 2003, 302 (5642),
103–106.
(30) Ruoslahti, E.; Pierschbacher, M. D. Cell 1986, 44 (4), 517–518.
(31) Scarborough, R. M.; Gretler, D. D. J. Med. Chem. 2000, 43 (19), 3453–3473.
(32) Eliceiri, B. P.; Cheresh, D. A. J. Clin. Invest. 1999, 103 (9), 1227–1230.
(33) Shimaoka, M.; Springer, T. A. Nat. Rev. Drug Discov. 2003, 2 (9), 703–716.
(34) Friedlander, M.; Brooks, P. C.;
Shaffer, R. W.; Kincaid, C. M.;
Varner, J. A.; Cheresh, D. A. Science
1995, 270 (5241), 1500–1502. (35) Weis, S. M.; Cheresh, D. A. Cold
Spring Harb. Perspect. Med. 2011,
1 (1), a006478–a006478.
(36) Haubner, R.; Gratias, R.; Diefenbach, B.; Goodman, S. L.;
Jonczyk, A.; Kessler, H. J. Am. Chem. Soc. 1996, 118 (32), 7461–7472.
(37) Tejpar, S.; Prenen, H.; Mazzone, M. The Oncologist 2012, 17 (8), 1039–1050.
(38) Chau, C. H.; Figg, W. D. Cancer Biol. Ther. 2012, 13 (8), 586–587.
(39) Dahmen, C.; Auernheimer, J.; Meyer, A.; Enderle, A.; Goodman, S.
L.; Kessler, H. Angew. Chem. Int. Ed. 2004, 43 (48), 6649–6652.
(40) Haubner, R.; Kessler, I. H. Angew. Chem. 1997, 109 (13-14), 1440–1456.
(41) Zanardi, F.; Burreddu, P.; Rassu, G.;
Auzzas, L.; Battistini, L.; Curti, C.;
Sartori, A.; Nicastro, G.; Menchi, G.;
Cini, N.; Bottonocetti, A.; Raspanti, S.; Casiraghi, G. J. Med. Chem. 2008, 51 (6), 1771–1782.
(42) Casiraghi, G.; Burreddu, P.;
Manzoni, L. P.; Scolastico, C.; Zanardi, F.; Battistini, L.; Curti, C.;
Rassu, G.; Auzzas, L. Integrin

8 – BIBLIOGRAPHY 183
Targeted Cyclopeptide Ligands,
Their Preparation and Use. (43) Rensing, S.; Schrader, T. Org. Lett.
2002, 4 (13), 2161–2164.
(44) Schmuck, C.; Rupprecht, D.;
Junkers, M.; Schrader, T. Chem. - Eur. J. 2007, 13 (24), 6864–6873.
(45) Rupprecht, D. Synthese und
Optimierung sequenzselektiver
künstlicher Rezeptoren für
biologisch relevante Oligopeptide,
2006. (46) Fokkens, M.; Schrader, T.; Klärner,
F.-G. J. Am. Chem. Soc. 2005, 127
(41), 14415–14421.
(47) Gersthagen, T.; Hofmann, J.; Klärner, F.-G.; Schmuck, C.;
Schrader, T. Eur. J. Org. Chem. 2013, 2013 (6), 1080–1092.
(48) Maehle, A.-H.; Prüll, C.-R.; Halliwell,
R. F. Nat. Rev. Drug Discov. 2002, 1 (8), 637–641.
(49) Jean-Marie Lehn - Nobel Lecture:
Supramolecular Chemistry - Scope
and Perspectives: Molecules -
Supermolecules - Molecular Devices . Nobelprize.org. Nobel
Media AB 2014. Web. 11 May 2015.
<http://www.nobelprize.org/nobel_
prizes/chemistry/laureates/1987/le
hn-lecture.html>. (50) Ma, X.; Zhao, Y. Chem. Rev. 2014,
150317111641003.
(51) Molecular recognition: receptors for molecular guests, 1. ed.; Vögtle,
F., Lehn, J.-M., Atwood, J. L., Eds.; Comprehensive supramolecular
chemistry; Pergamon: Oxford,
1996.
(52) Yu, G.; Jie, K.; Huang, F. Chem. Rev. 2015, 115 (15), 7240–7303.
(53) Lehn, J.-M. Angew. Chem. Int. Ed. Engl. 1988, 27 (1), 89–112.
(54) Schmuck, C. Eur. J. Org. Chem. 1999, 1999 (9), 2397–2403.
(55) Biedermann, F.; Nau, W. M.;
Schneider, H.-J. Angew. Chem. Int. Ed. 2014, 53 (42), 11158–11171.
(56) Klemm, K. Entwicklung neuer poly-kationischer Rezeptoren zur molekularen Erkennung von DNA und RNA; Universität Duisburg-
Essen, 2011.
(57) Klärner, F.-G.; Schrader, T. Acc. Chem. Res. 2013, 46 (4), 967–978.
(58) Hirose, K. J Incl. Phenom Macrocycl. Chem 2001, 39, 193–209.
(59) Thordarson, P. Chem Soc Rev 2011, 40 (3), 1305–1323.
(60) Geibel, B. Biomimetische peptidische Rezeptoren zur Erkennung biologisch relevanter Moleküle -Design, Synthese und Potential-; Universität Duisburg-
Essen, 2013.
(61) Pollard, T. D. Mol. Biol. Cell 2010,
21 (23), 4061–4067.
(62) Hill, Z. D.; MacCarthy, P. J. Chem. Educ. 1986, 63 (2), 162.
(63) MacCarthy, P. Anal. Chem. 1978,
50 (14), 2165–2165.
(64) Lallana, E.; Riguera, R.; Fernandez-
Megia, E. Angew. Chem. Int. Ed. 2011, 50 (38), 8794–8804.
(65) Maestro Version 10.1.013 Release 2015-1.
(66) Brückner, R.
Reaktionsmechanismen: organische Reaktionen, Stereochemie, moderne Synthesemethoden, 2., aktualisierte
und erw. Aufl.; Spektrum Lehrbuch; Spektrum Akad. Verl: Heidelberg,
2003.

184 8 – BIBLIOGRAPHY
(67) Harfmann, R. G.; Crouch, S. R.
Talanta 1989, 36 (1-2), 261–269. (68) Sunde, C. J.; Erickson, J. G.; Raunio,
E. K. J. Org. Chem. 1948, 13 (5),
742–748.
(69) TOMOHIRO, S.; AKIRA, M.; SHOJI,
K.; NAOHIRO, U. Preparation of 5,6-benzonorbornene-2,3-
dicarboxylic acids. JP2008127311.
(70) Beck, K.; Brand, U.; Hünig, S.;
Martin, H.-D.; Mayer, B.; Peters, K.;
von Schnering, H. G. Liebigs Ann. 1996, 1996 (11), 1881–1892.
(71) Atasoy, B.; Bayramoğlu, F.; Hökelek, T. Tetrahedron 1994, 50 (19),
5753–5764. (72) Gersthagen, T. Künstliche
ditopische Rezeptormoleküle zur
Erkennung von RGD-Schleifen,
Duisburg-Essen, 2011.
(73) Klärner, F.-G.; Benkhoff, J.; Boese, R.; Burkert, U.; Kamieth, M.; Naatz,
U. Angew. Chem. Int. Ed. Engl. 1996, 35 (10), 1130–1133.
(74) Schmuck, C.; Rupprecht, D.; Urban,
C.; Walden, N. Synthesis 2006, 2006 (01), 89–96.
(75) Gawande, M. B.; Shelke, S. N.;
Zboril, R.; Varma, R. S. Acc. Chem. Res. 2014, 47 (4), 1338–1348.
(76) Greene, T. W.; Wuts, P. G. M. Protective Groups in Organic Synthesis; John Wiley & Sons, Inc.:
New York, USA, 1999.
(77) Johnson, D. C.; Widlanski, T. S. Org. Lett. 2004, 6 (25), 4643–4646.
(78) Ben-Ishai, D.; Berger, A. J. Org. Chem. 1952, 17 (12), 1564–1570.
(79) Gröger, G.; Meyer-Zaika, W.;
Böttcher, C.; Gröhn, F.; Ruthard, C.; Schmuck, C. J. Am. Chem. Soc. 2011, 133 (23), 8961–8971.
(80) Coste, J.; Le-Nguyen, D.; Castro, B.
Tetrahedron Lett. 1990, 31 (2), 205–208.
(81) Al-Warhi, T. I.; Al-Hazimi, H. M. A.;
El-Faham, A. J. Saudi Chem. Soc. 2012, 16 (2), 97–116.
(82) Sambiagio, C.; Marsden, S. P.; Blacker, A. J.; McGowan, P. C.
Chem. Soc. Rev. 2014, 43 (10),
3525.
(83) Hajipour, A. R.; Mohammadsaleh, F.
Tetrahedron Lett. 2014, 55 (50), 6799–6802.
(84) Späth, A.; König, B. Tetrahedron
2010, 66 (10), 1859–1873.
(85) Goriya, Y.; Ramana, C. V. Tetrahedron 2010, 66 (38), 7642–7650.
(86) Peng, H.; Dornevil, K. H.; Draganov,
A. B.; Chen, W.; Dai, C.; Nelson, W.
H.; Liu, A.; Wang, B. Tetrahedron 2013, 69 (25), 5079–5085.
(87) Gingter, S.; Mondrzik, B.; Ritter, H.
Macromolecules 2012, 45 (4),
1753–1757.
(88) Talbiersky, P.; Bastkowski, F.; Klärner, F.-G.; Schrader, T. J. Am. Chem. Soc. 2008, 130 (30), 9824–9828.
(89) Bier, D.; Rose, R.; Bravo-Rodriguez,
K.; Bartel, M.; Ramirez-Anguita, J. M.; Dutt, S.; Wilch, C.; Klärner, F.-G.;
Sanchez-Garcia, E.; Schrader, T.;
Ottmann, C. Nat. Chem. 2013, 5
(3), 234–239.
(90) Xu, Z. Bioorg. Med. Chem. Lett. 2015, 25 (18), 3777–3783.
(91) Shih, H.-W.; Chen, K.-T.; Cheng, W.-
C. Tetrahedron Lett. 2012, 53 (2),
243–246. (92) Klärner, F.-G.; Kahlert, B.; Nellesen,
A.; Zienau, J.; Ochsenfeld, C.;

8 – BIBLIOGRAPHY 185
Schrader, T. J. Am. Chem. Soc. 2006, 128 (14), 4831–4841.
(93) Bertini, I.; Pierattelli, R. Pure Appl. Chem. 2004, 76 (2).
(94) Bertini, I.; Turano, P.; Vila, A. J.
Chem. Rev. 1993, 93 (8), 2833–2932.
(95) Wienand, W. Ein künstlicher
Rezeptor für das Dipeptid D-
Alanin-D-Alanin : Konzeption,
Synthese und physikalisch-
organische Charakterisierung, Köln, 2002.
(96) Kaiser, E.; Colescott, R. L.;
Bossinger, C. D.; Cook, P. I. Anal. Biochem. 1970, 34 (2), 595–598.
(97) Dai, X.; Su, Z.; Liu, J. O. Tetrahedron Lett. 2000, 41 (33), 6295–6298.
(98) Bickert, V. Neue künstliche Guanidiniocarbonylpyrrol-Rezeptoren zur Komplexierung von Oxo-Anionen in Wasser; 2008.
(99) Vosburgh, W. C.; Cooper, G. R. J. Am. Chem. Soc. 1941, 63 (2), 437–442.
(100) Giessibl, F. J. Rev. Mod. Phys. 2003, 75 (3), 949–983.
(101) Richter, C. Etablierung der
Rasterkraftmikroskopie an
kardiovaskulär relevanten Zellen,
Proteinen und Materialien -Ein methodischer Ansatz-, Charité:
Berlin, 2003.
(102) Guzman, H. V.; Garcia, P. D.;
Garcia, R. Beilstein J. Nanotechnol. 2015, 6, 369–379.
(103) Bielefeldt, H.; Giessibl, F. J. Surf. Sci. 1999, 440 (3), L863–L867.
(104) Tamayo, J.; García, R. Langmuir 1996, 12 (18), 4430–4435.
(105) Smith, D. P. E. Rev. Sci. Instrum. 1995, 66 (5), 3191.
(106) Malvern Instruments Ltd. User Manual Zetasizer Nano Series User Manual; 2004.
(107) Upstone, S. L. In Encyclopedia of Analytical Chemistry; Meyers, R. A.,
Ed.; John Wiley & Sons, Ltd:
Chichester, UK, 2013. (108) Organikum: organisch-
chemisches Grundpraktikum ; mit 220 Tabellen, 20., bearb. und erw.
Aufl., korrigierter Nachdr.; Becker,
H. G. O., Ed.; Wiley-VCH: Weinheim, 1999.
(109) López, A. M.; Scarel, F.; Carrero,
N. R.; Vázquez, E.; Mateo-Alonso,
A.; Ros, T. D.; Prato, M. Org. Lett. 2012, 14 (17), 4450–4453.


"Der Lebenslauf ist in der Online-Version aus Gründen des Datenschutzes nicht
enthalten."