
Rezumat TEZA pt EN generation and transmission of... · 2011-11-16 · KEYWORDS: retina, cells,...
24
UNIVERSITY OF MEDICINE AND PHARMACY OF CRAIOVA FACULTY OF MEDICINE Ph.D. THESIS -ABSTRACT- THE GENERATION AND TRANSMISSION OF INFORMATION IN THE VISUAL ANALYZER - ELECTROPHYSIOLOGICAL EVALUATION, THEORETICAL AND SOFTWARE MODEL Ph.D. COORDINATOR: Prof. Univ. Dr. IANCĂU MARIA Ph.D. STUDENT: ALEXANDRU DRAGOŞ OVIDIU CRAIOVA - 2011 -
Transcript of Rezumat TEZA pt EN generation and transmission of... · 2011-11-16 · KEYWORDS: retina, cells,...

UNIVERSITY OF MEDICINE AND PHARMACY OF CRAIOVA
FACULTY OF MEDICINE
Ph.D. THESIS -ABSTRACT-
THE GENERATION AND TRANSMISSION OF INFORMATION
IN THE VISUAL ANALYZER - ELECTROPHYSIOLOGICAL EVALUATION, THEORETICAL AND SOFTWARE MODEL
Ph.D. COORDINATOR: Prof. Univ. Dr. IANCĂU MARIA
Ph.D. STUDENT: ALEXANDRU DRAGOŞ OVIDIU
CRAIOVA - 2011 -

Investeşte în oameni!
FONDUL SOCIAL EUROPEAN
Programul Operaţional Sectorial Dezvoltarea Resurselor Umane 2007-
2013
Axa Prioritară: 1. Educaţia şi formarea profesională în sprijinul creşterii
economice şi dezvoltării societăţii
Domeniul Major de Intervenţie: 1.5. Programe doctorale şi postdoctorale
în sprijinul cercetării
Titlu proiect: „Sprijinirea tinerilor doctoranzi cu frecvenţă prin
acordarea de burse doctorale”
Cod Proiect: POSDRU/6/1.5/S/8
Beneficiar: Universitatea de Medicină şi Farmacie din Craiova

THESIS TABLE OF CONTENTS
PART I - STATE OF KNOWLEDGE 1.STRUCTURE AND FUNCTIONS ........................................................................................ 1 2. ELECTROPHYSIOLOGIAL EXPLORATIONALE OF THE VISUAL ANALYZER..... 19 3. MATHEMATICAL AND SOFTWARE MODEL OF THE RETINA .............................. 40
PART II - PERSONAL CONTRIBUTIONS
4.AIMS AND OBJECTIVES................................................................................................... 62 5.MATERIAL AND METHODS ........................................................................................... 64 6.RESULTS ............................................................................................................................. 83 7.DISCUSSIONS .................................................................................................................. 141 8.CONCLUSIONS ................................................................................................................ 152 9.REFERENCES ................................................................................................................... 155
KEYWORDS: retina, cells, layers, information, electrophysiology, ERG, VEP,
mathematical model, cellular neural network, software
INTRODUCTION
Although the cellular structure of the retina is known in detail for over 100 years, the
interactions between different cell types and the roles of their subtypes are still far from being
completely characterized. The way they work, the information they generate and the way this
information is processed by the different specialized cortical areas are topics more than ever,
because of improving research methods, due to the development of information technology
and biosignal recording tecniques, as well as genetics.
There are still many aspects regarding the visual analyzer that need further research,
such as the discovery of new functions performed by retinal cells, which led to distinguishing
new subtypes of the already known cell types. In the last five years there have been identified
amacrine cells responsible, in humans, with motion detection or intrinsically photosensitive
ganglion cells, which contain melanopsin. The image generation process has been highly
studied and recent discoveries regarding the image processing that begins in the retina and the
cellular pathways present at this level are arguments that this area is in constant development.
For these reasons I think it is necessary to develop a model of the structure and
functioning of the retina, which should also include recent knowledge. Without claiming that
it can be a "perfect copy", it will be useful to highlight the complexity of the connections and
processing present in the retina and and allow a quick, intuitivea understanding of the
processesing that occurs in the initials phases of vision. To create this model we used
electrophysiological explorations of the visual analyzer, which also are necessary to validate
its behavior.

1
PART I – STATE OF KNOWLEDGE
We discussed the structure and functioning of the visual analyzer, showing the
structure of the eye and the structure and physiology of the retina, for which we described the
photoreceptor cells and the phototransduction, the interconnections of retinal cells and the
generation of the visual data, the information processing retinal circuitry, the optic patways
and the visual cortex.
For the electrophysiological exploration of the visual analyzer, we used the
electroretinogram, mainly the Flash ERG method and visual evoked potentials - VEP, using
pattern reversal stimuli.
Mathematical modeling of retinal cell functioning involved detailing models of
photoreceptors, bipolar and ganglion cells and of signal transmission from photoreceptors
onwards, as well as the spatial distribution of photoreceptors.
Software modeling of the retina structure involved describing of artificial neural
networks and models applied so far.
PERSONAL CONTRIBUTIONS
4.AIMS AND OBJECTIVES
The main purpose of the paper was creating a software model of the retina, realistic
from both a morphological a physiological point of view, also conferring it flexible
architecture. A simplified model of the retina consists of three layers of elements processing
light information, each layer being connected with the others. The system corresponds to the
way the photoreceptor, bipolar and ganglion cells interact with each other. There are also cells
with lateral connections in the same layer ( the horizontal and amacrine cells), the role of
these cells being noise reduction, contrast amplifying and movement detection. They
accomplish this by inhibiting cells from the upper layers (spatial processing) or participating
in neuronal pathways where the signal is delayed (temporal processing). This model retains
the space-time behavior of the network as a whole, but also that of individual cells or layers of
the retina.
To accomplish the main purpose of this paper an electrophysiological evaluation of
the visual analyzer was needed, both at the receptor and central level, allowing us to gather as
much information as possible to create and validate the model. For this, we performed 3
studies:

2
-an ERG study, exploring the difference between stimulation during dark adaptation,
to assess the activity of rod cells, and light adaptation, to assess the activity cone cells,
(scotopic versus photopic – "S-F" study).
-an ERG study, which was meant to highlight the difference between stimulating with
monochromatic light (red) and with white light (red versus white – "R-W" study).
-a VEP study, which quantified the difference between stimuli with monochromatic
light with different wavelengths, corresponding to red, yellow, green and blue ("PEV" study).
5.MATERIALS AND METHODS
5.1. GROUPS
Table 1.Data regarding the groups involved in the study
Study Experiment Males/Females Mean± std.dev. Student test p Scotopic 6 M / 14 F 26.70 ± 4.43
S-F Photopic 4 M /12 F 27.25 ± 4.81
p=0.723
White light 9 M / F 22.26 ± 3.29 R-W
Red light 6 M / F 22.35 ± 3.47 p=0.924
PEV - 8 M / 21 F 20.79 ± 1.89 ani p=0.465 (M vs.F)
5.2. WORK PROTOCOL FOR THE S-F STUDY
We performed two experiments, the eyes being dark adapted and the pupils dilated:
- in the first experiment, we recorded Flash ERG in scotopic conditions, in response to
a series of 17 light intensities, increasing by 0.5 log, from -5 to 3 log cd·s/m2.
- in the second experiment, we recorded Flash ERG in conditions similar to photopic
environment, using a 2 flash stimulation technique, in response to a series of 11 light
intensities, increasing by 0.5 log, from -2 to 3 log cd·s/m2,.
In both experiments we used a Ganzfeld stimulator - Espion ColorDome to generate
flashes and ERG recording was performed by Espion Visual Electrophysiology System
(DiagnosysLLC, Littleton, MA, USA). Recording electrodes were HK loop type ("Konec
Hawlina-loop") and the reference and ground ones were Ag-AgCl cup type.
A B
Fig.1. HK loop electrodes (A) and their fixation in the conjunctival fornix, for recordings (B)

3
5.3.WORK PROTOCOL FOR THE R-W STUDY
The R-W study consisted of two distinct experiments:
-in the first experiment, we recorded Flash ERG in photopic conditions, in response to
a series of 9 increasing light intensities, stimulation being done with white light
- in the first experiment, we recorded Flash ERG in photopic conditions, in response to
a series of 9 increasing light intensities, stimulation being done with cu red light(635nm)
For both tests, the eyes were light adapted and pupils were not dilated, to recreate
normal daytime conditions. Minimum intensity was -1 log cd·s/m2 (0.1 cd·s/m2), which allows
us to obtain both ERG waves ERG for red light stimulation too.
For stimulation and data recording we used the Neuropack M1 MEB-9100 system
(Nihon Kohden Corp., Tokyo, Japan). Red light stimuli were obtained with special LED
goggles - LS-102J, part of the system, and white light stimuli were produced with a TSD122b
strobe lamp (Biopac Systems Inc., Goleta, CA, USA).
The Recording electrodes were HK loop type; the ground and reference ones were
self-adhesive, Ag-AgCl type.
5.4.PROTOCOLUL DE LUCRU PENTRU STUDIUL PEV
The PEV study consisted of four different tests, in which VEP were recorded using
"pattern reversal" stimuli presented as s, using blue, green, yellow and red grating, alternating
with a black background. For stimulation and data recording we used the Neuropack M1
MEB-9100 system (Nihon Kohden Corp., Tokyo, Japan), togrthrt with an LCD monitor. We
used "bridge" electrodes, made of Ag-AgCl .
5.5. PARAMETERS ANALYSED FOR THE ERG AND VEP WAVES
On the Flash ERG recordings many waves are described; we were interested in the
first negative wave, denoted "a" and in the first positive wave, denoted "b". Parameters used
to describe them were the amplitude and latency.
The most robust parameters in the analysis of the VEP are the latencies of the N75,
P100 and N135 waves. For our study, in each experiment we recorded the responses evoked
in three channels: Fz-OL, Fz-Oz and Fz-OR and we measured their latencies.

4
5.6. STATISTICAL PROCESSING OF DATA AND SOFTWARE MODELING
ERG responses were recorded using the Espion E2 program, embedded in the Espion
acquisition system, respectively dedicated software incorporated into the Neuropack system,
fromwhere they were exported as Excel files, one for each subject and experiment.
For the numerical data we used classical statistical indicators: (1) arithmetic mean, (2)
standard deviation, (3) coefficient of variation - the ratio of standard deviation and average,
expressed as a percentage, (4) minimum and maximum (5 ) median and quartiles.
Data processing was performed with Excel (the Student and ANOVA tests). To
compute data normality tests (Shapiro-Wilks and Anderson-Darling) and nonparametric tests
for comparison of averages (Mann-Whitney-Wilcoxon and Kruskal-Wallis), we used the
XLSTAT add-on.
Mathematical modeling of the evolution of ERG waves parameters, depending on the
intensity of stimuli was carried out independently, using the Origin and Matlab programs,
comparing the regression curves obtained by using different sets of parameters, generated
during the "data fitting" procedures.
We chose to create the software using the C # programming language, using Visual
C# 2005 Express Edition as the integrated development environment (IDE).
6.RESULTS
6.1.RESULTS OBTAINED FROM THE S-F STUDY
The first data serie that we a parameterized using a Hill function were the amplitudes
for the "a" wave, obtained in scotopic conditions with white light stimuli.
Table 2. Optimal coefficients for the amplitudes serie of the scotopic "a" waves
R=Rmax*In/(I n +σ n) Rmax 170 μV σ 0.5 cd·s/m2 n 0.7
For estimating the scotopic "b" waves in relation to stimulus intensities, two
approaches are proposed: as a single function or as the sum of two Hill functions.
Table 3. Coefficients used to estimate the scotopic "b" wave amplitudes
R=Rmax*In/(I n +σ n) Rmax 220 μV σ 0.003 cd·s/m2 n 0.8

5
The estimation by a single function, although gives predictions close to reality for the
initial (linear growth) and final (plateau) areas, has important errors between -1.5 and -0.5 log
stimulus intensities.
Table 4.Coefficients used for the scotopic "b" wave model, as sum of 2 Hill functions
R=Rmax1*In1/(I n1+σ1n1) + Rmax2*In2/(I n2+σ2
n2) Rmax1 180 μV Rmax2 45 μV σ1 0.002 cd·s/m2 σ2 0.3 cd·s/m2 n1 0.75 n2 1
The model obtained by adding the two functions gives better results, but is more
difficult to implement and use on a large scale simulation program.
Table 5.Differences between the integrals of the "b" waves function and the two models
F0 "b" wave F1+2 Value of integral 2481.3 2413.6 2433.3
Difference -67.6799 -19.6402
0
25
50
75
100
125
150
175
-5 -4.5 -4 -3.5 -3 -2.5 -2 -1.5 -1 -0.5 0 0.5 1 1.5 2 2.5 3
Intensitatea stimulului (log cd·s/m2)
Am
plit
ud
ine
a m
ed
ie (μ
V)
Functie Amplitudinea undei a
0
50
100
150
200
250
-5 -4.5 -4 -3.5 -3 -2.5 -2 -1.5 -1 -0.5 0 0.5 1 1.5 2 2.5 3
Intensitatea stimulului (log cd·s/m2)
Am
plit
ud
ine
a m
ed
ie (μ
V)
Amplitudinea undei b Functie 0 Functie 1+2
Fig.2. The scotopic "a" wave amplitudes serie and the estimation function
Fig.3.Comparison of the scotopic "b" waves and of the 2 estimation functions
The equation by which we modeled "a" wave amplitudes for the series of photopic
ERGs also was a Hill type function, but had an error greater than in other cases, due to
variations in linear growth observed for the intensities of 0log and 0.5 log.
Table 6. Optimal coefficients for the amplitudes serie of the photopic "a" waves and those for
estimating the photopic "b" waves until the start of the „photopic hill” phenomenon
R=Rmax*In/(I n +σ n) R=Rmax*In/(I n +σ n) Rmax 65 μV Rmax 105 μV σ 1 cd·s/m2 σ 0.3 cd·s/m2 n 0.6 n 1.4
0
10
20
30
40
50
60
70
-2 -1.5 -1 -0.5 0 0.5 1 1.5 2 2.5 3
Intensitatea stimulului (log cd·s/m2)
Am
plit
ud
ine
a m
ed
ie (μ
V)
Functie Amplitudinea undei a
0
20
40
60
80
100
120
-2 -1.5 -1 -0.5 0 0.5 1 1.5 2 2.5 3
Intensitatea stimulului (log cd·s/m2)
Am
plit
ud
ine
a m
ed
ie (μ
V)
Functie Amplitudinea undei b
Fig.4. The photopic "a" wave amplitudes serie and the estimation function
Fig.5. The photopic "b" wave amplitudes serie and the estimation function
6
Because the "photopic hill"phenomenon of decreasing "b" wave amplitudes at higher
intensities, we can not model the entire spectrum of values of the wave "b", recorded in
photopic conditions. For these reasons we sought a function to approximate as corrctly as
possible only values from the beginning up to the maximum, that is for stimulus intensities
ranging between -2 and 0.5 log.
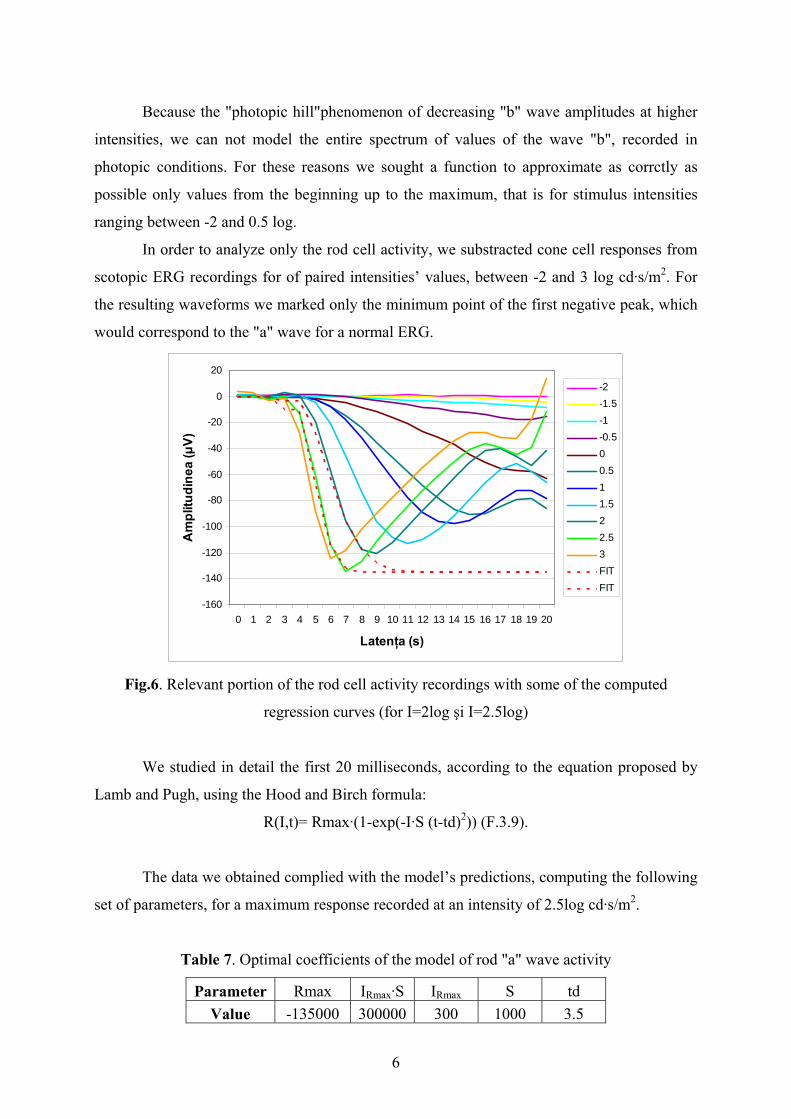
In order to analyze only the rod cell activity, we substracted cone cell responses from
scotopic ERG recordings for of paired intensities’ values, between -2 and 3 log cd·s/m2. For
the resulting waveforms we marked only the minimum point of the first negative peak, which
would correspond to the "a" wave for a normal ERG.
-160
-140
-120
-100
-80
-60
-40
-20
0
20
0 1 2 3 4 5 6 7 8 9 10 11 12 13 14 15 16 17 18 19 20
Latenţa (s)
Am
plit
ud
ine
a (μ
V)
-2
-1.5
-1
-0.5
0
0.5
1
1.5
2
2.5
3
FIT
FIT
Fig.6. Relevant portion of the rod cell activity recordings with some of the computed
regression curves (for I=2log şi I=2.5log)
We studied in detail the first 20 milliseconds, according to the equation proposed by
Lamb and Pugh, using the Hood and Birch formula:
R(I,t)= Rmax·(1-exp(-I·S (t-td)2)) (F.3.9).
The data we obtained complied with the model’s predictions, computing the following
set of parameters, for a maximum response recorded at an intensity of 2.5log cd·s/m2.
Table 7. Optimal coefficients of the model of rod "a" wave activity
Parameter Rmax IRmax·S IRmax S td
Value -135000 300000 300 1000 3.5

7
By comparing all the data series analyzed so far we can say that "a" waves, generated
by the electrical activity of photoreceptors, meet best the "linear growth followed by a
saturation zone" type of model, because there are no inhibitory external influences or
amplifications, variables with intensity of the stimulus, of the propagated electrical signals, as
in cells that generate "b" waves - mainly bipolar cells, which are of two types, ON and OFF,
and partly horizontal and Müller cells .
0
20
40
60
80
100
120
140
160
180
200
220
240
-5 -4.5 -4 -3.5 -3 -2.5 -2 -1.5 -1 -0.5 0 0.5 1 1.5 2 2.5 3
Intensitatea stimulului (log cd·s/m2)
Am
plit
ud
inea m
ed
ie (μ
V)
a scotopic b scotopic a fotopic b fotopic
Fig.7. Comparison of the amplitudes of the waves recorded in the S-F study
0%
200%
400%
600%
800%
1000%
1200%
1400%
1600%
1800%
2000%
Va
loa
rea
ra
po
rtu
lui a
mp
litu
din
ilor
b/a
-2 -1.5 -1 -0.5 0 0.5 1 1.5 2 2.5 3
Intensitatea stimulului (log cd·s/m2)
b/a scotopic b/a fotopic
0%
500%
1000%
1500%
2000%
2500%
3000%
3500%
Valo
are
a ra
po
rtu
lui a
mp
litu
din
ilor
-2 -1.5 -1 -0.5 0 0.5 1 1.5 2 2.5 3
Intensitatea stimulului (log cd·s/m2)
a scotopic/a fotopic b scotopic/b fotopic
Fig.8.Comparison of the ratios between amplitudes of "b" and "a" waves in the S-F study Fig.9. Comparison of the ratios between same wave type amplitudes in the S-F study
If ratios between the scotopic and photopic "a" waves vary only a little, "b" wave
ratios change from very high values, ~30 or 25, to values comparable with those of the "a"
waves ratios, reaching, for the final intensities, almost double the value of the waves caused
mostly by photoreceptors.

8
0
10
20
30
40
50
-2 -1.5 -1 -0.5 0 0.5 1 1.5 2 2.5 3
Intensitatea stimulului (log cd·s/m2)
La
tenţa
me
die
(m
s)
a scotopic a fotopic
0
20
40
60
80
100
120
-2 -1.5 -1 -0.5 0 0.5 1 1.5 2 2.5 3
Intensitatea stimulului (log cd·s/m2)
La
tenţa
me
die
(m
s)
b scotopic b fotopic
Fig.10. Comparison between the mean latencies of "a" waves from the S-F study
Fig.11. Comparison between the mean latencies of "b" waves from the S-F study
Comparing the latencies of the "a" waves, we see the trend of mean values for the
scotopic series decrease from 40ms to about 6ms, while for the photopic series, the variation
is relatively small. "b" wave latencies, obtained in the same experiment as above, differ
significantly between scotopic and photopic recordings.
6.2. RESULTS OBTAINED FROM THE R-W STUDY
In the first experiment from this study, we performed 31 ERG recordings in response
to a series of flashes, with white light and increasing intensities. For the second experiment
required in the study, 20 ERG recordings were made, in response to a series of flash stimuli,
with red light, also with increasing intensity, between -1 and 2 log, from 0.5 to 0.5 log plus
the intensity of 1.7 log (50 cd·s/m2). Neither in this study we found significant differencse
between males and females, so we performed the analysis on the entire group of subjects.
0
20
40
60
80
-1 -0.5 0 0.5 1 1.5 1.7 2
Intensitatea stimulului (log cd·s/m2)
Am
plit
ud
ine
a m
ed
ie (μ
V)
„a” lumină albă „b” lumină albă
0
20
40
60
80
-1 -0.5 0 0.5 1 1.5 1.7 2
Intensitatea stimulului (log cd·s/m2)
Am
plit
ud
ine
a m
ed
ie (μ
V)
„a” lumină roşie „b” lumină roşie
Fig.12. Comparison between the values of the "a" and "b" waves obtained with white light
Fig.13. Comparison between the values of the "a" and "b" waves obtained with red light
Calculating differences between "a" waves latencies of the of the two experiments,
and between "b"waves latencies, we see that they vary only a bit, as those for "a" waves are
around 3 ms, and those for waves "b" - close to 6 ms. Therefore, it is possible that significant
differences found between latencies to be due only to the different conditions and equipment
used,and not a real one between white and red light stimulation.
9
0
10
20
30
40
50
60
-1 -0.5 0 0.5 1 1.5 1.7 2
Intensitatea stimulului (log cd·s/m2)
Late
nţa
med
ie (m
s)
„a” l.albă „b” l.albă „a” l.roşie „b” l.roşie
Fig.14. Comparison between the mean latencies of waves from the R-W study’s experiments
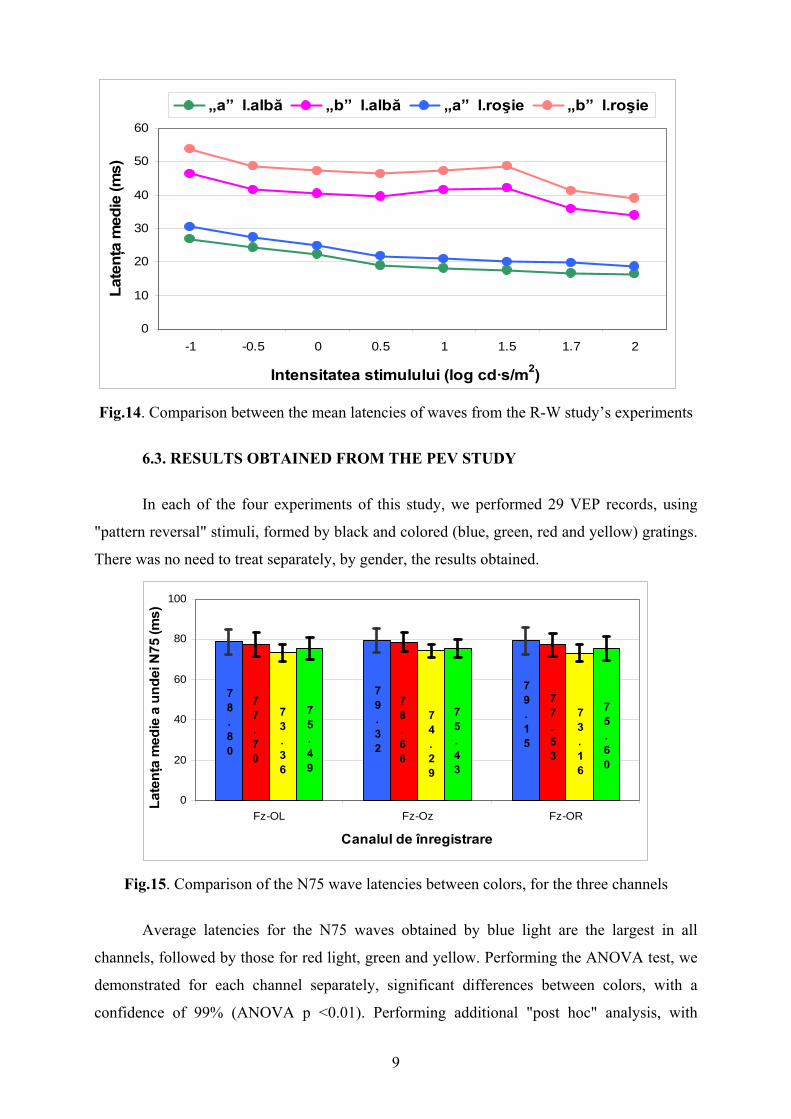
6.3. RESULTS OBTAINED FROM THE PEV STUDY
In each of the four experiments of this study, we performed 29 VEP records, using
"pattern reversal" stimuli, formed by black and colored (blue, green, red and yellow) gratings.
There was no need to treat separately, by gender, the results obtained.
79.15
79.32
78.80
77.53
78.66
77.70
73.16
74.29
73.36
75.60
75.43
75.49
0
20
40
60
80
100
Fz-OL Fz-Oz Fz-OR
Canalul de înregistrare
Late
nţa
med
ie a
un
dei N
75 (m
s)
Fig.15. Comparison of the N75 wave latencies between colors, for the three channels
Average latencies for the N75 waves obtained by blue light are the largest in all
channels, followed by those for red light, green and yellow. Performing the ANOVA test, we
demonstrated for each channel separately, significant differences between colors, with a
confidence of 99% (ANOVA p <0.01). Performing additional "post hoc" analysis, with

10
Tuckey and Fisher tests, for pairs of average latencies, we showed constant differences
between blue and yellow, red and yellow respectively, also with some differences between
blue and green or red and green.
P100 wave mean latencies have the same sequence as for the N75 wave. For the P100
waves, latency differences were even greater in all 3 the ANOVA tests performed obtaining
highly significant values (p <0.001).
Comparing the P100 wave latencies between pairs of colors, there are significant
differences between blue and yellow, respectively red and yellow, on all channels. Also in all
channels, but unverified on channel 1 by the Tuckey test, we find differences between blue
and green and red and green. In addition, Fisher's test shows a significant difference between
latencies obtained on channel 1 for red and blue and on channel 2 between green and yellow.
109.56
111.85
110.52
109.16
108.29
108.52
101.59
100.59
101.56
105.26
103.20
103.68
0
20
40
60
80
100
120
140
Fz-OL Fz-Oz Fz-OR
Canalul de înregistrare
Late
nţa
med
ie a
un
dei P
100 (m
s)
Fig.16. Comparison of the P100 wave latencies between colors, for the three channels
147.23
146.23
148.43
147.48
147.97
147.99
146.07
142.36
148.25
143.59
137.93
146.78
0
20
40
60
80
100
120
140
160
180
Fz-OL Fz-Oz Fz-OR
Canalul de înregistrare
Late
nţa
med
ie a
un
dei N
135 (m
s)
Fig.17. Comparison of the N135 wave latencies between colors, for the three channels

11
For the N135 waves we do not have a clear order of the average latencies between
colors, and the ANOVA tests reveal no significant differences between wave latencies
measured on any of the channels.
Table 8. ANOVA test results comparing the latencies for the waves N135
N135 p ANOVA Ch 1 0.989
Ch 2 0.103 Ch 3 0.846
As a conclusion, if for the N75 and P100 waves, known to be more stable, less
variable, we have a clear order of the average latencis as follows:
BLUE > RED > GREEN > YELLOW
for the N135 waves no rule can be detected, changes due to other factors than direct
propagation influencing the outcome, during the distribution of nerve impulses coming from
the retina, through intermediate stations, to visual association areas.
6.4.CREATION OF THE SOFTWARE MODEL OF THE RETINA
6.4.1.ARCHITECTUE OF THE MODEL
To have a realistic representation of the spatial structure of the retina, we adopted a
model consisting of interconnected matrices of elements ("cells" similar to artificial neurons,
but with different transfer functions for each group or subgroup): 3 main layers, modeling
photoreceptors, bipolar and ganglion cells, acting as a feed forward artificial neural network,
and 2 inter-layers of cells influencing the connection weights of the 3 main layers, simulating
horizontal and amacrine cells' influence.
.
Fig.18.The 3D structure of the retina model

12
6.4.2.PARTITIONING OF AN IMAGE
To make easy the transfer of information from a digital image to the elements of the
first layer of the model we chose to divide the array of photoreceptors in 30 parts, both in
length and width. The dimesion of 30x30 groups is close to 32x32, that is 25, which is a very
convenient number to be used as a constant in the creation of programs. In order to keep the
information convergence scheme designed for the model, it is necessary, within a group, to
have a minimum of 4x4 cells.
Fig.19.The photoreceptor layer - 30x30 groups of 16x16 elements
The elements within the groups, which are photoreceptor cells, are embedded in units
of varying sizes, smaller in the center and becoming larger towards the periphery. Each unit
corresponds to a bipolar cell of the next layer, even if the units have different numbers of cell
components. Because of the asymmetry due to the convergence and in order to have the same
number of units as the photoreceptor cells, we grouped the bipolar cells into 12x20 groups of
8x8 elements. Four such groups contain 256 bipolar cells, exact number bipolar cells
corresponding to an area of photoreceptor cells.
Fig.20.The bipolar cells layer - 12x20 groups of 8x8 elements
To one ganglion cell correspond, on average, 4 bipolar cells. We grouped the ganglion
cells in structures of 4x4 elements, which are associated with a structure of 8x8 bipolar cells.

13
To each bipolar cell, a horizontal cell is attached, that is used to receive impulses from
the units surrounding the photoreceptor unit from which the bipolar cell directly receives
visual information, constituind this way creating a center-surround receptive field. To each
ganglion cell we associated an amacrine cell, which receives inputs from all the bipolar cells
taht the ganglion cell has synapse with. The amacrine cell has the role to delay the signal, in
order to be able to process it temporally, to detect differences between two images presented
one after the other, differences that symbolise the movement of objects in the visual field.
6.4.3. SOFTWARE IMPLEMENTATION OF THE MODEL
According to the rules of object-oriented programming, the application consists of
several classes that model several entities that can work together.
Artificial neurons, used to create the cell layers of the model, are relatively simple
computational units that use a small number of parameters and whose action is based on a
single major operation.
class Neuron { private TipNeuron tip; private double intensitate, V_output; private double n;//coeficient Hill private double V_max;// raspunsul maxim posibil private double int_med;//intensitatea de semisaturatie public List<Link> sinapse = new List<Link>();//lista de pozitii ale neuronilor cu care face sinapsa public Neuron() { n = 1; V_max = 200; int_med = 128; } public double functieNeuron(double intensitate) { return V_max * Math.Pow(intensitate, n) / (Math.Pow(intensitate, n) + Math.Pow(int_med, n)); } }
Fig.21. Software implementation of the Class representing a generic neuron
The links ("synases") are stored, for each neuron, as a list.
The next step is the creation of the three layers that represent the "retina".
class Retina { private int i, j, n, m; private Neuron[,] foto, bipolare, ganglioni; //cele 3 straturi private int h_foto=30, v_foto=30, units_foto=4; //dimensiuni private int h_bipolare=20, v_bipolare=12, units_bipolare=2; private int h_ganglioni=20, v_ganglioni=12, units_ganglioni=1; public Retina() { InitializeComponent(); } private void InitializeComponent() { //initializare strat celule fotoreceptoare n = this.v_foto * this.units_foto;

14
m = this.h_foto * this.units_foto; foto = new Neuron[n,m]; System.Diagnostics.Debug.WriteLine("Initializare fotoreceptori"); for (i=0;i<n;i++) for (j = 0; j<m; j++) foto[i,j] = new Neuron(TipNeuron.Rod); //initializare strat celule bipolare //initializare strat celule ganglionare } }
Fig.22. The Class that creates the main structure of the three retinal layers
6.4.4.DESCRIPTION OF THE USE OF THE SOFTWARE
The first action to be performed to get started is loading an image. The program can
use the bitmap (.bmp), JPEG (.jpg) şi GIF (.gif) image formats.
The program can perform a wide range of image enhancement operations.
Fig.23. Contrast enhancement and edge detection
Fig.24.The images compared and the result of the "motion detection"
One of the important features implemented in this program is the detection of motion,
defined as the difference in light perception between two successively loaded images. After
finding the differences between the images we used a pseudocoloring operation, to highlight
them: we colored with red areas where light is detected, for example the bottom right corner,
and with blue regions where light is not perceived anymore.

15
DISCUTIONS AND ŞI CONCLUSIONS
1.Unlike other studies, using a great number of stimuli intensities, covering a large
value span ( -5 to +3 log cd·s/m²), allowed us to create a complete image of the optical
information receptor segment’s behavior during the interaction with various light stimuli,
found in real conditions, an insufficient researched topic in the literature, our research being
original in this aspect.
2.The data, regarding the amplitudes of the waves recorded in the first study, followed
the general tendency found in the literature – we obtained the sigmoidal evolution curves for
“a” wave amplitudes recorded in scotopic and photopic conditions, the distinct aspect of two
growth zones separated by a plateau area, for “b” waves in scotopic conditions, a shape
similar of the “photopic hill” phenomenon, for “b” waves measured in photopic conditions.
3.After estimating by mean of well established mathematical models (e.g. the Naka-
Rushton equation), we obtained the necessary values of the coefficients for the equations that
describe the relation between intensity and response, for the series of amplitudes measured in
scotopic and photopic conditions, carrying out one of the main goals of the electro-
physiological experiments, that of providing a quantitative base for implementing the
software model of the functions of the retina.
4.The latencies recorded in the first study revealed a clear tendency of diminishing the
peak time for “a” waves which reflects the photoreceptor activity, along with the increase in
intensity, in a linear manner, the difference between scotopic and photopic lighting beeing the
different regression slope and the initial and final values; this phenomenon is clearly outlined
because of the complex simulation method, with two successive flashes, different to what is
found in the literature where a low intensity lit background is used for saturating the rod
cells, but is not able to do this in an optimal manner.
5.By measuring the amplitudes obtained by stimulation with white light and red we
obtained significantly different results only for large amplitudes, ie amplitudes for stimuli of
more than 1.5 log cd·s/m2 for the "a" waves and only for the maximum amplitude of the "b"
series waves, measured at 0.5 log cd·s/m2 - in all these cases, the amplitude of the waves
recorded with white light was higher than for red light.
6.Stimulation with white light systematically produced lower latencies than the red
light, for "a"waves, as well as for "b"waves. Still, we are not fully convinced of the truth of
this relationship, because the differences were much less variable in relation to variations in
intensity of ~ 3ms for the "a" waves and ~ 6ms for the waves "b", and thus maybe only a
consequence of using stimulation of different equipment.

16
7.In the study for assessing the visual evoked potentials we obtained significant
differences for the N75 and P100 waves latencies, generated by stimulation with colors, but
not for N135 waves, something that can be explained by the different origin of the three
waves: N75 and P100 arise from the specific cortical projection areas, while N135 originates
in the nonspecific, association areas.
8.For the N75 and P100 waves we have identified a clear order of the latencies’ values
, the lowest being obtained by excitation with light yellow, followed by green and red, and the
largest being latencies for stimulation with blue light, which is surprising because yellow and
blue signals are sent on the same neural pathways.
9.Performing further analysis, we detected for the N75 waves significantly different
latencies for the pairs yellow-blue and yellow-red, and for the P100 waves we found, in
addition, differences for the blue-green and and green-red pairs, that cannot be explained only
by the different types of cones involved in the answer.
10.The studies conducted, aimed to electrophysiologically explore the visual analyzer,
provided us with specific numerical values for the parameters needed to create a mathematical
model of information processing and transmission in the retina.
11.For the software implementation of the identified model, we used a structure
inspired by the architecture of cellular neural networks, using 3 main layers of computing
units ("cells"), equivalent to photoreceptor, bipolar and ganglion cells and inserting between
them 2 other types of elements for horizontal and amacrine cells; the units interact with
neighbors within a variable radius, depending on the position from the center of the structure.
12.By adjusting the radius of interaction of cells from different layers we were able to
simulate the central high acuity vision (1-to-1 transmission), peripheral low acuity vision and
contrast enhancing at the border between different brightness areas.
13.By creating, in the structure described above, neural circuits with a larger or
smaller number of elementa, we were able to obtain temporal processing of the information
and, thus, to detect movement of objects in images shown in a succession.
14.Using mathematical formulas with a small number of coefficients (Hill equation),
we were able to have an acceptable data processing time, despite the large number of
computing units that compose the model (about 250,000).
15.The model created by us is clearly distinguishable from others presented in the
literature, because of the original method used for generating the underlying structure and of
the property to comply with the retinal morphology and synaptic bindings found at this level,
which we could describe mathematically and reproduce without having a very high degree of
complexity, while keeping intact the ability to simulate the main functions of the retina.

17
SELECTIED REFERENCES
[1] Petrusca D, Grivich MI, Sher A, Field GD, Gauthier JL, Greschner M, Shlens J,
Chichilnisky EJ, Litke AM (2007) - Identification and Characterization of a Y-Like Primate Retinal Ganglion Cell Type, J.Neurosci. 27(41):11019-11027
[2] Provencio I, Rodriguez IR, Jiang G, Hayes WP, Moreira EF, Rollag MD (2000) - A novel human opsin in the inner retina, J.Neurosci.20(2):600-605
[3] Zaidi FH, Hull JT et al.(2007) - Short-wavelength light sensitivity of circadian, pupillary, and visual awareness in humans lacking an outer retina.Curr.Biol;17(24):2122-2128
[4] Münch TA, da Silveira RA, Siegert S, Viney TJ, Awatramani GB, Roska B. (2009) - Approach sensitivity in the retina processed by a multifunctional neural circuit, Nat Neurosci.;12(10):1308-1316.
[5] Roska B., Werblin F. S. (2001)- Vertical Interactions across Ten Parallel Stacked Representations in Mammalian Retina, Nature, 410:583-587,
[6] Werblin F., Roska B. (2007)The movies in our eyes, Scientific American 296(4):72-79 [7] Kolb Helga, Fernandez E., Nelson R (2008)- Webvision: The Organization of the
Retina and Visual System, National Library of Medicine (online) [8] Kolb, Helga (2003)– How the Retina Works, American Scientist, 91:28–35, [9] Roorda, A., Williams, D.R. (1999)-The arrangement of the three cone classes in the
living human eye. Nature 397, 520-522 [10] Cernea, P. (2002)– Tratat de oftalmologie, Ed.Medicala, , 656-666 [11] Marmor M. F., Fulton A. B., Holder G. E., Miyake Y., Brigell M., Bach M. (2009) -
ISCEV Standard for full-field clinical ERG, 2008 update, Doc.Ophthalmol 118:69–77 [12] Sustar M, Cvenkel B, Brecelj J. (2009)- The effect of broadband and monochromatic
stimuli on the photopic negative response of the electroretinogram in normal subjects and in open-angle glaucoma patients. Doc Ophthalmol.; 118: 167-177
[13] Neştianu,V.,Iancău,M..,Georgescu,D.,Romanescu,F.,Badea,P.,Neştianu,A.- Potenţiale evocate(EP).Electrogeneza corelată în timp cu stimulul. Potenţiale evocate vizual, în Zăgrean, L. (2005) – Neuroelectrofiziologie clinică, Ed. Univ. Carol Davila, Bucureşti, 203-238
[14] Odom,J.V et al.(2010) - ISCEV standard for clinical visual evoked potentials (2009 update), Doc.Ophtalmol,120:111-119
[15] Naka K, Rushton W (1966) - S-potentials from luminosity units in the retina of fish (cyprinidae) J. Physiol. 185, pp. 587-599
[16] Baylor D. A., Nunn B. J., Schnapf J. L. (1984) - The photocurrent, noise and spectral sensitivity of rods of the monkey macaca fascicularis, J. Physiol. 357:575-607
[17] Penn RD, Hagins WA (1972) - Kinetics of the photocurrent of retinal rods. Biophys J; 12:1073–1094
[18] Hood DC, Birch DG (1990) - The A-wave of the human electroretinogram and rod receptor function. Invest Ophthalmol Vis Sci; 31:2070–2081
[19] Lamb TD, Pugh EN Jr. (2006) - Phototransduction, dark adaptation, and rhodopsin regeneration the proctor lecture. Invest Ophthalmol Vis Sci. ;47(12):5137-52
[20] Robson JG, Frishman LJ (1999). Dissecting the dark-adapted electroretinogram. Doc Ophthalmol 95, 187–215
[21] Robson J.G., Saszik S.M., Ahmed J., Frishman Laura J. (2003) - Rod and cone contributions to the a-wave of the electroretinogram of the macaque, J.Physiol,547.2:509–530
[22] Hood,D., Birch,D. - Measuring the Health of the Human Photoreceptors with the Leading Edge of the a-Wave, in Heckenlively JR, Arden GB (eds) (2006)-Principles and practice of clinical electrophysiology, 2nd ed. MIT Press, Cambridge, ,ch.35:487-501
[23] Boycott BB, Wassle H. (1991) - Morphological classification of bipolar cells of the primate retina. Eur J Neurosci.,3:1069–1088

18
[24] Fulton, Anne, Hansen,R – Stimulus-response functions for the scotopic b-wave, in Heckenlively JR, Arden GB (eds)(2006)-Principles and practice of clinical electrophysiology, 2nd ed. MIT Press, Cambridge,ch.33:473-478
[25] Severns ML, Johnson M (1993) - The care and fitting of Naka-Rushton functions to electroretinographic intensity response data. Doc Ophthalmol; 85(2):135–150
[26] Peachey NS, Alexander KR, Fishman GA (1989) - The luminance-response function of the dark-adapted human electroretinogram. Vision Res; 29:263–270
[27] ISCEV (2008)– Rod b-wave series protocol discussions http://iscev-wiki.org/twiki/bin/view/Main/RodBwaveseries
[28] Field, G. D., & Rieke, F. (2002). Nonlinear signal transfer from mouse rods to bipolar cells and implications for visual sensitivity. Neuron, 34:773–785
[29] Diamond, J. S., D. R. Copenhagen (1995) - The relationship between light-evoked synaptic excitation and spiking behaviour of salamander retinal ganglion cells, J. Physiol., 487:711–725
[30] Dumitrescu,D., Costin,H. (1996)– Reţele neuronale, Editura Teora, Bucureşti, 32-57 [31] Ţăndăreanu,N. (2001)– Sisteme Expert. Reprezentarea cunoştinţelor şi inferenţa,
Editura Universitaria, Craiova, 46-68 [32] Badea, P. (2007) Introducere în sisteme expert cu aplicaţii în medicină, Editura
Universitaria, 35-84 [33] Eberhart,R., Dobbins,R. (1990)– Neural Network PC Tools: A Practical Guide,
Academic Press Inc., New York, 35-58 [34] Rumelhart,D.E., McClelland,J.L. & PDP Research Group (1986)– Parallel
Distributed Processing: Explorations in the Microstructure of Cognition, vol. I, II, MIT Press, Cambridge, MA,
[35] Chua L. O., Yang L. (1988) - Cellular Neural Networks: Theory, IEEE Trans. On Circuits and Systems, (CAS), 35: 1257-1290,.
[36] Bálya D., Roska B., Roska T., Werblin F. S., (2002)- A CNN framework for modeling parallel processing in a mammalian retina, International Journal of Circuit Theory and Applications, 30(2-3): 363–393,.
[37] Wohrer, A, Kornprobst,P. (2009)-Virtual Retina: a biological retina model and simulator, with contrast gain control. J Comput Neurosci, 26(2):219-49
[38] Baccus S.A., Olveczky B.P., Manu M., Meister M. (2008) - A retinal circuit that computes object motion, Neurosci. 28 (27):6807-17 18596156
[39] Hawlina M, Konec B. (1992) New noncorneal HK-loop electrode for clinical electroretinography. Doc Ophthalmol.;81(2):253-9
[40] Hsien-Che Lee (2005) Introduction to color imaging science, Cambridge University Press Cambridge, UK , Ch.12.4 The retina 294-308
[41] Al Abdlseaed Abdlsaed, McTaggart Yvonne, Ramage T., Hamilton Ruth, McCulloch Daphne L. (2010) Light- and dark-adapted electroretinograms (ERGs) and ocular pigmentation: comparison of brown- and blue-eyed cohorts. Doc Ophthalmol 121:135–146
[42] Chung NH, Kim SH, Kwak MS. (1993) The electroretinogram sensitivity in patients with diabetes. Korean J Ophthalmol.;7(2):43-7
[43] Hamilton R., Bees M.A., Chaplin C.A., McCulloch D.L. (2007) The luminance–response function of the human photopic electroretinogram: A mathematical model. Vision Research 47 (2007) 2968–2972
[44] Rufiange Marianne, Dumont Marie, Lachapelle P. (2005) Modulation of the human photopic ERG luminance-response function with the use of chromatic stimuli Vision Research 45, 2321–2330
[45] Arden G., Berninger, T. - Clinical Electrophysiological and Psychophysical Investigations into Color Defects in Heckenlively JR, Arden GB (eds)(2006)-Principles and practice of clinical electrophysiology, 2nd ed. MIT Press, Cambridge,ch.

19
CURRICULUM VITAE 1. Surname: Alexandru 2. First Name: Dragoş Ovidiu 3. Date and place of birth: 30.04.1980, Craiova, Dolj 4. Citizenship: Romanian 5. Marital status: married, 1 child 6. Education and qualification: 1)15.09.1994-31.06.1998, “Nicolae Balcescu”- Theoretical High-school, Craiova – graduation degree: General Certificate of Education 2)1.10.1998 – 30.09.2004, University of Medicine and Pharmacy of Craiova, General Medicine Faculty – graduation degree 3)1.10.1999 – 31.07. 2005, University of Medicine and Pharmacy of Craiova, Teacher Training Department – graduation certificate 4)1.10.2000 – 30.09.2004, University of Craiova, Faculty of Mathematics – Informatics - graduation degree, licensed in Informatics 5)1.10. 2002 – 30.06.2004, University of Craiova, Teacher Training Department - graduation certificate 6)1.10.2006 – 30.07.2008, - University of Craiova, Faculty of Mathematics – Informatics – graduation degree, Master in Informatics – Artificial Intelligence and Communications Technology 7)1.10.2008 – 30.07.2010, University of Medicine and Pharmacy of Craiova- graduation degree, Master in Health Care Units Management 8)1.10.2008-present, University of Medicine and Pharmacy Craiova, PhD student in Normal and Pathological Physiology, coordinating teacher Prof.Univ.Dr. Maria Iancau 7. Scientific title: Assistant Professor / PhD Student 8. Professional experience: 1) 03.2009 – present Craiova, University of Medicine and Pharmacy Craiova, General Medicine Faculty - Teaching Assistant 2) 10.2005 – 02.2009 Craiova, - University of Medicine and Pharmacy Craiova, General Medicine Faculty – Junior Teaching Assistant 3) 12.2006 – 06.2009 Craiova, SC Comranado SRL - informatician 4) 1.1.2006 – 1.12.2009 Craiova, Emergency Clinical Hospital - resident doctor in Management and Public Health Medicine (without payment, complementary to the main job) 5) 1.1.2005 – 31.12.2005, Craiova, Emergency Clinical Hospital – training doctor – General Medicine (1.10.2005-31.12.2005 without payment, complementary to the main job) 9.Current job and title: University of Medicine and Pharmacy of Craiova, General Medicine Faculty , Department of Medical Informatics– Teaching Assistant 10. Seniority in current job: 6 years 11. Developed and published works: 2007,2008 1. Alexandru Dragos Ovidiu, Georgescu Daniel, Badea Petrica -Implementation of a neural network used in
medical diagnosis., Proceedings of the 29th International Conference -MEDINF 2007, November 8-11, SIBIU, Romania, "Lucian Blaga" University of Sibiu Editing House, ISSN 1843-651X,pp.422-435 (IN EXTENSO)
2. Oana Alexandru, Cornelia Zaharia, Valerica Tudorica, D.O. Alexandru - IGF1/IGF1R Mitogenic Pathways And Implications In Gb Therapy, Romanian Journal Of Neurology – Volume VII (2008), N0. 1, pp.5-9 (IN EXTENSO)
3. Emilia Pătru, Diana Elena Dincă, Andreea-Loredana Golli, D. Alexandru, C.L.Pătru- Epidemiologia cancerului în judeţul Dolj. Craiova Medicală, Vol 10, Nr 4, 2008,pp.251-255
4.B.Catalin, D.Georgescu, D. Alexandru, Ioana Streata, N.Velicu, T.A.Balseanu, V.Gheorman, Maria Iancau - Discrimination – friend or foe for visual storage?, Congress of The Romanian Society of Physiological Sciences, 5-7 iunie 2008, Cluj-Napoca, p.14
5.Maria Iancau, D.Georgescu, B.Catalin, D.Alexandru, M.Georgescu, F.Romanescu, Veronica Sfredel, A. Balseanu, Smaranda Mitran, D.Enescu-Bieru, V.Nestianu- Electrophysiological aspects of the perception of luminous stimuli of different wavelengths, Congress of The Romanian Society of Physiological Sciences, 5-7 iunie 2008, Cluj-Napoca, p.35
2009 1.Petcu DP, Petcu C, Popescu CF, Bătăiosu C, Alexandru D.-Clinical and cytological correlations in
pericardial effusions with cardiac tamponade.,Rom J Morphol Embryol.2009;50(2):pp251-256(IN EXTENSO)

20
2. M. T. Tarata, C. K. Dung, D. Georgescu, D. Alexandru, G. Staude,W. Wolf-Is the Bottleneck in Multitasking of Cognitive Origin? Tapping as an Experimental Assessment Tool. WC 2009, IFMBE Proceedings 25/IX, pp.566-569,(IN EXTENSO)
3. Braicu MD, Priţulescu C, Alexandru D, Moţa M. - The assessment of subclinic atherosclerosis objected through IMT in normal and dislipidemic patients with various degrees of glucose tolerance. Rom J of Internal Medicine, vol 47, nr.3/2009 (IN EXTENSO)
4. Marioara Daniela Braicu, D.Alexandru, Maria Moţa- The assessment of the glucose metabolism disturbances in normolipidic and dyslipidaemic patients., Romanian Journal Of Diabetes Nutrition & Metabolic Diseases, vol.16, nr.2/2009 (IN EXTENSO)
5.Alexandru D., Alexandru Livia., Georgescu D.,Iancau Maria (2009) Software modeling methods for neuro-visual structures, Fiziologia – Physiology, 2009 Supplement – Proceedings of SRSF 2009 - A XXIII-a Conferintã Nationalã a Societãtii Române de Stiinte Fiziologice "Fiziologia experimentalã si clinicã în contextul medicinei moderne", 203-206
6. Enescu Bieru D., Catalin B., Cosma G., Georgescu M., Georgescu D., Alexandru D., Fortan C., Popescu C., Iancau M.-Comparative study of compound muscle action potential and motor nerve velocity between professional sporetsmen, Sport Science Review, XVIII(2009), no.3, p65-79, ISSN 2066-8732(IN EXTENSO)
2010 1. Ioana M, Angelescu C, Burada F, Mixich F, Riza A, Dumitrescu T, Alexandru D, Ciurea T, Cruce M, Saftoiu
A.-MMR gene expression pattern in sporadic colorectal cancer. J Gastrointestin Liver Dis. 2010 Jun;19(2):155-159 (IN EXTENSO)
2. Alexandru D. O., Georgescu M., Catalin B., Georgescu D., Iancau M., Alexandru Livia, Balseanu A -Software model of the information transmission in the retina., FENS 2010 – 7th Forum of European Neuroscience, 03-07 iulie 2010, Amsterdam, Olanda
3. Tarata M, Wolf W, Georgescu D, Alexandru D, Serbanescu M -Blood oxygen saturation decreases with increasing fatigue of trapezius and sternocleidomastoidian muscles, , XVIII Congress of the International Society of Electrophysiology and Kinesiology, Aalborg University, Dk, ISBN: 978-87-7094-047-4
4. Tarata M., Serbanescu M., Georgescu D., Alexandru D., Staude G., Wolf W. -A new experimental concept for the quantitative exploration of the stretch reflex electromyographic response , BMT2010, 05-08 Octombrie 2010, Rostock, Germany
5. Tarata M, Wolf W, Georgescu D, Alexandru D, Serbanescu M - SEMG derived parameters vs blood oxygen saturation in monitoring neuromuscular fatigue, Clin. Neurophysiol., Vol. 121, Supplement 1, p. 180, ISSN 1388-2457, ICCN2010, 26 Oct - 2 Nov 2010, Kobe, Japonia
6. Dragoş Alexandru, Mihai Tărâţă, Daniel Georgescu, Mircea Şerbănescu, Marius Georgescu, Maria Iancău- On Retinal Information Transmition Modelling, , ROMEDINF 2010 - the 31st National Conference on Medical Informatics, Arad, 18-20 noiembrie 2010, In: Solution-based Medical Informatics, Proceedings of the 31-st Romanian National Conference on Medical Informatics, Ed. Univ. “Vasile Goldis”, Arad ISBN 978-973-664-436-8, Ed. Victor Babes, Timisoara 2010, ISBN 978-606-8054-14-8 (IN EXTENSO)
7. Tarata M, Wolf W, Daniel Georgescu, Dragos Alexandru, Mircea Serbanescu, Trusca Eugen, Vladut Gabriel, Velica Viorel- A method of quantitative monitoring of neuromuscular fatigue in pilots, ROMEDINF 2010 - the 31st National Conference on Medical Informatics, Arad, 18-20 noiembrie 2010 In: Solution-based Medical Informatics, Proceedings of the 31-st Romanian National Conference on Medical Informatics, Ed. Univ. “Vasile Goldis”, Arad ISBN 978-973-664-436-8, Ed. Victor Babes, Timisoara 2010, ISBN 978-606-8054-14-8 (IN EXTENSO)
8. Mircea Șerbănescu, Mihai Tărâță, W Wolf, Daniel Georgescu, Dragoș Alexandru -A System of Quantitative Exploration of the Stretch Reflex - Programming Paradigm, ROMEDINF 2010-the 31st National Conference on Medical Informatics, Arad, 18-20 noiembrie 2010 In: Solution-based Medical Informatics, Proceedings of the 31-st Romanian National Conference on Medical Informatics, Ed. Univ. “Vasile Goldis”, Arad ISBN 978-973-664-436-8, Ed. Victor Babes, Timisoara 2010, ISBN 978-606-8054-14-8 (IN EXTENSO)
9.Alexandru D., Gaman Amelia, Taisescu C., Tanasie R., Popescu G.- Metode de predare multimedia aplicabile in preclinic, Zilele U.M.F. din Craiova 40 de ani de învăţământ medical superior 4-5 iunie 2010
10. Tarata M., Georgescu D., Alexandru D., Serbanescu M.-Informatica medicala - cercetari interdisciplinare fundamentale si clinice, Zilele U.M.F. din Craiova 40 de ani de învăţământ medical superior 4-5 iunie 2010
2011 1.Alexandru D., Georgescu M., Cătălin B., Georgescu D., Iancău Maria (2011) Morpho-functional Novelties
Concerning the Retina and Visual Prosthesis, Current Health Sciences Journal Vol. 37, No. 1, 31-38 (IN EXTENSO)
2.Tarata M., Wolf W., Georgescu D., Alexandru D., Serbanescu M. (2011) Monitoring Neuromuscular Fatigue – A Noninvasive Approach, MEDITECH 2011, IFMBE Proceedings, 2011, Volume 36, Part 2, 144-147 (IN EXTENSO)

21
3.Sustar M, Alexandru D, Brecelj J (2011) Modeling of the scotopic ERG intensity series, Abstract book – XLIX Meeting of the International Society for Clinical Electrophysiology of Vision
4.Tarata M., Wolf W., Dragomir D., Georgescu D., Alexandru D., Trusca E.,. Serbanescu M (2011) Noninvasive monitoring of neuromuscular fatigue in occupational ergonomics – application in pilots, Proceedings of the XXIIIrd Annual International Occupational Ergonomics and Safety Conference Baltimore, Maryland, USA 9-10 June 2011, International Society of Occupational Ergonomics and Safety ISBN # 97809652558-8-2, eds. BF Ware, AR Kumar, JE Fernandez, 118-123 (IN EXTENSO)
5.Alexandru D. O., Georgescu M., Catalin B., Georgescu D., Iancau M (2011) Software for simulating the processing of visual stimuli in the retina. Proceedings of the 8th IBRO World Congress of Neuroscience, Floreta, Italia, 14 – 18 iulie 2011
6. Catalin B, Georgescu D, Alexandu D, Georgescu M, Enescu-Bieru D., Balseanu A, Sfredel V, Romanescu F, Mitran S, Iancau M - Variability of visual evoked potentials parameters using color stimulation., A 3-a Conferintă Natională de Neurofiziologie Clinică ASNER 2011, 23-25 septembrie, Bucuresti
7. Alexandru D.O., Catalin B., Georgescu D., Iancău Maria (2011) Introducerea ERG ca investigaţie clinică uzuală, ZileleU.M.F. din Craiova Ediţia a XLI-a 3-4 iunie 2011
12. Member of Professional Associations: - SRSF – Romanian Society of Physiology 13. Known languages: English, Italian, French 14. Experience (including managerial experience) in other national/international projects:
Program/ Project Function Period Scientific equipment and experiments for monitoring neuromuscular fatigue in pilots during dynamic effort.– “AEXON”
Research assistant
01.10.2008-30.09.2011
Quantifying the effects of regulating and molecular cell factors of the micro-environment on immune tolerance during anti-inflammatory and anti-tumoral therapy – “IMUNOTER”
Research assistant
01.10.2008-31.19.2011
Implementing modern methods of teaching/learning/evaluation in practical physiopathology - POSDRU ID 15265
Long term expert
01.04.2009-31.03.2010
The value of imunochemistry markers, molecular and immunological markers in the evolution of rheumatoid arthritis.
Research assistant
01.10.2006- 30.09.2008
The study of biological markers in the cancer genesis and oral mucosa neoplasia prediction.
Research assistant
01.10.2006- 30.09.2008
15. Specializations and qualifications: - Cardiology clinical stage in Santiago de Compostella, Spain – august 2003 (IFMSA scholarship); - the course "Training in the D.R.G Codes and Information” - mai-Junie 2005 - Ph.D. scholarship in Oftalmology Departament in Universitary Hospital of Ljubliana / Slovenia Neuro-physiology Diagnostic Unit under coordination of Prof. Brecelj Jelka, under the contract POSDRU/6/1.5/S/8 "SPRIJINIREA TINERILOR DOCTORANZI CU FRECVENŢĂ PRIN ACORDAREA DE BURSE DOCTORALE" – ID 7603, 1 august – 31 October 2010