
Measuring a Utility-Scale Turbine Wake Using the TTUKa Mobile

Proceedings of the 2nd Marine Energy Technology SymposiumMETS2014
April 15-18, 2014, Seattle, WA
REYNOLDS NUMBER DEPENDENCE OF CROSS-FLOW TURBINE PERFORMANCEAND NEAR-WAKE CHARACTERISTICS
Peter Bachant ⇤
Center for Ocean Renewable EnergyUniversity of New Hampshire
Durham, NH, USA
Martin WosnikCenter for Ocean Renewable Energy
University of New HampshireDurham, NH, USA
ABSTRACTMinimizing wake losses in wind or marine hydrokinetic
(MHK) turbine arrays is a crucial design consideration, as it hasa large impact on overall energy production. To understand andmitigate these losses, interactions between turbine wakes must beaccurately predicted, with near-wakes being especially importantfor cross-flow (or vertical-axis) turbines, given their affinity forclose-spaced operation. As numerical models become more ac-curate, validation efforts will need to take into account scale dis-crepancies between the numerical and physical models and theirreal-world applications. One such important scaling parameter isthe Reynolds number, and it remains unclear what level of con-fidence can be placed in models validated away from full-scaleReynolds numbers. In other words, what is the minimum accept-able scale mismatch for experimental validation at which modelscan be said to be “accurate enough?” To address this uncertainty,we investigated—experimentally and numerically—the effectsof Reynolds number on the performance and near-wake char-acteristics of a 3-bladed cross-flow turbine. Mechanical poweroutput and overall streamwise drag were measured in a towingtank at turbine diameter Reynolds numbers ReD = U•D/n =0.3–1.3⇥106, with performance becoming essentially Reynoldsnumber independent at ReD = 0.8⇥106, corresponding to an av-erage blade chord Reynolds number Rec ⌘ lU•c/n ⇡ 2.1⇥105.Detailed measurements of the near-wake one turbine diameterdownstream were acquired via acoustic Doppler velocimetry foreach Reynolds number case, showing very slight differences inthe mean velocity, turbulence intensity, and Reynolds stress atthe turbine mid-height plane, i.e., the near-wake statistics wereless Reynolds number dependent than the turbine performance.The wake was also simulated using a 2-D Reynolds-averaged
⇤Corresponding Author: [email protected]
Navier–Stokes (RANS) model. The performance results showpoor agreement with the experimental data, due to 2-D block-age and the neglecting of blade end effects, however, an increasein performance with Re is predicted. The CFD predictions forwake characteristics are reasonably accurate on the side of theturbine where blades are turning back into the direction of theflow, or where dynamic stall is occurring, but Reynolds numberdependence is much more exaggerated compared with the exper-imental data.
NOMENCLATUREl Turbine tip speed ratio wR/U•.n Fluid (water) kinematic viscosity.w Turbine shaft angular velocity.r Fluid density.s Turbine solidity.A Turbine frontal area.c Turbine blade chord length.CP Turbine power coefficient.CD Turbine rotor drag coefficient.D Turbine diameter.H Turbine height.N Number of turbine blades.Rec Approximate turbine blade chord Reynolds number.ReD Reynolds number based on turbine diameter.T Turbine shaft torque.U• Free stream or tow carriage velocity.
INTRODUCTIONThe US Department of Energy predicts a steady growth of
contributions from renewable sources to our energy supply, in-
1
cluding from wind energy and marine hydrokinetic (MHK) en-ergy [1]. Toward this end, cross-flow turbines are receiving re-newed interest, both for MHK applications in tidal [2], river-ine [3] or canal currents [4], as well as for deep-water offshorefloating wind farms in the US [5] and Europe [6].
Cross-flow turbines, which can be installed in vertical-axisor horizontal-axis orientation, have some key advantages overaxial-flow, horizontal-axis turbines. They are insensitive to vari-ations in flow direction, eliminating the need for a yaw control.They also generally do not require a blade pitching mechanism.For vertical-axis wind turbines, generators and gearboxes can beplaced lower in the assembly, increasing stability. This makesvertical axis turbines an attractive option for deep water wind.Cross-flow turbines have some disadvantages when compared toaxial-flow turbines, including somewhat lower energy conver-sion efficiency and unsteady loading of blades/rotor and powertrain due to their operating principle.
Also of interest are the potential advantages for turbine ar-rays constructed from cross-flow turbines due to their uniquewake dynamics. Firstly, wakes from devices in close proxim-ity have been shown to interact constructively, improving poweroutput of turbines in excess of their stand-alone performance [7].Secondly, these turbines have been shown to allow more closelyspaced arrays compared with conventional axial-flow devices,potentially resulting in more efficient land or channel use [8].
It should be noted that MHK energy conversion is expectedto be environmentally benign, for example the first experimentswith MHK cross-flow turbines and live fish at two laboratoriesdemonstrated fish survival rates approaching 100%, close to in-distinguishable from control populations [9, 10].
To effectively design individual cross-flow turbines andcross-flow turbine arrays it is important to understand the kineticenergy conversion process and the resulting turbine wake andits recovery, in particular the near-wake structure, to accuratelypredict interactions between turbine wakes of closely spaced de-vices.
Generally, analytical and numerical predictions used in en-gineering are tested with physical models, for which it is oftenimpractical, cost prohibitive, or impossible to match all relevantscales, e.g., the Reynolds number, based on on turbine diame-ter, ReD, or blade chord, Rec. In these cases, it is importantto be aware of the effects of these scale discrepancies, since a“validated” model may in fact produce unreliable predictions ifextrapolated to full-scale.
As it remains unclear what level of confidence can be placedin models validated away from full-scale Reynolds numbers, inthe present study the effects of Reynolds number on the per-formance and near-wake characteristics of a 3-bladed cross-flowturbine were investigated—both experimentally and numerically.Mechanical power output and overall streamwise drag were mea-sured in a towing tank over a range of turbine diameter Reynoldsnumbers of ReD = 0.3–1.3⇥106. Detailed measurements of the
near-wake one turbine diameter downstream were acquired viaacoustic Doppler velocimetry for each Reynolds number case,from which differences in the mean velocity, turbulence inten-sity, and Reynolds stress profiles are highlighted. The turbineand its near-wake were also simulated using an unsteady 2-DReynolds-averaged Navier–Stokes (RANS) model. In this paperthe numerical results are compared with the experimental data,evaluating this particular model’s ability to predict various quan-tities of interest and how these change with Reynolds number.
Effects of Reynolds NumberFor axial-flow (commonly referred to as horizontal-axis) tur-
bines, small changes in angle of attack a of the local relativewind w.r.t. blade chord occur throughout blade rotation, and aredue to mean shear in the boundary layer (which can also causevarying deformation) or turbulence. This means it’s relativelyeasy to predict turbine performance with models that employstatic foil section data, e.g., blade element momentum (BEM)methods.
For cross-flow turbines, on the other hand, dramatic oscil-lations in a occur as a blade rotates about the turbine axis, andturbine blades are often undergoing dynamic stall during peakpower output, which exceeds predictions based on static foildata [11]. Even so, static foil performance data, e.g. [12], showa strong dependence of (CL/CD)max on (Rec), with magnitude of(CL/CD)max and a at which (CL/CD)max occurs increasing withincreasing ReD. It follows that cross-flow turbine performanceshould also depend on Reynolds number, which is shown in,e.g., [13]. Bravo et al. [14] observed Reynolds number indepen-dence in power production for a vertical-axis turbine in a windtunnel for ReD = O(106), where O indicates order of magnitude,though it is unclear whether relevant wake statistics follow thesame trend.
Since utility-scale cross-flow turbines will reach ReD =O(107), in this study we sought to investigate/confirm Reynoldsnumber independence of performance around ReD = O(106), butmore importantly the dependence on detailed wake characteris-tics, since these are the drivers of wake recovery, and thereforearray performance.
EXPERIMENTAL SETUPTurbine Model
A three-bladed vertical-axis rotor was developed by the Uni-versity of New Hampshire Center for Ocean Renewable Energy(UNH-CORE) [15], in the spirit of, but not geometrically iden-tical to, the DOE Reference Model turbine designed by SandiaNational Laboratory in 2011 [16], dubbed “RVAT” (ReferenceVertical Axis Turbine) or “RM2” (Reference Model 2). An ini-tial design rendering (not shown in [16]) depicted two verticalaxis rotors installed in close proximity.
2
The UNH-RVAT is a 1 m diameter, 1 m tall three-bladedcross-flow turbine, constructed from 0.14 m chord NACA 0020blades, resulting in a solidity s = Nc/(pD) = 0.13, which issomewhat higher that of the Sandia RVAT rotor [16]. For this ex-periment, the blades were fixed at half-chord and mid-span, withzero preset pitch. The blade attachment struts were also builtfrom NACA 0020 foils, and fixed to a 9.5 cm diameter shaft. Adrawing of the UNH-RVAT turbine is shown in Figure 1.
���P�
� ��P�
FIGURE 1. CAD DRAWING OF THE UNH-RVAT WITH COU-PLING HUBS INSTALLED.
Facility and InstrumentationExperiments were performed in UNH’s tow/wave tank, a
36.6 m long facility with a 3.66 m wide by 2.44 m deep cross-section. Carriage motion is actuated by a permanent magnet ser-vomotor and timing belt, providing highly accurate tow veloci-ties, which are also measured independently by a 10 µm resolu-tion linear encoder.
The turbine was installed in the tow tank’s turbine test bedsupport frame, which is built from NACA 0020 struts, mountedto the carriage via linear bearings, allowing a pair of 2.2 kN ca-pacity S-beam load cells to measure total streamwise drag (alsocalled thrust). The model turbine had an 11% blockage ratiobased on its frontal area. The turbine shaft was loaded by a servomotor and gearhead, which provided precise control of mean tur-bine tip speed ratio. Shaft torque was measured with an InterfaceT8 200 Nm capacity inline torque transducer mounted betweenthe servo motor and turbine shaft. Signals from the torque trans-ducer and drag load cells were sampled at 2 kHz via NationalInstruments 9205 and 9237 modules, respectively. Turbine shaft
angle was sampled from the servo drive’s 105 count/rev emu-lated quadrature encoder output by a National Instruments 9401counter module. Turbine power was calculated from the mea-sured torque and angular velocity, which was computed by dif-ferentiating the shaft angle time series with a second order cen-tral difference scheme. Turbine shaft torque was corrected forbearing friction by adding a tare torque, measured in air by driv-ing the turbine shaft with the servo motor. Similarly, drag valueswere corrected by subtracting the tare drag, measured by tow-ing the test frame with the turbine removed. A schematic of theturbine and instrumentation installed in the tank cross-section isshown in Figure 2 and a photograph of the experimental setupwith the RVAT installed is shown in Figure 3.
3.66 m
1.24 m
2.44 m
Vectrino probeTurbine
Torque transducer
2X load cells
Servo motor
Hydrofoil frame
Guy wires
FIGURE 2. SCHEMATIC OF THE EXPERIMENTAL SETUP.
A Nortek Vectrino+ acoustic Doppler velocimeter (ADV),sampling at 200 Hz, was used to measure wake velocity. The de-vice is capable of measuring all three orthogonal components ofvelocity simultaneously with an accuracy of ±0.5% its measuredvalue ±1 mm/s. The ADV was mounted on an automated ver-tical and cross-stream positioning system at 1 turbine diameterdownstream (x/D = 1) from the turbine axis, the coordinate sys-tem for which is shown in Fig. 4. The turbine was towed throughthe tank at constant velocity. Tip speed ratio was set via the servodrive and its mean value held constant (l = 1.9) during each tow.To ensure repeatability of experimental conditions, an appropri-ate minimum tank settling time between tows for each tow speedwas determined using ADV measurements taken after a tow ateach speed.
3

FIGURE 3. PHOTOGRAPHS OF THE EXPERIMENTAL SETUPIN THE UNH TOW/WAVE TANK WITH RVAT INSTALLED.
PREVIOUS CHARACTERIZATION OF THE UNH-RVATBaseline experiments with the UNH-RVAT previously re-
ported in [15] included measurements of rotor power, drag (orthrust), tip speed ratio, and detailed maps of mean flow and turbu-lence components in the near-wake at a single Reynolds number.This baseline performance data are also being used by SandiaNational Laboratories to validate their CACTUS performanceprediction model for the US Department of Energy ReferenceModel turbines [18].
Representative turbine power and drag coefficients areshown in Figures 5 and 6, respectively. The drag coefficientcurve increases monotonically with tip speed ratio, as expected.The power coefficient curve also looks similar in shape to previ-ous experiments with vertical axis turbines, reaching a maximumvalue of 26% at a tip speed ratio l = 1.9. It should be notedthat the UNH-RVAT was not designed to have the highest powercoefficient possible, only to provide a high fidelity data set fora simple turbine model at reasonably high Reynolds numbers.Also note that the power coefficient for higher-solidity turbines
[�'� ��
\
[
Ȧ
8�
:DNH�PHDVXUHPHQW�SODQH
FIGURE 4. TOP VIEW OF TURBINE AND MEASUREMENT CO-ORDINATE SYSTEM.
of this type is quite sensitive to blade mounting location, and canlikely be improved, c.f. [17].
0.0 0.5 1.0 1.5 2.0 2.5 3.0 3.5
�
�0.10
�0.05
0.00
0.05
0.10
0.15
0.20
0.25
0.30
CP
FIGURE 5. MEASURED TURBINE POWER COEFFICIENT VER-SUS TIP SPEED RATIO, FROM [15].
In the previous experiment, transverse wake profiles in thenear-wake at x/D = 1 were obtained at various heights from thehorizontal turbine center plane up to z/H = 5/8, with a rangeof y/R = ±3, as shown in Figure 7. Here z/H = 0 corresponds
4

0.0 0.5 1.0 1.5 2.0 2.5 3.0 3.5
�
0.0
0.2
0.4
0.6
0.8
1.0
1.2
CD
FIGURE 6. MEASURED TURBINE DRAG COEFFICIENT VER-SUS TIP SPEED RATIO, FROM [15].
to the half-height (center) of the turbine. Mean and fluctuatingstreamwise velocity contours for the turbine operating at a tipspeed ratio l = 1.9, corresponding to maximum power output inFigure 5, are shown in Figure 8. These plots show, in a statis-tical sense, the complex asymmetry and three-dimensionality ofthe wake of this turbine. The flow is seen to accelerate aroundthe turbine due to blockage, also creating strong downward meanflow and streamwise vorticity. The peak momentum deficit oc-curs away from the center line at positive values of y/R, while themajority of turbulence intensity occurs around y/R = �1, show-ing evidence of separated flow, likely due to blades in dynamicstall, and also near the top of the turbine, due to blade tip vor-tex shedding. Turbulence was found to be approximately locallyisotropic at x/D = 1, i.e., sv and sw contours are similar to thoseof su shown in Figure 8 [15].
���
������
�����
�������
��������
�����
�����
������
�����
������
�����
������
�����
������
���������
�����
�����
�����
������
�������
�������
�������
��������
�������
��������
�������
��������
�������
�������
�
�����
������
��
������
�
�������
������
������
������
��������
��
������
�����
������
�
�������
������
������
��
������
�������
�������
������
��
������
�
������
��
�������
�������
\
]
785%,1(�)5217�9,(:�)/2:�,172�3$*(�
$//�',0(16,216�,1�0(7(56�81/(66�63(&,),('�27+(5:,6(
6ROLG:RUNV�(GXFDWLRQDO�(GLWLRQ��)RU�,QVWUXFWLRQDO�8VH�2QO\�
FIGURE 7. FRONT (DOWNSTREAM) VIEW OF TURBINEWAKE MEASUREMENT LOCATIONS FROM [15]. DIMENSIONSARE IN METERS
�3 �2 �1 0 1 2 3y/R
0.000.130.250.380.500.63
z/H
0.15 0.30 0.45 0.60 0.75 0.90 1.05 1.20u/U�
�3 �2 �1 0 1 2 3y/R
0.000.130.250.380.500.63
z/H
0.02 0.06 0.10 0.14 0.18 0.22 0.26 0.30 0.34�u/U�
FIGURE 8. CONTOURS OF NORMALIZED STREAMWISE VE-LOCITY MEAN (TOP) AND STANDARD DEVIATION (BOTTOM)AT x/D = 1 AND l = 1.9, FROM [15]. SOLID BLACK LINES INDI-CATE TURBINE FRONTAL AREA.
NUMERICAL SETUPThe numerical model used here is based on an unsteady
Reynolds-averaged Navier-Stokes (RANS) approach. The two-equation k–w SST turbulence model [19] is used to close theequations. The k–w SST (shear stress transport) formulationcombines the desirable features of the standard k–w model (byWilcox) to be well-behaved in adverse pressure gradient and sep-arating flows (essential for cross-flow turbines) with the desirablefeatures of a standard k–e closure model in the free stream. Thenumerical model was implemented in the open-source CFD plat-form OpenFOAM version 2.3.0.
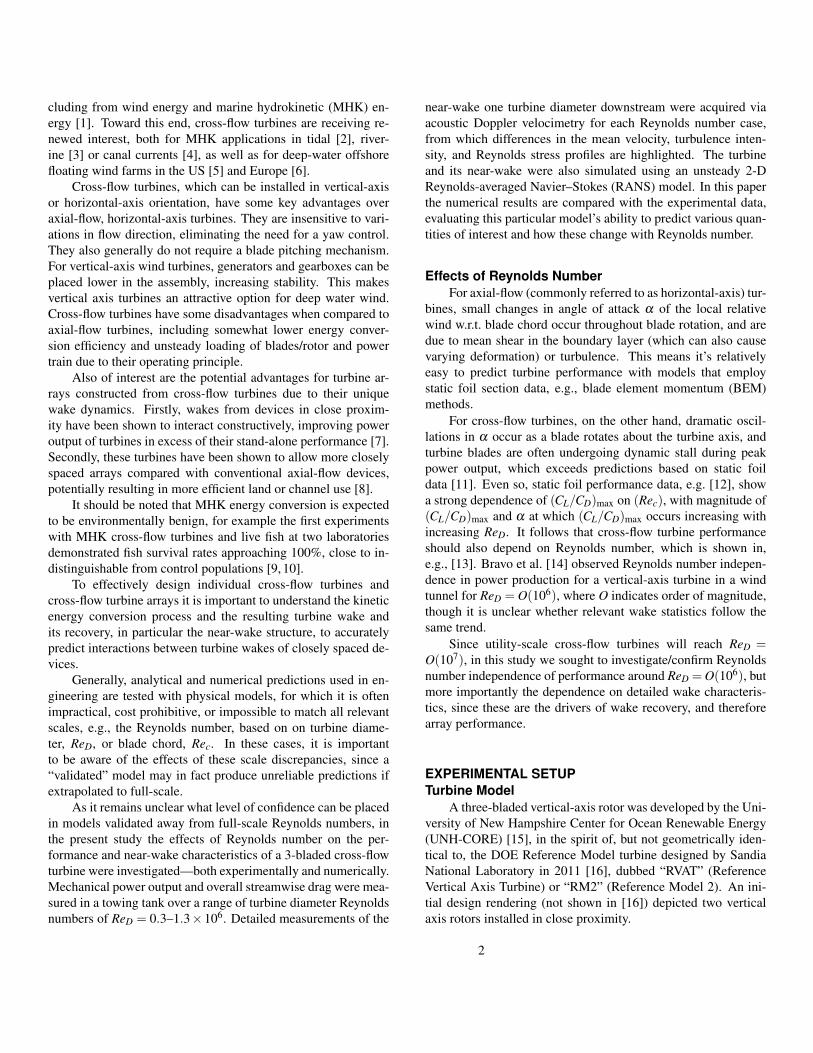
The UNH-RVAT geometry is located inside a two dimen-sional mesh, containing a circular rotating region, which ismatched to a larger, non-rotating domain that extends 1.52 mupstream and 2.16 m downstream from the turbine axis. Sim-ulations were tested for sensitivity to mesh refinement, whichinitially showed poor results (judged by comparison to the ex-perimental data) for very fine mesh resolution, thus a slightlycoarser mesh was chosen. Nonetheless, the final mesh is stillhighly resolved with viscous lengths on the surface of the foils,y+ ⌘ u⇤y/n ⇠ 1. A sample mesh used for the 2-D simula-tion is shown in Figure 9. For each Reynolds number case—since viscosity is the only parameter adjusted to change Reynoldsnumber—the entire mesh is scaled proportionally such that y+ atthe first cell next to the turbine blades is approximately equal forall. Boundary conditions at the walls are set to mimick a towing
5
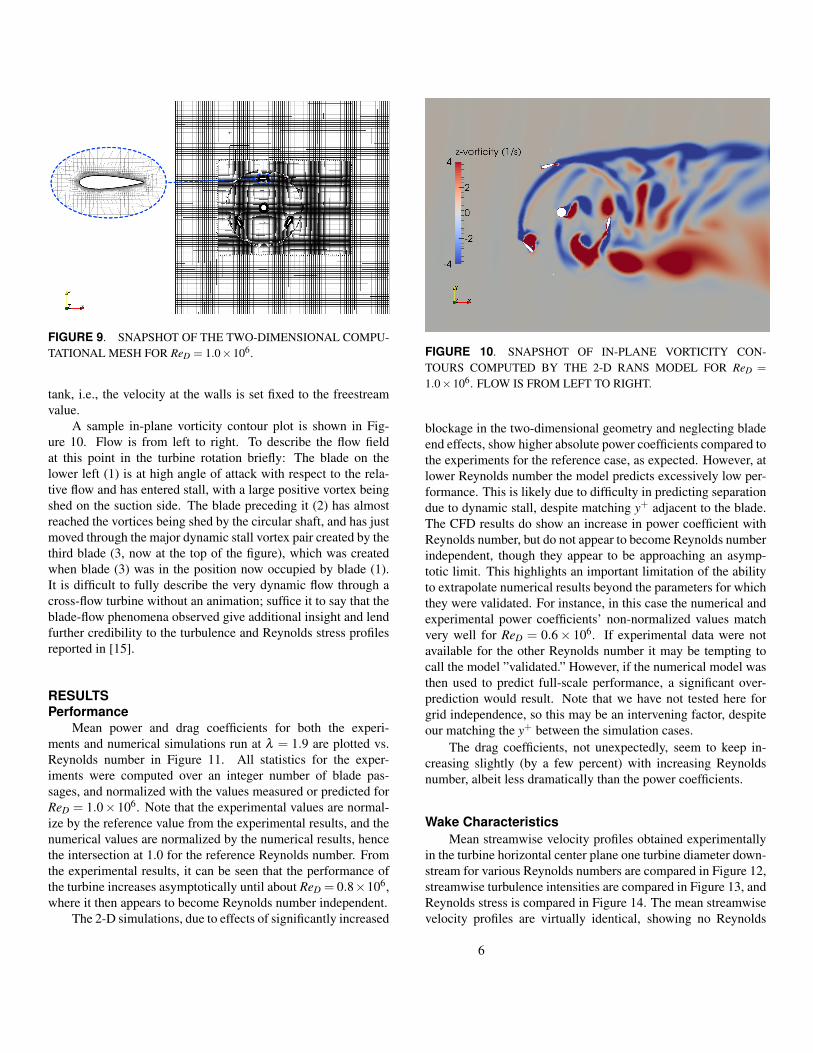
FIGURE 9. SNAPSHOT OF THE TWO-DIMENSIONAL COMPU-TATIONAL MESH FOR ReD = 1.0⇥106.
tank, i.e., the velocity at the walls is set fixed to the freestreamvalue.
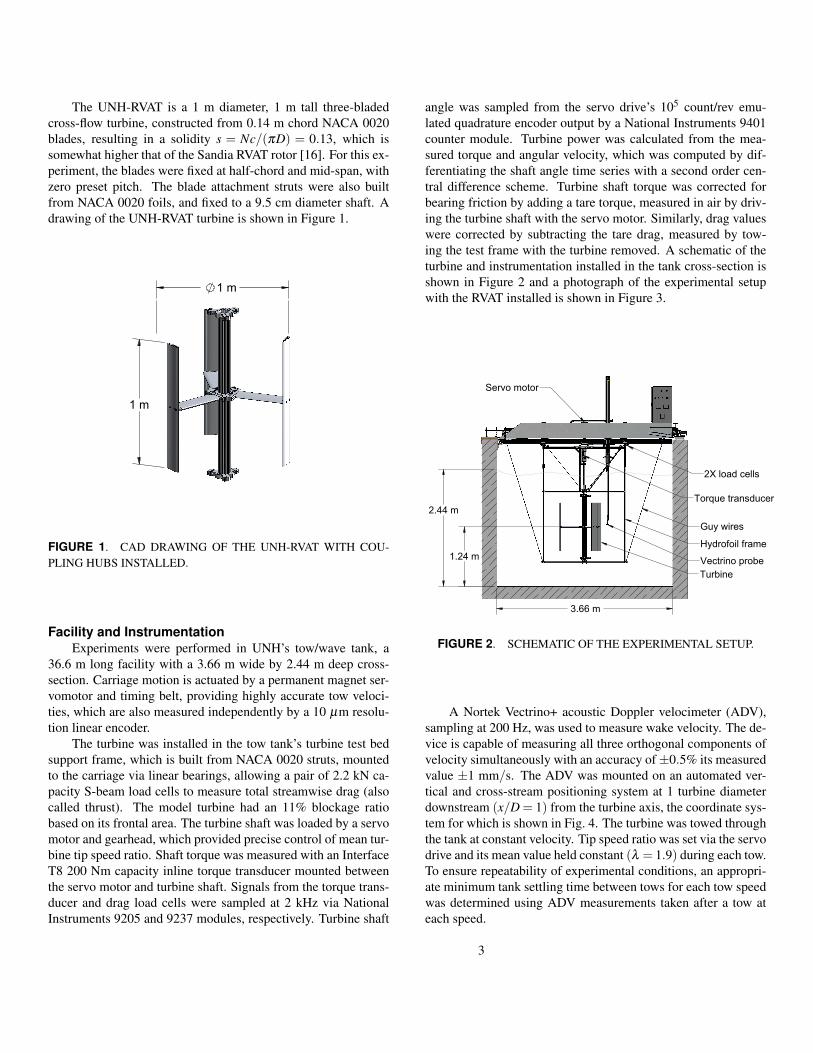
A sample in-plane vorticity contour plot is shown in Fig-ure 10. Flow is from left to right. To describe the flow fieldat this point in the turbine rotation briefly: The blade on thelower left (1) is at high angle of attack with respect to the rela-tive flow and has entered stall, with a large positive vortex beingshed on the suction side. The blade preceding it (2) has almostreached the vortices being shed by the circular shaft, and has justmoved through the major dynamic stall vortex pair created by thethird blade (3, now at the top of the figure), which was createdwhen blade (3) was in the position now occupied by blade (1).It is difficult to fully describe the very dynamic flow through across-flow turbine without an animation; suffice it to say that theblade-flow phenomena observed give additional insight and lendfurther credibility to the turbulence and Reynolds stress profilesreported in [15].
RESULTSPerformance
Mean power and drag coefficients for both the experi-ments and numerical simulations run at l = 1.9 are plotted vs.Reynolds number in Figure 11. All statistics for the exper-iments were computed over an integer number of blade pas-sages, and normalized with the values measured or predicted forReD = 1.0 ⇥ 106. Note that the experimental values are normal-ize by the reference value from the experimental results, and thenumerical values are normalized by the numerical results, hencethe intersection at 1.0 for the reference Reynolds number. Fromthe experimental results, it can be seen that the performance ofthe turbine increases asymptotically until about ReD = 0.8⇥106,where it then appears to become Reynolds number independent.
The 2-D simulations, due to effects of significantly increased
FIGURE 10. SNAPSHOT OF IN-PLANE VORTICITY CON-TOURS COMPUTED BY THE 2-D RANS MODEL FOR ReD =
1.0⇥106. FLOW IS FROM LEFT TO RIGHT.
blockage in the two-dimensional geometry and neglecting bladeend effects, show higher absolute power coefficients compared tothe experiments for the reference case, as expected. However, atlower Reynolds number the model predicts excessively low per-formance. This is likely due to difficulty in predicting separationdue to dynamic stall, despite matching y+ adjacent to the blade.The CFD results do show an increase in power coefficient withReynolds number, but do not appear to become Reynolds numberindependent, though they appear to be approaching an asymp-totic limit. This highlights an important limitation of the abilityto extrapolate numerical results beyond the parameters for whichthey were validated. For instance, in this case the numerical andexperimental power coefficients’ non-normalized values matchvery well for ReD = 0.6 ⇥ 106. If experimental data were notavailable for the other Reynolds number it may be tempting tocall the model ”validated.” However, if the numerical model wasthen used to predict full-scale performance, a significant over-prediction would result. Note that we have not tested here forgrid independence, so this may be an intervening factor, despiteour matching the y+ between the simulation cases.
The drag coefficients, not unexpectedly, seem to keep in-creasing slightly (by a few percent) with increasing Reynoldsnumber, albeit less dramatically than the power coefficients.
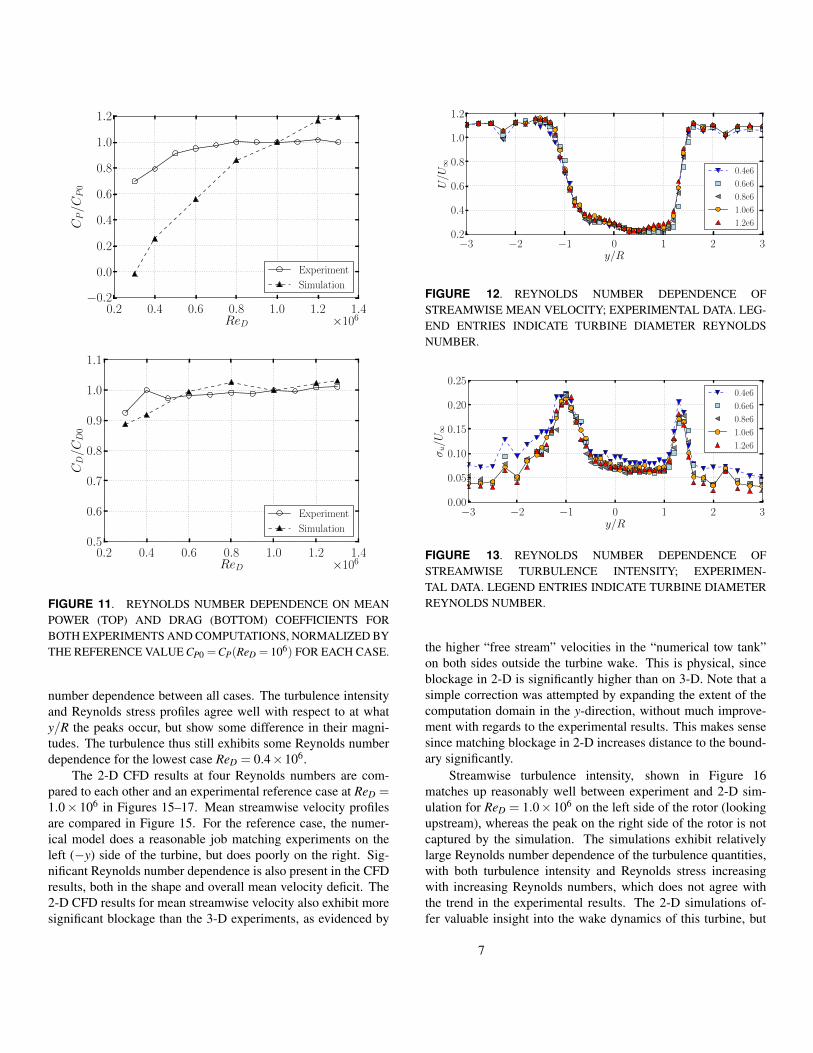
Wake CharacteristicsMean streamwise velocity profiles obtained experimentally
in the turbine horizontal center plane one turbine diameter down-stream for various Reynolds numbers are compared in Figure 12,streamwise turbulence intensities are compared in Figure 13, andReynolds stress is compared in Figure 14. The mean streamwisevelocity profiles are virtually identical, showing no Reynolds
6
0.2 0.4 0.6 0.8 1.0 1.2 1.4ReD ⇥106
�0.2
0.0
0.2
0.4
0.6
0.8
1.0
1.2
CP/C
P0
Experiment
Simulation
0.2 0.4 0.6 0.8 1.0 1.2 1.4ReD ⇥106
0.5
0.6
0.7
0.8
0.9
1.0
1.1
CD/C
D0
Experiment
Simulation
FIGURE 11. REYNOLDS NUMBER DEPENDENCE ON MEANPOWER (TOP) AND DRAG (BOTTOM) COEFFICIENTS FORBOTH EXPERIMENTS AND COMPUTATIONS, NORMALIZED BYTHE REFERENCE VALUE CP0 =CP(ReD = 106) FOR EACH CASE.
number dependence between all cases. The turbulence intensityand Reynolds stress profiles agree well with respect to at whaty/R the peaks occur, but show some difference in their magni-tudes. The turbulence thus still exhibits some Reynolds numberdependence for the lowest case ReD = 0.4⇥106.
The 2-D CFD results at four Reynolds numbers are com-pared to each other and an experimental reference case at ReD =1.0 ⇥ 106 in Figures 15–17. Mean streamwise velocity profilesare compared in Figure 15. For the reference case, the numer-ical model does a reasonable job matching experiments on theleft (�y) side of the turbine, but does poorly on the right. Sig-nificant Reynolds number dependence is also present in the CFDresults, both in the shape and overall mean velocity deficit. The2-D CFD results for mean streamwise velocity also exhibit moresignificant blockage than the 3-D experiments, as evidenced by
�3 �2 �1 0 1 2 3y/R
0.2
0.4
0.6
0.8
1.0
1.2
U/U
�
0.4e6
0.6e6
0.8e6
1.0e6
1.2e6
FIGURE 12. REYNOLDS NUMBER DEPENDENCE OFSTREAMWISE MEAN VELOCITY; EXPERIMENTAL DATA. LEG-END ENTRIES INDICATE TURBINE DIAMETER REYNOLDSNUMBER.
�3 �2 �1 0 1 2 3y/R
0.00
0.05
0.10
0.15
0.20
0.25
�u/U
�
0.4e6
0.6e6
0.8e6
1.0e6
1.2e6
FIGURE 13. REYNOLDS NUMBER DEPENDENCE OFSTREAMWISE TURBULENCE INTENSITY; EXPERIMEN-TAL DATA. LEGEND ENTRIES INDICATE TURBINE DIAMETERREYNOLDS NUMBER.
the higher “free stream” velocities in the “numerical tow tank”on both sides outside the turbine wake. This is physical, sinceblockage in 2-D is significantly higher than on 3-D. Note that asimple correction was attempted by expanding the extent of thecomputation domain in the y-direction, without much improve-ment with regards to the experimental results. This makes sensesince matching blockage in 2-D increases distance to the bound-ary significantly.
Streamwise turbulence intensity, shown in Figure 16matches up reasonably well between experiment and 2-D sim-ulation for ReD = 1.0⇥106 on the left side of the rotor (lookingupstream), whereas the peak on the right side of the rotor is notcaptured by the simulation. The simulations exhibit relativelylarge Reynolds number dependence of the turbulence quantities,with both turbulence intensity and Reynolds stress increasingwith increasing Reynolds numbers, which does not agree withthe trend in the experimental results. The 2-D simulations of-fer valuable insight into the wake dynamics of this turbine, but
7

�3 �2 �1 0 1 2 3y/R
�0.015
�0.010
�0.0050.000
0.005
0.010
0.015
0.020
0.025
u0 v
0 /U
2 �
0.4e6
0.6e6
0.8e6
1.0e6
1.2e6
FIGURE 14. REYNOLDS NUMBER DEPENDENCE OF u0v0
REYNOLDS STRESS; EXPERIMENTAL DATA. LEGEND ENTRIESINDICATE TURBINE DIAMETER REYNOLDS NUMBER.
must be viewed as preliminary until further verification, valida-tion, and/or results from 3-D simulations are available.
�3 �2 �1 0 1 2 3y/R
0.0
0.2
0.4
0.6
0.8
1.0
1.2
1.4
U/U
�
Exp.
0.4e6
0.6e6
0.8e6
1.0e6
1.2e6
FIGURE 15. REYNOLDS NUMBER DEPENDENCE OF MEANSTREAMWISE VELOCITY; EXPERIMENT (REFERENCE CASEAT ReD = 1.0 ⇥ 106) VERSUS PRELIMINARY 2-D CFD RESULTS.LEGEND ENTRIES INDICATE TURBINE DIAMETER REYNOLDSNUMBER.
CONCLUSIONSExperiments and numerical simulations were performed for
a cross-flow turbine at Reynolds number based on turbine di-ameter from ReD = 0.3 ⇥ 106 to ReD = 1.3 ⇥ 106 to investigateReynolds number effects on performance and near-wake charac-teristics.
The experimental results presented seem to indicate thatthe performance of the UNH-RVAT cross-flow turbine becomesReynolds number independent at ReD ⇡ 106, corresponding to anaverage blade chord Reynolds number Rec ⌘ lU•c/n ⇡ 2⇥105.From the experimental results, no significant Reynolds number
�3 �2 �1 0 1 2 3y/R
0.00
0.05
0.10
0.15
0.20
0.25
0.30
�u/U
�
Exp.
0.4e6
0.6e6
0.8e6
1.0e6
1.2e6
FIGURE 16. REYNOLDS NUMBER DEPENDENCE OFSTREAMWISE TURBULENCE INTENSITY; EXPERIMENT(REFERENCE CASE AT ReD = 1.0⇥106) VERSUS PRELIMINARY2-D CFD RESULTS. LEGEND ENTRIES INDICATE TURBINEDIAMETER REYNOLDS NUMBER.
�3 �2 �1 0 1 2 3y/R
�0.01
0.00
0.01
0.02
0.03
0.04
u0 v
0 /U
2 �
Exp.
0.4e6
0.6e6
0.8e6
1.0e6
1.2e6
FIGURE 17. REYNOLDS NUMBER DEPENDENCE OF u0v0
REYNOLDS STRESS; EXPERIMENT (REFERENCE CASE ATReD = 1.0 ⇥ 106) VERSUS PRELIMINARY 2-D CFD RESULTS.LEGEND ENTRIES INDICATE TURBINE DIAMETER REYNOLDSNUMBER.
dependence was found for mean streamwise velocity profiles,however, and a very small Reynolds number dependence was ob-served for turbulence intensity and Reynolds stresses.
Preliminary results from 2-D RANS simulations with a k–wSST turbulence closure model over-predict performance for thereference case of ReD = 1.0⇥106, due to the increased blockagein two versus three dimensions, and the exclusion of tip effects.The numerical results show much stronger Reynolds number de-pendence than the experimental results. Mean velocity and tur-bulence profiles obtained with the 2-D simulation compare rea-sonably well with experiments on one side of the turbine for thereference case, but show exaggerated Reynolds number depen-dence. This lends credibility to the numerical approach takenhere, though shows that great care must be taken during verifica-tion and validation to apply the model at varying scales.
8

Future work will include three dimensional simulations, andanalysis of Reynolds number effects on cross-stream and verticalcomponents of the near-wake flow from both simulations and ex-periments. Ultimately, this research seeks to produce a more ac-curate parameterization—or actuator model—for improving tur-bine array engineering.
ACKNOWLEDGMENTThe authors would like to acknowledge funding through a
National Science Foundation CAREER award (PI Wosnik, NSF-CBET 1150797, program manager Dr. Gregory Rorrer), a grantthrough the Leslie S. Hubbard Marine Program Endowment topurchase acoustic flow measurement instrumentation, and a grantfor laboratory infrastructure upgrades through the US Depart-ment of Energy. The authors also thank Vincent Lyon for as-sistance during the experiments.
REFERENCES[1] U.S. Energy Information Administration, 2012. Annual en-
ergy outlook 2012. Tech. rep., U.S. Department of Energy.[2] Ocean Renewable Power Company, 2012. America’s first
ocean energy delivered to the grid, September.[3] Alaska Energy Wiki, 2014. Hydrokinetic energy (in-river,
tidal, and ocean current).[4] Instream Energy, 2014. Project profile: Roza Canal
Yakima hydrokinetic project, January.[5] Sutherland, H. J., Berg, D. E., and Ashwill, T. D., 2012.
A retrospective of VAWT technology. Tech. rep., SandiaNational Laboratories.
[6] Paulsen, U. S., Pedersen, T. F., Madsen, H. A., Enevold-sen, K., Nielsen, P. H., Hattel, J., Zanne, L., Battisti,L., Brighenti, A., Lacaze, M., Lim, V., Heinen, J. W.,Berthelsen, P. A., Carstensen, S., de Ridder, E.-J., van Bus-sel, G., and Tescione, G., 2011. “Deepwind an innova-tive wind turbine concept for offshore”. In Proceedings ofEWEA.
[7] Li, Y., and Calsal, S. M., 2010. “Modeling of twin-turbine systems with vertical axis tidal current turbines:Part Ipower output”. Ocean Engineering, 37, pp. 627–637.
[8] Dabiri, J., 2011. “Potential order-of-magnitude enhance-ment of wind farm power density via counter-rotatingvertical-axis wind turbine arrays”. Journal of Renewableand Sustainable Energy, 3.
[9] Amaral, S., Perkins, N., Giza, D., and McMahon, B., 2011.Evaluation of fish injury and mortality associated with hy-drokinetic turbines. Tech. Rep. 1024569, Electric PowerResearch Institute.
[10] Castro-Santo, T., and Haro, A., 2012. Survival and behaviorof juvenile atlantic salmon and adult american shad on ex-
posure to a hydrokinetic turbine. Tech. rep., Electric PowerResearch Institute.
[11] Paraschivoiu, I., 2002. Wind Turbine Design with Empha-sis on Darrieus Concept, 1st ed. Polytechnic International,Montreal, Quebec, Canada.
[12] Sheldahl, R., and Klimas, P., 1981. Aerodynamic charac-teristics of seven symmetrical airfoil sections through 180-degrees angle of attack for use in aerodynamic analysis ofvertical axis wind turbines. Final report SAND80-2114,Sandia National Laboratories, Albuquerque, NM, March.
[13] Yang, B., and Shu, X. W., 2012. “Hydrofoil optimizationand experimental validation in helical vertical axis turbinefor power generation from marine current”. Ocean Engi-neering, 42, pp. 35–46.
[14] Bravo, R., Tullis, S., and Ziada, S., 2007. “Performancetesting of a small vertical-axis wind turbine”. In Proceed-ings of the 21st Canadian Congress of Applied MechanicsCANCAM.
[15] Bachant, P., and Wosnik, M., 2013. “Performance and near-wake measurements for a vertical axis turbine at moderateReynolds number”. In Proceedings of the ASME FluidsEngineering Division Summer Meeting, no. FEDSM2013-16575.
[16] Barone, M., Griffith, T., and Berg, J., 2011. Referencemodel 2: rev 0 rotor design. Tech. Rep. SAND2011-9306,Sandia National Laboratories, November.
[17] Fiedler, A. J., and Tullis, S., 2009. “Blade offset and pitcheffects on a high solidity vertical axis wind turbine”. WindEngineering, 33, pp. 237–246.
[18] Neary, V., Fontaine, A., Bachant, P., Wosnik, M., Michelen,C., Meyer, R., Gunawan, B., and Straka, W., 2013. “US De-partment of Energy (DOE) national lab activities in marinehydrokinetics: Scaled model testing of DOE reference tur-bines”. In Proceedings of European Wave and Tidal EnergyConference EWTEC.
[19] Menter, F., 1994. “Two-equation eddy-viscosity turbulencemodels for engineering applications”. AIAA Journal, 32,pp. 1598–1605.
9


