Reward System Design and Group Creativity: An Experimental Investigation · · 2010-04-10Reward...
45
Reward System Design and Group Creativity: An Experimental Investigation Clara Xiaoling Chen University of Illinois at Urbana-Champaign [email protected] Michael G. Williamson The University of Texas at Austin [email protected] Flora H. Zhou University of Illinois at Urbana-Champaign [email protected] April 2010 Acknowledgements: We have received helpful comments on previous drafts from Willie Choi, Steve Kachelmeier, Mark Peecher, Dan Stone, Ken Trotman, and workshop participants at the University of Illinois at Urbana-Champaign, University of Kentucky, University of Texas at Austin, and the AAA Management Accounting Section Mid-Year Meeting. We thank Oliver Toubia for providing and allowing us to adapt his ideation software program for our study. Clara Xiaoling Chen and Flora H. Zhou are grateful to the Campus Research Board at the University of Illinois at Urbana-Champaign for generous financial support.
-
Upload
phungkhuong -
Category
Documents
-
view
216 -
download
1
Transcript of Reward System Design and Group Creativity: An Experimental Investigation · · 2010-04-10Reward...

Reward System Design and Group Creativity:
An Experimental Investigation
Clara Xiaoling Chen University of Illinois at Urbana-Champaign
Michael G. Williamson The University of Texas at Austin
Flora H. Zhou University of Illinois at Urbana-Champaign
April 2010
Acknowledgements: We have received helpful comments on previous drafts from Willie Choi, Steve Kachelmeier, Mark Peecher, Dan Stone, Ken Trotman, and workshop participants at the University of Illinois at Urbana-Champaign, University of Kentucky, University of Texas at Austin, and the AAA Management Accounting Section Mid-Year Meeting. We thank Oliver Toubia for providing and allowing us to adapt his ideation software program for our study. Clara Xiaoling Chen and Flora H. Zhou are grateful to the Campus Research Board at the University of Illinois at Urbana-Champaign for generous financial support.

Reward System Design and Group Creativity: An Experimental Investigation
ABSTRACT
We report the results of an experiment where three-person groups develop a creative solution to an important problem. In this environment, we investigate how the following two dimensions of reward system design affect the efficacy of creativity-based incentives: (1) whether creativity is measured at the individual or group level, and (2) whether incentives on this measure take the form of a linear piece-rate or tournament. Relative to our piece-rate pay conditions, group-based (intergroup) tournament pay had a positive effect and individual-based (intragroup) tournament pay had no effect on the creativity of the group solution. We also find support for our theory-based process model suggesting that intergroup tournament pay leads to greater group cohesion and collaboration, which lead group members to identify to a greater extent with group objectives, which ultimately leads to a more creative group solution. Further validating this model, individual-based (intragroup) tournaments motivate group members to independently work harder on their individual inputs, but these efforts do not lead to greater creativity. Collectively, our results suggest that considering the interactive effects of the level and form of reward system design helps overcome obstacles identified by prior research that limit the effectiveness of creativity-contingent incentives. Keywords: reward system design; incentives; creativity; groups; tournaments Data Availability: The experimental data are available upon request.

Reward System Design and Group Creativity: An Experimental Investigation
I. INTRODUCTION
In our rapidly changing and highly competitive business environment, organizations
often look to employee groups for a creative solution to an important problem (e.g., see
Thompson and Choi 2006). For example, corporations such as General Electric and Procter &
Gamble form employee teams to develop a creative product or solution to meet a specified
customer need (Nussbaum 2005). Moreover, manufacturing companies such as John Deere and
Caterpillar increasingly look to groups of production-level employees for a creative, efficiency-
enhancing way to organize production (e.g., see Miller and O'Leary 1994; Sprinkle and
Williamson 2004).
A challenge for management accountants is designing reward systems to incentivize
group creativity (Kaplan and Norton 1996, Ch. 5). To help gain a better understanding of how
organizations can effectively address this challenge, we examine how two important dimensions
of reward system design affect the efficacy of creativity-contingent incentives. First, we examine
whether creativity is measured and rewarded at either the individual or group level. Second, we
examine whether the creativity-contingent incentive takes the form of either a linear piece-rate or
a tournament.
Prior research documents several obstacles that would limit the effectiveness of
creativity-contingent incentives at either the individual or group level. For example, consistent
with theory suggesting that creativity is a dimension of performance that does not respond well
to individuals’ independent efforts (e.g., see Amabile 1996), prior research demonstrates that
reward systems motivating individuals to independently work harder at being creative often do
not lead to more creative output (e.g., see Kachelmeier et al. 2008). Tying rewards to a group-
1

based measure of creativity could potentially enhance creativity by increasing collaborative
efforts (e.g., see Toubia 2006; Adler and Chen 2009). However, prior research highlights that
groups often do not capitalize on these opportunities due to obstacles such as free riding and
evaluation apprehension (i.e., anxieties that fellow group members will evaluate ideas
unfavorably) (Paulus 2000). Such obstacles would limit the effectiveness of group-based
creativity incentives.
Despite pessimistic findings from prior research, we argue that the effectiveness of
creativity-based incentives in group settings can be enhanced by considering the interactive
effects of the level at which organizations reward creativity and the specific form that these
incentives take (Bonner et al. 2000; Bonner and Sprinkle 2002; Sprinkle 2003; Sprinkle and
Williamson 2007). Specifically, prior research investigating creativity-contingent incentives
primarily utilizes linear piece-rate pay (Sprinkle 2008). We develop and test a process model
suggesting that group-based (intergroup) tournament pay helps overcome obstacles that would
otherwise limit the effectiveness of group-based creativity incentives.
Drawing on research in psychology and organizational behavior, our process model
suggests that intergroup competition sparked by group-based tournament pay promotes group
cohesiveness and collaboration. That is, intergroup competition can serve as a powerful
solidarity mechanism that enhances the psychological bond among group members, decreases
evaluation apprehension, and increases the extent ideas are freely exchanged (Bornstein 2003).
This greater group cohesion and collaboration is posited to lead group members to identify more
strongly with group activities and objectives, leading them to believe that they can achieve group
objectives through collective, coordinated efforts rather than independent individual efforts (e.g.,
see Brewer 1979; Tajfel and Turner 1986; van Knippenberg 2000). Ultimately, enhanced
2
cohesion, collaboration, and group identification is posited to lead to more creative group
solutions. That is, by increasing cohesion, collaboration, and group identification, group-based
tournaments will induce group members to be more willing to share their ideas, build on each
others’ ideas (which would enhance the creativity of individual inputs), and coordinate with each
other to transform these inputs into a creative group solution.
In addition to testing our theoretical model examining whether the tournament form of
compensation increases the efficacy of group-based creativity incentives, we examine the effects
of individual-based (intragroup) tournament pay to further validate our model. Prior research
demonstrates that intragroup tournaments motivate individuals to independently work harder on
their individual inputs (Drake et al. 1999). However, such individual efforts are unlikely to
facilitate the exchange of ideas among group members or the coordination of idea generation
among group members, both of which may be essential for group creativity. To the extent that
(1) our model suggesting that reward systems spark group creativity by promoting cohesion,
collaboration, and group identification is descriptive, and (2) prior research suggesting that one
cannot be more creative by simply independently working harder generalizes to our setting, we
do not expect individual-based tournament pay to enhance the creativity of a group’s solution.
Therefore, we predict that the level of creativity-contingent incentives and the specific
form of these incentives will interact to affect the effectiveness of creativity-contingent
incentives at promoting group creativity. Specifically, we posit that relative to piece-rate pay,
group-based tournament pay will have a positive effect and individual-based tournament pay will
not have a positive effect on the creativity of a group’s solution to a problem.
We test our hypothesis using a laboratory experiment where one-hundred eighty
undergraduate students, in groups of three, developed, via computer interaction, a creative
3
solution (i.e., a solution that is “original, innovative, and implementable within a reasonable
budget”) to an assigned campus problem. We manipulated two factors between subjects at two
levels each. First, we tied participant pay to a measure of either the creativity of the group’s
solution or the creativity of individual input to the group’s solution, both as assessed by an
independent panel of raters. Second, participants received either a linear piece-rate based on their
assigned measure or participated in a winner-take-all tournament. Here, either groups competed
against two other groups in their session based on the creativity of the group’s solution (an
intergroup tournament) or individuals competed against their other two group members based on
the creativity of their individual inputs to the group solution (an intragroup tournament). Across
all four conditions, we held average participant compensation constant.
We find our predicted interaction. Relative to the piece-rate incentive conditions, group-
based tournaments had a positive effect and individual-based tournaments had no effect on the
creativity of the group solution. Consistent with our process model, group-based tournaments led
to higher reported levels of group cohesion and collaboration, leading to greater identification
with the group objective, which ultimately led to a more creative group solution. Further
validating our model, intragroup tournaments motivated group members to independently work
harder on individual inputs, but such individual efforts did not lead to either a more creative
group solution or even more creative individual inputs to the group solution.
Our results make important contributions. First, our results suggest that considering the
interactive effects of the level and form of reward system design helps overcome obstacles
identified by prior research that limit the effectiveness of creativity-contingent incentives. In
particular, group-based tournament pay that can promote cohesion, collaboration, and group
4

identification can lead to greater creativity without incurring the costs of measuring and
rewarding individual collaborative efforts (e.g., see Toubia 2006).
In doing so, we also contribute to research investigating the efficacy of tournament pay
(e.g., see Young et al. 1993; Drake et al. 1999; Hannan et al. 2008). By simultaneously studying
the effects of both group-based and individual-based tournaments as well as illustrating the
process through which intergroup competition promotes higher group performance, we gain a
better understanding of when this incentive mechanism can be effective (Luft and Shields 2003).
For example, while Drake et al. (1999) suggest that tournament pay does not lead to higher group
performance on a collaborative task, they focus solely on individual-based (intragroup)
tournaments.
Finally, our results contribute to a better understanding of observations from practice.
Case and field studies illustrate that, when desiring group creativity, organizations often induce
intergroup competition (Amabile and Gryskiewiecz 1987). For example, manufacturing
organizations such as Caterpillar threaten to close and eliminate the jobs of all but the most
innovative production facilities (Arnold 1998). Moreover, organizations relying on creative
solutions to meet customer needs such as Johnson and Johnson often invest heavily in
competitive budgeting systems that reward members of the most innovative project teams with
greater investment and pay (Simons 2000). Our paper presents and tests a theoretical model that
can help explain why these practices have evolved in organizations.
We describe the background of our study and develop hypothesis in Section II.
Section III explains the method and design, Section IV presents results, and Section V concludes.
5

II. BACKGROUND, THEORY, AND HYPOTHESIS
Background
In organizations, creative endeavors such as developing a proposal to address an
important organizational problem often take place in group settings (Thompson and Choi 2006).
In a group setting, creativity can arise not only from the individual creativity of group members,
but also through collaboration and teamwork. Group members have the opportunity to build on
each others’ diverse ideas, which could enhance the creativity of individual inputs (Toubia
2006). Additionally, groups can further enhance the creativity of their output by effectively
coordinating with each other to transform these individual inputs into a more creative group
solution (Adler and Chen 2009).
In order to achieve this desired outcome, a management accounting solution would be to
tie employee pay to a measure of group creativity (e.g., the creativity of the group’s solution to
the organization’s problem).1 That said, prior research suggests that obstacles would limit the
effectiveness of a group-based creativity incentive. For example, free-riding (social loafing) is
prevalent in group creativity settings as it is in many settings examining group-based rewards
(Paulus 2000). Moreover, evaluation apprehension further limits individual contributions in
group creativity settings. That is, many individuals are anxious sharing creative ideas, which by
their nature are different, fearing others will evaluate them unfavorably (e.g., see Paulus et al.
2006).
To overcome these concerns, organizations may have the opportunity to measure and
reward creativity at the individual rather than the group level. That is, organizations may tie
rewards to the creativity of employee input to the group solution in order to motivate employees
1 In our setting, the group’s objective is to develop a single creative proposal. Throughout the remainder of the paper, we refer to the creativity of this proposal as group creativity.
6
to independently work harder at being creative. However, prior research suggests that obstacles
may also limit the effectiveness of individual-based creativity incentives. For example, theory
suggests that creativity does not arise simply from motivating individuals to independently work
harder (Amabile 1996). Recent research in accounting supports this premise. For example, in
settings without opportunities for collaboration, this research finds that reward systems
motivating individuals to work harder at being creative do not lead to more creative output
(Kachelmeier et. al 2008; Kachelmeier and Williamson 2010).
In sum, obstacles limit both individual and group-level creativity-contingent incentives.
Moreover, we are unaware of prior research examining the relative effectiveness of individual
versus group level creativity-contingent incentives at promoting group creativity. Thus, it is
difficult to predict whether we would observe a main effect of the level of creativity-contingent
incentives.
That said, prior research investigating creativity-contingent incentives focuses primarily
on something akin to piece-rate pay where better performance results in strictly higher rewards
(Sprinkle 2008). When designing reward systems, organizations must consider more than just the
level of performance-contingent incentives, but also other important dimensions of reward
system design such as the specific form these incentives take (Bonner et al. 2000; Bonner and
Sprinkle 2002; Sprinkle 2003; Sprinkle and Williamson 2007). In the next section, we present
theory suggesting that the level of creativity-contingent incentives (individual versus group) and
the specific form of these incentives (piece-rate versus tournament) interact to affect the efficacy
of creativity-contingent incentives.
7
Theory and Hypothesis
In this section, we use theory from psychology and organizational behavior to develop a
process model suggesting that, relative to piece-rate pay, tournament pay can more effectively
promote group creativity if it induces competition at the group rather than individual level. We
summarize this model in Figure 1. We first discuss the effects of moving from the piece-rate to
the tournament form of compensation when pay is contingent on a measure of group creativity.
Next, we discuss the effects of moving from piece-rates to tournaments when pay is contingent
on an individual measure of creativity.
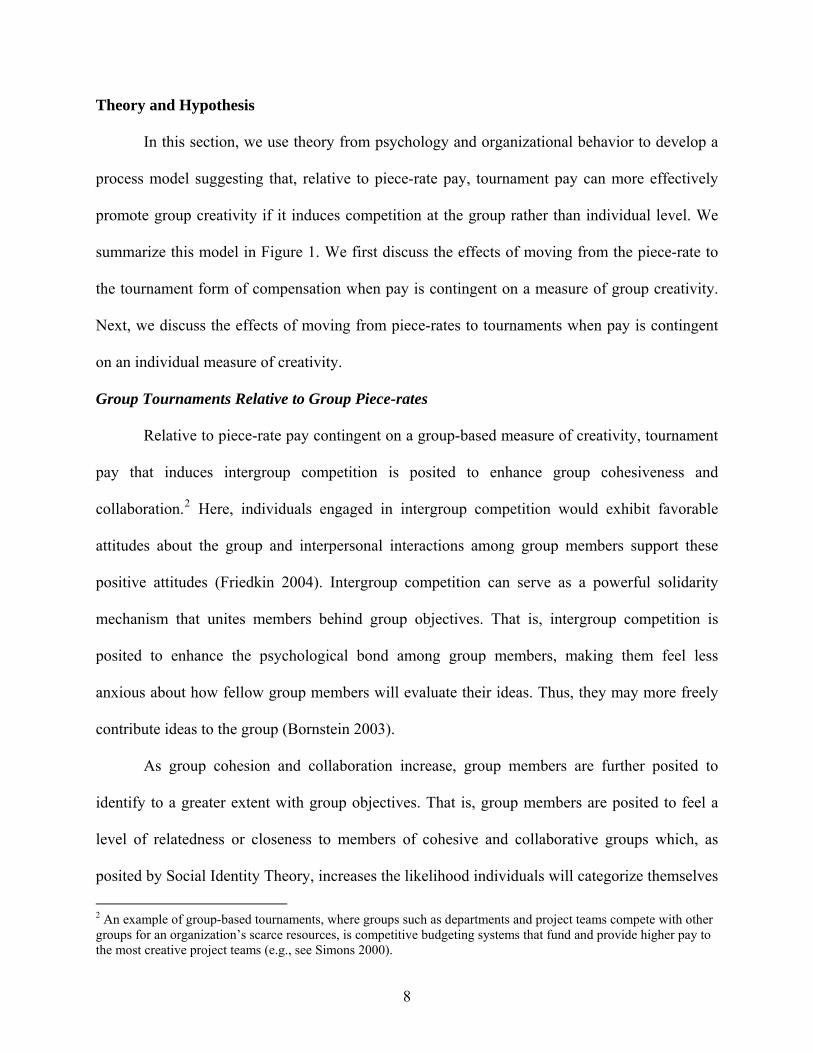
Group Tournaments Relative to Group Piece-rates
Relative to piece-rate pay contingent on a group-based measure of creativity, tournament
pay that induces intergroup competition is posited to enhance group cohesiveness and
collaboration.2 Here, individuals engaged in intergroup competition would exhibit favorable
attitudes about the group and interpersonal interactions among group members support these
positive attitudes (Friedkin 2004). Intergroup competition can serve as a powerful solidarity
mechanism that unites members behind group objectives. That is, intergroup competition is
posited to enhance the psychological bond among group members, making them feel less
anxious about how fellow group members will evaluate their ideas. Thus, they may more freely
contribute ideas to the group (Bornstein 2003).
As group cohesion and collaboration increase, group members are further posited to
identify to a greater extent with group objectives. That is, group members are posited to feel a
level of relatedness or closeness to members of cohesive and collaborative groups which, as
posited by Social Identity Theory, increases the likelihood individuals will categorize themselves
2 An example of group-based tournaments, where groups such as departments and project teams compete with other groups for an organization’s scarce resources, is competitive budgeting systems that fund and provide higher pay to the most creative project teams (e.g., see Simons 2000).
8

as a member of the group and adopt group goals as personal goals (Deci et al. 1989; Richer et al.
2002; Tajfel and Turner 1986). When individuals identify with a group, they tend to believe that
they can achieve group objectives through coordinated, collective efforts rather than
independent, individual efforts, and therefore are more likely to exert discretionary effort to
achieve collective goals, to focus on collective outcomes rather than individual rewards, and to
maintain their commitment to the collective even when it does not benefit them individually
(Brewer 1979; Chen et al. 1998; Ellemers et al. 2004; van Knippenberg 2000). These benefits
should help further facilitate collaboration, mitigate free riding, and decrease evaluation
apprehension.
Finally, Figure 1 illustrates that these processes will ultimately lead to greater group
creativity. That is, group members likely would be more willing to both work harder on the
group task and to share and build on each other’s ideas which would enhance the creativity of
individual inputs. Additionally, these group members would also likely coordinate more
effectively to transform these individual inputs into a more creative group solution.
Individual Tournaments Relative to Individual Piece-rates
Relative to piece-rate pay contingent on the creativity of individual input to the group
solution, research illustrates that individual (intragroup) tournaments motivate individuals to
independently work harder on their individual inputs.3 For example, in a laboratory experiment
where three-person groups each produced a subcomponent of a castle from toy blocks, Drake et
al. (1999) identified conditions where intragroup tournament pay increased independent
individual efforts (i.e., individuals produced more units of their castle subcomponent). However,
such individual efforts are unlikely to facilitate exchange of ideas among group members or
3 Examples of individual-based (intragroup) tournaments, where individuals compete against members of their own departments or teams, include competition for scarce promotion opportunities or a fixed bonus pool (Milgrom and Roberts 1992, Ch. 11).
9

coordination of idea generation among group members, both of which are essential for group
creativity.
Examining the effects of individual tournament pay in a group creativity setting provides
the opportunity to further validate our theory-based process model (Figure 1). If motivating
independent individual efforts do not enhance group creativity, then we provide further support
for our model suggesting that reward systems designed to enhance group creativity should
encourage collaborative efforts. That said, this result is not a foregone conclusion as some argue
that independent individual efforts can lead to greater group creativity by sparking creative
individual inputs (e.g., see Paulus 2000; Pirola-Merlo and Mann 2004 for reviews).
Ultimately, to the extent that (1) results from individual creativity settings suggesting that
independent efforts do not enhance creativity generalize to our setting, and (2) our model
suggesting that reward systems spark group creativity by promoting cohesion, collaboration, and
group identification is descriptive, we do not expect individual-based tournaments to have a
positive effect on group creativity.4
Hypothesis
Collectively, theory suggests that group-based tournament pay leads to greater cohesion
and collaboration, which lead group members to identify to a greater extent with group
objectives, which ultimately leads to a more creative group solution. By contrast, individual-
based tournament pay leads group members to independently work harder on their individual
inputs, which will not lead to a more creative group solution. Therefore, we predict that the level
4 Here, whether individual (intragroup) tournaments have no or a negative effect on group creativity depends on the influence of this incentive mechanism on cohesion, collaboration, and group identification. While prior research suggests that intragroup tournament pay leads individuals to sabotage the efforts of others, which would likely have a negative effect on these group processes (Drake et al. 1999), group members do not have clear opportunities to sabotage the individual efforts (e.g., disrupt the thoughts) of others in our group creativity setting. Thus, intragroup tournaments would not necessarily decrease these group processes relative to individual piece-rates.
10

of creativity-contingent incentives and the specific form of these incentives will interact to affect
the effectiveness of creativity-contingent incentives at promoting group creativity such that:
Hypothesis: Relative to piece-rate pay, group-based tournament pay will have a positive effect and individual-based tournament pay will have a non-positive effect on the creativity of a group’s solution to a problem.
III. METHOD
Participants
We recruited 180 undergraduate student volunteers from upper-level business classes of a
large state university to participate in one of ten 75-minute experimental sessions (nine to
eighteen participants per session). Of the participants, 17 percent were sophomores, 73.5 percent
were juniors, and 9.5 percent were seniors, with 48 percent of the participants being female. We
randomly assigned participants into three-person groups and all group interaction occurred via
computer. To ensure anonymity, we assigned each participant a code consisting of a group
number and one of three letters (i.e., A, B, or C).
Experimental Procedures
At the start of each session, participants read through a set of instructions on their
computer screen. The appendix provides the experimental instructions, including a screen shot
summarizing the screen functions of the computer program that facilitated group-member
interactions. After reading the instructions, individuals practiced using the software. No
communication with group members took place during the practice session. Any questions and
confusions regarding the functioning of the software were resolved during the practice session.
After the practice session and before the start of the actual ideation generation, participants read
about the incentive scheme they were assigned to, which was located on the top right corner of
their computer screen. As a manipulation check, participants were asked to answer a pre-
11

experimental question regarding the incentive scheme immediately following their reading of the
incentive scheme. We checked every participant’s answer to make sure that they understood their
incentive scheme before we started the idea generation session. In the idea generation
session, each three-person group spent 30 minutes developing a specific proposal for a creative
use for an abandoned house located on their college campus. Consistent with the psychology
literature (e.g., see Amabile 1996), a creative use was defined as “a use that is original,
innovative, and implementable within a reasonable budget.” We provided each group with a
brief history and a floor plan of the two-story house.
During the 30-minute proposal development phase, group members interacted via a
collaborative “ideation program” (Toubia 2006). The ideation program organizes group member
inputs in trees where initial thoughts or ideas, “parent-ideas,” are placed far left of the screen and
follow-up ideas, “child-ideas,” are placed below the existing ideas in which the child-idea
relates. Participants, at any time during the experiment, could choose to either contribute a new
parent-idea or build upon an existing idea. Each idea was labeled with the identification code of
the group member providing the input.
For example, a group member initiated the parent-idea, “Experimental house for energy
efficiency.” Under this parent-idea, a group member added the following child-idea, “Moreover,
part of the project could be addressing how to modernize energy consumption while keeping
historical significance intact.” While the group developed this proposal, another group member
added another parent-idea, “historical museum for children,” which was also further developed
with child-ideas.
Participants could also provide comments on any idea in a tree. Group members often
used comments to coordinate group efforts. For example, participants used comments such as,
12
“we need to discuss what to put in the [museum],” to focus the group’s effort. Additionally,
groups used the comment function for general discussion about the ideas such as one group
member commenting, “there are already so many [restaurants] on campus, do you think it would
work?” To which another group member responded, “that could work because [the house] is on
the other side of campus where there aren’t many eating places.” Each comment was labeled
with the identification code of the group member providing it.
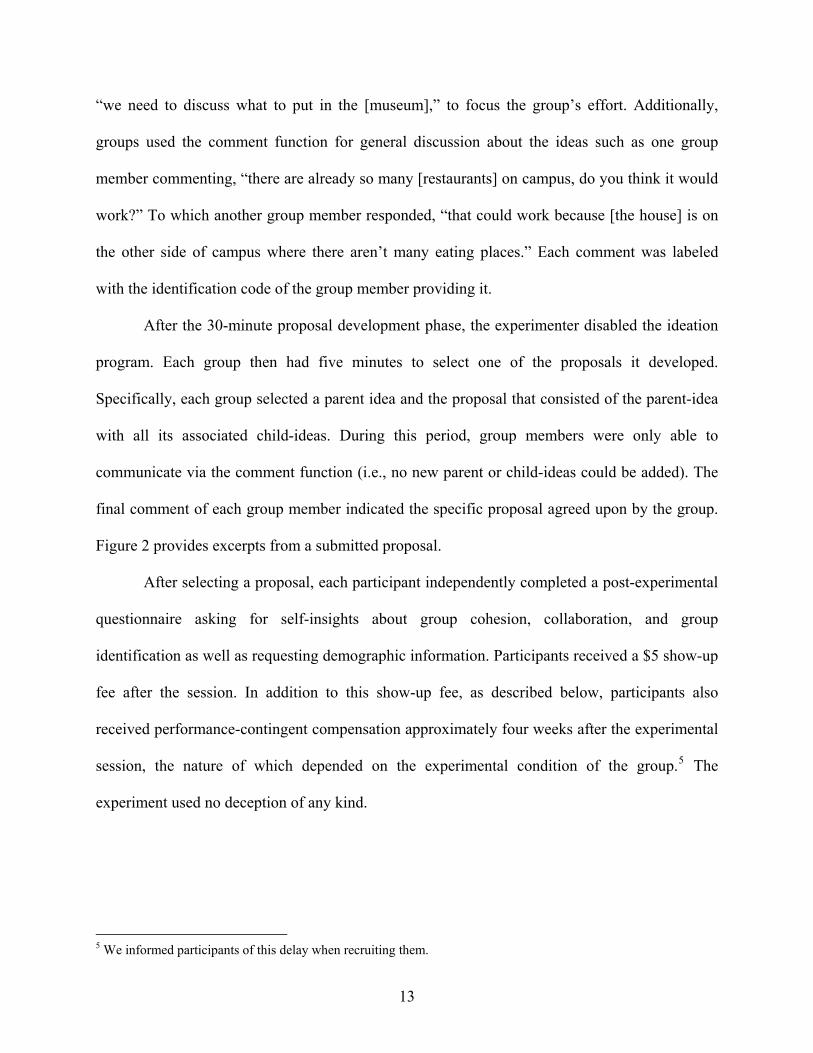
After the 30-minute proposal development phase, the experimenter disabled the ideation
program. Each group then had five minutes to select one of the proposals it developed.
Specifically, each group selected a parent idea and the proposal that consisted of the parent-idea
with all its associated child-ideas. During this period, group members were only able to
communicate via the comment function (i.e., no new parent or child-ideas could be added). The
final comment of each group member indicated the specific proposal agreed upon by the group.
Figure 2 provides excerpts from a submitted proposal.
After selecting a proposal, each participant independently completed a post-experimental
questionnaire asking for self-insights about group cohesion, collaboration, and group
identification as well as requesting demographic information. Participants received a $5 show-up
fee after the session. In addition to this show-up fee, as described below, participants also
received performance-contingent compensation approximately four weeks after the experimental
session, the nature of which depended on the experimental condition of the group.5 The
experiment used no deception of any kind.
5 We informed participants of this delay when recruiting them.
13
Experimental Design
We randomly assigned each three-member group to one of four experimental conditions
created by manipulating two dimensions of participants’ reward system in a between-subjects
design. We describe these two factors below.
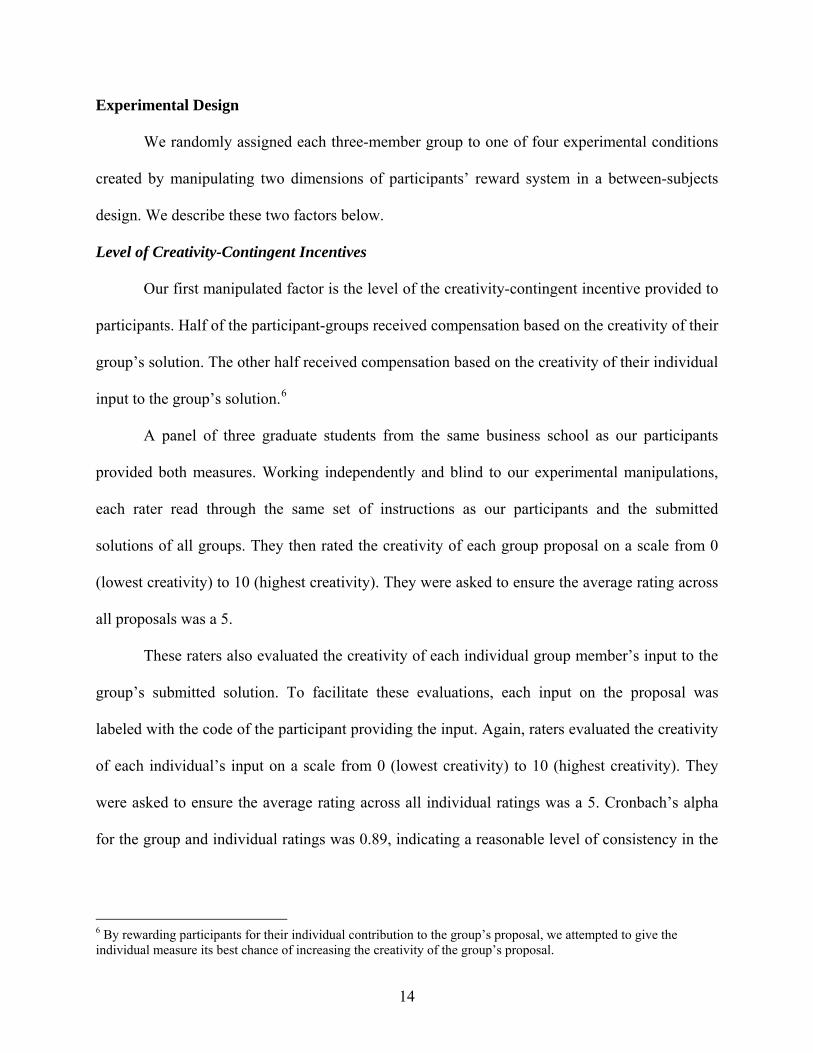
Level of Creativity-Contingent Incentives
Our first manipulated factor is the level of the creativity-contingent incentive provided to
participants. Half of the participant-groups received compensation based on the creativity of their
group’s solution. The other half received compensation based on the creativity of their individual
input to the group’s solution.6
A panel of three graduate students from the same business school as our participants
provided both measures. Working independently and blind to our experimental manipulations,
each rater read through the same set of instructions as our participants and the submitted
solutions of all groups. They then rated the creativity of each group proposal on a scale from 0
(lowest creativity) to 10 (highest creativity). They were asked to ensure the average rating across
all proposals was a 5.
These raters also evaluated the creativity of each individual group member’s input to the
group’s submitted solution. To facilitate these evaluations, each input on the proposal was
labeled with the code of the participant providing the input. Again, raters evaluated the creativity
of each individual’s input on a scale from 0 (lowest creativity) to 10 (highest creativity). They
were asked to ensure the average rating across all individual ratings was a 5. Cronbach’s alpha
for the group and individual ratings was 0.89, indicating a reasonable level of consistency in the
6 By rewarding participants for their individual contribution to the group’s proposal, we attempted to give the individual measure its best chance of increasing the creativity of the group’s proposal.
14
ratings. Thus, we averaged the three ratings to obtain our measure of group and individual
creativity.7
To help validate the graduate student ratings, we also asked an expert to provide
creativity ratings. Specifically, we asked a manager from the campus historic preservation office
who is in charge of the abandoned house to rank order six group proposals. We pre-selected
these proposals such that they were uniformly distributed across our entire range of creativity
ratings. Expert rankings corresponded perfectly with the rank order of our average creativity
ratings.
Form of Creativity-Contingent Incentives
Our second manipulated factor is the specific form of the creativity-contingent incentive.
We paid half of our participant-groups a linear piece-rate based on their assigned performance
measure. The other half of our participants received tournament pay where the participant or
group performing best on their assigned performance measure, out of three competitors, received
higher compensation. Here, those rewarded based on group creativity competed against two
other groups in their session (i.e., an intergroup tournament), and those rewarded based on
individual creativity competed against their two other group members (i.e., an intragroup
tournament).
Across all four conditions, we held average creativity-contingent compensation constant
at $15 per participant.8 In our individual piece-rate condition, participants received $3 multiplied
7 We asked creativity raters to provide a justification for each of their ratings. Based on these justifications, proposals receiving a high creativity rating often developed either an original/innovative overall theme that was implementable or an ordinary overall theme with original/innovative aspects such as creative ways to interface with student groups on campus. Examples of creative proposals include: (1) a Civil War visitors center serving food and presenting theater/other entertainment consistent with the time period giving a creative outlet to student groups across campus, and (2) allowing student groups from each college to turn a room into an exhibit in order to introduce prospective students to each college’s offering (each year, student groups with the best exhibit receive funding for their organizations). Proposals receiving lower creativity ratings developed a use typically associated with a college campus without original/innovative aspects such as (1) a coffee shop, or (2) a space that can be rented out by groups on campus.
15

by their individual input creativity rating where, as discussed above, the average rating was a 5.9
In our group piece-rate condition, groups received $9 multiplied by their group creativity rating,
where the average rating was a 5 and the three group members equally shared this piece-rate. In
our individual (intragroup) tournament condition, the group member receiving the highest
individual input creativity rating (out of the three group members) receives $45 and the other two
group members receive $0. Finally, in the group (intergroup) tournament condition, the group
with the highest group creativity rating (out of three groups) receives $135 and the other two
groups receive $0, where the three group members equally shared this tournament pay.
IV. RESULTS
Test of Hypothesis – Group Creativity Ratings
Our hypothesis predicts an interaction such that, relative to piece-rate pay, group-based
tournament pay will have a positive effect and individual-based tournament pay will not have a
positive effect on the creativity of the group’s solution. Before presenting the test of our process-
based model, we first present analyses of group creativity ratings. Panel A of Table 1 provides
descriptive statistics for group creativity ratings. With group creativity ratings as our dependent
measure, Panel B of Table 1 provides the results of an ANCOVA with contract form and
performance measure level as our independent measures and the percentage of females in each
group as a covariate. We control for the percentage of females in each group because prior
research suggests that females participate more in computer-mediated discussions (Hsi and
Hoadley 1997) and, in our collaborative setting, this could lead to more creativity.10
8 Participants received an average compensation of $20 (i.e., $5 show-up fee + $15 average creativity-contingent compensation). They also received “extra credit” from the courses in which we recruited them for participating in the experiment. 9 We communicated the creativity rating range and average in participant instructions. 10 Consistent with this argument, the individual creativity ratings of females in our study exceeded that of males (t = 2.63, p < 0.01).
16

This ANCOVA yields a significant interaction (F = 12.30, p = 0.04). As depicted by
Figure 3 which plots group creativity rating averages by experiment condition and as reported in
Panel C of Table 1, the nature of the interaction is that, relative to piece-rate pay, group
tournaments increase group creativity (F = 2.34; p = 0.06) and individual-based tournaments
have no effect on group creativity (F = 1.18; p = 0.28, two-tailed). Collectively, these results are
consistent with our hypothesis. Moreover, under the assumption that group piece-rates and
individual piece-rates do not have significantly different impact on group creativity, our
hypothesis would imply that intergroup tournaments lead to the highest level of group creativity
compared to the other three conditions. Consistent with this, we find that the average group
creativity rating in the group-based tournament condition is greater than an equally weighted
composite of the other three conditions (F = 3.12; p = 0.04).
Additional Hypothesis Tests
To further corroborate whether the specific mechanisms proposed in our process model
drive our creativity results, we collected several measures in our post-experimental questionnaire
completed independently by each participant. We first discuss each construct in our model
separately. To facilitate this discussion, Table 2 summarizes the specific statements used to
capture each construct in our model and the descriptive statistics by condition for participants’
responses to each statement, which were elicited on an eleven-point Likert scale with “0” labeled
“not at all” and “10” labeled “completely.”11 We then report the results of a path analysis to test
the links between these constructs. For completeness, we examine these measures across all four
of our conditions.
11 Factor analysis results suggest the measures are separate constructs consistent with Table 2 groupings.
17

Group Cohesion and Collaboration
As summarized in Table 2, we capture group cohesion and collaboration using eight post-
experimental questions adapted from the Group Environment Questionnaire (GEQ) scale
(Widmeyer et al. 1985). These measures capture the psychological bond individuals felt with
their group members and the ease at which group members shared ideas. The Cronbach’s alpha
on these eight measures is 0.87, which exceeds typical reliability thresholds (Peterson 1994).
Thus, we use the average of these eight measures for our analyses.
Figure 4, Panel A plots by experimental condition the average of the eight measures
representing our cohesion and collaboration construct. Consistent with our theoretical model, we
find that, for participants rewarded based on group creativity, those in the tournament condition
had higher cohesion and collaboration than those in the piece-rate condition (F = 3.23; p = 0.04).
We also find that, for participants rewarded based on individual creativity, tournament pay had
no effect on cohesion and collaboration relative to piece-rate pay (F = 0.01; p > 0.50, two-tailed).
Collectively, these results suggest that intergroup tournaments, but not intragroup tournaments,
promote group cohesion and collaboration.12
Identification with Group Objectives
Table 2 also summarizes the four post-experimental questions we use to capture the
extent group members identified with their group’s objective. These measures, adapted from the
Situation Motivation Scale (Guay et al. 2000), capture the importance participants placed on
their group’s objective and how important participants believed this objective was to their group
12 In addition to our self-reported measure of group cohesion and collaboration, we also observe evidence of greater coordination and collaboration among those in our group tournament condition during the experiment. Particularly, participants in our group tournament condition typed a larger number of words in the comments section (420 words), where much of the coordination and collaboration among group members took place, than the average number of words in the comment section of the other three conditions (304 words; F = 10.22; p < 0.01).
18

members. The Cronbach’s alpha on these four measures is 0.79, which exceeds typical reliability
thresholds. Thus, for our analyses, we use the average of these four measures.
Figure 4, Panel B plots by experimental condition the average of the four measures
representing our identification with group objectives construct. Consistent with our theoretical
model, we find that, for participants rewarded based on group creativity, those in the tournament
pay condition identified with the group objective to a greater extent than those in the piece-rate
condition (F = 3.08; p = 0.04). For participants rewarded on individual creativity, we did not
observe an effect of tournament pay (F = 0.06; p > 0.50, two-tailed). Collectively, these results
suggest that intergroup tournament, but not intragroup tournaments, induce group members to
identify to a greater extent with group objectives.
Path Analysis Results
Figure 5 presents results of a path analysis that estimates the links between our constructs
as hypothesized in Figure 1. While we estimated all links simultaneously, we used multi-group
analysis and report separate estimates for those rewarded based on group-level incentives and
those rewarded based on individual-level incentives for the link between tournament pay and
group cohesion and collaboration, which is predicted to differ between the two subsamples. We
represent our incentive form manipulation using a dummy variable set equal to “1” for
observations in the tournament condition and “0” for observations in the piece-rate condition.
The coefficients on this variable represent the increase in group cohesion and collaboration
attributable to tournament relative to piece-rate pay.
We used AMOS software, which employs a maximum likelihood estimation procedure,
to simultaneously estimate each link and compute fit indexes. Overall model fit is adequate, as
indicated by three goodness-of-fit measures: the Chi-square/degree of freedom (CMIN/DF) (=
19
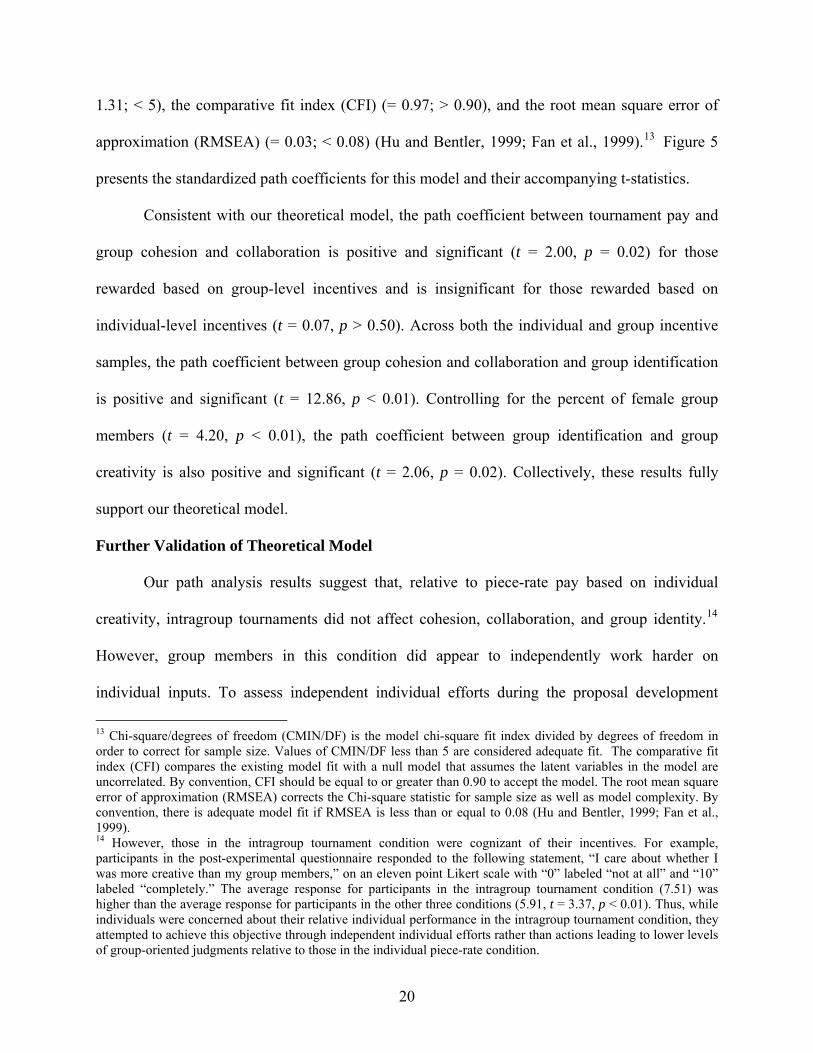
1.31; < 5), the comparative fit index (CFI) (= 0.97; > 0.90), and the root mean square error of
approximation (RMSEA) (= 0.03; < 0.08) (Hu and Bentler, 1999; Fan et al., 1999).13 Figure 5
presents the standardized path coefficients for this model and their accompanying t-statistics.
Consistent with our theoretical model, the path coefficient between tournament pay and
group cohesion and collaboration is positive and significant (t = 2.00, p = 0.02) for those
rewarded based on group-level incentives and is insignificant for those rewarded based on
individual-level incentives (t = 0.07, p > 0.50). Across both the individual and group incentive
samples, the path coefficient between group cohesion and collaboration and group identification
is positive and significant (t = 12.86, p < 0.01). Controlling for the percent of female group
members (t = 4.20, p < 0.01), the path coefficient between group identification and group
creativity is also positive and significant (t = 2.06, p = 0.02). Collectively, these results fully
support our theoretical model.
Further Validation of Theoretical Model
Our path analysis results suggest that, relative to piece-rate pay based on individual
creativity, intragroup tournaments did not affect cohesion, collaboration, and group identity.14
However, group members in this condition did appear to independently work harder on
individual inputs. To assess independent individual efforts during the proposal development
13 Chi-square/degrees of freedom (CMIN/DF) is the model chi-square fit index divided by degrees of freedom in order to correct for sample size. Values of CMIN/DF less than 5 are considered adequate fit. The comparative fit index (CFI) compares the existing model fit with a null model that assumes the latent variables in the model are uncorrelated. By convention, CFI should be equal to or greater than 0.90 to accept the model. The root mean square error of approximation (RMSEA) corrects the Chi-square statistic for sample size as well as model complexity. By convention, there is adequate model fit if RMSEA is less than or equal to 0.08 (Hu and Bentler, 1999; Fan et al., 1999). 14 However, those in the intragroup tournament condition were cognizant of their incentives. For example, participants in the post-experimental questionnaire responded to the following statement, “I care about whether I was more creative than my group members,” on an eleven point Likert scale with “0” labeled “not at all” and “10” labeled “completely.” The average response for participants in the intragroup tournament condition (7.51) was higher than the average response for participants in the other three conditions (5.91, t = 3.37, p < 0.01). Thus, while individuals were concerned about their relative individual performance in the intragroup tournament condition, they attempted to achieve this objective through independent individual efforts rather than actions leading to lower levels of group-oriented judgments relative to those in the individual piece-rate condition.
20

phase of our experiment, we take the sum of the number of words contained in parent-ideas (i.e.,
initial ideas) and the number of words in child-ideas that build on group members’ own ideas.
The average number of words contained in both parent ideas and child ideas building on group
members’ own ideas was higher for groups in the individual tournament condition (442 words)
than that of the other three conditions (344 words, F = 4.87, p = 0.02), suggesting greater
independent efforts by group members in the individual tournament condition.15
As suggested by our group creativity results, these independent efforts did not lead to
greater group creativity. Moreover, we did not discern a significant correlation between these
individual efforts and group creativity ratings (ρ = -0.05, p > 0.50). Demonstrating that these
independent individual efforts do not enhance group creativity helps to further validate our
process model suggesting that reward systems spark group creativity by promoting cohesion,
collaboration, and group identification.
Moreover, we also examine whether higher individual efforts in the individual
tournament condition led to more creative individual inputs to the group solution. Panel A of
Table 3 provides descriptive statistics for individual creativity ratings. With individual creativity
ratings as our dependent measure, Panel B of Table 3 provides the results of an ANCOVA with
contract form and performance measure level as our independent measures and the percentage of
females in each group as a covariate.
Similar to our group creativity results, this ANCOVA yields a significant interaction (F =
24.08, p = 0.02). As reported in Panel C of Table 3, the nature of the interaction is that, relative
to piece-rate pay, group tournaments increase individual creativity ratings (F = 2.34; p = 0.06)
and individual tournaments have no effect on individual creativity ratings (F = 1.18; p = 0.28,
15 The average words by condition are as follows: group piece-rate (332 words), group tournament (281 words), and individual piece-rate (420 words).
21

two-tailed). 16 Collectively, these results suggest that individual tournament pay led group
members to independently work harder on their individual inputs, but such efforts did not
translate into more creative group solution or individual inputs. By contrast, the cohesion,
collaboration, and group identification inspired by group tournaments not only lead to greater
group creativity, but also promoted more creative individual inputs as group members can likely
enhance their own creativity by building off the diverse ideas of others.
Supplemental Analysis on Idea Selection
The creativity of a group proposal is a joint function of both idea generation and idea
selection. That is, group members must ultimately select which of the group’s generated ideas to
further develop and, ultimately, submit, and the idea selected could affect the group’s creativity
rating. The magnitude of verbiage (i.e., developed and undeveloped ideas) in our transcripts of
group interactions makes any meaningful evaluation of unsubmitted thoughts and proposals
difficult. However, to explore potential variations in idea selection across our experimental
treatments, we asked a different graduate student from the participants’ university (i.e., not one
of our initial three creativity raters) to read through the transcript of each group’s interaction
during the 30-minute proposal development phase and then select and rank the three most
creative solutions of each group. Our rater was unaware of which idea each group selected. We
then compare the idea our rater identified as most creative with the idea actually selected by each
group.
Across the fifteen groups in each of our four conditions, the idea our rater identified as
most creative was actually selected by the group eleven times in the group tournament, eight
times in the group piece-rate, eight times in the individual tournament, and seven times in the
16 To ensure low creativity scores of individuals who did not contribute to the selected group idea are not driving our results, we replicated our results using the maximum individual creativity rating for each group. Using this measure does not change the inferences we make.
22

individual piece-rate conditions. These relative proportions did not statistically differ across our
four conditions (χ2 = 2.43; p = 0.49). Moreover, the top two most creative ideas identified by our
rater were selected by the group thirteen times in the group tournament, eleven times in the
group piece-rate, twelve times in the individual tournament, and twelve times in the individual
piece-rate conditions (χ2 = 0.83; p > 0.50). Collectively, these results suggest that the differences
in idea selection across our experimental conditions are not statistically significant.
V. CONCLUSIONS
We report the results of an experiment where three-person groups develop, via computer
interaction, a creative solution to an important problem. In this environment, we investigate how
the following two dimensions of reward system design affect the efficacy of creativity-based
incentives: (1) whether creativity is measured at the individual or group level, and (2) whether
incentives on this measure take the form of a linear piece-rate or tournament.
Our results support our hypothesis. Specifically, relative to our piece-rate conditions,
group tournaments lead to greater group cohesion and collaboration, which lead to greater
identification with group objectives, which ultimately lead to more creative group solutions.
While individual-based tournaments motivated individuals to independently work harder on
individual inputs, these efforts did not lead to more creative group solutions or even more
creative individual inputs to the group solution. Collectively, our results suggest that reward
systems promoting cohesion, collaboration, and group identification help overcome obstacles
identified in prior research that limit the effectiveness of creativity-contingent incentives.
Our results contribute to a better understanding of observations from practice suggesting
that organizations desiring group creativity often induce intergroup competition. For example,
innovative companies such as Johnson & Johnson and Procter & Gamble invest heavily in
23

competitive budgeting systems rewarding members of the most innovative project teams with
greater funding and pay (Simons 2000; Nussbaum 2005). Our findings also contribute to a better
understanding of academic practices. Here, research teams and universities are becoming
increasingly reliant on competitive grants for the funding of innovative projects (Geuna 2001).
Beyond formal organizational practices, our results also contribute to a better understanding of
the recent trend of “crowdsourcing.” Here, organizations make open calls to groups of people
requesting creative solutions to important problems and often pay groups with the most
innovative solution. For example, InnoCentive (launched with funding from Eli Lilly) provides a
platform where companies such as Boeing and Dupont post pressing R&D challenges to the
scientific community and provide financial rewards to teams with the best solutions (Brabham
2008).
More generally, our results highlight the importance of gaining a better understanding of
linkages between performance evaluation and reward system design and creativity in group
settings. Our existing knowledge of these linkages comes predominantly from individual settings
where research often suggests creativity is invariant to reward system design. Consistent with
this literature, our results suggest that simply encouraging individual group members to
independently work harder at being creative may not lead to the desired result. However, by
encouraging individuals to freely collaborate and build off the diverse ideas of others, our results
suggest that performance evaluation and reward systems may play a vital role in promoting
group creativity. These promising results will hopefully encourage future research in the area.
To this end, limitations of our study provide opportunities for future research. For
example, we examined a setting where groups interact for only a single period. Whereas this
design choice may be representative of some environments such as the reliance on cross-
24

functional teams formed to creatively address a specific problem, it may not be representative of
other environments such as when longstanding departments or teams must creatively address on-
going problems and, thus, may already be a cohesive and collaborative unit. Therefore, future
research could address the moderating role of multiple-period interactions on the link between
performance evaluation and reward system design and group creativity.
25

Appendix: Experimental Instructions Ground rules Before describing the experiment, it is important to establish two ground rules. 1. NO TALKING WITHIN OR COMMUNICATION BETWEEN SESSIONS While we hope that you find this experiment to be fun, it is also serious research. Please help us maintain control over the experiment by refraining from verbal communication with your fellow participants in this session or any communication with other students who might be participating in future sessions. If you have any questions at any time during today’s session, just raise your hand and we will assist you. 2. NO DECEPTION We promise to carry out the experiment in the manner described in these instructions, with no deception of any form. You have already received a $5 show-up fee. As will be explained later, you can earn additional compensation from this experiment which will be paid at a later date (in about four weeks). We promise that your compensation will be determined exactly as described in the rules explained later for this session.
26

Experimental Task Participants in today’s session have been randomly assigned into groups of three persons each. Each three-person group will spend 30 minutes developing specific proposals for a creative use for the Mumford house located in the South Quad (i.e., a use that is original, innovative, and implementable within a reasonable budget). Built just after the Civil War in 1870, the Mumford House is the oldest building on our campus. Despite being listed on the National Register of Historic Places, the building has been poorly maintained and, as a result, is currently uninhabited. In order to renew interest in this historical landmark, groups from around the state want to develop a creative use for the building which will help secure money for its renovation.
27

Developing creative proposals for the Mumford House For 30 minutes, each group will interact and develop their creative proposals electronically via an ideation program. The ideation program organizes group ideas in “trees” where the original ideas, “parent-ideas,” are placed far left of the screen and the follow-up ideas, “child-ideas,” are placed below the existing parent-ideas that the child-idea relates. Here is what the ideation program looks like:
Your upper right screen shows how
your compensation will be determined.
You can contribute a parent‐idea by
clicking on “Enter an idea not building
on any previous idea”.
You can contribute a child‐idea or
comment on an existing idea by first
selecting the idea number of the existing
idea you wish to build on, then clicking
submit to enter your idea/comment.
Please note that comments are not
considered part of an idea.
Your left screen shows ideas and comments that
have been generated.
You need to either press “F5” or click on any
existing idea to refresh the screen.
Each group’s idea-trees are recorded on the left-hand side of the screen. As seen in the image above, all child-ideas that build on a specific parent-idea have the same color and the same indentation. At any time during the 30-minute interactive group session, group members can choose to either contribute a new parent-idea or build/comment upon an existing parent idea by clicking on either “Enter an idea not building on any previous idea” or “Enter an idea to react to or build on idea #” on the right-hand side of the screen. When building on ideas, you should generally use “conjunctive phrases” like 'More precisely', 'In particular.’ These conjunctive phrases make sure that the ideas in a tree are linked not only verbally, but also conceptually. Note: New ideas and comments won't appear automatically on the screen. To see new ideas, you have to refresh the page, either by pressing F5 or clicking on any previous idea. Each group will only be able to observe the ideas and comments of its three members (i.e., not the ideas and comments of participants in other groups).
28

Submitting a creative proposal for the Mumford House After the 30-minute interactive session, each group will have 5 minutes to select one idea from the idea(s) it developed. Specifically, each group will submit the number of the parent-idea where the discussion and development of its most creative idea began. Recall: Parent-ideas are the initial ideas at the far left of the screen. During this 5-minute period, group members will only be able to communicate via the comment function (i.e., no new parent or child ideas can be added). Remember, comments won’t appear automatically on the screen. To see new comments, you have to refresh the page, either by pressing F5 or clicking on any previous comment. The final comment of the group should indicate the number of the parent idea selected.
29

Your Compensation <Group piece-rate> After today’s session, doctoral students will rate the creativity of each group’s submitted idea on a scale of 0 to 10, where “10” indicates the highest rating, “0” indicates the lowest possible rating, and “5” will be the average rating across all sessions. Each group will be paid $9 multiplied by the group creativity rating. The group payment will be evenly divided among the three group members. <Group tournament> After today’s session, doctoral students will rate the creativity of each group’s submitted idea on a scale of 0 to 10, where “10” indicates the highest rating, “0” indicates the lowest possible rating, and “5” will be the average rating across all sessions. The group receiving the highest group creativity rating out of the three groups in today’s session on your side of the lab will receive $135 and the other two groups with receive $0. The group payment will be evenly divided among the three group members. <Individual piece-rate> After today’s session, doctoral students will rate the creativity of each group member’s input to the group’s submitted idea on a scale of 0 to 10, where “10” indicates the highest rating, “0” indicates the lowest possible rating, and “5” will be the average rating across all sessions. Each individual will receive $3 multiplied by his/her individual rating. <Individual tournament> After today’s session, doctoral students will rate the creativity of each group member’s input to the group’s submitted idea on a scale of 0 to 10, where “10” indicates the highest rating, “0” indicates the lowest possible rating, and “5” will be the average rating across all sessions. The individual from each group with the highest rating will receive $45 and the other two individuals will receive $0. <All Conditions> We will pay you your compensation in about four weeks, after we receive the creativity ratings. We promise that you and all others with this version of the research will receive cash compensation as described above for participating today.
30

REFERENCES
Adler, P. S., and C. X. Chen. 2009. Beyond intrinsic motivation: On the nature of individual motivation in large-scale collaborative creativity. Working paper.
Amabile, T. M. and S. Gryskiewiecz. 1987. Creativity in the R&D laboratory. C.f.C. Leadership,
ed. Technical Report No. 30, Greensboro, NC. Amabile, T. M. 1996. Creativity in Context: Update to the Social Psychology of Creativity.
Boulder, CO: Westview Press. Arnold, P. 1998. The limits of Postmodernism in accounting history: The Decatur experience.
Accounting, Organizations, and Society 23 (7): 665-684. Bonner, S. E., R. Hastie, G. B. Sprinkle, and S. M. Young. 2000. A review of the effects of
financial incentives on performance in laboratory tasks: Implications for management accounting. Journal of Management Accounting Research 12: 19-64.
Bonner, S. E., and G. B. Sprinkle. 2002. The effects of monetary incentives on effort and task performance: Theories, evidence, and a framework for research. Accounting, Organizations and Society 27 (May – July): 303-345.
Bornstein, G. 2003. Intergroup conflict: Individual, group, and collective interests. Personality and Social Psychology Review 7: 129-145.
Brabham, D. C. 2008. Crowdsourcing as a model for problem solving. The International Journal
of Research into New Media Technologies 14 (1): 75-90. Brewer, M. B. 1979. In-group bias in the minimal intergroup situation: A cognitive-motivational
analysis. Psychological Bulletin 86(2): 307-324. Chen, C. C., X. P. Chen, and J. R. Meindl. 1998. How can cooperation be fostered? The cultural
effects of individualism-collectivism. The Academy of Management Review 23: 285-304. Deci, E. L., J. P. Connell, and R. M. Ryan. 1989. Self-determination in a work organization.
Journal of Applied Psychology 74: 580-590. Drake, A. R., S. F. Haka, and S. P. Ravenscroft. 1999. Cost system and incentive structure
effects on innovation, efficiency and profitability in teams. The Accounting Review 74(3): 323-345.
Ellemers, N., D. Gilder, and S.A. Haslem. 2004. Motivating individuals and groups at work: A
social identity perspective on leadership and group performance. Academy of Management Review 29(3): 459-478.
31
Fan, X., B. Thompson, and L. Wang. 1999. Effects of sample size, estimation methods, and model specification on structural equation modeling fit indexes. Structural Equation Modeling 6: 56-83.
Friedkin, N. E. 2004. Social Cohesion. Annual Review of Sociology 30: 409-425. Geuna, A. 2001. The changing rationale for European university research funding: Are there
negative unintended consequences? Journal of Economic Issues 35 (3): 607-632. Guay, F., R. J. Vallerand, and C. Blanchard. 2000. On the assessment of situational intrinsic and
extrinsic motivation: The Situational Motivation Scale (SIMS). Motivation and Emotion 24(3): 175-213.
Hannan, R. L., R. Krishnan, and A. H. Newman. 2008. The effects of disseminating relative
performance feedback in tournament and individual performance compensation plans. The Accounting Review 83(4): 893-913.
Hsi, S. and C. M. Hoadley. 1997. Productive discussion in science: Gender equity through
electronic discourse. Journal of Science Education and Technology 6: 23-36. Hu, L., and P. M. Bentler. 1999. Cutoff criteria for fit indexes in covariance structure analysis:
Conventional criteria versus new alternatives. Structural Equation Modeling 6: 1-55. Kachelmeier, S. J., B. E. Reichert, and M. G. Williamson. 2008. Measuring and motivating
quality, creativity, or both. Journal of Accounting Research 46(2): 341-73. Kachelmeier, S. J., and M. G. Williamson. 2010. Measuring and motivating quality, creativity, or
both. The Accounting Review, forthcoming. Kaplan, R., and D. Norton. 1996. The Balanced Scorecard: Translating Strategy into Action.
Boston. Luft, J., and M. D. Shields. 2003. Mapping management accounting: graphics and guidelines for
theory-consistent empirical research. Accounting, Organizations, and Society 28 (February/April): 169-249.
Milgrom, P. and J, Roberts. 1992. Economics, Organization and Management. Englewood
Cliffs, NJ: Prentice-Hall. Miller, P., & O’Leary, T. 1994. Accounting, “economic citizenship” and the spatial reordering of
manufacture. Accounting, Organizations and Society 19: 15-43. Nussbaum, B. 2005. Get creative! How to build innovative companies. Business Week 3945: 60-
68.
32
Paulus, P. B. 2000. Group, teams, and creativity: The creative potential of idea-generating groups. Applied Psychology: An International Review 49 (2): 237-262.
Paulus, P. B., T. Nakui, and V. L. Putman. 2006. Group brainstorming and teamwork: Some
rules for the road to innovation. In Creativity and Innovation in Organizational Teams, edited by L. Thompson and H. S. Choi. Mahway, NJ: Lawrence Erlbaum Associates, 69-86.
Peterson, R. A. 1994. A meta-analysis of Cronbach’s coefficient alpha. Journal of Consumer
Research 21 (September): 381-391.
Pirola-Merlo, A. and L. Mann. 2004. The relationship between individual creativity and team creativity: Aggregating across people and time. Journal of Organizational Behavior 25: 235-257.
Richer, S. F., C. Blanchard, and R. J. Vallerand. 2002. A motivational model of work turnover.
Journal of Applied Social Psychology 32(10): 2089-2113. Simons, R. 2000. Codman & Shurtleff, Inc: Planning and control system. Harvard Business
School Case 9-187-081. Sprinkle, G. B. 2003. Perspectives on experimental research in managerial accounting.
Accounting Organizations and Society. 28: 287-318. Sprinkle, G. B. 2008. Discussion of Measuring and motivating quantity, creativity, or both.
Journal of Accounting Research 46 (May): 375-382. Sprinkle, G. B., and Williamson, M. G. 2004. The evolution from Taylorism to employee
gainsharing: A case study examining John Deere’s Continuous Improvement Pay Plan. Issues in Accounting Education 19(4): 487-503.
Sprinkle, G. B., and M. G. Williamson. 2007. Experimental research in managerial accounting.
In Handbook of Management Accounting Research, Volume 1, edited by C. S. Chapman, A. G. Hopwood, and M. D. Shields, 415-444. Oxford, UK: Elsevier, Ltd.
Tajfel, H., and J. C. Turner. 1986. The Social Identity Theory of Intergroup Behavior. Chicago, IL: Nelson-Hall.
Thompson, L. and H. S. Choi. 2006. Creativity and Innovation in Organizational Teams.
Mahwah, NJ: Lawrence Erlbaum Associates. Toubia, O. 2006. Idea generation, creativity, and incentives. Marketing Science 25(5): 411-25. van Knippenberg, D. 2000. Work motivation and performance: A social identity perspective.
Applied Psychology: An International Review 49(3): 357-371.
33
Widmeyer, W. N., L. R. Brawley, and A. V. Carron. 1985. The Measurement of Cohesion in Sport Teams: The Group Environment Questionnaire. London, Ontario: Sports Dynamics.
Young, S. M., J. Fisher, and T. M. Lindquist. 1993. The effects of intergroup competition and
intragroup cooperation on slack and output in a manufacturing setting. The Accounting Review 68(3): 466-481.
34

TABLE 1 The Effects of Level and Form of Creativity-Contingent Incentives on Group Creativity Ratings
Panel A: Means (Standard Deviations) for Group Creativity Ratings Individual Measure Group Measure Piece-Rate Contract
5.47
(2.67) 5.09
(2.52)
Tournament Contract 4.87 (2.53)
5.80 (1.91)
Panel B: Analysis of Variance
Factor df Sum of Squares F
p-valuea
FORM OF INCENTIVES 1 0.55 0.29 .64
LEVEL OF INCENTIVES 1 4.98 2.76 .24
FORM x LEVEL OF INCENTIVES 1 19.34 12.30 .04
PERCENT OF FEMALE GROUP MEMBERS 1 79.73 14.14 <.01
Error
Panel C: Simple Effects Effect of INCENTIVE FORM within GROUP-LEVEL INCENTIVES
1 2.34 .06
Effect of INCENTIVE FORM within INDIVIDUAL-LEVEL INCENTIVES
1 1.18 .28
a Reported p-values are two-tailed unless testing a one-tailed prediction, as signified by bold face.
35

TABLE 2 Descriptive Statistics of Process Variables
Group-Based Incentive
Mean (Standard Deviation) Individual-Based Incentive
Mean (Standard Deviation) Piece-rate Tournament Piece-rate Tournament Group Cohesion & Collaboration Measures:
As a whole, I liked the members in my group.
7.51 (8.13)
8.13 (1.78)
7.02 (2.15)
7.04 (2.04)
Our group was united in trying to generate a creative idea.
7.73
(2.44)
8.69
(1.41)
7.13
(2.79)
7.16
(2.36) My group did not give me enough opportunities to contribute my ideas. (R)
8.93
(1.78)
8.91
(1.82)
8.24
(2.16)
8.07
(2.40)
I did not like the style of work in this group. (R)
6.87
(3.01)
7.87
(2.28)
7.07
(2.05)
7.27
(2.28) I feel attached to the group.
5.24
(3.18)
5.58
(2.79)
4.33
(3.19)
4.64
(2.99) I feel quite similar to others in my group in terms of general attitudes and opinions.
6.64
(1.98)
7.60
(1.44)
6.13
(2.12)
6.11
(1.91)
I think my group was relatively more cohesive (united) compared to other groups in this study.
6.33
(2.42)
7.27
(1.53)
5.58
(2.20)
5.67
(2.33)
My group members were open to the ideas of others.
7.89
(1.80)
8.02
(1.99)
7.51
(2.83)
7.27
(2.21) Group Identification Measures:
I think this activity is important for me.
5.13 (2.64)
5.40 (1.95)
5.09 (2.44)
5.31 (2.12)
I think this activity is important for my group.
5.33
(2.83)
6.13
(2.14)
5.11
(2.49)
5.62
(1.93) I cared about my creative performance on the task.
8.36
(1.93)
8.80
(1.39)
8.16
(2.07)
8.20
(1.85) My group cared about its creative performance on the task.
7.82
(2.25)
8.67
(1.43)
7.91
(1.49)
7.47
(1.77) This table summarizes the statements used to capture the two process variables in our model and the descriptive statistics by condition for participants’ responses to each statement. Each statement was elicited on an eleven-point Likert scale with “0” labeled “not at all” and “10” labeled “completely”.
36

TABLE 3 The Effects of Level and Form of Creativity-Contingent Incentives on Individual Creativity Ratings Panel A: Means (Standard Deviations) for Individual Creativity Ratings Individual Measure Group Measure Piece-Rate Contract
5.22
(2.48) 4.89
(2.28)
Tournament Contract 5.00 (2.40)
5.89 (1.71)
Panel B: Analysis of Variance
Factor df Sum of Squares F
p-value
FORM OF INCENTIVES 1 8.56 5.67 .14
LEVEL OF INCENTIVES 1 4.98 10.41 .08
FORM x LEVEL OF INCENTIVES 1 16.60 24.08 .02
PERCENT OF FEMALE GROUP MEMBERS 1 69.31 14.46 <.01
Error
Panel C: Simple Effects Effect of INCENTIVE FORM within GROUP-LEVEL INCENTIVES
1 5.11 .01
Effect of INCENTIVE FORM within INDIVIDUAL-LEVEL INCENTIVES
1 0.14 .71
a Reported p-values are two-tailed unless testing a one-tailed prediction, as signified by bold face.
37

FIGURE 1 Process Model
Tournament Pay
Level of Incentives (Group-Based vs. Individual-Based)
Group Cohesion & Collaboration
Group Identification
Group Creativity
38

FIGURE 2 Excerpts of Group Proposal
C: The House can be used as a Civil War Center. Visitors & parents can pay to get in, and the house can be filled with facts and showpieces from the war, as well as radios from songs from the 1870s and a television or two playing Civil War documentaries.
A: More precisely, charge people to enter – charge people to eat from cooked food at the kitchen – encourage visitors who may go to the University to visit this cite and include it in the tours.
C: More precisely, elementary and high schools can be contracted to attract several visitors to view the historical building along with attracting tourists to the University. This would increase the perceived value of the school to prospective students.
A: Indeed, along with that, the media can be occasionally contacted to keep up with updates & renovation to raise public awareness, potentially generate sponsors/ more funds, and increase the reputation of the university.
A: More precisely, classes on campus that are studying this time period can be encouraged to visit the site (i.e., for extra credit) to generate more inflow of customers. Plus, professors may want to visit and bring their families.
B: More precisely, we can introduce the sale of recipes as well to increase the funding.
A: Exactly! And serve a variety of foods, maybe “north” versus “south” so people can get a feel for the time.
A: On the other hand, parents and visitors may not mind paying a small fee to get into the building. Remember, we are trying to raise funds in order to renovate the building, so we have to find some means of generating funds.
C: More precisely, to combine the first idea with this one, maybe historical groups on campus could be in charge of raising capital to renovate the house until it is ready to be used by the public.
A: This is an excellent idea for initial funds. Then, once the house is ready to use and is generating funds, the fraternity will not have to keep generating, but can still be in charge of running the house and therefore take a portion of the profits.
C: Moreover, these historical groups on campus could also be in charge of certain parts of running the house, such as giving tours. This way, the house would boost the economy on campus and create jobs and experience for current students.
C: Indeed, along with the kitchen, the office may be utilized as a ticket selling/ taking area because it is in the front entrance on the first floor.
A: More precisely, students from different studies can come together. Film students can help create documentaries to be shown in the house (or short films). Drama students can do reenactments of the war at specific times (i.e., once a month).
C: More precisely, acting students can dress in authentic civil war outfits and use accents to create the environment of the Civil War while giving tours.
C: Moreover, professors and TA’s can be contacted by the University to encourage them to add into the curriculum projects to benefit/ advertise the Mumford house.
C: Indeed, monthly attractions will be necessary to attract repeat customers. Otherwise, visitors will most likely not return if there is nothing new to see.
39
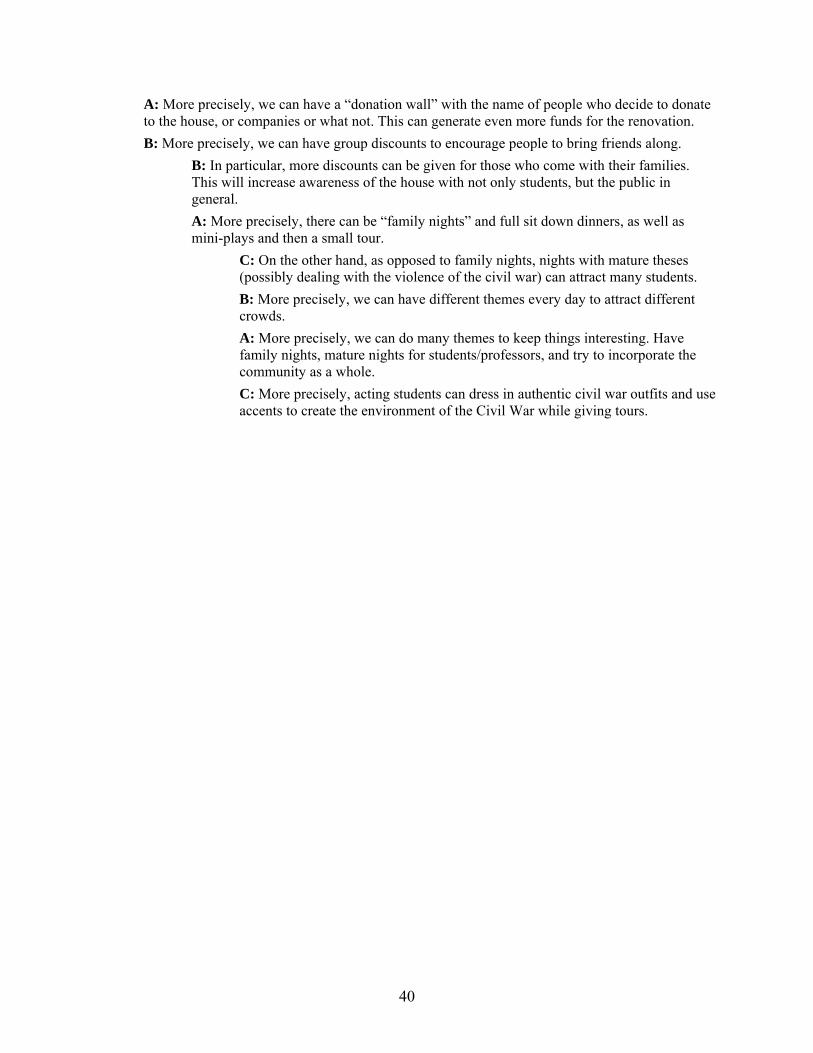
A: More precisely, we can have a “donation wall” with the name of people who decide to donate to the house, or companies or what not. This can generate even more funds for the renovation.
B: More precisely, we can have group discounts to encourage people to bring friends along.
B: In particular, more discounts can be given for those who come with their families. This will increase awareness of the house with not only students, but the public in general.
A: More precisely, there can be “family nights” and full sit down dinners, as well as mini-plays and then a small tour.
C: On the other hand, as opposed to family nights, nights with mature theses (possibly dealing with the violence of the civil war) can attract many students.
B: More precisely, we can have different themes every day to attract different crowds.
A: More precisely, we can do many themes to keep things interesting. Have family nights, mature nights for students/professors, and try to incorporate the community as a whole.
C: More precisely, acting students can dress in authentic civil war outfits and use accents to create the environment of the Civil War while giving tours.
40

FIGURE 3 Group Creativity Ratings by Condition
4.00
4.25
4.50
4.75
5.00
5.25
5.50
5.75
6.00
Tournament Piece-rate
Cre
ativ
ity
of
Gro
up
So
luti
on
Group
Individual
41
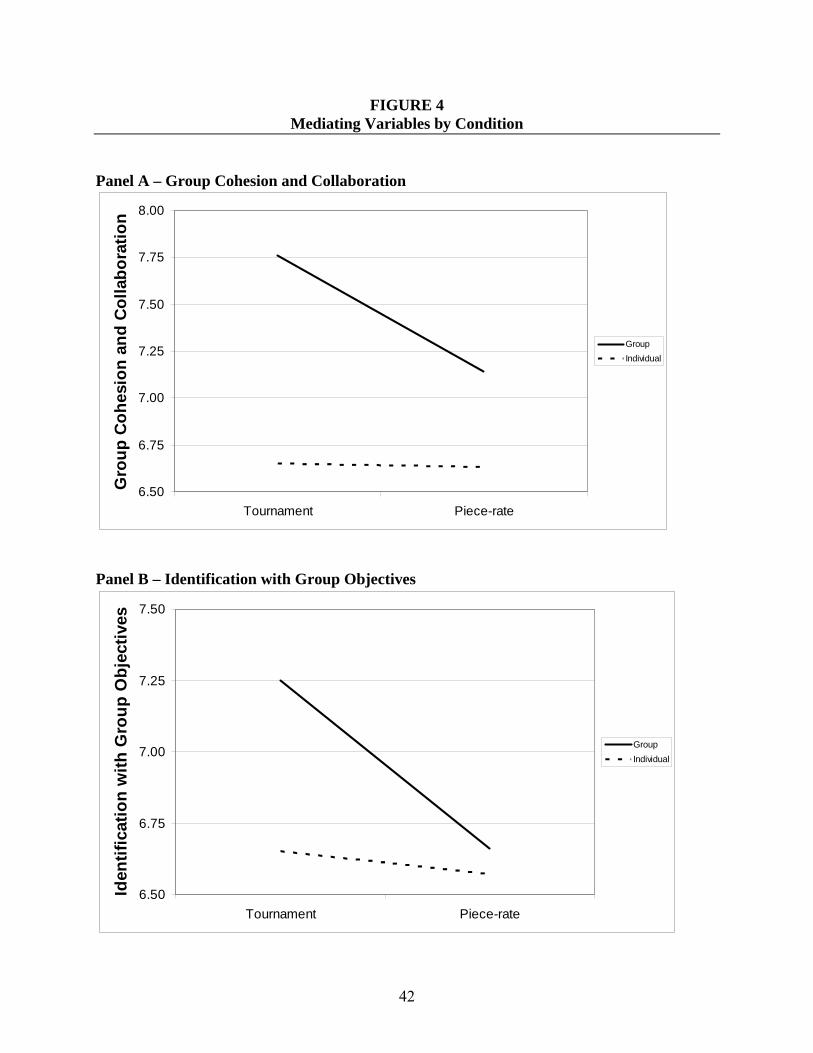
FIGURE 4 Mediating Variables by Condition
Panel A – Group Cohesion and Collaboration
6.50
6.75
7.00
7.25
7.50
7.75
8.00
Tournament Piece-rate
Gro
up
Co
hes
ion
an
d C
oll
abo
rati
on
Group
Individual
Panel B – Identification with Group Objectives
6.50
6.75
7.00
7.25
7.50
Tournament Piece-rate
Iden
tifi
cati
on
wit
h G
rou
p O
bje
ctiv
es
Group
Individual
42

FIGURE 5 Path Analysis Results
Tournament Pay
Group-Based Incentive 0.21 (2.00)*
Individual-Based Incentive 0.01 (0.07)
Group Cohesion & Collaboration
0.49 (12.86)*
Group Identification
0.12 (2.06)*
0.40 (4.20)*
Percent of Female Group Members
Group Creativity
This figure shows the results of a path analysis that estimates the links between the constructs in our theoretical model. We used multi-group analysis and report separate estimates for those rewarded for individual-based incentives and those rewarded for group-based incentives for the link between tournament pay and group cohesion and collaboration. We represent our incentive form manipulation using a dummy variable set equal to “1” for observations in the tournament condition and “0” for observations in the piece-rate condition. The standardized path coefficients for this model and their accompanying t-statistics are shown next to each path. Overall model fit is adequate as indicated by three goodness-of-fit measures: the Chi-square/degree of freedom (CMIN/DF) (= 1.31; < 5), the comparative fit index (CFI) (= 0.97; > 0.90), and the root mean square error of approximation (RMSEA) (= 0.03; < 0.08).
43