
Revitalizing Suburban Downtown Retail Districts ... 5: Retail Parking Strategies ... retail...
76
Strategies & Best Practices Suburban Downtown Retail Districts R e v i t a l i z i n g E S T . 2 0 1 3 November 2013
Transcript of Revitalizing Suburban Downtown Retail Districts ... 5: Retail Parking Strategies ... retail...

Strategies & Best Practices
Suburban DowntownRetail Districts
Revitalizing
EST. 2013
November 2013

The symbol in our logo is adapted from the official DVRPC seal and is designed as a
stylized image of the Delaware Valley. The outer ring symbolizes the region as a whole
while the diagonal bar signifies the Delaware River. The two adjoining crescents
represent the Commonwealth of Pennsylvania and the State of New Jersey.
DVRPC is funded by a variety of funding sources including federal grants from the U.S. Department of Transportation’s
Federal Highway Administration (FHWA) and Federal Transit Administration (FTA), the Pennsylvania and New Jersey
departments of transportation, as well as by DVRPC’s state and local member governments. The authors, however, are
solely responsible for the findings and conclusions herein, which may not represent the official views or policies of the
funding agencies.
DVRPC fully complies with Title VI of the Civil Rights Act of 1964 and related statutes and regulations in all programs and
activities. DVRPC’s website (www.dvrpc.org) may be translated into multiple languages. Publications and other public
documents can be made available in alternative languages and formats, if requested. For more information, please call
(215) 238-2871.
The Delaware Valley Regional Planning Commission is dedicated to uniting the
region’s elected officials, planning professionals, and the public with a common
vision of making a great region even greater. Shaping the way we live, work,
and play, DVRPC builds consensus on improving transportation, promoting
smart growth, protecting the environment, and enhancing the economy.
We serve a diverse region of nine counties: Bucks, Chester, Delaware,
Montgomery, and Philadelphia in Pennsylvania; and Burlington, Camden,
Gloucester, and Mercer in New Jersey. DVRPC is the federally designated Metropolitan Planning Organization for the
Greater Philadelphia Region — leading the way to a better future.
NJ
PA
DEMD
VA
NY CT
RI
New York City
Wilmington
Baltimore
Washington, D.C.
MD
MERCER
BURLINGTON
CAMDEN
GLOUCESTER
DELAWARE
PHILADELPHIA
MONTGOMERY
CHESTER
BUCKS
MERCER
BURLINGTON
CAMDEN
GLOUCESTER
DELAWARE
PHILADELPHIA
MONTGOMERY
CHESTER
BUCKS

Table of Contents
Chapter One: Why do Downtown Retail Districts Matter? ................................................................................................................................................................. 3
Retail Typology ........................................................................................................................................................................................................................................................ 4
Retail District Uses .................................................................................................................................................................................................................................................. 4
What are the Trends Affecting Retail Districts? ..................................................................................................................................................................................................... 8
Chapter Two: Evaluating Suburban Retail Districts in Greater Philadelphia ................................................................................................................................. 11
Chapter Three: Applying the Characteristics of Successful Retail Districts ................................................................................................................................... 27
Managed................................................................................................................................................................................................................................................................ 28
Retail-Appropriate ................................................................................................................................................................................................................................................. 31
Pedestrian-Friendly ............................................................................................................................................................................................................................................... 34
Parking Options ..................................................................................................................................................................................................................................................... 37
Unified ................................................................................................................................................................................................................................................................... 39
Transit-Accessible ................................................................................................................................................................................................................................................. 42
Programmed .......................................................................................................................................................................................................................................................... 44
Chapter Four: Municipal Actions to Revitalize Retail Districts ........................................................................................................................................................ 47
Prepare a Retail District Plan ............................................................................................................................................................................................................................... 47
Improve the Development Review Process ......................................................................................................................................................................................................... 51
Update Retail Zoning ............................................................................................................................................................................................................................................ 52
Provide Incentives to Attract New Retail .............................................................................................................................................................................................................. 53
Enlist Partners ....................................................................................................................................................................................................................................................... 56
Track Success ....................................................................................................................................................................................................................................................... 57

Chapter Five: Evaluating Retail Supply and Demand ..................................................................................................................................................................... 59
Supply Side of Retail ............................................................................................................................................................................................................................................. 59
Demand Side of Retail .......................................................................................................................................................................................................................................... 60
Evaluation ............................................................................................................................................................................................................................................................. 65
Conclusion ......................................................................................................................................................................................................................................... 67
Sources .............................................................................................................................................................................................................................................. 69
Figures and Tables Figure 1: Use Mix of 71 Visited Older Suburban Retail Districts ....................................................................................................................................................... 6
Figure 2: Retail Districts Studied ..................................................................................................................................................................................................... 15
Figure 3: Sidewalk Zones ................................................................................................................................................................................................................. 35
Figure 4: Safety Zones ...................................................................................................................................................................................................................... 35
Figure 5: Retail Parking Strategies .................................................................................................................................................................................................. 38
Figure 6: Sample Retail Inventory .................................................................................................................................................................................................... 49
Figure 7: Haddon Heights, NJ Zoning Map ...................................................................................................................................................................................... 52
Figure 8: Sample Trade Area Map ................................................................................................................................................................................................... 63 Table 1: Retail Elements and Priority .............................................................................................................................................................................................. 13
Table 2: Retail District Management Types .................................................................................................................................................................................... 30
Table 3: Estimated Sales per Square Foot ...................................................................................................................................................................................... 64
Table 4: Sample Capture Rates ....................................................................................................................................................................................................... 64
Table 5: Sample Unmet Demand Calculation ................................................................................................................................................................................. 65
Table 6: Average Store Size ............................................................................................................................................................................................................. 65

1
Executive Summary
Many land use and zoning policies address retail and commercial
development, but often fall short of creating and sustaining a thriving
retail district that fits the needs of the surrounding population.
Through the Strategies for Older Suburbs work program of the
Delaware Valley Regional Planning Commission, staff compiled
information about 71 suburban downtown retail districts in an effort
to learn what elements were common among successful older
suburban retail districts. Short- and long -term strategies were then
developed to help local officials revive these districts and further their
economic development goals.
It is imperative that older communities understand how retail fits into
the overall quality of life for a community. Understanding why
retailers choose particular locations and what factors local officials
may be able to influence, are critical to maintaining a competitive
edge in the retail market. Recent retail development trends include
building a retail district to meet the demands of the baby boomers,
increased ethnic diversity, and affluent households. Communities
strive to incorporate these trends and create a shopping experience
that has a mix of uses and serves all modes of transportation.
Revitalizing Downtown Districts is organized into five chapters. The
first chapter discusses the importance of downtown retail districts,
focusing on retail trends and typologies. Chapter two outlines the
result of the field work and evaluates common elements found in the
region that contribute to a retail district’s success. Outlined for local
governments are seven highly relevant factors to consider when
revitalizing any retail district. Chapter three discusses applying the
building blocks of a retail district to begin the revitalization process.
Chapter four provides specific, retail-ready actions that municipal
officials can influence such as regulatory compliance, zoning
regulations, incentives to attract new retail, and working with
partners. Chapter five provides local officials simple calculations on
how to determine retail supply and demand. This chapter takes the
reader through each step and explains where to find critical data. The
report is intended for local governments to begin to think about their
retail districts in the larger context of the community’s economic
development goals and quality of life.
High Street in West Chester illustrates the key elements found in successful retail districts such as wide sidewalks, high Walk Score, low vacancy, parking options, anchored, and an involved BID.


R E V I T A L I Z I N G S U B U R B A N D O W N T O W N R E T A I L D I S T R I C T S 3
Chapter One: Why do Downtown Retail Districts Matter?
A central place primarily has existed to provide
goods and services to the surrounding
population. Human behavior dictates that
people prefer to purchase goods and services
from the closest location that offers that good
or service. Even after decades of suburban
sprawl and an influx of big retailer stores, the
same remains true today.
The primary commercial hub in most
communities is traditionally the Main Street.
While the streets differ in names from
community to community, these commercial
hubs all have common characteristics such as
buildings with retail uses on the ground floor
and offices or apartments above. These
downtown districts are not just the economic
engines of the small towns, but also the primary
places for community events and social
gatherings.
Downtown retail districts are an integral part of
any thriving community. They serve various
functions, including these listed below:
Generate tax revenues - Many local
communities attempt to attract large retail
stores to boost the local tax base. While large
developments such as big-box stores might
provide higher revenues on a per-parcel basis,
they often provide fewer taxes on a per-acre
basis. In other words, dense downtowns
provide local governments with greater tax
yields per acre. Rather than spending time
courting big-box stores, older suburbs would be
wise to focus on retaining existing retailers; and
creating an environment that is conducive to
local entrepreneurs.
Provide employment - Small, local businesses
produce jobs for the local economy. By
understanding the immediate labor force in
their neighborhood, businesses can find local
employees.
Provide access to a variety of goods and
services - The small-scale retail stores in
downtowns offer a variety of goods and
services, such as groceries, hardware, apparel,
gifts, and even home furnishings. Often
customers can have direct contact with the
storeowners and receive personalized
attention.
Bring community members together - A retail
district creates a sense of place and identity for
a community. It is a location to have parades
and festivals. Local stores are also more likely
to donate to local fundraisers. Business owners
are more likely to participate in community
events and committees.
Phoenixville, PA has undergone a recent revitalization building upon arts and culture venues and new public art throughout the downtown. The mural pays homage to the steel industry that once dominated the local economy.
Ambler, PA, has a thriving downtown full of arts and culture, restaurants, and vintage shops. Downtown Ambler is accessible via regional rail and bus, making it a transit-friendly community.
4
Retail Typology
Municipal officials are interested in reviving
their older downtown retail districts. Two
decades ago, national chains avoided
downtown locations because of perceived
parking issues. Today, many chain stores have
rediscovered the benefits of downtown
locations. To help local officials in thinking
about their retail districts, what follows are
definitions (according to the American Planning
Association) of downtowns and commercial
areas often found in older suburban locations.
Central Business District (CBD) is a major
commercial downtown center. An urban
downtown district has design features and a
diversity of uses including cultural facilities,
retail, housing, and ancillary uses.
Commercial Corridors are intended to allow
auto-oriented development while encouraging
walking, bicycling, and transit with a variety of
retail and industrial uses. Commercial corridors
are open and place parking in the front of the
building for convenience.
Main Streets are the neighborhood shopping
area that have a unique character and draw
people from outside the area for the shopping
experience. Many main streets are part of the
National Main Street program.
Neighborhood Commercial Districts are a mix of
commercial uses serving more than one
residential neighborhood. These small areas
specialize in goods and services for nearby
residents.
Retail District Uses
As the traditional center of commerce and
activity, downtown retail districts have a variety
of uses - prime retail, residential, vacant,
nonretail (office, day care, yoga studio etc.),
cultural, and civic. The best occupants for
downtowns are credit-worthy retailers to occupy
a majority of the space, especially the first floor,
but given the competition and climate for retail,
that may be unrealistic. Therefore, having
nonretail uses occupy first floor space has
become a common occurrence. It is important
to understand the impacts each use provides to
the vitality of the retail district. The following
uses were identified for the 71 districts in this
study.
Retail
Retail uses include restaurants, service
oriented businesses and convenience stores.
Retail stores are placed into three categories
(as outlined below): Neighborhood Goods and
services (NG&S); Food and Beverage (F&B), and
General Merchandise, Apparel, Furnishings,
and Other (GAFO). Small downtowns and
neighborhoods should strive to occupy their
districts with neighborhood Goods and Services
for the nearby residential community. Once this
is achieved, the district can move onto Food &
Beverage and then General Merchandise types
of retail.
Residential
Residential uses include any single-family
dwelling or apartment. Residential uses in
retail districts are often found above stores;
however some downtowns include single-family
detached homes on the main street. These
homes are zoned commercial and are often
occupied by retail or commercial uses. These
are often difficult spaces to fill as they do not
meet national retailer standards as being retail
appropriate.
Having an established residential community
within or in close proximity to the retail district
creates a built-in consumer base, as well as an
environment that appears to be in motion 24
hours a day.

R E V I T A L I Z I N G S U B U R B A N D O W N T O W N R E T A I L D I S T R I C T S 5
Vacant
Vacancies should be avoided in a downtown
district. Vacancies can occur for many reasons,
but the key is to deal with them as they arise. A
good rule of thumb is to have a plan in place
when a vacancy does happen by allowing for
appropriate nonretail uses in the downtown. A
vacancy rate below 20 percent is perceived to
be a retail-appropriate district.
Nonretail (Office)
With the downturn of the retail market, many
downtowns have seen an influx of nonretail
uses in otherwise traditional retail space.
Nonretail uses include day care, professional
offices, yoga or fitness-related uses, and
nonprofit offices. Nonretail uses can be
positive additions to street activity and should
be clearly defined in the zoning code. Ensure
that nonretail uses contribute to the vitality of
the downtown and sidewalk traffic. At a
minimum, be sure that nonretail uses are:
Actively occupied and continue the movement of the street;
Able to participate in facade programs; allow them to transfer the public realm, such as outdoor café seating, to adjacent restaurants;
Participating in the perception of safety on the street by keeping on storefront lighting and maintaining the property; and
Visible from the street and if they have a storefront window, ensure attractive displays or activity.
Primary Retail Categories
Neighborhood Goods & Services (NG&S): grocery stores, convenience stores, drugstores, florists, bakeries, delicatessens, butchers, dry cleaners, salons, tailors, laundromats, spas, liquor stores, shoe repair, shoe shops, and stores of similar tenants. These types of retail establishments draw shoppers within a quarter mile trade radius. They are places people would run a Saturday errand.
Food & Beverage (F&B): sit-down restaurants, take-away food, cafes, bars, coffee shops, sandwich shops, ice cream shops, fast food restaurants, and similar types of tenants. Food and Beverage uses are used by local residents, but their draw comes from a bit further, a ½ mile radius.
General Merchandise, Apparel, Furnishings, and Other (GAFO): clothing stores, furniture stores, discount stores, bookstores, jewelry stores, gift stores, pet supply, home décor stores, music stores, sporting goods stores, craft stores, mattress stores, electronic stores, auto parts stores, hardware stores, and similar types of tenants. GAFO includes all other retail and is the largest category. Retail stores in the GAFO category are usually bigger in size and tend to draw shoppers who make big purchases, but less frequently. Therefore, GAFO draws shoppers outside a one mile trade radius.
6
Cultural
Cultural uses include entertainment
activities, such as art galleries,
performing arts centers, historic
theatres, as well as churches,
synagogues, and other religious
institutions. Cultural uses provide for a
destination apart from retail stores in
the downtown and often act as the
anchor. Many visitors who are visiting
the cultural anchor will also take the
time to stop in a retail shop and dine.
Cultural uses tend to be nonprofit
organizations, thus not contributing to
the tax base. Often, they are not
required to take part in any
assessments that are levied by a
Business District Improvement or
Merchants Fund. However, if they are
dedicated to the community and act as
a partner, they will often be willing to
make a donation in lieu or contribute in
other ways.
Civic
Civic uses include municipal buildings,
firehouses, police departments,
libraries, or any government offices.
Civic uses are the traditional anchor to
older retail districts and provide
tremendous foot traffic for nearby retail
stores. While civic uses do not
contribute to the sales in the
downtown, they have an employment
base that will be looking to shop and
eat during the lunch hour. Many
services and food and beverage uses
can be supported by civic uses.
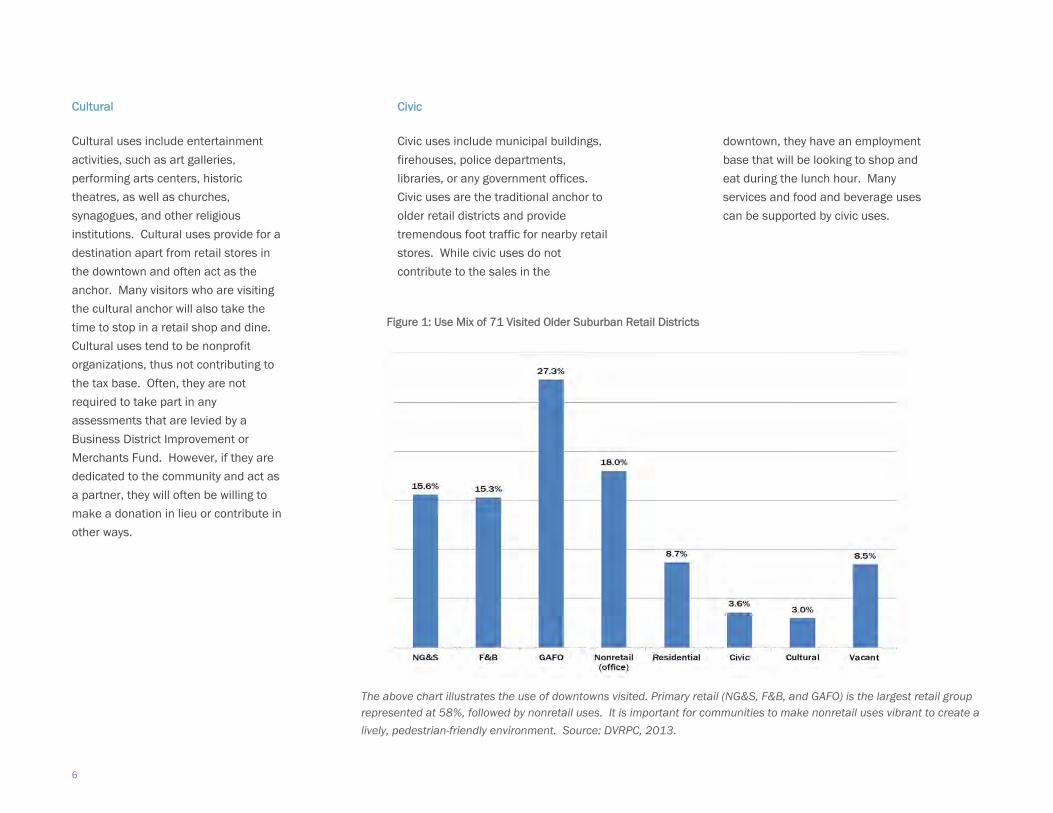
The above chart illustrates the use of downtowns visited. Primary retail (NG&S, F&B, and GAFO) is the largest retail group represented at 58%, followed by nonretail uses. It is important for communities to make nonretail uses vibrant to create a lively, pedestrian-friendly environment. Source: DVRPC, 2013.
Figure 1: Use Mix of 71 Visited Older Suburban Retail Districts

R E V I T A L I Z I N G S U B U R B A N D O W N T O W N R E T A I L D I S T R I C T S 7
Local Stores versus National Chains
National chain stores are often a welcome
addition to any downtown, usually acting as an
anchor. Chain stores are retail outlets that
share a brand and central management with
standardized business practices. To be
considered a chain, the store must have more
than 10 units under the same brand and have
a central headquarters; otherwise, it offers
franchise contracts. Examples of franchises are
Friendly’s Restaurants and Kennedy (Crown)
Fried Chicken. Franchises have central
headquarters, but are owned and operated by
individual proprietors.
There are also local or regional chain stores
that are not national. For the purposes of
categorizing retail, any store that has more than
three locations is considered a local or regional
chain (versus national chain with 10 or more
stores). A local or regional chain example is A
Taste of Olive in West Chester, Ardmore, and
Haddonfield, or Pat’s Pizza, located throughout
South Jersey, Pennsylvania, Delaware, and
Maryland. The remainder of stores is
categorized as local, meaning family owned and
unique to that particular retail district.
Retail Mix
Achieving the right tenant mix - or even local
versus chain - is one element of a retail
district’s success, but the primary goal is to
ensure that the retail and nonretail uses
support both the nearby neighborhood and
associated residential demographic. Figure 1
illustrates the general use mix of the 71 retail
districts visited. The largest percent is made up
of General Merchandise, Apparel, Furnishings,
and Other (GAFO), followed by nonretail (office)
uses. Communities should strive to get credit-
worthy retail tenants that serve the basic needs
and essentials of residents in the immediate
neighborhood to fill spaces, such as NG&S,
rather than focusing too much on the mix of
retail that makes up the district. The demand
for a variety of goods and services will balance
out.
Taste of Olive in Haddonfield, NJ is a regional chain located in two other downtowns: West Chester, PA, and Ardmore, PA.

8
What are the Trends Affecting Retail Districts?
By understanding the direction of national and
regional retail trends, local leaders and
businesses can survive and continue to grow.
Below are recent retail trends that many retail
districts may be able to build upon.
Baby Boomers
Baby boomers (born 1946-1964) have had a
tremendous effect on the retail economy. As
they formed households, a large demand was
created for goods and furnishings. Often, they
“traded up,” buying items of better quality than
their parents possessed. However, as they
begin to age, they are now beginning to scale
back, looking to purchase more moderately
priced goods. This is the main market
supporting “value retailing,” which includes
manufacturers and retailers such as Wal-Mart,
Kmart, Target, and Costco.
Baby ‘Boomlet’
Since 1989, over four million children have
been born every year in the US. This surge in
the population, or ‘baby boomlet’, has shown its
strength for demands on multimedia –
computers, cell phones – as well as children’s
clothes and toys.
Affluent Households
Households with incomes over $75,000 have
more discretionary spending power than
average and are not impacted the same way by
downturns in the economy. Studies have shown
that clothing purchases for affluent households
are considerably above average, as well as
home remodeling and improvement products.
Affluent empty nesters tend to spend more on
travel.
Ethnic Diversity
Foreign-born residents and their American-born
children are becoming an increasingly powerful
economic force, creating opportunity and
challenges for development and retail markets.
For example, the Latino and Asian populations
have grown throughout the region, providing
new demands on the retail markets. Local
economic development agencies can tell
prospective retailers how a neighborhood is
changing, thereby attracting stores that meet
the community’s market demands. The foreign-
born population is also more likely to start their
own business than their American-born cohorts.
Downtown retail districts also have an
opportunity to capitalize on several recent
development trends. They include:
Walkable Communities The National Association of Realtors’ 2011 Community Preference Survey revealed that Americans would like to live in walkable communities, where shops, restaurants, and local goods and services are within an easy stroll from their homes, and their jobs are a short commute away, as long as those communities can also provide privacy from neighbors and detached, single-family homes.
At the same time, many developers are switching from developing typical suburban strip centers to urbanized locations with high foot traffic and are transit accessible. They are building up rather than out. Many developers are now willing to work around various issues that downtown locations present.
In addition, historically, retailers were more interested in immediate available space and less interested in the market that traditional downtowns offered. Now, retailers look for downtowns that can provide an existing strong customer base, as well as attractive streetscapes and facades. This provides additional exposure for their storefronts and accesses a different shopping population.

R E V I T A L I Z I N G S U B U R B A N D O W N T O W N R E T A I L D I S T R I C T S 9
Adaptive Reuse
Adaptive reuse creates a new retail
environment within existing buildings. It
provides for preservation and eliminates the
need for demolition or land assembly. In most
circumstances, adaptive reuse of buildings is
cheaper than new construction in older
communities.
“Experience Shopping”
Experience shopping includes shopping areas
with restaurants, carnival rides, performers,
and national chain stores. Today’s shopping
experience is often outside. Some
communities are reinventing their closed
shopping malls into outdoor centers; however,
traditional downtowns have been utilizing this
pattern since they were established.
Market for Smaller Offices
Recent trends in office space have curtailed the
demand for large amounts of office space.
Companies have downsized due to
telecommunications. On average, companies
have reduced the space needed for workers
from 250 square feet to 175 square feet. More
than ever, companies are looking for space that
can provide their employees with a better
quality of work life and transit options.
Policies that Impede Downtown Retail
Revitalization
Constructing ring roads/bypasses
Creating pedestrian only zones and parking in remote lots
Relocating municipal functions away from downtown
Removing on-street parking
Creating one-way streets
Losing a key retailer
Opening of new shopping center
Not addressing petty crime
Failing to maintain the public realm
Refusing national retailers/discount department stores
Source: Streetsense, 2012. The vibrancy of downtown Kennett Square, PA, takes advantage of the small office market and adaptive reuse trends. The photo on top shows the Market at Liberty Place. The market is an indoor farmers market housed in a building previously used during WWII to disassemble ships. The market offers food and wine and is a great meeting place for lunch and dinner. The photo on bottom illustrates the headquarters for Genesis, an elderly care company. Built without a cafeteria, all 600 employees are encouraged to visit the downtown eateries for shopping and lunch options.
1 0
Niche Retail
A niche is a special segment of the market well-
situated for dealing with the competitive nature
of retail. Most successful downtowns have
been built upon the strengths of two or three
economic niches. They are often based on a
specialization and work best when it is unique,
offering little or no outside competition. Niche
retail is often a strong component of
downtowns that have a traditional, historic
urban form.
A downtown niche can provide growth potential
and be used as an effective business
recruitment tool. The existence of a niche
demonstrates to potential related retailers that
there is already a proven level of customer
traffic and expenditures. Often, downtown
businesses do not realize they have the basis of
a niche. Documenting the existing businesses
will enable a community to evaluate whether a
niche may already exist. Niche economies can
be goods and services- based or consumer-
based. Goods and service based niches
include antiques, specialty food chains (A Taste
of Olive), and arts and entertainment activities
such as theatre, dance, art galleries or
museums. Consumer-based niches include
ethnic groups, tourism, or office workers.
Accounting for a majority of this nation’s
population growth, African Americans, Asians,
and Latinos are now important segments for
retailers with tremendous spending power.
Tourism is important but not for every
downtown. Lastly, the office market is
continually changing. With more businesses
offering telecommuting, there is less demand
for Class A office space. However, businesses
that do require space often seek areas that are
transit accessible and offer their employees
shopping and dining in close proximity. This is
particularly important when capturing the lunch
time business of nearby workers at local food
and beverage establishments.
Having identified an existing niche or potential
niche does not mean it will be effective. A
proper market assessment, measuring the
supply and demand, should be completed. In
this case, household expenditures are
important, as many shoppers will buy niche
products once the essential goods and services
have been purchased. Having suitable
commercial space is also important. What may
be appropriate for one niche may be entirely
unsuitable for another. For instance, artists
need large spaces of at least 5,000 square
feet, whereas antique retailers may prefer
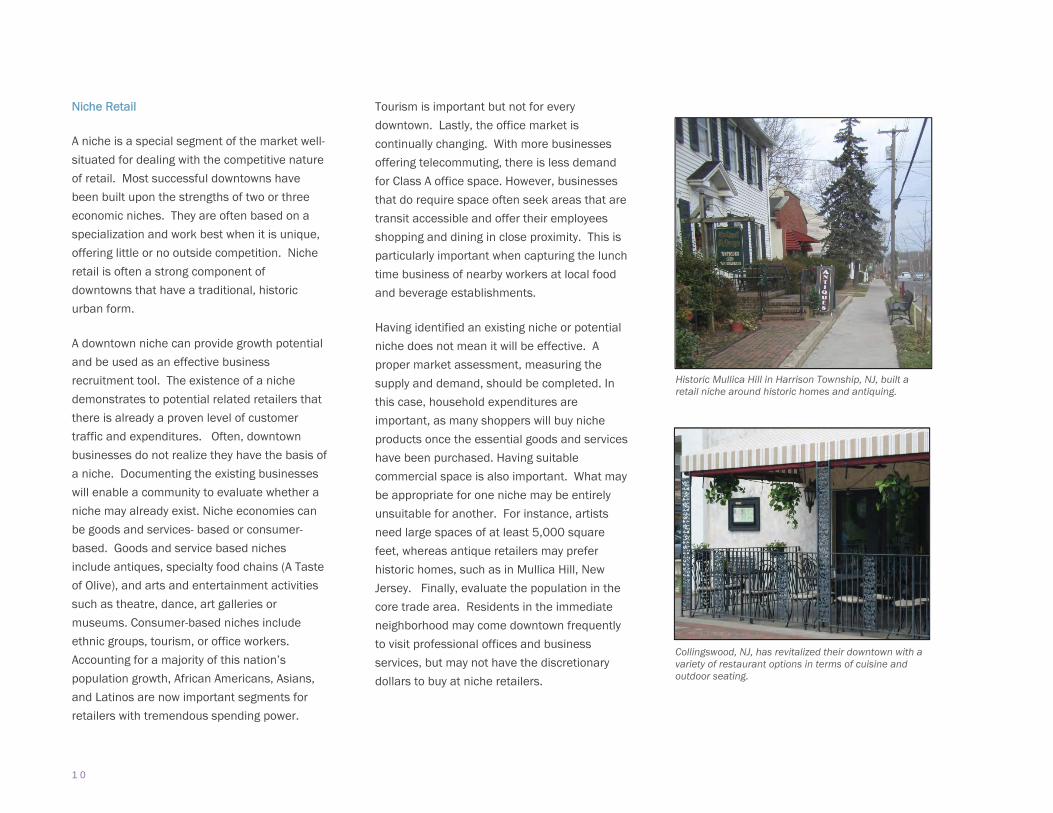
historic homes, such as in Mullica Hill, New
Jersey. Finally, evaluate the population in the
core trade area. Residents in the immediate
neighborhood may come downtown frequently
to visit professional offices and business
services, but may not have the discretionary
dollars to buy at niche retailers.
Historic Mullica Hill in Harrison Township, NJ, built a retail niche around historic homes and antiquing.
Collingswood, NJ, has revitalized their downtown with a variety of restaurant options in terms of cuisine and outdoor seating.
R E V I T A L I Z I N G S U B U R B A N D O W N T O W N R E T A I L D I S T R I C T S 1 1
Chapter Two: Evaluating Suburban Retail Districts in Greater Philadelphia
Retail in the small towns across the
United States does not follow the same
formula. Retail districts face a variety
of challenges, and the success of one
street cannot be easily replicated. In
the Greater Philadelphia region, many
older suburban retail districts are
either no longer supported by the
market conditions or they have not
evolved to address changes in
population and income. In order for
these retail districts to thrive and be
successful, it is important to
understand the evolution of retail and
the building blocks that successful
streets have in common.
Greater Philadelphia communities
analyzed include those categorized as
an older suburb/mature in
Connections 2040. These criteria
provided over 100 “traditional”
suburban downtowns to evaluate.
Field work was performed to collect
information on various elements,
including zoning, infrastructure, retail
mix, signs, open space,
pedestrian/vehicle counts,
management structure, historic
properties, retail anchor, vacancy rate,
Walk Score, and transit accessibility.
Demographic information was then
pulled from the Census about
population within a quarter mile, the
number of households within a half
mile, and median household income
within a half mile. This information
enabled a comparison of all districts
and defined which elements were
present or lacking in suburban retail
districts throughout the region. Based
on the qualitative and quantitative
analysis, 71 retail districts were
included for a more detailed analysis,
as shown in Figure 2.
Once the retail districts were chosen,
the boundaries for each retail district
were drawn. Since there often are no
defined boundaries of a central
business district, it is about perception
and the feeling exuded from a
particular community. Instinctively, the
retail district contains taller buildings,
higher density, transportation nodes,
and a large number of pedestrians on
the street. Retail districts can be
defined by natural or manmade
borders, such as bodies of water, rail
tracks, topography, or roadways.
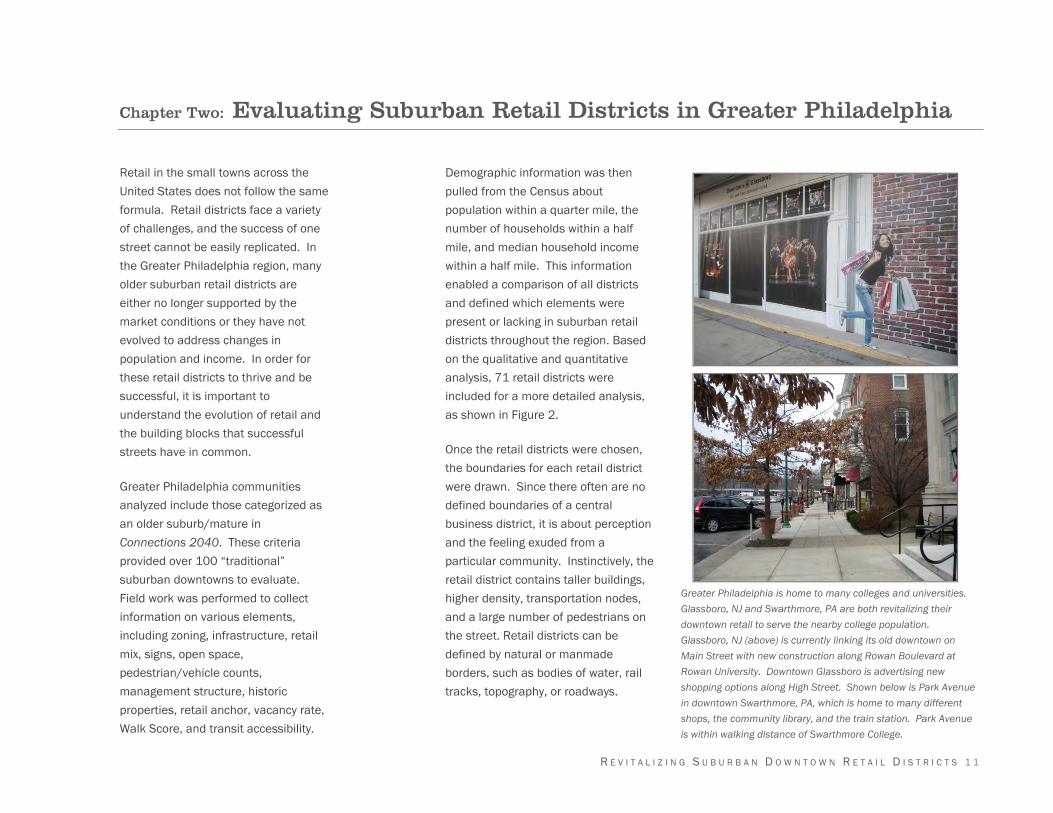
Greater Philadelphia is home to many colleges and universities. Glassboro, NJ and Swarthmore, PA are both revitalizing their downtown retail to serve the nearby college population. Glassboro, NJ (above) is currently linking its old downtown on Main Street with new construction along Rowan Boulevard at Rowan University. Downtown Glassboro is advertising new shopping options along High Street. Shown below is Park Avenue in downtown Swarthmore, PA, which is home to many different shops, the community library, and the train station. Park Avenue is within walking distance of Swarthmore College.

1 2
Essentially, the CBD is what people
think of when they think of a
community’s downtown area. For the
purposes of this study, boundary lines
were drawn at natural barriers or in
areas where residential uses began to
dominate the street front.
Table 1 outlines the common retail
district elements found in all 71 retail
districts and assigns a priority level of
how relevant they are to the success of
the district. Elements found to have
high relevance are not necessarily the
only elements that will contribute to
the success of a retail district. These
seven elements have been categorized
as high: BID/Merchants Association,
sidewalk width, high Walk Score,
vacancy rate, parking options,
anchored, and high traffic counts
(AADTS). These are important criteria
that retailers study before making a
location decision and should be the
focus of a downtown retail strategy.
Elements categorized as medium
relevance include streetscape design,
local versus national tenant mix, lease
rents, historic districts, household
income, transit accessibility, residential
population and events and
programming. Population and
household income may not be able to
change quickly but the other physical
elements categorized as medium can
be addressed in the short term.
Streetscape design and events may
bring more people to the downtown,
but they need a place to shop and visit
first.
Finally, elements categorized as low
relevance include open space, the
retail mix, and number of blocks. Open
space is usually included in site
requirements, while the number of
blocks and retail mix do not require
immediate attention when embarking
on an overall revitalization of the
district. The number of blocks and
retail mix should be included in the
long- term strategy for the community
and require further analysis and time.
The following pages highlight ten great
older retail districts that exhibited all
seven high relevant elements, as well
as medium relevant elements. They
include: Bordentown City, Bryn Mawr,
Collingswood, Doylestown Borough,
Downingtown, Haddonfield, Kennett
Square, Media, Princeton, and West
Chester. (All data on the 71 districts
are available at www.dvrpc.org/sos).
.
Above, Bordentown City, NJ, has reused previous residential buildings as storefronts. Below, Primo Hoagies takes space inside an old mill in downtown Downingtown, PA, adding to Chester County’s rural charm.
R E V I T A L I Z I N G S U B U R B A N D O W N T O W N R E T A I L D I S T R I C T S 1 3
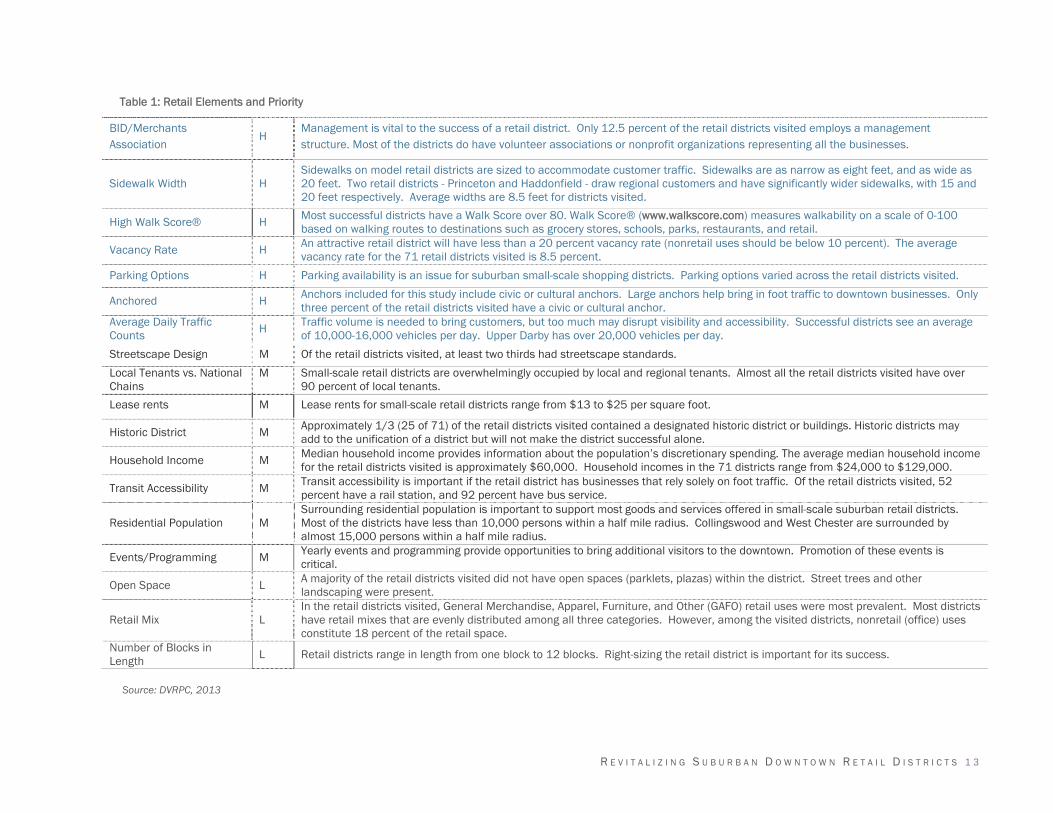
Table 1: Retail Elements and Priority
Source: DVRPC, 2013
BID/Merchants Association
H Management is vital to the success of a retail district. Only 12.5 percent of the retail districts visited employs a management structure. Most of the districts do have volunteer associations or nonprofit organizations representing all the businesses.
Sidewalk Width H Sidewalks on model retail districts are sized to accommodate customer traffic. Sidewalks are as narrow as eight feet, and as wide as 20 feet. Two retail districts - Princeton and Haddonfield - draw regional customers and have significantly wider sidewalks, with 15 and 20 feet respectively. Average widths are 8.5 feet for districts visited.
High Walk Score® H Most successful districts have a Walk Score over 80. Walk Score® (www.walkscore.com) measures walkability on a scale of 0-100 based on walking routes to destinations such as grocery stores, schools, parks, restaurants, and retail.
Vacancy Rate H An attractive retail district will have less than a 20 percent vacancy rate (nonretail uses should be below 10 percent). The average vacancy rate for the 71 retail districts visited is 8.5 percent.
Parking Options H Parking availability is an issue for suburban small-scale shopping districts. Parking options varied across the retail districts visited.
Anchored H Anchors included for this study include civic or cultural anchors. Large anchors help bring in foot traffic to downtown businesses. Only three percent of the retail districts visited have a civic or cultural anchor.
Average Daily Traffic Counts H Traffic volume is needed to bring customers, but too much may disrupt visibility and accessibility. Successful districts see an average
of 10,000-16,000 vehicles per day. Upper Darby has over 20,000 vehicles per day.
Streetscape Design M Of the retail districts visited, at least two thirds had streetscape standards.
Local Tenants vs. National Chains
M Small-scale retail districts are overwhelmingly occupied by local and regional tenants. Almost all the retail districts visited have over 90 percent of local tenants.
Lease rents M Lease rents for small-scale retail districts range from $13 to $25 per square foot.
Historic District M Approximately 1/3 (25 of 71) of the retail districts visited contained a designated historic district or buildings. Historic districts may add to the unification of a district but will not make the district successful alone.
Household Income M Median household income provides information about the population’s discretionary spending. The average median household income for the retail districts visited is approximately $60,000. Household incomes in the 71 districts range from $24,000 to $129,000.
Transit Accessibility M Transit accessibility is important if the retail district has businesses that rely solely on foot traffic. Of the retail districts visited, 52 percent have a rail station, and 92 percent have bus service.
Residential Population M Surrounding residential population is important to support most goods and services offered in small-scale suburban retail districts. Most of the districts have less than 10,000 persons within a half mile radius. Collingswood and West Chester are surrounded by almost 15,000 persons within a half mile radius.
Events/Programming M Yearly events and programming provide opportunities to bring additional visitors to the downtown. Promotion of these events is critical.
Open Space L A majority of the retail districts visited did not have open spaces (parklets, plazas) within the district. Street trees and other landscaping were present.
Retail Mix L In the retail districts visited, General Merchandise, Apparel, Furniture, and Other (GAFO) retail uses were most prevalent. Most districts have retail mixes that are evenly distributed among all three categories. However, among the visited districts, nonretail (office) uses constitute 18 percent of the retail space.
Number of Blocks in Length L Retail districts range in length from one block to 12 blocks. Right-sizing the retail district is important for its success.

14
Bordentown City Farnsworth Ave. (CR 545) / Crosswicks St. (CR 528)
Quakertown Borough W. Broad St. (PA 313) / 3rd St.Burlington City High St. / Broad St.
Sellersville Borough N. Main St. / Maple Ave.Maple Shade Township Main St. (CR 537) / Forklanding Rd.
Yardley Borough Main St. / Afton Ave. (PA 332)Moorestown Township Main St. (CR 537) / Mill St.
Coatesville City E. Lincoln Highway (US 30 Business) / 2nd Ave.Mount Holly Township High St. / Mill St. (CR 537)
Downingtown Borough E. Lancaster Ave. (US 30 Business) / Beech St.Palmyra Borough Broad St. (CR 543) / Cinnaminson Ave. (CR 607)
Kennett Square Borough Baltimore Pike / Union St. (PA 82)Riverside Township S. Pavilion Ave. / Scott St. (CR 613)
Malvern Borough King St. / Warren Ave.Riverton Borough Broad St. (CR 543) / Main St. (CR 603)
Phoenixville Borough Bridge St. (PA 113) / Main St.Audubon Borough (Merchant St.) Merchant St. / Oakland Ave.
West Chester Borough Gay St. (PA 3) / High St. (PA 100)Barrington Borough Clements Bridge Rd. (NJ 41) / Trenton Ave.
Berlin Borough White Horse Pike (US 30) / Broad St.
Collingswood Borough Haddon Ave. (CR 630) / Collings Ave. (CR 561)
Darby Borough Main St. / Powell Rd.
Gloucester City Broadway (CR 551) / Market St. (CR 634)
East Lansdowne Borough Baltimore Pike / Penn Blvd.
Haddon Heights Borough Station Ave. (CR 656) / Atlantic Ave. (CR 727)
Haverford Township (Brookline) Darby Rd. / Brookline Blvd.
Haddon Township (Westmont) Haddon Ave. (CR 561) / Crystal Lake Rd. (CR 643)
Haverford Township (Oakmont) Darby Rd. / Campbell Ave.
Haddonfield Borough Kings Highway (NJ41) / Haddon Ave. (CR 561)
Lansdowne Borough Lansdowne St. / Baltimore Ave.
Laurel Springs Borough Atlantic Ave. (CR 727) / Stone Rd. (CR 669)
Marcus Hook Borough Market St. (PA 452) / 10th St. (US 13)
Merchantville Borough Maple Ave. (CR 662) / Center St. (CR 537)
Media Borough State St. / S. Jackson St.
Pennsauken Township Westfield Ave. (CR 610) / Browning Rd. (CR 612)
Norwood Borough Winona Ave. / Chester Pike (US 13)
Pine Hill Borough Erial Rd. (CR 703) / Branch Ave. (CR 687)
Radnor Township (Wayne) Lancaster Ave. (US 30) / Wayne Ave.
Glassboro Borough High St. (CR 641) / Main St. (CR 553)
Ridley Park Borough E. Hinckley Ave. / E. Sellers Ave.
Harrison Township (Mullica Hill) N. Main St. (NJ 45) / Bridgeport-Mullica Hill Rd. (US 322)
Swarthmore Borough N. Chester Rd. / Park Ave.
Paulsboro Borough E. Broad St. (NJ 44) / Delaware St. (CR 667)
Upper Darby Township Market St. (PA 3) / S. 69th St.
Pitman Borough Broadway Ave. (CR 553) / Holly Ave. (CR 624)
Ambler Borough Butler Ave. / Main St.
Swedesboro Borough Kings Highway (CR 551) / Railroad Ave.
Cheltenham Township (Glenside) S. Easton Rd. / Glenside Ave.
Wenonah Borough West St. / Mantua Ave. (CR 632)
Hatboro Borough S. York Rd. (PA 263) / E. Moreland Rd.
Westville Borough Broadway (CR 551)/ Pine St.
Jenkintown Borough Old York Rd. (PA 611) / West Ave.
Woodbury City Broad St. (NJ 45) / Delaware St. (CR 640)
Lansdale Borough Main St. (PA 63) / Susquehanna Ave.
Hightstown Borough Main St. (NJ 33) / Stockton St. (CR 571)
Lower Merion Township (Ardmore) Lancaster Ave. (US 30) / Anderson Ave.
Princeton Nassau St. (NJ 27) / Witherspoon St.
Lower Merion Township (Bryn Mawr) Lancaster Ave. (US 30) / Merion Ave.
Bristol Borough Mill St. / Radcliffe St.
Lower Merion Township (Haverford) Lancaster Ave. (US 30) / Haverford Station Rd.
Doylestown Borough State St. (US 202) / Main St.
Narberth Borough Narberth Ave. / Haverford Ave.
Langhorne Borough Maple St. (PA 213) / Bellevue Ave.
Norristown Borough Main St. / Swede St.
Morrisville Borough W. Bridge St. (PA 32) / Pennsylvania Ave.
Pottstown Borough E. High St. (PA 663) / Hanover St.
New Hope Borough Main St. (PA 32) / Bridge St. (PA 179)
Souderton Borough N. Main St. (PA 113) / Chestnut St.
Newtown Borough State St. / Washington Ave.
Telford Borough N. Main St. / W. Broad St.
Perkasie Borough W. Market St. / S. 6th St.1
382
393
404
415
426
437
448
459
4610
11
12
47
13
48
14
49
15
50
16
51
17
52
18
53
19
54
20
55
21
56
22
57
23
58
24
59
25
60
26
61
27
62
28
63
29
64
30
65
31
66
32
67
33
68
34
69
35
70
36
71
37
Retail District Cross Streets Retail District Cross StreetsMap
NumberMap
Number

15
202
32276
206
95
13
295
30
1
202
295206
130
202
95
322
76
30
1
NJ TPKE
NJ TPKE
AC
PKWY
GS
PA TPKE
PA TPKE
322
130
130
295
422
EXPWY
476
476
76
276
41
100
313663
73
73
63
309
309 611
3
202
1
1
252
420
29
31
72
70
70
73
38
42
73
55
40
30
BUCKS
CHESTER
BURLINGTON
MONTGOMERY
MERCER
GLOUCESTER
CAMDEN
DELAWARE
PHILADELPHIA
7170
69
68
676665
64
63
62
61
60
59
58
5756
55
54
53
52
51
5049
4847
46
45
44
43
4241
40
39
38
37
36
35
34
33
32
31
30
29
28
27
26
2524
23
22
21
20
1918
17
1615
1413
12
11
10
9
8
7
65
43
2
1
Miles
0 4 8
Retail District
Figure 2
Retail Districts Studied

Bordentown City BURLINGTOWN COUNTY, NJ
The core of Bordentown’s business district is concentrated on Farnsworth Avenue and Crosswicks Street, and is easily accessible via Route 130 and I-295. Businesses include art galleries, bookshops, antiques shops, a vintage record shop, as well as several restaurants and professional offices. Downtown Bordentown has a lively adjacent residential neighborhood. The Downtown Association sponsors two annual events in the spring and fall which bring in new visitors.
Management: Downtown Bordentown Association (www.downtownbordentown.com)Sidewalk Width: 10 feetWalk Score: 69Parking Options: metered street parking, public parking lots Anchored: Borough Hall, Fire, Elementary School, and PolicePopulation within ½ mile: 3,395Median Household Income within ¼ mile: $66,222 Number of Blocks in Study Area: 10
27.7%
4.4% 7.7%NG&S
13.3%F&B
21.1%GAFO
22.5%Office
Vacant (3.3%)
Residential
Civic/Cultural
Use Mix
i Bordentown City is located on the NJ Transit’s RiverLINE, connecting the downtown district to Trenton and Philadelphia.
16

6.6%
18%
NG&S8.2%Vacant
16.4%F&B
41.0%GAFO
9.8%Office
Civic/Cultural
Use Mix
Bryn MawrMONTGOMERY COUNTY, PA
Management: Bryn Mawr Beautiful Foundation; Bryn Mawr Business Association (www.brynmawrpa.org/bmba)Sidewalk Width: 10 feetWalk Score: 98Parking Options: metered street parking, public parking lots Anchored: Bryn Mawr Film Institute (cultural)Population within ½ mile: 5,997Median Household Income within ¼ mile: $51,977
Number of Blocks in Study Area: 6
Situated along Lancaster Avenue on the Main Line, Bryn Mawr is a thriving business district. Sprinkled throughout this neighborhood shopping district are offi ces, services, and charming boutique stores. The Bryn Mawr retail district is located within a quarter-mile of the Bryn Mawr train station, and enjoys a ballooning core trade area population when area colleges – Bryn Mawr and Haverford – are in session. The Bryn Mawr retail district receives high volumes of traffi c during the day but competition is fi erce with two other retail districts within walking distance.
i Bryn Mawr’s retail district is one of three identifi ed districts located in Lower Merion Township. Of the three, Bryn Mawr has the lowest percentage of offi ce uses (9.8%) and the highest percentage of cultural uses (3.3%).
17

18.3%
3.5% 7.2%
13.0%NG&S
17.7%F&B
23.3%GAFO17.0%
Office
Vacant
ResidentialCivic/Cultural
Use Mix
CollingswoodCAMDEN COUNTY, NJ
i
Management: Collingswood Partners, Collingswood Business Association (collingswood.com/shopping/collingswood-partners)Sidewalk Width: 8 feetWalk Score: 91Parking Options: kiosk street parking, public parking lots Anchored: Borough Hall, PATCO station Population within ½ mile: 14,686Median Household Income within ¼ mile: $ 68,292 No. of Blocks in Study Area: 21
Located along the PATCO High Speed Line, Collingswood’s revitalized Haddon Avenue Business District offers a full array of boutique shops, restaurants, professional offices, and cultural entertainment. Collingswood is within a 10 minute PATCO ride to Philadelphia and offers new housing options directly next to the train station at the LumberYard. Collingswood hosts a variety of events throughout the year to bring in visitors. At 21 blocks, it is one of the largest shopping districts.
To encourage local shopping, Collingswood Partners Inc. runs the Collingswood Cash program (money only to be spent at Collingswood retailers and restaurants). Shoppers that purchase $50 in Collingswood Cash will receive an additional $20 to spend anywhere in town.
18
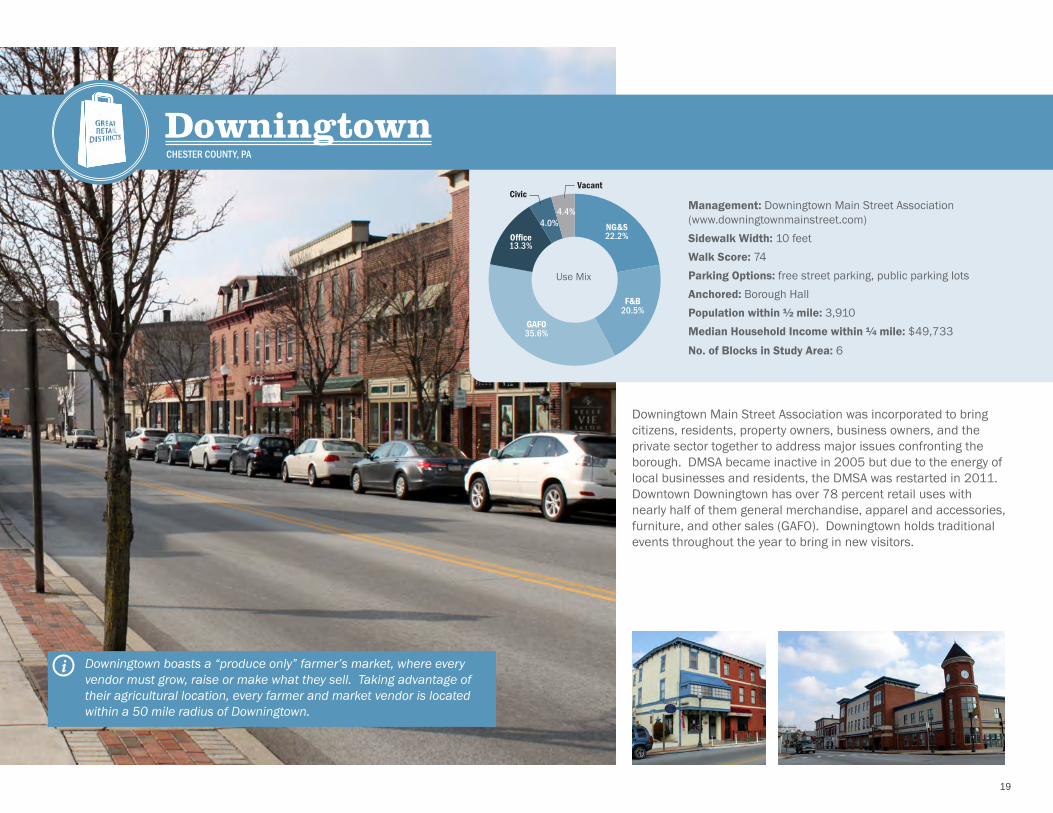
Downingtown Main Street Association was incorporated to bring citizens, residents, property owners, business owners, and the private sector together to address major issues confronting the borough. DMSA became inactive in 2005 but due to the energy of local businesses and residents, the DMSA was restarted in 2011. Downtown Downingtown has over 78 percent retail uses with nearly half of them general merchandise, apparel and accessories, furniture, and other sales (GAFO). Downingtown holds traditional events throughout the year to bring in new visitors.
Downingtown boasts a “produce only” farmer’s market, where every vendor must grow, raise or make what they sell. Taking advantage of their agricultural location, every farmer and market vendor is located within a 50 mile radius of Downingtown.
22.2%
20.5%
35.6%
13.3%
4.0%
4.4% NG&S
F&B
Office
GAFO
VacantCivic
DowningtownCHESTER COUNTY, PA
Management: Downingtown Main Street Association (www.downingtownmainstreet.com)Sidewalk Width: 10 feetWalk Score: 74Parking Options: free street parking, public parking lots Anchored: Borough Hall Population within ½ mile: 3,910Median Household Income within ¼ mile: $49,733 No. of Blocks in Study Area: 6
i
Use Mix
19
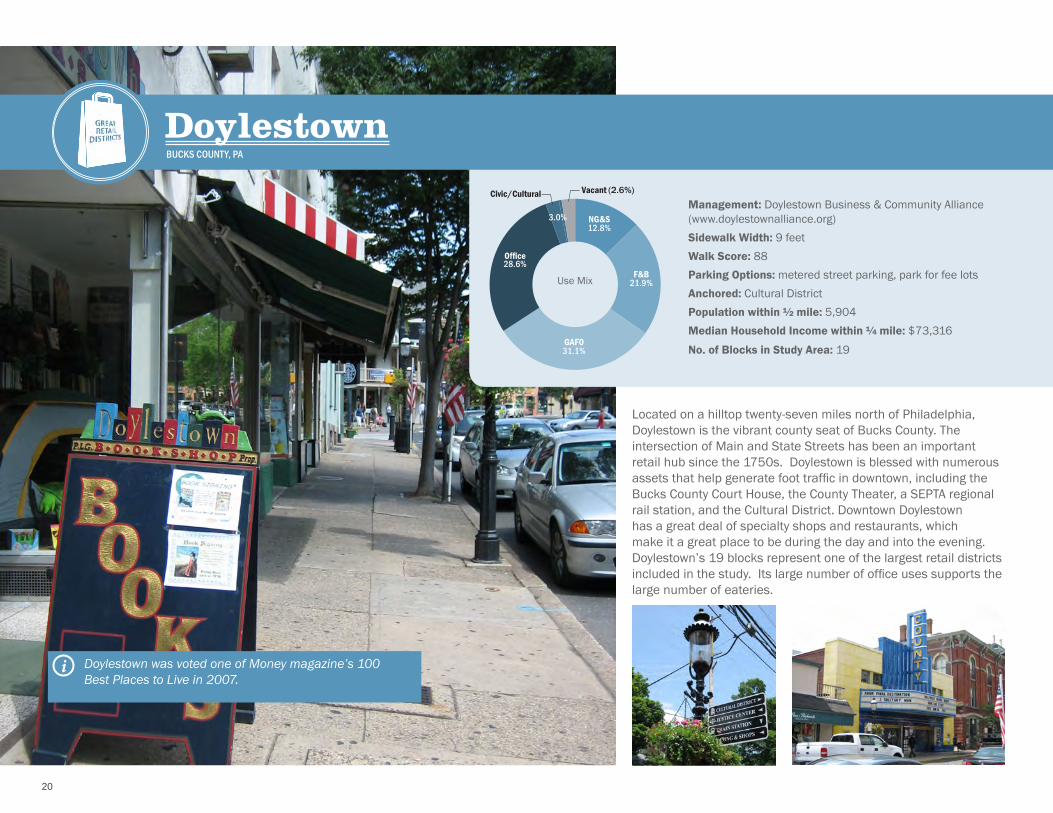
12.8%NG&S
21.9%F&B
31.1%GAFO
28.6%
3.0%
Office
Vacant (2.6%)Civic/Cultural
Use Mix
DoylestownBUCKS COUNTY, PA
i Number of Blocks: 19Households in Core Trade Area: 3,212
Management: Doylestown Business & Community Alliance (www.doylestownalliance.org)Sidewalk Width: 9 feetWalk Score: 88Parking Options: metered street parking, park for fee lots Anchored: Cultural District Population within ½ mile: 5,904Median Household Income within ¼ mile: $73,316No. of Blocks in Study Area: 19
Located on a hilltop twenty-seven miles north of Philadelphia, Doylestown is the vibrant county seat of Bucks County. The intersection of Main and State Streets has been an important retail hub since the 1750s. Doylestown is blessed with numerous assets that help generate foot traffic in downtown, including the Bucks County Court House, the County Theater, a SEPTA regional rail station, and the Cultural District. Downtown Doylestown has a great deal of specialty shops and restaurants, which make it a great place to be during the day and into the evening. Doylestown’s 19 blocks represent one of the largest retail districts included in the study. Its large number of office uses supports the large number of eateries.
Doylestown was voted one of Money magazine’s 100 Best Places to Live in 2007.
20

7.8%
18.0%
49.0%Office
21.4%NG&S
F&B
GAFO
Cultural
3.8%
HaddonfieldCAMDEN COUNTY, NJ
i
Management: Partnership for Haddonfield (www.haddonfieldprofessionals.org)Sidewalk Width: 20 feetWalk Score: 77Parking Options: metered street parking, park for fee lots Anchored: Borough Hall, PATCO station Population within ½ mile: 7,056Median Household Income within ¼ mile: $126,386No. of Blocks in Study Area: 14
Use Mix
Located within walking distance of the PATCO High Speed Line, Haddonfield has a bustling downtown filled with an array of shops. From salons and flower shops to cafes and specialty stores, Haddonfield has a diverse mix of retailers that keep shoppers coming back. The retail shops line Kings Highway, Haddon Avenue, and Tanner Street with branded wayfinding signage to direct shoppers. Haddonfield has an historic fabric that leads the district to be unified with only a minimal number of chain retailers. Downtown also has various office uses for doctors, lawyers, and architects. Nonretail uses make up 49 percent of the street while traditional retail accounts for 47 percent. At the time of the field work, downtown Haddonfield had less than one percent vacancy.
Haddonfield Town-Wide Gift Certificates are accepted at over 200 retail and service businesses and over 600 professional offices throughout the community.
21

7.0%
5.0% 6.5%NG&S
18.8%F&B
42.0%GAFO
18.0%Office
Vacant (2.7%)
ResidentialCivic
Kennett SquareCHESTER COUNTY, PA
i
Management: Historic Kennett Square Inc. (www.historickennettsquare.com)Sidewalk Width: 10 feetWalk Score: 82Parking Options: metered street parking, park for fee lots, and structured parkingAnchored: Historic Sites Population within ½ mile: 4,501Median Household Income within ¼ mile: $61,758No. of Blocks in Study Area: 9
Kennett Square is the smallest town in America to have its own symphony orchestra.
Use Mix
Good things come in small packages. The quaint small town of Kennett Square, known as the Mushroom Capital of the World, is located in the Brandywine Valley in Chester County. From antiques to clothing and books to gifts, Kennett Square has it all. Known for the famous Talula’s Table Restaurant, historic Kennett is surrounded by a rural landscape, home to mushroom farms. The retail shops account for 68 percent of the uses in the district; the highest category is GAFO. Kennett Square hosts many events throughout the year, making it a destination for residents and tourists.
22

18.5%NG&S
26.7%F&B
24.7%GAFO
26.0%Office
Cultural (1.4%) Vacant (2.7%)
MediaDELAWARE COUNTY, PA
i
Management: Media Business Authority (MBA) (www.mediabusinessauthority.com)Sidewalk Width: 10 feetWalk Score: 95Parking Options: metered street parking, park for fee lots, and structured parkingAnchored: County Courthouse Complex Population within ½ mile: 6,735Median Household Income within ¼ mile: $54,617No. of Blocks in Study Area: 14
State Street is Media’s bustling main street. Though less than one square mile in size, Media is served by SEPTA regional rail and the 101 Trolley, and is the county seat. During the week, the County Courthouse brings in over 300,000 visitors and employees to Media during normal business hours, many of whom shop and dine while they are in town. In addition to stores and professional offices, there are several parks, schools, playgrounds, houses of worship, community centers, and entertainment venues on or within walking distance of State Street. Media is a diverse and inclusive place. From street festivals to live music to a performance theater to poetry readings, State Street offers entertainment for all ages.
Media became the first community in the U.S. to attain Fair Trade Town certification in June 2006.
Use Mix
23
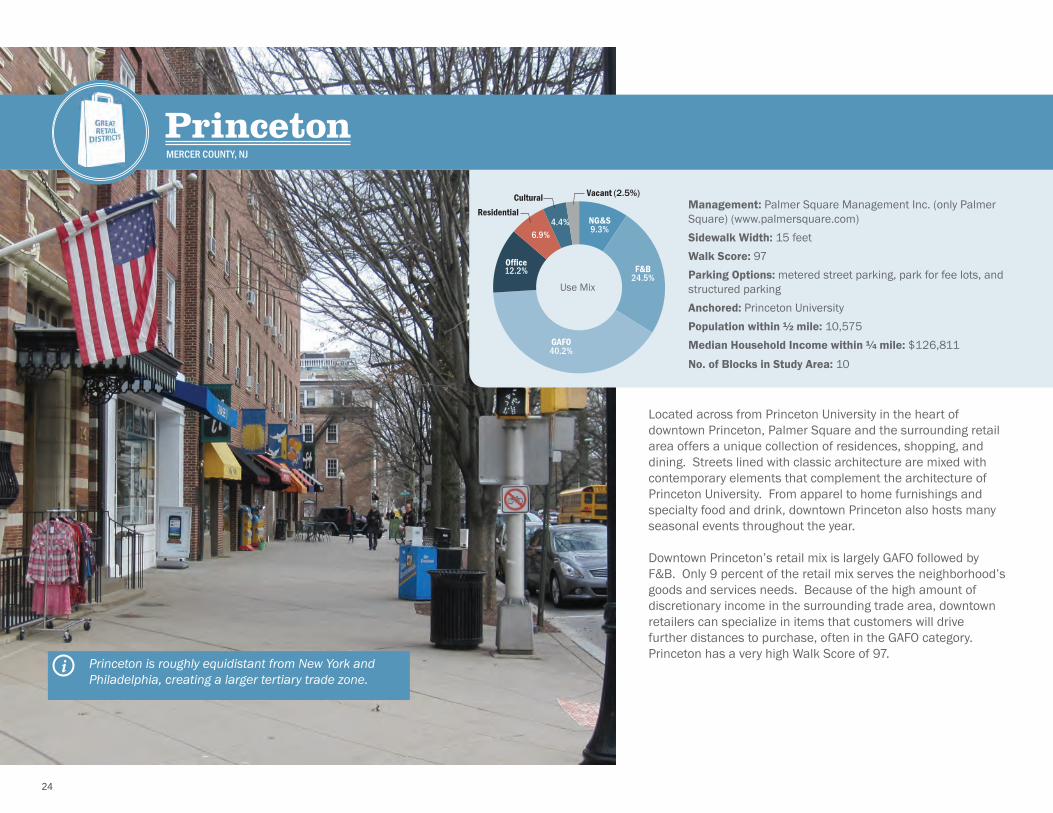
PrincetonMERCER COUNTY, NJ
i
Management: Palmer Square Management Inc. (only Palmer Square) (www.palmersquare.com)Sidewalk Width: 15 feetWalk Score: 97Parking Options: metered street parking, park for fee lots, and structured parkingAnchored: Princeton UniversityPopulation within ½ mile: 10,575 Median Household Income within ¼ mile: $126,811No. of Blocks in Study Area: 10
Located across from Princeton University in the heart of downtown Princeton, Palmer Square and the surrounding retail area offers a unique collection of residences, shopping, and dining. Streets lined with classic architecture are mixed with contemporary elements that complement the architecture of Princeton University. From apparel to home furnishings and specialty food and drink, downtown Princeton also hosts many seasonal events throughout the year.
Downtown Princeton’s retail mix is largely GAFO followed by F&B. Only 9 percent of the retail mix serves the neighborhood’s goods and services needs. Because of the high amount of discretionary income in the surrounding trade area, downtown retailers can specialize in items that customers will drive further distances to purchase, often in the GAFO category. Princeton has a very high Walk Score of 97. Princeton is roughly equidistant from New York and
Philadelphia, creating a larger tertiary trade zone.
6.9%
4.4% 9.3%NG&S
24.5%F&B
40.2%GAFO
12.2%Office
Vacant (2.5%)CulturalResidential
Use Mix
24

6.6%
7.4% 12.1%NG&S
21.5%F&B
21.1%GAFO
29.0%Office
Vacant
ResidentialCivic (2.3%)
West ChesterCHESTER COUNTY, PA
i
Use Mix
Management: West Chester Business Improvement District (www.wcbid.com)Sidewalk Width: 12 feetWalk Score: 89Parking Options: metered street parking, park for fee lots. and structured parkingAnchored: West Chester UniversityPopulation within ½ mile: 13,642Median Household Income within ¼ mile: $41,807No. of Blocks in Study Area: 10
The Borough of West Chester has small town charm with bigger town amenities. Downtown West Chester is home to West Chester University and receives many tourists from throughout the state visiting the historic sites in and around the Brandywine Valley. Downtown has a variety of restaurants, boutique shops, professional offices and residential options. West Chester recently added a new hotel and downtown lofts.
Because West Chester is the county seat, it has a high number of office uses that support the variety of eateries located in the Borough. Food and beverage (F&B) account for 21 percent of the uses frequented by the high population of daytime workers and the university population. West Chester has no passenger rail service but has invested in a new bus depot in order to provide an alternative mode of transportation to the Borough.
The entire downtown district is listed on the National Register of Historic Places.
25

R E V I T A L I Z I N G S U B U R B A N D O W N T O W N R E T A I L D I S T R I C T S 2 7
Chapter Three: Applying the Characteristics of Successful Retail Districts
Building from the elements that have high relevance to retailers, this section highlights each of the seven elements and provides strategies for communities to
undertake. They include (in order of importance): Managed, retail-appropriate, pedestrian-friendly, parking options, unified, transit-accessible, and programmed.
Each element provides an explanation and both short-term and long-term solutions.
Managed Does your retail district have clear leadership and management with support from a BID, merchants association, or retail recruiter? Is there a single point of contact for efficiency and clarity for all parties?
Unified Does your downtown have a common character or theme, often historic in nature, which serves to unify the retailers within the district?
Retail-Appropriate Do the retail spaces include storefronts that are at least 20 feet wide, have transparent windows, sidewalks at least eight feet wide, and few disruptions (i.e., offices, open space, or residential)?
Transit-Accessible Does your retail district have transit options close to retail shops and restaurants?
Pedestrian-Friendly Does your retail district provide a walkable and perceived safe environment?
Programmed Does your community hold events and yearly programs that bring in new visitors to the downtown?
Parking Options
Does your retail district provide parking options for visitors? Are parking signs visible?
2 8
Managed
The burden of planning for a retail district falls
on the local government; however, day-to-day
management is often provided by an outside
organization. Having an organizational
structure in place increases a downtown’s
capacity for development and reduces
responsibilities on the local government.
Management structures help with access to
funding resources and attract new development
without burdening residents with increased
taxes.
For managed districts, consider a yearly
evaluation of the activities performed. Revisit
the goals and make sure any strategies or
incentives are flexible based on the retail
market.
Not Managed?
Talk to the retailers in the district about their
interest in forming a committee, no matter how
large or small, formal or informal. While
businesses compete with each other, a unified
retail district can attract more customers if
acting as one cohesive group. Table 2 outlines
different types of management structures to be
explored. Business Improvement District
guidelines recommend at least 150
businesses. Micro districts can also be created
with about 40 to 100 businesses. If the
district has less than 40 businesses, consider a
merchants’ association, or look into how the
district can become a certified Main Street.
Civic associations or business authorities are
also alternatives to consider, but they often do
not provide a reliable source of funds.
Encourage retailers in the business district to
maintain similar hours. This will start the
process of working together. Below are
additional strategies to consider.
Centralized Retail Management
Downtown retail districts can use the shopping
mall experience to help manage and unify.
Centralized Retail Management (CRM)
organizes retailers to function as a single unit,
which includes coordinated days and hours of
operation, common area maintenance, retailer
location strategies, window merchandising,
customer service, and promotion. In
downtowns where there are multiple property
owners and business operators, a commitment
is needed for CRM to succeed.
Operational Hours
A challenge for many downtowns is motivating
small business owners to extend their hours
and maintain extended days. Most business
owners cite that low volumes cannot justify the
cost of keeping their store open. However,
potential shoppers will not venture to the
downtown to shop if they believe everything is
closed. Downtowns can begin to change this
ideology by remaining open on weekdays until
7:00 pm to give shoppers an opportunity to
make purchases after work. This can be done
in conjunction with a regularly scheduled
community event. The growing pains of
extended hours can be difficult. It will take at
least six months of extended hours before the
market catches on; but the long-term rewards
are worth it!
Common Area Maintenance
Common areas include the public right of way,
sidewalks, parks, and plazas. While these may
be maintained by the local government, a
downtown management entity can act as a
stable funding source and service provider.
Maintenance also includes repairs and
seasonal decorating.
Retailer Location Strategies
Achieving a coordinated retailer location
strategy in a downtown is a challenge given the
fragmented property ownership and lack of a
single management entity. An overall strategy
should be developed in the community’s long-
term plan to have key retailers (those that are
considered anchors and will attract other

R E V I T A L I Z I N G S U B U R B A N D O W N T O W N R E T A I L D I S T R I C T S 2 9
retailers) in more prominent locations, such as
corners.
Window Merchandising
Window merchandising is essentially free
advertising, and many downtown retail
strategies do not include this detail. Window
displays should be changed on a monthly basis
or, at a minimum, seasonally. Window displays
should allow the indoor activity to be seen from
the street.
Customer Service
Quality customer service varies, but downtown
retailers can “out service” shopping malls.
Seemingly small gestures, such as knowing a
customer’s name, keeping their preferences on
file, or contacting them when a particular
product becomes available, creates a
customer-friendly atmosphere. Most shoppers
opt for better customer service over the
cheapest price available. Retail store owners
can personalize their store. Shoppers will be
more apt to return.
Promotion
Working together as a cohesive unit, the retail
district can be promoted as a single entity.
When retailers in the same district work
together to promote themselves, target sales
goals and visitor expectations can be reached
quicker. This is especially helpful when it
comes to promoting special events in the
downtown area.
Window merchandising enhances opportunities to sell products. Two examples of what not to do for window merchandising are: 1. The J& D Whistle Stop completely covers their windows and does not allow for people to see what is inside. Not allowing potential shoppers to view the inside of the store will act as a deterrent. 2. The Twice as Nice Boutique has too much merchandise to look at in the window and is overwhelming for the pedestrian. Two positive examples of window displays are: 3. The Mill Street Village provides lights and window boxes to attract window shoppers. 4. The Ardmore Initiative, manager of the Lancaster Avenue retail district, has a storefront for easy access and advertising. While a nonretail use, the storefront is welcoming.
1
2
3
4

3 0
Source: DVRPC, 2013
Type Explanation Location Number of Businesses
Required Interest
Business Improvement District
Property owners voluntarily tax themselves to fund improvements or services for a defined area. BIDs provide a funding mechanism for public improvements, such as security, lighting, or sanitation. BIDs can be created for businesses and residential areas, but require approval from the governing body.
Urban
Suburban
150+ High
Main Street The National Trust for Historic Preservation utilizes the historic character of established downtowns to ignite revitalization. Designated Main Streets strive to revitalize their downtowns through their four-point approach.
Urban
Suburban
25+ Medium-High
Retail Recruiter
Retail recruiters serve as matchmakers for vacant storefronts. Retail recruiters should have knowledge regarding the local demographics, what retailers currently exist in the area, and the available amount of leasable retail space. Retail recruiters should understand the zoning and permitting requirements, any pending infrastructure/transportation improvements or beautification plans, and available financial or design incentives.
Urban
Suburban
Rural
Any Medium-High
Community Development Corporations (CDCs)
A CDC is a nonprofit, public-private partnership that helps to attract new business. Funding for a CDC often comes from the municipal government and donations. They often have the ability to acquire land, demolish buildings, and make site improvements, but most focus on business retention. The CDC has an established board of directors and the chair is often from the private sector. CDCs can range in size, depending on the amount of funds, land area to be included as part of the organization’s mission, and population of the community.
Urban
Suburban
Rural
Any Low-Medium
Merchant’s Associations
Merchants’ Associations focus on creating revenue through events, advertising, and building consensus among retail properties. They often help recruit retailers by fielding questions, offering site assistance and assisting with the permitting process. Merchant’s associations are the easiest type of management structure, as they require a low number of businesses to exist.
Urban
Suburban
Rural
2+ Low-Medium
Enterprise Zone
Businesses located within Enterprise Zones are eligible for state incentives, which may include a state sales tax exemption or a utility tax exemption for businesses of a certain size. Many communities provide additional local financial incentives to attract new business. Many communities that have enterprise zones receive funding from state and private sources for operations.
Urban Any Low
Economic Development Department
Most communities assign the economic development department to be responsible for administration of land-use and zoning regulations. While it can be advantageous to keep decision-making within the realms of the local government, this type of model often is exposed to short-term political change and leads to retail goals changing in the short term. To help mitigate some of the political impacts, the economic development department should assign a point person to be the principal liaison with any potential developer, retailer, or broker.
Urban
Suburban
Rural
Any Low
Table 2: Retail District Management Types
R E V I T A L I Z I N G S U B U R B A N D O W N T O W N R E T A I L D I S T R I C T S 3 1
Retail-Appropriate
Retail-appropriate districts often have a
vacancy rate of less than 20 percent, and a
nonretail use rate of less than 10 percent. The
ideal retail space has ceilings of 14 feet or
more, is at least 20 feet in width, 45 to 90 feet
in depth, has sidewalks of at least eight feet
and few disruptions in continuity of retail stores
(few instances of professional offices, open
space, or residential-only buildings). While
these are the primary conditions that make a
retail district attractive, there are additional
factors such as site criteria, demographics, and
geographic context that contribute to the
appropriateness of a particular location.
Already Retail-Appropriate?
If the downtown already meets the site criteria
that retailers prefer, consider a retail broker
training program for members of the BID or
merchant association.
Retail-appropriate spaces should be identified
in the community’s regulatory documents and
requires stores to provide 25 percent clear
glass for window displays and gazing. Storefront
signage should also be in character with the
building and district.
In addition, it is important to understand what
type of retailers will be able to utilize the space
that exists in your retail district. For instance, it
makes no sense to recruit a major retailer if
stores are no larger than 3,000 square feet.
Complementary Retail
When sizing up a potential site, retailers will
consider the existing businesses to compare
the customer base. Are the existing retail uses
complementary to this new potential retailer?
Meaning, do the existing businesses already
draw the correct consumer to the downtown?
Addressing Vacancy
Building off of the community profile, make sure
that the existing mix of tenants corresponds to
the neighborhood’s retail strength. If there is
an abundance of nonretail and vacant space,
create a list of names and addresses of
property owners of the vacant retail spaces.
Contact them about the space to find out what
their future plans are and if they would be
willing to allow the community to address the
façade. Communities can minimize the effect
of the vacancies by introducing a window art
program by placing historic photos of the
neighborhood in the windows and maintain the
front of the building with volunteers.
Although permission is needed from the
storeowner, it is important to make the
appearance of the store seem as vital as
possible. Make sure the public realm is
maintained and the storefront remains lit at
night.

3 2
Ask all property owners to participate in
creating a “retail experience.” Discuss
creating activity and having outside
lights on afterhours. Invite them to
participate in the management or
volunteer organization and consider
allowing nonretail businesses to take
advantage of any façade or sign
programs offered.
Site Criteria
Retailers rely on four specific site
criteria when evaluating properties.
They include visibility, entryways,
accessibility, and utilities.
Clear entryway
Pedestrian-accessible
Visible from inside and out
Underground Utilities
1. This restaurant along Lancaster Avenue, Ardmore, PA, illustrates the four site criteria with visibility from the inside and out; clearly defined entryway, pedestrian access with room for outside dining, and hidden utility lines. 2. Nassau Street in Princeton, NJ, also provides options for retailers. Each store has clear glass, defined entryways, pedestrian access, and a uniform look with store awnings. Pedestrian-accessible
Clear entryway
Urban form and uniformity
1
2
R E V I T A L I Z I N G S U B U R B A N D O W N T O W N R E T A I L D I S T R I C T S 3 3
Visibility
To help attract customer traffic, downtown
retailers should utilize visual merchandising
practices. A well-planned interior can attract
impulse buyers and reinforce the quality of
goods. Merchandise should be clean and easy
to navigate. Some easy merchandising
practices for downtown retail districts should
include:
Simple and easy window displays;
Change window displays weekly;
Avoid handmade and taped signage;
Constantly update the store with new finishes, colors, and fixtures; and
Display a sample of store merchandise or theme along the storefront.
Entryways
Entryways should be easy to find for shoppers.
Ideally, the door should be a different color and
have the address of the store. If the entryway is
to the side or rear of the building, provide
proper signage.
Accessibility
A building is retail appropriate if it is able to be
accessed. For instance, utilizing the second
floor of many buildings for retail purposes is not
accessible, as elderly or handicapped persons
may not be able to climb the stairs. Appropriate
spaces will be accessible for pedestrians,
bicyclists, and motorists.
Utilities
Many retailers look for spaces that have
infrastructure in place. Many downtown
districts have overhead utility lines. Having
underground utilities is preferred because they
will not become a nuisance to trees or block
signage.
Regulatory Compliance
An additional component of retail appropriate
spaces includes supportive zoning and site
regulations. Retailers prefer to locate in
communities where the development process is
clear, concise, and streamlined.
Right Sizing
Most retail districts do not take into account the
retail market and often include too much land
area. By over-zoning for commercial and retail
uses, strategic recruitment becomes more
difficult. In many cases, smaller districts (one
to three blocks) are more successful, as they
have less space to fill and are walkable. By
conducting a market analysis, the community
will have a realistic expectation of the type and
amount of retail the district can support. The
district should then be rezoned to the
appropriate size.

3 4
Pedestrian-Friendly
Downtowns should serve the pedestrian,
whether walking for function or leisure.
Walkability increases the capture rate of
expenditures from the primary trade area,
which equals higher, reliable sales.
The definition of a walkable downtown to a
retailer means having sidewalks with
appropriate width, food and beverage
establishments with outdoor cafes, and
properly spaced trees and streetlights (visibility
and maintained). Sidewalks are often the first
and last impression for shoppers. Although
many people drive to their retail destination, the
last part of their journey to a storefront is
always on foot. Providing a memorable walking
experience is paramount. This starts with the
actual sidewalk environment and safety.
Already Pedestrian-Friendly?
Even if the community is already considered a
safe environment for pedestrians, continue to
make safety a priority. Work with volunteers to
help keep the retail environment clean.
Many older retail districts have sidewalks, but
they often lack the specifications that retailers
require. Below are some strategies to consider
in creating a safe pedestrian environment.
Sidewalk Environment
Sidewalks have three components. Shown in
Figure 3 are the storefront zone, walkway zone,
and amenity zone. Sidewalks should be no less
than eight feet for retail appropriateness, but to
accommodate the pedestrian and outdoor
furniture, sidewalks should be at least 15 feet.
Safety
Pedestrian-friendly districts need to be safe or
have the perception of being safe. Shoppers
will not want to visit the downtown after dark if
they do not feel safe. Safer areas have:
Buildings between two to six floors;
Active uses above retail spaces;
Retail vacancy rates under 10 percent;
Low crime statistics; and
Less difference between median household income and average household income.
Crime Prevention through Environmental
Design (CPTED) is based on the premise that a
properly designed public realm can reduce both
the opportunity for crime and the fear of crime.
Crime prevention includes addressing
surveillance, maintenance, sidewalks, parking
garages, and storefronts. Keeping eyes on the
street will help to deter crime.
Defensible design should be incorporated into
the downtown retail district. The biggest
deterrents to crime are lighting, watchful eyes,
and clear sightlines. Proper lighting is an
effective crime deterrent because it can
discourage criminal activity. This is illustrated
in Figure 4.

R E V I T A L I Z I N G S U B U R B A N D O W N T O W N R E T A I L D I S T R I C T S 3 5
Source: DVRPC, 2013
This illustration shows elements of safe districts. They include eyes above the street, proper lighting, and buildings between two and six floors.
Source: www.smgov.net
Figure 3: Sidewalk Zones
Figure 4: Safety Zones

3 6
Increasing the walkability and safety of
the downtown retail district can be
done in the relative short term for
minimal cost.
At different times of the day, observe pedestrian and bicycle activity in the neighborhood. Is the walking and biking experience hindered? Note sidewalks uplifted by tree roots, lack of curb cuts, lack of bike parking, and low tree branches.
Talk to restaurant owners about providing outdoor seating. Walkability will increase when local restaurants provide tables and chairs outdoors.
If the walking environment is hindered by the high speed of traffic, provide a radar speed display for passing motorists. Work with your local government to install temporary traffic calming measures within the retail district and enforce vehicular speeds. On- street parking also serves to slow down traffic.
Store owners, as well as nonretail owners, should leave display
window lighting on until 11pm and during the day and evening on weekends.
To determine if there is a perceived safety problem in the downtown, talk to merchants and residents. Conduct walkthroughs of the district during the day and night, noting areas with gaps in lighting, unmaintained landscapes, or graffiti. Promote and support businesses that maintain their stores and make certain merchants understand their responsibility to the public realm.
Retail business owners should install the best lighting they can afford. To encourage safety, develop a small loan program for businesses that are willing to provide safe and effective lighting. Lighting can also be sustainable. Energy savings can be provided with skylights, windows, and low-wattage fluorescent lighting in back-room areas.
Plant shrubs, trees, and flowers and keep them in good condition;
Provide trash cans and recycling bins to keep streets clear of litter;
Remove graffiti as soon as it appears;
Develop an ambassador program with volunteers to walk the street;
Engage the local police to see how they can help; and
Inventory abandoned buildings and contact owners to press for sale or lease, repurposing or activation.
Garbage left at the sidewalk contributes to an unsafe feeling for pedestrians.

R E V I T A L I Z I N G S U B U R B A N D O W N T O W N R E T A I L D I S T R I C T S 3 7
Parking Options
Parking is critical for retailers and
consumers. Street-front retailing
requires well-planned, convenient on-
street parking that is easy-to-use,
clean, and well lit. Parking ratios vary
depending on the type of shopping
experience.
As a rule of thumb, for convenience
shopping, communities should provide
three to four parking spaces per 1,000
square feet of gross building area with
high turnover (eight to 10 vehicle
changes per hour). Parking meters
should be used in small shopping
districts only when street parking is
consistently unavailable. There are few
small villages and towns with the
critical mass of businesses necessary
for a visitor to spend more than an
hour shopping.
Parking garages are often prohibitively
expensive for municipalities to
construct. However, if structured
parking is desired for retail sales, it
should be designed, constructed, and
managed at a higher level than typical
office or residential garages. Dirty,
poorly lit parking garages with
confusing signage give the impression
that the nearby goods and services are
low-value, poor quality, and dated.
Retail parking garages should have
floor-to-ceiling heights of eight to 12
feet, painted surfaces, natural light
supplemented with color-corrected
lighting, logical signage, and office-
quality finishes in the elevators and
stairwells. Having a manned station
also provides an additional welcoming
feeling to the shopping district.
Additional design features to consider
include:
Locate parking garages and lots that encourage ground-level activity and have attractive pedestrian linkages;
Mixed use buildings, or linear buildings;
Use parking facilities for shared uses; or
Charge a nominal fee.
Buildings are the most fundamental
element of any downtown, particularly
occupied ones. Parking lots located
interior to their blocks is preferred.
Parking is an important issue and must
be addressed, but tearing buildings
down or removing lanes of traffic is
often not the best long-term solution.
Consider the following questions when
developing a parking strategy.
How does parking intersect with retail goals?
Does the existing parking supply meet the demand?
What is the dominant feature of the retail environment?
Is there a way to provide parking without wide expanses of pavement?
Can available parking be increased through shared parking strategies?
Would higher parking prices encourage less traffic and generate additional municipal funds?
Remember, people do not visit
downtowns to park their cars.
Shoppers come to downtowns for the
experience and ambience.
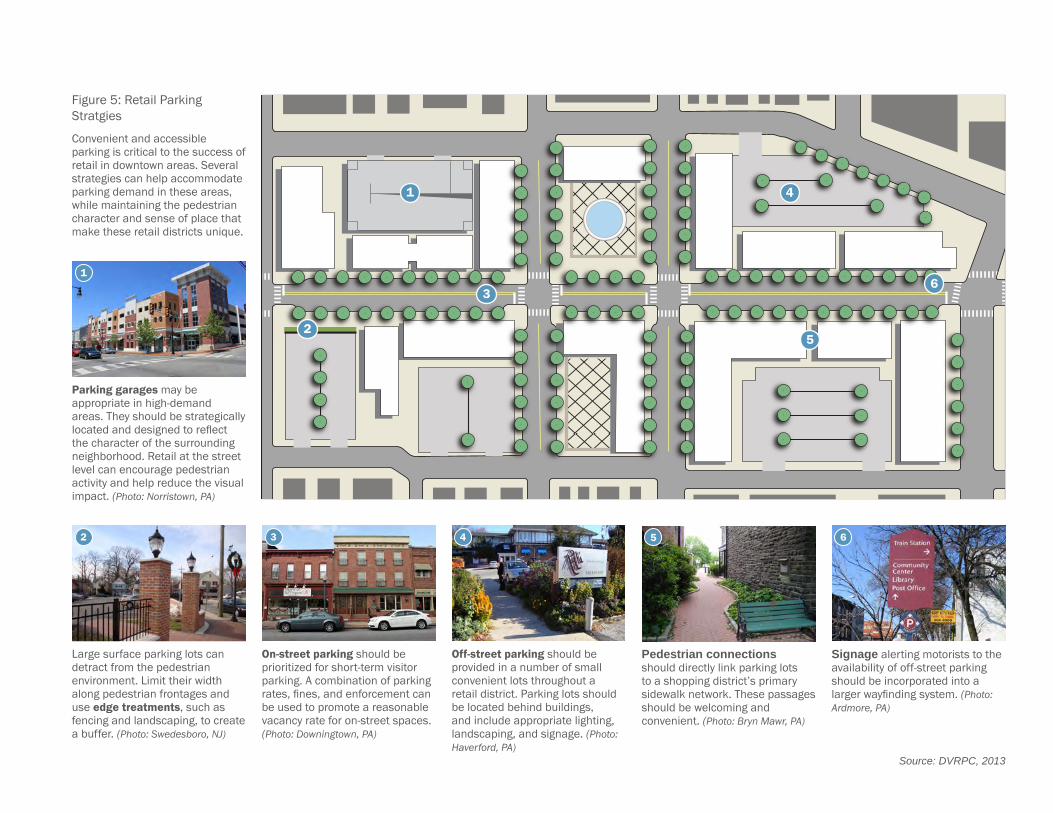
Figure 5: Retail Parking Stratgies
Convenient and accessible parking is critical to the success of retail in downtown areas. Several strategies can help accommodate parking demand in these areas, while maintaining the pedestrian character and sense of place that make these retail districts unique.
Large surface parking lots can detract from the pedestrian environment. Limit their width along pedestrian frontages and use edge treatments, such as fencing and landscaping, to create a buffer. (Photo: Swedesboro, NJ)
Parking garages may be appropriate in high-demand areas. They should be strategically located and designed to reflect the character of the surrounding neighborhood. Retail at the street level can encourage pedestrian activity and help reduce the visual impact. (Photo: Norristown, PA)
On-street parking should be prioritized for short-term visitor parking. A combination of parking rates, fines, and enforcement can be used to promote a reasonable vacancy rate for on-street spaces. (Photo: Downingtown, PA)
Off-street parking should be provided in a number of small convenient lots throughout a retail district. Parking lots should be located behind buildings, and include appropriate lighting, landscaping, and signage. (Photo: Haverford, PA)
Pedestrian connections should directly link parking lots to a shopping district’s primary sidewalk network. These passages should be welcoming and convenient. (Photo: Bryn Mawr, PA)
Signage alerting motorists to the availability of off-street parking should be incorporated into a larger wayfinding system. (Photo: Ardmore, PA)
2
1
3 4 5 6
1
2
3
4
5
6
Source: DVRPC, 2013

R E V I T A L I Z I N G S U B U R B A N D O W N T O W N R E T A I L D I S T R I C T S 3 9
Unified
The urban form of a retail district often
acts as a unifying agent. Streets are
built with two-story buildings offering
retail on the ground floor with offices or
residential uses on the second floor.
Unify the Downtown
Unifying the downtown can be achieved
through the urban form – tree lined
streets and historic architecture.
Often, this urban form provides the
district the opportunity to brand itself.
Branding the downtown requires an
established group of retailers willing to
act as a unified group. A quality brand
can increase exposure and act as a
recruitment tool for new retailers.
A downtown brand that is built upon
what is hoped for, rather than what
exists, runs a far greater risk of failure.
The brand is created based on how a
neighborhood or community perceives
itself. A proper brand is more than
words and images used along with a
place name; it is a long-term,
permanent feeling of what a place
should be and mean. Often a brand
can begin to take shape by an existing
cohesive element in the downtown.
For instance, is there a historic district
already in place? Is there particular
architecture that lends itself to creating
the retail district? These elements
often already exude a feeling among
shoppers and residents. To further
raise awareness, the brand should
encapsulate the neighborhood’s
intrinsic value. Communicate the
architectural significance, walkability,
or historic feel of the downtown
shopping district. Make the
neighborhood distinguishable from
other nearby neighborhoods.
A logo is then created from the brand.
Shopping and dining guides, event
promotions, and advertising should
utilize the design elements of the
brand, while taglines and images
should reinforce the brand concept.
The logo should be vivid and positive.
The final step is to spread the word!
Promoting and enhancing should be
continual. Continue to talk to residents
and businesses to guide the message
and increase recognition and usage.
Maintain good relations with
community organizations, such as
chambers of commerce, to help
promote the community brand.
Signs
Proper retail signage is important to
market individual businesses, but it
can also serve to unify the retail
district. Most downtowns will have
individual signs, as well as wayfinding.
Effective signage begins with well-
written zoning codes and design
standards. Sign ordinances that are too
restrictive limit creativity. Keep sign
requirements to the proper scale for
the pedestrian.
Properly sized signage will help unify
the downtown. Review local zoning
and building codes for sign
requirements. The following elements
should be considered:
Limit the size of the sign to one square foot of signage for each linear foot of storefront;
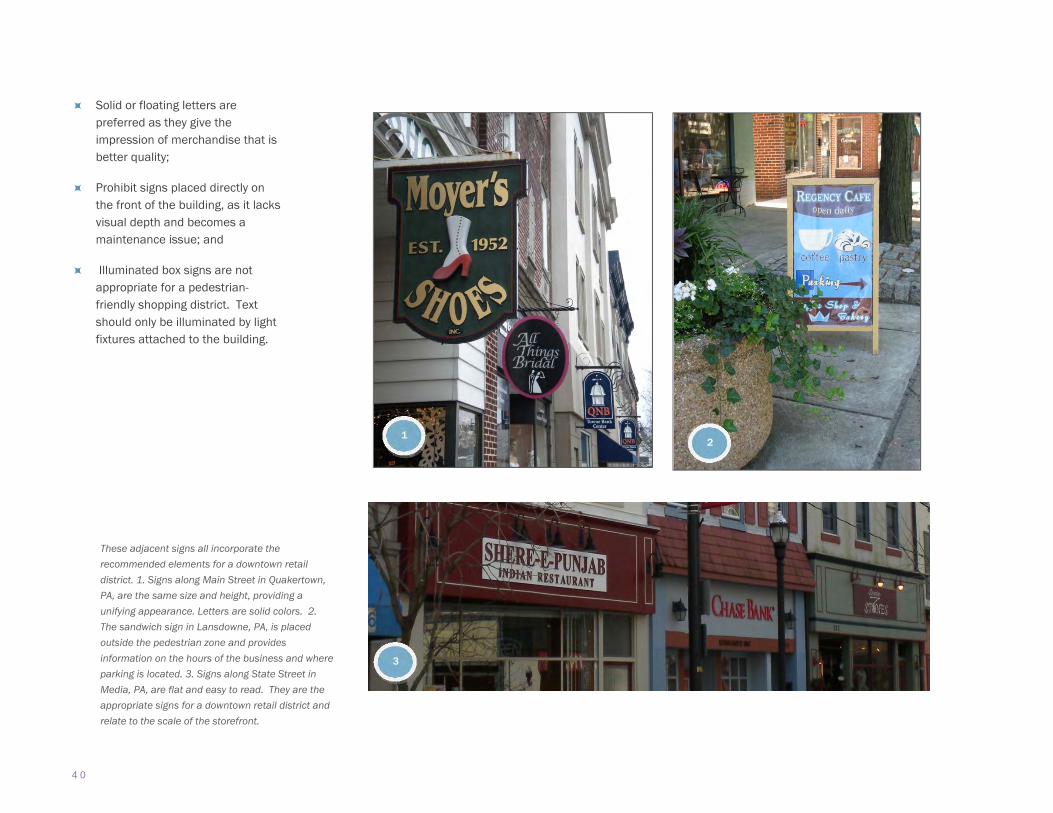
4 0
Solid or floating letters are preferred as they give the impression of merchandise that is better quality;
Prohibit signs placed directly on the front of the building, as it lacks visual depth and becomes a maintenance issue; and
Illuminated box signs are not appropriate for a pedestrian-friendly shopping district. Text should only be illuminated by light fixtures attached to the building.
These adjacent signs all incorporate the recommended elements for a downtown retail district. 1. Signs along Main Street in Quakertown, PA, are the same size and height, providing a unifying appearance. Letters are solid colors. 2. The sandwich sign in Lansdowne, PA, is placed outside the pedestrian zone and provides information on the hours of the business and where parking is located. 3. Signs along State Street in Media, PA, are flat and easy to read. They are the appropriate signs for a downtown retail district and relate to the scale of the storefront.
1 2
3
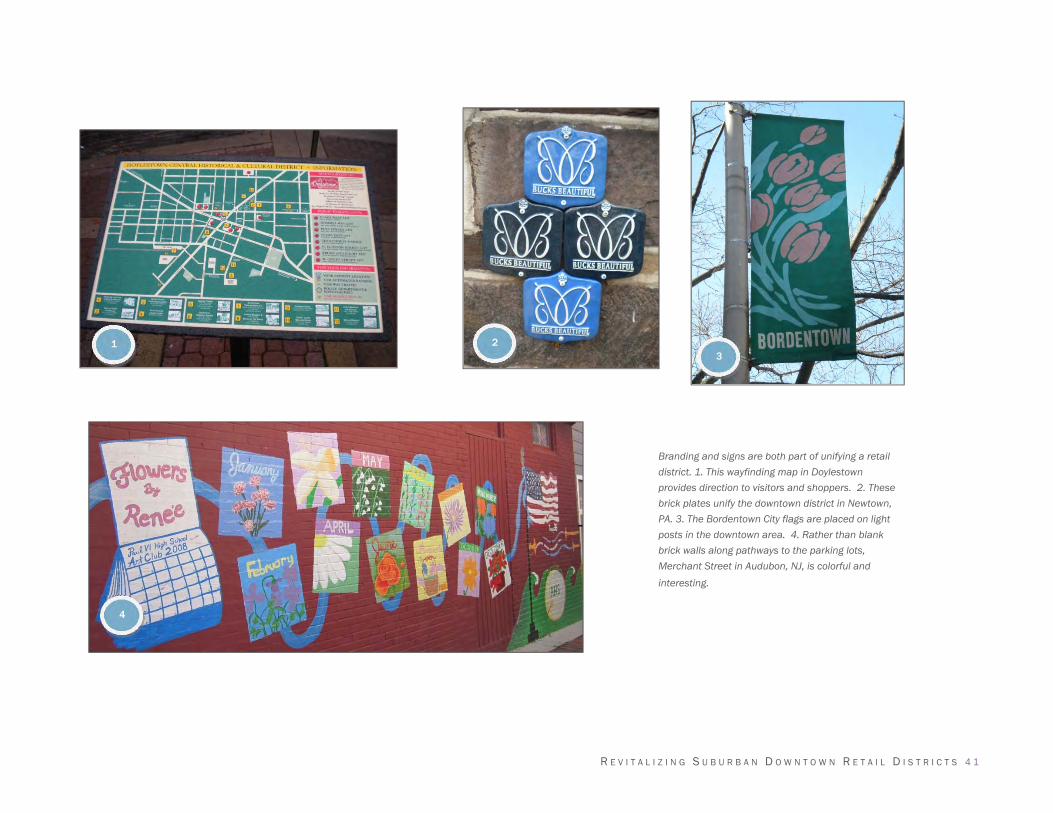
R E V I T A L I Z I N G S U B U R B A N D O W N T O W N R E T A I L D I S T R I C T S 4 1
Branding and signs are both part of unifying a retail district. 1. This wayfinding map in Doylestown provides direction to visitors and shoppers. 2. These brick plates unify the downtown district in Newtown, PA. 3. The Bordentown City flags are placed on light posts in the downtown area. 4. Rather than blank brick walls along pathways to the parking lots, Merchant Street in Audubon, NJ, is colorful and interesting.
1 2 3
4

4 2
Transit-Accessible
Locating in a downtown retail district
provides the opportunity to serve
pedestrians, transit-users, and
motorists.
Within the Greater Philadelphia region,
transit accessibility has gained
relevance to potential retailers. Most
of the existing successful downtown
retail districts are anchored by a transit
station. For neighborhood goods, and
services (NG&S) and Food and
Beverage (F&B) retailers, proximity to a
transit stop (within three to four blocks)
ensures that residents have regular
patterns of activity that pass retail
locations, such as dropping off dry
cleaning on the way to work or happy
hour after work. Transit riders are
more likely to conduct errands on their
way to the station if the opportunity
exists.
If a downtown has a bus, trolley, or
train station, it is important to
recognize this asset. Utilize wayfinding
for transit riders, keep station stops
clean, and provide protection from the
weather. Consider a retail strategy that
includes potential customers using
transit, i.e., if your community has a
transfer station, make sure there are
goods and services, as well as quick-
bite eating establishments near the
stop/station.
Many older retail districts are transit-accessible. Creating retail options close to or even in the transit station provides additional foot traffic. 1. The SEPTA Wayne Station is in walking distance of many shops and eateries. 2. Trax restaurant in Ambler is across the street from the train platform. 3. A savvy retailer in Collingswood, NJ, places a menu near a tree where bicyclists park.
1
2
3

R E V I T A L I Z I N G S U B U R B A N D O W N T O W N R E T A I L D I S T R I C T S 4 3
Promote Transit
Retailers can promote their businesses
and access to transit through programs
such as SEPTA’s Pass Perks Program.
Using a weekly or monthly SEPTA pass,
transit riders can receive discounts at
participating restaurants, stores, or
destinations throughout the region.
Visit www.septapassperks.org for more
information.
1. The River LINE Station in Palmyra, NJ, is directly across Broad Street from the retail shops. 2. The retail district in Narberth, PA, is easily visible and accessible from the SEPTA regional rail station. 3. Future train service may be restored to Wenonah, NJ, providing direct access to the retail businesses in the downtown.
1
2 3

4 4
Programmed
Events and programs are important for
the visibility of the downtown retail
district. Events will bring people to the
downtown, with the hope they will
make purchases at local businesses.
Events are created for different
purposes. Many local governments,
BIDs, and community groups plan
events throughout the year. There are
generally two types of events: special
and fundraising. It is important to
distinguish between a special event
and a fundraising event, so the goals
can be clearly established. Is it to bring
customers to downtown or to raise
money for the local organizational
group?
Special events are used to build
downtown traffic, while fundraising
events are designed to raise money
and not necessarily bring people back
to the downtown.
Plan special events for the downtown
around the community’s heritage,
include traditional and not-so
traditional holidays, or on dates that
have local meaning. Special events
require many hours from volunteers.
As such, make sure that the event is
not weather dependent and pays for
itself! Special events include parades,
book fairs, craft fairs, or festivals.
Many communities utilize weekly,
monthly, or seasonal programming to
bring new customers to the downtown,
such as First Fridays, Restaurant
Weeks, Farmers’ Markets, and Concert
Series. These generally are used to
bring additional customers to the
downtown and often become
sustainable on their own. No matter
the duration of the event, marketing
and promotion is important.
It is also important to pick the proper
location for the event or program.
Having a Farmers’ Market in a closed
alley will not provide for proper
exposure. Make sure that the event is
located near the retail businesses to
be seen.
Civic/Cultural Anchors
Successful retail districts include a
civic or cultural anchor to help bring
potential shoppers to the downtown.
Many times these anchors have their
own events and programs. By building
off of an anchor’s events, local
governments can construct community
integration and visibility. Having the
downtown anchored by a civic or
cultural use will draw customers from
further distances and lengthen the
“time on the street,” meaning the
frequency and amount of purchases
made from local retailers. Civic and
cultural anchors can be economic
engines for the downtown, but make
sure they are right-sized for the
community.
Many downtowns also have civic or
cultural retailers. This is a retailer that
provides programs, such as a fabric
shop that has quilting classes, coffee
shops with a community bulletin, or a
local bookstore with reading times.

R E V I T A L I Z I N G S U B U R B A N D O W N T O W N R E T A I L D I S T R I C T S 4 5
If the community does not currently
host special events or programs, meet
with local business owners and officials
to get one started. Link a special event
to a cause or meaningful day for the
community. For example, Lansdale
Borough celebrates Founder’s Day
every August.
4
Events and programs can be found throughout the summer months. 1. This painting at the Pottstown Farmers’ Market location serves to alert the shopper to the location as well as adding a unique design feature to the downtown. 2. The Farmers’ Market in Doylestown, PA, is held downtown. 3. Summer concerts in Souderton bring out people of all ages. 4. The Narberth Theatre is a cultural draw to the downtown. 5. Doylestown designates their cultural district.
2 1
5
3

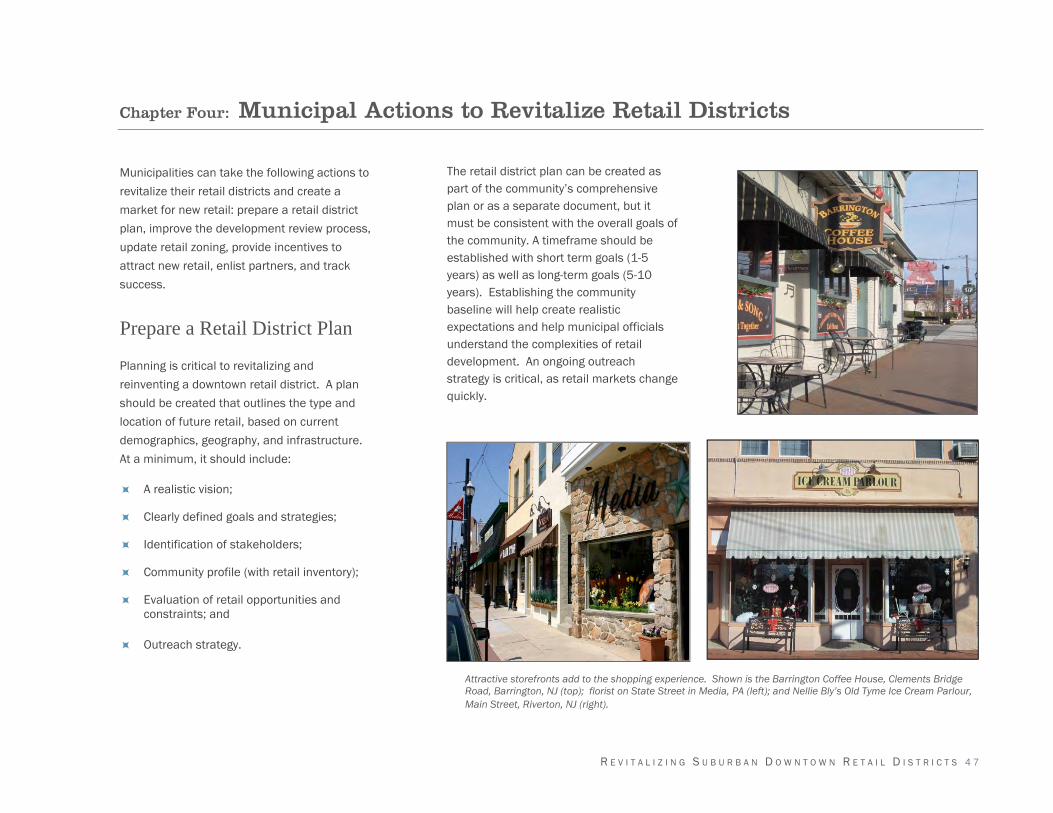
R E V I T A L I Z I N G S U B U R B A N D O W N T O W N R E T A I L D I S T R I C T S 4 7
Chapter Four: Municipal Actions to Revitalize Retail Districts
Municipalities can take the following actions to
revitalize their retail districts and create a
market for new retail: prepare a retail district
plan, improve the development review process,
update retail zoning, provide incentives to
attract new retail, enlist partners, and track
success.
Prepare a Retail District Plan
Planning is critical to revitalizing and
reinventing a downtown retail district. A plan
should be created that outlines the type and
location of future retail, based on current
demographics, geography, and infrastructure.
At a minimum, it should include:
A realistic vision;
Clearly defined goals and strategies;
Identification of stakeholders;
Community profile (with retail inventory);
Evaluation of retail opportunities and constraints; and
Outreach strategy.
The retail district plan can be created as part of the community’s comprehensive plan or as a separate document, but it must be consistent with the overall goals of the community. A timeframe should be established with short term goals (1-5 years) as well as long-term goals (5-10 years). Establishing the community baseline will help create realistic expectations and help municipal officials understand the complexities of retail development. An ongoing outreach strategy is critical, as retail markets change quickly.
Attractive storefronts add to the shopping experience. Shown is the Barrington Coffee House, Clements Bridge Road, Barrington, NJ (top); florist on State Street in Media, PA (left); and Nellie Bly’s Old Tyme Ice Cream Parlour, Main Street, Riverton, NJ (right).

4 8
Vision
Recruiting retail is not simply the act of
identifying a business and then opening that
business in town. Local governments want to
make it abundantly clear that new businesses
should complement and grow within the
existing business district. If there is an
established district, existing business may find
that it is a struggle to remain open, and it may
be difficult to retain everyone. A realistic vision
with goals and objectives will provide the
framework for all businesses in the retail
district. A sample vision statement may read,
“The economic development vision for community x is to strive to maintain and enhance a diverse tax base with a mix of retail, office, and industrial businesses to ensure the quality of life our community deserves.”
A community can make itself more attractive to
retailers without sacrificing a vision. Without
understanding what attracts retailers, a
community can be left with the wrong type of
retail. The vision should reflect the primary
goal of the retail district. For instance, is the
primary goal for the retail district to preserve
historic structures? Infill abandoned
properties? Create a revitalized shopping
district? Once the primary goal is established, a
guiding statement should be created. Goals
and strategies should then support this new
vision.
Goals and Strategies
Long-term goals should be based on the
community’s desires and needs. Develop
strategies to implement the goals. They can be
planning, financial, and economic strategies.
For instance, if the primary goal of your
downtown retail district is brownfield
redevelopment, then your strategies should be
directed toward that aim. Creating a
merchant’s association or façade program will
be less effective than creating a Tax Increment
Financing (TIF) district or other financial
incentive tied to redevelopment.
Identification of Stakeholders
Be sure to include all pertinent stakeholders in
the planning process. This includes business
owners, community officials, government
agencies, businesses associations, and
consumers, as well as important players in the
retail recruitment process. Each group will
have their own ideas of what the retail district
should be. Below is a list of stakeholders and
their role in downtown development.
Developers manage the construction or
rehabilitation of retail facilities. Developers
often have experience in creating a retail mix
that will be appropriate for a specific location.
Retailers perform many of the developer
functions. There are three types of retailers:
Anchor stores – Anchor retail stores serve as the key retail in large developments (Wal-Mart or Target). Anchors attract consumers, as well as other retailers to tap into the potential spending power generated by the anchor retailer. Anchor retail stores are largely found in superregional malls. The concept of the anchor retail store is transferable to downtown retail districts if the space, demographics, and household incomes exist.
Credit-worthy tenants (best specialty stores) are generally smaller than anchors, but are powerful generators of spending power. Often found in regional shopping centers. These include cell phone stores or supermarkets.
Local retailers provide a unique identity and connection to the downtown retail district. These include independently-owned stores.
Real Estate Brokers forge relationships with
developers and retailers. They work on
commission and are paid by the developer
when a lease is signed. Many large retailers
work through brokers, so it may be necessary to
use one to attract a large retailer.
Consumers drive revenue by visiting the stores
and purchasing. Many shoppers are as
concerned with the shopping experience as the
goods they buy. It is important to have a

R E V I T A L I Z I N G S U B U R B A N D O W N T O W N R E T A I L D I S T R I C T S 4 9
pleasant atmosphere for shoppers to enjoy
themselves.
Community Officials provide guidance on the
development and retail opportunities in the
community. Community officials ensure that
the economic development goals of the
community are considered. When a BID or
other management structure does not exist,
community officials will be the point of contact
for developers and retailers.
Community Profile
Create a community profile that includes all
physical and demographic information. Map
out where existing and duplicative businesses
are located. This will give a visual of the retail
environment. Be sure to mark on the map any
regional shopping centers. This is important
when evaluating market need and supply. As
part of the community profile, conduct a retail
inventory of the district. Be sure to include the
name of the business, type of retail, use, and
owner, as shown in Figure 6.
Opportunities and Constraints
From the community profile, identify
opportunities and constraints. Opportunities
could include infill possibilities, streetscape
enhancements, new traffic patterns, or new
transit service. Constraints could include
elements such as physical barriers, population
and income spending power, or lack of a single
point of contact for businesses.
Outreach Strategy
No matter the condition of the downtown,
communities should always be getting the word
out about retail opportunities. Be sure to
outline what outreach will be employed. For
instance, will social media be utilized such as
creating a Facebook page? Are there
community brochures? Outreach should be
continuous and strategies should evolve. Be
sure to review outreach strategies on a yearly
basis to evaluate what is working and what is
not.
Figure 6: Sample Retail Inventory
Retailer No./Street Use (retail/office/vacant/other
Retail Category (NG&S,
F&B, GAFO) Property Owner Local/Chain
Art studios and galleries can be used as an element to revitalize a downtown retail district. Merchantville, NJ, has artist studio space located along Chapel Avenue.
Source: DVRPC, 2013

5 0
Regardless if the economic development goal is to recruit new business or retain existing business, most older suburbs are in the process of revitalizing their
downtown retail districts. Outlined below are the 4 R’s of retail planning. This will help communities understand the primary goal for their downtown strategies.
Recruit
Retail recruitment is the
process of attracting new
businesses to an existing
retail area.
When recruiting new
businesses, be prepared to
provide information about
the area’s demographics,
location of competition, and
the existing retailers. Inform
prospective retailers about
any new infrastructure
projects, beautification
plans, or other planned
municipal projects that will
make the downtown retail
appropriate. Include
information about financial
incentives, rebates, or
waivers.
Retain
Keeping existing businesses
is easier and less expensive
than recruiting new ones.
Independent retailers can
enhance the authenticity of
the shopping district. Also,
local store owners tend to be
more supportive of local
initiatives and contribute to
the safety of the district.
Many retail managers utilize
business retention surveys
to enable owners to give
feedback to local officials.
Issues for retailers range
from trash removal to
sidewalk condition to
support for events and
programs. It is important to
provide a mechanism for
existing business owners to
be able to voice their
concerns and feel part of the
community.
Revitalize
Revitalization is the process
of restoring economic vitality
to an area that has fallen
upon disinvestment.
Municipalities use several
different approaches, such
as creating a Main Street or
using eminent domain for
infill. Revitalization includes
infrastructure or design
development or embracing
new trends. Revitalization
involves more than a single
site, so it is important to
examine adjacent properties
and the surrounding
neighborhoods when
developing revitalization
goals. Targeted infill may
include the construction of a
new building with façade
and streetscape treatments..
Replace Retail replacement is not used as often as revitalization. In some downtowns, a decrease in pedestrian activity and related retail activity was offset by a rise in auto body repair stores, light industry, and manufacturing. These types of businesses are not pedestrian friendly. Rather than eliminate these businesses, municipalities can offer the property owner incentives to relocate to more appropriate locations. In many instances, older downtown retail districts provide a mixed environment with auto-oriented and pedestrian-friendly uses within the same area.
Source: Retail 1-2-3, ICSC.

R E V I T A L I Z I N G S U B U R B A N D O W N T O W N R E T A I L D I S T R I C T S 5 1
Improve the Development Review Process
A positive investment climate is crucial
for a community to be successful.
Developers appreciate quick turnaround
on permits and inspections, low fees,
and one-stop shopping. To ensure
efficiency, communities should review
their development process to make sure
everything is clear and concise.
Establishing a clear line of
communication to decision-makers is
also important.
Downtowns that have reversed
downward trends have done so
incrementally and strategically. As with
most complex matters, a “quick fix” is
rarely the answer to repair a downtown
for the long term. Local officials must
be clear regarding community
regulations, have the leadership to carry
through with the project, and ensure
that the vision is adopted by all
stakeholders in the community. Tools to
help the community become attractive
for business development may include:
Consolidate the multiple reviews involved for many projects into a single application;
Require a concept plan to be submitted for staff review prior to submission of the application that will be reviewed by the planning board;
Allow certain details such as landscaping and lighting that are now required as part of a site plan to be reviewed and approved after plats have been recorded;
Encourage public input at additional points in the process, such as before and after submission of the concept plan, and at meetings organized by the developer.
Streamline the development review process;
Provide a quick turnaround on permits/inspections (involves clear responsibilities, deadlines, chains of communication, and procedures);
Institute low fees;
Hold regular meetings with all departments to spot red flags;
Recapture agreements for extending sewer/water service (an agreement authorizing reimbursement for the construction of improvements beneficial to the public);
Maintain a current list of available properties; and
Foster communication between property owners and developers.
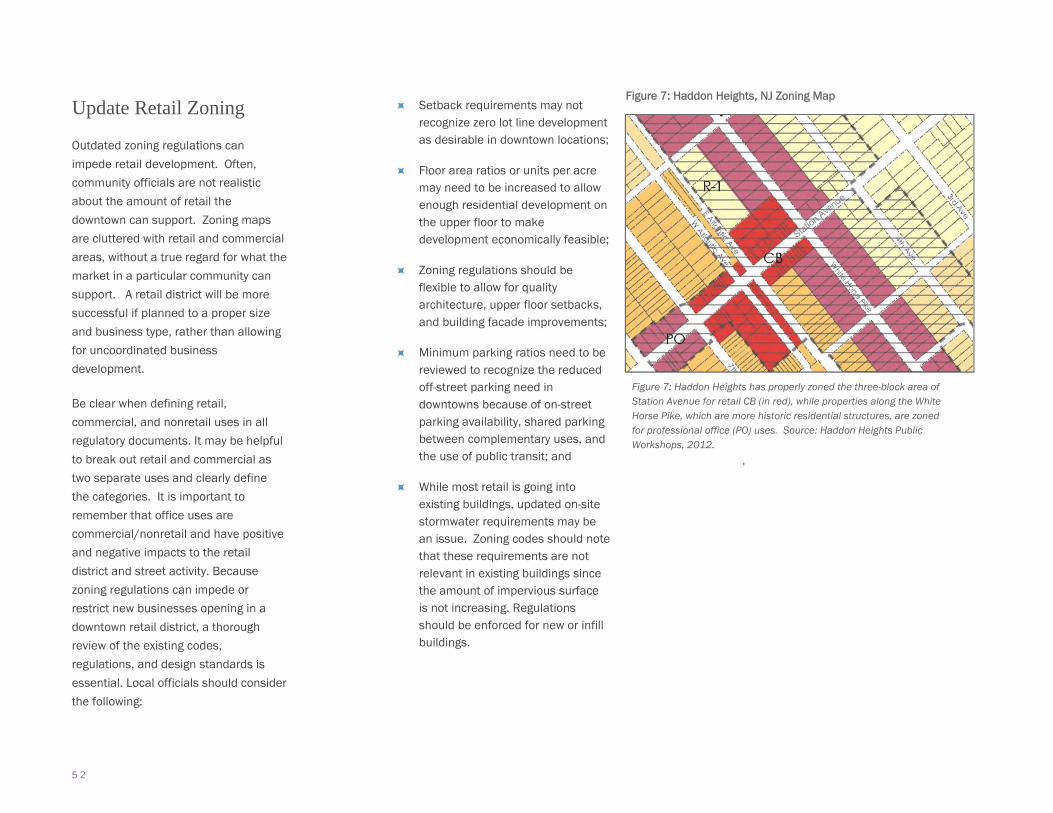
5 2
Update Retail Zoning
Outdated zoning regulations can
impede retail development. Often,
community officials are not realistic
about the amount of retail the
downtown can support. Zoning maps
are cluttered with retail and commercial
areas, without a true regard for what the
market in a particular community can
support. A retail district will be more
successful if planned to a proper size
and business type, rather than allowing
for uncoordinated business
development.
Be clear when defining retail,
commercial, and nonretail uses in all
regulatory documents. It may be helpful
to break out retail and commercial as
two separate uses and clearly define
the categories. It is important to
remember that office uses are
commercial/nonretail and have positive
and negative impacts to the retail
district and street activity. Because
zoning regulations can impede or
restrict new businesses opening in a
downtown retail district, a thorough
review of the existing codes,
regulations, and design standards is
essential. Local officials should consider
the following:
Setback requirements may not recognize zero lot line development as desirable in downtown locations;
Floor area ratios or units per acre may need to be increased to allow enough residential development on the upper floor to make development economically feasible;
Zoning regulations should be flexible to allow for quality architecture, upper floor setbacks, and building facade improvements;
Minimum parking ratios need to be reviewed to recognize the reduced off-street parking need in downtowns because of on-street parking availability, shared parking between complementary uses, and the use of public transit; and
While most retail is going into existing buildings, updated on-site stormwater requirements may be an issue. Zoning codes should note that these requirements are not relevant in existing buildings since the amount of impervious surface is not increasing. Regulations should be enforced for new or infill buildings.
.
Figure 7: Haddon Heights has properly zoned the three-block area of Station Avenue for retail CB (in red), while properties along the White Horse Pike, which are more historic residential structures, are zoned for professional office (PO) uses. Source: Haddon Heights Public Workshops, 2012.
Figure 7: Haddon Heights, NJ Zoning Map

R E V I T A L I Z I N G S U B U R B A N D O W N T O W N R E T A I L D I S T R I C T S 5 3
Provide Incentives to Attract New Retail
Competition for new businesses is high
and economic development officials
often use the same strategies. Careful
use of physical and financial incentives
can level the playing field, while
misusing incentives can leave a
community fiscally vulnerable.
Incentives serve to increase profitability
or defray the costs of construction,
relocation, or rehabilitation. The proper
incentives may convince developers and
retailers to invest in an older downtown.
Provide incentives only if the project
could not proceed without them and
make sure there is a policy guide on
their use. Generally, incentives are
broken into three categories: regulatory
incentives, financial incentives, and
design incentives.
Below are guidelines for establishing
municipal incentives:
Establish policies before receiving requests to set expectations;
Do not rely on the developer or retailer’s analysis of what incentives are needed. Have an independent party review the
developer’s projections of tax and sales revenue;
Require the developer or retailer to argue his or her case, including substantiating the financial projections;
Consider “look back” provisions, which permit the amount of the incentive to be reexamined during the course of a project;
Avoid up-front payments. Developers often want financial incentives early, but if the project falls through or generates less money than expected, the municipality may not recoup its costs;
Work with a successful developer. Require background information and visit other projects that he/she has completed.
Regulatory Incentives
Regulatory incentives are about zoning compliance and the permitting process. A community will become more attractive to a potential retailer if the development process is clear and available upfront. Regulatory incentives are low cost and can be done in the short term. Ensure that all members of the development process are aware of the incentives and consider assigning one person to be the main contact.
Sample Incentive Package for Community Rebates on Sales Tax and Fee Waivers
Projects must have:
Brick and mortar location;
Employees must be physically employed in a downtown location;
Projected annual retail gross taxable sales of at least $1.5 million;
Must employ five or more full-time employees and have a minimum $500,000 capital investment, including property, building, equipment, and renovation.
Incentives:
Qualifying projects will be considered for rebates of up to 50 percent to the property developer or retailer of future city sales tax receipts over a 10-year period.
The township will consider waiver of building permit fee.
The township will consider waiver of water and sewer tap fee.
Source: Thomasville, AL.

5 4
Financial Incentives
While municipalities often think of retail
as a revenue generator, local
governments must be willing to invest in
the downtown district as a whole.
Fortunately, the right public investment
can leverage 10 to 15 times that
amount in private investment. The
public sector cannot create a market for
retail, but it can use public subsidies to
leverage needed private investment.
When offering incentives to perspective
retailers, remember the following:
Provide only enough to get an initial retail business moving forward. This is often enough to attract additional businesses.
Establish an expected return on public dollars to evaluate the worthiness of each incentive. Review and develop a business’s projections to ascertain if the incentive is worthy.
Build performance-based incentives. If a particular goal is not achieved, the incentive must be given back, or offer rebates on future tax revenues.
For example, Cheltenham Township,
Pennsylvania recently adopted a tax
abatement ordinance to spur additional
retail development in the 5 designated
retail districts – Glenside, Elkins Park
East, Elkins Park West, East
Cheltenham Avenue and Cheltenham
Village. Tax on the improved part of the
property is phased in over five years and
improvements can be made to new and
existing businesses. To be eligible for
the tax abatement, properties must
meet the ordinance’s definition of
“deteriorating.”
Financial Incentives
Tax Increment Financing (TIF) is used by communities to help stimulate redevelopment. TIF allows infrastructure and other related improvements associated with
specific developments to be funded by future tax revenue generated by the improvements. A loan for the improvements is secured and then incremental tax revenue
above the predevelopment level is used to repay the loan. State legislation sets the parameters for the use of TIF.
Sales Tax Rebates create little risk for communities. Municipalities can rebate any portion of sales tax generated by a commercial development if a public purpose is
demonstrated. Sales tax revenue can offset developer costs and be restricted to catalytic retail development, whether a shopping center or individual retailer. Rebates
can include utility or other municipally-collected taxes.
Revolving Loan Funds (RLFs) are facilitated by municipalities who offer loans for enterprises to improve conditions or equipment. Many states require that for every
$15,000 of RLF money, at least one full-time job must be created.
Fee waivers of municipal building fees reduce construction costs for retailers and developers. This does not require a community to put forth any money.
Catalyst tenant grants are much like tenant allowances given to department stores to anchor regional malls. Catalyst tenant grants can induce specific retail types to
locate in key locations within the retail district. These grants are most effective in areas without a retail base. Catalyst grants should be given to only specific iconic
tenants that will help attract additional retailers to the district.
Source: Retail 1-2-3, ICSC

R E V I T A L I Z I N G S U B U R B A N D O W N T O W N R E T A I L D I S T R I C T S 5 5
Design Incentives
Infrastructure and community
investment is essential to attracting new
retail. Design incentives – design
guidelines, land assembly,
infrastructure, and parking – may be
expensive, but can be worth the
investment. By investing in the
community, retailers are often willing to
make the same investment. Improving
the downtown atmosphere, providing
sidewalks and plantings, providing for
parking, or assembling land are
important steps in planning for retail.
A common mistake for communities is
to invest millions in the public realm
with new street furniture and brick
sidewalks, while ignoring vacant or
deteriorating buildings, facades, or
building condition. Communities should
avoid focusing on design elements
without also addressing the facilities.
Building condition is a key criterion
assessed by retailers when making
location decisions.
Facade Programs
Incentives and matching grant programs
for facade improvements are useful in
older downtowns and typically follow
design guidelines. Municipalities can
provide design services and matching
grants to cover a portion of the
building’s renovation costs. Funds for
facade programs can be raised, or
qualifying communities may choose to
utilize a portion of their Community
Development Block Grant (CDBG) funds.
Facade programs can include physical
improvements, such as painting,
window replacement, awnings, or
infrastructure.
The Lansdowne Economic Development Corporation (LEDC) assists business and property owners in the Lansdowne Central Business District (CBD). Facade improvements are encouraged through matching grants. Source: www.landsdownefuture.org, 2013.
Phoenixville Borough, PA received a grant to provide new street furniture and sidewalks in the downtown. Streetscape improvements are one of the several revitalization projects ongoing in the Borough including two new mixed-use projects along Bridge Street and enhancements to the Schuylkill River Trail.
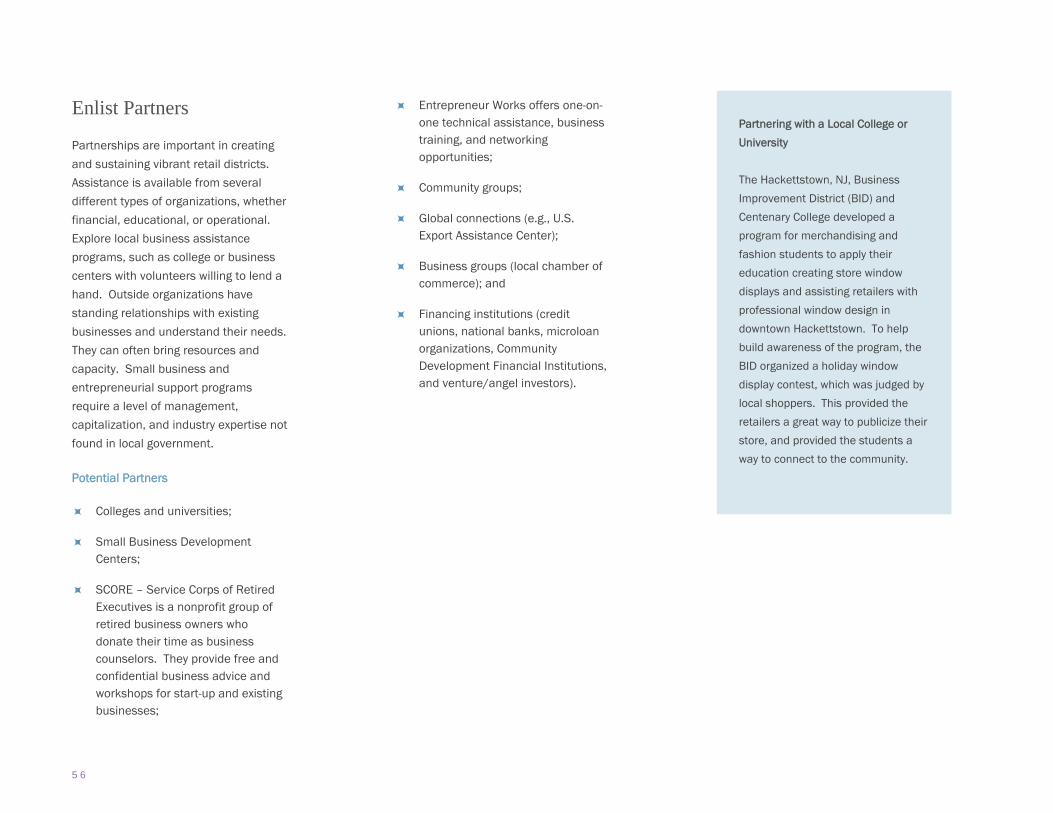
5 6
Enlist Partners
Partnerships are important in creating
and sustaining vibrant retail districts.
Assistance is available from several
different types of organizations, whether
financial, educational, or operational.
Explore local business assistance
programs, such as college or business
centers with volunteers willing to lend a
hand. Outside organizations have
standing relationships with existing
businesses and understand their needs.
They can often bring resources and
capacity. Small business and
entrepreneurial support programs
require a level of management,
capitalization, and industry expertise not
found in local government.
Potential Partners
Colleges and universities;
Small Business Development Centers;
SCORE – Service Corps of Retired Executives is a nonprofit group of retired business owners who donate their time as business counselors. They provide free and confidential business advice and workshops for start-up and existing businesses;
Entrepreneur Works offers one-on-one technical assistance, business training, and networking opportunities;
Community groups;
Global connections (e.g., U.S. Export Assistance Center);
Business groups (local chamber of commerce); and
Financing institutions (credit unions, national banks, microloan organizations, Community Development Financial Institutions, and venture/angel investors).
Partnering with a Local College or
University
The Hackettstown, NJ, Business
Improvement District (BID) and
Centenary College developed a
program for merchandising and
fashion students to apply their
education creating store window
displays and assisting retailers with
professional window design in
downtown Hackettstown. To help
build awareness of the program, the
BID organized a holiday window
display contest, which was judged by
local shoppers. This provided the
retailers a great way to publicize their
store, and provided the students a
way to connect to the community.

R E V I T A L I Z I N G S U B U R B A N D O W N T O W N R E T A I L D I S T R I C T S 5 7
Track Success
Simply put, one cannot manage what is
not measurable. In the early stage of
planning, the community’s retail goals
should be clearly defined. These goals
are the criteria for measuring success.
If the goal is increased revenue, then
measure the return on investment. If
the goal is to create a unique shopping
experience, then provide surveys to
shoppers to gauge their opinions.
Make sure metrics rely upon the same
source each time and a set time period
is given for the measurement.
Below is a list of questions that should
be revisited frequently.
Have the community’s demographics
changed?
What, if any, impact has immigration had?
Is the population increasing?
Has the community’s buying power changed?
What is the current market?
Is the retail district attracting more dollars than last year?
How are neighboring communities doing? Is there competition for the same dollars?
Should the current supply and demand be reevaluated?
Are the correct regulatory, financial,
and design incentives provided?
Was a small business loan program created?
Who has utilized the facade program? The tax abatement program?


R E V I T A L I Z I N G S U B U R B A N D O W N T O W N R E T A I L D I S T R I C T S 5 9
Chapter Five: Evaluating Retail Supply and Demand
Retail is a limited commodity; therefore, it is
important to know the market. A market
assessment can help identify any unmet retail
demand. Market assessments simply measure
whether there is unmet retail demand in the
downtown. Once the vital information needed
by potential retailers is collected, take stock of
what already exists in the downtown and where
there may be an unmet need for a particular
retail sector. This allows targeting future
growth.
Supply Side of Retail Step 1: Determine the Supply
Simply complete a retail inventory by walking
around the retail district and writing down each
retail space's business name, address, square
footage, and retail category. Be sure to denote
when there is a vacancy. Include nonretail
businesses utilizing any retail space, such as an
insurance company or a doctor's office.
To determine the total amount of retail space
occupied by tenants for each retail category,
simply add together all of the square footage
occupied by NG&S tenants, F&B tenants, and
GAFO tenants.
Step 2: Set the Boundaries
What are the limits of the community’s retail
district? The retail district should have
continuous retail tenants. A solid block of retail
with no vacancies is often more successful than
a longer stretch with more vacancies. The
district usually has a string of ground-level
spaces that are activated by a use that is
accessible by the public (church, daycare, and
professional office). A string of large nonretail
uses, such as apartment buildings, government
buildings, or a park, signify the end of the retail
district. The boundaries are subjective so be
sure to have reasons for determining a specific
start and stop.
Step 3: Conduct Retail Inventory
List all the spaces within your retail district,
regardless of their existing tenant or use (see
sample on Page 49). There may be some
spaces occupied by offices or some that are
vacant. This happens when a retail-appropriate
use is occupied by a nonretail use. To ascertain
if a space is “retail-appropriate,” look for
storefronts that do not have yards and are
typically adjacent to similar looking ground-level
spaces.
Step 4: Identify the Retail Category
Neighborhood Goods & Services (NG&S); Food
and Beverage (F&B); or General Merchandise,
Apparel, Furnishings or Other (GAFO).
Step 5: Determine the Property Owner
Property owner names and addresses can be
found at the local tax office. It is also helpful to
have the business owner’s name.
Step 6: Conduct Shopper Surveys
Gathering basic information about shopping
patterns will help a community assess its
market strengths and weaknesses. While
professional marketing firms assess the sales
potential of various sites, a basic shopper
survey is a more cost-efficient way to do this.
Shopper surveys ask individuals about their
community, including likes and dislikes about
the shopping environment. While many
respondents desire stores that are unrealistic
(i.e., a Nordstrom), the survey can still provide
Calculating Existing Retail Supply
(NG&S SF + F&B SF + GAFO SF) +
Vacant SF +
Non-retail tenants SF
Source: Streetsense

6 0
information about buying patterns and
preferred locations. The survey can be done via
mail, telephone, or in person.
Demand Side of Retail Step 1: Determine Demand
Determining demand for retail relies upon
competing demands from various interests, as
well as the impact of existing retail in the
primary and secondary trade area. An
understanding of what exists within the
community’s trade area is the first step in the
process. Retailers rely on formulas when
evaluating trade areas, such as the number of
households with a certain median income
within a certain distance of their site. This
formula often changes depending on the type of
retail store. To assess what is within the trade
area, start with a map delineating nearby
shopping areas and other retail.
Market demand must be calculated for each
type of retail separately, as the total
expenditures, capture rate, and sales per
square foot will vary. Create a spreadsheet for
each category (grocery, apparel, dining out,
etc.), using the retail demand formula.
Savvy retailers and office tenants evaluate a
community’s market potential before locating.
Market considerations often take precedence
over site considerations because without
demand, the availability of a retail-appropriate
site is irrelevant. The top two criteria for
locating in an established community are foot
traffic and overall accessibility, followed by the
spending power of the surrounding
neighborhood.
Pedestrian Counts
For urban locations, pedestrian counts are vital.
Food and Beverage (F&B) retailers have the
greatest interest in pedestrian and bicycle
counts for two reasons: F&B retailers, such as
coffee, ice cream, or sandwich shops, rely on
passersby who will make impulsive purchase
decisions and; for sit-down dining
establishments, pedestrians and bicyclists
create vitality on the street.
Transit Accessibility
Within the Greater Philadelphia region, most of
the successful downtown retail districts are
anchored by a rail station. For NG&S and F&B
retailers, proximity to a rail stop (within three to
four blocks) ensures that the neighborhood’s
residents can frequent retail locations, such as
dropping off dry cleaning on the way and from
the station.
Median Household Income
Median household income is a commonly used
indicator of a neighborhood’s spending power.
NG&S retailers have a low threshold for median
household income as every socioeconomic
group needs and purchases these goods. While
the cost of necessities such as groceries, and
medicines, is the same for everyone, regardless
of income, the percentage of household
spending that goes to these types of basic
goods and services influences retailer location.
F&B retailers need customers that have
disposable income after they buy their basic
goods. GAFO retailers have the highest
threshold for median income because
consumers will generally not buy clothes,
furniture, or a computer until they have
satisfied their basic needs and still have
disposable income.
Population
For NG&S, the population threshold is relatively
low; everybody needs basic goods and services.
F&B retailers require a larger population, since
most people eat out, but enjoy variety in their
dining choices. GAFO retailers are looking for a
large population with unmet demand. These
stores require shoppers to make more
expensive purchases less often. They need to
generate a sufficient volume of business to
sustain a store.
Daytime Population
Approximately 15 percent of household
purchases originate from the workplace.
Therefore, daytime population is looked upon
as important especially for F&B retailers who

R E V I T A L I Z I N G S U B U R B A N D O W N T O W N R E T A I L D I S T R I C T S 6 1
wish to capture a time-limited lunch crowd.
NG&S tenants need a lower threshold
population during the day. F&B retailers seek
higher densities of daytime population. GAFO
tenants are not concerned with daytime
population, as they do not rely on the workforce
to make big purchases during their lunch hour.
Most F&B retailers also need weekend
population to sustain themselves.
Educational Attainment
NG&S retailers like to see secondary education
levels for potential higher-income customers,
but they are mostly concerned with the
concentration of high school graduates as a
potential workforce for their stores.
Vehicular Traffic Counts
Average Automobile Daily Trips (AADT), or traffic
counts, are used by retailers as an indicator of
how visible a potential site is. The minimum
threshold depends upon the size of the trade
area needed. NG&S retailers depend heavily
on local customers and therefore can pursue
areas with lower traffic counts. (Pedestrian
counts for NG&S retailers are more important).
Customers generally like to shop for basic
goods and services close to home; therefore,
car commuters are not important to NG&S.
GAFO retailers attract customers from a much
larger area. Most people purchase jewelry,
furniture, and electronics infrequently, and high
traffic counts equate to exposure for potential
customers.
Retail Competition
NG&S retailers seek out areas where they will
be surrounded by complementary tenants,
though not those offering the same good or
service. F&B retailers want to be surrounded by
other F&B retailers, as a cluster of food options
drives more vehicular traffic. GAFO retailers are
somewhere in the middle. Similar stores that
attract similar customers are ideal, but direct
competition too close can draw price shopping.
Overlap
When a store opens up a second location too
close, it is referred to as “cannibalization.” For
NG&S retailers, cannibalization is not a
concern. F&B retailers also have flexibility.
Because of the large trade area for GAFO
retailers, they are the most affected by
cannibalization. Two locations of the same
retailer may split sales and leave both stores
unprofitable.

6 2
Step 2: Configure Trade Areas
Trade area is the portion of the larger region
from which the retail will draw most of its
customers. Trade areas often overlap, which
can cause any downtown to struggle if nestled
between adjacent downtowns with successful
retail, or even a regional mall. Trade areas are
categorized into primary, secondary, and
tertiary zones for existing competition and are
natural for transportation options. Trade areas
vary depending on the type and size of the
center and location of its competition. When
measuring trade areas, travel time is more
important than physical distance. The number
of shoppers willing to travel long distances for
convenience NG&S goods drops dramatically. A
community that offers both everyday goods and
destination goods will capture multiple markets.
In general, an urban retailer will draw from up
to a half mile away, a suburban retailer will
attract customers from one to three miles away;
and a rural area will pull from a maximum of 25
miles away. Travel times can be estimated by
driving through the trade area in typical weather
conditions and traffic situations. Figure 8
illustrates how to graphically show competing
retail districts.
Primary Trade Area: typically draws up to 75 percent
of consumers from about three miles or less.
Retailers consider their primary trade area as the
area in which they can most significantly penetrate
the market. Therefore, it is the primary trade area
that is most important when considering a tenant’s
position in the market and merchandising.
Secondary Trade Area: typically draws 10 to 20
percent of consumers from three to seven miles. This
area is generally less defensible from competition.
The range of the secondary trade area depends on
the location of competitors and population. In areas
where there are fewer retailers, the secondary trade
area may extend farther. Secondary trade areas are
critical when evaluating the market for F&B
establishments and GAFO.
Tertiary Trade Area typically draws the fewest
consumers and extends up to 15 miles in major
metropolitan areas to 50 miles in less-populated
regions. It is the most difficult area to pinpoint and
may also include tourists or shoppers from out of
town. Tertiary trade areas are critical when evaluating
the market for GAFO.
0-3 miles
3-7 miles
Up to 15 miles

R E V I T A L I Z I N G S U B U R B A N D O W N T O W N R E T A I L D I S T R I C T S 6 3
Figure 8: Sample Trade Area Map
The trade area map of the Ambler retail district shows the designated boundaries of the retail district, with a circle encapsulating a one-mile radius, assuming the downtown retail district will draw from the primary trade zone. Competition is strong for this district, as there are four super regional malls within 13 miles and another destination retail district, Chestnut Hill, within seven miles. Source: DVRPC, 2013.
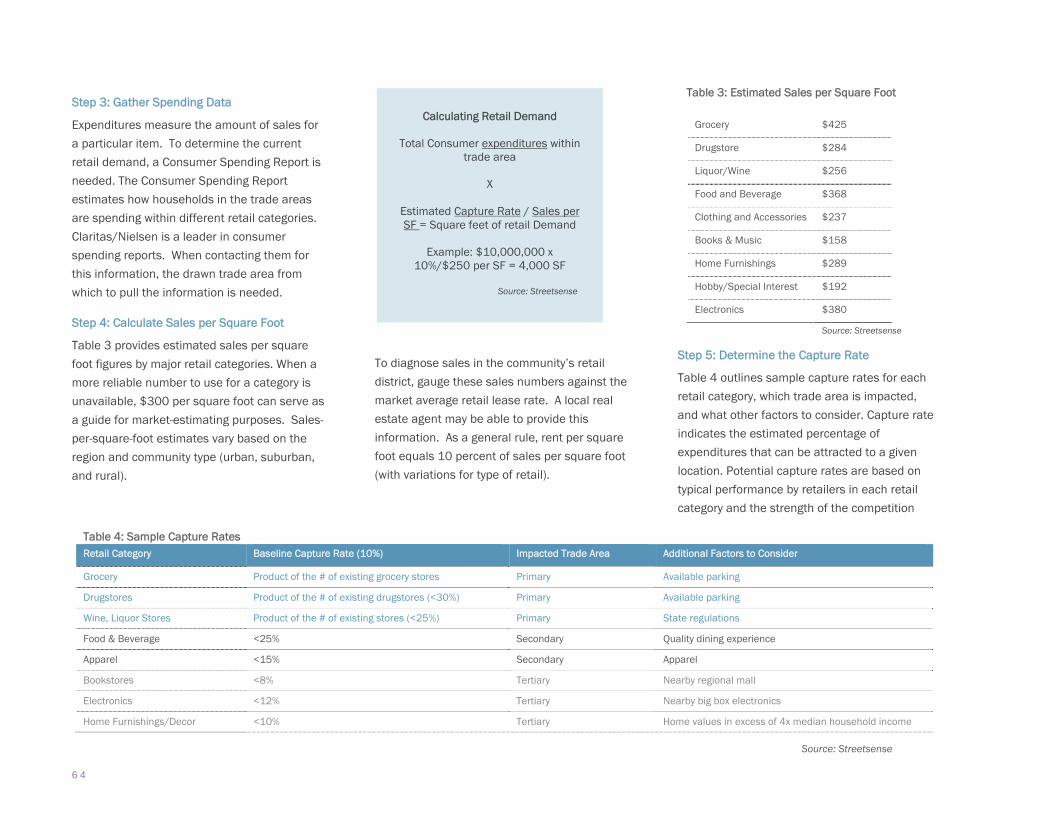
6 4
Step 3: Gather Spending Data
Expenditures measure the amount of sales for
a particular item. To determine the current
retail demand, a Consumer Spending Report is
needed. The Consumer Spending Report
estimates how households in the trade areas
are spending within different retail categories.
Claritas/Nielsen is a leader in consumer
spending reports. When contacting them for
this information, the drawn trade area from
which to pull the information is needed.
Step 4: Calculate Sales per Square Foot
Table 3 provides estimated sales per square
foot figures by major retail categories. When a
more reliable number to use for a category is
unavailable, $300 per square foot can serve as
a guide for market-estimating purposes. Sales-
per-square-foot estimates vary based on the
region and community type (urban, suburban,
and rural).
To diagnose sales in the community’s retail
district, gauge these sales numbers against the
market average retail lease rate. A local real
estate agent may be able to provide this
information. As a general rule, rent per square
foot equals 10 percent of sales per square foot
(with variations for type of retail).
Step 5: Determine the Capture Rate
Table 4 outlines sample capture rates for each
retail category, which trade area is impacted,
and what other factors to consider. Capture rate
indicates the estimated percentage of
expenditures that can be attracted to a given
location. Potential capture rates are based on
typical performance by retailers in each retail
category and the strength of the competition
Calculating Retail Demand
Total Consumer expenditures within trade area
X
Estimated Capture Rate / Sales per SF = Square feet of retail Demand
Example: $10,000,000 x
10%/$250 per SF = 4,000 SF
Source: Streetsense
Table 4: Sample Capture Rates Retail Category Baseline Capture Rate (10%) Impacted Trade Area Additional Factors to Consider
Grocery Product of the # of existing grocery stores Primary Available parking
Drugstores Product of the # of existing drugstores (<30%) Primary Available parking
Wine, Liquor Stores Product of the # of existing stores (<25%) Primary State regulations
Food & Beverage <25% Secondary Quality dining experience
Apparel <15% Secondary Apparel
Bookstores <8% Tertiary Nearby regional mall
Electronics <12% Tertiary Nearby big box electronics
Home Furnishings/Decor <10% Tertiary Home values in excess of 4x median household income
Source: Streetsense
Table 3: Estimated Sales per Square Foot
Grocery $425
Drugstore $284
Liquor/Wine $256
Food and Beverage $368
Clothing and Accessories $237
Books & Music $158
Home Furnishings $289
Hobby/Special Interest $192
Electronics $380
Source: Streetsense

R E V I T A L I Z I N G S U B U R B A N D O W N T O W N R E T A I L D I S T R I C T S 6 5
existing in each retail category. Each retail
category begins at a baseline capture rate (10
percent) and is then adjusted based on the
competition in the surrounding area.
Evaluation
Once the supply and demand calculations are
complete, subtract the supply from the demand
to determine the unmet demand. Sample
equation is shown in Table 5.
The unmet demand does not mean much
unless translated. How many square feet
actually equal a new grocery store, boutique, or
eating establishment? Using the average store
size chart shown in Table 6, communities can
determine what type of retail they can support.
In the case of the sample community used in
Table 5, they can support a small boutique style
store (GAFO), a sit down and quick bite food
establishment (F&B) and one or two
neighborhood goods and services. Remember
to evaluate the trade area needed for each
category. Table 6 shows the average store size
by font color which corresponds to the size of
the trade area needed: blue represents the
stores that are supported by the primary trade
area; gray represents stores that are supported
by the secondary trade area; and the black font
represents the tertiary trade area.
The difference in the supply and demand
reveals the condition of the retail district. An
environment with more demand than supply in
a particular retail category is considered
“underserved” for that type of retail, and
therefore capable of supporting retail growth.
An area with more retail supply than demand is
considered “oversupplied.” Under these
conditions, it is not unusual for the quality of
retail in the area to be diminished and the
business sales margins to be low.
Understanding whether the community is
underserved or oversupplied is critical when
targeting new retailers or developing plans for
vacant buildings.
Table 5: Sample Unmet Demand Calculation
Retail Category Estimated Demand - Existing Supply = Unmet Demand
NG&S 23,200 sf 20,100 sf 3,100 sf
F&B 43,300 sf 32,000 sf 11,300 sf
GAFO 14,500 sf 12,800 sf 1,700 sf
Total 81,000 sf 64,900 sf 16,100 sf
Source: Streetsense
Boutique 1,200 – 2,400 sf
Quick-Bite Food 1,200 – 3,600 sf
Sit-Down Dining 2,400 – 9,000 sf
Drugstore 6,000 – 10,000 sf
Grocery Store 25,000 – 60,000 sf
Big Box (specialty) 15,000 – 120,000 sf
Source: Streetsense
Table 6: Average Store Size

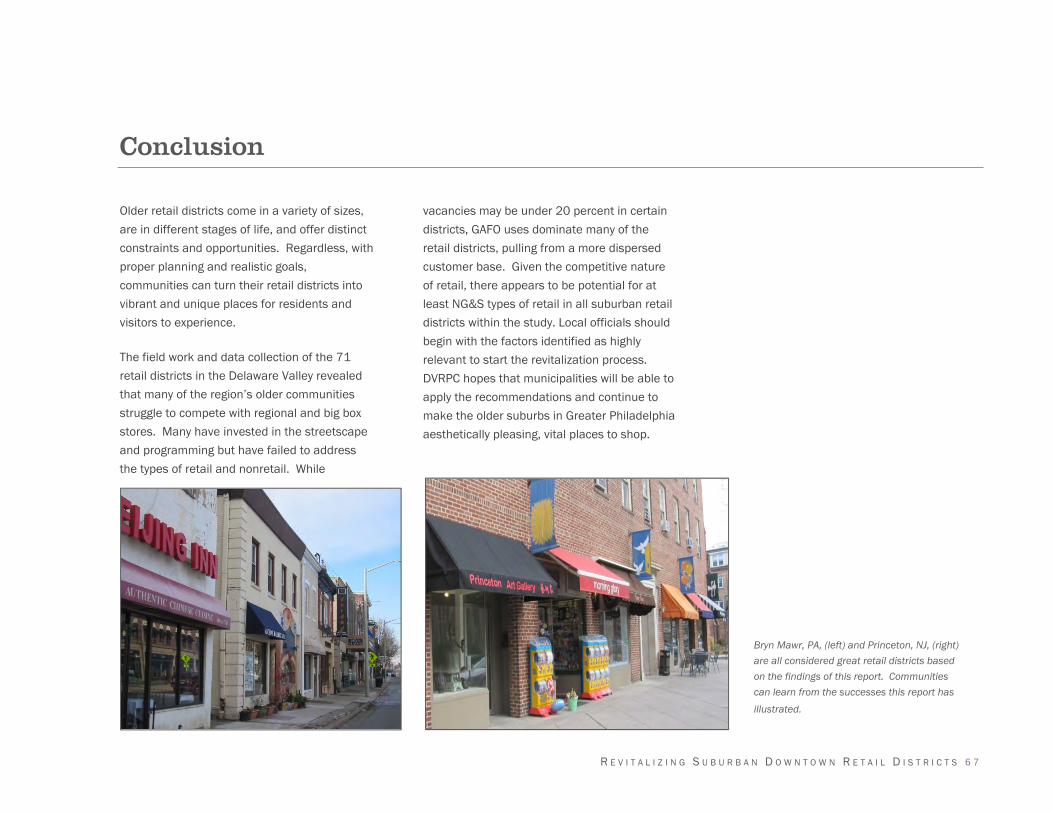
R E V I T A L I Z I N G S U B U R B A N D O W N T O W N R E T A I L D I S T R I C T S 6 7
Conclusion
Older retail districts come in a variety of sizes,
are in different stages of life, and offer distinct
constraints and opportunities. Regardless, with
proper planning and realistic goals,
communities can turn their retail districts into
vibrant and unique places for residents and
visitors to experience.
The field work and data collection of the 71
retail districts in the Delaware Valley revealed
that many of the region’s older communities
struggle to compete with regional and big box
stores. Many have invested in the streetscape
and programming but have failed to address
the types of retail and nonretail. While
vacancies may be under 20 percent in certain
districts, GAFO uses dominate many of the
retail districts, pulling from a more dispersed
customer base. Given the competitive nature
of retail, there appears to be potential for at
least NG&S types of retail in all suburban retail
districts within the study. Local officials should
begin with the factors identified as highly
relevant to start the revitalization process.
DVRPC hopes that municipalities will be able to
apply the recommendations and continue to
make the older suburbs in Greater Philadelphia
aesthetically pleasing, vital places to shop.
Bryn Mawr, PA, (left) and Princeton, NJ, (right) are all considered great retail districts based on the findings of this report. Communities can learn from the successes this report has illustrated.


R E V I T A L I Z I N G S U B U R B A N D O W N T O W N R E T A I L D I S T R I C T S 6 9
Sources
Beyard, Michael D., Michael Pawlukiewicz, and Alex Bond, Ten Principles for Rebuilding Neighborhood Retail, Washington, DC: ULI—the Urban Land Institute, 2003.
Available online:
http://www.uli.org/ResearchAndPublications/Reports/~/media/Documents/ResearchAndPublications/Reports/TenPrinciples/TP_NeighborhoodRetail.ashx (Accessed
August 2, 2012).
CEOs for Cities, Young and the Restless in the Knowledge Economy, 2005, Available online: http://www.ceosforcities.org/research/the-young-and-restless-in-a-knowledge-
economy (Accessed August 2, 2012).
D.C. Office of Planning. DC Vibrant Retail Streets Toolkit. Washington, DC: Streetsense, 2012. Available online:
http://planning.dc.gov/DC/Planning/Across+the+City/Other+Citywide+Initiatives/DC+Vibrant+Retail+Streets+Toolkit/Vibrant+Retail+Streets+Toolkit (Accessed August 2,
2012).
Gibbs, Robert. Principles of Urban Retail Planning and Development, John Wiley & Sons, Inc., 2012
International Council of Shopping Centers, Retail 1-2-3: U.S. Guide for Local Officials & Community Leaders. 2011
McConnell, J. Katie, Christiana McFarland, and Brett Common, Supporting Entrepreneurs and Small Businesses: A Tool Kit for Local Leaders, National League of Cities
Center for Research and Innovation. Available online:
http://www.nlc.org/File%20Library/Find%20City%20Solutions/Research%20Innovation/Economic%20Development/RI_SmallBizToolkit-2012-Web.pdf (Accessed July 19,
2012)
Milder, N. David, Downtown Economics, Issue 154, June 2009
Milder, N. David, Niche Strategies for Downtown Revitalization, Downtown Research and Development Center, 1997
National Association of Realtors, The 2011 Community Preference Survey: What Americans are looking for when deciding where to live. Washington, DC: Belden
Russonello and Stewart, 2011. Available online: http://www.realtor.org/sites/default/files/smart-growth-comm-survey-results-2011.pdf (Accessed August 2, 2012)
National Trust for Historic Preservation, MainStreet.org. 2012, Available online: http://www.preservationnation.org/main-street/ (Accessed August 2, 2012).
7 0
Internet sites Accessed
http://www.cityofboston.gov/dnd/OBD/G_restaurant_initiative.asp (accessed 3/5/13)
http://www.smgov.net/Departments/OSE/Categories/Green_Building/Guidelines/Transportation/Pedestrian_Safety___Comfort.aspx (accessed 3/5/13)
http://hped.org/
http://hped.org/wp-content/uploads/2010/04/Task-Force-May-2006-Assessment-Report.pdf
http://hped.org/wp-content/uploads/2010/04/Task-Force-January-2007-Summary-of-Ideas.pdf
http://hped.org/wp-content/uploads/2010/04/Task-Force-March-2007-6-Point-Economic-Development-Strategy.pdf
http://www.haverfordtownship.com/docs/Haverford_Township_Comprehensive_Plan_Addendum_Report.pdf
http://www.haverfordtownship.com/egov/docs/1322578348988.htm
http://www.thomasvilleal.com/RetailIncentives.htm (June 10, 2013)
http://cheltenhamtownship.org/

Publication Title: Revitalizing Suburban Downtown Retail
Districts: Strategies and Best Practices
Publication Number: 13070
Date Published: November 2013
Geographic Area Covered:
DVRPC 9-county region
Key Words: retail districts, downtown, older suburbs, management
types, main streets, BIDs, merchants associations, Competitive Retail
Management, nonretail, civic, culture, vacant, residential, population
density, transit access, capture rates, lease rates, sales per square
foot, general merchandise, food and beverage, neighborhood goods,
Bryn Mawr, Collingswood, Princeton, Haddonfield, West Chester,
Downingtown, Doylestown, Media, Bordentown City, Kennett Square,
trade area, retail mix, façade programs, financial incentives, design
incentives, retail supply, retail demand, zoning, density, inventory,
retail typology, retail trends.
Abstract: Many land use and zoning policies address retail and
commercial development, but often fall short of creating and
sustaining a thriving retail district that fits the needs of the
surrounding population. Through the Strategies for Older Suburbs
work program, staff compiled information about 71 downtown retail
districts in an effort to learn what elements were common among
successful older suburban retail districts. Short- and long -term
strategies were then developed to help local officials maintain and
revive these districts and further their economic development goals.
Staff Contact:
Karen Cilurso
Senior Regional Planner
(215) 238-2876
Delaware Valley Regional
Planning Commission
190 N. Independence Mall West,
8th Floor
Philadelphia PA 19106
Phone: (215) 592-1800
Fax: (215) 592-9125
Internet: www.dvrpc.org

190 N. Independence Mall West, 8th Floor
Philadelphia, PA 19106 215.592.1800
www.dvrpc.org