Revisiting the Asian crisis (1997) in the light of present...
5
Computational and Applied Mathematics Journal 2015; 1(2): 16-20 Published online January 30, 2015 (http://www.aascit.org/journal/camj) Keywords Foreign Exchange Rate, Asian Crisis, Recession, Nonlinearity, Lyapunov Exponent, Chaos Received: December 05, 2014 Revised: January 19, 2015 Accepted: January 20, 2015 Revisiting the Asian crisis (1997) in the light of present global recession: A chaotic analysis paradigm Pritha Das, Atin Das 1 Department of Mathematics, Indian Inst. Engg. Sc. & Tech., Shibpur, Howrah, India 2 Department of Physical Science, N H School, 1/257 Naktala Kolkata, India Email address [email protected] (P. Das), [email protected] (A. Das) Citation Pritha Das, Atin Das. Revisiting the Asian Crisis (1997) in the Light of Present Global Recession: A Chaotic Analysis Paradigm. Computational and Applied Mathematics Journal. Vol. 1, No. 2, 2015, pp. 16-20. Abstract Asian financial crisis gripped much of Asia beginning in July 1997. Within ten years, entire global economy entered into the present recession that had started around July 2008. Four years after the eruption of the global financial crisis, the world economy was still struggling to recover, actually during 2012, global economic growth has weakened further. In this context, we like to analyze the Foreign Exchange (ForEx) market which observed most hectic activities in this periods. We have selected eight Asian Countries, Hong Kong, Indonesia, South Korea, Malaysia, Philippines, Singapore, Taiwan and Thailand. We computed Largest Lyapunov Exponent (LLE) which is the best tool to quantify chaos from ForEx rate to US Dollar data of these countries during the Asian crisis (1997-1999), then during the first three years of global recession (2007-2009) and finally during next three years during ongoing recession (2010-2012). Our purpose is to compare the amount of chaotic behavior the ForEx markets show in these three distinct periods. We find that the ForEx market became more chaotic during global recession than it was in the Asian crisis. We also find, comparing LLEs that global recession is continuing till end of observation, that is December 2012. 1. Introduction Many East Asian countries recorded extraordinary economic growth during the 1990s [1]. Immediately after this, beginning in July 1997 financial crisis gripped much of Asia. Within ten years of the Asian crisis, entire global economy entered into the present recession, starting around July 2008 and is still struggling to recover. In this work, we like to analyze and compare these two events by looking into the Foreign Exchange (ForEx) markets as they reliably reflect the economy of the respective countries in present globalized system. Before that, we shall briefly outline the events mentioned above. ForEx market and mathematical methods to quantify its chaotic behavior will be explained also in this section. Survey of literature attempting this type of analysis as well as difference of opinion among researchers regarding such chaotic analysis will be briefly presented later in the section. The crisis starting in 1997 was so acute that it even raised fears of a worldwide economic meltdown due to financial contagion. The countries that were affected most by the crisis include Indonesia, South Korea and Thailand. Countries like Hong Kong, Malaysia, Laos and the Philippines were also hurt by the slump. China, Taiwan, Singapore etc. were less affected, although all suffered from a loss of demand and
Transcript of Revisiting the Asian crisis (1997) in the light of present...
Computational and Applied Mathematics Journal 2015; 1(2): 16-20 Published online January 30, 2015 (http://www.aascit.org/journal/camj)
Keywords Foreign Exchange Rate,
Asian Crisis, Recession,
Nonlinearity,
Lyapunov Exponent,
Chaos
Received: December 05, 2014
Revised: January 19, 2015
Accepted: January 20, 2015
Revisiting the Asian crisis (1997) in the light of present global recession: A chaotic analysis paradigm
Pritha Das, Atin Das
1Department of Mathematics, Indian Inst. Engg. Sc. & Tech., Shibpur, Howrah, India 2Department of Physical Science, N H School, 1/257 Naktala Kolkata, India
Email address
[email protected] (P. Das), [email protected] (A. Das)
Citation Pritha Das, Atin Das. Revisiting the Asian Crisis (1997) in the Light of Present Global Recession:
A Chaotic Analysis Paradigm. Computational and Applied Mathematics Journal.
Vol. 1, No. 2, 2015, pp. 16-20.
Abstract Asian financial crisis gripped much of Asia beginning in July 1997. Within ten years,
entire global economy entered into the present recession that had started around July
2008. Four years after the eruption of the global financial crisis, the world economy was
still struggling to recover, actually during 2012, global economic growth has weakened
further. In this context, we like to analyze the Foreign Exchange (ForEx) market which
observed most hectic activities in this periods. We have selected eight Asian Countries,
Hong Kong, Indonesia, South Korea, Malaysia, Philippines, Singapore, Taiwan and
Thailand. We computed Largest Lyapunov Exponent (LLE) which is the best tool to
quantify chaos from ForEx rate to US Dollar data of these countries during the Asian
crisis (1997-1999), then during the first three years of global recession (2007-2009) and
finally during next three years during ongoing recession (2010-2012). Our purpose is to
compare the amount of chaotic behavior the ForEx markets show in these three distinct
periods. We find that the ForEx market became more chaotic during global recession
than it was in the Asian crisis. We also find, comparing LLEs that global recession is
continuing till end of observation, that is December 2012.
1. Introduction
Many East Asian countries recorded extraordinary economic growth during the 1990s
[1]. Immediately after this, beginning in July 1997 financial crisis gripped much of Asia.
Within ten years of the Asian crisis, entire global economy entered into the present
recession, starting around July 2008 and is still struggling to recover. In this work, we
like to analyze and compare these two events by looking into the Foreign Exchange
(ForEx) markets as they reliably reflect the economy of the respective countries in
present globalized system. Before that, we shall briefly outline the events mentioned
above. ForEx market and mathematical methods to quantify its chaotic behavior will be
explained also in this section. Survey of literature attempting this type of analysis as well
as difference of opinion among researchers regarding such chaotic analysis will be
briefly presented later in the section.
The crisis starting in 1997 was so acute that it even raised fears of a worldwide
economic meltdown due to financial contagion. The countries that were affected most by
the crisis include Indonesia, South Korea and Thailand. Countries like Hong Kong,
Malaysia, Laos and the Philippines were also hurt by the slump. China, Taiwan,
Singapore etc. were less affected, although all suffered from a loss of demand and

17 Pritha Das and Atin Das: Revisiting the Asian Crisis (1997) in the Light of Present Global Recession: A Chaotic Analysis Paradigm
confidence throughout the region. There was an intense period
of speculation in ForEx markets, in the respective countries.
Foreign and domestic investors withdrew funds. The region
experienced a collapse in the level of economic activity while
the number of bankruptcies and level of private sector debt
escalated. Details of such activities in 1997 to 1998 are listed
in, for example, [2,3,4]. This crisis was termed as Asian Crisis.
The International Monitory Fund (IMF) in the perspective
of the Asian crisis noted that serious financial crises are not a
new phenomenon, and they will occur again in the future [5].
The IMF also warned that the risk of crises is rising, including
the scope for international contagion. In fact present global
recession started around July 2008. Four years after this,
during 2012, global economic growth has weakened further. A
growing number of developed economies have fallen into a
double-dip recession. Those in severe sovereign debt distress
moved even deeper into recession, caught in the downward
spiraling [6]. This global recession also affects the Asian
countries.
1.1. Literature Review
We have two events: one is the Asian crisis and the other is
the ongoing Global recession. To the best of our knowledge
little work has been done to compare these two events in
paradigm of nonlinear data analysis. In some works, different
financial indicator values were compared. Zeman (2013)
compared the chaotic behaviors of Thailand (in Asia) in 1998
and Greece (in EU) in 2013 in terms of economic indicators
like GDP, unemployment, exports, government debt etc.
without any further analysis [7]. He observed many similarities
could be found in the creation of both crises. In a slightly
different context, another study in ECB Bulletin, May 2012 [8]
compared crisis in Japan to the present one in the US, terming
both as ‘balance sheet recessions’ with focus on different
aspects of debt problems in Japan, US and Euro Area up to
2011. With simple comparison of relevant statistics, it takes
into account changed growth trajectory in the United States
and the euro area. It rightly concluded that the recovery in both
economies is thus likely to be sluggish and prone to
uncertainty, in line with previous episodes following financial
crises. Baily and Elliott (2009), while analyzing the US
financial and economic crisis, commented that the global crisis
occurring a decade later made the Asian crisis look trivial by
comparison [9]. Krugman (2013) while comparing crisis in
Indonesia (in Asia) and Greece (in EU), reasoned the recovery
of the former as it had its own currency. By this point in the
aftermath of the Asian crisis, even Indonesia was well on the
road to recovery; Greece, Spain etc. are still sinking [10].
In the above mentioned studies, no mathematical or
statistical analysis was undertaken. To study the nonlinear
relationship of different elements in complex dynamics of
ForEx market, we will concentrate to quantify chaos in
ForEx market. This can be done only through nonlinear data
analysis. Largest Lyapunov Exponent (LLE) which is the
best tool to quantify chaos, as it measures the loss of
information through evolution of time. This is explained later
in this paper. Chaotic nature of the two crises under study
remains unaddressed so far our knowledge runs. Probably
due to this, sometimes wrong conclusion is arrived. For
example, Baily et al. (ibid) hoped in 2009 that it is possible
or even likely that the worst is over in financial markets and
the economy will slowly start to mend. Another example of
failure to capture the access the depth of recession in terms of
data analysis is the International Monetary Fund (IMF)
Report in 2007. Just few months before the recession started
in 2008, it although noted the “Downside risks have
increased significantly”, but was confident that “So far,
despite the significant ongoing correction in financial
markets, global growth remains solid, though some
slowdown could be expected” [11]. In this work, we are not attempting to investigate causes
and effects of the crisis or recession, rather we like to analyze
the Foreign Exchange (ForEx) markets which are 24-hour
financial market.. The trading in the foreign exchange
markets generally involves the US dollar. In globalized
economy, most countries accept pegging their currencies to
the US dollar. The global demand crumpled and led to an
imbalance in the global economics. There are several reasons
for this creeping return to pegged exchange rates. Most of the
countries are buying the US dollar in order to curb the
appreciation of their currencies [12]. There is plenty of
literature showing basic factors - called fundamentals that
influence changes in the exchange rate. Some examples of
fundamentals are listed in Das [13].
There is some difference of opinion regarding the presence of
chaos in ForEx market. Some of the related earlier works found
evidence of chaotic structures in foreign exchange rates (for
example, in case of the Canadian and Australian dollars over
their floating rate periods), some studies found little evidence of
chaos, however, many of them showed evidence of nonlinear
structure. Some studies found little evidence of chaos, however,
many of them showed evidence of nonlinear structure [14]. Bask
[15,16] considered Swedish Kroner versus Deutche Mark, ECU,
US $ and Yen in his study using data of daily observation from
January 1986 to August 1995 (2409 points). By measuring the
LLE, the study found indication of deterministic chaos in all
exchange rate series. De Grauwe et al. [17] stressed that it is
generally difficult to conclusively find evidence for the existence
of chaotic dynamics because the available techniques do not
allow separating the exogenous noise from chaos. In a series of
work, we investigated the chaotic property of Foreign Exchange
Rates of several countries [13,18-20] where we calculated the
LLE to characterize and measure chaotic properties of ForEx
rate data sets.
In this work, we have selected following eight Asian
Countries: Hong Kong, Indonesia, South Korea, Malaysia,
Philippines, Singapore, Taiwan and Thailand. We computed
LLE from ForEx rate to US Dollar for these countries during
the Asian crisis, then during the first three years of current
recession and finally during next three years till 2012. Our
purpose is to compare the amount of chaotic behaviour the
ForEx markets show in these three distinct periods. More

Computational and Applied Mathematics Journal 2015; 1(2): 16-20 18
specifically we like to find which event affected this market
more and how it is going till 2012.
The paper is organized as follows: The source and period
of data are given in Section 2. LLE and algorithm used are
explained under Section 3. Results are given in Section 4 and
some concluding remarks are made in Section 5.
2. Data Collection
Access to one of the world's largest historical, high
frequency, filtered currency databases are made freely
available for download by OANDA [21]. The data are
available in XLS format. We collected daily data for eight
Asian countries as mentioned earlier. The periods for which
data collection was done (starting from 1st January of
beginning year and ending on 31st December of concluding
year in each case) are: i) To assess the Asian crisis effect, data
from 1997 to 1999, and to assess the global recession, ii)
during first three years, that is data from 2007 to 2009 and iii)
next three years, that is to data from 2010 to 2012 are
considered. While converting ForEx, financial institution
charges a different rate when one sells a currency (called the
Bid) or buys a currency (called the Ask). The Midpoint rate is
the average of the Bid and Ask rates for a currency pair. In this
work, data sets are midpoint rates on daily basis. Thus we have
for each country, three datasets- each consisting of little over
1000 points for each of the three periods. All data are suitably
plotted in Fig 1 (left panels). We have plotted the ForEx rate
taking number of data points as horizontal axis, omitting the
standard time option so that the rates can be easily compared
during the discussed three periods.
3. Methodology: Finding Lyapunov
Exponent Using TSTOOL Package
Chaotic processes are characterized by positive Lyapunov
Exponent (LE). LE measures the rate at which information is
lost from a system. Positive LE means that information about
initial conditions are easily lost, implying chaos. The larger
the LE, the faster is the loss and hence system is more
chaotic. [22]. There are several approaches to calculate the
LE, here we follow the approach of Wolf et al. [23]. For
details, please refer to our earlier work [13]. Again, we used
the TSTOOL to find the largest LLE. The function used is
largelyap which is an algorithm based on work by Wolf
[ibid], it computes the average exponential growth of the
distance of neighboring orbits via the prediction error. The
increase of the prediction error versus the prediction time
allows an estimation of the LLE. For details, please refer to
our previous work. In the particular MATLAB [24] code,
largelyap, the average exponential growth of the distance of
neighboring orbits is studied on a logarithmic scale, this time
via prediction error p(k). Dependence of p(k) on the number
of time steps may be divided into three phases. Phase I is the
transient where the neighboring orbits converges to the
direction corresponding to the λ1 the LLE. During phase II,
the distance grows exponentially with exp(λ1tk) until it
exceeds the range of validity of the linear approximation of
the flow. Then phase III begins where the distance increases
slower than exponentially until it decreases again due to
folding in the state space. If the phase II is sufficiently long, a
linear segment with slope λ1 appears in the p(k) versus k
diagram [25,26].
While calculating the LLE, we have obtained the
prediction error p(k) versus k diagrams as output and are
given in Fig.1 (Right panel). By finding the slope of the
phase II, we estimate LLEs in each case. The LLE values are
plotted against number of nearest neighbors used in
calculation.
4. Results
Table 1. Showing LLE values of the eight countries for Three periods
LLE values
Time period in years
Country Currency 1997 to 1999 2007 to 2009 2010 to 2012
Hong Kong HKD 3.2 3.8 4.4 Indonesia IDR 3.8 4.1 4.3 South Korea KRW 3.3 4.1 4.2 Malaysia MYR 3.5 4.3 4.5 Philippines PHP 4.2 4 3.3 Singapore SGD 4.1 4 4.4 Taiwan TWD 3.8 4.5 4.4 Thailand THB 3.7 4.5 4.4
From the Table 1 showing LLE values of the eight
countries for the mentioned three period, it is observed that
LLE values in 1997 to 1999 was in the range of 3.5 to 4.1,
during 2007 to 2009, they range 4 to 4.5 (except Hong Kong)
while during 2010 to 2012, they are in the range of 4.2 to 4.5
(except Philippines).
Particularly, for all the countries,
LLE in 1997-1999 period < LLE during 2007-2009.
So we can safely say that comparing the 1997 Asian crisis
and 2007 Global recession, the
LLE values increased for the Asian countries. So the
ForEx market became more chaotic during global recession
than it was in the Asian crisis. Also comparing the 2007 LLE
values to that in 2010, we see that there is no much
difference. So we can say that effect of global recession is
continuing till end of observation, that is December, 2012.
19 Pritha Das and Atin Das: Revisiting the Asian Crisis (1997) in the Light of Present Global Recession: A Chaotic Analysis Paradigm
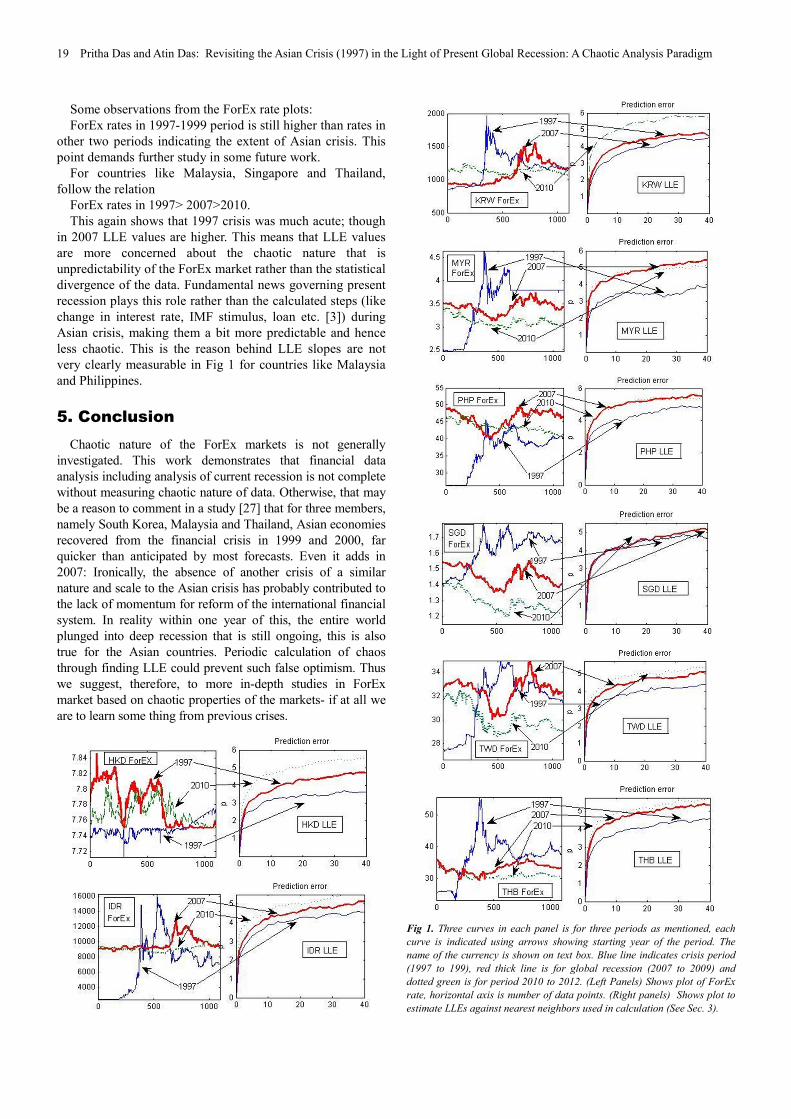
Some observations from the ForEx rate plots:
ForEx rates in 1997-1999 period is still higher than rates in
other two periods indicating the extent of Asian crisis. This
point demands further study in some future work.
For countries like Malaysia, Singapore and Thailand,
follow the relation
ForEx rates in 1997> 2007>2010.
This again shows that 1997 crisis was much acute; though
in 2007 LLE values are higher. This means that LLE values
are more concerned about the chaotic nature that is
unpredictability of the ForEx market rather than the statistical
divergence of the data. Fundamental news governing present
recession plays this role rather than the calculated steps (like
change in interest rate, IMF stimulus, loan etc. [3]) during
Asian crisis, making them a bit more predictable and hence
less chaotic. This is the reason behind LLE slopes are not
very clearly measurable in Fig 1 for countries like Malaysia
and Philippines.
5. Conclusion
Chaotic nature of the ForEx markets is not generally
investigated. This work demonstrates that financial data
analysis including analysis of current recession is not complete
without measuring chaotic nature of data. Otherwise, that may
be a reason to comment in a study [27] that for three members,
namely South Korea, Malaysia and Thailand, Asian economies
recovered from the financial crisis in 1999 and 2000, far
quicker than anticipated by most forecasts. Even it adds in
2007: Ironically, the absence of another crisis of a similar
nature and scale to the Asian crisis has probably contributed to
the lack of momentum for reform of the international financial
system. In reality within one year of this, the entire world
plunged into deep recession that is still ongoing, this is also
true for the Asian countries. Periodic calculation of chaos
through finding LLE could prevent such false optimism. Thus
we suggest, therefore, to more in-depth studies in ForEx
market based on chaotic properties of the markets- if at all we
are to learn some thing from previous crises.
Fig 1. Three curves in each panel is for three periods as mentioned, each
curve is indicated using arrows showing starting year of the period. The
name of the currency is shown on text box. Blue line indicates crisis period
(1997 to 199), red thick line is for global recession (2007 to 2009) and
dotted green is for period 2010 to 2012. (Left Panels) Shows plot of ForEx
rate, horizontal axis is number of data points. (Right panels) Shows plot to
estimate LLEs against nearest neighbors used in calculation (See Sec. 3).

Computational and Applied Mathematics Journal 2015; 1(2): 16-20 20
References
[1] Krugman, P. (1994) "The Myth of Asia's Miracle". Foreign Affairs 73 (6): 62–78. JSTOR 20046929.
[2] Krugman, P. "What Happened to Asia?, Jan. 1998, http://web.mit.edu/krugman/www/DISINTER.html)
[3] Gabriel P., The Three Routes to Financial Crises: The Need for Capital Controls., Center for Economic Policy Analysis, Cambridge University, Nov. 2000.
[4] Wikipedia, 1997 Asian financial crisis, http://en.wikipedia.org/wiki/1997_Asian_Financial_Crisis (visited May, 2013).
[5] IMF, World Economic Outlook, May 1998.
[6] United Nations, Global Economic Outlook, 2013.
[7] Zeman M., (2013) A comparative analysis of 1997 East Asian Tigers crisis and EU sovereign debt crisis, Main study cases: Thailand and Greece, University of Vienna April 2013.
[8] European Central Bank, Comparing the recent Financial Crisis in The United States and the Euro Area with the Experience of Japan in the 1990s, Monthly Bulletin May 2012
[9] Baily M. N., Elliott D. J. (2009). Where Does It Stand and Where Do We Go From Here?, Initiative on Business and Public Policy at Brookings.
[10] Krugman P., The Asian Crisis Versus The Euro Crisis, The New York Times, August 28, 2013
[11] International Monetary Fund (IMF) (2007), "World Economic and Financial Surveys, Financial Market Turbulence, Causes, Consequences, and Policies", Washington DC, Oct. 2007.
[12] Grauwe De P., Grimaldi M., (2003). Intervention in the foreign exchange market in a model with noise traders. Draft at Univ. of Leuven.
[13] Das A., Das P., (2007). Chaotic Analysis of the Foreign Exchange Rates. Appl. Math. & Compu. 185(1): 388-396.
[14] LeBaron B., (1994). Chaos and nonlinear forecastability in economics and finance. Phil. Tran. of Royal Soc. London. Ser. A . 348: 397-404.
[15] Bask M., (1996). Dimensions and Lyapunov exponents from exchange rate series. Chaos, Solitons & Fractals. 7(12): 2199-2214.
[16] Bask M., (2002). A positive Lyapunov exponent in Swedish exchange rates? Chaos, Solitons & Fractals. 14(5): 1295-1304.
[17] Grauwe De P, Vansteenkiste I., (2001). Exchange rates and fundamentals A non-linear relationship? Center for Econ. Studies & Ifo Inst. for Econ. Res. Working Paper No. 577 available at <www.CESifo.de> Visited April 2006, Jan., 2010.
[18] Das A, Das P., Gürsan Ç., (2012). Chaotic analysis of the foreign exchange rates during 2008 to 2009 recession, AJBM Vol. 6(15), pp. 5226-5233.
[19] Das P., Das A., (2013) Comparison of Recession During 2008 - 2009 and 2009-2013: A Chaotic Analysis Of The Foreign Exchange Rates, Journal of Contemporary Management. May, 100-112.
[20] Das P., Das A., (2014). Investigating the Existence of Chaos in Inflation Data in Relation to Chaotic Foreign Exchange Rate, Economics Research International. Volume 2014, Article ID 783505.
[21] OANDA- A trusted source for currency data.http://www.oanda.com Visited May, 2013.
[22] Chris B. (1998). Chaos in Foreign Exchange Markets: A Skeptical view, Computational Economics 11:265-281.
[23] Wolf A., Swift J. B., Swinney L. H., Vastano J. A., (1985). Determining Lyapunov exponent from a time series. Physica D. 16: 285–317.
[24] MATLAB Release13, The MathWorks, Inc., 2002.
[25] Parlitz U., (1998). Nonlinear time series analysis, in: Suykens JAK, Vandewalle J (Eds.) Nonlinear Modeling - Advanced Black-Box Techniques. Kluwer Acad. Pub. Boston.
[26] Parlitz U., Wedekind I, Lauterborn W, Merkwirth C (2001). TSTOOL & User Manual, Ver. 1.11, DPI Göttingen, download at <www.physik3.gwdg.de/tstool/gpl.txt>
[27] Jomo K. S., (2007). What Did We Really Learn from the 1997-98 Asian Debacle? in Ten years after: Revisiting the Asian Financial Crisis, Ed. Bhumika M., Asia Program, Woodrow Wilson International Center for Scholars, October.