Revision 1 Disturbance of the Sm-Nd isotopic system by metasomatic alteration… · 2019. 9. 9. ·...
39
1 Revision 1 1 Disturbance of the Sm-Nd isotopic system by metasomatic alteration: 2 a case study of fluorapatite from the Sin Quyen Cu-LREE-Au 3 deposit, Vietnam 4 5 Xiao-Chun Li a* , Mei-Fu Zhou a* , Yue-Heng Yang b , Xin-Fu Zhao c , Jian-Feng Gao d 6 a, Department of Earth Sciences, The University of Hong Kong, Hong Kong SAR, 7 China 8 b, State Key Laboratory of Lithospheric Evolution, Institute of Geology and 9 Geophysics, Chinese Academy of Sciences, Beijing, China 10 c, State Key Laboratory of Geological Processes and Mineral Resources, and Faculty 11 of Earth Resources, China University of Geosciences, Wuhan 430074, China 12 d, State Key Laboratory of Ore Deposit Geochemistry, Institute of Geochemistry, 13 Chinese Academy of Sciences, Guiyang 550002, China 14 15 16 17 18 19 20 21 22 23 24 25 26 *Corresponding author. E-mail: [email protected], [email protected] 27 28
Transcript of Revision 1 Disturbance of the Sm-Nd isotopic system by metasomatic alteration… · 2019. 9. 9. ·...

1
Revision 1 1
Disturbance of the Sm-Nd isotopic system by metasomatic alteration: 2
a case study of fluorapatite from the Sin Quyen Cu-LREE-Au 3
deposit, Vietnam 4
5
Xiao-Chun Lia*, Mei-Fu Zhoua*, Yue-Heng Yangb, Xin-Fu Zhaoc, Jian-Feng Gaod 6
a, Department of Earth Sciences, The University of Hong Kong, Hong Kong SAR, 7
China 8
b, State Key Laboratory of Lithospheric Evolution, Institute of Geology and 9
Geophysics, Chinese Academy of Sciences, Beijing, China 10
c, State Key Laboratory of Geological Processes and Mineral Resources, and Faculty 11
of Earth Resources, China University of Geosciences, Wuhan 430074, China 12
d, State Key Laboratory of Ore Deposit Geochemistry, Institute of Geochemistry, 13
Chinese Academy of Sciences, Guiyang 550002, China 14
15
16
17
18
19
20
21
22
23
24
25
26
*Corresponding author. E-mail: [email protected], [email protected] 27
28

2
Abstract The Neoproterozoic (840 Ma) Sin Quyen deposit in northwestern Vietnam 29
contains replacement Cu-LREE-Au orebodies in Proterozoic metasedimentary rocks. 30
In this deposit, LREE-bearing minerals include allanite-(Ce), monazite-(Ce), 31
chevkinite-(Ce), and fluorapatite. Fluorapatite from orebodies has undergone variable 32
degrees of metasomatic alteration. Samarium-Neodymium isotopic analyses were 33
conducted on altered fluorapatite, and also on allanite-(Ce) and monazite-(Ce), to 34
investigate whether such metasomatism can affect the Sm-Nd isotope system. 35
Allanite-(Ce) and monazite-(Ce) have 147Sm/144Nd ratios ranging from 0.0359 to 36
0.0549, and 143Nd/144Nd ratios from 0.51147 to 0.51172. Their initial 143Nd/144Nd 37
values at the time of mineralization range from 0.51126 to 0.51148, but mostly cluster 38
between 0.51135 and 0.51145. Thus, the primary ore-forming fluids were relatively 39
homogeneous in their Sm-Nd isotopic compositions. In the 147Sm/144Nd vs. 40
143Nd/144Nd diagram, the compositions of allanite-(Ce) and monazite-(Ce) generally 41
plot along a Sm-Nd isochron of 840 Ma, implying that the Sm-Nd isotopic systems of 42
these minerals were either closed or only slightly modified. In contrast, altered 43
fluorapatite crystals have 147Sm/144Nd ratios varying from 0.0667 to 0.1348, and 44
143Nd/144Nd ratios from 0.51160 to 0.51199. The calculated initial 143Nd/144Nd ratios 45
range widely from 0.51114 to 0.51141, with most values lower than those of the 46
allanite-(Ce) and monazite-(Ce). In the 147Sm/144Nd vs. 143Nd/144Nd diagram, their 47
compositions mostly plot below the 840-Ma Sm-Nd isochron. Petrographic 48
observations and trace elemental analyses show that metasomatic modification of 49
fluorapatite grains led to increases of their Sm/Nd ratios. The unaltered domains in the 50
grains have Sm/Nd ratios varying from 0.114 to 0.200, with an average value of 0.161; 51
whereas the altered domains have Sm/Nd ratios varying from 0.111 to 0.254, with an 52
average value of 0.183. The increased Sm/Nd ratios can cause the calculated initial 53
143Nd/144Nd ratios to be lower than actual initial isotopic ratios, and can also result in 54
compositional deviations from the reference Sm-Nd isochron. 55
This study demonstrates that the traditionally assumed inert Sm-Nd isotopic 56
system can be metasomatically disturbed due to changes in the Sm/Nd ratio. 57
Therefore, care must be taken when interpreting the Sm-Nd isotopic data from 58

3
apatite/apatite-rich rocks that have undergone metasomatic alteration. 59
60
Key words: apatite, metasomatic alteration, Sm-Nd isotopes 61
62
INTRODUCTION 63
Apatite is a common accessory mineral in igneous, metamorphic and 64
sedimentary rocks, and hydrothermal ore deposits. Its mineral structure can 65
accommodate a range of trace elements, such as halogens, S, V, As, Sr, and rare earth 66
elements (REE) (Hughes and Rakovan, 2015), which are sensitive to diverse 67
geological processes. Thus, apatite has gained considerable attention as a mineral with 68
many uses within the earth sciences. However, this mineral is susceptible to 69
fluid-induced alteration over a wide range of pressures and temperatures (Harlov, 70
2015 and references therein), raising questions about the interpretation of its 71
elemental and isotopic composition. 72
Apatite commonly contains moderate to high concentrations of Sm and Nd. 73
Advances in analytical techniques make it possible to determine the Sm-Nd isotopes 74
of apatite, on a sub-grain scale, by laser ablation multi-collector inductively coupled 75
plasma mass spectrometry (e.g., Fisher et al., 2011; Yang et al., 2014). This approach 76
can provide rapid, texturally sensitive isotopic data, which has many advantages over 77
previous bulk-rock analyses. For example, it allows assessment of Nd isotope 78
equilibrium/disequilibrium among minerals of high-grade metamorphic rocks. Such 79
data are important for understanding Nd isotope exchange during both metamorphism 80
and crustal anatexis processes (Hammerli et al., 2014). Moreover, in-situ Sm-Nd 81
isotopic analysis of apatite is important to determine the primary isotopic signature of 82
mantle-derived rocks by analyzing the composition of apatite that directly crystallized 83
from the initial unaffected magmas (Wu et al., 2011, 2013). Apatite is also useful for 84
sediment provenance studies based on its initial Nd isotope composition. Such studies 85
can help unravel the tectonic history of the hinterland and provide insights into the 86
origins and transport pathways of the sediments (e.g., Foster and Carter, 2007; 87
Henderson et al., 2010). It is also notable that apatite is one of the major hosts of Sm 88

4
and Nd in many rocks, such as peraluminous and metaluminous granites (Bea, 1996), 89
carbonatites (Chakhmouradian et al., 2017), high-grade metamorphic rocks (Harlov 90
and Forster, 2002; Janots, 2018), and Kiruna-/IOCG-type hydrothermal deposits 91
(Harlov et al., 2002; Schoneveld et al., 2015). This means that the Sm-Nd isotopic 92
composition of apatite can partially or even largely control that of the host rocks. 93
Given the significance of the Sm-Nd isotopic system in apatite, it is necessary to have 94
a proper understanding of the metasomatic effects on the Sm-Nd isotopic changes in 95
any study of apatite. However, to our knowledge, there are only sparse studies 96
concerning this issue. 97
REE-rich fluorapatite crystals are widespread in the IOCG-type Sin Quyen 98
deposit, northwestern Vietnam, and many crystals have been altered during post-ore 99
metasomatic processes. The altered fluorapatite crystals may record Sm-Nd isotopic 100
changes, and thus provide a good opportunity to study metasomatism-induced 101
isotopic disturbance. In this paper, we present petrographic, elemental, and in-situ and 102
bulk-mineral Sm-Nd isotopic data for altered fluorapatite from the Sin Quyen deposit. 103
For comparison, in-situ Sm-Nd isotopic data for allanite-(Ce) and monazite-(Ce) from 104
orebodies were also obtained. The comprehensive dataset shows that the Sm-Nd 105
isotopic system of fluorapatite could be variably disturbed during metasomatism, 106
indicating that care must be taken when using Sm-Nd isotopes of altered apatite as 107
geological indicators. 108
109
DEPOSIT GEOLOGY 110
The Sin Quyen deposit is hosted in a metamorphic complex in northwestern 111
Vietnam (Fig. 1a). The protoliths of the metamorphic complex include Archean to 112
Paleoproterozoic igneous intrusions and Paleoproterozoic to Neoproterozoic 113
sedimentary rocks, all of which have been metamorphosed up to amphibolite facies. 114
The metamorphic complex was intruded by Neoproterozoic to Mesozoic plutons, and 115
unconformably covered by Cambrian to Triassic sedimentary rocks (Fig. 1a). 116
Orebodies in the Sin Quyen deposit are distributed along a NW-SE trending zone, 117
about 2.5 km long and 200 to 400 m wide (Fig. 1b). The mining area is divided into 118
5
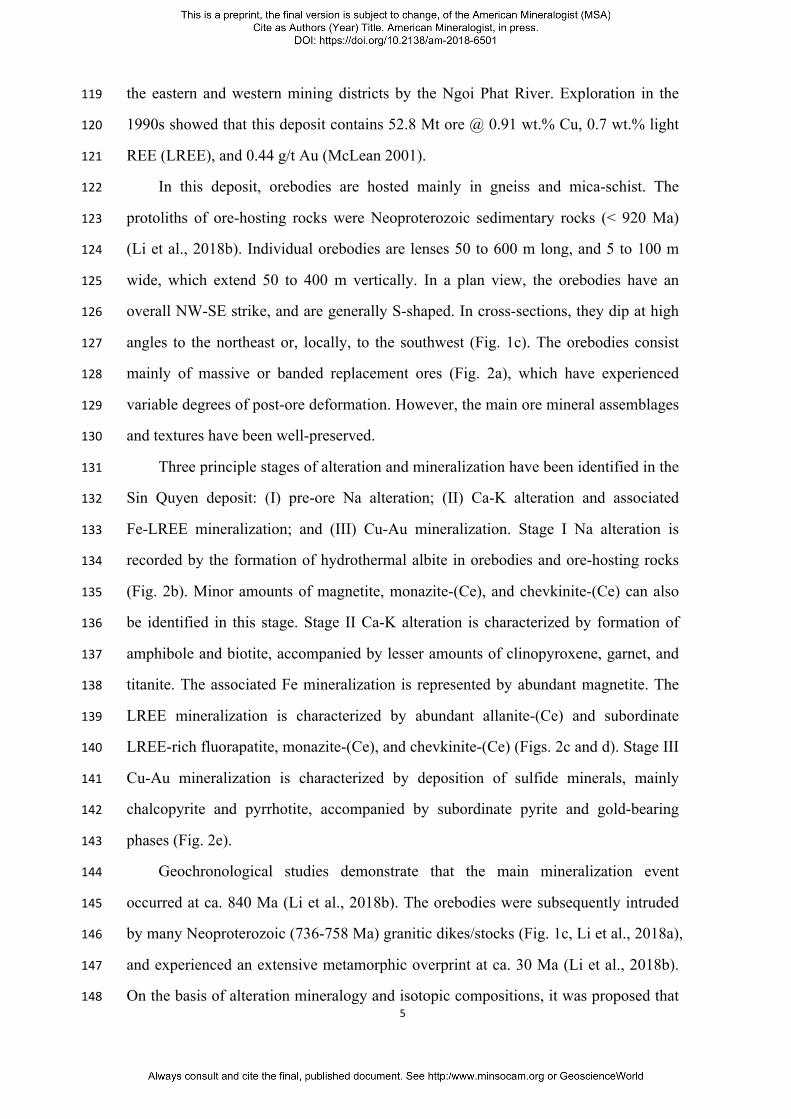
the eastern and western mining districts by the Ngoi Phat River. Exploration in the 119
1990s showed that this deposit contains 52.8 Mt ore @ 0.91 wt.% Cu, 0.7 wt.% light 120
REE (LREE), and 0.44 g/t Au (McLean 2001). 121
In this deposit, orebodies are hosted mainly in gneiss and mica-schist. The 122
protoliths of ore-hosting rocks were Neoproterozoic sedimentary rocks (< 920 Ma) 123
(Li et al., 2018b). Individual orebodies are lenses 50 to 600 m long, and 5 to 100 m 124
wide, which extend 50 to 400 m vertically. In a plan view, the orebodies have an 125
overall NW-SE strike, and are generally S-shaped. In cross-sections, they dip at high 126
angles to the northeast or, locally, to the southwest (Fig. 1c). The orebodies consist 127
mainly of massive or banded replacement ores (Fig. 2a), which have experienced 128
variable degrees of post-ore deformation. However, the main ore mineral assemblages 129
and textures have been well-preserved. 130
Three principle stages of alteration and mineralization have been identified in the 131
Sin Quyen deposit: (I) pre-ore Na alteration; (II) Ca-K alteration and associated 132
Fe-LREE mineralization; and (III) Cu-Au mineralization. Stage I Na alteration is 133
recorded by the formation of hydrothermal albite in orebodies and ore-hosting rocks 134
(Fig. 2b). Minor amounts of magnetite, monazite-(Ce), and chevkinite-(Ce) can also 135
be identified in this stage. Stage II Ca-K alteration is characterized by formation of 136
amphibole and biotite, accompanied by lesser amounts of clinopyroxene, garnet, and 137
titanite. The associated Fe mineralization is represented by abundant magnetite. The 138
LREE mineralization is characterized by abundant allanite-(Ce) and subordinate 139
LREE-rich fluorapatite, monazite-(Ce), and chevkinite-(Ce) (Figs. 2c and d). Stage III 140
Cu-Au mineralization is characterized by deposition of sulfide minerals, mainly 141
chalcopyrite and pyrrhotite, accompanied by subordinate pyrite and gold-bearing 142
phases (Fig. 2e). 143
Geochronological studies demonstrate that the main mineralization event 144
occurred at ca. 840 Ma (Li et al., 2018b). The orebodies were subsequently intruded 145
by many Neoproterozoic (736-758 Ma) granitic dikes/stocks (Fig. 1c, Li et al., 2018a), 146
and experienced an extensive metamorphic overprint at ca. 30 Ma (Li et al., 2018b). 147
On the basis of alteration mineralogy and isotopic compositions, it was proposed that 148

6
the mineralization was genetically associated with Neoproterozoic subduction-related 149
magmatic activity (Li et al., 2018b). 150
151
SAMPLING AND ANALYTICAL METHODS 152
Fluorapatite is widespread in the orebodies, but varies in abundance from < 1% 153
to > 10%. In this study, four ore samples that contain > 5 vol.% apatite were selected 154
for study. Two samples, SQ13-96 and SQ13-110, were collected from two separate 155
orebodies in the western mining district, and the remaining two samples (LC11-55 156
and LC11-77) were from ore stockpiles of the eastern mining district. The main 157
features of the studied samples are listed in Table 1. 158
Polished thin sections of each sample were investigated first by petrographic 159
microscopy, and then back-scattered electron (BSE) images were obtained using a 160
JEOL JXA-8230 electron microprobe at The University of Hong Kong. Major 161
element compositions of fluorapatite were determined using the same microprobe, 162
following the analytical procedure described by Goldoff et al. (2012). The 163
accelerating voltage was set at 15 kV, the beam current at 20 nA, and the beam 164
diameter at 10 µm. The analyzing crystals were PET (S, P, Ca, Sr, and Cl), LiF (Ce, 165
Fe, and Mn), LDE1 (F), and TAP (As, Si, and Na). The Kα line was chosen for the 166
analyses of S, P, Si, Fe, Mn, Ca, Na, F, and Cl, and the Lα line for As, Ce, and Sr. The 167
counting times on peaks were 10s for F, Cl, Na, and K, and 20 to 40 s for other 168
elements. Background intensities were measured on both sides of the peak for half of 169
the peak time. The standards were lazurite for S and Sr, apatite for P, Ca, and F, 170
gallium arsenide for As, albite for Si and Na, monazite for Ce, magnetite for Fe, 171
rhodonite for Mn, and tugtupite for Cl. All data were corrected using standard ZAF 172
correction procedures. The representative EMPA data are presented in Table 2, and 173
the whole dataset can be found in the Supplementary file. 174
Trace element analyses of fluorapatite were performed using a Geolas Pro 175
193nm laser ablation (LA) system coupled to an Agilent Technologies 7900 type 176
inductively coupled plasma-mass spectrometer (ICP-MS) at the Institute of 177
Geochemistry, Chinese Academy of Sciences. The analyses were performed on thin 178

7
sections, with a beam diameter of 32 um and a repetition rate of 4 Hz. The counting 179
times were ~20 s for the background analyses, and ~50 s for the sample analyses. The 180
glass standard NIST 610 was used for external calibration, and was analyzed twice 181
after 8 sample analyses. Calcium was used as the internal standard, and the content of 182
CaO was determined by EMP analyses. The apatite standard Durango was measured 183
as an external standard to monitor the analytical accuracy. Data reduction was 184
performed by the software ICPMSDataCal. The representative LA-ICP-MS trace 185
element data are listed in Table 3, and the whole dataset can be found in the 186
Supplementary file. 187
In-situ Sm-Nd isotopic analyses were performed using a Neptune multi-collector 188
(MC) ICP-MS, equipped with a Geolas 193 nm excimer laser ablation system at the 189
Institute of Geology and Geophysics, Chinese Academy of Sciences (IGGCAS). The 190
analyses were conducted on thin sections, with a spot size of 90 or 110 µm and a 191
repetition rate of 8 Hz for fluorapatite, a spot size of 20 µm and a repetition rate of 4 192
Hz for monazite-(Ce), and a spot size of 32 um and a repetition rate of 6 Hz for 193
allanite-(Ce). Each spot analysis involved ~20 s of background data acquisition and 194
~50 s of data acquisition from the sample. After analyses of eight samples, two 195
standards were analyzed for external calibration. The apatite standard Ap 1 was used 196
for the analyses of fluorapatite (reference values: 147Sm/144Nd = 0.0822 ± 0.0014, 197
143Nd/144Nd = 0.511349 ± 0.000038; Yang et al., 2014), and the monazite standard 198
Namaqua was used for the analyses of monazite-(Ce)/allanite-(Ce) (reference values: 199
147Sm/144Nd = 0.0977 ± 0.0002, 143Nd/144Nd = 0.511896 ± 0.000032; Liu et al., 2012). 200
The isobaric interference of 144Sm on 144Nd is significant. In order to correct for this 201
interference, we have used the 147Sm/149Sm ratio (1.08680) and the measured 202
147Sm/149Sm ratio to calculate the Sm fractionation factor, and then used the measured 203
147Sm intensity and the natural 147Sm/144Sm ratio to estimate the Sm interference on 204
mass 144. The interference-corrected 146Nd/144Nd ratio was then normalized to 0.7219 205
to calculate the Nd fractionation factor. Finally, the 143Nd/144Nd and 145Nd/144Nd 206
ratios were normalized using the exponential law. The 147Sm/144Nd ratio was 207
calculated using the exponential law after correcting for the isobaric interference of 208
8
144Sm on 144Nd as described above, and then was externally calibrated against the 209
147Sm/144Nd ratio of the standards. The raw data were exported offline and the whole 210
data-reduction procedure was performed using an in-house Excel VBA (Visual Basic 211
for Applications) macro program. The apatite standard Ap 2 was measured to monitor 212
the analytical accuracy for apatite, yielding weighted mean 147Sm/144Nd and 213
143Nd/144Nd ratios of 0.0755 ± 0.0008 and 0.511034 ± 0.000037, respectively, which 214
are consistent, within uncertainty, with the reported values of 0.0764 ± 0.0002 and 215
0.511007 ± 0.000030, respectively (Yang et al., 2014). The in-situ Sm-Nd isotopic 216
data are listed in Table 4. 217
Bulk-mineral Sm-Nd isotopic compositions of fluorapatite were analyzed at 218
IGGCAS. Fluorapatite crystals were separated from crushed samples using a 219
conventional density separation technique.About 100 mg of fluorapatite was weighed 220
into a 7 ml SavillexTM Teflon beaker, and the appropriate amount of mixed 221
149Sm-150Nd spike was added. Samples were dissolved in distilled HF + HNO3 + 222
HBO3. Chemical separation was performed using a two-stage ion exchange procedure. 223
Firstly, REE were isolated from the matrix elements using a standard cation exchange 224
resin. After that, Sm and Nd were separated using Eichrom LN (LN-C-50B, 100 to 225
150 µm, 2 ml) chromatographic columns. The Sm-Nd isotopic measurements were 226
conducted using an IsoProbe-T thermal ionization mass spectrometer. The reference 227
material BCR-2 was measured to monitor the accuracy of the entire analytical 228
procedure, with the following results: 6.67 ppm Sm, 28.56 ppm Nd, and 143Nd/144Nd 229
= 0.512651 ± 16 (2σ), which are comparable to the reported reference values (Sm: 230
6.547 ppm, Nd: 28.26 ppm, 143Nd/144Nd = 0.512635 ± 29; Jochum et al., 2005). The 231
bulk-mineral Sm-Nd isotopic data are listed in Table 5. 232
233
FLUORAPATITE PETROGRAPHY 234
Fluorapatite occurs as single crystals or aggregates in contact with magnetite, 235
allanite-(Ce), amphibole, biotite and/or garnet of stage II (Figs. 2f and g). Some 236
fluorapatite crystals contain inclusions of magnetite and biotite. Individual 237
fluorapatite crystals are subhedral to anhedral in shape, and have lengths ranging from 238

9
50 to 150 µm. Many grains contain intra-crystal fractures, and some have two-phase 239
fluid inclusions (Fig. 2h). The fluid inclusions are commonly distributed along lines, 240
so they are interpreted to have been trapped after crystallization of fluorapatite. 241
In BSE images, we recognize five textural types of fluorapatite. Type I grains 242
show very faint or concentric growth zoning (Figs. 3a and b). Type II varieties have 243
irregular BSE-bright cores surrounded by darker rims (Fig. 3c). The BSE-dark rims 244
can be either continuous or discontinuous and have variable thicknesses. Boundaries 245
between the BSE-dark and BSE-bright areas may be smooth or irregular. The 246
BSE-bright areas are not homogeneous: some show slightly different levels of gray 247
and some contain small BSE-dark patches. Type III crystals have not only BSE-dark 248
areas along rims but also irregular BSE-dark veins passing through the bright interiors 249
(Fig. 3d). Type IV crystals have a small BSE-bright core or some isolated BSE-bright 250
patches surrounded by relatively wide dark areas (Fig. 3e). These grains grade into 251
homogeneous and relatively dark crystals of Type V (Fig. 3f). 252
253
FLUORAPATITE MINERAL COMPOSITION 254
Major and trace elements 255
Fluorapatite crystals from the Sin Quyen deposit consist chiefly of CaO and P2O5, 256
with 2.39 to 3.71 wt.% F and 0.01 to 1.23 wt.% OH (estimated via charge balance on 257
the halogen site). They also contain minor SiO2 (below detection limit to 1.01 wt.%), 258
Ce2O3 (below detection limit to 1.29 wt.%), SrO (below detection limit to 0.22 wt.%), 259
and FeO (0.01 to 0.64 wt.%). The BSE-bright domains generally have higher contents 260
of Ce2O3 and SiO2 than the BSE-dark domains. Some crystals contain detectable 261
Na2O (< 0.05 wt.%) and Cl (< 0.02 wt.%). 262
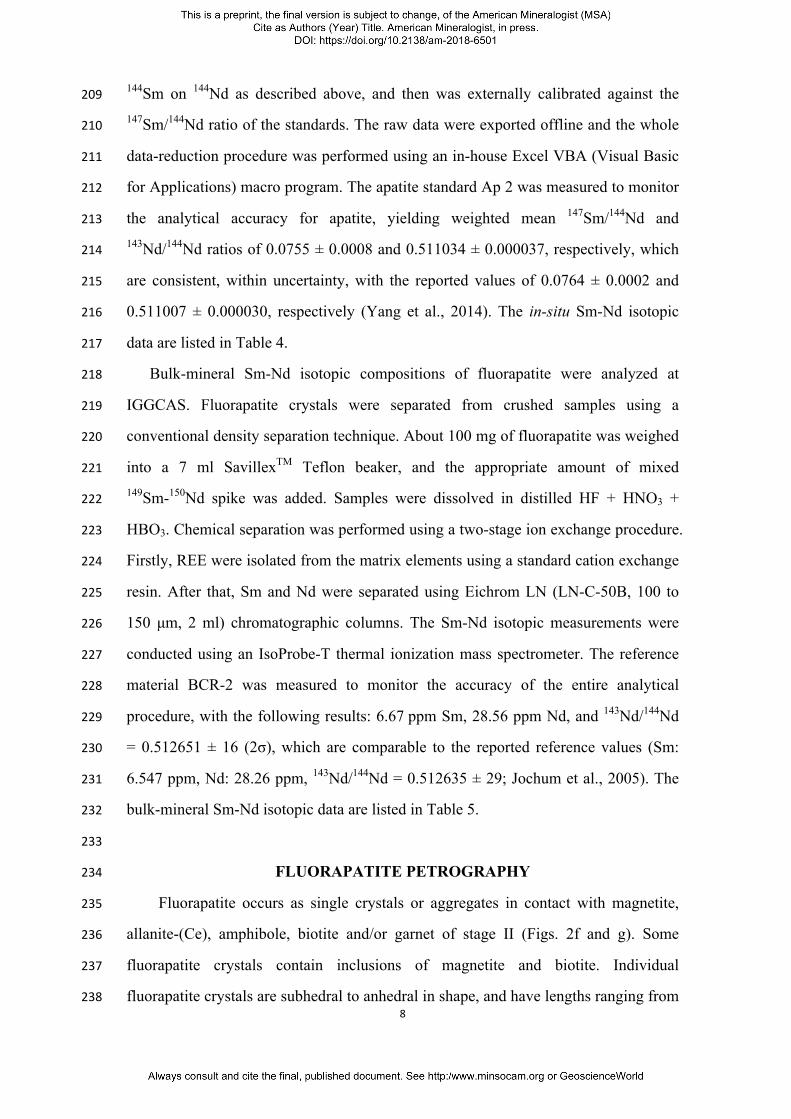
Different fluorapatite domains contain highly variable (REE + Y) concentrations 263
(319 to 20388 ppm), which correlate positively with Si (Fig. 4a). Thus, the REE3+ 264
ions are principally charge-balanced through the coupled substitution Si4+ + (REE+ 265
Y)3+ = P5+ + Ca2+. It is proposed that in apatite the REE3+ ions can also be 266
charge-balanced through the coupled substitution Na+ + (REE+ Y)3+ = 2Ca2+ (Roeder 267
et al., 1987; Pan and Fleet, 2002). However, the correlation between (REE + Y) and 268

10
Na is not obvious (Fig. 4b), which indicates that the latter coupled substitution is not 269
important for the samples in this study. In each sample, the BSE-dark areas generally 270
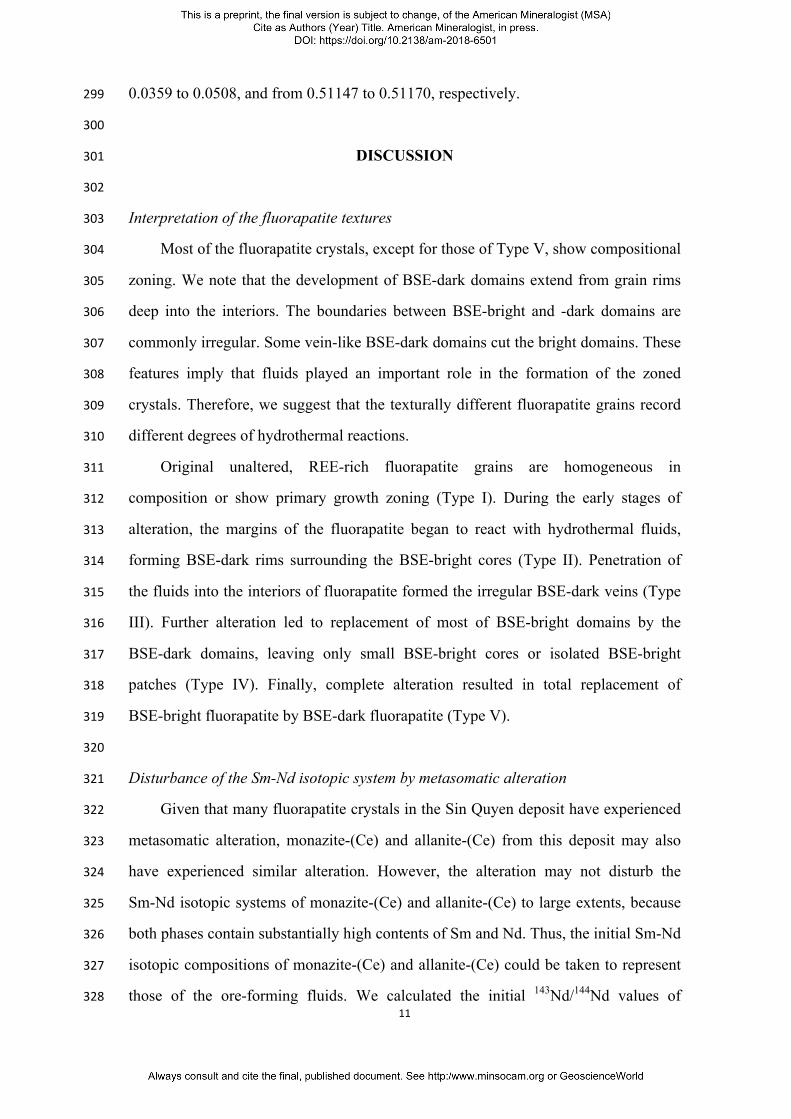
have lower (REE+Y) concentrations and higher Sm/Nd ratios than the bright areas 271
(Figs. 5a to d). Trace element analyses were conducted on both BSE-bright and -dark 272
areas of eight fluorapatite crystals. In all crystals, the dark areas have lower (REE+Y) 273
concentrations than the corresponding bright areas. In six of the crystals, the dark area 274
has a higher Sm/Nd ratio than the corresponding bright area, whereas in one crystal, 275
the dark and bright areas have similar Sm/Nd ratios, and in the other, the BSE-dark 276
area has a lower Sm/Nd ratio than the BSE-bright area. Although the BSE-dark 277
domains have lower REE concentrations than the BSE-bright domains, their 278
chondrite-normalized REE patterns are similar, with nearly flat or slightly 279
right/left-inclined profiles from La to Pr, right-inclined profiles from Nd to Dy, and 280
slightly left-inclined to nearly flat profiles from Ho to Lu (Figs. 5e to h). The 281
BSE-dark domains also contain lower amounts of U (21.4 ppm on average), As (49.7 282
ppm on average), and Ge (9.29 ppm on average) than the BSE-bright domains (63.6 283
ppm U, 87.5 ppm As, and 24.5 ppm Ge on average). 284
285
Sm-Nd isotopes 286
In-situ Sm-Nd isotopic compositions of fluorapatite were analyzed using large 287
laser spots (90 or 110 µm), so most analyses include mixed BSE-bright and -dark 288
areas. Overall, the analyses yielded scattered 147Sm/144Nd (0.0667 to 0.1348) and 289
143Nd/144Nd ratios (0.51160 to 0.51199) (Fig. 6a). Spots containing higher proportions 290
of BSE-bright domains generally have lower 147Sm/144Nd ratios than those with 291
higher proportions of BSE-dark domains (Fig. 6a). Bulk-mineral Sm-Nd isotopic 292
analyses of fluorapatite yielded more restricted 147Sm/144Nd (0.1024 to 0.1112) and 293
143Nd/144Nd ratios (0.511809 to 0.511822) (Table 5). 294
Compared with fluorapatite, monazite-(Ce) and allanite-(Ce) have relatively 295
uniform isotopic compositions (Fig. 6a). Monazite-(Ce) has 147Sm/144Nd and 296
143Nd/144Nd ratios varying from 0.0375 to 0.0549, and from 0.51157 to 0.51172, 297
respectively. Allanite-(Ce) has 147Sm/144Nd and 143Nd/144Nd ratios varying from 298
11
0.0359 to 0.0508, and from 0.51147 to 0.51170, respectively. 299
300
DISCUSSION 301
302
Interpretation of the fluorapatite textures 303
Most of the fluorapatite crystals, except for those of Type V, show compositional 304
zoning. We note that the development of BSE-dark domains extend from grain rims 305
deep into the interiors. The boundaries between BSE-bright and -dark domains are 306
commonly irregular. Some vein-like BSE-dark domains cut the bright domains. These 307
features imply that fluids played an important role in the formation of the zoned 308
crystals. Therefore, we suggest that the texturally different fluorapatite grains record 309
different degrees of hydrothermal reactions. 310
Original unaltered, REE-rich fluorapatite grains are homogeneous in 311
composition or show primary growth zoning (Type I). During the early stages of 312
alteration, the margins of the fluorapatite began to react with hydrothermal fluids, 313
forming BSE-dark rims surrounding the BSE-bright cores (Type II). Penetration of 314
the fluids into the interiors of fluorapatite formed the irregular BSE-dark veins (Type 315
III). Further alteration led to replacement of most of BSE-bright domains by the 316
BSE-dark domains, leaving only small BSE-bright cores or isolated BSE-bright 317
patches (Type IV). Finally, complete alteration resulted in total replacement of 318
BSE-bright fluorapatite by BSE-dark fluorapatite (Type V). 319
320
Disturbance of the Sm-Nd isotopic system by metasomatic alteration 321
Given that many fluorapatite crystals in the Sin Quyen deposit have experienced 322
metasomatic alteration, monazite-(Ce) and allanite-(Ce) from this deposit may also 323
have experienced similar alteration. However, the alteration may not disturb the 324
Sm-Nd isotopic systems of monazite-(Ce) and allanite-(Ce) to large extents, because 325
both phases contain substantially high contents of Sm and Nd. Thus, the initial Sm-Nd 326
isotopic compositions of monazite-(Ce) and allanite-(Ce) could be taken to represent 327
those of the ore-forming fluids. We calculated the initial 143Nd/144Nd values of 328

12
monazite-(Ce) and allanite-(Ce) at the time of mineralization (840 Ma), and found 329
that they range from 0.51126 to 0.51148, mostly between 0.51135 and 0.51145 (Fig. 330
6b). Such results indicate that the ore-forming fluids of the Sin Quyen deposit had 331
relatively homogeneous Nd isotopic compositions. Fluorapatite crystals that 332
precipitated from the ore-forming fluids would be expected to have similarly 333
homogeneous Nd isotopic compositions. However, their initial 143Nd/144Nd values 334
range widely from 0.51114 to 0.51141, mostly lower than those of monazite-(Ce) and 335
allanite-(Ce) (Fig. 6c). Assuming an initial 143Nd/144Nd value of 0.51140 (the average 336
initial 143Nd/144Nd value of monazite-(Ce) and allanite-(Ce)), a reference isochron 337
with an age of 840 Ma is shown in the 147Sm/144Nd vs. 143Nd/144Nd diagram (Fig. 6a). 338
In this diagram, the compositions of most analyzed fluorapatites, especially grains 339
with higher proportions of BSE-dark (altered) domains, plot below the reference 340
isochron (Fig. 6a), indicating that the Sm-Nd isotopic system was disturbed during the 341
post-ore metasomatic process. 342
Disturbance of the Sm-Nd isotopic system could potentially be due to: (1) 343
change(s) in the 143Nd/144Nd ratio; (2) change(s) in the 147Sm/144Nd ratio; or (3) a 344
combination of (1) and (2). If the metasomatic fluids had 143Nd/144Nd ratios different 345
from those of unaltered fluorapatite, the 143Nd/144Nd ratios of fluorapatite could have 346
been changed, because Nd can be introduced into fluorapatite from the fluids. 347
However, it is difficult to determine how much Nd was gained from metasomatic 348
fluid. The accurate isotopic composition of metasomatic fluid is not known. Thus, it 349
cannot be certain if the disturbance of Sm-Nd isotopic system was mainly due to the 350
changes in the 143Nd/144Nd ratios. Variable removal of Nd from fluorapatite during 351
metasomatism may imply insignificant gain of Nd from the fluid. Thus, the 352
143Nd/144Nd ratio of fluorapatite may not be changed significantly. 353
Our analyses show that the Sm/Nd ratios of fluorapatite commonly increased 354
during metasomatism, although in rare crystals the ratios decreased. If the Sm/Nd 355
ratios were increased immediately after the formation of fluorapatite, the 356
compositions of altered domains would evolve along new paths, but their present-day 357
compositions, together with those of unaltered domains, would still lie on the 840-Ma 358

13
isochron (Fig. 7a). If the Sm/Nd ratios increased at some later time, the compositional 359
evolutionary paths of the altered domains would be more complex, as graphically 360
illustrated in the 147Sm/144Nd vs. 143Nd/144Nd diagram (Fig. 7b). At t0, the initial 361
composition of an unaltered fluorapatite crystal could have been located at Point b0. 362
As time passed, its composition would have evolved along path b0-b1. If the crystal 363
was altered at t1, its Sm/Nd ratio could have been increased to Point b1'. From then on, 364
the composition of the altered fluorapatite would evolve along a new path, but the 365
question is where the new path would stop. To help answer this question, we have 366
inserted point d1 on the reference isochron with an age of (t0-t1). This point has the 367
same 147Sm/144Nd ratio as Point b1', but its 143Nd/144Nd ratio is higher. Assuming that 368
the Sm-Nd isotopic system of Point d1 remained closed since t1, the composition of 369
this point would just intersect with the reference isochron of 840 Ma at the present 370
day (Point dp). Because Points b1' and d1 have the same 147Sm/144Nd ratio, the 371
increases in the 143Nd/144Nd ratio at the time interval of t1 to the present day should be 372
the same for the two points. Since Point b1' has a 143Nd/144Nd ratio lower than that of 373
Point d1, the path b1'- bp' cannot intersect with the isochron of 840 Ma, i.e., the 374
present-day composition of the altered fluorapatite must be plotted below the 840-Ma 375
isochron. 376
To obtain the initial 143Nd/144Nd ratio of the altered fluorapatite, two evolution 377
paths need to be traced backward (Fig. 7c). To obtain the 143Nd/144Nd ratio at t1, path 378
bp'- b1' needs to be traced backward. The mathematical equation can be expressed as: 379
380
(143Nd/144Nd)t1 = (143Nd/144Nd)p – (147Sm/144Nd)p (eλt1–1) (1) 381
382
where (143Nd/144Nd)p denotes the present-day 143Nd/144Nd ratio, (147Sm/144Nd)p 383
denotes the present-day 147Sm/144Nd ratio, and λ is the decay constant of 147Sm. 384
385
To further obtain the 143Nd/144Nd ratio at t0, path b1-b0 also needs to be traced 386
backward using the mathematical expression: 387
388

14
(143Nd/144Nd)t0 = (143Nd/144Nd)t1 – (147Sm/144Nd)unchanged [eλ(t0-t1) –1] (2) 389
390
where (147Sm/144Nd)unchanged denotes the 147Sm/144Nd ratio before the metasomatic 391
alteration at t1. 392
393
Substitute equation (1) into equation (2): 394
395
(143Nd/144Nd)t0 = (143Nd/144Nd)p – (147Sm/144Nd)p (eλ*t1 – 1) – 396
147Sm/144Ndunchanged*[eλ(t0-t1) –1], (3) 397
The initial 143Nd/144Nd ratio of the altered apatite can be obtained. 398
If the alteration-induced change of the 147Sm/144Nd ratio is ignored, one 399
evolutionary path (bp'- bcal) or two continuous evolutionary paths (bp'- b1' and b1'-bcal) 400
need to be traced backward (Fig. 7d). The mathematical expression is: 401
402
(143Nd/144Nd)cal = (143Nd/144Nd)p – (147Sm/144Nd)p (eλ*t1 – 1) – 403
147Sm/144Ndchanged*[eλ(t0-t1) –1] (4) 404
405
where (147Sm/144Nd)changed denotes the 147Sm/144Nd ratio after the metasomatic 406
alteration at t1. 407
It is obvious that the ratio obtained from equation (4) will be smaller than that 408
obtained from equation (3), because (147Sm/144Nd)changed is larger than 409
(147Sm/144Nd)unchanged. 410
The above illustrations demonstrate that an increase in the Sm/Nd ratio can cause 411
the present-day composition of the altered apatite to plot below the present-day 412
Sm-Nd isochron, and can also cause the calculated initial 143Nd/144Nd ratio to be 413
lower than the actual initial isotopic ratio. Here we want to point out that fluorapatite 414
from the Sin Quyen deposit may have experienced multiple stages of metasomatic 415
alteration, during which the Sm/Nd ratios may have been increased and/or even 416
decreased several times. Thus, here we present only a simple and ideal illustration of 417
the change in the Sm-Nd isotope system. It is also notable that, although the 418

15
increase(s) in the Sm/Nd ratios can explain the observed Sm-Nd isotopic disturbances, 419
it does not mean that this is the only possible cause. Addition of Nd from 420
compositionally different fluids might also induce somewhat changes in 143Nd/144Nd 421
ratios, and more studies are needed to test this possibility. 422
423
IMPLICATION 424
Previous experimental studies have demonstrated that apatite can be altered by a 425
variety of fluids, including aqueous brines (NaCl-KCl-CaCl2-H2O), H2O-CO2 aqueous 426
fluids, and low pH acidic fluids, over a wide range of temperatures (300-900 oC) and 427
pressures (500-1000 MPa) (Harlov et al., 2002b, 2005; Harlov and Förster, 2003). In 428
addition to laboratory experiments, apatite from a wide range of natural rocks has also 429
been found to experience metasomatic alteration (Harlov, 2015 and references 430
therein). Previous studies concerned mainly on the elemental changes during 431
metasomatic alteration of apatite (e.g., Harlov et al., 2002a; Bonyadi et al., 2011; Li 432
and Zhou, 2015; Heidarian et al., 2018), but much less on the alteration-induced 433
Sm-Nd isotopic disturbance. 434
It has long been assumed that Sm and Nd have very similar chemical behaviors, 435
and thus the Sm/Nd ratios are little affected by hydrothermal alteration (White, 2014). 436
However, this study demonstrates that Sm/Nd ratios can obviously be changed during 437
metasomatic alteration, and that this change will affect the evolution of the Sm-Nd 438
isotopic system. Similar results have also been documented in other studies. For 439
example, apatite crystals from magnetite-apatite ores in the Kiruna area, Sweden, also 440
experienced metasomatic alteration, and the alteration induced variable REE removal 441
(Harlov et al., 2002a). The unaltered REE-rich apatite domains have an average 442
Sm/Nd ratio of 0.16, whereas the altered REE-poor domains have an average ratio of 443
0.21. Similarly, unaltered REE-rich apatite crystals from magnetite ores in the Bafq 444
District, Iran, have Sm/Nd ratios ranging from 0.13 to 0.22, whereas altered, 445
REE-poor crystals have ratios ranging from 0.18 to 0.55 (Stosch et al., 2011). It has 446
also been found that unaltered, REE-rich fluorapatite domains, from the Yinachang 447
Fe-Cu-(LREE) deposit, southwestern China, have Sm/Nd ratios ranging from 0.14 to 448

16
0.25, whereas altered, REE-poor domains have ratios ranging from 0.19 to 0.45 (Li 449
and Zhou, 2015). These examples indicate that REE loss is a common process during 450
metasomatic alteration of apatite, and the removal of Sm is usually less than the 451
removal of Nd, resulting in an increase in the Sm/Nd ratio. This less removal of Sm 452
may be partially related to its higher compatibility in the apatite structure, as 453
demonstrated in previous apatite-melt REE partition experiments (Watson and Green, 454
1981; Klemme and Dalpe, 2003; Prowatke and Klemme, 2006). It is also notable that 455
experimental studies demonstrate that, at elevated temperatures (> 150 oC), NdCl2+ 456
and NdF2+ species in hydrothermal solutions are more stable than SmCl2+ and SmF2+ 457
species, respectively (Migdisov and Williams-Jones, 2009). Since Cl and F are two 458
major anion ligands in most upper crustal fluids (Yardly, 2012), the removal of 459
smaller amounts of Sm relative to Nd may also be related to the predominance of Cl- 460
and/or F- in the metasomatic fluids. 461
In addition to the Sm-Nd isotopic system, it has been documented that Sr and O 462
isotopes of apatite can also be modified during metasomatic alteration. For example, 463
the unaltered fluorapatite crystals from the Taocun iron-oxide apatite deposit, eastern 464
China, have 87Sr/86Sr ratios ranging from 0.7077 to 0.7087, and δ18O values ranging 465
from +5.3 to +7.5‰. After reacting with upper crustal meteoric water, the fluorapatite 466
crystals have obviously higher 87Sr/86Sr ratios (0.7083-0.7097) and lower δ18O values 467
(-3.0 to +3.4‰) (Zeng et al., 2016). 468
In summary, if metasomatism occurs, bulk-rock isotopic compositions of 469
apatite/apatite-rich rocks may show mixed signatures, and hence be geologically 470
misleading. Therefore, it is important to evaluate the effects of metasomatic alteration 471
on mineral textures and mineral chemistry before using apatite as a geological 472
indicator. 473
474
Acknowledgements 475
We would like to express our great thanks to Dr. Tingguang Lan for his 476
assistance with trace element analyses, and Dr. Chang Zhang for his assistance with 477
in-situ Sm-Nd isotopic analyses. Prof. Paul T. Robinson is greatly appreciated for 478

17
useful discussion and language polishing. Prof. Daniel E. Harlov and an anonymous 479
reviewer are greatly appreciated for their constructive reviews. Dr. Fangzhen Teng is 480
gratefully acknowledged for his editorial handling. This study was supported by 481
NSFC grants (41473038, 41472068, 41525012), and the “CAS Hundred Talents” 482
Project to Jian-Feng Gao. 483
484
References 485
Bea, F. (1996) Residence of REE, Y, Th and U in granites and crustal protoliths: 486
implications for the chemistry of crustal melts. Journal of petrology, 37, 521-552. 487
Chakhmouradian, A.R., Reguir, E.P., Zaitsev, A.N., Coueslan, C., Xu, C., Kynicky, J., 488
Mumin, A.H., and Yang, P. (2017) Apatite in carbonatitic rocks: Compositional 489
variation, zoning, element partitioning and petrogenetic significance. Lithos, 490
274-275, 188-213. 491
Fisher, C.M., McFarlane, C.R.M., Hanchar, J.M., Schmitz, M.D., Sylvester, P.J., Lam, 492
R., and Longerich, H.P. (2011) Sm-Nd isotope systematics by laser 493
ablation-multicollector-inductively coupled plasma mass spectrometry: Methods 494
and potential natural and synthetic reference materials. Chemical Geology, 284, 495
1-20. 496
Foster, G.L., and Carter, A. (2007) Insights into the patterns and locations of erosion 497
in the Himalaya - A combined fission-track and in situ Sm-Nd isotopic study of 498
detrital apatite. Earth and Planetary Science Letters, 257, 407-418. 499
Goldoff, B., Webster, J.D., and Harlov, D.E. (2012) Characterization of 500
fluor-chlorapatites by electron probe microanalysis with a focus on time-dependent 501
intensity variation of halogens. American Mieneralogist, 97, 1103-1115. 502
Hammerli, J., Kemp, A.I.S., and Spandler, C. (2014) Neodymium isotope 503
equilibration during crustal metamorphism revealed by in situ microanalysis of 504
REE-rich accessory minerals. Earth and Planetary Science Letters, 392, 133-142. 505
Harlov, D.E., and Förster, H.J. (2002) High-grade fluid metasomatism on both a local 506
and regional scale: the Seward Peninsula, Alaska and the Val Strona di Omegna, 507
Ivrea-Verbano zone, northern Italy. Part II: Phosphate mineral chemistry. Journal 508

18
of Petrology, 43, 801-824. 509
Harlov, D.E., Andersson, U.B., Förster, H.J., Nyström, J.O., Dulski, P., and Broman, 510
C. (2002a) Apatite-monazite relations in the Kiirunavaara magnetite-apatite ore, 511
northern Sweden. Chemical Geology, 191, 47-72. 512
Harlov, D.E., Förster, H.J. and Nijland, T.G. (2002b) Fluid-induced nucleation of 513
REE-phosphate minerals in apatite: nature and experiment. Part I. Chlorapatite. 514
American Mineralogist, 87, 245-261. 515
Harlov, D.E., and Förster, H.J. (2003) Fluid-induced nucleation of REE phosphate 516
minerals in apatite: nature and experiment. Part II. Fluorapatite. American 517
Mineralogist, 88, 1209-1229. 518
Harlov, D.E., Wirth, R., and Förster, H.J. (2005) An experimental study of 519
dissolution-reprecipitation in fluorapatite: fluid infiltration and the formation of 520
monazite. Contribution to Mineralogy and Petrology, 150, 268-286. 521
Harlov, D.E. (2015) Apatite: a fingerprint for metasomatic processses. Elements, 11, 522
171-176. 523
Heidarian, H.., Lentz, D.R., Alirezaei, S., McFarlane, C.R.M., Peighambari, S. (2018) 524
Multiple Stage Ore Formation in the Chadormalu Iron Deposit, Bafq Metallogenic 525
Province, Central Iran: Evidence from BSE Imaging and Apatite EPMA and 526
LA-ICP-MS U-Pb Geochronology. Minerals, 8, 87. 527
Henderson, A.L., Foster, G.L., and Najman, Y. (2010) Testing the application of in 528
situ Sm-Nd isotopic analysis on detrital apatites: A provenance tool for constraining 529
the timing of India-Eurasia collision. Earth and Planetary Science Letters, 297, 530
42-49. 531
Hughes, J.M., and Rakovan, J.F. (2015) Structurally robust, chemically diverse: 532
apatite and apatite supergroup minerals. Elements, 11, 165-170. 533
Janots, E., Austrheim, H., Spandler, C., Hammerli, J., Trepmann, C.A., Berndt, J., 534
Magnin, V., and Kemp, A. (2018) Rare earth elements and Sm-Nd isotope 535
redistribution in apatite and accessory minerals in retrogressed lower crust material 536
(Bergen Arcs, Norway). Chemical Geology, in press. 537

19
Jochum, K.P., Nohl, U., Herwig, K., Lammel, E., Stoll, B., and Hofmann, A.W. (2005) 538
GeoReM: A New Geochemical Database for Reference Materials and Isotopic 539
Standards. Geostandards and Geoanalytical Research, 29, 333-338. 540
Klemme, S., and Dalpe, C. (2003) Trace-element partitioning between apatite and 541
carbonatite melt. American Mineralogist, 88, 639-646. 542
Li, X.C., and Zhou, M.F. (2015) Multiple stages of hydrothermal REE remobilization 543
recorded in fluorapatite in the Paleoproterozoic Yinachang Fe-Cu-(REE) deposit, 544
Southwest China. Geochimica et Cosmochimica Acta, 166, 53-73. 545
Li, X.C., and Zhou, M.F. (2017) Hydrothermal alteration of monazite-(Ce) and 546
chevkinite-(Ce) from the Sin Quyen Fe-Cu-LREE-Au deposit, northwestern 547
Vietnam. American Mineralogist, 102, 1525-1541. 548
Li, X.C., Zhao, J.H., Zhou, M.F., Gao, J.F., Sun, W.H., and Tran, M.D. (2018a) 549
Neoproterozoic granitoids from the Phan Si Pan belt, Northwest Vietnam: 550
Implication for the tectonic linkage between Northwest Vietnam and the Yangtze 551
Block. Precambrian Research, 209, 212-230. 552
Li, X.C., Zhou, M.F., Chen, W.T., Zhao, X.F., and Tran, M.D. (2018b) Uranium-lead 553
dating of hydrothermal zircon and monazite from the Sin Quyen 554
Fe-Cu-REE-Au-(U) deposit, northwestern Vietnam. Mineralium Deposita, 53, 555
399-416. 556
Liu, Z.C., Wu, F.Y., Yang, Y.H., Yang, J.H., and Wilde, S.A. (2012) Neodymium 557
isotopic compositions of the standard monazites used in U-Th-Pb geochronology. 558
Chemical Geology, 334, 221-239. 559
McLean, R.N. (2001) The Sin Quyen iron oxide-copper-gold-rare earth oxide 560
mineralization of North Vietnam, in Porter, T.M., e.d., Hydrothermal iron oxide 561
copper–gold & related deposits: a global perspective, volume 2: Adelaide, PGC 562
Publishing, p.293-301. 563
Migdisov, A.A., Williams-Jones, A.E., and Wagner, T. (2009) An experimental study 564
of the solubility and speciation of the Rare Earth Elements (III) in fluoride- and 565
chloride-bearing aqueous solutions at temperatures up to 300°C. Geochim 566
Cosmochim Acta, 73, 7087-7109. 567

20
Pan, Y., and Fleet, M.E. (2002) Composition of the apatite-group minerals: 568
substitution mechanisms and controlling factors. In: Kohn MJ, Rakovan J, Hughes 569
JM (eds) Phosphates: geochemical, geobiological, and materials importance, 48, 570
13–49. 571
Prowatke, S., and Klemme, S. (2006) Trace element partitioning between apatite and 572
silicate melts. Geochimica et Cosmochimica Acta, 70, 4513-4527. 573
Roeder, P.L., MacArthur, D., Ma, X.P., Palmer, G.R., and Mariano, A.N. (1987) 574
Cathodoluminescence and microprobe study of rare-earth elements in apatite. 575
American Mineralogist, 72, 801-811. 576
Schoneveld, L., Spandler, C., and Hussey, K. (2015) Genesis of the central zone of 577
the Nolans Bore rare earth element deposit, Northern Territory, Australia. 578
Contribution to Mineralogy and Petrology, 170, 11. 579
Stosch, H.G., Romer, R.L., Daliran, F., and Rhede, D. (2011) Uranium-lead ages of 580
apatite from iron oxide ores of the Bafq District, East-Central Iran. Mineralium 581
Deposita, 46, 9-21. 582
Ta, V.D. et al. (1975) The geological report on detailed exploration of the Sin Quyen 583
copper deposit. General Department of Geology, Hanoi (unpublished). 584
Watson, E.B., and Green, T.H. (1981) Apatite/liquid partition coefficients for the 585
rare-earth elements and strontium. Earth and Planetary Science Letters 56, 405-421. 586
White W.M. 2014. Isotope Geochemistry. Wiley. 498p. 587
Wu, F.Y., Yang, Y.H., Li, Q.L. Mitchell, R.H., Dawson, J.B., Brandl, G., and Yuhara, 588
M. (2011) In-situ determination of U–Pb ages and Sr–Nd–Hf isotopic constraints 589
on the petrogenesis of the Phalaborwa carbonatite Complex, South Africa. Lithos, 590
127, 309-322. 591
Wu, F.Y., Arzamastsev, A.A., Mitchell, R.H., Li, Q.L., Sun, J., Yang, Y.H., and 592
Wang, R.C. (2013) Emplacement age and Sr–Nd isotopic compositions of the 593
Afrikanda alkaline ultramafic complex, Kola Peninsula, Russia. Chemical Geology, 594
353, 210-229. 595
Yang, Y.H., Wu, F.Y., Yang, J.H., Chew, D.M., Xie, L.W., Chu, Z.Y., Zhang, Y.B., 596

21
and Huang, C. (2014) Sr and Nd isotopic compositions of apatite reference 597
materials used in U-Th-Pb geochronology. Chemical Geology, 385, 35-55. 598
Yardley, B.W.D. (2012) The chemical composition of metasomatic fluids in the crust, 599
in Harlov, D.E., and Austrheim H., e.d., Metasomatism and the chemical 600
transformation of rock, Springer, p. 17-53. 601
Zeng, L.P., Zhao, X.F., Li, X.C., Hu, H., and McFarlane, C. (2016) In situ elemental 602
and isotopic analysis of fluorapatite from the Taocun magnetite-apatite deposit, 603
Eastern China: Constraints on fluid metasomatism. American Mineralogist, 101, 604
2468-2483.605
606
Figure captions 607
608
Fig. 1 (a) Geological map of the northwestern Vietnam region. (b) Simplified 609
geological map of the Sin Quyen deposit (modified from Ta et al. 1975). (c) Cross 610
section A-B located in (a), showing the distribution of orebodies (modified from 611
McLean 2001). 612
613
Fig. 2 (a) A sample of banded ore, which mainly contains magnetite- and 614
chalcopyrite-rich bands. (b) Stage I albite crystals overprinted by later-stage 615
amphibole and biotite. (c) Typical mineral assemblage of stage II (magnetite + 616
allanite-(Ce) + amphibole + biotite). (d) Monazite-(Ce) crystals in ore sample. (e) 617
Stage III sulfide minerals overprinting earlier stage minerals. (f) Individual 618
fluorapatite crystals in contact with magnetite, and biotite. (g) Fluorapatite aggregates 619
in contact with allanite-(Ce) and magnetite. (h) Two-phase fluid inclusions in 620
fluorapatite. Mineral abbreviations: Aln-allanite-(Ce), Amp-amphibole, 621
Ap-fluorapatite, Bt-biotite, Ccp-chalcopyrite, Mag-magnetite, Mnz-monazite-(Ce), 622
Po-pyrrhotite, Qz-quartz. 623
624
Fig. 3 (a) A fluorapatite crystal with very faint zoning. (b) A fluorapatite crystal with 625
concentric growth zoning. Note that this crystal has discontinuous dark areas along 626

22
the grain rim. (c) Fluorapatite crystals with dark rims of varying thickness around the 627
bright cores. (d) A fluorapatite crystal with dark veins crossing the bright interior. (e) 628
A fluorapatite crystal with small bright patches surrounded by dark area. (f) 629
Homogeneous, dark fluorapatite crystals. Mineral abbreviations are the same as those 630
in Fig. 2. 631
632
Fig. 4 Plots of Si vs. (REE+Y) and Na vs. (REE+Y) concentrations for fluorapatite. 633
634
Fig. 5 (a) to (d) Plots of (REE+Y) vs. Sm/Nd for fluorapatite from the samples in this 635
study. (e) to (h) Chondrite-normalized REE profiles for fluorapatite from studied 636
samples. 637
638
Fig. 6 (a) Plot of 143Nd/144Nd vs. 147Sm/144Nd for fluorapatite, allanite-(Ce), and 639
monazite-(Ce). A Sm-Nd isochron of 840 Ma is shown for reference. (b) Histogram 640
showing initial 143Nd/144 Nd ratios of allanite-(Ce) and monazite-(Ce). (c) Histogram 641
showing initial 143Nd/144 Nd ratios of fluorapatite. 642
643
Fig. 7 147Sm/144Nd vs. 143Nd/144Nd diagrams illustrating: (a) and (b) the effect of the 644
Sm/Nd ratio change on the evolution of the Sm-Nd isotopic system, (c) methodology 645
regarding the back tracing of the initial isotopic composition of a sample that has 646
experienced a Sm/Nd ratio change, and (d) how to back trace the initial isotopic 647
composition of a sample if the change in the Sm/Nd ratio is ignored. See the text for 648
further discussion. 649


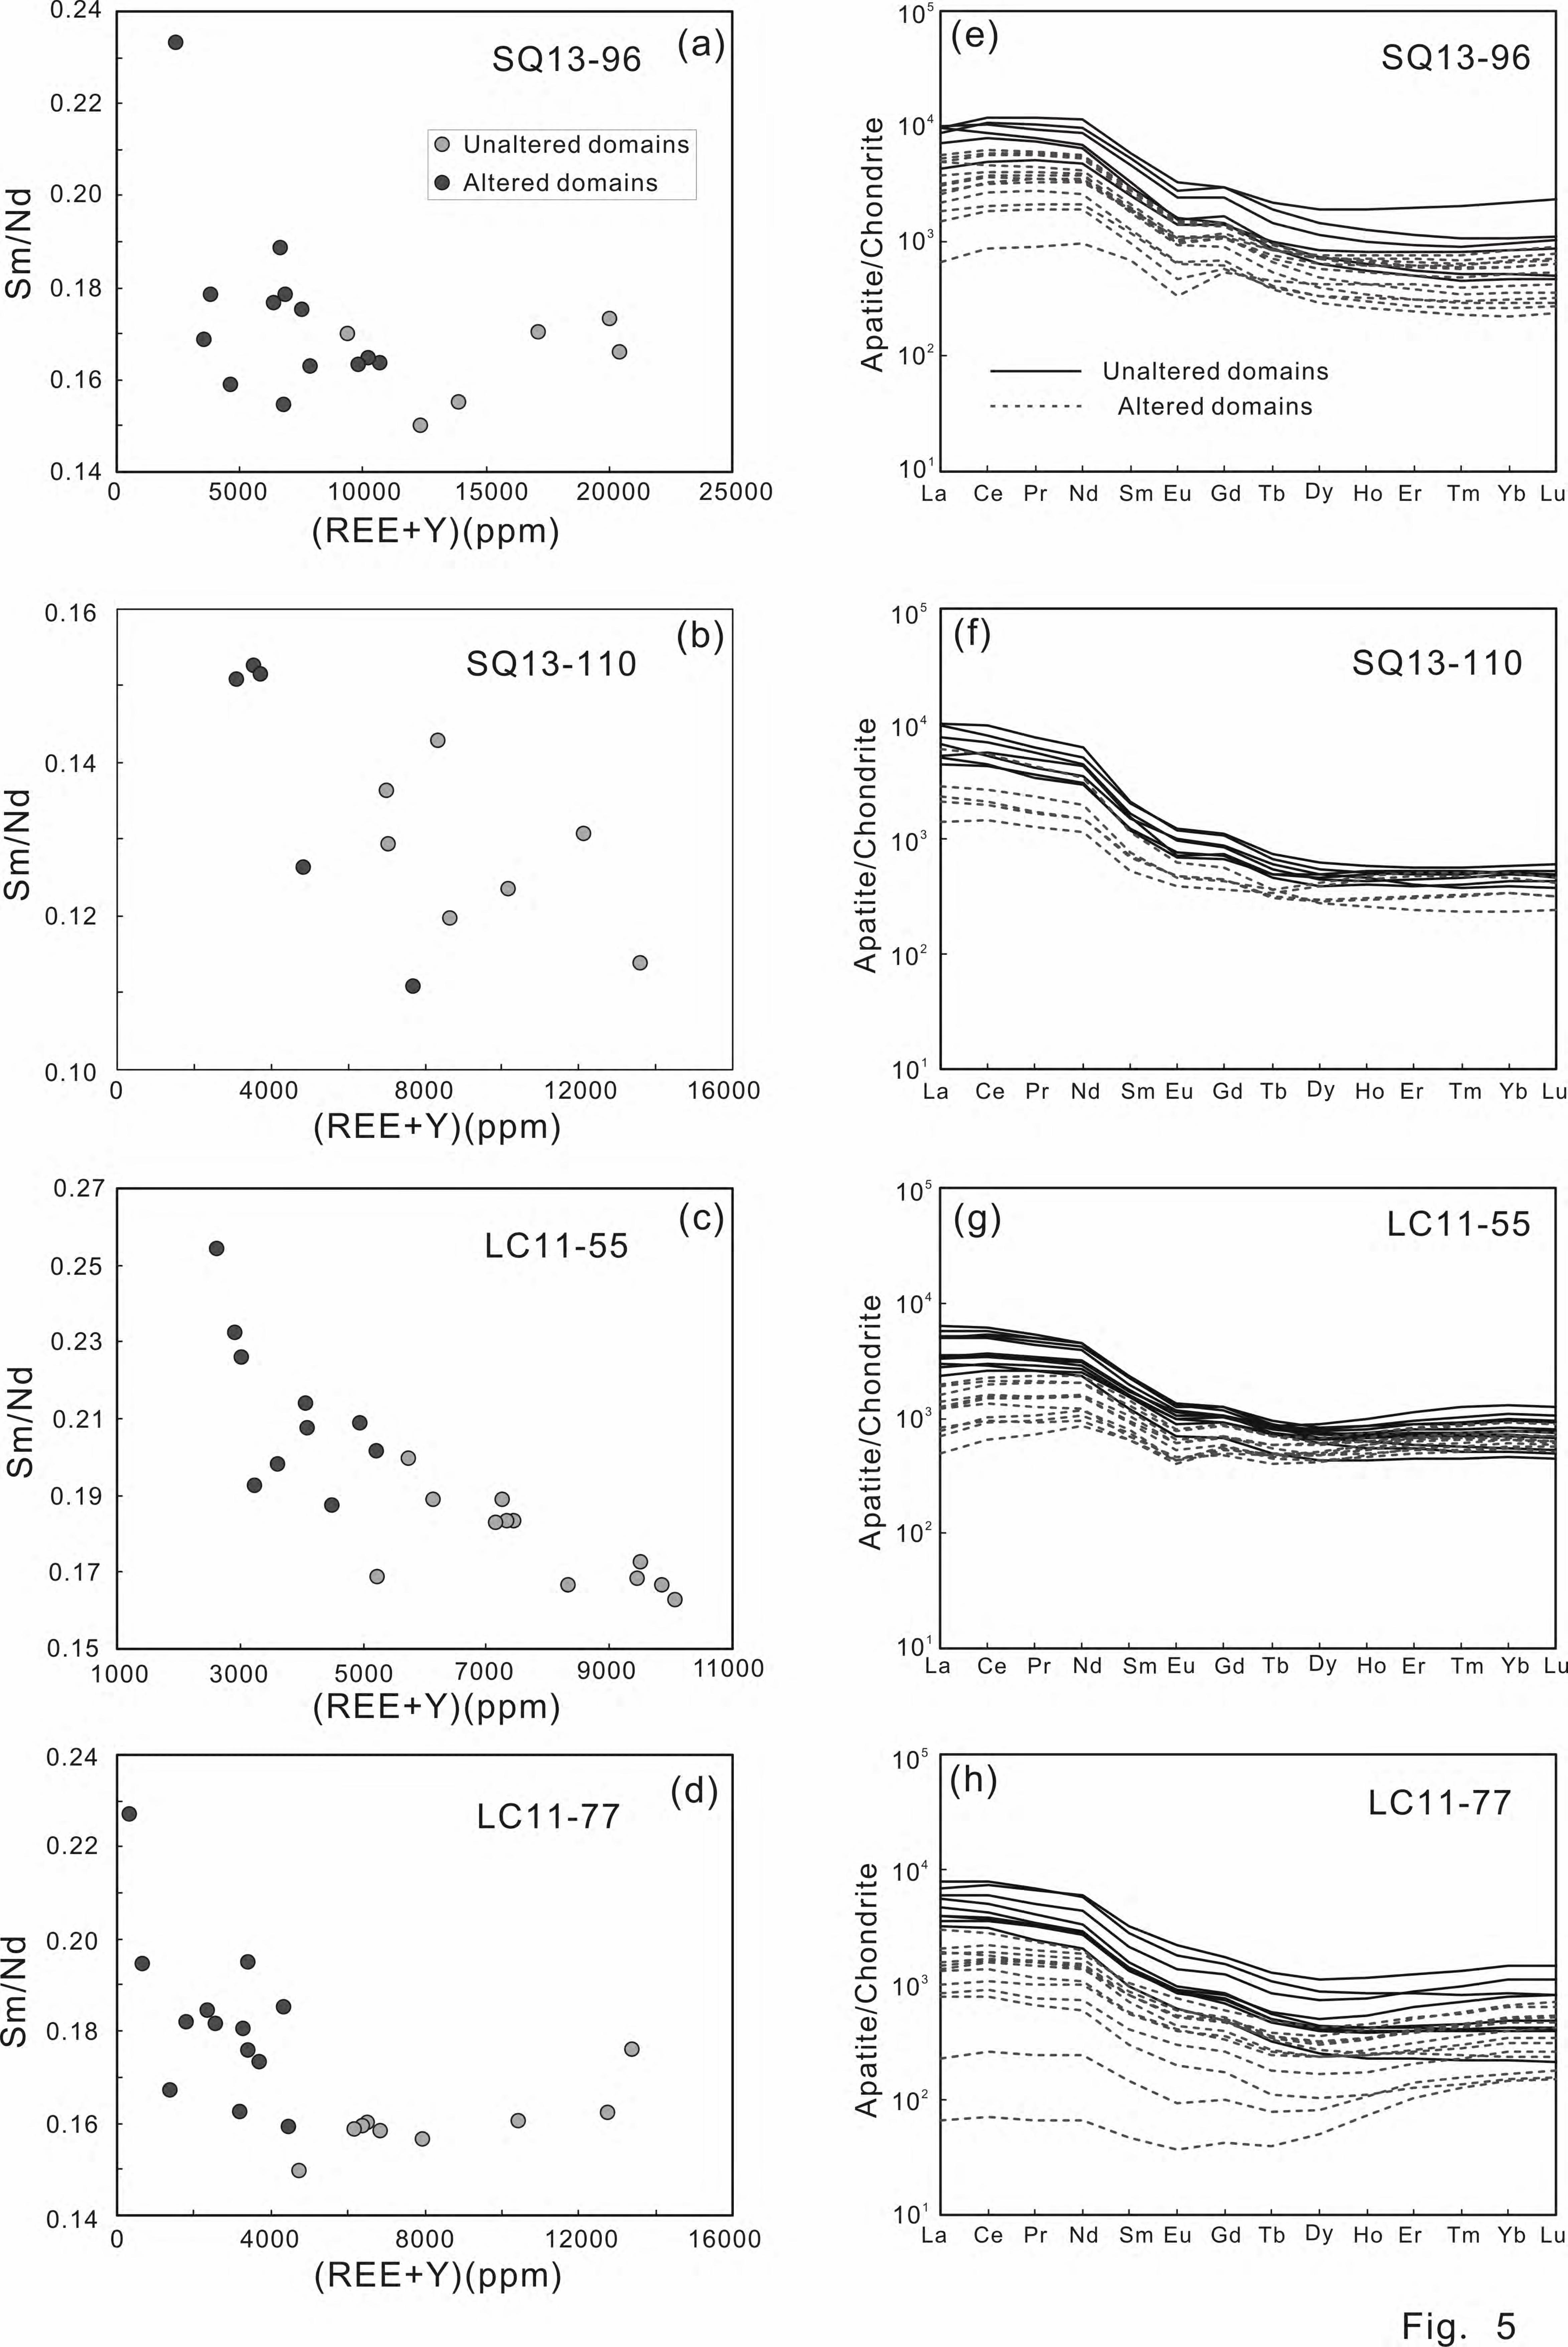
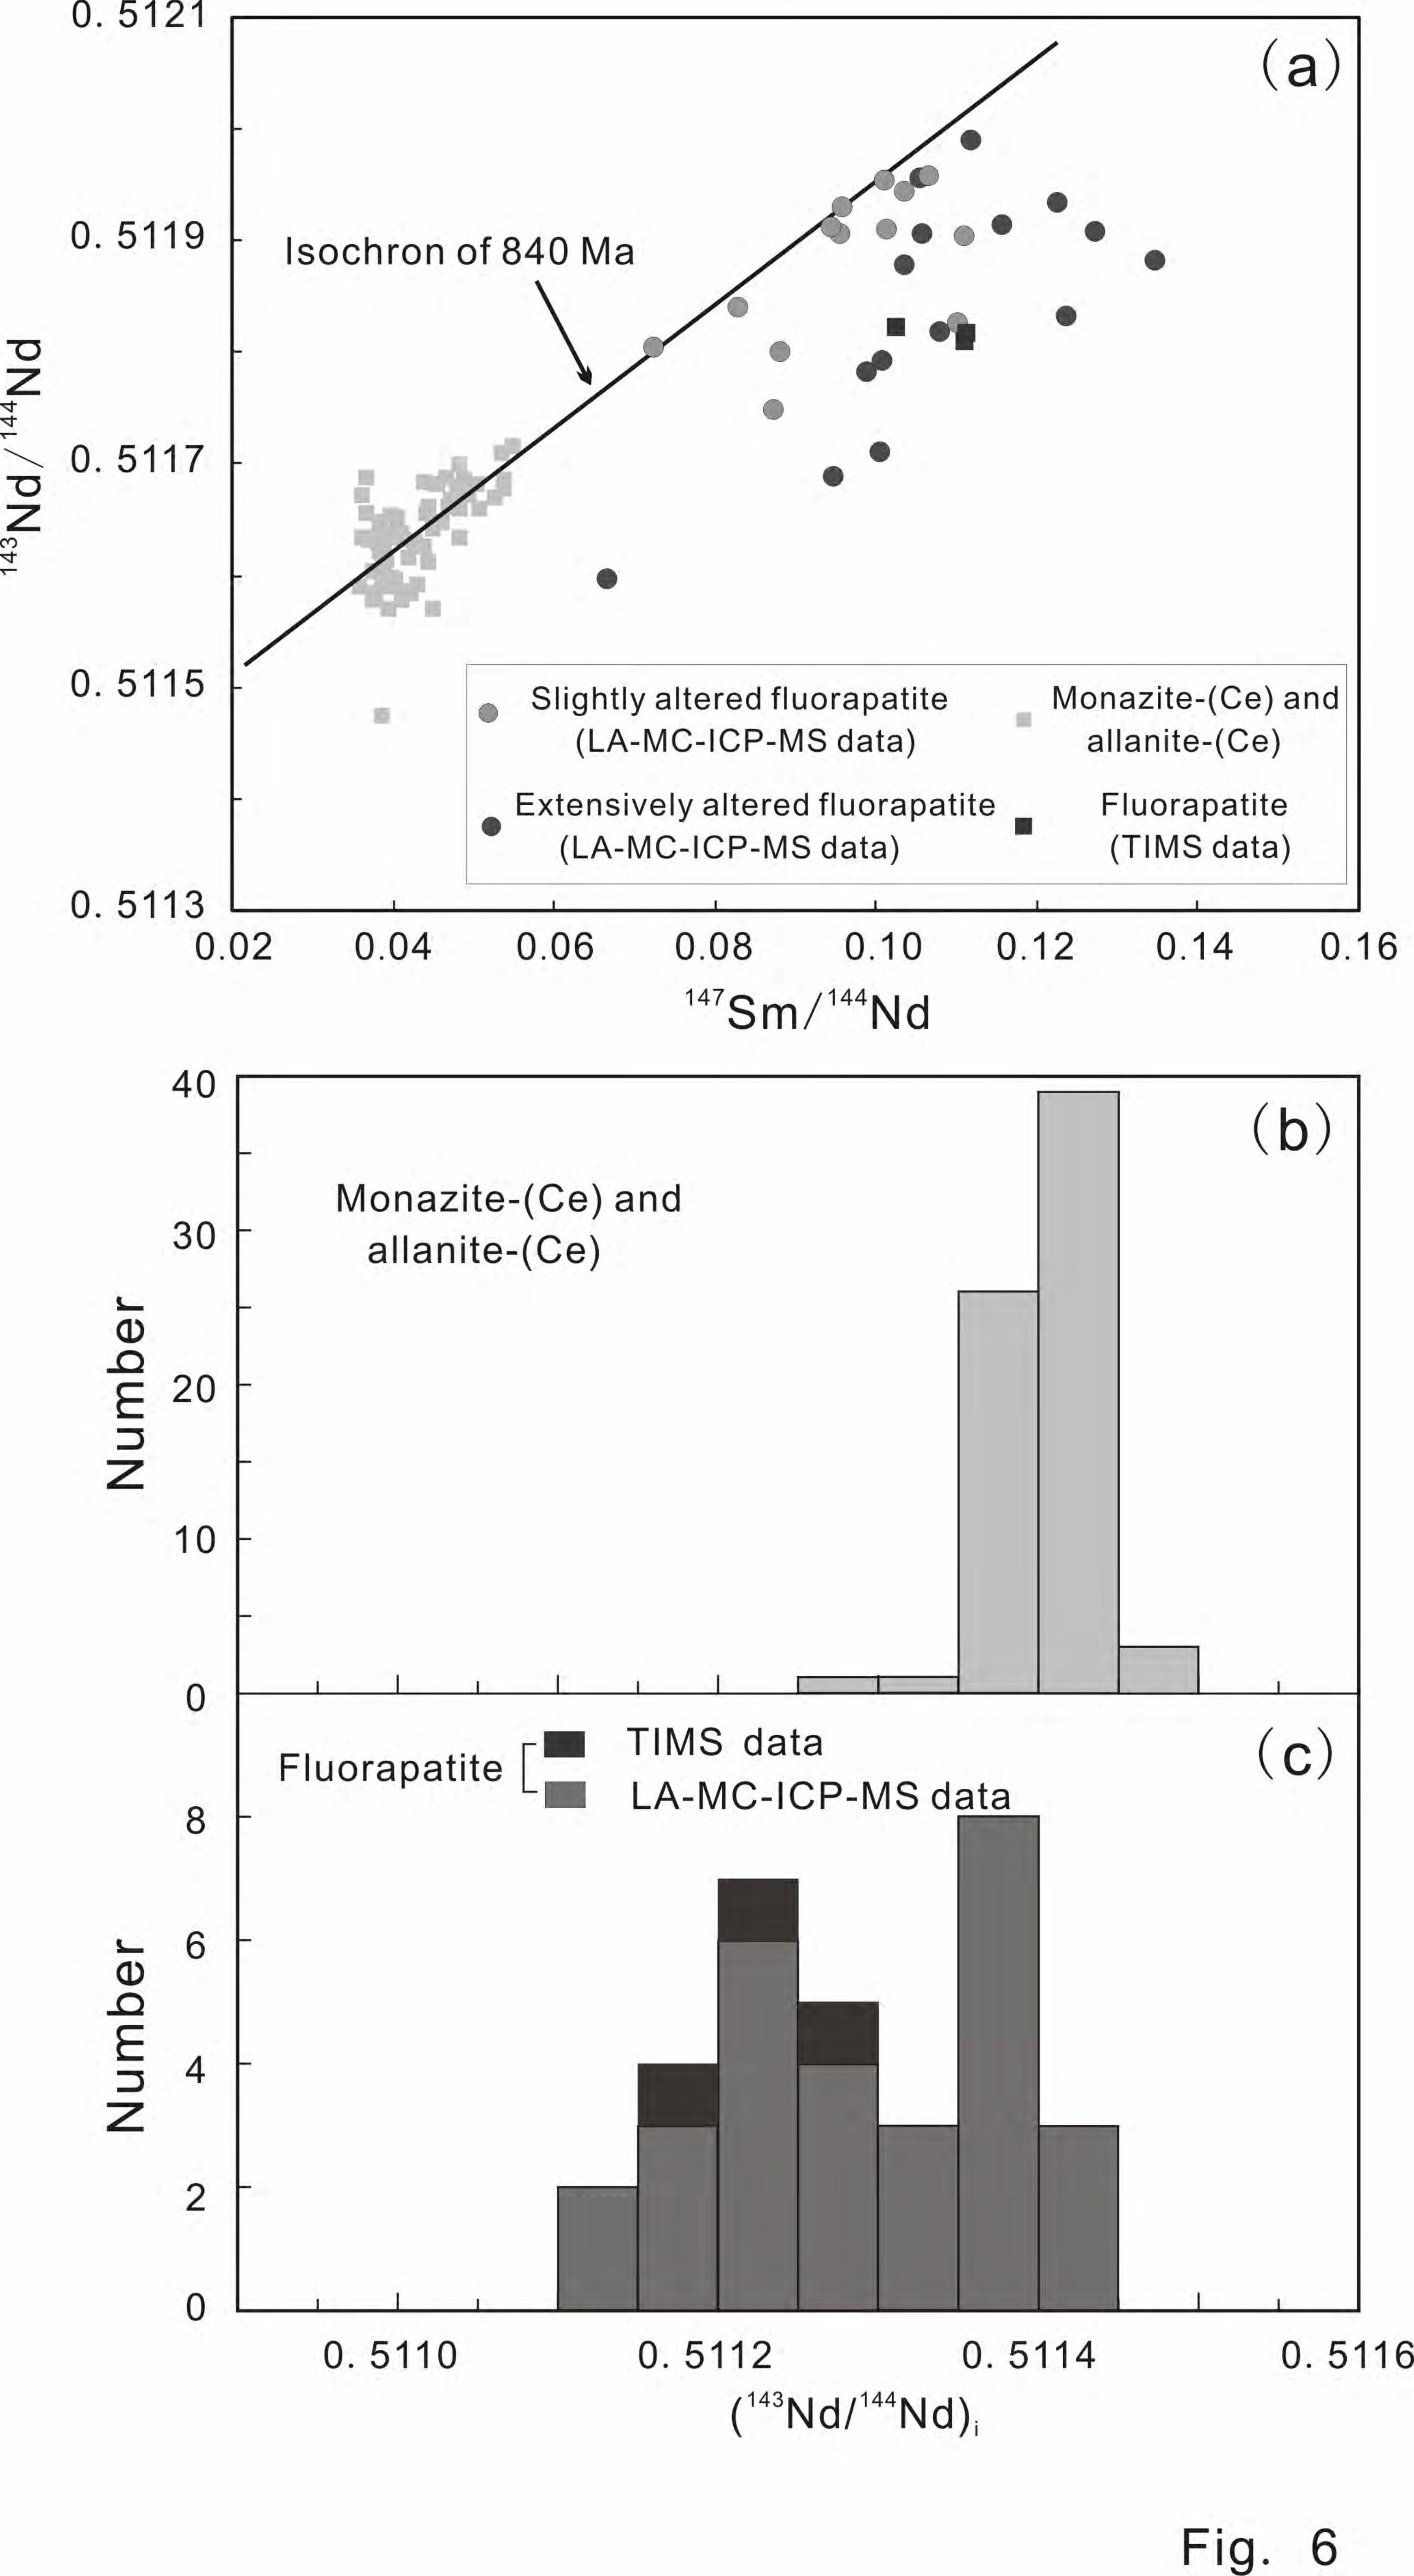


Table 1 A list of fluorapatite-bearing samples
Sample No. Locality Rock type Mineralogy
SQ13-96 North border of the
western mining district
Massive ore sample Stage I: Ab±Mag
Stage II: Mag+Aln+Amp+Ap
Stage III: Ccp+Bt±Py
SQ13-110 North border of the
western mining district
Banded ore sample Stage I: Ab+Chev+Mnz
Stage II: Aln+Ap
Stage III: Bt±Ccp
LC11-55 Ore pile in the eastern mining
district Banded ore sample
Stage II: Mag+Amp+Aln+Bt+Ap
Stage III: Ccp
LC11-77 Ore pile in the eastern mining
district Massive ore sample
Stage II: Mag+Aln+Bt+Amp+Ap
Stage III: Ccp+Po

Table 2 A summary of major element content of fluorapatite (wt.%)
BSE-bright domains BSE-dark domains Mean (n=58) Range Mean (n=58) Range
SO3 0.01 b.d.l.-0.05 0.01 b.d.l.-0.04 P2O5 41.64 40.42-42.48 42.26 41.48-42.99 SiO2 0.31 b.d.l.-1.01 b.d.l. b.d.l.-0.08
Ce2O3 0.57 b.d.l.-1.29 0.16 b.d.l.-0.57 FeO 0.19 0.01-0.57 0.20 0.01-0.64 MnO 0.02 b.d.l.-0.08 0.02 b.d.l.-0.07 CaO 54.66 53.19-55.59 55.12 54.51-55.76 SrO 0.07 b.d.l.-0.14 0.09 0.02-0.22
Na2O b.d.l. b.d.l.-0.04 b.d.l. b.d.l.-0.05 F 2.80 2.39-3.71 2.87 2.44-3.67 Cl 0.01 b.d.l.-0.02 0.01 b.d.l.-0.02
OH 0.83 0.01-1.23 0.80 0.08-1.19 Total 99.93 98.51-100.82 100.33 99.01-100.89
Note: (1) b.d.l. means below detection limit. (2) The content of OH was estimated assuming the (F, Cl, OH) site is filled.

Table 3 A summary of trace element concentration for fluorapatite (ppm)
SQ13-96 (BSE-bright domains) SQ13-96 (BSE-dark domains) SQ13-110 (BSE-bright domains) SQ13-110 (BSE-dark domains) Mean (n=6) Range Mean (n=13) Range Mean (n=7) Range Mean (n=5) Range
Na 343 93.6-706 244 79.8-558 190 124-295 155 125-196 Si 3802 2426-5720 1617 784-2646 1286 618-2247 876 b.d.l.-2263 Sc 0.35 0.04-0.81 0.20 0.11-0.40 0.28 0.15-0.40 0.28 0.22-0.38 V 1.17 0.15-4.61 0.30 0.05-0.71 0.15 0.11-0.23 0.16 b.d.l.-0.32 Cr 1.60 0.79-3.34 0.92 b.d.l.-1.97 2.02 b.d.l.-3.53 2.25 b.d.l.-5.53 Ge 27.9 15.8-40.9 12.0 3.02-19.9 31.4 11.3-50.8 13.6 5.44-28.4 As 141 43.8-281 63.7 14.4-158 45.1 8.67-96.0 42.4 5.06-81.5 Rb 0.45 0.09-1.75 0.22 0.03-1.05 0.12 0.02-0.17 0.12 0.08-0.15 Sr 596 457-780 619 442-735 746 474-873 811 788-836 Ba 0.71 0.06-1.65 0.44 0.03-3.33 0.50 0.11-1.73 1.18 0.46-2.07 Pb 2.32 1.86-2.62 2.00 1.72-2.30 2.11 1.43-2.86 1.92 1.74-2.16 Th 9.69 2.95-18.1 2.01 0.36-4.28 5.71 1.94-12.8 2.11 1.03-3.41 U 109 44.6-204 29.4 9.46-57.0 51.4 30.1-110 24.8 19.7-31.7 La 1933 1021-2346 760 156-1328 1651 1053-2359 700 337-1430 Ce 5472 2989-7156 2221 521-3787 3822 2601-5829 1673 894-3338 Pr 816 472-1128 344 84.7-568 485 325-736 214 121-413 Nd 3711 2226-5303 1626 450-2607 1957 1361-2869 889 534-1601 Sm 612 379-880 276 105-427 247 184-327 117 80.4-177 Eu 125 78.9-190 55.1 19.4-84.7 54.0 40.6-71.2 28.0 22.6-36.2 Gd 435 281-605 204 108-292 176 138-228 91.9 73.5-116 Tb 51.3 32.3-79.5 24.8 14.2-35.2 21.5 17.1-28.0 12.5 11.6-13.3 Dy 281 163-477 138 73.7-189 125 97.8-156 84.4 70.4-105 Ho 57.2 31.0-104 28.7 14.8-41.9 27.3 22.6-32.6 20.1 14.6-26.7 Er 161 82.5-319 81.0 39.9-125 78.8 64.8-92.6 61.6 39.3-85.4 Tm 24.0 11.5-50.5 12.0 5.87-19.4 12.1 9.50-14.3 9.59 6.00-13.2 Yb 170 78.5-369 83.8 37.6-139 83.3 65.1-100 64.0 39.5-87.6 Lu 26.3 11.8-58.2 13.1 6.02-22.2 12.2 9.65-15.3 8.89 6.08-11.8 Y 1643 933-3002 858 445-1280 804 724-963 619 402-816
Total (REE+Y) 15517 9379-20388 6725 2439-10688 9556 6999-13596 4594 3138-7704 Sm/Nd 0.164 0.150-0.173 0.174 0.154-0.233 0.128 0.114-0.143 0.138 0.111-0.153

LC11-55 (BSE-bright domains) LC11-55 (BSE-dark domains) LC11-77 (BSE-bright domains) LC11-77 (BSE-dark domains) Mean (n=12) Range Mean (n=11) Range Mean (n=9) Range Mean (n=13) Range
Na 123 67.8-218 83.6 55.9-192.3 145 51.4-266 84.0 27.2-232 Si 1516 222-2233 990 396-1835 2108 753-3905 544 b.d.l.-1203 Sc 0.32 0.26-0.42 0.24 0.10-0.38 0.44 0.16-0.81 0.35 0.15-0.57 V 0.50 0.26-1.03 0.38 0.16-0.89 1.09 0.26-1.97 0.38 b.d.l.-0.73 Cr 2.83 0.83-4.39 2.81 1.37-4.26 1.81 0.29-3.69 2.88 0.91-4.53 Ge 21.2 13.5-28.6 9.01 4.89-14.9 21.1 10.4-41.2 7.72 1.11-14.2 As 84.6 38.3-244 49.5 18.2-93.7 88.5 7.81-195 49.5 14.2-89.9 Rb 0.33 0.12-1.23 0.29 0.10-0.74 0.85 0.07-2.20 0.35 0.02-0.98 Sr 555 388-688 702 588-822 899 712-1137 1039 736-1645 Ba 0.55 0.12-1.90 0.64 0.16-2.64 1.59 0.09-4.36 0.54 0.07-2.62 Pb 1.75 1.07-2.13 2.02 1.80-2.44 1.98 1.27-2.54 2.15 1.31-2.72 Th 2.35 0.83-3.41 0.77 0.44-1.24 2.70 0.47-6.95 0.35 b.d.l.-0.88 U 50.5 29.8-63.1 26.9 17.8-45.6 60.8 12.4-171 14.8 0.78-33.7 La 963 545-1511 286 117-469 1207 774-1847 318 15.6-715 Ce 2530 1578-3773 876 403-1393 3047 1899-4750 851 42.9-1708 Pr 360 247-501 137 68.5-220 403 236-641 119 6.28-224 Nd 1610 1094-2119 691 396-1091 1699 970-2785 537 31.4-926 Sm 283 184-357 145 99.0-220 275 145-490 95.0 7.13-158 Eu 63.7 40.7-76.5 32.1 23.1-46.1 67.0 35.3-126 24.1 2.12-44.5 Gd 216 139-258 131 98.5-183 201 100-359 74.6 8.70-125 Tb 29.9 18.6-35.0 19.9 15.2-25.9 25.4 12.0-47.9 9.91 1.50-17.9 Dy 180 108-222 133 106-170 145 63.8-281 60.6 12.8-107 Ho 40.7 24.0-55.6 32.7 25.7-41.6 32.4 13.0-64.5 14.6 4.10-25.5 Er 125 72.7-185 107 82.9-137 100 37.9-204 49.4 17.2-85.8 Tm 19.8 11.5-31.7 17.3 13.2-22.3 16.2 5.53-33.3 8.38 3.25-14.7 Yb 136 78.0-221 119 91.9-155 117 37.6-252 62.7 24.5-114 Lu 19.6 11.2-31.6 17.1 13.1-22.4 17.3 5.40-37.3 9.63 3.80-18.0 Y 1205 742-1645 1012 807-1246 991 390-1902 460 138-785
Total (REE+Y) 7782 5224-10053 3757 2638-5218 8344 4727-13400 2693 319-4467 Sm/Nd 0.178 0.163-0.200 0.213 0.187-0.254 0.160 0.150-0.176 0.182 0.159-0.227
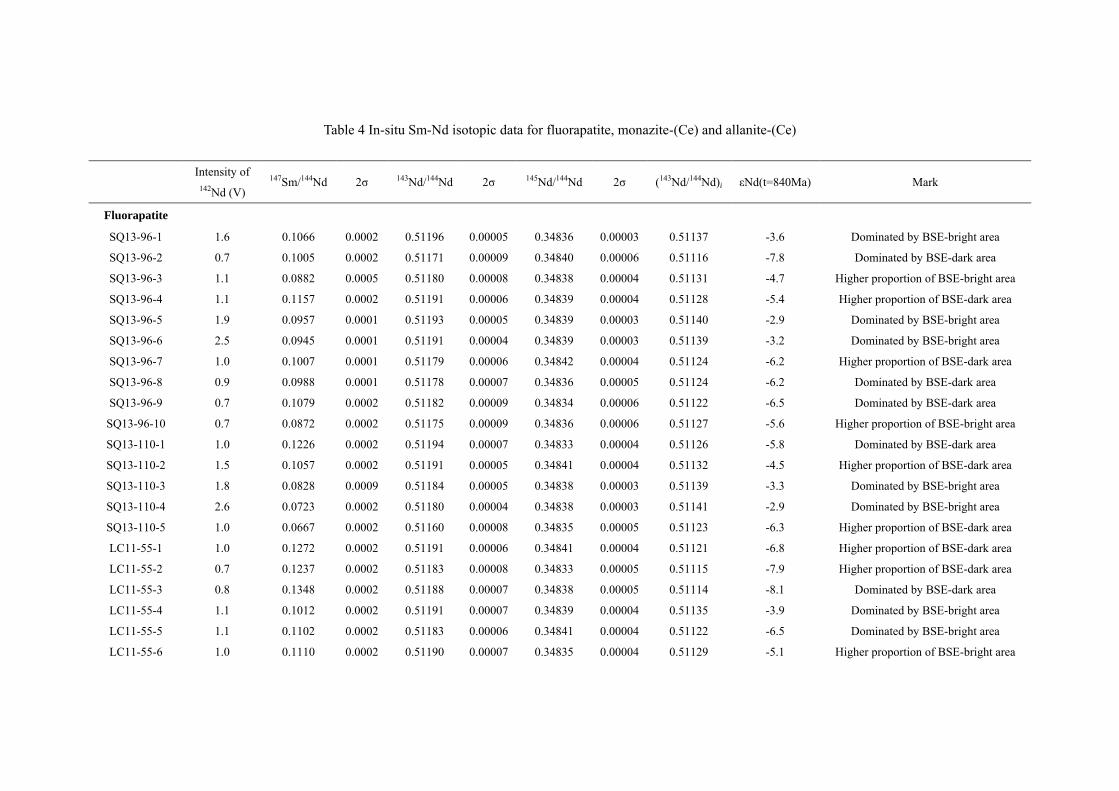
Table 4 In-situ Sm-Nd isotopic data for fluorapatite, monazite-(Ce) and allanite-(Ce)
Intensity of
142Nd (V) 147Sm/144Nd 2σ 143Nd/144Nd 2σ 145Nd/144Nd 2σ (143Nd/144Nd)i εNd(t=840Ma) Mark
Fluorapatite
SQ13-96-1 1.6 0.1066 0.0002 0.51196 0.00005 0.34836 0.00003 0.51137 -3.6 Dominated by BSE-bright area
SQ13-96-2 0.7 0.1005 0.0002 0.51171 0.00009 0.34840 0.00006 0.51116 -7.8 Dominated by BSE-dark area
SQ13-96-3 1.1 0.0882 0.0005 0.51180 0.00008 0.34838 0.00004 0.51131 -4.7 Higher proportion of BSE-bright area
SQ13-96-4 1.1 0.1157 0.0002 0.51191 0.00006 0.34839 0.00004 0.51128 -5.4 Higher proportion of BSE-dark area
SQ13-96-5 1.9 0.0957 0.0001 0.51193 0.00005 0.34839 0.00003 0.51140 -2.9 Dominated by BSE-bright area
SQ13-96-6 2.5 0.0945 0.0001 0.51191 0.00004 0.34839 0.00003 0.51139 -3.2 Dominated by BSE-bright area
SQ13-96-7 1.0 0.1007 0.0001 0.51179 0.00006 0.34842 0.00004 0.51124 -6.2 Higher proportion of BSE-dark area
SQ13-96-8 0.9 0.0988 0.0001 0.51178 0.00007 0.34836 0.00005 0.51124 -6.2 Dominated by BSE-dark area
SQ13-96-9 0.7 0.1079 0.0002 0.51182 0.00009 0.34834 0.00006 0.51122 -6.5 Dominated by BSE-dark area
SQ13-96-10 0.7 0.0872 0.0002 0.51175 0.00009 0.34836 0.00006 0.51127 -5.6 Higher proportion of BSE-bright area
SQ13-110-1 1.0 0.1226 0.0002 0.51194 0.00007 0.34833 0.00004 0.51126 -5.8 Dominated by BSE-dark area
SQ13-110-2 1.5 0.1057 0.0002 0.51191 0.00005 0.34841 0.00004 0.51132 -4.5 Higher proportion of BSE-dark area
SQ13-110-3 1.8 0.0828 0.0009 0.51184 0.00005 0.34838 0.00003 0.51139 -3.3 Dominated by BSE-bright area
SQ13-110-4 2.6 0.0723 0.0002 0.51180 0.00004 0.34838 0.00003 0.51141 -2.9 Dominated by BSE-bright area
SQ13-110-5 1.0 0.0667 0.0002 0.51160 0.00008 0.34835 0.00005 0.51123 -6.3 Higher proportion of BSE-dark area
LC11-55-1 1.0 0.1272 0.0002 0.51191 0.00006 0.34841 0.00004 0.51121 -6.8 Higher proportion of BSE-dark area
LC11-55-2 0.7 0.1237 0.0002 0.51183 0.00008 0.34833 0.00005 0.51115 -7.9 Higher proportion of BSE-dark area
LC11-55-3 0.8 0.1348 0.0002 0.51188 0.00007 0.34838 0.00005 0.51114 -8.1 Dominated by BSE-dark area
LC11-55-4 1.1 0.1012 0.0002 0.51191 0.00007 0.34839 0.00004 0.51135 -3.9 Dominated by BSE-bright area
LC11-55-5 1.1 0.1102 0.0002 0.51183 0.00006 0.34841 0.00004 0.51122 -6.5 Dominated by BSE-bright area
LC11-55-6 1.0 0.1110 0.0002 0.51190 0.00007 0.34835 0.00004 0.51129 -5.1 Higher proportion of BSE-bright area

LC11-77-1 0.6 0.0948 0.0003 0.51169 0.00009 0.34840 0.00007 0.51117 -7.6 Dominated by BSE-dark area
LC11-77-2 1.8 0.0955 0.0001 0.51191 0.00005 0.34837 0.00003 0.51138 -3.4 Dominated by BSE-bright area
LC11-77-3 1.3 0.1055 0.0001 0.51196 0.00005 0.34836 0.00003 0.51138 -3.5 Higher proportion of BSE-dark area
LC11-77-4 1.5 0.1011 0.0001 0.51195 0.00005 0.34839 0.00004 0.51140 -3.1 Dominated by BSE-bright area
LC11-77-5 1.6 0.1034 0.0001 0.51195 0.00004 0.34840 0.00003 0.51138 -3.5 Dominated by BSE-bright area
LC11-77-6 1.4 0.1117 0.0001 0.51199 0.00005 0.34837 0.00003 0.51138 -3.5 Dominated by BSE-dark area
LC11-77-7 1.0 0.1034 0.0001 0.51188 0.00005 0.34841 0.00004 0.51131 -4.8 Dominated by BSE-dark area
Monazite-(Ce)
LC11-44-1 5.4 0.0505 0.0003 0.51168 0.00003 0.34845 0.00002 0.51140 -3.0
LC11-44-2 5.5 0.0494 0.0001 0.51167 0.00003 0.34841 0.00002 0.51140 -3.0
LC11-44-3 5.8 0.0549 0.0003 0.51172 0.00003 0.34842 0.00002 0.51141 -2.8
LC11-44-4 5.3 0.0483 0.0002 0.51166 0.00003 0.34843 0.00002 0.51139 -3.2
LC11-44-5 5.5 0.0537 0.0001 0.51171 0.00004 0.34842 0.00002 0.51141 -2.8
LC11-44-6 4.8 0.0539 0.0002 0.51168 0.00004 0.34842 0.00003 0.51138 -3.4
LC11-44-7 5.1 0.0539 0.0001 0.51169 0.00004 0.34843 0.00002 0.51139 -3.2
LC11-44-8 5.3 0.0481 0.0002 0.51168 0.00005 0.34842 0.00004 0.51141 -2.7
LC11-44-9 5.0 0.0484 0.0002 0.51163 0.00005 0.34841 0.00004 0.51137 -3.7
LC11-44-10 5.4 0.0444 0.0001 0.51166 0.00004 0.34844 0.00003 0.51142 -2.7
LC11-44-11 4.3 0.0527 0.0002 0.51167 0.00005 0.34844 0.00003 0.51138 -3.4
LC11-44-12 4.0 0.0490 0.0001 0.51168 0.00005 0.34845 0.00004 0.51141 -2.9
SQ13-99-1 5.1 0.0440 0.0000 0.51168 0.00003 0.34845 0.00002 0.51144 -2.2
SQ13-99-2 4.6 0.0375 0.0000 0.51160 0.00003 0.34840 0.00002 0.51140 -3.1
SQ13-99-3 4.6 0.0419 0.0000 0.51161 0.00003 0.34841 0.00002 0.51138 -3.3
SQ13-99-4 4.8 0.0414 0.0000 0.51159 0.00003 0.34841 0.00002 0.51136 -3.8
SQ13-99-5 4.8 0.0411 0.0000 0.51158 0.00003 0.34840 0.00002 0.51135 -4.0
SQ13-99-6 4.3 0.0424 0.0000 0.51158 0.00003 0.34842 0.00002 0.51135 -4.0

SQ13-99-7 4.2 0.0415 0.0001 0.51163 0.00004 0.34844 0.00002 0.51140 -3.0
SQ13-99-8 4.1 0.0449 0.0000 0.51157 0.00004 0.34840 0.00002 0.51132 -4.6
SQ13-99-9 4.4 0.0429 0.0000 0.51163 0.00003 0.34840 0.00002 0.51139 -3.2
SQ13-99-10 4.1 0.0470 0.0000 0.51166 0.00004 0.34841 0.00003 0.51140 -3.0
SQ13-99-11 3.9 0.0391 0.0000 0.51161 0.00005 0.34845 0.00004 0.51140 -3.1
Allanite-(Ce)
LC11-77-1 4.9 0.0405 0.0001 0.51160 0.00003 0.34838 0.00002 0.51137 -3.6
LC11-77-2 5.0 0.0379 0.0000 0.51158 0.00003 0.34841 0.00002 0.51138 -3.5
LC11-77-3 5.2 0.0388 0.0000 0.51159 0.00003 0.34841 0.00002 0.51137 -3.5
LC11-77-4 6.3 0.0412 0.0002 0.51164 0.00003 0.34841 0.00002 0.51141 -2.8
LC11-77-5 6.1 0.0395 0.0000 0.51159 0.00003 0.34841 0.00002 0.51137 -3.6
LC11-77-6 6.1 0.0388 0.0000 0.51163 0.00003 0.34842 0.00002 0.51141 -2.8
LC11-77-7 5.7 0.0392 0.0000 0.51161 0.00003 0.34840 0.00002 0.51140 -3.1
LC11-77-8 5.7 0.0398 0.0001 0.51160 0.00003 0.34841 0.00002 0.51138 -3.4
LC11-77-9 4.7 0.0391 0.0000 0.51160 0.00003 0.34840 0.00002 0.51139 -3.3
LC11-56-1 6.6 0.0395 0.0000 0.51163 0.00003 0.34841 0.00002 0.51142 -2.7
LC11-56-2 6.8 0.0387 0.0000 0.51163 0.00004 0.34841 0.00003 0.51142 -2.6
LC11-56-3 2.7 0.0396 0.0001 0.51157 0.00006 0.34838 0.00004 0.51135 -4.0
LC11-56-4 2.4 0.0389 0.0001 0.51147 0.00007 0.34841 0.00005 0.51126 -5.8
LC11-56-5 6.8 0.0386 0.0000 0.51162 0.00003 0.34841 0.00002 0.51141 -2.8
LC11-56-6 6.8 0.0385 0.0000 0.51165 0.00003 0.34841 0.00002 0.51144 -2.3
LC11-56-7 6.7 0.0388 0.0000 0.51162 0.00003 0.34840 0.00002 0.51140 -2.9
LC11-56-8 6.0 0.0390 0.0000 0.51162 0.00003 0.34843 0.00002 0.51141 -2.9
LC11-56-9 25.6 0.0399 0.0000 0.51165 0.00003 0.34841 0.00002 0.51143 -2.4
LC11-56-10 25.4 0.0397 0.0000 0.51164 0.00001 0.34841 0.00001 0.51142 -2.6
SQ13-99-1 2.5 0.0359 0.0001 0.51159 0.00005 0.34836 0.00003 0.51139 -3.2

SQ13-110-1 3.9 0.0462 0.0001 0.51165 0.00004 0.34840 0.00003 0.51139 -3.2
SQ13-110-2 5.8 0.0508 0.0000 0.51166 0.00003 0.34840 0.00002 0.51138 -3.4
SQ13-110-3 6.0 0.0446 0.0000 0.51166 0.00003 0.34839 0.00002 0.51141 -2.7
SQ13-110-4 6.0 0.0444 0.0001 0.51165 0.00003 0.34842 0.00002 0.51141 -2.8
SQ13-110-5 7.1 0.0484 0.0001 0.51170 0.00006 0.34842 0.00005 0.51143 -2.4
SQ13-110-6 7.5 0.0472 0.0000 0.51167 0.00002 0.34840 0.00001 0.51141 -2.9
SQ13-110-7 6.6 0.0477 0.0001 0.51166 0.00003 0.34839 0.00001 0.51140 -3.0
SQ13-110-8 6.4 0.0488 0.0000 0.51169 0.00003 0.34841 0.00002 0.51142 -2.7
SQ13-110-9 6.7 0.0478 0.0000 0.51166 0.00003 0.34842 0.00002 0.51140 -3.1
SQ13-101-1 5.0 0.0444 0.0000 0.51161 0.00004 0.34839 0.00002 0.51137 -3.7
SQ13-101-2 5.6 0.0450 0.0001 0.51164 0.00003 0.34843 0.00002 0.51139 -3.2
SQ13-101-3 5.7 0.0454 0.0000 0.51168 0.00003 0.34840 0.00002 0.51143 -2.4
SQ13-101-4 5.5 0.0440 0.0000 0.51162 0.00003 0.34841 0.00002 0.51138 -3.4
SQ13-101-5 7.4 0.0457 0.0000 0.51168 0.00002 0.34842 0.00001 0.51143 -2.4
SQ13-101-6 7.6 0.0468 0.0000 0.51169 0.00003 0.34844 0.00002 0.51143 -2.5
SQ13-101-7 4.5 0.0433 0.0000 0.51159 0.00004 0.34843 0.00002 0.51135 -4.0
SQ13-101-8 5.7 0.0408 0.0000 0.51165 0.00003 0.34842 0.00002 0.51143 -2.5
SQ14-16-1 4.0 0.0377 0.0000 0.51158 0.00003 0.34836 0.00002 0.51137 -3.6
SQ14-16-2 7.5 0.0384 0.0000 0.51160 0.00003 0.34843 0.00002 0.51139 -3.2
SQ14-16-3 8.2 0.0390 0.0000 0.51162 0.00002 0.34841 0.00002 0.51140 -3.0
SQ14-16-4 7.2 0.0367 0.0001 0.51169 0.00009 0.34847 0.00007 0.51148 -1.4
SQ14-16-5 7.9 0.0362 0.0001 0.51167 0.00009 0.34847 0.00006 0.51147 -1.6
SQ14-16-6 8.0 0.0363 0.0001 0.51163 0.00007 0.34843 0.00005 0.51143 -2.4
SQ14-16-7 8.7 0.0369 0.0001 0.51165 0.00004 0.34844 0.00003 0.51145 -2.0
SQ14-16-8 7.4 0.0381 0.0000 0.51163 0.00006 0.34842 0.00004 0.51142 -2.6
SQ14-16-9 7.9 0.0374 0.0000 0.51163 0.00004 0.34842 0.00003 0.51143 -2.5

SQ14-16-10 7.2 0.0371 0.0000 0.51163 0.00003 0.34844 0.00003 0.51143 -2.5
Note: The data for allanite-(Ce) are from Li and Zhou (2017).
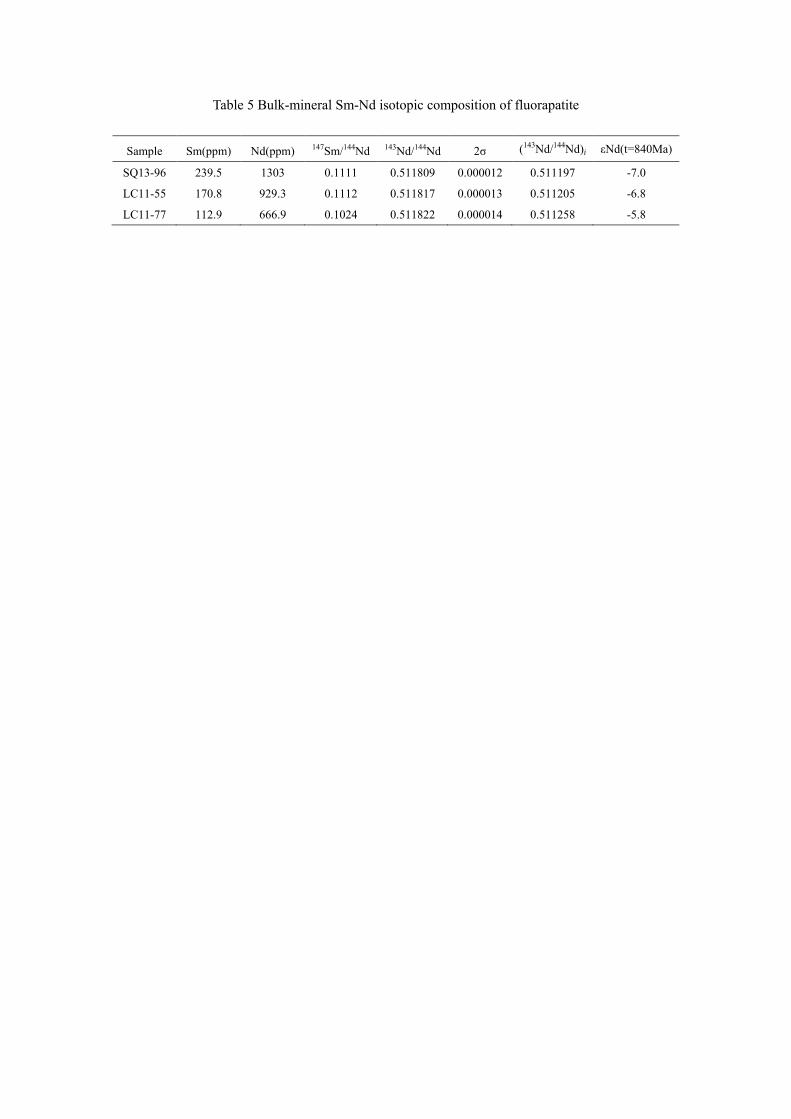
Table 5 Bulk-mineral Sm-Nd isotopic composition of fluorapatite
Sample Sm(ppm) Nd(ppm) 147Sm/144Nd 143Nd/144Nd 2σ (143Nd/144Nd)i εNd(t=840Ma)
SQ13-96 239.5 1303 0.1111 0.511809 0.000012 0.511197 -7.0
LC11-55 170.8 929.3 0.1112 0.511817 0.000013 0.511205 -6.8
LC11-77 112.9 666.9 0.1024 0.511822 0.000014 0.511258 -5.8