Revised Version DESY 13-081 - epub.sub.uni-hamburg.de
25
Revised Version DESY 13-081 arXiv:1306.1391v2 [physics.ins-det] 13 Jun 2013
Transcript of Revised Version DESY 13-081 - epub.sub.uni-hamburg.de

*∣306.∣39∣*
Revised Version DESY 13-081ar
Xiv
:130
6.13
91v2
[ph
ysic
s.in
s-de
t] 1
3 Ju
n 20
13
Measurement of the Luminosity in the ZEUSExperiment at HERA IIL. Adam zyka, J. Andruszkowb,1, T. Bolda, P. Borzemskib,2, C. Buettner ,A. Caldwell , J. Chwastowskib, W. Danilukb, V. Drugakovd,e, A. Eskreysb,2,J. Figielb, A. Galasb, M. Gilb,3, M. Helbi hf, F. Janus hekd, P. Jurkiewi zb,D. Kisielewskaa, U. Kleind,4, A. Kotarbab, W. Lohmannd,g,�, Y. Ningf, K.Oliwab, K. Olkiewi zb, S. Paganisf,5, J. Pieronb, M. Przyby iena, Z. Renf,W. Ru hlewi zb,1, W. S hmidke ,6, U. S hneeklothd, F. S iullif, P. Stopab,J. Sztuk-Dambietzh,7, L. Suszy kia, J. Sutiak , W. Wierbab, L. ZawiejskibaAGH University of S ien e and Te hnology, Cra ow, Polandb The Henryk Niewodni zanski Institute of Nu lear Physi s, Polish A ademy of S ien es,Cra ow , Poland Max-Plan k-Institut fuer Physik, M�un hen, GermanydDeuts hes Elektronen Syn hrotron, Hamburg, GermanyeNCPHEP, Minsk, BelarusfColumbia University, New York, USAgBrandenburgis he Te hnis he Universit�at, Cottbus, GermanyhHamburg University, II Institute of Exp. Physi s, Hamburg, GermanyAbstra tThe luminosity in the ZEUS dete tor was measured using photons from ele -tron bremsstrahlung. In 2001 the HERA ollider was upgraded for operationat higher luminosity. At the same time the luminosity-measuring system ofthe ZEUS experiment was modi�ed to ta kle the expe ted higher photonrate and syn hrotron radiation. The existing lead-s intillator alorimeter�Corresponding authorEmail address: wolfgang.lohmann�desy.de (W. Lohmann)1now at Motorola software enter, Krakow2de eased3now at Comar h, Krakow4now at University of Liverpool5now at The University of SheÆeld6now at Brookhaven National Laboratory7now at European X-Ray Free-Ele tron Laser Fa ility GmbH, HamburgPreprint submitted to Nu lear Instruments & Methods in Physi s Resear h June 14, 2013

was equipped with radiation hard s intillator tiles and shielded against syn- hrotron radiation. In addition, a magneti spe trometer was installed tomeasure the luminosity independently using photons onverted in the beam-pipe exit window. The redundan y provided a reliable and robust luminos-ity determination with a systemati un ertainty of 1.7%. The experimentalsetup, the te hniques used for luminosity determination and the estimate ofthe systemati un ertainty are reported.Keywords: luminosity measurement, ZEUS experiment1. Introdu tionAt the HERA storage rings ele trons1 and protons have been a eleratedto energies of 27.5 GeV and 920 GeV, respe tively, and brought to ollisionsinside two experiments, ZEUS and H1. Data taken with these experimentsprovided us with pre ise measurements of quark and gluon distributions inthe proton and allowed pre ision tests of Quantum Chromodynami s as thetheory of the strong for e at small distan es. The luminosity is a key param-eter of the storage ring determining its physi s potential in terms of eventstatisti s in the pro esses of interest hara terised by a ertain ross se tion.The pre ise measurement of the luminosity in the experiments is of ru ialimportan e, sin e the luminosity un ertainty translates dire tly to the un- ertainty of the ross se tion and hen e to the measurement of quark andgluon distributions.The luminosity is measured in ele tron-proton s attering using the rateof high energy photons from the bremsstrahlung pro ess, ep! ep . This isa pure QED pro ess, whi h has a high rate and a pre isely al ulable rossse tion. In the �rst phase of HERA a photon alorimeter [1℄ was used tomeasure the rate of bremsstrahlung photons. This alorimeter was positionedin the HERA tunnel about 100m downstream of the ZEUS experiment, wherethe ele tron and proton beams were separated. Bremsstrahlung photonsmoved through a straight va uum hamber and an aluminum exit windowbefore entering the photon alorimeter.After the ompletion of an upgrade program the HERA a elerator restartedoperations in 2001. The luminosity was steadily in reased rea hing a fa torof 5 times the one of the �rst HERA phase. The major hanges were stronger1In this paper, \ele tron" is meant to spe ify both ele tron or positron.2

beam fo using and slightly larger beam urrents. The physi s program wasextended to pro esses with lower ross se tion e.g., to explore the heavy avour ontent of the proton or to probe weak intera tions using in additionele tron beam polarisation.However, the earlier beam separation and stronger fo using of the beamled to more syn hrotron radiation and a larger rate of bremsstrahlung events,the latter resulting in a pile-up of more than one photon per bun h rossingin the photon alorimeter. To redu e the impa t of syn hrotron radiation onthe photon alorimeter, the thi kness of the arbon absorber blo ks installedin front of the photon alorimeter was in reased from 2 to 4 radiation lengths.A se ond luminometer, the spe trometer [2℄, was installed outside the syn- hrotron radiation one, to measure the luminosity using a di�erent dete torte hnique. Bremsstrahlung photons were measured after they onverted toele tron pairs in the exit window of the photon beam pipe. The onvertedele tron pair was spatially split by the magneti �eld of a dipole, and bothparti les were individually measured by two ele tromagneti alorimeters.The alorimeters were pla ed verti ally at suÆ iently large distan e fromthe photon beam not to be a�e ted by the dire t syn hrotron radiation andun onverted bremsstrahlung photons. The large ux of low energy ele tronsfrom syn hrotron photon intera tions in material upstream of the dipole mag-net was swept away from the alorimeters. The data rate in the spe trom-eter was, in omparison to photon alorimeter, onsiderably redu ed due tothe onversion probability of about 9% in the beam-pipe exit window and ahigher threshold on the photon energy. The fra tion of bun h rossings withmore than one photon reating depositions in the spe trometer approa hedonly a few per ent at the highest instantaneous luminosity.Utilising two independent luminosity measurements allowed a permanent omparison, whi h was important for tra ing ba k in real time dete tor mal-fun tions and to redu e systemati un ertainties.In this paper, we report on the operation of the photon alorimeter and spe -trometer in the data taking periods after the upgrade, des ribe the steps toobtain the luminosity from the raw data, and evaluate systemati un er-tainties of the luminosity measurement. Sin e the spe trometer was a newdevi e, more detailed studies are reported.3

2. Bremsstrahlung and Luminosity DeterminationThe energy spe trum of bremsstrahlung photons in the pro essep! ep (1)is given by Bethe and Heitler [3℄ in Born approximation negle ting the �nitesize of the proton as:d�dE = 4�r2e E 0eE Ee �EeE 0e + E 0eEe � 23��ln 4EpEeE 0empmeE � 12� ; (2)where � is the �ne stru ture onstant, re the lassi al ele tron radius, E the energy of the radiated photon, Ep and Ee are the proton and ele tronbeam energies, E 0e is the s attered ele tron energy, and mp and me are theproton and ele tron masses. For illustration the photon energy spe trum isshown in Figure 1 for an ele tron beam energy of 27.5GeV. Re ently one-loopQED radiative orre tions have been al ulated for the pro ess (1) [4℄. Theirimpa t on the ross se tion (2) and photon angular distribution is onsideredin se tion 7.1.2.The integrated luminosity is al ulated for a ertain data taking periodas: L = N A� ; (3)where N is the number of bremsstrahlung photons sele ted in a ertainenergy range over the period, and � is the bremsstrahlung ross-se tion inte-grated over the same energy range. The a eptan e, A, is the probability fora bremsstrahlung photon reated in the ep intera tion region to be observedin the luminometer. To estimate the a eptan e of the photon alorime-ter and the spe trometer detailed Monte Carlo simulations of both devi eswere done as des ribed in se tion 5.3. Photon Calorimeter and Spe trometerThe performan es of the photon alorimeter and the spe trometer werestudied in test-beams. The results are des ribed in detail in Refs. [1, 2℄.Both devi es were installed about 100 m downstream from the nominalintera tion point, IP, in the dire tion of the ele tron beam, as sket hed inFigure 2. 4

[GeV]γE
10 15 20 25
[m
b/G
eV
]γ
/dE
σd
0
2
4
6
Figure 1: The energy spe trum of bremsstrahlung photons obtained from Eqn.(2).window
92m
dipole
95m
SPEC
104m
filters
AERO
PCAL
107m
γ
e+
e−
Figure 2: The layout of the luminometers in the ZEUS experiment. The IP is on theleft side in the ZEUS dete tor. A dipole magnet just downstream of the beam-exit win-dow de e ted ele trons originating from onverted photons to the two ele tromagneti alorimeters of the spe trometer SPEC. PCAL denotes the photon alorimeter and �ltersthe arbon absorber blo ks. AERO are Cerenkov ounters not used for the luminositymeasurement.5
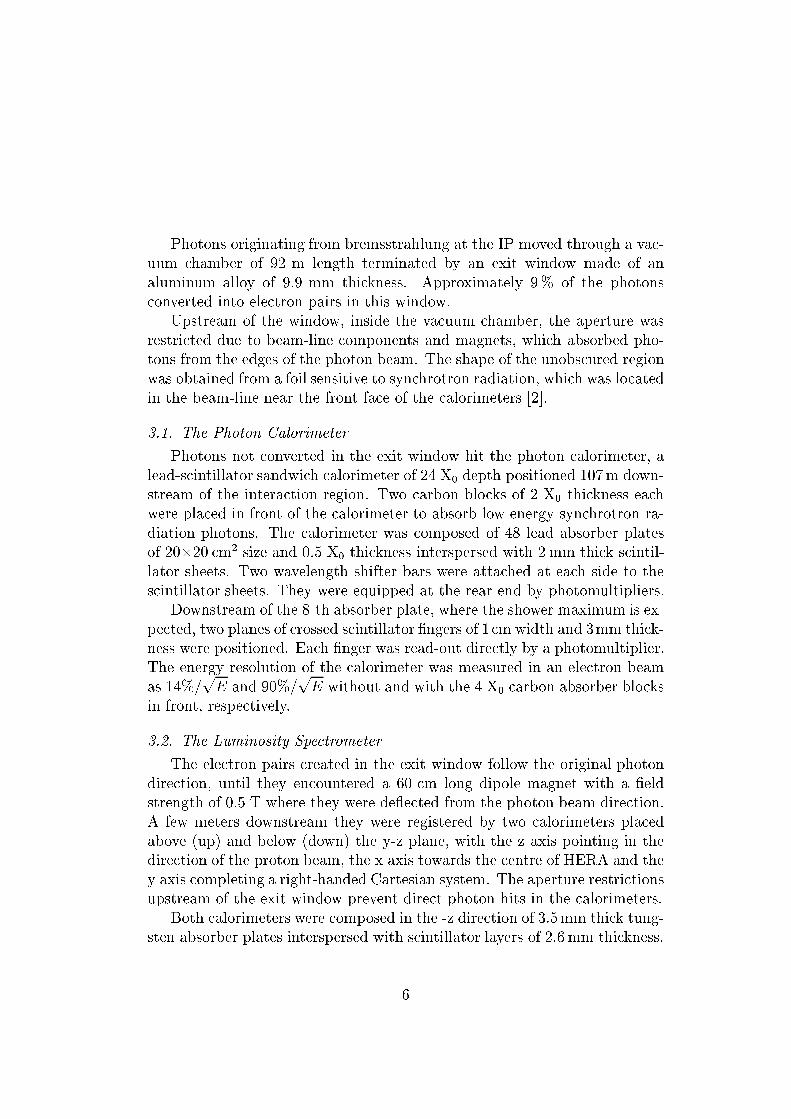
Photons originating from bremsstrahlung at the IP moved through a va -uum hamber of 92 m length terminated by an exit window made of analuminum alloy of 9.9 mm thi kness. Approximately 9% of the photons onverted into ele tron pairs in this window.Upstream of the window, inside the va uum hamber, the aperture wasrestri ted due to beam-line omponents and magnets, whi h absorbed pho-tons from the edges of the photon beam. The shape of the unobs ured regionwas obtained from a foil sensitive to syn hrotron radiation, whi h was lo atedin the beam-line near the front fa e of the alorimeters [2℄.3.1. The Photon CalorimeterPhotons not onverted in the exit window hit the photon alorimeter, alead-s intillator sandwi h alorimeter of 24 X0 depth positioned 107m down-stream of the intera tion region. Two arbon blo ks of 2 X0 thi kness ea hwere pla ed in front of the alorimeter to absorb low energy syn hrotron ra-diation photons. The alorimeter was omposed of 48 lead absorber platesof 20�20 m2 size and 0.5 X0 thi kness interspersed with 2 mm thi k s intil-lator sheets. Two wavelength shifter bars were atta hed at ea h side to thes intillator sheets. They were equipped at the rear end by photomultipliers.Downstream of the 8-th absorber plate, where the shower maximum is ex-pe ted, two planes of rossed s intillator �ngers of 1 m width and 3mm thi k-ness were positioned. Ea h �nger was read-out dire tly by a photomultiplier.The energy resolution of the alorimeter was measured in an ele tron beamas 14%/pE and 90%/pE without and with the 4 X0 arbon absorber blo ksin front, respe tively.3.2. The Luminosity Spe trometerThe ele tron pairs reated in the exit window follow the original photondire tion, until they en ountered a 60 m long dipole magnet with a �eldstrength of 0.5 T where they were de e ted from the photon beam dire tion.A few meters downstream they were registered by two alorimeters pla edabove (up) and below (down) the y-z plane, with the z axis pointing in thedire tion of the proton beam, the x axis towards the entre of HERA and they axis ompleting a right-handed Cartesian system. The aperture restri tionsupstream of the exit window prevent dire t photon hits in the alorimeters.Both alorimeters were omposed in the -z dire tion of 3.5mm thi k tung-sten absorber plates interspersed with s intillator layers of 2.6 mm thi kness.6

Ea h layer was divided into strips of 7.9 mm width. The strips were al-ternately verti ally and horizontally mounted, providing an x and y positionmeasurement of a shower. The s intillator strips of ea h orientation were on-ne ted sequentially in the z dire tion to one wavelength shifter bar equippedwith a photomultiplier, forming a readout hannel. Ea h alorimeter had 16 hannels in x dire tion. In y dire tion, the down alorimeter had 15 hannelsand the up alorimeter 11 hannels. The latter is due to the limited spa ebetween the photon beam and the proton beam pipe. The alorimeters,both with a longitudinal depth of 24 X0, were alibrated in an ele tron beamwith energies between 1 and 6 GeV. The energy resolution and alibrationun ertainty were measured as 17%/pE and 0.5%, respe tively.3.3. Data A quisition and Data StorageThe data a quisition system, DAQ [5℄, ommon for the photon alorime-ter and the spe trometer, was independent from the ZEUS entral DAQ.This allowed pro essing of large data samples, ne essary for the luminositymeasurement, without a�e ting the entral DAQ performan e. Signals fromea h photomultiplier were digitised by 12{bit ash ADCs and transferred tofour memory boards, MB, after ea h bun h rossing. To orre t for pedestals,the ADC values stored from the previous bun h rossing were subtra ted.3.3.1. The Photon Calorimeter Spe i� PartThe digitised signals from the two photomultipliers were averaged and onverted into energy using alibration onstants obtained as des ribed inse tion 4.1. Rates of events were ounted on-line with energy thresholds of10 GeV and 17 GeV for pilot bun hes2 and olliding bun hes. In addition,total rates and rates for olliding bun hes were re orded for energy thresholdsof 7.5GeV, 12GeV and 16.5GeV, respe tively. These rates were used to ross he k the orre tions applied for pile-up of more than one bremsstrahlungphoton per bun h rossing in the luminosity measurement. For ea h run aspe ial re ord is written ontaining pedestals, signals from light test-pulses,on-line event rates, ele tron and proton urrents in HERA and the a tivetime of the ZEUS experiment. The signals from the s intillator �ngers weredigitised and re orded to monitor the photon shower position.2Pilot ele tron bun hes have no orresponding proton bun hes and hen e an be usedto measure ba kground rates. 7
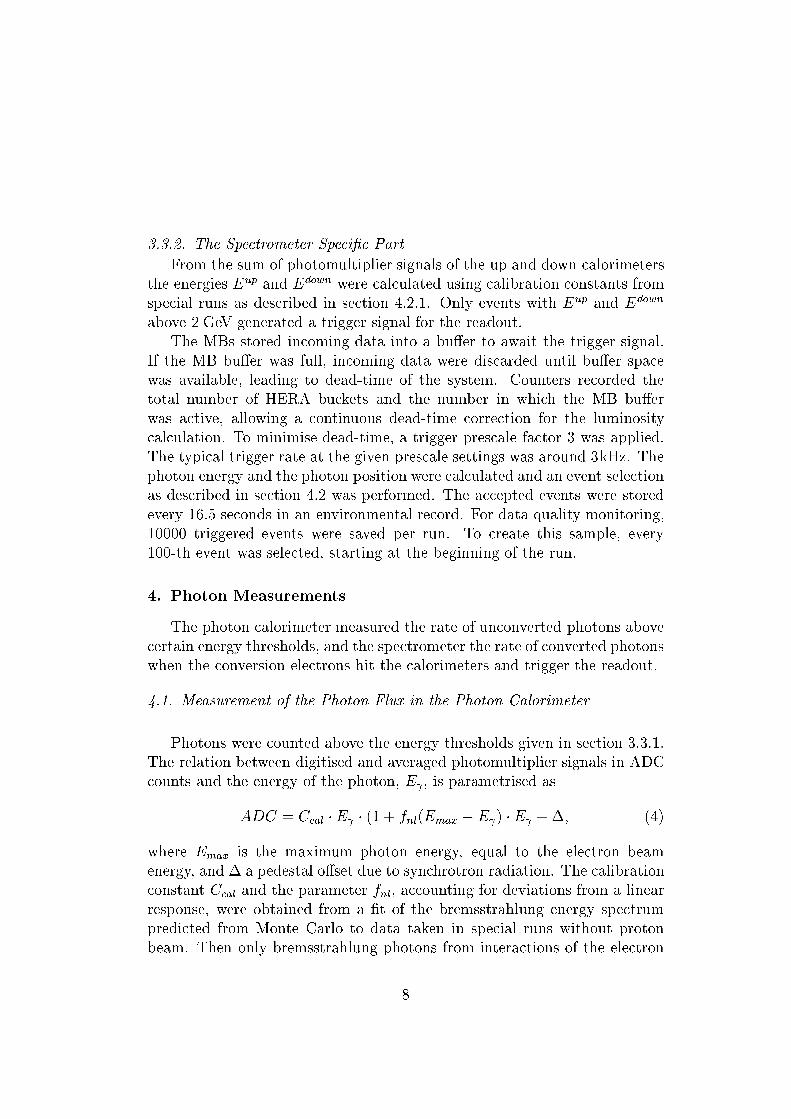
3.3.2. The Spe trometer Spe i� PartFrom the sum of photomultiplier signals of the up and down alorimetersthe energies Eup and Edown were al ulated using alibration onstants fromspe ial runs as des ribed in se tion 4.2.1. Only events with Eup and Edownabove 2 GeV generated a trigger signal for the readout.The MBs stored in oming data into a bu�er to await the trigger signal.If the MB bu�er was full, in oming data were dis arded until bu�er spa ewas available, leading to dead-time of the system. Counters re orded thetotal number of HERA bu kets and the number in whi h the MB bu�erwas a tive, allowing a ontinuous dead-time orre tion for the luminosity al ulation. To minimise dead-time, a trigger pres ale fa tor 3 was applied.The typi al trigger rate at the given pres ale settings was around 3kHz. Thephoton energy and the photon position were al ulated and an event sele tionas des ribed in se tion 4.2 was performed. The a epted events were storedevery 16.5 se onds in an environmental re ord. For data quality monitoring,10000 triggered events were saved per run. To reate this sample, every100-th event was sele ted, starting at the beginning of the run.4. Photon MeasurementsThe photon alorimeter measured the rate of un onverted photons above ertain energy thresholds, and the spe trometer the rate of onverted photonswhen the onversion ele trons hit the alorimeters and trigger the readout.4.1. Measurement of the Photon Flux in the Photon CalorimeterPhotons were ounted above the energy thresholds given in se tion 3.3.1.The relation between digitised and averaged photomultiplier signals in ADC ounts and the energy of the photon, E , is parametrised asADC = C al � E � (1 + fnl(Emax � E ) � E +�; (4)where Emax is the maximum photon energy, equal to the ele tron beamenergy, and � a pedestal o�set due to syn hrotron radiation. The alibration onstant C al and the parameter fnl, a ounting for deviations from a linearresponse, were obtained from a �t of the bremsstrahlung energy spe trumpredi ted from Monte Carlo to data taken in spe ial runs without protonbeam. Then only bremsstrahlung photons from intera tions of the ele tron8
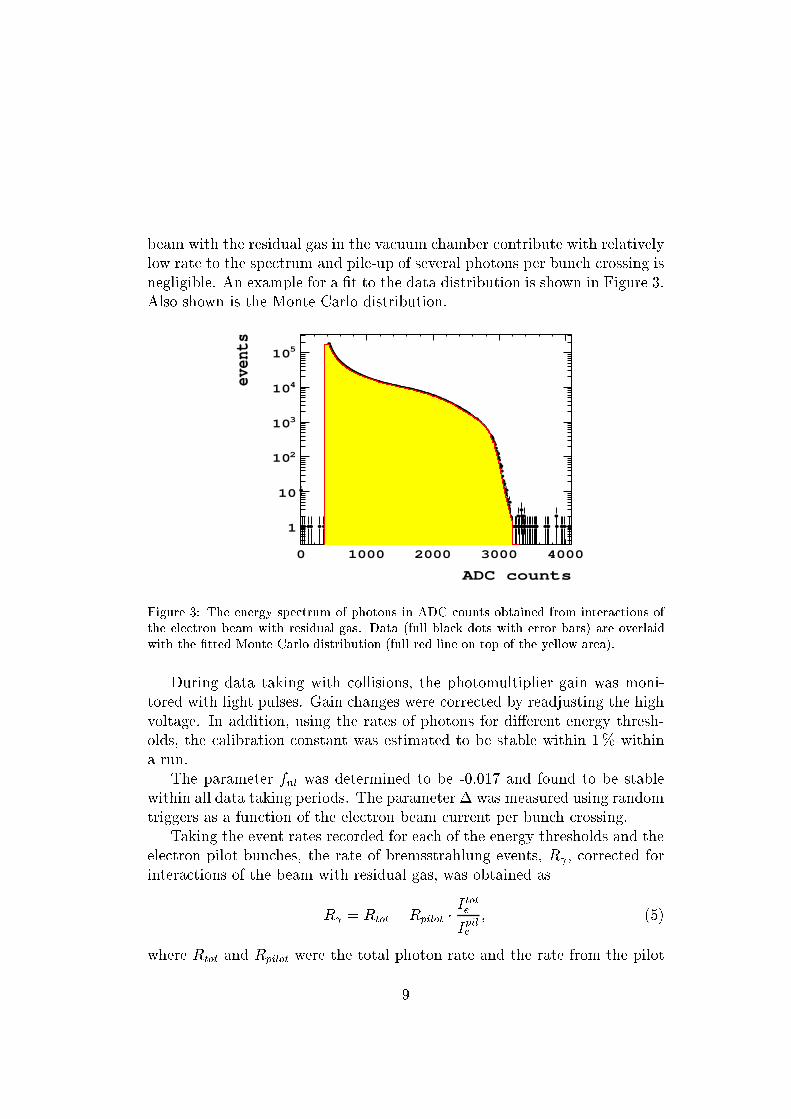
beam with the residual gas in the va uum hamber ontribute with relativelylow rate to the spe trum and pile-up of several photons per bun h rossing isnegligible. An example for a �t to the data distribution is shown in Figure 3.Also shown is the Monte Carlo distribution.
ADC counts
0 1000 2000 3000 4000
even
ts
1
10
210
310
410
510
Figure 3: The energy spe trum of photons in ADC ounts obtained from intera tions ofthe ele tron beam with residual gas. Data (full bla k dots with error bars) are overlaidwith the �tted Monte Carlo distribution (full red line on top of the yellow area).During data taking with ollisions, the photomultiplier gain was moni-tored with light pulses. Gain hanges were orre ted by readjusting the highvoltage. In addition, using the rates of photons for di�erent energy thresh-olds, the alibration onstant was estimated to be stable within 1% withina run.The parameter fnl was determined to be -0.017 and found to be stablewithin all data taking periods. The parameter � was measured using randomtriggers as a fun tion of the ele tron beam urrent per bun h rossing.Taking the event rates re orded for ea h of the energy thresholds and theele tron pilot bun hes, the rate of bremsstrahlung events, R , orre ted forintera tions of the beam with residual gas, was obtained asR = Rtot � Rpilot � I toteIpile ; (5)where Rtot and Rpilot were the total photon rate and the rate from the pilot9

bun hes, and I tote and Ipile the total and the pilot-bun h ele tron urrents,respe tively.At high photon rates more than one photon from a single bun h rossingmay have hit the alorimeter. The average number of photons per bun h rossing, �n , was estimated to be�n = R � �b�(E > Etres:) � fr �N b ; (6)where �b and �(E > Etres:) are the total bremsstrahlung ross se tion3and the bremsstrahlung ross se tion above an energy threshold Etres:, fr isthe HERA orbit frequen y and N b the number of olliding bun hes. Thebremsstrahlung rate orre ted for multiple photons per bun h rossing wasthen R0 = R � (1 + P (Etres:; �n )); (7)where the orre tion term P(Etres:; �n ) was determined from Monte Carlosimulations.4.2. Measurement of the Photon Flux in the Spe trometer4.2.1. Position and Energy Measurement of Ele trons and Photons in theSpe trometerAt nominal magneti �eld, ele trons with energies above 3.5 GeV hit the alorimeters. Events with ele trons measured in both alorimeters were usedto re onstru t the energy and transverse oordinates of the onverted photon.To minimise the impa t of noise, only 4 strips near the shower maximumwere used for the ele tron energy measurement. The measurement was or-re ted for transverse energy leakage, a small e�e t ex ept at the edges of the alorimeter, and the light attenuation in s intillators. The photon energywas al ulated as the sum of ele tron energies.The shower position was al ulated as the energy-weighted average inx and y. Only hannels with an energy above 60 MeV were used. Thephoton oordinates, X and Y , were obtained from the position and en-ergy measurements of the individual ele trons, taking into a ount ele tronde e tion by the dipole magnet.3�b was al ulated for photons with energies above 0.1GeV, being the energy thresholdof the alorimeter 10

The alorimeters were routinely alibrated to take into a ount gain vari-ations due to radiation damage and re overy me hanisms in the s intillatorsand wavelength shifter bars. Spe ial runs were taken with an adjustableslit ollimator inserted into the photon beam to sele t a ertain y position.Using the bending power of the dipole magnet a dire t relation betweenthe ele tron energy and the y position of the shower in the alorimeter wasobtained. Data taken in this on�guration were used to determine the indi-vidual hannel gains iteratively. After ea h step gains were varied to mat hthe predi ted energy and y position. The pro edure onverged after a smallnumber of steps.4.2.2. Event sele tionThe depositions in the spe trometer of a typi al triggered event are shownin Figure 4. After the re onstru tion of the energy and position of the showersin ea h alorimeter the following sele tion riteria were imposed:� The re onstru ted energy for ea h alorimeter must be larger than3.5 GeV to suppress noise.� The largest energy depositions must not be at the edge strips in ea hof the four planes to minimise leakage, thus ensuring good energy andposition re onstru tion.� The y position of a shower in the down dete tor was restri ted to makethe �du ial regions of up and down alorimeters equal.� The rms width of the shower must be less than 1 m for ea h of the fourproje tions (rms- ut) to reje t hadron showers from proton intera tionswith the residual gas.The last requirement was applied only in the data taking periods 2005 and2006 with ele tron beam. It aused severe event loss due to depositions fromsyn hrotron radiation at the inner edges of the y-plane. This loss of eventswas orre ted for using the 10000 event sample re orded at the beginning ofea h run [6℄. In data taking periods with positron beams in 2006 and 2007the last requirement was omitted, sin e the fra tion of hadron showers in thespe trometer was estimated to be negligible using runs with only protons inthe ollider.About half of the triggered events passed the requirements. The re on-stru ted photon oordinates, X and Y and the photon energy were stored11

channelupX0 5 10 15
En
erg
y [G
eV
]
0
1
2
channelupY0 5 10
En
erg
y [G
eV
]
0
0.5
1
1.5
channeldnX
0 5 10 15
En
erg
y [G
eV
]
0
0.5
1
1.5
channeldnY
0 5 10 15
En
erg
y [G
eV
]
0
0.5
1
1.5
2
Figure 4: A spe trometer event with an ele tron pair oin iden e. The energy depositionper hannel in the x (left) and y (right) dire tions for the up (top) and down (bottom) alorimeters. Negative energy in several hannels result from the subtra tion of the storedADC values of the previous bun h rossing.into histograms for ea h environmental re ord. The mean photon beam posi-tion and width were al ulated at the exit window. From the moments of theX and Y distributions and the orrelation oeÆ ient <X Y > the pho-ton beam ellipse and its tilt were determined. The number of photons was ounted and orre ted for intera tions of the beam with the residual gas usingEqn.(5). The raw data of the environmental re ord were then dis arded.5. Monte Carlo Simulations to Determine the A eptan esThe a eptan es of the photon alorimeter and spe trometer were deter-mined by Monte Carlo simulations using the GEANT 3.21 pa kage. Photons12

were generated a ording to the bremsstrahlung spe trum as given in Eqn.(2)taking into a ount the ele tron beam angular divergen e. They were thenrandomly distributed in a suÆ iently large area of the (x,y) plane at thez-position of the exit window. Using beam pro�les measured by the spe -trometer as des ribed in se tion 4.2.2 and the aperture limits of the va uum hamber, a weight was applied to ea h photon. Only photons generatedinside the measured aperture were tra ked to the luminometers.5.1. Photon Calorimeter SimulationPhotons with an energy larger than Emin = 0.1 GeV not onverted in thebeam exit window or air were transported to the photon alorimeter and ashower was simulated. The energy deposited in the s intillators and s intilla-tor �ngers was re orded for shower energy and position re onstru tion. Thelight olle tion and the impa t of the readout ele troni s was parametrisedusing test-beam data.A dete tor response fun tion F (E al) was al ulated as a fun tion of thephoton energy E ,F (E al) = 1=�b � Z Ee�meEmin d�dE P (E ; E al)dE ; (8)with P (E ; E al) being the probability that for an in ident photon withan energy E the energy E al was measured in the alorimeter and �b thebremsstrahlung ross se tion integrated from Emin to the upper kinemati limit. Using the dete tor response fun tion the ross se tion, �thr, for photonswith a measured energy above a threshold, Ethr, is obtained,�thr(Ethr) = �b Z 1Ethr F (E al)dE al: (9)The a eptan e A is the number of events above a given energy threshold,Nthr, divided by the generated number of events, Ngen,A = NthrNgen = Z 1Ethr F (E al)dE al: (10)5.2. Spe trometer SimulationThe generated photons were onverted in the exit window. The ele tronswere transported to the alorimeters using a parametrised �eld map of the13

dipole and taking into a ount intera tions in the exit window and in air.Showers were simulated in the alorimeters and the energy depositions in thes intillator tiles were transformed into signals of the photomultipliers. Thesimulated events were subje t to the re onstru tion and sele tion as des ribedin se tion 4.2 and a epted events were used to to al ulate X and Y , andthe energy of the photon, E . This sample was then used to al ulate thea eptan e for every environmental re ord. Assuming a Gaussian shapedphoton beam and taking into a ount the orrelations between X and Y determined from data, the events were re-weighted to �t to the measuredX and Y distribution. An example of the result is shown in Figure 5.The a eptan e was then al ulated as the ratio of the sum of a eptedand generated Monte Carlo event weights. A typi al value of the averagea eptan e is 0.65% for E > 8 GeV with a maximum of 2% at 22 GeV.6. Luminosity Measurement6.1. Calorimeter Pro edureThe ounter rates with the energy thresholds de�ned in se tion 3.3.1 were orre ted for intera tion of the ele tron beam with residual gas in the va uumand pile-up using Eqn. (5) and Eqn. (7) and summed up to N as de�ned inEqn. (3). For ea h energy threshold a value for the luminosity was obtained.Finally a orre tion for the ZEUS a tive time was applied.6.2. Spe trometer Pro edureThe number of photons was ounted in ea h environmental re ord ap-plying the riteria given in se tion 4.2.2. The integrated luminosity was al ulated using Eqn. (3) and orre ted for dead times of the ZEUS andthe spe trometer DAQ systems. The impa t of pile-up due to onversionof more than one photon per bun h rossing was estimated as des ribed inthe Appendix. The number of photons obtained after applying the sele -tion riteria is slightly larger than the true number. A orre tion, as shownin Figure 6 as a fun tion of a quantity r, is applied, where r is the fra tion of olliding bun hes with a bremsstrahlung event passing the sele tion riteria.The orre tion, rea hing 0.4% at r = 0.0015, orresponding to the maximalinstantaneous luminosity measured at HERA, was applied to the measuredluminosity of ea h environmental re ord.14

[cm]γX
-6 -4 -2 0 2 4 6
Eve
nts
1
10
210
310
[cm]γY
-6 -4 -2 0 2 4 6E
ven
ts
1
10
210
310
Figure 5: The re onstru ted x (left) and y-positions (right) of a epted photons in the spe -trometer olle ted in one environmental re ord. Dots with error bars are data and thehistogram is the Monte Carlo predi tion.
r
0 0.0005 0.001 0.0015
[%
]m
ea
s)/
Lm
ea
s-L
tru
e(L
-0.4
-0.3
-0.2
-0.1
0
Figure 6: Luminosity shift due to pile-up as a fun tion of the fra tion of olliding bun heswith a bremsstrahlung event passing the sele tion riteria. The shown range of r orre-sponds to the experimental situation. The simulation was performed for the photon beamwith average parameters.15

7. Systemati E�e ts in the Luminosity Measurement7.1. Systemati s Common to the Photon Calorimeter and the Spe trometer7.1.1. A eptan eThe estimation of the un ertainty in the a eptan e holds for both the pho-ton alorimeter and the spe trometer. The shape of the aperture area andits alignment relative to the dete tors were ea h measured to an a ura yof 1 mm. A variation of these quantities by 1 mm shifted the values of thea eptan e within 1%.The variation of the a eptan e as a fun tion of the photon beam positionwas studied using neutral urrent events sele ted in the ZEUS dete tor. Forthe 2004/06 ele tron beam and the 2006/07 positron beam independent anal-yses were done using samples of neutral urrent events with Q2 > 185 GeV2.This pro ess has a high rate and is not expe ted to have any ommon sys-temati s with the luminosity measurement. Details of the event sele tion riteria an be found in Ref.[7℄.The ratio between the rate of neutral urrent events and the luminositymeasured with the spe trometer is shown in Figure 7 (left) as a fun tion ofthe x position of the photon beam, X , and in Figure 8 (left) as a fun tion ofthe y position of the photon beam, Y for data taken with a positron beam.The ratio as a fun tion of X exhibits a slope of (�5:9 � 4:2)� 10�2 m�1whereas no dependen e on Y is observed.Also shown in the right �gures is the distribution of photons used inthe luminosity measurement as a fun tion of X and Y , normalised to theintegrated luminosity. A �t with a Gaussian to the distribution shown inFigure 7 (right) results in a mean value of -0.5 mm and a width of 1.9 mm.The systemati un ertainty of the luminosity is estimated as the variationwithin the width as 1.1%.The same study using data taken with the ele tron beam results in asystemati un ertainty of 1.2%.The impa t of the event rate on the luminosity measurement was inves-tigated using the ratio between neutral urrent events and the luminositymeasured by the spe trometer as a fun tion of the produ t of the ele tronand proton urrents. These urrents are measured with other devi es, andtheir produ t is proportional to the luminosity. Using the same te hniqueas des ribed above a systemati un ertainty of 0.6% was estimated for datataken with positron beam. No impa t was observed for data taken withele tron beam. 16
[mm]γX
-6 -4 -2 0 2 4
[n
b]
SP
EC
eve
nts
/L
1.5
2
2.5
[mm]γX
-5 0 5]
-1 [
pb
SP
EC
L0
5
10
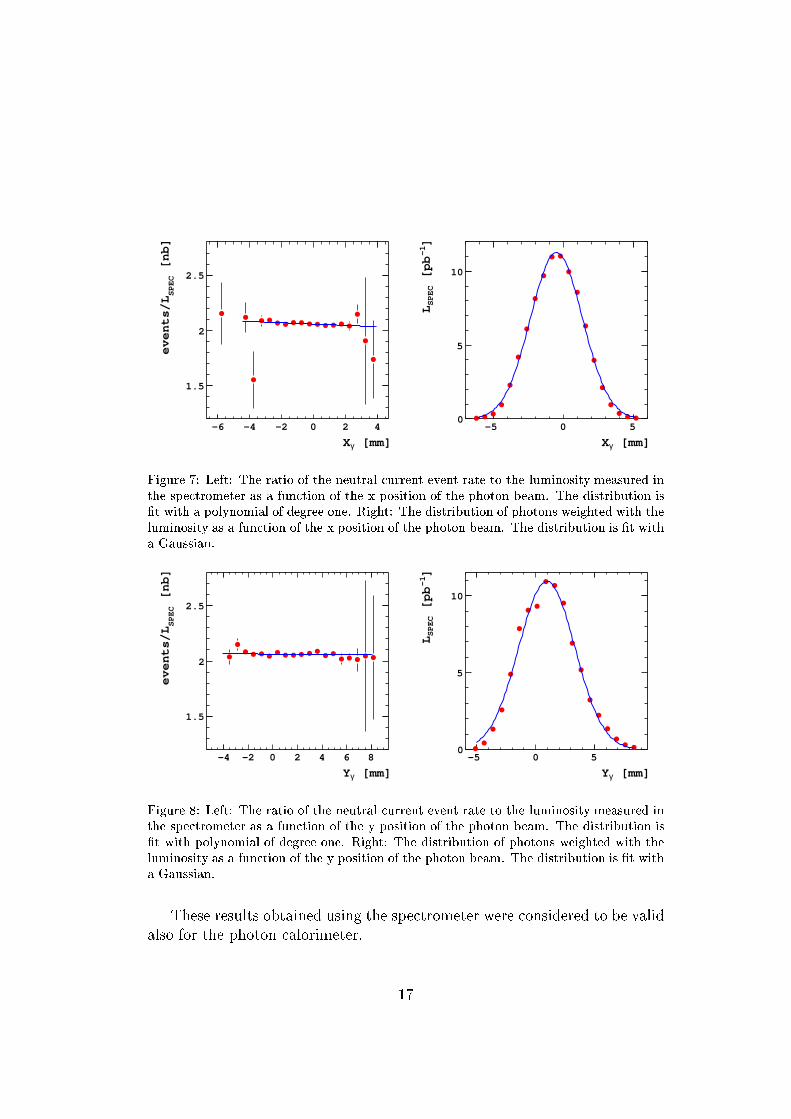
Figure 7: Left: The ratio of the neutral urrent event rate to the luminosity measured inthe spe trometer as a fun tion of the x position of the photon beam. The distribution is�t with a polynomial of degree one. Right: The distribution of photons weighted with theluminosity as a fun tion of the x position of the photon beam. The distribution is �t witha Gaussian.
[mm]γY
-4 -2 0 2 4 6 8
[n
b]
SP
EC
eve
nts
/L
1.5
2
2.5
[mm]γY
-5 0 5
]-1
[p
bS
PE
CL
0
5
10
Figure 8: Left: The ratio of the neutral urrent event rate to the luminosity measured inthe spe trometer as a fun tion of the y position of the photon beam. The distribution is�t with polynomial of degree one. Right: The distribution of photons weighted with theluminosity as a fun tion of the y position of the photon beam. The distribution is �t witha Gaussian.These results obtained using the spe trometer were onsidered to be validalso for the photon alorimeter. 17

7.1.2. Theory Un ertaintyThe formula given in Eqn.(2) for the bremsstrahlung ross se tion as afun tion of the photon energy is obtained in the Born approximation negle t-ing the �nite size of the proton. Re ently the pro ess has been al ulatedin luding one-loop QED radiative orre tions and proton form-fa tors [4℄.The in lusion of the one-loop QED orre tions auses a small redu tion inthe photon energy spe trum at the high energy limit of the a eptan e. Theangular spread of the photon momenta obtained from this al ulation is byan order of magnitude smaller than the divergen e of the ele tron beam inZEUS. The impa t of both e�e ts on the luminosity measurement is negligi-ble.7.1.3. Summary of Common Systemati Un ertaintiesA summary of the systemati un ertainties ommon to the Photon Calorime-ter and the Spe trometer is given in Table 1.Table 1: The systemati s un ertainties of the luminosity measurement ommon to thephoton alorimeter and the spe trometer for ele tron and positron beams. All values in%. Sour e of systemati s 2005/2006 e�p 2006/2007 e+paperture and 1 1dete tor alignmentx-position of the 1.2 1.1photon beambeam urrents - 0.6sum 1.6 1.67.2. Photon CalorimeterThe systemati un ertainties originating from the alibration of the pho-ton alorimeter and multiple photon hits were onsidered.7.2.1. Pedestal Shifts and Calibration ConstantsIn the alibration of the photon alorimeter an o�set � due to syn hrotronradiation in the photomultiplier signal was taken into a ount. The syn- hrotron radiation was measured with random triggers of bun h rossings18

and parametrised as a fun tion of the ele tron beam urrent. Values forpedestal shifts of 0.20 MeV/�A and 0.08 MeV/�A were obtained for ele -tron and positron beams, respe tively. The impa t of a remaining pedestalun ertainty of 85 MeV and the un ertainty on the alibration onstant wastranslated in an un ertainty of the luminosity measurement. The ombina-tion of both e�e ts lead to a systemati un ertainty of 1.5%.7.2.2. Multiple Photon HitsThe luminosities obtained for several energy thresholds were orre tedfor pile-up using Eqn.(7). The di�eren es of the values obtained for severalenergy thresholds were distributed as a fun tion of the average number ofphotons per bun h rossing. From their variation a systemati un ertaintyof 0.5% was estimated.7.3. Spe trometerAs additional sour es of systemati un ertainties spe i� for the spe -trometer the proton beam intera tions with residual gas in the beam-pipe,potentially reating depositions in the alorimeters, and the onversion prob-ability in the beam exit window were onsidered.7.3.1. Impa t of Proton Beam Intera tions with Residual Gas in the Beam-pipeData was olle ted when only protons were ir ulating in HERA to esti-mate the ontribution of ba kground from intera tions of the proton beamwith residual gas in the beam-pipe. The event sele tion riteria, des ribedin se tion 4.2.2, were applied. The event rate without applying the rms- utwas 0.1 Hz. The typi al event rate for bremsstrahlung events was 10-15 kHzat the beginning of a �ll. Hen e the fra tion of events from proton{residualgas intera tions in the data is about 10�5.The e�e t on the luminosity measurement due to pile-up of a protonshower in the up alorimeter and an ele tron shower in the down alorime-ter was estimated from the data to be less than 10�6 at standard va uum onditions.7.3.2. Photon Conversion CoeÆ ient in the Beam Exit WindowThe beam exit window, where about 9% of the photons were expe tedto onvert, onsists of an aluminum alloy. After the shutdown of HERA thewindow has been dismounted and its thi kness and omposition measured.19

For the thi kness 9.9 � 0.01 mm was obtained. The hemi al omposition ofthe beam exit window was determined by two laboratories using mass spe -tros opy. The measurements are summarised in Table 2. Although there areTable 2: The hemi al omposition of the beam exit window measured in two laboratoriesand the photon onversion oeÆ ient �pair for photons of 20GeV in the elements ontained.Element Z �pair m�1 fra tion, % (lab1) fra tion, % (lab2)Mg 12 0.0528 0.318 0.344Al 13 0.0858 81.790 86.200Si 14 0.0815 14.765 10.300Fe 26 0.4385 0.227 0.260Cu 29 0.5342 2.433 2.400Zn 30 0.4397 0.338 0.365average � 0.0984 0.0986di�eren es of up to several per ent in the hemi al ompositions measuredin two laboratories, the average photon onversion oeÆ ients at 20 GeV areequal within 2.3 per mille. In the following the measurements of lab2 areused. The photon onversion oeÆ ient is a fun tion of the energy. In Fig-
[GeV]γE1 10
]-1
[cm
pa
irµ
0.08
0.082
0.084
0.086
0.088
GEANT
NIST
Figure 9: The photon onversion oeÆ ient of aluminum as a fun tion of the photonenergy. The full red dots are obtained from the parametrisation in GEANT4 and the opendots from tables published by NIST. 20

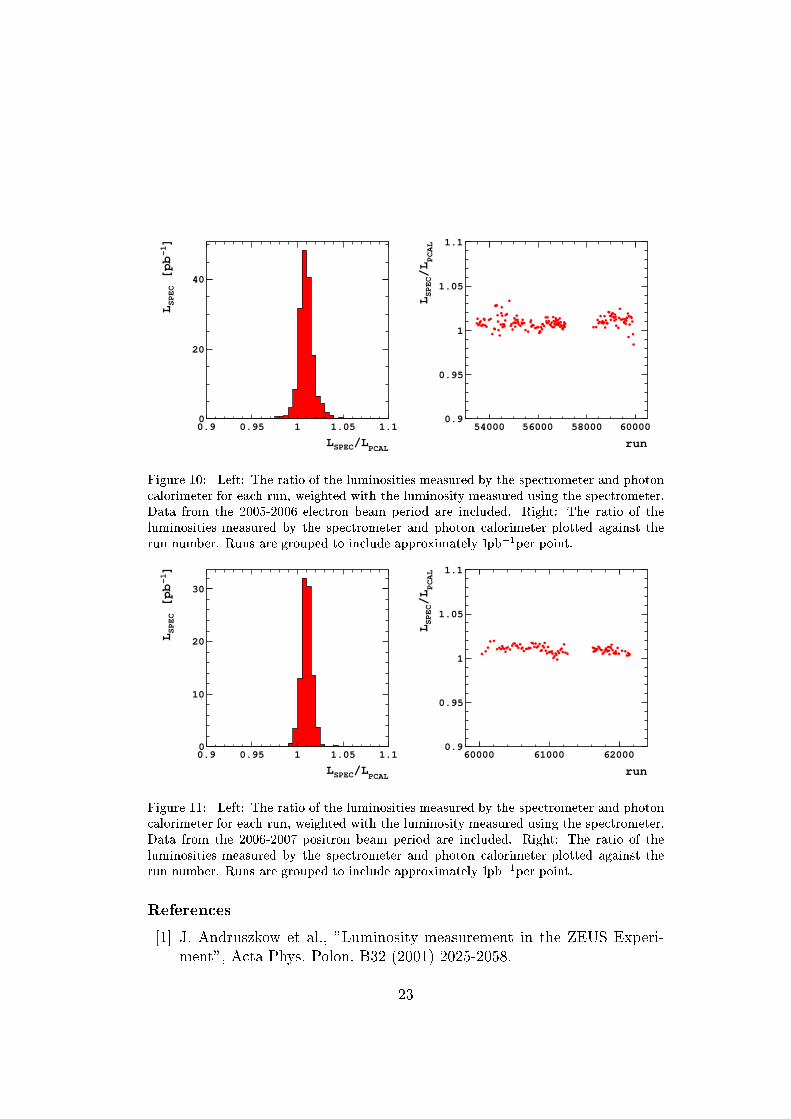
ure 9 its parametrisation used in GEANT4 is ompared with the values fromthe NIST [8℄ data base for aluminum being the largest element fra tion inthe exit window. In the relevant energy range around 20 GeV the di�eren ein the onversion oeÆ ient approa hes 1%.For the a eptan e al ulation the values from the NIST database areused. The un ertainty of the luminosity resulting from the photon onversion oeÆ ient in the beam exit window is estimated to be 0.7%. The dominant ontribution originates from the un ertainty of the ross se tion measuredat 1.5 GeV [9℄ used in the NIST database and its extrapolation to 20 GeV.The un ertainty of the thi kness ontributes with 0.1% and the un ertaintyof the hemi al omposition with 0.3%.7.4. Summary of the Systemati Un ertaintiesThe systemati un ertainties estimated for the photon alorimeter werethe same for ele tron and positron beams. The un ertainty not ommon withthe un ertainties of the spe trometer results to 1.6%.The systemati un ertainties obtained for the spe trometer are estimatedfor ele tron and positron beams separately. The un ertainty not ommonwith the photon alorimeter amounts to 0.9%. A summary is given in Table3. Averaging the systemati un ertainties not ommon between photon alorime-ter and spe trometer and adding it in quadrature to the ommon systemati un ertainty leads to a total systemati un ertainty of the luminosity measure-ment of 1.7%.8. Comparison of the Luminosities Measured with the Calorimeterand Spe trometerThe distribution of the ratio between the luminosity values obtained forea h run from the spe trometer and the photon alorimeter is shown in Fig-ure 10 (left) for data taken with ele tron beam and in Figure 11 (left) fordata taken with positron beam.Very good agreement between the two measurements is found. The distri-butions of the ratios have nearly Gaussian shape with a mean value of 1.01both for the ele tron and positron data.4GEANT3 and GEANT4 use the same ross se tion parametrisation.21
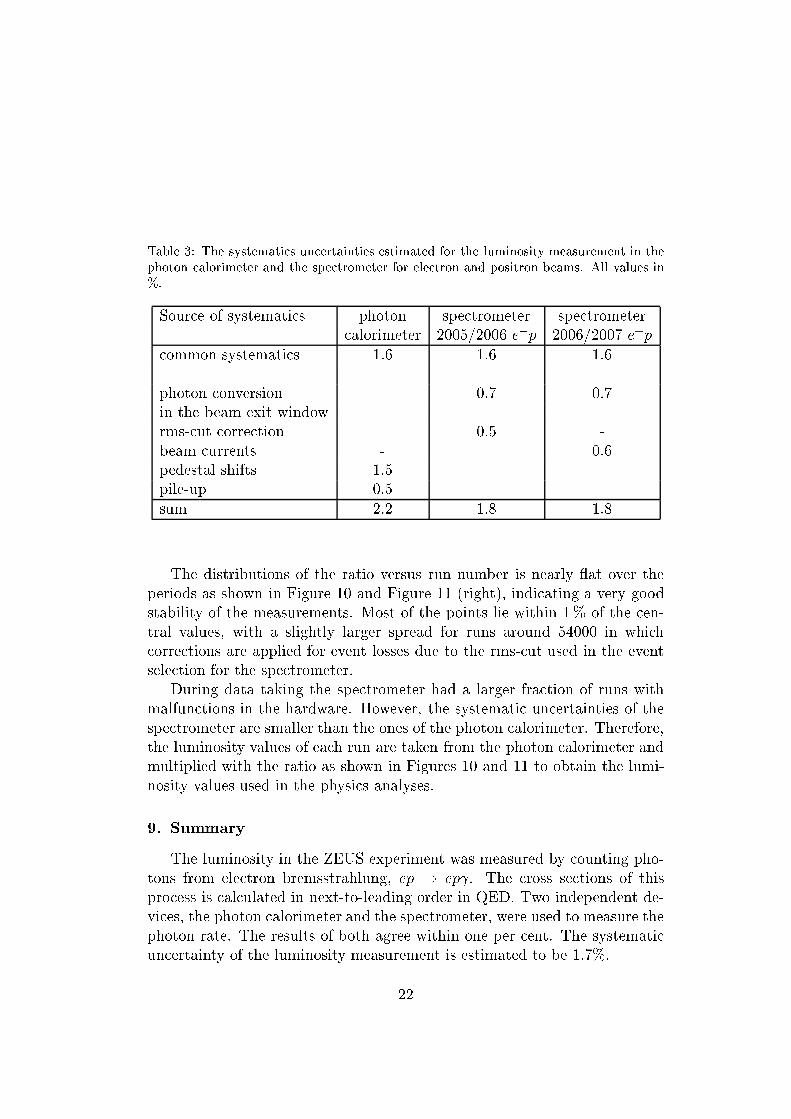
Table 3: The systemati s un ertainties estimated for the luminosity measurement in thephoton alorimeter and the spe trometer for ele tron and positron beams. All values in%.Sour e of systemati s photon spe trometer spe trometer alorimeter 2005/2006 e�p 2006/2007 e+p ommon systemati s 1.6 1.6 1.6photon onversion 0.7 0.7in the beam exit windowrms- ut orre tion 0.5 -beam urrents - 0.6pedestal shifts 1.5pile-up 0.5sum 2.2 1.8 1.8The distributions of the ratio versus run number is nearly at over theperiods as shown in Figure 10 and Figure 11 (right), indi ating a very goodstability of the measurements. Most of the points lie within 1% of the en-tral values, with a slightly larger spread for runs around 54000 in whi h orre tions are applied for event losses due to the rms- ut used in the eventsele tion for the spe trometer.During data taking the spe trometer had a larger fra tion of runs withmalfun tions in the hardware. However, the systemati un ertainties of thespe trometer are smaller than the ones of the photon alorimeter. Therefore,the luminosity values of ea h run are taken from the photon alorimeter andmultiplied with the ratio as shown in Figures 10 and 11 to obtain the lumi-nosity values used in the physi s analyses.9. SummaryThe luminosity in the ZEUS experiment was measured by ounting pho-tons from ele tron bremsstrahlung, ep ! ep . The ross se tions of thispro ess is al ulated in next-to-leading order in QED. Two independent de-vi es, the photon alorimeter and the spe trometer, were used to measure thephoton rate. The results of both agree within one per ent. The systemati un ertainty of the luminosity measurement is estimated to be 1.7%.22
PCAL/LSPECL
0.9 0.95 1 1.05 1.1
]-1
[p
bS
PE
CL
0
20
40
run
54000 56000 58000 60000P
CA
L/L
SP
EC
L0.9
0.95
1
1.05
1.1
Figure 10: Left: The ratio of the luminosities measured by the spe trometer and photon alorimeter for ea h run, weighted with the luminosity measured using the spe trometer.Data from the 2005-2006 ele tron beam period are in luded. Right: The ratio of theluminosities measured by the spe trometer and photon alorimeter plotted against therun number. Runs are grouped to in lude approximately 1pb�1per point.
PCAL/LSPECL
0.9 0.95 1 1.05 1.1
]-1
[p
bS
PE
CL
0
10
20
30
run
60000 61000 62000
PC
AL
/LS
PE
CL
0.9
0.95
1
1.05
1.1
Figure 11: Left: The ratio of the luminosities measured by the spe trometer and photon alorimeter for ea h run, weighted with the luminosity measured using the spe trometer.Data from the 2006-2007 positron beam period are in luded. Right: The ratio of theluminosities measured by the spe trometer and photon alorimeter plotted against therun number. Runs are grouped to in lude approximately 1pb�1per point.Referen es[1℄ J. Andruszkow et al., "Luminosity measurement in the ZEUS Experi-ment", A ta Phys. Polon. B32 (2001) 2025-2058.23

[2℄ M. Helbi h et al., "The Spe trometer system for measuring ZEUS lu-minosity at HERA", Nu l. Instrum. Meth. A565 (2006) 572; B. Surrow,"Measurement of the Proton Stru ture Fun tion F2 at low Q2 and verylow x with the ZEUS Beam Pipe Calorimeter at HERA", Ph. D. Thesis,Univ. of Hamburg (1998); T. Monteiro, \Study of Ex lusive Ele tropro-du tion of �0 Mesons at low q2 using the ZEUS Beam Pipe Calorimeterat HERA", Ph. D. Thesis, Univ. of Hamburg (1998).[3℄ H. Bethe and W. Heitler, \On the stopping of fast parti les and on the reation of positive ele trons", Pro . Roy. So . London A 146 (1934) 83.[4℄ T. Haas and V. Makarenko, \Pre ision al ulation of pro esses usedfor luminosity measurement at the ZEUS experiment", arXiv:1009.2451[hep-ph℄, Eur. Phys. J. C 71 (2011) 1574.[5℄ T. Bold, \Common Data A quisition System for the ZEUS LuminosityMonitor", Lambert A ademi Publishing, (2010).[6℄ V. Drugakov, Ph. D. Thesis, NCPHEP Minsk, 2013.[7℄ The ZEUS Coll., S. Chekanov et al., Eur. Phys. J. C 62 (2009) 625.[8℄ M.J. Berger et al. ,"XCOM: Photon Cross Se tions Database",http://www.nist.gov/pml/data/x om/index. fm.[9℄ T. M. Knasel and J. K. Walker, Phys. Lett. B 27 (1968) 103.AppendixTo orre t for the impa t of pile-up the following model was used. Themean number of ele tron pairs per bun h rossing, �, with an energy largerthan 8 GeV rea hed up to 0.02 at the beginning of a �ll. Negle ting theprobability of more than 2 ele tron pairs per bun h rossing, the fra tionof olliding bun hes with an event in the spe trometer passing all sele tion uts, r, is r = P0;1A0;1 + P1;1A1;1 + P0;2A0;2; (11)where P0;1 and A0;1 are the probability of the reation and a eptan e ofan ele tron pair when no ele tron pair was in the previous bun h rossingand P1;1 and A1;1 the same quantities when there was an ele tron pair in24

the previous bun h rossing. A1;1 a ounts for losses due to previous bun hsubtra tion, whi h may lead to event reje tion by the redu tion of the de-posited energy. P0;2 and A0;2 are the probability and a eptan e of eventswith two ele tron pairs whi h are ounted as one event. A0;2 a ounts forfake oin iden es made by e+ and e� from di�erent photonsThe number of ele tron pairs per bun h rossing is des ribed by a Poissondistribution with the mean �. Evaluating probabilities Pm;n to order �2 andsolving Eqn.(11) for �(r) we have� = rA0;1 + �1� A0;22A0;1 + f �1� A1;1A0;1��� rA0;1�2 ; (12)where f is the fra tion of olliding bun hes with a pre eding olliding bun h.It a ounts for the fa t that the olliding bun hes ome in trains alternatingwith pilot and empty bun hes.The luminosity is Ltrue = N b�(E > Ethres:)�(E > Ethres:) ; (13)where N b is the number of olliding bun hes and Ethres: is the energy thresh-old.The measured luminosity isLmeasured = Nb r=A0;1(E > Ethres:)�(E > Ethres:) : (14)The relative luminosity shift is thenLtrue � LmeasuredLmeasured = �1� A0;22A0;1 + f �1� A1;1A0;1�� rA0;1 : (15)The quantities Am;n are determined using Monte Carlo simulations of thephoton beam with parameters obtained from data. Values of f are al ulatedfor the bun h sequen e of ea h run.25