REVISED SOCALGAS DIRECT TESTIMONY OF ANN D. … · (CUSTOMER SERVICE - INFORMATION) ... forecast...
100
Doc # 295436 Company: Southern California Gas Company (U 904 G) Proceeding: 2016 General Rate Case Application: A.14-11-004 Exhibit: SCG-12-R REVISED SOCALGAS DIRECT TESTIMONY OF ANN D. AYRES (CUSTOMER SERVICE - INFORMATION) March 2015 BEFORE THE PUBLIC UTILITIES COMMISSION OF THE STATE OF CALIFORNIA
Transcript of REVISED SOCALGAS DIRECT TESTIMONY OF ANN D. … · (CUSTOMER SERVICE - INFORMATION) ... forecast...
Doc # 295436
Company: Southern California Gas Company (U 904 G) Proceeding: 2016 General Rate Case Application: A.14-11-004 Exhibit: SCG-12-R
REVISED
SOCALGAS
DIRECT TESTIMONY OF ANN D. AYRES
(CUSTOMER SERVICE - INFORMATION)
March 2015
BEFORE THE PUBLIC UTILITIES COMMISSION OF THE STATE OF CALIFORNIA

ADA-i Doc # 295436
TABLE OF CONTENTS
I. INTRODUCTION.............................................................................................................. 1
A. Summary of Costs ....................................................................................................... 1
B. Summary of Activities ................................................................................................ 1
C. Supports SoCalGas’ Goals of Safety, Reliability, Customer Service, and Compliance .................................................................................................................. 4
D. Support To/From Other Witnesses ........................................................................... 6
II. NON-SHARED COSTS..................................................................................................... 8
A. Introduction ................................................................................................................ 8
B. Customer Engagement & Insights ............................................................................ 9
1. Description of Costs and Underlying Activities ................................................. 11
2. Forecast Method.................................................................................................... 16
3. Cost Drivers ........................................................................................................... 16
C. Customer Assistance................................................................................................. 30
1. Description of Costs and Underlying Activities ................................................. 31
2. Forecast Method.................................................................................................... 33
3. Cost Drivers ........................................................................................................... 34
D. Customer Segment Markets .................................................................................... 37
1. Energy Markets & Capacity Products ................................................................ 41
2. Segment Services ................................................................................................... 47
III. SHARED COSTS ............................................................................................................. 62
A. Introduction .............................................................................................................. 62
B. Energy Markets & Capacity Products ................................................................... 64
1. Description of Costs and Underlying Activities ................................................. 65
2. Forecast Method.................................................................................................... 68
3. Cost Drivers ........................................................................................................... 68
C. VP Customer Solutions ............................................................................................ 69
1. Description of Costs and Underlying Activities ................................................. 69
2. Forecast Method.................................................................................................... 69
3. Cost Drivers ........................................................................................................... 70
IV. CAPITAL.......................................................................................................................... 70
A. Introduction .............................................................................................................. 70
B. SoCalGas ENVOY® ................................................................................................. 72
1. SoCalGas ENVOY® & MCS Sybase Database Upgrade, Project #81439 ...... 72
ADA-ii Doc # 295436
2. SoCalGas ENVOY® MCS Data Controls, Project #81438 ............................... 72
3. Gas and Electric Harmonization, Workpaper #00754B ................................... 73
4. Low OFO and EFO, Workpaper #00754C ......................................................... 74
5. SoCalGas ENVOY® Next Generation, Project #14803 .................................... 74
C. NAESB EDIX Upgrade, Project #14869 ................................................................ 74
1. Description ............................................................................................................. 74
D. Socalgas.com Technology Upgrade, Project #14829 ............................................. 75
1. Description ............................................................................................................. 75
E. C&I Next Generation, Project #14827, #15802 ...................................................... 76
1. Description ............................................................................................................. 76
F. Email Campaign Management, Project #14825 .................................................... 77
1. Description ............................................................................................................. 77
V. CONCLUSION ................................................................................................................ 79
VI. WITNESS QUALIFICATIONS ..................................................................................... 80
LIST OF APPENDICES Web/Social Media and Customer Contact Center Interaction Matrix…………………..…...A-1-7
Customer Engagement & Insights and Business Clients 2013 Activities ……………….…….B-1
Glossary of Acronyms….………..………...…………………………….…………………...C-1-3

ADA-iii Doc #295436
SUMMARY
Test Year 2016 Summary of Total O&M Costs
(Thousands of 2013 dollars)
CS - INFORMATION Shown in Thousands of 2013 Dollars 2013 Adjusted-
Recorded TY2016
Estimated Change
Total Non-Shared $17,073 $24,635 $7,562Total Shared Services (Incurred) $2,912 $3,398 $486Total O&M $19,985 $28,033 $8,048
Test Year 2016 Summary of Total Capital IT Costs
(Thousands of 2013 dollars)
CS - INFORMATION
Shown in Thousands of 2013 Dollars Estimated
2014 Estimated
2015 Estimated
2016
Capital IT Projects, Annual Estimated Total $4,411 $12,717 $2,478
Summary of Requests
My testimony describes the Customer Service – Information (“CS-I”) activities and costs
at the Southern California Gas Company (“SoCalGas”). These activities include account
management services to nonresidential and residential customers; products and services for
homebuilders and developers; services for capacity, pipeline, and storage; gas scheduling; gas
transmission planning; and customer research, outreach, communication, and education.
Generally, these customer-centric activities help ensure timely and effective customer
communications regarding safety, reliability, conservation, and various other programs and
services. Regarding costs, my testimony provides estimated expenses for Test Year (“TY”) 2016
to support these ongoing core activities, and requests the following incremental activities and
costs be authorized:
Additional resources to enhance customer service through expansion of information (e.g.,
safety messages), eServices, self-help tools, and energy usage analysis tools, on socalgas.com
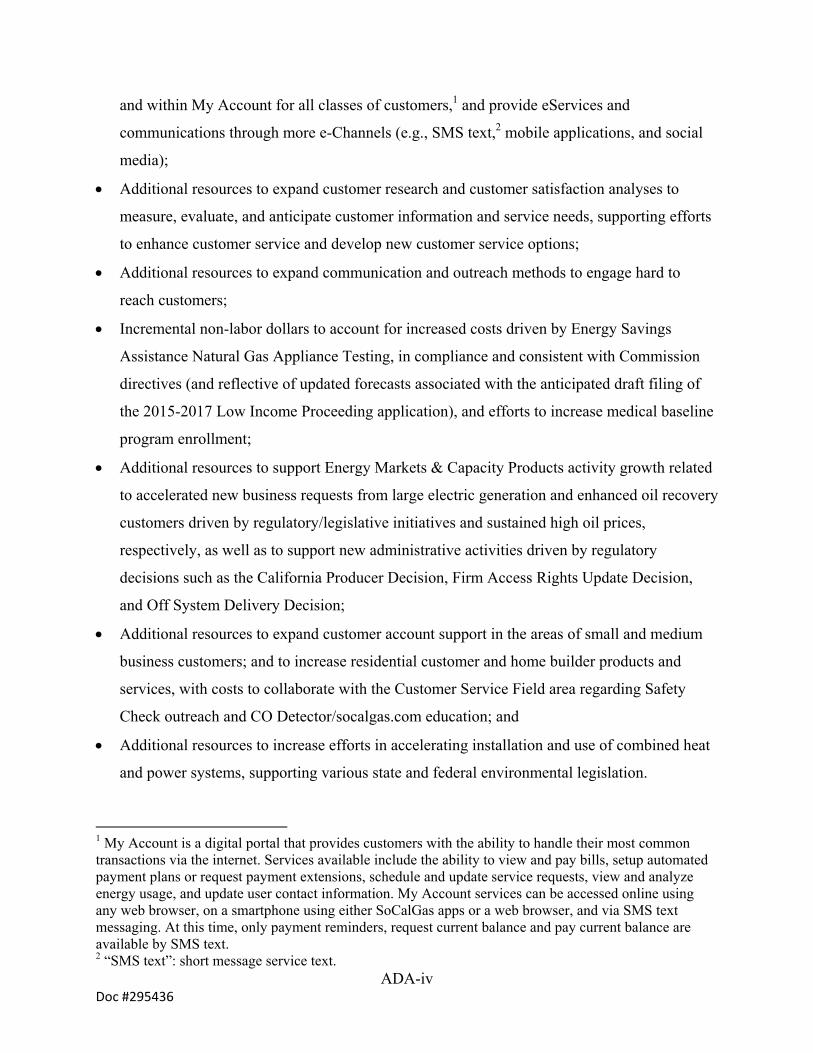
ADA-iv Doc #295436
and within My Account for all classes of customers,1 and provide eServices and
communications through more e-Channels (e.g., SMS text,2 mobile applications, and social
media);
Additional resources to expand customer research and customer satisfaction analyses to
measure, evaluate, and anticipate customer information and service needs, supporting efforts
to enhance customer service and develop new customer service options;
Additional resources to expand communication and outreach methods to engage hard to
reach customers;
Incremental non-labor dollars to account for increased costs driven by Energy Savings
Assistance Natural Gas Appliance Testing, in compliance and consistent with Commission
directives (and reflective of updated forecasts associated with the anticipated draft filing of
the 2015-2017 Low Income Proceeding application), and efforts to increase medical baseline
program enrollment;
Additional resources to support Energy Markets & Capacity Products activity growth related
to accelerated new business requests from large electric generation and enhanced oil recovery
customers driven by regulatory/legislative initiatives and sustained high oil prices,
respectively, as well as to support new administrative activities driven by regulatory
decisions such as the California Producer Decision, Firm Access Rights Update Decision,
and Off System Delivery Decision;
Additional resources to expand customer account support in the areas of small and medium
business customers; and to increase residential customer and home builder products and
services, with costs to collaborate with the Customer Service Field area regarding Safety
Check outreach and CO Detector/socalgas.com education; and
Additional resources to increase efforts in accelerating installation and use of combined heat
and power systems, supporting various state and federal environmental legislation.
1 My Account is a digital portal that provides customers with the ability to handle their most common transactions via the internet. Services available include the ability to view and pay bills, setup automated payment plans or request payment extensions, schedule and update service requests, view and analyze energy usage, and update user contact information. My Account services can be accessed online using any web browser, on a smartphone using either SoCalGas apps or a web browser, and via SMS text messaging. At this time, only payment reminders, request current balance and pay current balance are available by SMS text. 2 “SMS text”: short message service text.
ADA-v Doc #295436
With respect to how I estimated costs, my testimony adopts a consistent 5-year average
forecast methodology to form a “baseline” forecast for all areas within CS-I. This forecasting
methodology reduces anomalies in the forecast by smoothing costs attributed to compliance with
new mandates or regulations, employee attrition, and cost fluctuations associated with operations
and maintenance (“O&M”) costs that are closely tied with other programs (e.g., Customer
Assistance) that are not aligned with the GRC cycle. The 5-year average baseline forecast was
further adjusted, where needed, to account for specific program growth and other incremental
costs not reflected in historical cost data. Furthermore, the baseline forecasts for all groups
within CS-I were adjusted to reflect personnel movement resulting from company
reorganization.
ADA-1 Doc #295436
SOCALGAS DIRECT TESTIMONY OF ANN D. AYRES 1
(CUSTOMER SERVICE - INFORMATION) 2
3
I. INTRODUCTION 4
A. Summary of Costs 5
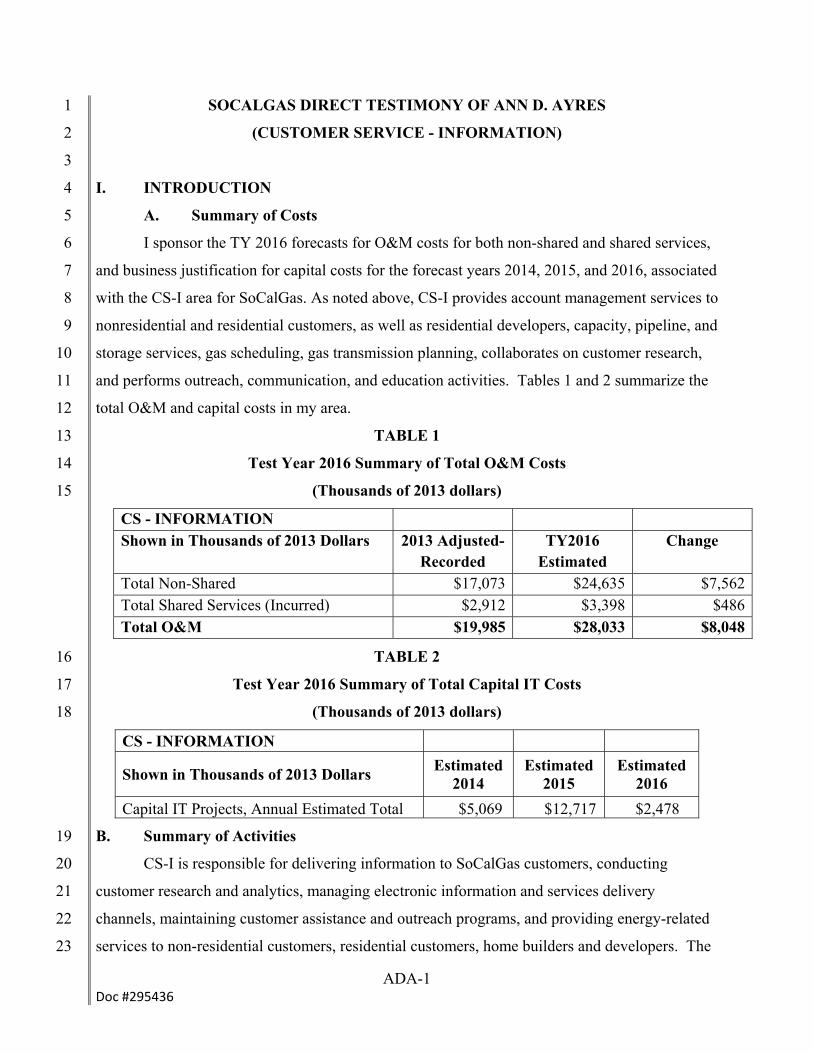
I sponsor the TY 2016 forecasts for O&M costs for both non-shared and shared services, 6
and business justification for capital costs for the forecast years 2014, 2015, and 2016, associated 7
with the CS-I area for SoCalGas. As noted above, CS-I provides account management services to 8
nonresidential and residential customers, as well as residential developers, capacity, pipeline, and 9
storage services, gas scheduling, gas transmission planning, collaborates on customer research, 10
and performs outreach, communication, and education activities. Tables 1 and 2 summarize the 11
total O&M and capital costs in my area. 12
TABLE 1 13
Test Year 2016 Summary of Total O&M Costs 14
(Thousands of 2013 dollars) 15
CS - INFORMATION Shown in Thousands of 2013 Dollars 2013 Adjusted-
Recorded TY2016
Estimated Change
Total Non-Shared $17,073 $24,635 $7,562Total Shared Services (Incurred) $2,912 $3,398 $486Total O&M $19,985 $28,033 $8,048
TABLE 2 16
Test Year 2016 Summary of Total Capital IT Costs 17
(Thousands of 2013 dollars) 18
CS - INFORMATION
Shown in Thousands of 2013 Dollars Estimated
2014 Estimated
2015 Estimated
2016
Capital IT Projects, Annual Estimated Total $5,069 $12,717 $2,478
B. Summary of Activities 19
CS-I is responsible for delivering information to SoCalGas customers, conducting 20
customer research and analytics, managing electronic information and services delivery 21
channels, maintaining customer assistance and outreach programs, and providing energy-related 22
services to non-residential customers, residential customers, home builders and developers. The 23
ADA-2 Doc #295436
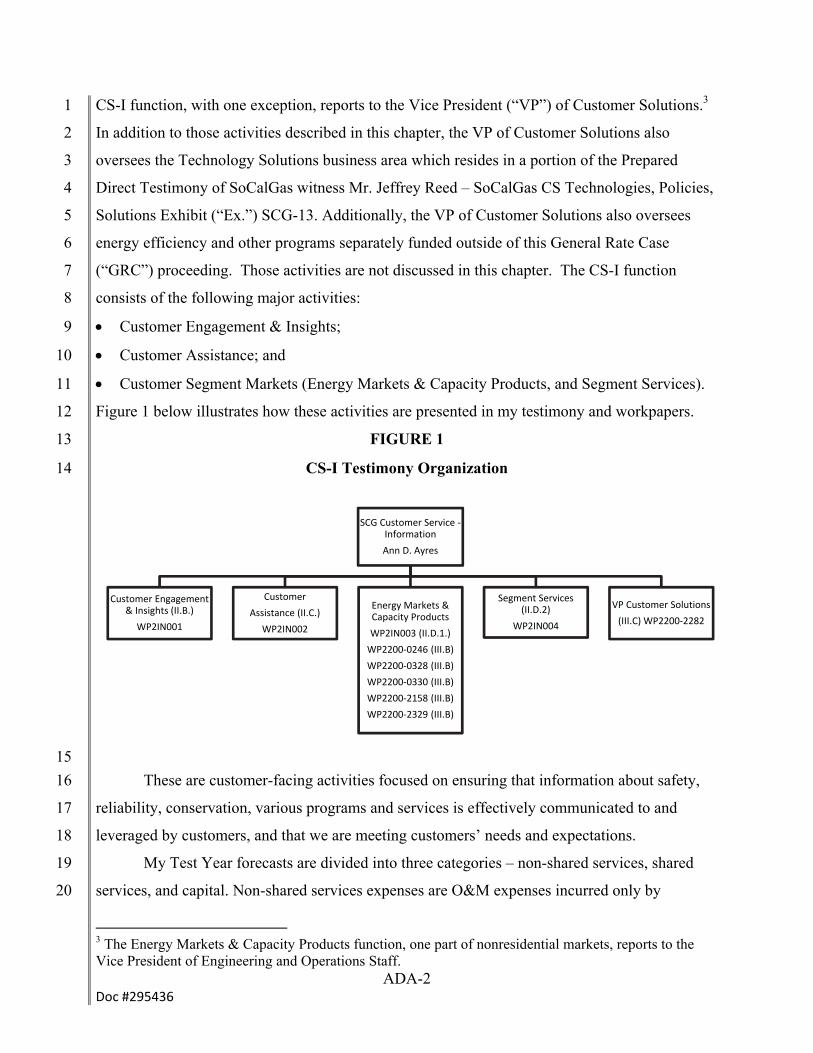
CS-I function, with one exception, reports to the Vice President (“VP”) of Customer Solutions.3 1
In addition to those activities described in this chapter, the VP of Customer Solutions also 2
oversees the Technology Solutions business area which resides in a portion of the Prepared 3
Direct Testimony of SoCalGas witness Mr. Jeffrey Reed – SoCalGas CS Technologies, Policies, 4
Solutions Exhibit (“Ex.”) SCG-13. Additionally, the VP of Customer Solutions also oversees 5
energy efficiency and other programs separately funded outside of this General Rate Case 6
(“GRC”) proceeding. Those activities are not discussed in this chapter. The CS-I function 7
consists of the following major activities: 8
Customer Engagement & Insights; 9
Customer Assistance; and 10
Customer Segment Markets (Energy Markets & Capacity Products, and Segment Services). 11
Figure 1 below illustrates how these activities are presented in my testimony and workpapers. 12
FIGURE 1 13
CS-I Testimony Organization 14
15
These are customer-facing activities focused on ensuring that information about safety, 16
reliability, conservation, various programs and services is effectively communicated to and 17
leveraged by customers, and that we are meeting customers’ needs and expectations. 18
My Test Year forecasts are divided into three categories – non-shared services, shared 19
services, and capital. Non-shared services expenses are O&M expenses incurred only by 20
3 The Energy Markets & Capacity Products function, one part of nonresidential markets, reports to the Vice President of Engineering and Operations Staff.
SCG Customer Service ‐Information
Ann D. Ayres
Customer Engagement & Insights (II.B.)
WP2IN001
Customer
Assistance (II.C.)
WP2IN002
Energy Markets & Capacity Products
WP2IN003 (II.D.1.)
WP2200‐0246 (III.B)
WP2200‐0328 (III.B)
WP2200‐0330 (III.B)
WP2200‐2158 (III.B)
WP2200‐2329 (III.B)
Segment Services (II.D.2)
WP2IN004
VP Customer Solutions
(III.C) WP2200‐2282
ADA-3 Doc #295436
SoCalGas and are discussed in Section II. Shared services expenses are O&M expenses incurred 1
by SoCalGas on behalf of both SoCalGas and San Diego Gas and Electric (“SDG&E”), and are 2
discussed in Section III. Capital requirements are identified in Section IV; however, capital 3
expenditure forecasts are provided elsewhere in the SoCalGas testimony Ex.SCG-18 (Olmsted). 4
Generally, my Test Year forecasts are reasonable because they account for cyclical 5
fluctuations and recurring costs attributed to core business functions. TY 2016 estimated O&M 6
expenses adopted a consistent 5-year average forecast methodology to form a “baseline” forecast 7
for all areas within CS-I. This forecasting methodology reduces anomalies in the forecast by 8
smoothing costs attributed to abnormal operating conditions, compliance with new mandates or 9
regulations, employee attrition, and cost fluctuations associated with O&M costs that are closely 10
tied with other programs (Customer Assistance) that are not aligned with the GRC cycle. The 5-11
year average baseline forecast was further adjusted, where needed, to account for specific 12
program growth and other incremental costs not reflected in historical cost data. Furthermore, the 13
baseline forecasts for all groups within CS-I were adjusted to reflect personnel movement 14
resulting from company reorganization. This is the most accurate method to reflect the activities 15
in the CS-I area, as historical costs from 2009-2013 are representative of continued core 16
operational activities without overstating, understating, or selectively isolating particular 17
historical expenses. 18
The following factor(s) were considered in the development of TY 2016 estimated 19
expenses: 20
Increasing diversity of SoCalGas’ customer segments; 21
Customer information technology adoption, dynamic and expanding communication e-22
channels leading to increased customer expectations; 23
Heightened community interest with respect to gas safety; 24
Expanded special needs, hard-to-reach customer outreach efforts to ensure all customers are 25
uniformly served; 26
Enhanced technical engineering services and support; and 27
Expanded and more complex state and federal energy, air quality, policy and regulatory 28
environment. 29
30
31

ADA-4 Doc #295436
C. Supports SoCalGas’ Goals of Safety, Reliability, Customer Service, and 1 Compliance 2
The activities within my CS-I testimony represent SoCalGas’s commitment to our 3
customers by focusing on safety, reliability, customer service, and compliance. 4
Safety 5
Customer interest with respect to gas safety has heightened due to increased attention on 6
the shale gas industry boom and recent pipeline safety accidents that occurred outside of 7
SoCalGas’ service territory. Subsequently, our activities have grown to increase gas safety 8
education and awareness to customers through a multitude of communication channels and 9
delivery methods, which include: one-on-one customer engagement, outreach events, social 10
media messaging, as well as supporting increased natural gas appliance testing and CO testing. 11
We also focus on capital investment projects to build out our socalgas.com website capacity and 12
expand our social media/mobile presence so that (among other things) emergency alerts and 13
messages can be effectively conveyed to customers. A reliable communication platform is 14
particularly valuable in times when mobile or landlines are overloaded with congestion and 15
phone calls are unable to connect. 16
Reliability 17
CS-I activities also consist of, and continue to grow, in the area of gas transmission 18
system modeling and gas scheduling in support of gas system reliability. Our gas scheduling 19
group is responsible for maximizing the system capacity by balancing the system between in-20
state and out-of-state scheduled receipts and forecasted system demand, declaring operational 21
flow orders and winter balancing enforcement. We are requesting capital investment dollars to 22
support an anticipated final decision related to the Federal Energy Regulatory Commission's 23
Notice of Proposed Rulemaking to align nationwide gas and electric operational practices of 24
pipelines and electric generators for energy scheduling.4 We also have dedicated resources 25
focused on evaluating an influx of requests for service and information pertaining to Southern 26
California Edison’s Local Capacity Resource Request for Offer. These request types are 27
expected to continue as the California electricity system continues to change. 28
We also continue to evolve and expand our storage, hub, and capacity products and 29
services, which support customers’ gas service reliability, including investing capital into further 30
4 FERC. Notice of Proposed Rulemaking (“NOPR”) Docket No. RM14-2-000.
ADA-5 Doc #295436
development of our electronic bulletin board (“EBB”) system (otherwise known as SoCalGas 1
ENVOY®) to build new functionalities for balancing and secondary market trading. 2
Additionally, our staff activities continue to identify, implement, and propose refinements to our 3
gas curtailment regulations and processes to protect service to our core load and minimize impact 4
to our non-core load. 5
Customer Service 6
Our focus on improving the customer experience includes responding to customer 7
expectations to interact through social media channels (e.g., YouTube, Facebook, Twitter, etc.), 8
providing customers multiple channels of communication, and building out customer self-service 9
options for online and mobile payment. We continue to refine and add to our customer research 10
and analytics, as data and communication channels continue to grow and change, ensuring our 11
services continue to address customer needs and satisfaction. 12
In addition to our communication and technology offerings, we are developing a 13
dedicated group to serve the small, medium business customer segment needs, as well as 14
growing our dedicated group to serve the residential, new construction, and homebuilder 15
customer segment. Increasing complexities in air quality regulations and permitting are 16
challenges for small, medium business customers. This customer segment typically lacks 17
resources, expertise, or in-house experience to effectively deal with these challenges. We are 18
also focused on increasing services and communications to support the growing aging population 19
of residential customers and to provide assistance to homebuilders and construction to address 20
Zero Net Energy mandates, Title 24, and air quality items such as South Coast Air Quality 21
Management District (“SCAQMD”) Rule 1111. 22
Compliance 23
SoCalGas is supportive of federal and state environmental goals and initiatives that are 24
influencing the energy marketplace to drive greenhouse gas reduction, renewables integration, 25
abate once-through-cooling, construct new fast start generator technology, and grow biogas 26
interconnection. Accordingly, CS-I activities continue to adapt to ensure compliance with 27
federal and state directives and regulatory decisions, and are requesting additional resources 28
dedicated to supporting federal and state environmental initiatives to encourage greenhouse gas 29
reduction and renewable energy by accelerating the installation of combined heat and power 30
technology. 31

ADA-6 Doc #295436
SoCalGas is also supportive of technology compliance with accessibility requirements 1
and data security standards. In addition to ensuring continued compliance with the Web Content 2
Accessibility Guidelines (“WCAG”) 2.0 requirements established by the Memorandum of 3
Understanding agreed to with the Center for Accessible Technology executed on February 24, 4
2012, CS-I is also requesting capital investments to upgrade various software applications, and 5
enhance website security to meet compliance requirements and operational standards such as the 6
North American Energy Standard Board (“NAESB”) version 2.0 to schedule gas with our 7
interstate trading partners. 8
D. Support To/From Other Witnesses 9
In addition to sponsoring my organization’s cost centers, I also provide: 10
Business justification for costs related to capital IT projects in the Prepared Direct Testimony 11
of SoCalGas witness Christopher Olmsted - SoCalGas Information Technology (Ex. SCG-12
18); 13
Related O&M labor/FTE/non-labor costs (Section II.B.3. “eServices & Data Analysis”) 14
associated with the Capital IT projects’ business cases sponsored in the prepared Direct 15
Testimony of SoCalGas witness Evan Goldman – SoCalGas Customer Services Operation 16
(Ex. SCG-11); 17
Related O&M non-labor costs impact for communication printing and postage costs related 18
to Customer Service Field activities that are incremental and described in the prepared Direct 19
Testimony of SoCalGas witness Sara Franke – SoCalGas Customer Service Field & SCG 20
Meter Reading (Ex.SCG-10, Section II.B.1.d.2., and Section II.B.1.d.3.); 21
Background information regarding cost recovery of the Natural Gas Appliance Testing 22
(“NGAT”) Memorandum Account in the prepared Direct Testimony of SoCalGas witness 23
Reginald Austria – SoCalGas Regulatory Accounts (Ex.SCG-33, Section II.A.2.); 24
Miscellaneous revenues for Line Item Billing (“LIB”) and Federal Energy Retrofit Program 25
(“FERP”), including the basis for the forecasted revenues and the projected revenues, are 26
sponsored by SoCalGas witness Michelle Somerville, Ex.SCG-32, Section III.17 and Section 27
III.18, respectively; and 28
Shared Services total incurred costs/FTE costs which are described in Section III whereas the 29
dollar amounts allocated to affiliates are presented in the prepared Direct Testimony of 30
SoCalGas witness Mark Diancin (Ex. SCG-25, Section II). 31
ADA-7 Doc #295436
Capital IT Projects 1
Section IV of my testimony provides descriptions and the business need for Information 2
Technology (“IT”) projects that are associated with functions that reside in my CS-I testimony. 3
The costs of these projects are represented separately under the SoCalGas Information 4
Technology testimony of SoCalGas witness Christopher Olmsted (Ex.SCG-18). 5
Related O&M labor/FTE costs to Ex.SCG-11(Goldman) 6
There are 3 capital IT projects (Integrated Customer Data & Analytics_SQL, Project 7
#14826; My Account Mobile 1C, Project # 81423; and SCG My Business Account, Project # 8
81436) presented in the testimony of the Customer Service - Operations group, which presents 9
ongoing O&M FTE and non-labor costs impacts to my CS-I testimony area. The capital IT 10
business cases are presented in the prepared Direct Testimony of SoCalGas witness Evan 11
Goldman – SoCalGas Customer Services Operation (Ex.SCG-11, Section IV.B.3, Section 12
IV.B.4; and Section IV.B.5). However, the ongoing functions of these 3 capital IT projects also 13
impact my witness area in CS-I, as ongoing incremental O&M labor / FTE, and non-labor costs 14
are associated with supporting these projects and are requested as incremental work in Section 15
II.B.3 “Cost Drivers” for the subgroup “eServices & Analysis” within the Customer Engagement 16
& Insights function. 17
Communication Costs Related to Customer Service Field Operations Activities 18
The Customer Engagement & Insight costs within Section II.B.1 of my testimony 19
describes this business group as responsible for managing, maintaining, and providing 20
foundational communication channels and analytics for the company’s various business units. 21
Some costs to Customer Engagement & Insights also includes the communication material (e.g. 22
seasonal type winter messages) for company-wide messages, however messaging and outreach 23
material for specific programs or initiatives are typically funded by their associated business 24
units (such as energy efficiency). In the prepared Direct Testimony of SoCalGas witness Sara 25
Franke – SoCalGas Customer Service Field & SCG Meter Reading (Ex.SCG-10, Section 26
II.B.1.d.3. and Ex.SCG-10, Section II.B.1.d.2.), there includes a forecast to support service 27
enhancements for safety messaging outreach, and CO detectors and socalgas.com education, 28
however the cost components for producing the communication materials reside in Section 29
II.D.2.c. of my testimony, in Residential Market Services. 30
31
32

ADA-8 Doc #295436
NGAT Memorandum Account 1
A one-time memorandum account was approved by the Commission in 2011 for 2
SoCalGas to recover NGAT costs associated with increased home weatherization program goals 3
from the 2009-2011 Low Income Proceeding.5,6 The Low Income Proceeding 2009 base year 4
represented the first year of the program cycle approved in Decision (“D”) 08-11-031, and 5
reflected a 47% increase over previous projections of GRC TY 2008 testing. SoCalGas incurred 6
these additional NGAT costs without a recovery mechanism, which led to the Commission-7
approved NGAT memorandum account where $1.944 million in expenses were recorded by 8
SoCalGas, and for which SoCalGas now seeks cost recovery in the SoCalGas Regulatory 9
Accounts GRC testimony (Ex.SCG-33, Section II.A.2. [Austria]). 10
Miscellaneous Revenues 11
Line Item Billing (“LIB”) and Federal Energy Retrofit Program (“FERP”) are services 12
offered by Segment Services – Residential Services, and Segment Services – Account 13
Management/Staff Support, respectively. The forecast basis and projected miscellaneous 14
revenues generated by LIB and FERP are sponsored in Ex.SCG-32, Section III.17 and Section 15
III.18 (Somerville). 16
Shared Services 17
The percent allocation of each shared service cost center in my testimony (Section III) are 18
detailed in Ex.SCG-12-WP (Ayres). 19
II. NON-SHARED COSTS 20
A. Introduction 21
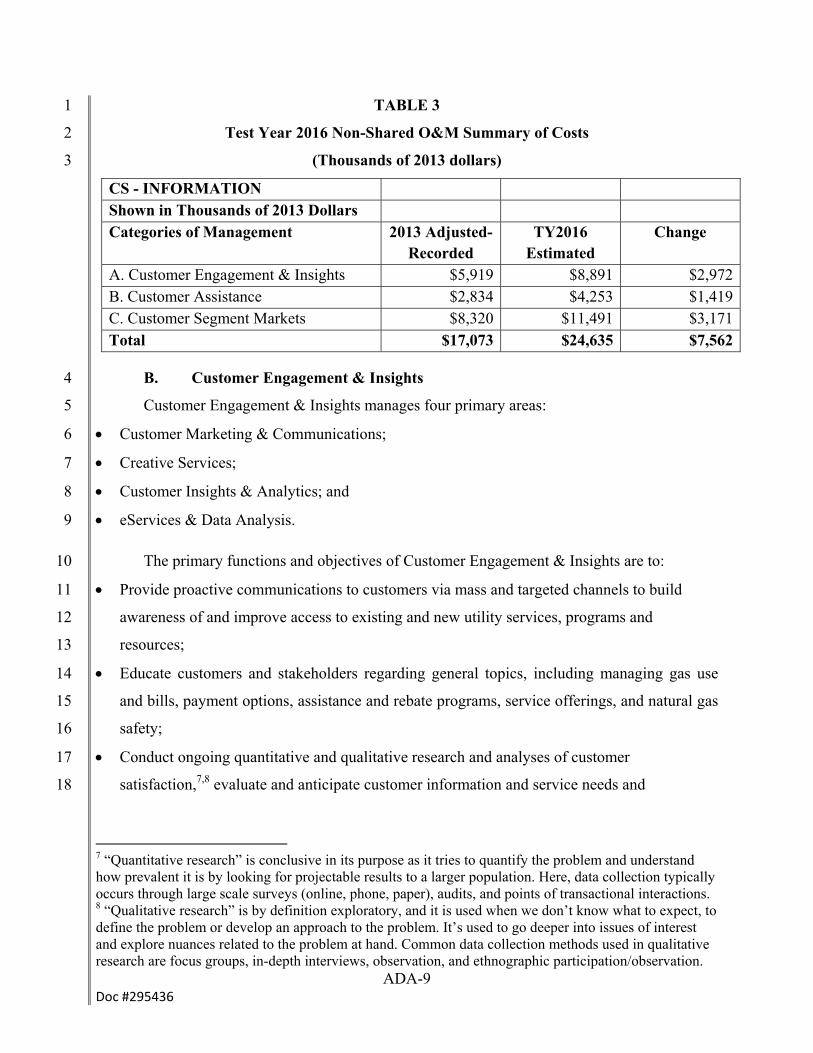
Table 3 summarizes the total non-shared O&M forecasts for the listed cost categories. 22
23
5 D.10-12-002, pg.10. 6 Description of how GRC funded NGAT costs are related to a separate Low Income Proceeding regulatory cycle are further described in Section II.C.I. under “Energy Savings Assistance Programs Related to Natural Gas Appliance Testing”.
ADA-9 Doc #295436
TABLE 3 1
Test Year 2016 Non-Shared O&M Summary of Costs 2
(Thousands of 2013 dollars) 3
CS - INFORMATION Shown in Thousands of 2013 Dollars Categories of Management 2013 Adjusted-
Recorded TY2016
Estimated Change
A. Customer Engagement & Insights $5,919 $8,891 $2,972B. Customer Assistance $2,834 $4,253 $1,419C. Customer Segment Markets $8,320 $11,491 $3,171Total $17,073 $24,635 $7,562
B. Customer Engagement & Insights 4
Customer Engagement & Insights manages four primary areas: 5
Customer Marketing & Communications; 6
Creative Services; 7
Customer Insights & Analytics; and 8
eServices & Data Analysis. 9
The primary functions and objectives of Customer Engagement & Insights are to: 10
Provide proactive communications to customers via mass and targeted channels to build 11
awareness of and improve access to existing and new utility services, programs and 12
resources; 13
Educate customers and stakeholders regarding general topics, including managing gas use 14
and bills, payment options, assistance and rebate programs, service offerings, and natural gas 15
safety; 16
Conduct ongoing quantitative and qualitative research and analyses of customer 17
satisfaction,7,8 evaluate and anticipate customer information and service needs and 18
7 “Quantitative research” is conclusive in its purpose as it tries to quantify the problem and understand how prevalent it is by looking for projectable results to a larger population. Here, data collection typically occurs through large scale surveys (online, phone, paper), audits, and points of transactional interactions. 8 “Qualitative research” is by definition exploratory, and it is used when we don’t know what to expect, to define the problem or develop an approach to the problem. It’s used to go deeper into issues of interest and explore nuances related to the problem at hand. Common data collection methods used in qualitative research are focus groups, in-depth interviews, observation, and ethnographic participation/observation.

ADA-10 Doc #295436
preferences, supporting the development of new customer service options, targeted 1
communications and delivery channels to satisfy those needs; and, 2
Leverage and expand existing and new e-Channels,9 (including social media) and 3
communication platforms (such as mobile) to support customer education and awareness-4
building objectives. 5
For TY 2016, SoCalGas is requesting a total of $8.891 million for Customer Engagement 6
& Insights. This forecast is based on a 5-year average cost with an incremental funding request 7
of $2.972 million above 2013 base year spend to accomplish the following: 8
Enhance customer service by expanding information,10 eServices,11 and self-help tools 9
available on socalgas.com and within My Account for all classes of customer (i.e., 10
residential, commercial, industrial) and provide eServices through more e-Channels (e.g., 11
SMS Text, Mobile Apps, etc.);12 12
Support and enhance the energy usage analysis tools to achieve greater customer 13
engagement and encourage potential customer behavioral changes that reduce energy usage; 14
Expand customer research and customer satisfaction analyses to measure, evaluate and 15
anticipate customer information and service needs, supporting efforts to enhance customer 16
service, and develop new customer service options; 17
Continue to expand messaging for general gas safety for dig in’s, appropriate appliance use, 18
carbon monoxide poisoning awareness and earthquake response by customers; and 19
9 e-Channels refer collectively to the variety of electronic communications and services-delivery platforms through which communications, transactions, interactions and/or collaboration between SCG and its customers may occur. These include, but are not limited to, self-service interactive voice response systems, website-based bill payment and self-service, e-mail, text/SMS, social media (e.g., Facebook, MySpace, Twitter) and mobile services. New and evolving technologies will lead to the creation of additional e-Channels in the future. 10 See Appendix B for table indicating the communication support that Customer Engagement & Insights provides to other departments, programs, or groups (defined as “business clients” or “business owners”), as well as how expenses are allocated or incurred by Customer Engagement & Insights. 11 See Appendix A for table indicating the interactions between the web and social media channels that Customer Engagement & Insights maintain, and how the Customer Contact Center department is integrated. 12 My Account is a digital portal that provides customers with the ability to handle their most common transactions via the Internet. Services available include the ability to view and pay bills, setup automated payment plans or request payment extensions, schedule and update service requests, view and analyze energy usage, and update user contact information. My Account services can be accessed online using any web browser, on a smartphone using either our apps or a web browser, and by SMS text messaging. At this time only payment reminders, request current balance and pay current balance are available by SMS text.

ADA-11 Doc #295436
Improve and expand social media communications as the level of customer interaction 1
continues to expand and the need to communicate across more social media channels 2
increases. 3
See Table 4 below for a summary of TY2016 estimated non-shared Customer Engagement & 4
Insights costs compared to 2013 Adjusted-Recorded base year. Explanation of cost change from 5
2013 Adjusted-Recorded to TY2016 Estimated is further elaborated in the following Sections 6
II.B.2 and II.B.3. 7
TABLE 4 8
Test Year 2016 Summary of Non-Shared Customer Engagement & Insights Costs 9
(Thousands of 2013 dollars) 10
CS - INFORMATION Shown in Thousands of 2013 Dollars B. Customer Engagement & Insights 2013 Adjusted-
Recorded TY2016
Estimated Change
1. Customer Engagement & Insights $5,919 $8,891 $2,972Total $5,919 $8,891 $2,972
11
1. Description of Costs and Underlying Activities 12
The following provides further detail regarding the four areas managed by Customer 13
Engagement & Insights, as well as details regarding primary cost drivers within these areas. 14
Customer Marketing & Communications 15
The Customer Marketing and Communications team is responsible for developing 16
marketing strategies and plans, and overseeing the execution of customer-facing communications 17
campaigns to help business partners meet their objectives and goals. This includes monitoring 18
and analyzing market trends, evaluating customer research, identifying target markets and 19
developing strategies to communicate with various customer segments and increase customer 20
engagement. 21
The creation and placement of advertisements, mailers and other materials is 22
accomplished using both internal resources and external vendors. Customer Marketing and 23
Communications also oversees external suppliers, such as advertising agencies, language 24
translation vendors, design vendors and SoCalGas’ e-mail service provider. 25
ADA-12 Doc #295436
Communications to customers cover general topics such as customer services offered by 1
SoCalGas, bill management, payment options and critical natural gas safety information, as well 2
as more targeted programs and/or services-specific communications. General messages are often 3
delivered in English, Spanish, Chinese (Mandarin and Cantonese), Vietnamese and Korean, in 4
in-language media. Targeted messages may depend on the audience as well as program goals 5
and objectives. In addition, SoCalGas buys African-American and Filipino media. All ethnic 6
advertising is delivered in-language and is transcreated (never simply translated) to ensure we 7
are being culturally relevant with our customers and so our messages are delivered and 8
consumed more effectively.13 Generally, costs associated with programs and/or services-specific 9
communications are paid by the requesting organizations within SoCalGas.14 Therefore, the costs 10
incurred by the Customer Marketing and Communications area relate to items that are company-11
wide and include: costs to fund an annual general and pipeline awareness safety campaign, a 12
“winter prep” campaign that helps customers manage their winter gas bills, and ongoing 13
campaigns to build awareness of newer, electronically-based customer services and information. 14
Creative Services 15
The Creative Services team manages day-to-day activities associated with graphic design, 16
scheduling and production for bill enclosures, as well as for various printed and electronic 17
materials, such as brochures, flyers, posters and newsletters, stewarding brand vision and 18
protecting brand equity. This team is also responsible for organizing and implementing various 19
external outreach events annually. 20
These materials support numerous SoCalGas programs and services-related education 21
and outreach efforts and many of the bill enclosures that are mandated by the Commission. 22
Additionally, the Creative Services team oversees the use of the SoCalGas logos and names, and 23
associated compliance with various copyright, trademark and creative usage rights requirements. 24
SoCalGas’ identities are trademarked and require oversight to ensure proper and legal usage by 25
both internal departments and outside entities. Creative Services ensures that legal and mandated 26
affiliate disclaimers appear on all company (e.g., energy efficiency and low income programs) 27
13 “Transcreated” refers the adoption of a message from one language to another, while maintaining its intent, style, tone, and context. Transcreation requires taking the essence of the message and re-creating it in another language or dialect. 14 See Appendix B “Customer Engagement & Insights and Business Clients 2013 Activities Table” for illustration of differences in activities and costs incurred between Customer Engagement & Insights groups compared to business owners or ‘clients’.
ADA-13 Doc #295436
and third party materials. This protects customers by ensuring information provided with the 1
SoCalGas name or logo legitimately comes from SoCalGas, and reduces customer confusion 2
and/or misperception when the SoCalGas name or logo appears on others’ printed or electronic 3
materials. Costs that are within this area for ongoing creative services projects include: 4
Management of an extensive database of catalogued images and videos,15 which include 5
updating expiring licensed images, maintaining legal releases of images, and arranging 6
periodic photo and video shoots for new content; 7
Conducting or supporting over 200 customer events annually, such as county fairs, festivals, 8
and business symposiums such as the SoCalGas Business Expo; and 9
Producing an annual report of SoCalGas’ diversity of vendor relationships based on Diverse 10
Business Enterprises (“DBE”) Group’ metrics, which is distributed to the CPUC and DBE 11
vendors. 12
Costs for the designing and printing of various materials are paid by the requesting 13
business owner organizations with the exception of company-wide, general communications.16 14
Customer Insights & Analytics 15
The Customer Insights & Analytics team manages all primary and secondary customer 16
research to monitor customer satisfaction and experience,17 providing insight into what 17
influences and drives consumer behavior, customer needs and perception. This team is also 18
responsible for advising on customer insights as it pertains to business practices, and provides 19
analytical support with quantitative and qualitative studies. This includes managing external 20
vendors which provide associated research and benchmarking services, analyses and tools. The 21
team works cross-functionally across numerous areas within SoCalGas to disseminate and 22
communicate research and customer satisfaction findings – guiding the development, operation 23
and enhancement of services and programs to meet customer needs and optimize the benefits 24
customers derive from SoCalGas’ services. In 2012, a new ongoing Customer Experience Survey 25
15 The SoCalGas images and videos database contains over 20,000 images. 16 See Appendix B “Customer Engagement & Insights and Business Clients 2013 Activities” for illustration of differences in activities and costs incurred between Customer Engagement & Insights groups compared to business owners or ‘clients’. 17 Primary research is considered new research, carried out to investigate specific issues or questions. Primary research consists of questionnaires, surveys, or interviews with individuals or small groups. Secondary research makes use of information previously researched for other purposes and is publically available. Secondary research includes published research reports in a library, surveys, internet, or scientific reports produced by councils, universities, or government.
ADA-14 Doc #295436
(“CES”) was implemented to replace the previous Customer Satisfaction Survey (“CSS”). The 1
role of the Customer Insights & Analytics group includes overseeing the implementation, 2
management and dissemination of the survey results to their associated departments to allow for 3
an ongoing understanding of changing customer needs and wants. 4
The group also supports data analysis projects for various departments within SoCalGas, 5
such as evaluating energy usage and other characteristics by customer segment and producing 6
ad-hoc regulatory reports (e.g., Commission and intervenor data requests, and California Energy 7
Commission [“CEC”] reports, among others). 8
Costs for ongoing research projects, such as customer satisfaction measurement, are 9
included within this area, as well as costs associated with research related to services and 10
program valuation and awareness. Other company research projects are coordinated by this 11
group but are paid for by the requesting organization within SoCalGas.18 12
Customer Experience Survey (“CES”) 13
Beginning in year 2012, SoCalGas instituted a new Customer Experience Survey that 14
better reflects the needs of customers and identifies what services and communications the 15
customer values. The findings of the survey are provided to various departments within 16
SoCalGas to review customers’ perception of SoCalGas “performance,” and provide indications 17
of how we can adjust our operations to sustain or improve our “performance”. 18
o Customer Satisfaction Survey (2005 - 2011) (“CSS”) 19
The previous CSS survey has been in place in SoCalGas from (2005 – 2011), and has 20
been an 11-point scale “customer satisfaction” metric used to determine whether SoCalGas has 21
met a measure of minimum requirements. The customer groups included in the survey are 22
comprised of 4-5 million transactions with residential and foodservice customers. 23
Three SoCalGas contact channels were included in the survey, consisting of Customer 24
Service Representatives (“CSRs”), Interactive Voice Response (“IVRs”), and the branch office. 25
o Customer Experience Survey (2012 – current) 26
The current CES, administered by TNS – a global research firm with survey 27
measurement expertise across various sectors, is a new 5-point scale metric used to gauge 28
customer’s perception of SoCalGas “performance,” which expands metrics to include a 29
18 See Appendix B “Customer Engagement & Insights and Business Clients 2013 Activities” for illustration of differences in activities and costs incurred between Customer Engagement & Insights groups compared to business owners or ‘clients’.
ADA-15 Doc #295436
customer’s opinion of value-added in a service transaction,19 in addition to gauging the minimum 1
requirements of service. The customer groups included in this survey expands the sample pool to 2
6-8 million transactions and now includes commercial and industrial customers as well as 3
residential and food-service customers. Examples of additional areas in which customer opinion 4
is gauged: 5
Measures customer’s perception of ease of transaction to resolve their request, 6
Measures customer’s level of concern which prompted their interaction, and 7
Gauges whether expectations of service were met. 8
The types of contact channels measured have also been expanded to include online 9
transactions and additional types of transactions previously excluded (such as payments and 10
program enrollment). 11
eServices & Data Analysis 12
The SoCalGas eServices & Data Analysis team is responsible for defining the strategic 13
direction for eServices at SoCalGas, the policies that govern eServices, and the expansion of 14
eServices across the various e-Channels (e.g., internet computers, tablets, smartphones, email or 15
text devices) based on customer trends and internal analytics. 16
eServices & Data Analysis is also responsible for project management and user 17
experience design for the eServices and payment options available in My Account. Primary 18
customer research and internal analytics are used to define and constantly refine the customer 19
experience within My Account to assure that customers are able to easily find, understand and 20
complete transactions within My Account. 21
Additionally, the team handles the day-to-day management and maintenance of 22
socalgas.com and the intranet knowledge base of collected internal websites used at SoCalGas 23
for the storage and dissemination of information to employees. The team provides web user 24
interface development and optimization, website usage analytics, web technical standards, 25
streaming media posting, website governance and Content Management System (“CMS”) 26
administration. 27
28
29
19 Value added: May refer to a customer’s perception of worth in a service transaction from additional enhancements or offerings, in terms such as convenience, ease, time, satisfaction, etc.
ADA-16 Doc #295436
2. Forecast Method 1
The forecast method used for this cost category is 5-year historical average with 2
adjustments for expanded functions, and with adjustments to historical costs to align expenses to 3
their appropriate functional areas. Further elaborating on the historical adjustments: Customer 4
Engagement & Insights was previously called Communications, and was a shared service with 5
San Diego Gas & Electric (“SDG&E”) from 2009 through partially 2011. Subsequently, 6
adjustments were made to these historical expenses, which consisted of cost transfers between 7
SDG&E and SoCalGas to align activities with the appropriate utility it supported. Additionally, 8
for the purpose of presenting historical costs that most accurately reflect current and TY 2016 9
functions, adjustments were made to align historical expenses with SoCalGas’ reorganization of 10
activities (see Ex.SCG-12-WP-2IN001 for specific adjustment details). These adjustments 11
subsequently present an accurate 5-year history of expenses for functions Customer Engagement 12
& Insights has incurred for core business activities, and presents a reasonable period of time to 13
capture periodic and recurring non-labor expenses, without selectively isolating historical 14
expenses to overstate or understate costs, and is consistent with forecast methodologies in 15
previous SoCalGas general rate cases for this area. Historical periodic non-labor costs consist of 16
software licenses, software upgrades, major design refreshes, and continuing research studies 17
conducted by external services (Details of large sized variances further elaborated in Ex.SCG-18
12-WP, pg. 400-403). 19
3. Cost Drivers 20
Customer Engagement & Insights recorded total adjusted expenditures of $5.919 million 21
in 2013, of which $1.543 million was labor costs and $4.377 million was non-labor costs. 22
Collectively, these expenditures provided a foundational level of general customer 23
communications, research and customer satisfaction studies, and website support. The costs for 24
this area include employee labor and expenses, software license fees, as well as related external 25
contractor and/or vendor support. Non-labor costs do not include media purchases, agency or 26
printing costs, which are billed directly to the SoCalGas organization (business unit) requiring 27
the communications activity, unless otherwise noted.20 28
20 See Appendix B “Customer Engagement & Insights and Business Clients 2013 Activities” for illustration of differences in activities and costs incurred between Customer Engagement & Insights groups compared to business owners or ‘clients’.
ADA-17 Doc #295436
SoCalGas’ TY 2016 forecast reflects a $2.254 million increase in funding within 1
Customer Engagement & Insights above the 5-year historical average. As previously discussed 2
in Section II.B.2, a 5-year average forecast methodology was used as the basis for the TY 2016 3
forecast plus adjustments to account for specific program growth (see Table 5 for a summary of 4
incremental expenditures and related activities, which is then followed by further justification 5
detail organized by Program activity). 6
The expanded customer engagement and outreach efforts of this organization supports 7
outreach and education due to changing policy and regulation, safety education, natural gas 8
programs and the research information needed so that customers are engaged and educated. For 9
example, policy initiatives and programs developed by the California Public Utilities 10
Commission (“CPUC”) to reach emission reduction goals called for in The Global Warming 11
Solutions Act of 2006, include clear calls to action for the utilities’ communication goals: 12
“Regardless of the underlying motivation, the customer’s participation is critical to achieve these 13
emissions reduction goals….Getting customers engaged should be one of the primary goals of 14
the utilities and the regulators.”21 The White Paper goes on to further recommend two primary 15
actions that the utilities and regulators should consider: “Prioritize customer engagement through 16
program designs and service offerings using analysis of customer needs and motivations” and 17
“Expand the service offerings of the utility to include services that will facilitate and automate 18
the customers’ energy management opportunities”. 19
20
21 Policy and Planning Division, “Customers as Grid Participants: A Fundamentally New Role for Customers”, CPUC, pg.3.

ADA-18 Doc #295436
TABLE 5 1
Test Year 2016 Incremental Customer Engagement & Insights Expenditures 2
(Thousands of 2013 dollars) 3
Program Labor Non-Labor
Explanation Total
Customer Marketing & Communications
$ 167 n/a 2 FTEs: social media ($83.4) /communication ($83.4) advisors.
$467
n/a $300
NL: Additional engagement and ad campaigns, production of additional video content, enhance current social media software tools for metrics to track effectiveness of social media efforts.
Customer Insight & Analytics
$96 n/a 1 FTE: research analyst ($96.1).
$806
n/a $170 NL: Customer Research Online Panel - for quantitative research of online customer community.
n/a $270
NL: Qualitative Online Community Research - $160,000 for qualitative research that works in conjunction with quantitative research panels to provide metrics on concepts and media tests through the online community; $30,000 to build business email and phone # database for research and communication outreach; and $80,000 to manage and produce survey content to mobile channels.
n/a $270 NL: $150,000 to expand CES to include social media surveys, and $120,000 for customer behavioral data collection and analysis.
Creative Services
$179 n/a 2 FTEs: 1 community outreach advisor ($96.1), 1 creative services advisor ($83.4).
$329
n/a $150
NL: Development and print of hard-to-reach community media messages, traveling expenses, flyers, pamphlets, promotional material, and booth costs for regional/local events.
eServices & Data Analysis
$372 n/a *4 FTE: 1 e-Service designer ($96.1), 2 e-Service analysts (2x$96.1), and 1 web editor ($83.4).
$652
n/a $280
NL: $215,000 for annual maintenance of mobile applications, enhancements, and promotion; $5,000 annual socalgas.com refresh expenses; $60,000 for intranet gaslines.com platform annual maintenance.
Total Incremental Request
$814 $1,440
$2,254
*3 of the 4 FTEs associated with eServices & Data Analysis are costs driven by associated Capital projects sponsored by Evan Goldman (Ex.SCG-11). See Table 6 for further details.
4
ADA-19 Doc #295436
Customer Marketing & Communications 1
With the expansion of online services offered by companies, there also has been an 2
increased expectation of how customers expect to be serviced. Outside of their interactions with 3
utilities, customers are comparing their interactions with airlines, retailers, banks, and other 4
industries with their utilities and that is starting to shape brand awareness, loyalty, expectations 5
and experiences.22 Our customers are used to transacting across different service channels with 6
their other service providers and we need to ensure we are providing them with a similar 7
experience. In a study conducted in 2013, 83% of our customers said they would probably 8
interact with their utilities via social media.23 9
SoCalGas must be prepared to offer a level of service to its customers via social media. 10
The additional social media support we’re requesting is needed to address the preference for 11
online services by our current and future customers. Customers want accurate, relevant, and 12
complete answers to their questions upon first contact with a company, and they want effortless 13
transitions across multiple touch points (e.g., web, tablet, in-person, etc.) from the channel of 14
their choice (e.g., voice, chat, email, or social) without having to repeat themselves.24 15
Furthermore, the rest of the industry is already offering these services and research has revealed 16
that younger generations (X, Y and Z) prefer online services and that it provides improved 17
customer satisfaction. Per Forrester Research, Inc., survey data shows that, on average, 41% of 18
consumers ages 18 to 46 (Generations X, Y, and Z) prefer online customer service to the 19
telephone. Savvy customer service leaders recognize that developing online customer support 20
channels isn’t just a tactic to build future relationships with today’s younger customers; online 21
customer service is imperative to appeal to the majority of today’s online consumers.25 22
Consumers ages 18 to 44 represent 39% of SoCalGas’ service territory population.26 23
It is also important to note that it is not only the youth that are highly connected and are 24
engaged in social media. The demographics of social media are expanding. “Fully 71% of online 25
adults now use Facebook, and usage among seniors has increased significantly in the last year. 26
22 Adams, Will. “Mobile: Trends and Opportunities 2013”, Chartwell, January 2013, pg.8. 23 SoCalGas, “Customer Insight Panel – Residential Panel Composition & Technology Segments”, March 2013. 24 Leggett, Kate. “Understand Communication Channel Needs to Craft Your Customer Service Strategy”, Forrester Research Inc., March 11, 2013, pg.2. 25 Leggett, Kate. “Understand Communication Channel Needs to Craft Your Customer Service Strategy,” Forrester Research Inc., March 11, 2013, pg.2. 26 Nielsen Pop-Facts 2014.
ADA-20 Doc #295436
Some 45% of internet users age 65 or older now use Facebook, up from 35% who did so in late 1
2012.”27 It is critical that SoCalGas maintain connectivity via social media and online channels 2
with customers to ensure we are providing customer contact channels that are relevant and used 3
by customers for other retail business transactions and communications. 4
Social media continues to be an important communication channel for utilities. This is 5
reflected in a survey conducted by Chartwell in 2013. In 2012, 80% of utilities had Twitter 6
accounts and 71% had Facebook accounts. In 2013, 90% of utilities have Twitter accounts and 7
85% have Facebook accounts.28 Our own research conducted on our ongoing proprietary 8
Customer Insight Panels shows that 82% of our customers use social media in their everyday 9
lives. The most visited sites from our customers include Facebook (84%), YouTube (56%), 10
Twitter (21%) and Instagram (18%).29 SoCalGas currently manages Facebook, Twitter, 11
YouTube and Instagram pages and actively communicates and updates them on an ongoing 12
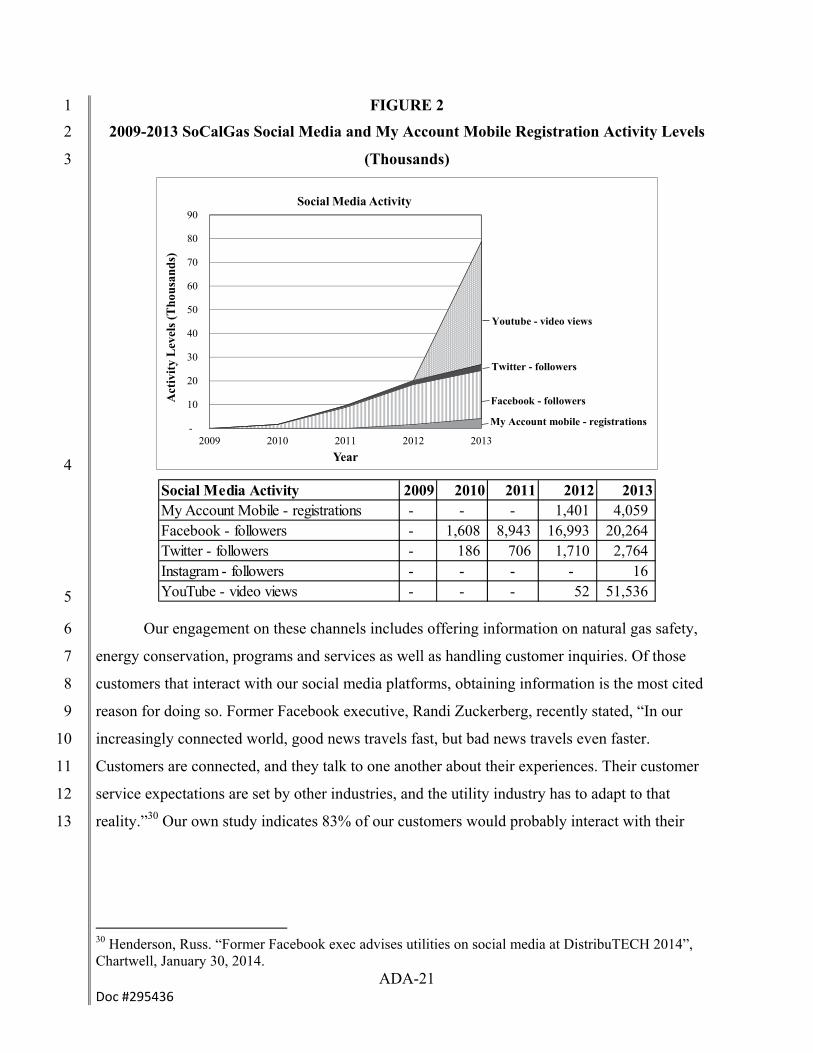
basis. Figure 2 illustrates the 5-year growth of SoCalGas social media and My Account mobile 13
registration activity. 14
15
27 Duggan, Maeve and Aaron Smith. “Social Media Update 2013”, Pew Research Center, January 2014, pg.4. 28 Hieb, Ashley. “Social Media 2013”, Chartwell, August 29, 2013. 29 SoCalGas, “Customer Insight Panel – Residential Panel Composition & Technology Segments”, March 2013.
ADA-21 Doc #295436
FIGURE 2 1
2009-2013 SoCalGas Social Media and My Account Mobile Registration Activity Levels 2
(Thousands) 3
4
5
Our engagement on these channels includes offering information on natural gas safety, 6
energy conservation, programs and services as well as handling customer inquiries. Of those 7
customers that interact with our social media platforms, obtaining information is the most cited 8
reason for doing so. Former Facebook executive, Randi Zuckerberg, recently stated, “In our 9
increasingly connected world, good news travels fast, but bad news travels even faster. 10
Customers are connected, and they talk to one another about their experiences. Their customer 11
service expectations are set by other industries, and the utility industry has to adapt to that 12
reality.”30 Our own study indicates 83% of our customers would probably interact with their 13
30 Henderson, Russ. “Former Facebook exec advises utilities on social media at DistribuTECH 2014”, Chartwell, January 30, 2014.
-
10
20
30
40
50
60
70
80
90
2009 2010 2011 2012 2013
Act
ivit
y L
evel
s (T
hou
san
ds)
Year
Social Media Activity
Youtube - video views
Twitter - followers
Facebook - followers
My Account mobile - registrations
Social Media Activity 2009 2010 2011 2012 2013My Account Mobile - registrations - - - 1,401 4,059 Facebook - followers - 1,608 8,943 16,993 20,264 Twitter - followers - 186 706 1,710 2,764 Instagram - followers - - - - 16 YouTube - video views - - - 52 51,536

ADA-22 Doc #295436
utilities via social media.31 Furthermore, the 2013 J.D. Power Gas Utility Residential Customer 1
Satisfaction Study highlights Social Media as the most satisfying communications channel.32 2
These market forces are the drivers behind an incremental 2 FTEs and $300,000 in non-3
labor dollars above our 5-year historical average costs in Customer Marketing and 4
Communications. SoCalGas’ TY 2016 expense request would actively expand our social media 5
following with increased paid engagement and ad campaigns and production of additional video 6
content for our YouTube channel, and enhance current social media software tools to provide 7
better metrics that track the effectiveness of social media efforts. 8
A key attribute of Social Media is that it also provides the opportunity to communicate 9
with our customers during crisis situations by delivering timely and important messages that 10
address safety related situations when other communication channels are unavailable. In an 11
emergency event, mobile networks tend to overload with congestion and phone calls are unable 12
to connect. As landline use declines and more customers rely solely on mobile phone use,33 13
social media (as well as other e-Channels) becomes an alternative, reliable communication 14
platform to relay messages or alerts. 15
Customer Insights & Analytics 16
The work that the Customer Insights & Analytics team is responsible for will also need to 17
be expanded and is included in this incremental request for resources. The additional work in 18
this area required to support new and expanded channel communications includes 1 additional 19
FTE above the 5-year historical average; and more research in these areas using our existing 20
methods, which include $170,000 non-labor costs for the Customer Research Online Panel 21
(residential and business customer insight online panels determine the value of SoCalGas 22
services, including information provided in different media, information and services topics) and 23
$270,000 non-labor costs for Qualitative Online Community Research (qualitative research 24
allowing for real-time feedback from our customers). To support these methods, we need to 25
invest in collecting business emails and phone numbers to provide for an accurate representative 26
sample of our customer base. 27
31 SoCalGas. “Customer Insight Panel – Residential Panel Composition & Technology Segments”, March 2013. 32 J.D. Power and Associates, “2013 Gas Utility Residential Customer Satisfaction Study”, October 22, 2013. 33 CDC/NCHS, National Health Interview Survey indicates adults with wireless-service-only, have grown from less than 25% in 2009 to over 36% by the end of 2012, pg.1, Figure 1.
ADA-23 Doc #295436
Additionally, $270,000 in incremental non-labor costs to support social media/mobile 1
research and behavioral data collection will be required to allow us to capture customers’ in-the-2
moment experiences on their mobile devices (mobile phones and tablets) in order to gather 3
insights and expectations to better serve the needs of customers in this emerging channel. 4
Mobile internet usage is increasing rapidly. Forrester Research Inc.’s January 2014 study 5
has found that all generations are connected to mobile internet. Younger generations lead; with 6
70% of online Gen Zers and Gen Yers using a smartphone, but even 18% of the Golden 7
Generation have one as well.34 “The number of unique smartphone subscribers is projected to 8
grow at an average annual growth rate of 7% from 2013 to 2017. The number of consumer tablet 9
owners will expand even more rapidly and is forecast to grow at an average annual growth rate 10
of 15% from 2013 to 2017. By 2017, Forrester Research Inc. expects 88% of the total online 11
population to be smartphone subscribers and 54% for the total online population to own a 12
tablet.”35 Despite the growing significance of mobile devices in consumer’s lives, adoption rates 13
of leveraging mobile technologies to collect data for market research purposes is trailing behind. 14
In the latest GreenBook Research Industry Trends (“GRIT”) study, only 17% of research buyers 15
or clients are leveraging mobile surveys.36 However, GreenBook Research Industry Trends 16
expect mobile research with clients/buyers to grow from 17% to an expected 53% and vendors 17
expecting the increase to be from 24% to 64% as adding mobile phones to the research mix 18
allows market insight professionals to minimize the distance between the actual experience and 19
the recall,37 which will provide a more accurate view of events, and facilitate the capture of rich 20
emotional/behavioral insights and connections that might not have been obvious when 21
leveraging traditional research techniques. 22
Creative Services 23
Creative Services requires 1 incremental FTE and $150,000 non-labor costs above the 5-24
year historical average in support of developing a plan to identify high priority opportunities to 25
coordinate information and printed communication collateral for hard to reach customers, which 26
34 Fleming, Gina. “The State of Consumers and Technology: Benchmark 2013, US”, Forrester Research Inc., January 29, 2014, pg.2. 35 Fleming, Gina. “The State of Consumers and Technology: Benchmark 2013, US”, Forrester Research Inc., January 29, 2014, pg.5. 36 “GreenBook Research Industry Trends Report, Spring 2012”, http://www.greenbook.org/PDFs/GRIT-S12-Full.pdf, pg.22. 37 “GreenBook Research Industry Trends Report, Spring 2012”, http://www.greenbook.org/PDFs/GRIT-S12-Full.pdf, pg.25.

ADA-24 Doc #295436
continues to be a challenge across all types of information communication. Hard to reach 1
(residential) customers are defined as those customers who do not have easy access to program 2
information or generally do not participate in programs due to a language, income, housing type, 3
geographic, or homeownership barrier. Hard to reach (business) customers also include factors 4
such as business size and lease barriers. The purpose of this incremental request is to increase 5
customer awareness of programs and services that are available to the hard to reach customers, 6
which are a significant portion of SoCalGas’s customer demographics. SoCalGas customer 7
demographics indicate 35% of customers’ language preference is something other than English, 8
20% of our customers fall under the low income category (household’s total income not to 9
exceed $35,000 year), and where 30% of customers are aged 55+ years, and 14% of which are 10
seniors aged 65+ years.38 To help these customers take advantage of SoCalGas’s programs and 11
services designed to improve safety and save money and energy, this incremental FTE will lead 12
multicultural outreach and communication efforts to increase trust and loyalty with more of our 13
ethnic customer communities.39 Effective outreach in diverse communities requires cultural 14
competency. E-Source leveraged the Nielsen Company’s survey of more than 30,000 residential 15
customers in the U.S. and learned that when customers of ethnically diverse backgrounds 16
become aware of utility energy efficiency offerings (which can apply to other programs and 17
services), they have a higher participation rate than non-ethnic customers do. Per the Nielsen 18
Company, “Forging relationships with ethnic communities can also lower acquisition costs, 19
reduce churn, increase customer commitment, and position the utility as a caring community 20
participant – a positive identity that can earn both ethnic and mainstream customers’ loyalty”.40 21
The responsibilities of this FTE would be to investigate and implement best practices of reaching 22
the hard to reach customer group, which include activities such as: door-to-door canvasing, 23
representing SoCalGas at regional/local events, media streamings targeted towards community 24
channels and local news, and cultivating local partnerships and workshops. 25
Also, Creative Services requires 1 incremental FTE above the 5-year historical average in 26
order to support the expanding volume of communication channels and messages by ensuring 27
consistency of message content, timing and coordination of message releases, and ensuring best 28
38 2013 SoCalGas customer data + Nielsen data. 39 Focus Report, RES-F-43. “Multicultural Marketing and Outreach: How Engaging Key Ethnicities Will Grow Utility Program Participation”, June 6, 2012. 40 Focus Report, RES-F-43. “Multicultural Marketing and Outreach: How Engaging Key Ethnicities Will Grow Utility Program Participation”, June 6, 2012.
ADA-25 Doc #295436
practices for communication outreach and delivery are followed. Based on the past two and a 1
half years’ activity trend of communication material production, the communication messages 2
production rate in this area’s purview will triple 2012’s count (161 completed projects) by 2014 3
(248 production projects have already been completed by 2nd quarter), and continue its’ growth 4
into test year 2016. Another driving influence of production material increase is the growth of 5
SoCalGas’ social media channels, which will continue to evolve how SoCalGas communicates 6
with customers. Social media messages growth (as indicated in the Customer Marketing & 7
Communications section above) generates additional copywriting activities as well. To be most 8
effective with its communications, SoCalGas must speak in one unified corporate branding 9
voice.41 Additional to the social media communications activities, the role of the Creative 10
Services copywriter FTE is to increase and maximize the value provided to our customers on the 11
SoCalGas website by generating cohesive and unified text to sustain a reader’s interest, and 12
ensure “key” terms are used for searchable content, as users often leave a webpage after 20-30 13
seconds, unless the copy holds their interest.42 14
eServices & Data Analysis 15
SoCalGas continues to enhance the eServices available both on socalgas.com and within 16
My Account. SoCalGas also has created applications (“apps”) for both iPhone and Android 17
mobile phones along with a new mobile My Account website in order to keep pace with the 18
increased use of mobile devices and tablets by our customers. However, additional capital 19
projects are required to support growth in mobile phone use and enable the expansion of 20
customer services to more e-Channels (e.g., SMS Text, Mobile Apps, etc.) and enable our 21
customer’s preference to transact with SoCalGas in these e-Channels. This increase in online 22
services will also require more resources to support the operation, troubleshooting, and 23
continuous improvement of the customer experience, as well as for those eServices scheduled to 24
be launched in the coming years. Additional capital projects that impact this area’s O&M costs 25
are further described in Section IV of Evan Goldman’s testimony (Ex.SCG-11). The O&M 26
41 “The key to forming a smashable language is to integrate it into every piece of communication your company is responsible for, including all internal communications.” Lindstrom, Martin. “Establishing A ‘Brand Language”, Brand Strategy Insider, July 28, 2008, http://www.brandingstrategyinsider.com/2008/07/establishing-a.html#.U30QvJGs1cY. 42 Nielsen, Jakob. “How Long Do Users stay On Web Pages?”, N/g Nielsen Norman Group, Sept 12,2011, http://www.nngroup.com/articles/how-long-do-users-stay-on-web-pages/.

ADA-26 Doc #295436
support funding associated and non-associated with these capital projects are outlined in Table 6 1
below. 2
TABLE 6 3
Test Year 2016 Incremental eServices & Data Analysis FTE Summary 4
(Thousands of 2013 dollars) 5
eServices & Data Analysis
FTE Labor Explanation
e-Service designer 1 $96 1 O&M FTE to support My Business Account capital project #81436. See Ex.SCG-11, Section IV.B.5 (Goldman).
e-Service analyst 1 $96
0.25 O&M FTE to support My Business Account capital project #81436. See Ex.SCG-11, Section IV.B.5 (Goldman), and 0.75 O&M FTE to support continued enhancements on socalgas.com and My Account.
e-Service analyst 1 $96 1 O&M FTE to support Integrated Customer Data Analytics capital project #14826. See Ex.SCG-11, Section IV.B.3 (Goldman).
Web editor 1 $83
0.75 O&M FTE to support My Account Mobile 1C capital project #81423. See Ex.SCG-11, Section IV.B.4 (Goldman), and 0.25 O&M FTE to support continued enhancements on socalgas.com and My Account.
Total 4 $372 1 e-Service designer, 2 e-Service analysts, and 1 web editor.
6
The cost drivers behind this forecast are primarily based on the significant growth in 7
customer utilization of socalgas.com and My Account. Visits to SoCalGas www.socalgas.com 8
have grown by over 36% over the last four years and reached over 16 million in 2013. 9
Currently, over 1.9 million customers are registered and actively using SoCalGas’ My Account 10
online services, with over 43,000 new users registering on average each month. Over the last 11
four years, visits to My Account have grown by 100%+ to over 29 million by end of 2013 (see 12
Figure 3). 13
14

ADA-27 Doc #295436
FIGURE 3 1
2009-2013 SoCalGas Web Channels Activity Levels 2
(Thousands) 3
4
5
Monthly visits to our smartphone site “My Account Mobile” over the last two years have 6
grown over 226% to reach 1.3 million annual visits by end of 2013 (see Figure 3). Online 7
payments over the same period have grown 27% to reach over 11 million payments in 2013, 8
totaling over $600 million dollars for the year. 9
Another cost driver is the need to support the various devices used to access 10
socalgas.com and My Account. The continued growth in smartphone and tablet adoption by 11
customers and the increasing variety of mobile device types used by customers increases the cost 12
to design, develop and test each new eService. Nearly two-thirds (63%) of mobile phone owners 13
now use their phone to go online and because 91% of all Americans now own a mobile phone, 14
Web Channels Activity Levels 2009 2010 2011 2012 2013socalgas.com # of Visits 12,113,297 13,147,991 13,560,000 15,807,826 16,452,438 My Account # of Visits 11,307,784 13,500,000* 15,000,000* 17,687,432 29,414,085 My Account Mobile # of Visits n/a n/a n/a 729,089 1,388,282 Total My Account User Registrants 417,816 893,684 1,400,335 1,978,281 2,495,403 # of Mobile Bill Payments n/a n/a n/a 263,967** 505,805 *Annual My Account # of Visits data for 2010 and 2011 was estimated because of incomplete data for the year.**2012 is missing one month of data (Jan. 2012)
ADA-28 Doc #295436
this means that 57% of all American adults are mobile internet users.43 The proportion of mobile 1
phone owners who use their phone to go online has doubled since 2009.44 Additionally, one third 2
of these mobile phone internet users (34%) mostly use their phone to access the internet, as 3
opposed to other devices like a desktop, laptop, or tablet computer.45 Young adults, non-whites, 4
and those with relatively low income and education levels are particularly likely to be mobile-5
mostly internet users.46 Even at households with less than $10,000 household income, 6
Smartphone ownership increased 14% between May 2011 and May 2013 to reach 35%, while 7
42% of those households have broadband and 70% of them go online.47 8
As the fastest growing sector, tablet ownership increased 48 percent since 2012. Growth 9
is highest among those aged 25-34 (74 percent year-over-year growth) and those aged 55 and 10
older (45 percent year-over-year growth).48 The installed base of big brand (e.g., Apple, 11
Samsung, etc.) media tablets is expected to surpass 285 million units at the close of 2013.49 The 12
United States, which has been the largest single tablet market since inception, represents more 13
than 70 million tablets alone, or about one for every four persons.50 14
Another continued cost driver is the requirement to keep all web content on socalgas.com 15
and within My Account, accessible for customers with special needs and compliant with Web 16
Content Accessibility Guidelines (“WCAG”) 2.0. Since 2012, SoCalGas has complied with the 17
TY 2012 GRC Memorandum of Understanding with the Center for Accessible Technology by 18
modifying My Account to be WCAG 2.0 compliant, by providing Accessibility training to web 19
43 Duggan, Maeve and Aaron Smith. “Cell Internet Use 2013”, Pew Research Internet Project, September 16, 2013, http://www.pewinternet.org/2013/09/16/cell-internet-use-2013/. 44 Duggan, Maeve and Aaron Smith. “Cell Internet Use 2013”, Pew Research Internet Project, September 16, 2013, http://www.pewinternet.org/2013/09/16/cell-internet-use-2013/. 45 Duggan, Maeve and Aaron Smith. “Cell Internet Use 2013”, Pew Research Internet Project, September 16, 2013, http://www.pewinternet.org/2013/09/16/cell-internet-use-2013/. 46 Duggan, Maeve and Aaron Smith. “Cell Internet Use 2013”, Pew Research Internet Project, September 16, 2013, http://www.pewinternet.org/2013/09/16/cell-internet-use-2013/. 47 Smith, Aaron. “Technology Adoption by Lower Income Populations”, Pew Research Internet Project, October 8, 2013, http://www.pewinternet.org/2013/10/08/technology-adoption-by-lower-income-populations/. 48 “Deloitte Mobile Consumer Survey: Speed’s Hot, Apps Not, Price Matters – Sometimes”, Deloitte, November 20, 2013, http://www.deloitte.com/view/en_US/us/press/Press-Releases/08ac7c50fba72410VgnVCM3000003456f70aRCRD.htm. 49 “Big Brand Tablet Installed Base to Surpass 285 Million by Year’s End”, ABI Research – Research News, December 19, 2013, https://www.abiresearch.com/press/big-brand-tablet-installed-base-to-surpass-285-mil. 50 Big Brand Tablet Installed Base to Surpass 285 Million by Year’s End”, ABI Research – Research News, December 19, 2013, https://www.abiresearch.com/press/big-brand-tablet-installed-base-to-surpass-285-mil.

ADA-29 Doc #295436
team employees, by contracting with third-parties to audit socalgas.com, and by the continued 1
remediation of web content to be WCAG 2.0 compliant. 2
Areas requiring expanded funding include 4 additional FTEs and $280,000 in incremental costs 3
above the 5-year average historical costs in eServices to provide more eServices via the web, 4
smartphones, email and text to small and medium businesses (of which 1.25 FTEs are to support 5
the capital IT project “SCG My Business Account, Project #81436”, 1 FTE is for supporting the 6
capital IT project “Integrated Customer Data Analytics, Project #14826”, and 0.75 FTE to 7
support the capital IT project My Account Mobile 1C, Project #81423”, see Ex.SCG-11, Section 8
IV [Goldman]). Small and medium businesses have specific needs for online bill payment, 9
account management, usage analysis, and utility information that are dissimilar to the residential 10
online customer and require the creation of business specific eServices. Support for these new 11
small and medium business eServices will expand the need for resources to manage, trouble-12
shoot and govern the Business My Account Portal. Usage of the Business My Account portal is 13
expected to reach 40-50% of our small and medium business customers within 3 years (based on 14
growth trends derived from data on business accounts in My Account from August 2011 15
compared to June 2014). Recent research shows that 80% of our business customers think it is 16
very important to them to be able to view their account information online, 73% say it is very 17
important to them to be able to pay their bill online and 57% say it is very important to them to 18
view historical gas usage online (SoCalGas Customer Insight Panel, July 2012). 19
Additional resources are needed to keep pace with the overall growth in online service 20
usage, which has increased 54% over the last two years to exceed 432,000 online transactions in 21
2013. This growth has required an increased level of effort to manage the customer experience 22
across all our online service channels and the level of effort required for continued compliance of 23
accessibility for people with disabilities as per the Memorandum of Understanding with the 24
Center for Accessible Technology adopted in 2012. Usability testing is required to assess the 25
usability of the online services to maintain a customer experience within My Account that 26
enables customers to easily find, understand and complete transactions within My Account. 27
Resources are also needed to support the expanded use of socalgas.com by customers. 28
Continued investment in this area is needed to ensure that information on socalgas.com is easy to 29
find, easy to understand, and provides relevant insights on energy usage or program information 30
for visitors. Increased web support for new features and pages, enhancements to existing 31
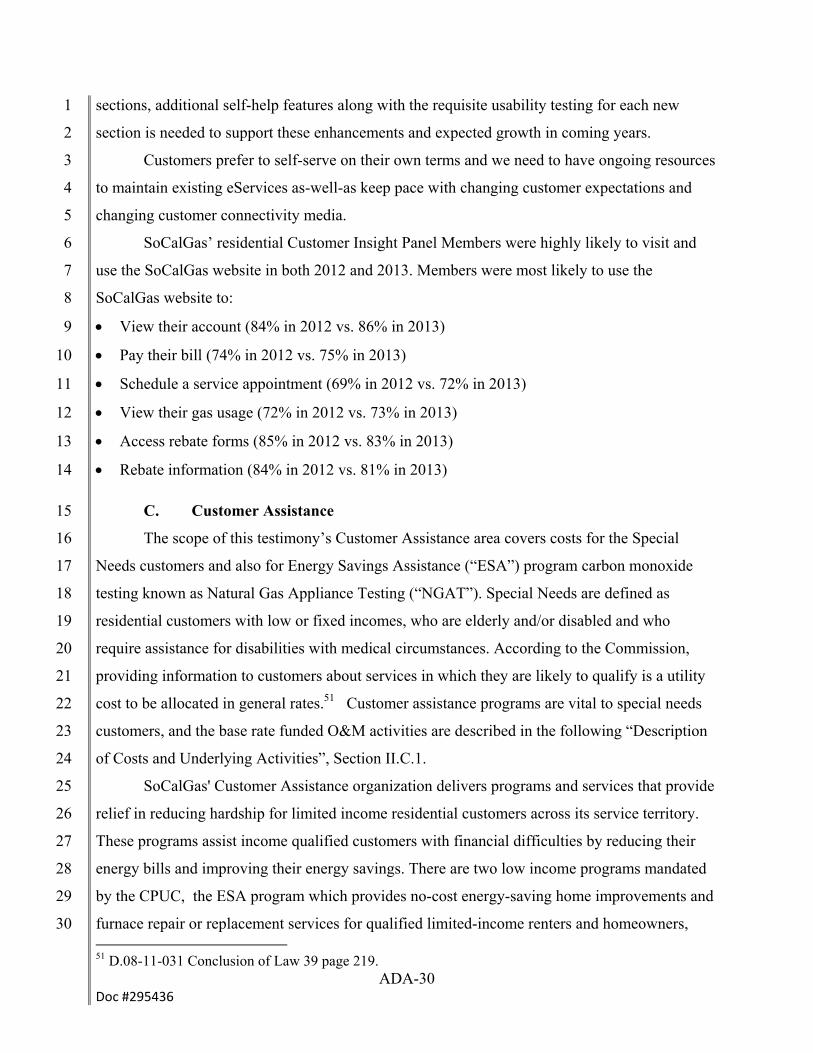
ADA-30 Doc #295436
sections, additional self-help features along with the requisite usability testing for each new 1
section is needed to support these enhancements and expected growth in coming years. 2
Customers prefer to self-serve on their own terms and we need to have ongoing resources 3
to maintain existing eServices as-well-as keep pace with changing customer expectations and 4
changing customer connectivity media. 5
SoCalGas’ residential Customer Insight Panel Members were highly likely to visit and 6
use the SoCalGas website in both 2012 and 2013. Members were most likely to use the 7
SoCalGas website to: 8
View their account (84% in 2012 vs. 86% in 2013) 9
Pay their bill (74% in 2012 vs. 75% in 2013) 10
Schedule a service appointment (69% in 2012 vs. 72% in 2013) 11
View their gas usage (72% in 2012 vs. 73% in 2013) 12
Access rebate forms (85% in 2012 vs. 83% in 2013) 13
Rebate information (84% in 2012 vs. 81% in 2013) 14
C. Customer Assistance 15
The scope of this testimony’s Customer Assistance area covers costs for the Special 16
Needs customers and also for Energy Savings Assistance (“ESA”) program carbon monoxide 17
testing known as Natural Gas Appliance Testing (“NGAT”). Special Needs are defined as 18
residential customers with low or fixed incomes, who are elderly and/or disabled and who 19
require assistance for disabilities with medical circumstances. According to the Commission, 20
providing information to customers about services in which they are likely to qualify is a utility 21
cost to be allocated in general rates.51 Customer assistance programs are vital to special needs 22
customers, and the base rate funded O&M activities are described in the following “Description 23
of Costs and Underlying Activities”, Section II.C.1. 24
SoCalGas' Customer Assistance organization delivers programs and services that provide 25
relief in reducing hardship for limited income residential customers across its service territory. 26
These programs assist income qualified customers with financial difficulties by reducing their 27
energy bills and improving their energy savings. There are two low income programs mandated 28
by the CPUC, the ESA program which provides no-cost energy-saving home improvements and 29
furnace repair or replacement services for qualified limited-income renters and homeowners, 30 51 D.08-11-031 Conclusion of Law 39 page 219.

ADA-31 Doc #295436
(“weatherization services”); and the California Alternate Rates for Energy (“CARE”), which 1
provides eligible customers a 20 percent discount on their monthly gas bill at their primary 2
residence, and where new customers (who are approved within 90 days of starting new gas 3
service) may also receive a $15 discount on their Service Establishment Charge. Customers 4
must meet income guidelines to be eligible for these programs. The budgets for these two low 5
income programs are addressed in a separate application process and are funded through the 6
Public Purpose Surcharge and not through base rates.52 7
For TY 2016, SoCalGas is requesting a total of $4.253 million for Customer Assistance 8
non-shared services. This forecast is based on a 5-year average cost, as described in Section 9
II.C.2., with an incremental funding request of $1.419 million over the 2013 base year spend for 10
the following: 11
Natural Gas Appliance Testing; 12
Medical Baseline Program Outreach; 13
Table 7 summarizes O&M expenses for Customer Assistance. 14
TABLE 7 15
Test Year 2016 Summary of Non-Shared Customer Assistance Costs 16
(Thousands of 2013 dollars) 17
CS – INFORMATION Shown in Thousands of 2013 Dollars C. Customer Assistance 2013 Adjusted-
Recorded TY2016
Estimated Change
1. Customer Assistance $2,834 $4,253 $1,419Total $2,834 $4,253 $1,419
1. Description of Costs and Underlying Activities 18
Energy Savings Assistance Programs Related to Natural Gas Appliance Testing 19
The home weatherization activities that SoCalGas performs in the Energy Savings 20
Assistance (“ESA”) program authorized and funded in the Low Income Proceeding have an 21
associated level of required carbon monoxide testing known as Natural Gas Appliance Testing 22
(“NGAT”). SoCalGas’ ESA program contractors provide NGAT service in their normal course 23
52 Through the Commission’s Low Income Proceeding, SoCalGas’ (U338E) Application (A.) 11-05-017 for approval of LIEE and CARE programs and budgets for Program Years (“PY”) 2012-2014 was filed May 16, 2011 and approved in D. 12-08-044.
ADA-32 Doc #295436
of business. After performing certain energy efficiency measures such as weather-stripping, 1
caulking, or window and door repair that affect air infiltration, contractors are required to check 2
the safe functioning of all gas appliances in the home. The process involves a visual check as 3
well as turning on each gas appliance and measuring CO levels. The Low Income proceeding 4
decision, D.08-11-031, ordered SoCalGas to charge NGAT to base rates rather than to the Public 5
Purpose Program funds as a “basic utility service”.53 In the instance of the 2009-2011 ESA 6
program cycle where the Commission mandated a greater number of treated homes than 7
forecasted in the associated GRC cycle, the Commission approved a memorandum account to 8
recover these incremental costs to base rates.54 9
Medical Baseline Program 10
The Medical Baseline (“MBL”) Program is a Commission-mandated program designed 11
to provide additional baseline allowance to households where a family member has a medical 12
condition that requires additional heating to sustain the individual’s health.55 SoCalGas’ MBL 13
activities include outreach, enrollment and application processing, customer support, and 14
participant recertification. Participants are recertified either annually or bi-annually depending on 15
their medical condition. At the end of 2013, approximately 32,000 customers were enrolled in 16
MBL. The most recent study of SoCalGas’s Medical Baseline eligible population continues to 17
be from the 2010 report from Athens Research,56 which estimates an MBL eligible population of 18
approximately 71,000, indicating an enrollment of approximately 45% of the eligible population. 19
There remain potentially 55% of unreached MBL program eligible customers, which 20
SoCalGas will continue to focus on expanding program awareness to. These activities will be 21
further detailed in Section II.C.3, Cost Drivers. 22
Gas Assistance Fund 23
The Gas Assistance Fund (“GAF”) program provides bill payment assistance of up to 24
$100 per year to income qualified SoCalGas customers experiencing financial hardship.57 25
SoCalGas shareholders, employees, and customers contribute to the GAF program. In October 26
53 D. 08-11-031 Ordering Paragraph 65 page 231. 54 D.10-12-002. 55 Medical Baseline is available to paraplegics and quadriplegics, multiple sclerosis patients, scleroderma patients, and people being treated for a life threatening illness or who have a compromised immune system. See http://www.socalgas.com/assistance/medallowance. 56 Athens Research report, issued June 20, 2010, provides rough estimate of SoCalGas’s MBL eligible population to be approximately 71,000. 57 Gas Assistance Fund: http://www.socalgas.com/assistance/gaf/.
ADA-33 Doc #295436
and November of each year, SoCalGas solicits customers for contributions to the GAF program, 1
and SoCalGas shareholders match those contributions, generally on a dollar-for-dollar basis, up 2
to $250,000. In 2013, as approved in Advice Letter (“AL”) 4168, the remaining $1,000,000 in 3
ratepayer funds was used to provide energy assistance to qualified customers. In 2013, the GAF 4
program disbursed over $881,603 and helped more than 10,000 customers to pay their gas 5
bill. Customer Assistance promotes the program, and United Way of Greater Los Angeles 6
(“UWGLA”) is the program administrator; working with more than 70 Community Based 7
Organizations (“CBO’s”) to qualify customers and complete the intake applications. 8
Low Income Home Energy Assistance Program 9
The Low Income Home Energy Assistance Program (“LIHEAP”) is a federally funded 10
assistance program administered by the state that provides bill payment assistance and home 11
weatherization services to qualified customers.58 Customer Assistance works with LIHEAP 12
agencies to ensure that payments are received from the California Department of Community 13
Services and Development (“CSD”) and are applied correctly to customers’ bills.59 14
2-1-1 / 3-1-1 15
The 2-1-1 nationwide telephone service provides callers with information on community, 16
health and disaster services. In 2013, twelve 2-1-1 county-based agencies and a city-based 3-1-1 17
agency were provided with SoCalGas’ Customer Assistance and general utility information.60 18
SoCalGas works closely with 2-1-1/3-1-1 agencies so that callers receive the most up-to-date 19
information on Customer Assistance programs and services. Customer Assistance also worked 20
with 2-1-1 county agencies to include links for SoCalGas program information on local 2-1-1 21
websites, for example the Los Angeles County 2-1-1 site www.infoline-la.org. 22
2. Forecast Method 23
The forecast method I chose for this cost category is a five-year historical average with 24
adjustment for specific program activities related to MBL and NGAT. This method is most 25
appropriate because the historical years of 2009-2013 are reflective of costs that have been and 26
continue to be core operational program activities.61 Forecast adjustments for specific program 27
58 Low Income Home Energy Assistance Program: http://www.socalgas.com/assistance/liheap/. 59 The state Department of Community Services & Development administers the federally funded Low-Income Home Energy Assistance Program (LIHEAP) in California. 60 Fresno, Imperial (Sure Helpline), Kern, Kings, Los Angeles, Orange, Riverside, San Bernardino, Santa Barbara, San Luis Obispo, Ventura, and Tulare Counties, and City of L.A. 311 Program. 61 See Ex.SCG-12-WP- 2IN002.000 for explanation of adjustment made to historical year 2011.
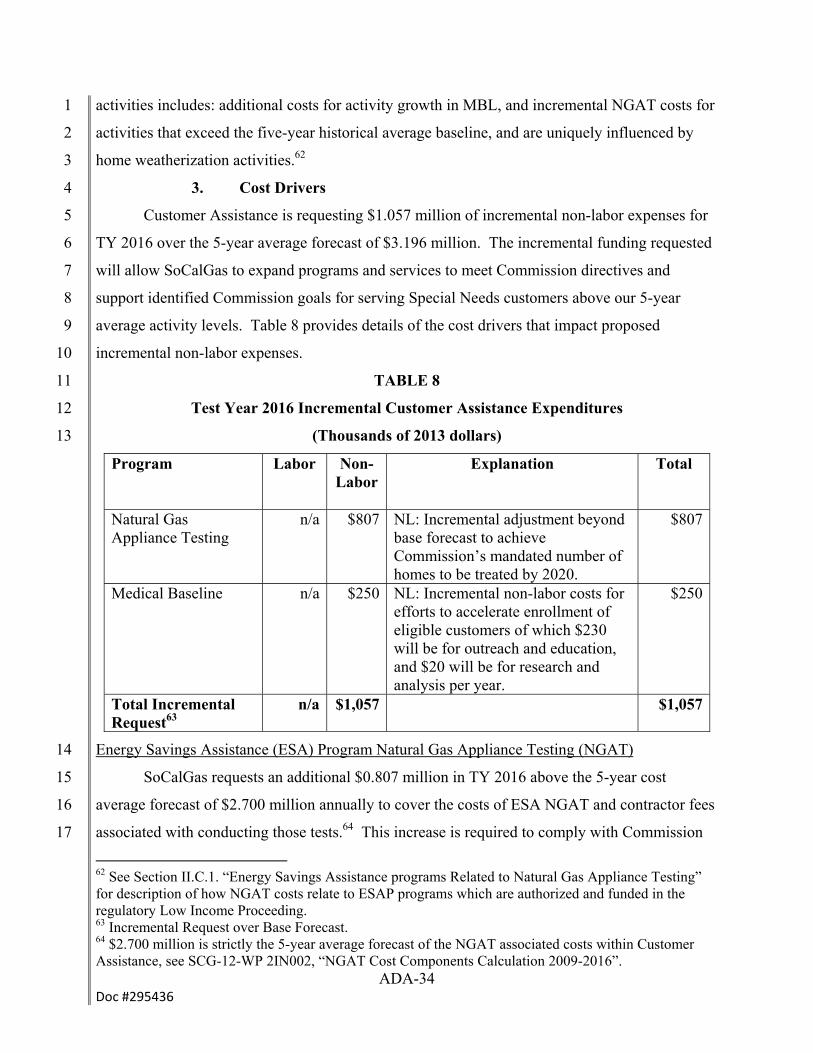
ADA-34 Doc #295436
activities includes: additional costs for activity growth in MBL, and incremental NGAT costs for 1
activities that exceed the five-year historical average baseline, and are uniquely influenced by 2
home weatherization activities.62 3
3. Cost Drivers 4
Customer Assistance is requesting $1.057 million of incremental non-labor expenses for 5
TY 2016 over the 5-year average forecast of $3.196 million. The incremental funding requested 6
will allow SoCalGas to expand programs and services to meet Commission directives and 7
support identified Commission goals for serving Special Needs customers above our 5-year 8
average activity levels. Table 8 provides details of the cost drivers that impact proposed 9
incremental non-labor expenses. 10
TABLE 8 11
Test Year 2016 Incremental Customer Assistance Expenditures 12
(Thousands of 2013 dollars) 13
Program Labor
Non-Labor
Explanation Total
Natural Gas Appliance Testing
n/a $807 NL: Incremental adjustment beyond base forecast to achieve Commission’s mandated number of homes to be treated by 2020.
$807
Medical Baseline n/a $250 NL: Incremental non-labor costs for efforts to accelerate enrollment of eligible customers of which $230 will be for outreach and education, and $20 will be for research and analysis per year.
$250
Total Incremental Request63
n/a $1,057 $1,057
Energy Savings Assistance (ESA) Program Natural Gas Appliance Testing (NGAT) 14
SoCalGas requests an additional $0.807 million in TY 2016 above the 5-year cost 15
average forecast of $2.700 million annually to cover the costs of ESA NGAT and contractor fees 16
associated with conducting those tests.64 This increase is required to comply with Commission 17
62 See Section II.C.1. “Energy Savings Assistance programs Related to Natural Gas Appliance Testing” for description of how NGAT costs relate to ESAP programs which are authorized and funded in the regulatory Low Income Proceeding. 63 Incremental Request over Base Forecast. 64 $2.700 million is strictly the 5-year average forecast of the NGAT associated costs within Customer Assistance, see SCG-12-WP 2IN002, “NGAT Cost Components Calculation 2009-2016”.
ADA-35 Doc #295436
directives to support the ongoing number of tests required on ESA serviced homes, which is 1
proposed to consist of 118,000 homes treated per year, and is anticipated to be consistent with 2
the filing of the Low Income Proceeding application for program years 2015-2017.65 For TY 3
2016, SoCalGas forecasts the annual cost for 118,000 homes at $35 per test (constant 2013 $s), 4
which amounts to an annual program funding requirement of $3.511 million. The forecasted 5
NGAT volume is estimated based on testing 85% of the 118,000 ESA homes to be 6
weatherized.66 NGAT costs will continue to be incurred in TY 2016 and beyond, as SoCalGas 7
continues to perform weatherization activities to meet the Commission’s 100% programmatic 8
initiative by 2020. SoCalGas pays a fixed rate for each test performed, to each of over 30 9
contractors providing NGAT.67 SoCalGas routinely (annually, or more frequently when 10
necessary) evaluates the rates it pays for each ESA program service (which includes NGAT) and 11
attempts to align rates with market conditions based on factors such as: market rates for labor 12
and materials, the expressed views of the program’s contractors, contractor behavior, and 13
program performance. SoCalGas seeks to protect ratepayer interests during negotiations with 14
contractors by procuring the entire range of ESA program services at the lowest total cost. While 15
SoCalGas has managed to negotiate costs from 2009-2013 to an average expense of $29.68 per 16
test,68 current estimates of contractors’ costs based on time and materials basis, as well as 17
65 The 2015-2017 Low Income Proceeding application filing date is targeted for November 18, 2014. The forecast of 118,000 homes may ultimately be different in the Low Income application or proceeding outcome. The previous 2012-2014 Low Income Proceeding adopted a higher number of homes treated than what is anticipated for filing in the 2015-2017 Low Income Proceeding application. The lower forecast of homes treated in the 2015-2017 application is due to an updated study: “Needs Assessment for the Energy Savings Assistance and the California Alternate Rates for Energy Programs” provided by Evergreen Economics on December 16, 2013 which identifies a higher unwillingness and ineligibility rate. 66 Not all homes treated by the LIEE program require NGAT. However, based on the California Conventional Home Weatherization Installation Standards Section 24, Part 1(2), which states that: “in homes receiving infiltration measures, NGAT shall be conducted when the home is heated with natural gas, or has one or more other natural gas appliances affecting the living space,” 85% is a reasonable estimate. From 2009-2013, 5-year average indicates 81% of homes were treated through the LIEE Program required NGAT, with an increase in percentage of treated homes to 87% from 2012-2013, see SCG-12-WP-2IN002, “NGAT Cost Components Calculation 2009-2016”. 67 Each of these contractors also provides numerous other services to the ESA program related to weatherization and appliance work. On average, NGAT makes up less than 10% of the costs paid to a contractor by SoCalGas for a given ESA program serviced home. 68 See Ex.SCG-12-WP-2IN002, “NGAT Cost Components Calculation 2009-2016”.
ADA-36 Doc #295436
comparable market data references, 69 leads SoCalGas’ anticipated costs per unit test to escalate 1
to $35 by TY2016 (in constant 2013 $s). SoCalGas estimates that depending on the particular 2
home, NGAT can take up to 1 hour to complete and that such a comprehensive service offered 3
on a retail basis would cost an estimated $100/test, which are comparable to assertions from the 4
Energy Efficiency Council that the NGAT process takes between 60 and 90 minutes and has a 5
fair market value between $125 and $250. 70,71 SoCalGas anticipates based on discussions with 6
program contractors and evaluation of market conditions, a substantial increase to the NGAT rate 7
is anticipated during this next program cycle. Fortunately, SoCalGas has maintained the rate 8
established over 8 years ago, but believes the current rate cannot be sustained. The length of this 9
period and corresponding inflation only adds to the likely magnitude of an inevitable increase. 10
Periodic adjustments have been made to other ESA Program services, including an average 11
increase of over 4% to the range of weatherization services for 2014 from 2013. 12
In the event the adopted forecast volume increases significantly due to changes in the 13
2015-2017 ESA program cycle, for instance if there is a revision in state mandated eligibility 14
criteria for ESA programs, SoCalGas will file supplemental testimony to request additional 15
funding that is consistent with 2015-2017 ESA homes (units) authorized forecast. 16
Medical Baseline Customer Outreach 17
The SoCalGas goal for MBL is to enroll the eligible population across the service 18
territory into the program. At the end of 2013, approximately 32,000 were enrolled in MBL, 19
representing an annual increase of 6.2 percent since 2010. This goal established by SoCalGas 20
also supports the Commission’s ESA programs enrollment goal for households with 21
disabilities,72,73 as customers on the MBL program can be cross-referenced with participating 22
69 Pacific Gas and Electric Company, 2014 GRC, Exhibit (PG&E-5) Chapter 7, Customer Energy Solutions Table 7-33 publishes their comparable service of 2012 NGAT to be a negotiated cost of $39.00/test. 70 The Energy Efficiency Council is a group of community-based organizations and private contractors who provide ESA program services in California. 71 Letter via email, Allan Rago to Kim Hassan dated October 10, 2011, RE: SDG&E's first set of data requests to the Energy Efficiency Council dated September 28, 2011 - A.11-05-020. 72 PU Code 382€ states, “The Commission and electrical corporations and gas corporations shall make all reasonable efforts to coordinate ratepayer-funded programs with other energy conservation and efficiency programs.” 73 D.12-08-044, page 408, “We approve the proposed continuation of the 15% disabled household Energy Savings Assistance Program penetration enrollment goal.”
ADA-37 Doc #295436
customers in the ESA program who have not been identified as a disabled household.74 1
SoCalGas proposes incremental non-labor funding of $250,000 above the base forecast to 2
support increased outreach. This will primary be done through additional support to Community 3
Based Organizations (“CBO”s) who are an effective channel for distribution of applications and 4
explanation of the program. Of the incremental request, $230,000 will support the following 5
activities: 6
Additional training resources to provide more support than currently available for 7
coordinating with CBOs on MBL promotional efforts. It is anticipated the additional support 8
for CBOs will support bolstering enrollment. The additional training will focus on educating 9
CBOs regarding program eligibility requirements and training CBOs on eligible conditions 10
for MBL in order to assist customers in completing the customer section of the application,75 11
Leveraging the CBO network to further promote MBL by targeting new enrollment channels 12
such as limited English proficient communities, among others that may be identified in the 13
updated eligible population study (discussed below), 14
And developing educational and enrollment materials in multiple languages, and a higher 15
volume of communication materials to support multiple channels of delivery, including an 16
educational video, promotional handouts for community events, health fairs and expos, and 17
collateral material to provide for the use of CBOs. 18
An incremental $20,000 will be designated for additional research and analysis to update 19
the 2010 eligible population study and determine the most effective approach to maximize 20
program participation.76 The last study conducted in June 2010, estimated the eligible MBL 21
population at approximately 71,000. SoCalGas believes a new study will render estimates that 22
provide a more current eligibility population to refine targeted outreach efforts. 23
D. Customer Segment Markets 24
This section summarizes activities and costs incurred by the organizations that together 25
serve the Customer Segment Markets. This group manages customer accounts, develops 26
education and communication materials on gas rates, tariffs, contracts, and safety, and provides 27
74 Customers can not be asked directly whether they or a member of their household has a disability, so visual identification by program staff are used as well as when customers self-identify by letting SoCalGas staff know or by signing up for MBL. 75 To be communicated through local dialysis centers, veteran hospitals, senior centers, and other high propensity health care facilities. 76 Athens Research report, issued June 20, 2010.

ADA-38 Doc #295436
regulatory information for nonresidential and residential customers. The activities in this section 1
are organized under two subgroups: 2
1) Energy Markets & Capacity Products handles account management for very large 3
customers, including enhanced oil recovery; municipal, merchant and utility electric 4
generation, including large cogeneration; and wholesale customers. This group also 5
establishes interconnections for California gas and biogas suppliers; markets 6
unbundled storage capacity and the California Energy Hub77; manages the business 7
relationship with unbundled storage and hub service customers; and purchases natural 8
gas to maintain system integrity. The costs related to shared-services activities in this 9
organization that support both SoCalGas and SDG&E are discussed separately in 10
Section III of this testimony. 11
2) Segment Services provides account management and other customer services 12
including education and training to small, medium and large commercial, industrial 13
and government customers; small business, developers and residential builders; as 14
well as residential customers. 15
The customer segments in which Energy Markets & Capacity Products and Segment 16
Services encompass are further identified in the following: Table 9, Customer Segment - 17
Account Management Matrix. 18
19
77 California Energy Hub: http://www.socalgas.com/for-your-business/ceh.shtml.

ADA-39 Doc #295436
TABLE 9 1
Customer Segments - Account Management Matrix 2
Customer Segment Description
Ene
rgy
Mar
kets
&
Cap
acit
y P
rodu
cts
Energy Markets Large electric generators, wholesale, international, and enhanced oil recovery and California gas and biogas supplier interconnections.
Seg
men
t Ser
vice
s
Select Industry
Noncore or noncore eligible (>250,000 therm/year consumption) manufacturers, large hospitals, petroleum refineries, Los Angeles City and County, State and Federal Accounts.
Geographically Assigned Commercial & Industrial Customers
Hotels, restaurant chains, small hospitals, school districts, small manufacturers, grocery chains, restaurant chain accounts, colleges, >50,000 therm/year accounts.
Small, Medium, Business
Medium (> 10,000 therm/year, and < 50,000 therm/year consumption) commercial & industrial customers, small (<10,000 therm/year consumption) commercial & industrial customers.
Residential, Home Builders, Developers
Single family, multi-family, and master meter residential accounts.
For TY 2016, SoCalGas is requesting a total of $11.491 million for Customer Segment 3
Markets. This forecast is based on a 5-year average cost, as detailed in Section II.D.1.b. and 4
Section II.D.2.b., with an incremental funding request of $3.171 million over 2013 base year 5
spend to accomplish the following: 6
Increase account management and staff support to accommodate increased regulatory and 7
market driven customer service and account turnover activity in the Energy Markets’ electric 8
generation (“EG”) and enhanced oil recovery (“EOR”) customer segments. Key drivers of 9
this activity in the EG market are environmental, legislative and regulatory initiatives and 10
11
ADA-40 Doc #295436
equipment technology advances.78,79 Per the California Energy Commission, “Dispatchable 1
natural gas-fired generation is the dominant source of electricity and accounted for 43 2
percent of all generation in California in 2012. As California and the rest of the nation strive 3
to integrate a higher percentage of renewable-derived energy into their electricity generation 4
portfolio, the role of natural gas will likely change. In addition, the closure of San Onofre 5
Nuclear Generation Station and retirement of once-through cooling generation facilities in 6
California will require replacement generation, some of which will likely come from natural 7
gas-fired generation.80 For the EOR market, activity is generated by sustained high oil prices 8
coupled with low natural gas prices, which leads to greater oilfield development. Energy 9
Markets will also see significant increases in activity related to managing and implementing 10
new California Gas Producer Access Agreements and the new California Producer Service 11
tariff recently approved by the Commission orders in Decision D.07-08-029, D.10-09-001 12
and AL4177-A, as well as California Producer interconnection activities, including inquiries, 13
capacity studies, preliminary and detailed engineering studies. New agreements are expected 14
to grow from recent elevated levels due to sustained high oil prices, which encourage oilfield 15
development and the production of associated gas. Activity could accelerate further if the 16
Monterey shale is developed (as shale reservoirs have been developed elsewhere in the 17
United States,81 and as 3 of the 5 Monterey/Santos shale play lease holders [have since 18
2010], commenced development activities82). In addition, new biogas interconnections are 19
expected from the passage and implementation of AB1900 promoting pipeline access to the 20
gas pipeline system for landfill derived biogas pursuant to R.13-02-008, D.14-01-034 and 21
subsequent cost allocation decisions. 22
78 “The WECC California (CAMX) region accounts for both the highest absolute level of nonhydropower renewable generation in 2040 and the largest growth from 2012 to 2040, which is supported by an aggressive renewable portfolio standard (“RPS”), availability of solar, wind, and geothermal resources, and relatively high electricity prices.” “Annual Energy Outlook 2014 with projections to 2040”, U.S. Energy Information Administration, April 2014, pg. MT-20. 79 “2012 California Gas Report”, prepared by the California gas and electric utilities, July 2012, pages 11-12. 80 “California Natural Gas Data and Statistics – Overview”, California Energy Commission, http://www.energyalmanac.ca.gov/naturalgas/index.html. 81 “Review of Emerging Resources: U.S. Shale Gas and Shale Oil Plays”, U.S. Energy Information Administration, July 2011, pg.4, http://www.eia.gov/analysis/studies/usshalegas/pdf/usshaleplays.pdf. 82 “Review of Emerging Resources: U.S. Shale Gas and Shale Oil Plays”, U.S. Energy Information Administration, July 2011, pg.76. http://www.eia.gov/analysis/studies/usshalegas/pdf/usshaleplays.pdf.

ADA-41 Doc #295436
Implement account services for small and medium business customer segments (defined as < 1
50,000 therm/year consumption), 2
Establish account services for home builders, developers, and residential customer segments, 3
and 4
Advance market education and adoption of combined heat and power (“CHP”) systems 5
through implementation support with emissions permitting, feasibility analysis, gas quality 6
data, and available incentive funding support. 7
Table 10 summarizes O&M expenses for non-shared services by the Segment Services 8
group. 9
TABLE 10 10
Test Year 2016 Summary of Non-Shared Customer Segment Markets Costs 11
(Thousands of 2013 dollars) 12
CS – INFORMATION Shown in Thousands of 2013 Dollars D. Customer Segment Markets 2013 Adjusted-
Recorded TY2016
Estimated Change
1. Energy Markets & Capacity Products $1,801 $2,078 $2772. Segment Services $6,519 $9,413 $2,894Total $8,320 $11,491 $3,171
1. Energy Markets & Capacity Products 13
a. Description of Costs and Underlying Activities 14
The three major activities of Energy Markets & Capacity Products include: 1) account 15
management providing personalized attention to large and complex enhanced oil recovery 16
(“EOR”), electric generation (“EG”) and wholesale customers, and interconnection of and 17
upgrading existing facilities and contract administration for California gas producers and biogas 18
producers; 2) storage and hub services83, marketing unbundled storage capacity and hub services 19
to customers; and 3) staff support for the account management activity, including regulatory 20
support and policy development, tariff development and compliance, contract development, 21
market and competitive analysis, business controls and demand forecasting. 22
83 See California Energy Hub: http://www.socalgas.com/for-your-business/ceh.shtml.
ADA-42 Doc #295436
Energy Markets Account Management 1
To effectively meet the needs of Energy Market segment customers, SoCalGas delivers 2
individualized account management services through highly trained and specialized customer 3
contact personnel – Account Representatives (“ARs”). Customer interactions with ARs are 4
critical to safe and reliable service delivery, regulatory compliance, and customer satisfaction. 5
Topics often discussed include: 6
Safe use of natural gas; 7
Bill explanations; 8
Bill issues resolution; 9
Rate options, advise on tariffs, and contract management; 10
Project management for requests for new and expanded natural gas service; 11
Emergency preparedness and business resumption planning; 12
Air quality regulation permitting and compliance; and 13
Technical information. 14
Energy Markets segment customers are noncore and represent most of the largest 15
customers on the SoCalGas system,84 and approximately 45% of 2013 SoCalGas’ system 16
throughput. Typical customers are large cogeneration facilities greater than 20 megawatts 17
(“MW”), large EG (including Utility Electric Generators and Exempt Wholesale Generators), 18
EOR and wholesale customers. ARs for Energy Markets typically handle a smaller number of 19
accounts, on average, compared to other ARs mentioned in the following section (Section 20
II.D.2), which reflects the fact that Energy Market customers are inherently more complex to 21
serve, likely having multiple accounts served by multiple meters involving more complex 22
measurement technology, among other issues. ARs also manage services, communications, and 23
contract administration for approximately 45 active California gas producer meters representing 24
55 access arrangements. In addition, these representatives are responsible for responding to 25
capacity access inquiries from new California gas producers and biogas producers, and for 26
managing the interconnection process, including facilities upgrades and gas quality enforcement. 27
For this reason, Energy Market ARs must maintain industry specific expertise, have frequent 28
contact with their customer base, and rely on knowledgeable support, planning and 29
administration from Energy Markets Staff Support and be able to effectively identify, 30
84 There are currently 96 Energy Market Segment customers.
ADA-43 Doc #295436
communicate and solicit support from diverse company resources ranging from commercial, 1
regulatory and litigation, to engineering, operations, and billing. 2
Storage Products and Hub Services 3
Storage Products and Hub Services operate the California Energy Hub to provide 4
unbundled natural gas storage and parking services,85 and to procure natural gas to maintain 5
system integrity. Storage Products and Hub Services manages the sales of storage products and 6
hub services through sales campaigns, open seasons, and bi-lateral negotiations, to meet 7
customer needs and to maximize value for SoCalGas and its ratepayers. From 2009 to 2013, this 8
group generated a $115.5 million benefit to ratepayers through the sales of storage products and 9
services. In order to meet their objectives, this group cultivates and builds trusting, long-term and 10
productive working relationships with both established storage products and hub services 11
customers and other market participants. This group negotiates and executes storage and hub 12
transactions with their customers, and manages open seasons for storage capacity. They also 13
manage requests for proposals for reliability supply needs, storage expansions, and related new 14
services. This group also directs the focus of special studies to uncover sales opportunities for 15
storage and hub services. The studies are generally conducted by the Capacity Products Staff that 16
is a shared service discussed in Section III.B. 17
Energy Markets Staff Support 18
The Energy Markets Staff Support group works to support the needs of customers, 19
California gas and biogas producers, regulatory agencies and Energy Markets ARs. Energy 20
Markets Staff Support provides analyses, customer needs assessments, market and competitive 21
assessments, and consistent, accurate customer communication materials. Energy Markets Staff 22
Support works with other utility departments to facilitate safe and consistent service to Energy 23
Markets customers in accordance with Commission tariff rules and regulations. Examples of 24
activities include, but are not limited to: 25
Creating communication, training and safety materials: Energy Markets Staff Support 26
develops letters, forms, instructions, and analysis tools for ARs and Energy Markets 27
customers to effectively communicate and implement tariffs, regulatory changes, and safety 28
advisories ordered by the Commission. 29
85 Parking Services: Gas parking is the temporary storage of gas on the SoCalGas system and gas loaning is the temporary lending of gas from the SoCalGas system.
ADA-44 Doc #295436
Contract analysis and negotiations: Energy Markets Staff Support completes competitive 1
assessments for customers and prospective customers requesting special contracts to compete 2
with alternative pipeline service or alternate fuels. They develop negotiating guidelines and 3
contract terms and conditions, gain management approval for negotiated contracts, develop 4
testimony and supporting documentation to gain Commission approval of the negotiated 5
contracts, and develop and implement internal procedures and controls for contract 6
management and regulatory compliance. 7
Analysis: Energy Markets Staff Support provides expert analysis of economics to help 8
Energy Markets ARs work with their customers to select the utility rates and services that 9
best suit their facility needs. Energy Markets Staff Support maintains a bill estimator tool 10
allowing ARs to educate customers of their rate options and the costs associated with each 11
service. It also works with Gas Engineering, Accounting and ARs to implement tariff line 12
extension allowances, and works with ARs, Measurement, Regulation and Control, and the 13
Engineering Analysis Center to resolve customer and gas producer questions regarding gas 14
measurement and gas quality. 15
Financial and information controls and tariff compliance: Energy Markets Staff Support 16
develops and manages procedures and tools to ensure that all activities undertaken to support 17
Energy Markets customers comply with all applicable Commission decisions, resolutions, 18
tariff rates and rules as well as other financial and regulatory rules. These include, for 19
example: Sarbanes-Oxley Act, Affiliate Transaction rules, Confidentiality Agreement policy, 20
records retention policy, and audit procedures. Energy Markets Staff Support also works 21
with Segment Services Staff and Gas Transmission Planning to track available capacity, 22
assign firm capacity for new customers and to identify transmission areas that are potentially 23
capacity constrained. 24
Regulatory filings, data responses, and segment demand forecasting: Energy Markets Staff 25
Support must stay abreast of impending regulation and tariff changes and provide the 26
education and training material to support the rollout of new programs. Regulatory 27
compliance and support includes technical contributions to major proceedings, advice letters, 28
compliance filings, data requests, Energy Markets customer segments demand forecasts, and 29
the preparation and submission of reports to regulatory agencies. All of these activities either 30
directly or indirectly affect Energy Markets customers by setting or affecting their rates and 31

ADA-45 Doc #295436
regulatory compliance requirements. Examples include, but are not limited to, sponsoring 1
testimony in cost allocation proceedings, preparing advice letters for tariff compliance filings 2
and tariff exemptions for uniquely situated customers, and responding to data requests from 3
the Commission, CARB and other agencies. 4
b. Forecast Method 5
The forecast method developed for this cost category is 5-year average with adjustment 6
for customer account growth and expanded support functions. This method is most appropriate 7
because it takes a consistent and full outlook of costs incurred for business functions and 8
responsibilities that have remained stable during the past five years, and reduces common 9
anomalies in the basis of the forecast, such as periodic expenses (i.e., implementations resulting 10
from mandates such as Omnibus and the California Producer Access Proceeding)86,87 or 11
fluctuations in the business cycle (i.e., unexpected delays in employee replacement due to 12
specialized skills gap). (Details of large sized variances further elaborated in Ex.SCG-12-WP, 13
pg. 408-410). 14
c. Cost Drivers 15
Energy Markets & Capacity Products recorded total adjusted expenditures of $1.801 16
million in 2013, of which $1.727 million was labor costs and $0.074 million was non-labor costs. 17
SoCalGas’ TY 2016 forecast reflects a $0.217 million increase in funding within Energy Markets 18
& Capacity Products above the 5-year average forecast (see Table 11). As previously discussed 19
in Section II.D.1.b, a 5-year average forecast methodology was used as the basis for the TY 2016 20
forecast plus adjustments to account for specific program growth. 21
The cost drivers behind this forecast are for 1 incremental FTE in Account Management 22
to meet the increased account management activities for EG and EOR customers and increased 23
account management and new tariff implementation activities for the California gas producer and 24
biogas producer interconnectors, and 1 incremental FTE in the area of Energy Markets Staff 25
Support to ensure adequate tools, communications, controls and analysis capabilities are in place 26
to support the increased account management activities. 27
86 The Omnibus Decision (07-12-019) allows SoCalGas/SDG&E to implement a range of revisions to their natural gas operations and offer new services for their core and unbundled storage services, Additional detail: http://www.socalgas.com/for-your-business/natural-gas-services/omnibus.shtml. 87 The California Producer Access Proceeding provides California natural gas producers access to the SoCalGas pipeline system. Additional detail here: http://www.socalgas.com/regulatory/tariffs/tm2/pdf/4177-A.pdf.
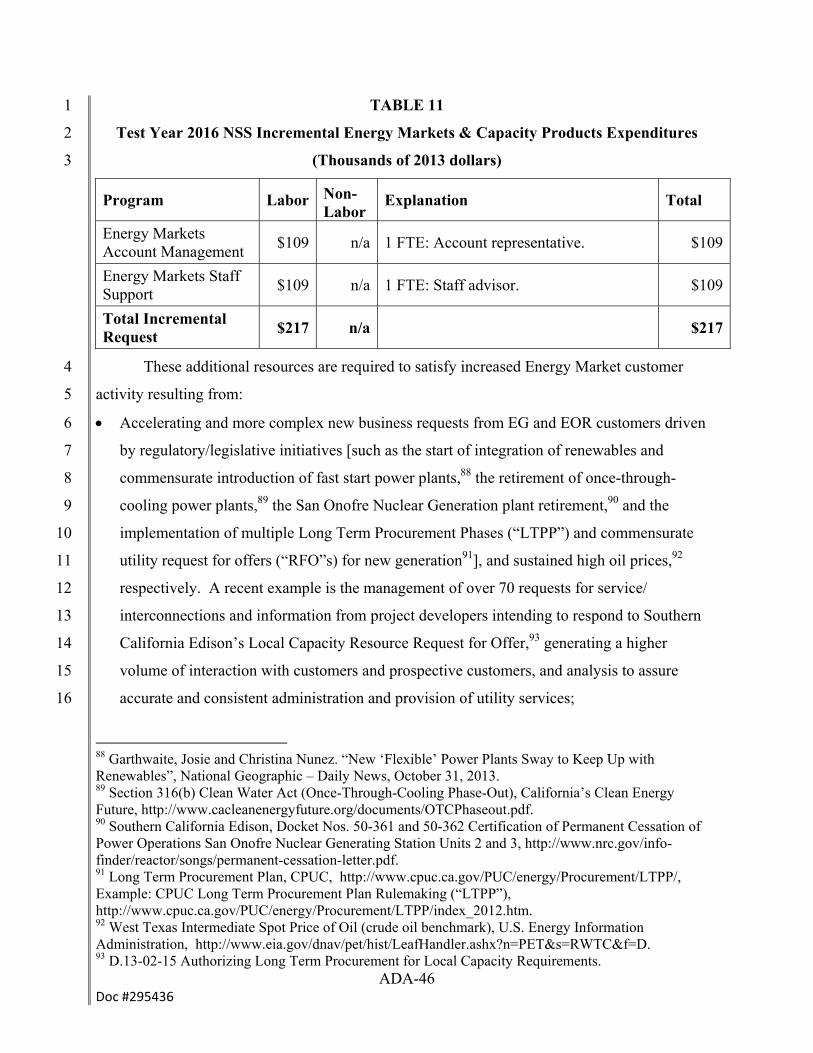
ADA-46 Doc #295436
TABLE 11 1
Test Year 2016 NSS Incremental Energy Markets & Capacity Products Expenditures 2
(Thousands of 2013 dollars) 3
Program Labor Non-Labor
Explanation Total
Energy Markets Account Management
$109 n/a 1 FTE: Account representative. $109
Energy Markets Staff Support
$109 n/a 1 FTE: Staff advisor. $109
Total Incremental Request
$217 n/a $217
These additional resources are required to satisfy increased Energy Market customer 4
activity resulting from: 5
Accelerating and more complex new business requests from EG and EOR customers driven 6
by regulatory/legislative initiatives [such as the start of integration of renewables and 7
commensurate introduction of fast start power plants,88 the retirement of once-through-8
cooling power plants,89 the San Onofre Nuclear Generation plant retirement,90 and the 9
implementation of multiple Long Term Procurement Phases (“LTPP”) and commensurate 10
utility request for offers (“RFO”s) for new generation91], and sustained high oil prices,92 11
respectively. A recent example is the management of over 70 requests for service/ 12
interconnections and information from project developers intending to respond to Southern 13
California Edison’s Local Capacity Resource Request for Offer,93 generating a higher 14
volume of interaction with customers and prospective customers, and analysis to assure 15
accurate and consistent administration and provision of utility services; 16
88 Garthwaite, Josie and Christina Nunez. “New ‘Flexible’ Power Plants Sway to Keep Up with Renewables”, National Geographic – Daily News, October 31, 2013. 89 Section 316(b) Clean Water Act (Once-Through-Cooling Phase-Out), California’s Clean Energy Future, http://www.cacleanenergyfuture.org/documents/OTCPhaseout.pdf. 90 Southern California Edison, Docket Nos. 50-361 and 50-362 Certification of Permanent Cessation of Power Operations San Onofre Nuclear Generating Station Units 2 and 3, http://www.nrc.gov/info-finder/reactor/songs/permanent-cessation-letter.pdf. 91 Long Term Procurement Plan, CPUC, http://www.cpuc.ca.gov/PUC/energy/Procurement/LTPP/, Example: CPUC Long Term Procurement Plan Rulemaking (“LTPP”), http://www.cpuc.ca.gov/PUC/energy/Procurement/LTPP/index_2012.htm. 92 West Texas Intermediate Spot Price of Oil (crude oil benchmark), U.S. Energy Information Administration, http://www.eia.gov/dnav/pet/hist/LeafHandler.ashx?n=PET&s=RWTC&f=D. 93 D.13-02-15 Authorizing Long Term Procurement for Local Capacity Requirements.

ADA-47 Doc #295436
Implementing and managing new California Producer Agreements required by D.07-08-029, 1
D.10-09-001 and AL4177-A, which established new CPUC form agreements and a tariff 2
governing all terms and conditions of access including balancing service; and 3
Managing increased biogas interconnection inquiries from landfill operators once the 4
Commission’s R.13-02-008 and D.14-01-034 promoting pipeline access to the gas pipeline 5
system is implemented. 6
It is anticipated that due to aforementioned legislative and regulatory initiatives related to 7
greenhouse gas reduction, renewables integration, once-through-cooling abatement, new 8
technology fast start generator inquiries and construction, and new gas supplier interconnector 9
tariffs, Energy Markets’ customer segment account management and staff support activity and 10
related obligations will grow significantly during the rate case period. 11
2. Segment Services 12
a. Description of Costs and Underlying Activities 13
The major activities of Segment Services consists of individualized account management 14
of customer segments such as select industry and geographically assigned commercial and 15
industrial customers (see Table 9 for Customer Segments - Account Management Matrix); 16
focused customer services to segments such as the small, medium, business (“SMB”) customers, 17
home builders, developers, and residential customers; segment services staff support; advising in 18
areas that pertain to regulatory, tariff, contracts, air quality, legislation, market and forecast 19
analysis, and presenting customer programs, education and training to the various customer 20
segments listed above. 21
Account Management 22
To effectively serve and meet the needs of specific customer segments, SoCalGas 23
delivers individualized account management services through highly trained and specialized 24
Account Representatives (“ARs”) assigned to segments of select industry (large manufacturers, 25
large hospitals, petroleum refineries) and geographical segments of commercial and industrial 26
customers (hotels, restaurant chains, small hospitals, small manufacturers, etc.). See Table 9 27
Customer Segments – Account Matrix for a specific account breakdown. Customer interactions 28
with ARs are critical to safe and reliable service delivery, regulatory compliance, and customer 29
satisfaction. Topics often discussed include: 30
Safe use of natural gas; 31

ADA-48 Doc #295436
Bill explanations; 1
Bill issues resolution; 2
Rate options, tariffs, and contract management; 3
New business project management; 4
Emergency preparedness and business resumption planning; 5
Air quality regulation permitting and compliance; and 6
Technical information. 7
Segment Services customer accounts are assigned ARs based on select industry, which 8
consists of noncore or noncore-eligible customers (accounts consuming greater than 250,000 9
therms/year); and commercial and industrial core customers with accounts consuming greater 10
than 50,000 therms/year or chain accounts, which are assigned ARs geographically. The 11
Segment Services noncore accounts consists of approximately 820 unique active meters,94 and 12
the remaining assigned core accounts consists of approximately 3,400 active meters.95 13
Collectively, the AR assigned customer segment consists of approximately 59% of the revenue 14
stream of SoCalGas’ nonresidential commercial and industrial customers.96 ARs must maintain 15
industry specific expertise, provide frequent contact with their customer base, provide support by 16
advising on current air quality regulation and compliance, and manage new business/meter 17
requests. ARs are also responsible for advising customers on their eligible tariff options, 18
explaining the complexities of rate contracts and tariffs (such as curtailment priorities and 19
calculating authorized curtailment quantities), and assisting eligible customers with navigating 20
the complexities of two bidding processes: potentially-capacity-constrained firm volumes and 21
22
94 Per 2013 data estimates, which include all unique active meter locations. 95 Per 2013 data estimates, including gas air conditioning (“AC”) and gas engine tariffs, and G-10 tariffs >= 50,000 therm/year. 96 Per 2013 data estimates, which include (C&I Transportation Component Revenue + Gas) divided by (C&I Transportation Component Revenue + Gas of noncore, small cogen, refinery cogen, gas AC, gas engine, NGV, C&I >=50,000 therm/year, C&I <=50,000therm/year).

ADA-49 Doc #295436
Backbone Transmission Service rights.97,98 To meet these duties, ARs rely on knowledgeable 1
support from their staff organization to maintain current, up-to-date, and consistent information 2
to provide to customers. 3
Small/Medium Business Support Services 4
The support services strategy for the small/medium business (“SMB”) customer is to 5
initiate awareness, increase tools and campaigns, establish primary services, and establish 6
continuous improvement to support this segment effectively. The strategy includes tactics to 7
effectively communicate programs, services, rate education, air quality regulations and mandated 8
messages to the SMB segment.99 In 2013, the SMB customer segment represented 9
approximately 210,000 active meters and provides approximately 41% of the combined core and 10
noncore nonresidential commercial and industrial revenue stream.100,101 The numerous accounts 11
and unique needs in this customer segment necessitate a different outreach approach distinct 12
from our Account Management and Residential Services activities. SMB Support Services works 13
in collaboration with the Customer Engagement & Insights group, to then design and implement 14
strategies for education outreach, programs and services. This work includes: 15
Identifying customer preferences and needs using qualitative and quantitative studies; 16
Developing phases of online Business My Account awareness campaigns for encouraging 17
customer enrollment and use;102 18
97 Potentially capacity-constrained firm volumes: Potentially Capacity-Constrained Area: Segments of the local transmission system in which customer requests for firm transportation service currently exceed, or within the next five years may exceed, available capacity. Such requests must be based on historical usage or evidence which substantiates expected incremental load. See AL4490: “Publication of Open Season Results for Line 7000 in the San Joaquin Valley”, May 1, 2013, http://socalgas.com/regulatory/tariffs/tm2/pdf/4490.pdf, and AL4512: “Publication of Open Season Results for the Rainbow Corridor”, August 16, 2013, http://socalgas.com/regulatory/tariffs/tm2/pdf/4512.pdf. 98 Backbone Transmission Service: http://www.socalgas.com/for-your-business/natural-gas-services/backbone.shtml. 99 See Table 9 Customer Segments – Account Management Matrix for definition of “small and medium business” customer segment. 100 Estimated based on all unique active meter locations that appear in 2013 (includes usage=0 with customer charge>0) based on (Core C&I <=50,000 therm/year usage) 101 Estimated based on all unique active meter locations that appear in 2013 (includes usage=0 with customer charge>0) based on (Core C&I <=50,000 therm/year usage) divided by all commercial & industrial usage) , where (C&I<=50K) excludes assigned NGV, EG, AC, noncore accounts) 102 Supports the forecasts attributed to capital project: SCG My Business Account in the testimony of Mr. Evan Goldman –SoCalGas Customer Services Operation (Ex.SCG-11 Section IV).
ADA-50 Doc #295436
Designing industry specific webpages to communicate relevant products and services (such 1
as seminars and self-service tools to manage and monitor gas usage); and 2
Crafting safety messages for emergency planning and recovery. 3
The SMB customers look to SoCalGas to provide them with information regarding 4
energy issues that will directly impact their business, to keep them apprised of all regulatory and 5
rate changes, tips on how to save money on their energy bill, and safety-related messages.103 6
Unlike the larger customers, who may employ skilled engineering staff to help them manage 7
their energy usage, 70% of small businesses are owned and operated by a single person,104 8
requiring SMB customers to fill multiple roles. They may lack the expertise, background, or 9
even the time to understand complex energy messages. Because of the limited resources 10
dedicated to energy issues, these customers rely on SoCalGas to customize and make a myriad of 11
energy information easy to understand and apply. These SMBs may also have language or 12
cultural differences to overcome, therefore, messaging is carefully crafted to transmit complex 13
information to ensure it is easily understood and its relevance is obvious. 14
Residential Services 15
Residential Services represents activities reorganized in 2013 with the objective of 16
centralizing key functions to more effectively develop, deliver and manage services for our 5.4 17
million residential customers and for the residential builders in our region.105 The two key 18
functions that comprise Residential Services are: Residential Market Services and Clean Energy 19
Builder. 20
Residential Market Services 21
The purpose of this group is to enable SoCalGas to effectively meet residential customer 22
expectations. The group is responsible for identifying changing residential customer needs; 23
developing new services or refining existing services to meet those needs; coordinating 24
SoCalGas operational groups to deliver services; and monitoring the services to ensure 25
effectiveness in meeting customer needs. Customer safety is a constant and critical objective 26
across this group’s entire body of work. 27
103 “Small Business Association, Score – Impact on US Small Business of Natural & Man-made disasters”, HP and SCORE: Counselors to America’s Small Business. 104 Groth, Aimee and Kim Bhasin.“18 Amazing Facts About Small Businesses In America”, Business Insider, August 24, 2011. 105 Based on 2013 meter count data.
ADA-51 Doc #295436
The primary functions of the group are: 1
o Data analytics to define customer needs and expectations, which is complementary to, but 2
not duplicative of the market research performed by the Customer Engagement & Insights 3
group,106 and is focused on utilizing operational and other quantitative data to identify trends 4
and improvement opportunities; and 5
o Project management to develop, implement and continuously improve residential customer 6
services, which involves planning, coordination and communication to assure safe and 7
reliable consumption of natural gas during policy changes, service enhancements, and 8
seasonal changes. 9
Examples of the group’s focus areas include: 10
o Heating season: Planning and coordination of policies, operations and communications to 11
ensure customers enjoy safe and reliable heating during the winter season. 12
o Customer impacts: Monitoring of bill amounts, meter activity and other operational and 13
market trends that may adversely impact customers; and related planning/coordination of 14
tactics to support customers. 15
Clean Energy Builder Services 16
The purpose of this group is to enable SoCalGas to effectively support builders, 17
developers and contractors in utilizing natural gas to develop the Southern California housing 18
stock to meet state environmental goals. The group is responsible for identifying consumer fuel 19
and appliance needs and priorities; defining gaps between consumer/environmental priorities, 20
builder/developer/contractor practices and products provided by the manufacturing community; 21
and coordinating SoCalGas operational and policy groups to deliver information and services to 22
support the building community in meeting environmental goals and consumer needs. The 23
primary functions of the group are: 24
106 Customer Engagement & Insights conducts data analytics and market research of both historical and current environment, as well as performance metrics based on current SoCalGas products, services and customer engagement, whereas Residential Market Services conducts data analytics and market research for identifying and anticipating future customer needs and trends to develop new products and services (back-cast and current environment compared to forecast environment).

ADA-52 Doc #295436
o Data analytics to define customer and builder/developer/contractor needs and expectations. 1
This is complementary to, but not duplicative of,107 the market research performed by the 2
Customer Engagement and Insights group, and is focused on utilizing operational and other 3
quantitative data to identify trends and improvement opportunities. 4
o Project management to develop, implement and continuously improve home builder and 5
developer services; and to support outreach to the builder community. 6
Examples of the group’s focus areas include: 7
o Builder/developer/contractor education and outreach: Communications and processes to help 8
builders understand new clean energy technologies and their applications; 9
o Builder/developer/contractor impacts: Planning and coordination of customer service 10
processes including scheduling, operations and communications to address builder, 11
contractor and home owner/home buyer needs; and 12
o Builder/developer/contractor new construction support: Provide information on safety, codes, 13
standards, regulations and permit requirements, and assisting developers with identifying 14
requirements for utility distribution main and service line extensions. 15
Segment Services Staff Support 16
Similar to the Staff Support function of the Energy Market & Capacity Products 17
subgroup, the Segment Services Staff Support (“Staff”) function of the Segment Services 18
subgroup works behind the scenes to support customers, regulating agencies, and ARs by 19
functioning as advisors and knowledge experts who perform various services, including: 20
Training: Providing internal training to new ARs, and refresher trainings to existing ARs to 21
educate them on most current business processes, tariffs, new gas technology and its 22
applications; 23
Assessment: Conducting assessments of Segment Services customer needs, values, and 24
impacts with regards to gas transportation services; 25
Analysis: Staff provides expert analysis of CHP systems, customer bills, engine water 26
pumping, and gas air conditioning economics to help customers select utility rates and 27
107 Customer Engagement & Insights conducts data analytics and market research of both historical and current environment, as well as performance metrics based on current SoCalGas products, services and customer engagement, whereas Clean Energy Builder Services conducts data analytics and market research for identifying and anticipating future customer needs, demands, and trends to shape and develop new products and services).
ADA-53 Doc #295436
technology that best suit their facility needs. Staff also maintains a bill estimator tool 1
allowing ARs to correctly educate customers about their rate options and the costs associated 2
with each rate. For CHP, staff performs detailed rate evaluations, economics and efficiency 3
analysis, assists with technology selection and permitting, and determines if any self-4
generation incentive program (“SGIP”) applies; 5
Economic Development: Together with its ARs, staff works with at-risk customers as well as 6
economic development agencies by providing energy assessments, information on various 7
incentives, and knowledge on how to streamline manufacturing operations and utilize cleaner 8
fuel options; 9
New Business: Ensuring consistent new business allowance calculations and reconciliations 10
of new gas service and consistent calculation of eligible noncore contract volumes allotment; 11
Contract Negotiation: Developing and managing contract negotiation guidelines, policies, 12
and marketing strategies to enhance the value of SoCalGas service to Segment Services 13
customers; 14
Contract Management: Managing the potentially-constrained open season contract volumes 15
bidding process and the Backbone Transportation Service (“BTS”) bidding process. Staff 16
develops communication for open seasons in potentially-constrained areas of SoCalGas’ 17
distribution system to ensure all customers receive accurate and timely notices. This includes 18
bidding procedures and online support for the open seasons, and the analysis of customer 19
bids and available capacity to determine if pro-rating is required; 20
Compliance: Managing contract renewals, new legal entity reviews, and ensuring internal 21
regulatory contract compliance. Staff plays an active role in the Major Account Activity 22
Team to approve all new requests for noncore service to assure that the customers are fully 23
informed of their rate options and understand the conditions of their rate elections, and 24
assures that all new contracts are compliant with internal requirements pursuant to the 25
Sarbanes Oxley Act. 26
Regulatory Filings: Support regulatory reporting, advice letter, and application filings; there 27
are various reports that are required by regulatory agencies including the Commission, CEC, 28
air quality management districts, Energy Information Agency, the FERC and others. These 29
reports require data analysis and preparations, work papers, and responses to follow-up 30

ADA-54 Doc #295436
inquiries. Examples include the Quarterly Fuel and Energy Report (“QFER”), the California 1
Gas Report (“CGR”), and the Gas Utility Monthly Survey Report. 2
Major Regulatory Proceedings: Examples include the Triennial Cost Allocation Proceeding 3
(“TCAP”) and GRC. These proceedings normally have numerous phases and occur over 4
many months or years. They require gathering and analyzing customer and cost data, 5
performing impact evaluations for all stakeholders, establishing policies and procedures to be 6
proposed, preparing testimony and exhibits, preparing rebuttal for parties with opposing 7
views, responding to data requests, participating in hearings before the Commission, 8
settlement meetings, and attending Commission workshops. 9
Communication: Advising and providing outreach and communication materials (with 10
support from Customer Engagement & Insights group) to ARs for use in communicating 11
impending and new air quality regulations, tariff/regulatory changes, technology specific 12
education and legislative conditions; 13
Outreach: Staff maintains relationships with numerous industry and customer 14
organizations.108 These relationships provide valuable opportunities to distribute and receive 15
information on customer needs, technology development, regulatory trends and safety 16
standards. Customers, trade organizations and community groups often request SoCalGas 17
personnel to speak at conferences on safe, efficient and reliable distribution and consumption 18
of natural gas;109 19
Budgeting: Providing department and management level budget and forecast support; and 20
Seminars: Organize and develop Energy Resource Center (“ERC”) seminars. The ERC 21
demonstration facility helps educate customers about equipment, design techniques, and 22
building technologies. Customer Programs staff develops and conducts technical seminars, 23
108
U. S. Department of Energy, California Energy Commission, American Society of Heating Refrigeration, Air Conditioning Engineers Standard 90.1, Building Energy Standards Committee, ASHRAE, American Flame Research Organization, Association of Energy Engineers, California Metals Association, Southern California Water Committee, Association of California Water Agencies, Gas Technology Institute, American Gas Cooling Center (Member of the AGCC Advisory Board), Energy Solutions Center, California Air Resources Board, South Coast Air Quality Management District, San Joaquin Valley Air Quality Management District. 109 American Institute of Architects (“AIA”), Institute of Ammonia Refrigeration (“IIAR”), West Coast Energy Management Congress (“AEE WCEMC”), Building Owners and Managers Association Conference (“BOMA”), Contractors, Educators and State Officials, Association of California Water Agencies (“ACWA)”, National Association of Energy Service Companies (“NAESCO”) and World Agricultural Exposition.
ADA-55 Doc #295436
and provides training and materials for energy managers and engineers. In 2013, 192 food-1
service equipment demonstrations, 206 technical and food-service seminars, 47 customer 2
outreach events and 16 technical training sessions were conducted at the Energy Resource 3
Center, along with 1,268 meetings for business/industry associations, customers, and internal 4
and external utility personnel. 5
b. Forecast Method 6
The forecast method developed for this cost category is five-year historical average with 7
adjustment for specific and new customer segment activity growth, and an incremental 8
adjustment to make whole a partial year FTE/labor cost recorded for new functions that were 9
added to Residential Market Services mid-2013. This method is most appropriate because the 10
historical years of 2009-2013 are reflective of costs that have been and continue to be core 11
operational program activities,110 smoothing fluctuations of costs caused by attrition (i.e., 12
unexpected delays in employee replacement due to specialized skills gap). Incremental 13
adjustments are to account for additional targeted outreach and service activities to support 14
further customer segmentation of markets beyond the five-year historical average baseline 15
activities. (Details of large sized variances further elaborated in Ex.SCG-12-WP, pg. 411-414). 16
c. Cost Drivers 17
Segment Services recorded total adjusted expenditures of $6.519 million in 2013, of 18
which $4.950 million was labor costs and $1.568 million was non-labor costs. SoCalGas’ TY 19
2016 forecast reflects a $2.591 million increase in funding within Segment Services above the 5-20
year average forecast (see Table 12 for a summary of incremental expenditures and related 21
activities [as well as observe Footnote 111], which is then followed by further justification detail 22
organized by Program activity).. As previously discussed in Section II.D.2.b, a 5-year average 23
forecast methodology was used as the basis for the TY 2016 forecast plus adjustments to account 24
for specific program growth. 25
26
110 See Ex.SCG-12-WP-2IN004 for detail of adjustments made to historical years to reflect costs and expenditures consistent to forecasted activities in this area.
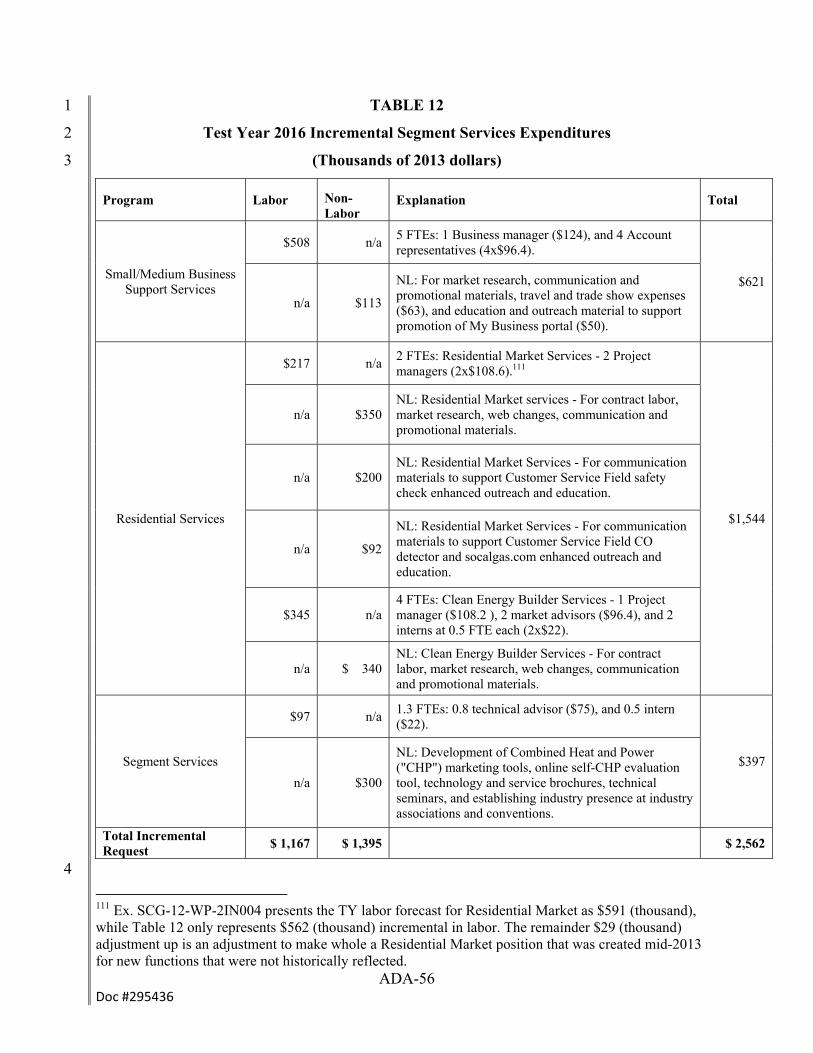
ADA-56 Doc #295436
TABLE 12 1
Test Year 2016 Incremental Segment Services Expenditures 2
(Thousands of 2013 dollars) 3
Program Labor Non-Labor
Explanation Total
Small/Medium Business Support Services
$508 n/a 5 FTEs: 1 Business manager ($124), and 4 Account representatives (4x$96.4).
$621
n/a $113
NL: For market research, communication and promotional materials, travel and trade show expenses ($63), and education and outreach material to support promotion of My Business portal ($50).
Residential Services
$217 n/a 2 FTEs: Residential Market Services - 2 Project managers (2x$108.6).111
$1,544
n/a $350 NL: Residential Market services - For contract labor, market research, web changes, communication and promotional materials.
n/a $200 NL: Residential Market Services - For communication materials to support Customer Service Field safety check enhanced outreach and education.
n/a $92
NL: Residential Market Services - For communication materials to support Customer Service Field CO detector and socalgas.com enhanced outreach and education.
$345 n/a 4 FTEs: Clean Energy Builder Services - 1 Project manager ($108.2 ), 2 market advisors ($96.4), and 2 interns at 0.5 FTE each (2x$22).
n/a $ 340 NL: Clean Energy Builder Services - For contract labor, market research, web changes, communication and promotional materials.
Segment Services
$97 n/a 1.3 FTEs: 0.8 technical advisor ($75), and 0.5 intern ($22).
$397
n/a $300
NL: Development of Combined Heat and Power ("CHP") marketing tools, online self-CHP evaluation tool, technology and service brochures, technical seminars, and establishing industry presence at industry associations and conventions.
Total Incremental Request
$ 1,167 $ 1,395 $ 2,562
4
111 Ex. SCG-12-WP-2IN004 presents the TY labor forecast for Residential Market as $591 (thousand), while Table 12 only represents $562 (thousand) incremental in labor. The remainder $29 (thousand) adjustment up is an adjustment to make whole a Residential Market position that was created mid-2013 for new functions that were not historically reflected.
ADA-57 Doc #295436
The cost drivers behind this forecast include an incremental 5 FTEs and $113,000 in non-1
labor costs (for market research, print and design for communication materials, and trade show 2
expenses) in the area of Small/Medium Business Support Services to bolster the education and 3
outreach of: our products and services, natural gas conservation, and safety awareness. The 4
incremental FTEs will: 5
Focus outreach to trade, business, and chamber organizations with an additional trade 6
association market specialist, enabling SoCalGas to be an expert of SMB energy matters; 7
Provide account support management with a Business Service Representative to address 8
customer inquiries elevated from the Customer Contact Center due to specialized SMB needs 9
and requests; and 10
Provide Account Representatives to work with SMB customers as a central and proactive 11
coordinating contact to address customer needs (ranging from: services expansion, new 12
business gas service requests, air quality compliance issues, billing and tariff explanations) 13
and to also coordinate and present to individual and group meetings as well as handle direct 14
mail and telephone outreach. 15
The SMB customers have traditionally been the “neglected middle” between large 16
commercial industrial and residential customers and offer a significant opportunity for outreach 17
and education.112 SoCalGas recognizes the value and importance of tailoring self-service content, 18
providing specialized direct-contact, and continuing to analyze and determine customer needs 19
and preferences in order to effectively engage this segment, especially about issues of natural gas 20
conservation and safety. The benefits of increasing engagement with this customer segment 21
would be: enhancing customer satisfaction, retaining business customers challenged with 22
increasingly complex air quality regulations (such as SCAQMD Rule 1147, Rule 1153, 1146, 23
1146.1, and Zero Net Energy mandates to improve efficiency of all commercial natural gas 24
appliances and equipment),113 developing more effective communication strategies, and 25
broadening our insights into this customer segment’s needs so that new relevant products and 26
112 Accenture “Accenture New Energy Consumer Handbook 2013” Small and Medium Businesses: The Untapped Energy Consumer, page 188, http://nstore.accenture.com/acn_com/PDF/Accenture-New-Energy-Consumer-Handbook-2013.pdf. 113 The Customer Service Information areas covered in my witness area work in conjunction with the SoCalGas Customer Services Technologies, Policies, and Solutions areas covered in the witness area of Mr. Jeffrey Reed to provide customers support with air quality regulations. These regulations, policies, and goals are further detailed in Mr. Jeffrey Reed’s testimony, Ex.SCG-13.

ADA-58 Doc #295436
services may be developed. While retail, financial, and telecommunications industries have long-1
focused on customer analytics and segmentation to adapt to competition, utilities also need to 2
consider a customer segmented approach to optimize programs and educational materials.114 3
Similarly, other California utilities such as Pacific Gas & Electric and San Diego Gas & Electric 4
Company recognize the importance of engaging the SMB customer segment, and are in various 5
stages of implementation to develop and shore up their own organizations to support this 6
segment.115 7
In the area of Residential Services, I am forecasting an incremental 2 FTEs and an 8
incremental $350,000 in non-labor dollars (for contract labor, market research, web changes, 9
collateral) above the adjusted 5-year historic average for Residential Market Services to address 10
the evolving needs of our residential customer base, specifically the growing elderly population 11
and our lower and middle income population. This incremental cost will be focused on 12
developing and delivering services for these customer segments such as: 13
Senior services: This service provides tools, policies and communications that will support 14
the growing aging population and their families in the safe use of natural gas, and in effective 15
interactions with SoCalGas. This is to address unique needs of the aging population related 16
to customer safety and convenience. For example, there is a potential rise in safety issues 17
related to diminishing senses of smell, hearing, sight and touch.116 Furthermore, the increase 18
of a “many to one” customer relationship where the primary customer is supported by a 19
network of family members or caregivers who make decisions and transact for the customer 20
also introduces new needs.117 21
Landlord/renter services: This service provides information, tools, policies and 22
communications to support renters in the safe operation of gas appliances in or on their 23
residences. It also supports landlords in energy management and appliance investment 24
decisions, and in the proper maintenance of gas appliances on their properties. Data suggest 25
114 Richards, Christine H., Utility Analytics Institute “Customer Targeting and Segmentation Analytics – Satisfying Customers as Individuals”, 2013, page 3-4. 115 Richards, Christine H., Utility Analytics Institute “Customer Targeting and Segmentation Analytics – Satisfying Customers as Individuals”, 2013. 116 Dugdale III, David “Aging Changes in the Senses” November 10, 2012 MedlinePlus – Trusted Health Information for You, http://www.nlm.nih.gov/medlineplus/ency/article/004013.htm. 117 Coughlin, Joseph, “Estimating the Impact of Caregiving and Employment on Well-Being” May 2010, Outcomes & Insights in Health Management, Vol. 2 Issue 1, http://www.healthways.com/success/library.aspx?id=615.

ADA-59 Doc #295436
that renters are disproportionately low income.118 Furthermore, California law requires that 1
landlords provide habitable units to their tenants, including utilities and appliances in 2
working order.119 This is an area where SoCalGas can formally support the safety needs of 3
both landlords and renters by proactively providing information, tools and communications. 4
Consistent with the focus on customer safety and meeting the needs of landlord/renters 5
and elderly populations, I am also requesting the following to support the proposed service 6
enhancements described in the testimony of Ms. Sara Franke, Customer Services Field and SCG 7
Meter Reading (Ex.SCG-10) in this customer segment with: 8
$200,000 in incremental non-labor dollars (for communications materials) to support the 9
Safety Check outreach (Ex.SCG-10, Section II.B.1.d.3.), and 10
$92,000 for incremental non-labor dollars (for communications materials) for Customer 11
Service Field personnel’s on-premise time to educate customers about the state mandate for 12
carbon monoxide detectors and socalgas.com (Ex.SCG-10, Section II.B.1.d.2.). 13
In the area of Clean Energy Builder Services, I am forecasting an incremental 4 FTEs and 14
an incremental $340,000 in non-labor dollars (for contract labor, market research, web changes, 15
printing and design of communication material) above the 5-year historic average to address the 16
increasing needs of the building community, homeowners and home buyers. New housing starts 17
are forecasted to grow annually from 50,243 in 2014 to 90,193 by 2020.120 That growth is 18
converging with the need to meet state and local environmental goals,121 and NMR Group, Inc.’s 19
study submitted in May 2014 to the CPUC has indicated that the building community has a need 20
for better education and understanding about options to efficiently grow new housing stock while 21
118 “America’s Rental Housing – Meeting Challenges, Building on Opportunities” Renter Demographics, Joint Center for Housing Studies of Harvard University, http://www.jchs.harvard.edu/sites/jchs.harvard.edu/files/ahr2011-3-demographics.pdf. 119 “Dealing With Problems”, California Department of Consumer Affairs, 2012 Edition, http://www.dca.ca.gov/publications/landlordbook/problems.shtml. 120 Internal department forecast “Southern California Housing Starts for 2014” to be used for residential meter forecasting. The same source data was used for the 2014 California Gas Report. Quarterly data are annualized and seasonally adjusted. Info was gathered from the Global Insight (February 2014) Regional Forecast. 121 Examples: Zero Net Energy mandates to improve efficiency of all residential and commercial natural gas appliances and equipment, Title 24 residential home efficiency standards, SCAQMD Rule 1111 – to reduce NOx emissions from residential central furnaces.

ADA-60 Doc #295436
meeting these goals.122 This incremental cost will be focused on materials and resources to 1
achieve greater builder outreach and education, and company communications and processes to 2
meet builder production needs. 3
In the area of Segment Services Staff Support, I am requesting an incremental 1.3 FTE 4
and $300,000 in non-labor dollars above the 5-year historical average cost to increase efforts to 5
accelerate the installation and use of small (below 5 MW) combined heat and power (“CHP”) 6
systems. This additional FTE funding is to support expanded activities in CHP education and 7
outreach; to help customers navigate the complexities of electric and gas tariff rates, standby 8
charges, and departing load charges; to help customers estimate demand charges; to help 9
customers understand feed-in tariffs and incentive programs; and to provide economic 10
competitiveness evaluations by simple payback for scoping the potentials for incorporating CHP 11
technology into their processes. The additional non-labor dollars are for the development of 12
marketing tools which include a specific socalgas.com CHP subpage, an online CHP candidate 13
self-evaluation tool, educational brochures about CHP technology process and benefits,123 14
technical seminars with presentations from industry experts at SoCalGas’ Energy Resource 15
Center, and establishing further industry presence with participation and sponsorships of 16
strategic industry associations and conventions to bring CHP awareness to the customers with 17
industrial or commercial processes most viable for incorporating CHP technology. These 18
additional efforts are to support meeting CHP growth goals that the evolving environmental 19
policy that is increasingly focused on environmental sustainability and climate change have 20
established. 21
According to the California Air Resource Board’s (“CARB’s”) 2008 Assembly Bill 22
(“AB”) 32 scoping plan, meeting California’s 2020 greenhouse gas reduction goals will require 23
installation of 4,000 MW of new CHP capacity.124 In 2010, Governor Brown’s Clean Energy 24
Jobs Plan set a goal of 6,500 MW of new CHP capacity by 2030.125 Most recently, AB1257 25
Natural Gas Strategy was introduced in 2013, which recognized natural gas as a flexible energy 26
supply source for heating, water heating, cooling, cooking, engine operation, and electric 27 122 “California Multifamily Residential New Construction – Market Effects Study: Phase I Report”, NMR Group, Inc. May 2014, Page 164. 123 CHP technologies that compete in the California Market includes: gas turbines, reciprocating engines, fuel cells, and microturbines. 124 “Climate Change Scoping Plan a Framework for Change”, California Air Resources Board for the State of California, December 2008, pgs.42-43. 125 Brown, Jerry. “Brown Announces Clean Energy Jobs Plan”, 2010.
ADA-61 Doc #295436
generation and provides a valuable complement to the development of renewable generation 1
sources, particularly intermittent generating sources in support of state policy to reduce 2
greenhouse gas emissions. The Presidential Executive Order, issued by President Obama on 3
energy efficiency, includes a national goal of 40 gigawatts (GW) of new, cost effective industrial 4
CHP by the end of 2020.126 5
Based on Inter City Fund (“ICF”) International’s 2012 study for the CEC, CHP systems 6
smaller than 5 MW represent only 6.2 percent of the total existing CHP capacity in California, 7
while systems larger than 100 MW represent almost 40 percent of the total existing capacity. ICF 8
International asserts that the market saturation of CHP in large facilities is much higher than for 9
smaller sites. Much of the remaining technical market potential is composed of smaller systems. 10
In fact, from 2006 to the present, CHP systems smaller than 5MW have accounted for 27.7 11
percent of capacity growth.127 This growth occurred notwithstanding the recent economic 12
downturn, which did dampen new development of CHP, and also caused CHP capacity to 13
decrease as industrial or commercial host sites have to shut down. In the past five years, there 14
have been 314 MW of CHP in California that have ceased to operate because the host facility 15
where they are located has shut down.128 However, as national CHP development trends start to 16
turn around, the number of CHP systems in the development and construction state are picking 17
up again,129 and SoCalGas will require additional resources to meet these customers’ needs,130 18
and to support meeting AB32’s target of new CHP installations. The additional resources would 19
provide for higher capacities of customer support, particularly as these smaller customers are 20
often limited in technical expertise and experience to accurately assess the viability of CHP. In 21
SoCalGas’s experience, from 2012-2013, customer inquiries and requests for evaluation of CHP 22
potentials have doubled, generating a greater volume of work due to economic recovery coupled 23
126 The White House. “Executive Order –Accelerating Investment in Industrial Energy Efficiency”, August 30, 2012. 127 ICF International Inc. “2012 Combined Heat and Power Policy Analysis and 2011-2030 Market Assessment”, CEC-200-2012-022, pg. 34. 128 ICF International Inc. “2012 Combined Heat and Power Policy Analysis and 2011-2030 Market Assessment”, CEC-200-2012-022, pg. 37. 129 ICF International Inc. “2012 Combined Heat and Power Policy Analysis and 2011-2030 Market Assessment”, CEC-200-2012-022, pg. 37. 130 Includes providing guidance to customers to understand: technical potential of implementing CHP to their specific site (such as estimating thermal and electric load requirements) their ability to retrofit, the availability of natural gas service for a specific site, and CHP rate of return (economics). To be economic, the savings in power and fuel costs need to be compared to the added capital, fuel, and other operating and maintenance costs associated with operating a CHP system.
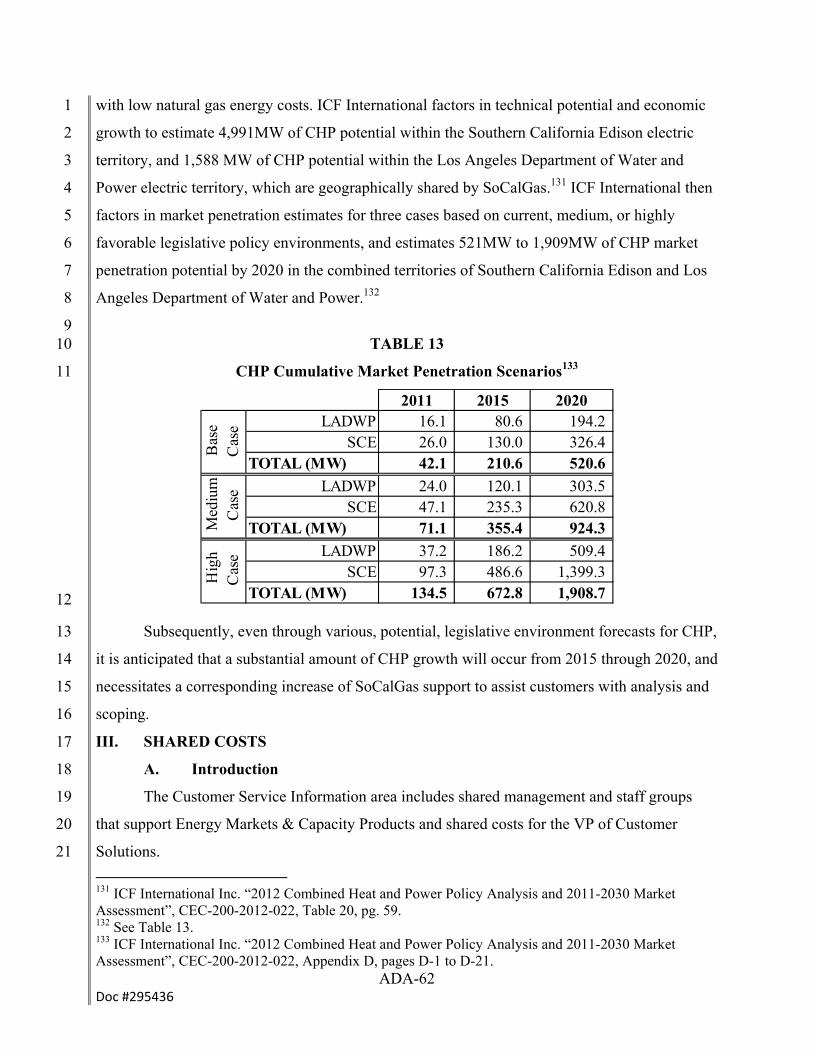
ADA-62 Doc #295436
with low natural gas energy costs. ICF International factors in technical potential and economic 1
growth to estimate 4,991MW of CHP potential within the Southern California Edison electric 2
territory, and 1,588 MW of CHP potential within the Los Angeles Department of Water and 3
Power electric territory, which are geographically shared by SoCalGas.131 ICF International then 4
factors in market penetration estimates for three cases based on current, medium, or highly 5
favorable legislative policy environments, and estimates 521MW to 1,909MW of CHP market 6
penetration potential by 2020 in the combined territories of Southern California Edison and Los 7
Angeles Department of Water and Power.132 8
9 TABLE 13 10
CHP Cumulative Market Penetration Scenarios133 11
12
Subsequently, even through various, potential, legislative environment forecasts for CHP, 13
it is anticipated that a substantial amount of CHP growth will occur from 2015 through 2020, and 14
necessitates a corresponding increase of SoCalGas support to assist customers with analysis and 15
scoping. 16
III. SHARED COSTS 17
A. Introduction 18
The Customer Service Information area includes shared management and staff groups 19
that support Energy Markets & Capacity Products and shared costs for the VP of Customer 20
Solutions. 21
131 ICF International Inc. “2012 Combined Heat and Power Policy Analysis and 2011-2030 Market Assessment”, CEC-200-2012-022, Table 20, pg. 59. 132 See Table 13. 133 ICF International Inc. “2012 Combined Heat and Power Policy Analysis and 2011-2030 Market Assessment”, CEC-200-2012-022, Appendix D, pages D-1 to D-21.
2011 2015 2020LADWP 16.1 80.6 194.2
SCE 26.0 130.0 326.4 TOTAL (MW) 42.1 210.6 520.6
LADWP 24.0 120.1 303.5 SCE 47.1 235.3 620.8
TOTAL (MW) 71.1 355.4 924.3
LADWP 37.2 186.2 509.4 SCE 97.3 486.6 1,399.3
TOTAL (MW) 134.5 672.8 1,908.7
Bas
e C
ase
Med
ium
C
ase
Hig
h C
ase
ADA-63 Doc #295436
Energy Markets & Capacity Products’ shared service elements include both direct customer 1
service and staff support. Specific groups in this area include: Capacity Products Support, 2
Gas Scheduling, Capacity Products Staff, and Gas Transmission Planning. The Energy 3
Market & Capacity Products shared services, schedules gas transportation and storage 4
services on the SDG&E and SoCalGas transportation and storage system; provides capacity 5
services for gas marketers that serve both SoCalGas and SDG&E customers, large 6
nonresidential customers who choose to act as their own supplier, and core aggregators. 7
Energy Markets & Capacity Products also manages business relationships with upstream 8
pipelines that serve the SoCalGas and SDG&E systems. This area also provides analytical 9
and regulatory compliance support for Backbone Transportation Service, unbundled storage 10
and Hub transactions; represents SoCalGas in the development and modification of gas 11
industry standards for gas scheduling; analyzes the capability of the SDG&E and SoCalGas 12
transportation system to serve both aggregate and individual customer demand; and develops 13
recommendations for pipeline or compression facility changes due to revised demand 14
forecasts, new customers desiring service at certain points for receipt, or suppliers requesting 15
receipt point access. 16
The Customer Solutions VP oversees both shared and non-shared activities within the 17
Customer Solutions organization. The non-shared activities include Customer Engagement & 18
Insights, Customer Assistance, and Customer Segment Markets. The shared activities consist 19
of the NGV Program and Low Carbon Energy Market Development.134 20
For shared services, SoCalGas forecasts a TY2016 expense of $3.398 million, a $0.486 21
million increase over 2013 recorded expenses of $2.912 million. Table 14 summarizes the total 22
shared O&M forecasts for the listed cost categories. 23
24
134 The NGV Programs and Low Carbon Energy Market Development functions are covered by SoCalGas witness Jeffrey Reed, Ex.SCG-13.
ADA-64 Doc #295436
TABLE 14 1
Shared O&M Summary of Costs 2
(Thousands of 2013 dollars) 3
CS – INFORMATION Shown in Thousands of 2013 Dollars Incurred Costs (100% Level)
Categories of Management 2013 Adjusted-Recorded
TY2016 Estimated
Change
A. Energy Markets & Capacity Products $2,647 $2,956 $309B. VP Customer Solutions $265 $442 $177Total Shared Services (Incurred) $2,912 $3,398 $486
I am sponsoring the forecasts on a total incurred basis, as well as the shared services 4
allocation percentages related to those costs. Those percentages are presented in my shared 5
services workpapers, along with a description explaining the activities being allocated (See 6
Ex.SCG-12-WP [Ayres]). The dollar amounts allocated to affiliates are presented in our Shared 7
Services Policy and Procedures testimony. See Ex. SCG-25 (Diancin). 8
B. Energy Markets & Capacity Products 9
Table 15 below provides a summary of TY2016 estimated shared-service Energy 10
Markets & Capacity Products costs compared to 2013 Adjusted-Recorded base year. 11
Explanation of cost changes from 5-year average forecast methodology compared to TY2016 12
Estimated is further elaborated in Section III.B.3. 13
14
15
16
17
18
19
20
21
22
ADA-65 Doc #295436
TABLE 15 1
Shared O&M Summary of Costs within Energy Markets & Capacity Products 2
(Thousands of 2013 dollars) 3
CS – INFORMATION Shown in Thousands of 2013 Dollars Incurred Costs (100% Level)
A. Energy Markets & Capacity Products
2013 Adjusted-Recorded
TY2016 Estimated
Change
1. Energy Markets & Capacity Products – Director
$338 $299 $-39
2. Capacity Products Support $640 $736 $963. Capacity Products Staff $540 $595 $554. Gas Scheduling $554 $729 $1725. Gas Transmission Planning $575 $600 $25Incurred Costs Total $2,647 $2,956 $309
1. Description of Costs and Underlying Activities 4
The Energy Markets & Capacity Products costs consists of both non-shared and shared-5
services. While the non-shared costs are described earlier in my testimony (see Section II.D.1), 6
the shared-services costs are contained in this area of my testimony, and consist of the 5 cost 7
centers described below: 8
Energy Markets & Capacity Products – Director 9
Energy Markets & Capacity Products – Director (2200-0246) tracks management and 10
supervision costs of shared and non-shared services within the Energy Markets & Capacity 11
Products organization along with associated non-labor expenses. 12
Capacity Products Support 13
Capacity Products (2200-0328) is responsible for the development and administration of 14
pipeline capacity products that provide both SDG&E and SoCalGas customers access to natural 15
gas supply from interconnecting upstream pipelines, California gas production, underground 16
storage, and the SDG&E and SoCalGas Citygate.135 Activities include: 17
Establishing policies and procedures for scheduling and nominations on the 18
SoCalGas/SDG&E system. 19
135 Citygate: A point or measuring station at which an entity receives gas from a natural gas pipeline company or transmission system.
ADA-66 Doc #295436
Managing the sale of receipt point access capacity to marketers and large business customers 1
through the open season process and through SoCalGas’s secondary market on the Electronic 2
Bulletin Board (“SoCalGas ENVOY®”). 3
Managing the SoCalGas Contracted Marketer program with 37 marketers serving 870 4
noncore customers to ensure a high level of service to meet the needs of both the marketers 5
and our customers. 6
Managing the SoCalGas Core Aggregation programs with 20 Energy Service Providers 7
(“ESPs”) serving approximately 18,000 core customers to ensure a high level of service to 8
meet both the needs of the ESPs and our customers. 9
Managing SoCalGas ENVOY®, including user access rights, informational posting, security, 10
training, and system forms, including Backbone Transportation Service, Pooling and Electric 11
Bulletin Board Access Agreements with marketers, suppliers and transportation customers on 12
both the SoCalGas and SDG&E systems. 13
Administering SoCalGas ENVOY® agreements with the major pipelines, producers, 14
marketers, agents, and liquefied natural gas (“LNG”) project developers interconnecting with 15
the SoCalGas/SDG&E pipeline system. 16
Negotiating and managing all aspects of interconnect and operational balancing agreements 17
with upstream pipelines that deliver natural gas into the SoCalGas/SDG&E system. 18
Establishing primary contact and negotiations with new pipeline suppliers and new gas 19
supply project developers related to facility studies, development of interconnections and 20
take-away capacity enhancements. 21
Participating in North American Energy Standards Board (“NAESB”) activities at the 22
committee level on behalf of SoCalGas/SDG&E where industry standards are developed; and 23
in regulatory matters under the authority of the Federal Energy Regulatory Commission 24
(FERC) concerning the upstream pipelines serving the SoCalGas and SDG&E system that 25
affect operations. 26
Providing back office support for the administration of Storage Products and Hub Services 27
including scheduling and invoicing support. 28
29
30
31

ADA-67 Doc #295436
Capacity Products Staff 1
Capacity Products Staff (2200-0330) supports Energy Markets & Capacity Products by 2
monitoring and analyzing market and pricing information, recommending changes to capacity 3
and storage market activities in response to market developments, developing pricing guidelines 4
for storage and hub products offered via the California Energy Hub, and monitoring the financial 5
performance of California Energy Hub product offerings. 6
Capacity Products Staff provides analytical staff support to the non-shared services 7
groups, including Storage Products and Energy Markets Staff Support. They develop and run 8
storage valuation tools to set pricing guidelines for various short-term and long-term unbundled 9
storage products. Capacity Products Staff works with Gas Operations to set volume guidelines 10
for various short-term and long-term unbundled storage and Hub products. They provide the 11
regulatory support and witnesses in regulatory proceedings dealing with transportation balancing 12
requirements and unbundled storage products. Capacity Products Staff provides analyses of 13
long-term storage investments to determine their effect on customer service and revenues. They 14
also analyze storage competitors throughout the western United States to determine the impact 15
on unbundled storage, as well as the need for new storage investments and new storage product 16
positioning. 17
Capacity Products Staff also provides support to all other Energy Markets & Capacity 18
Products groups. This support involves major transmission products like Backbone 19
Transportation Service (“BTS”) and Off System Delivery service. Capacity Products Staff 20
examines general market conditions to assess the value of these products. They also examine the 21
marketing of other transmission products in the Western United States to determine their 22
applicability to SoCalGas’ practices and products. 23
Gas Scheduling 24
Gas Scheduling (2200-2158) schedules gas transportation and storage services for 25
suppliers and customers on both the SDG&E and SoCalGas system. Responsibilities include 26
maximizing the system capacity by balancing the system between in-state and out-of-state 27
scheduled receipts and forecasted system demand, declaring operational flow orders and winter 28
balancing enforcement. The organization is also responsible for managing transportation 29
nominations based on BTS contract rights relative to available receipt point capacities, 30
confirming nominations to interstate and intrastate pipelines, reporting scheduling volumes to 31
customers, tracking storage accounts and the imbalance trading process for customer owned gas 32
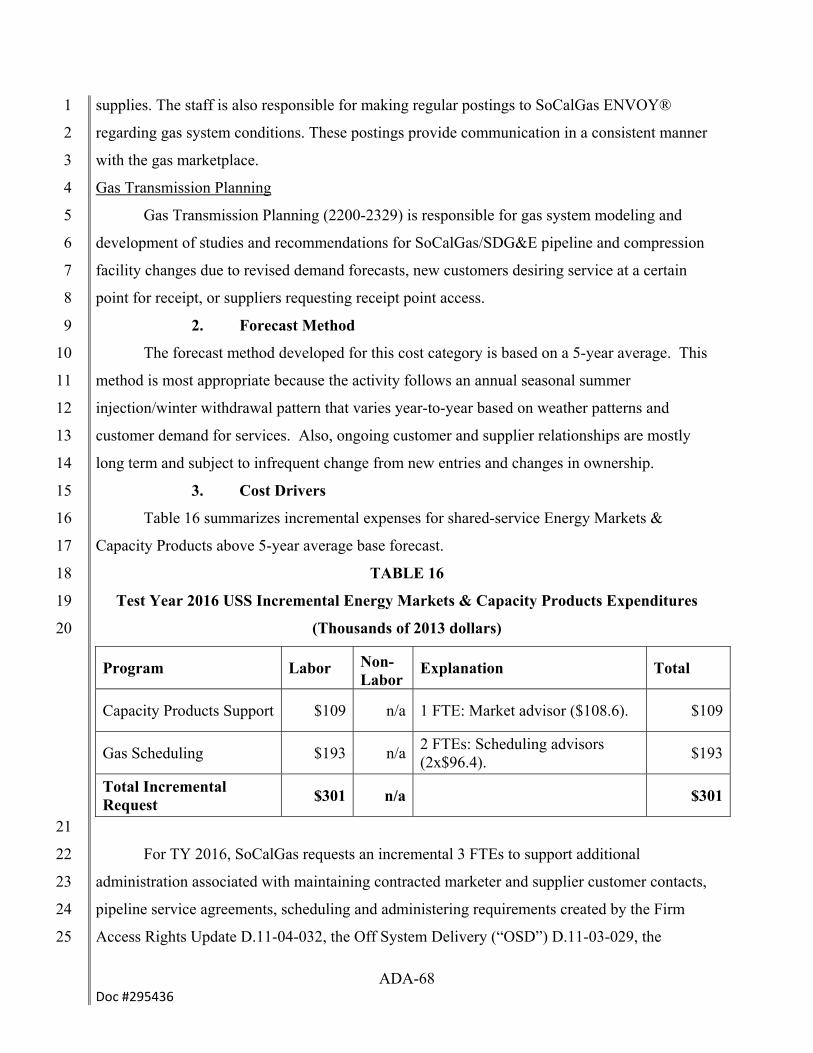
ADA-68 Doc #295436
supplies. The staff is also responsible for making regular postings to SoCalGas ENVOY® 1
regarding gas system conditions. These postings provide communication in a consistent manner 2
with the gas marketplace. 3
Gas Transmission Planning 4
Gas Transmission Planning (2200-2329) is responsible for gas system modeling and 5
development of studies and recommendations for SoCalGas/SDG&E pipeline and compression 6
facility changes due to revised demand forecasts, new customers desiring service at a certain 7
point for receipt, or suppliers requesting receipt point access. 8
2. Forecast Method 9
The forecast method developed for this cost category is based on a 5-year average. This 10
method is most appropriate because the activity follows an annual seasonal summer 11
injection/winter withdrawal pattern that varies year-to-year based on weather patterns and 12
customer demand for services. Also, ongoing customer and supplier relationships are mostly 13
long term and subject to infrequent change from new entries and changes in ownership. 14
3. Cost Drivers 15
Table 16 summarizes incremental expenses for shared-service Energy Markets & 16
Capacity Products above 5-year average base forecast. 17
TABLE 16 18
Test Year 2016 USS Incremental Energy Markets & Capacity Products Expenditures 19
(Thousands of 2013 dollars) 20
Program Labor Non-Labor
Explanation Total
Capacity Products Support $109 n/a 1 FTE: Market advisor ($108.6). $109
Gas Scheduling $193 n/a 2 FTEs: Scheduling advisors (2x$96.4).
$193
Total Incremental Request
$301 n/a $301
21
For TY 2016, SoCalGas requests an incremental 3 FTEs to support additional 22
administration associated with maintaining contracted marketer and supplier customer contacts, 23
pipeline service agreements, scheduling and administering requirements created by the Firm 24
Access Rights Update D.11-04-032, the Off System Delivery (“OSD”) D.11-03-029, the 25
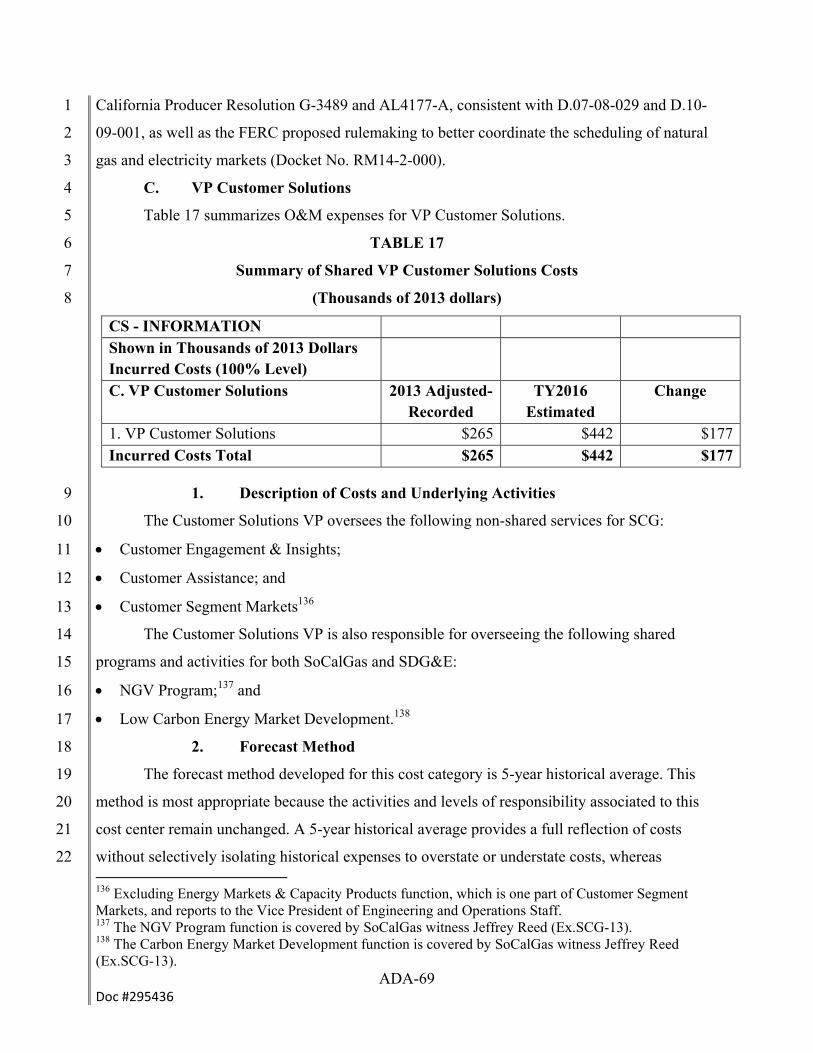
ADA-69 Doc #295436
California Producer Resolution G-3489 and AL4177-A, consistent with D.07-08-029 and D.10-1
09-001, as well as the FERC proposed rulemaking to better coordinate the scheduling of natural 2
gas and electricity markets (Docket No. RM14-2-000). 3
C. VP Customer Solutions 4
Table 17 summarizes O&M expenses for VP Customer Solutions. 5
TABLE 17 6
Summary of Shared VP Customer Solutions Costs 7
(Thousands of 2013 dollars) 8
CS - INFORMATION Shown in Thousands of 2013 Dollars Incurred Costs (100% Level)
C. VP Customer Solutions 2013 Adjusted-Recorded
TY2016 Estimated
Change
1. VP Customer Solutions $265 $442 $177Incurred Costs Total $265 $442 $177
1. Description of Costs and Underlying Activities 9
The Customer Solutions VP oversees the following non-shared services for SCG: 10
Customer Engagement & Insights; 11
Customer Assistance; and 12
Customer Segment Markets136 13
The Customer Solutions VP is also responsible for overseeing the following shared 14
programs and activities for both SoCalGas and SDG&E: 15
NGV Program;137 and 16
Low Carbon Energy Market Development.138 17
2. Forecast Method 18
The forecast method developed for this cost category is 5-year historical average. This 19
method is most appropriate because the activities and levels of responsibility associated to this 20
cost center remain unchanged. A 5-year historical average provides a full reflection of costs 21
without selectively isolating historical expenses to overstate or understate costs, whereas 22 136 Excluding Energy Markets & Capacity Products function, which is one part of Customer Segment Markets, and reports to the Vice President of Engineering and Operations Staff. 137 The NGV Program function is covered by SoCalGas witness Jeffrey Reed (Ex.SCG-13). 138 The Carbon Energy Market Development function is covered by SoCalGas witness Jeffrey Reed (Ex.SCG-13).
ADA-70 Doc #295436
comparatively, a base year forecast scenario would be inappropriate, as the 2013 historical year 1
experienced a period of vacancy during an organization change for the Vice President of 2
Customer Solutions office. A 5-year historical average forecast is consistent with forecast 3
methodologies in previous SoCalGas general rate cases for this area, and also provides an 4
average representation of the periodic fluctuations in non-labor costs caused by common atypical 5
expenditures to support market studies, align customer service priorities, and investigate 6
development of new products and services. 7
3. Cost Drivers 8
The TY 2016 forecast based on 5-year historical average results in $177,000 in 9
incremental costs compared to the 2013 base year. No additional adjustments or incremental 10
costs are forecasted for this cost center. 11
IV. CAPITAL 12
A. Introduction 13
I sponsor the capital IT projects listed below (Table 18). These IT projects address: 14
technical obsolescence as software or hardware approach “end-of-life”, new mandated activities, 15
customer experience improvements, understanding customers, and growth of current activities 16
and functions. The IT capital costs are presented in the testimony of Christopher Olmsted, 17
SoCalGas - Information Technology (Ex.SCG-18). Any ongoing O&M impacts associated with 18
these capital projects are referenced accordingly in Section II of my testimony. 19
20
21
22
23
24
25
26
27
28
29
30
31
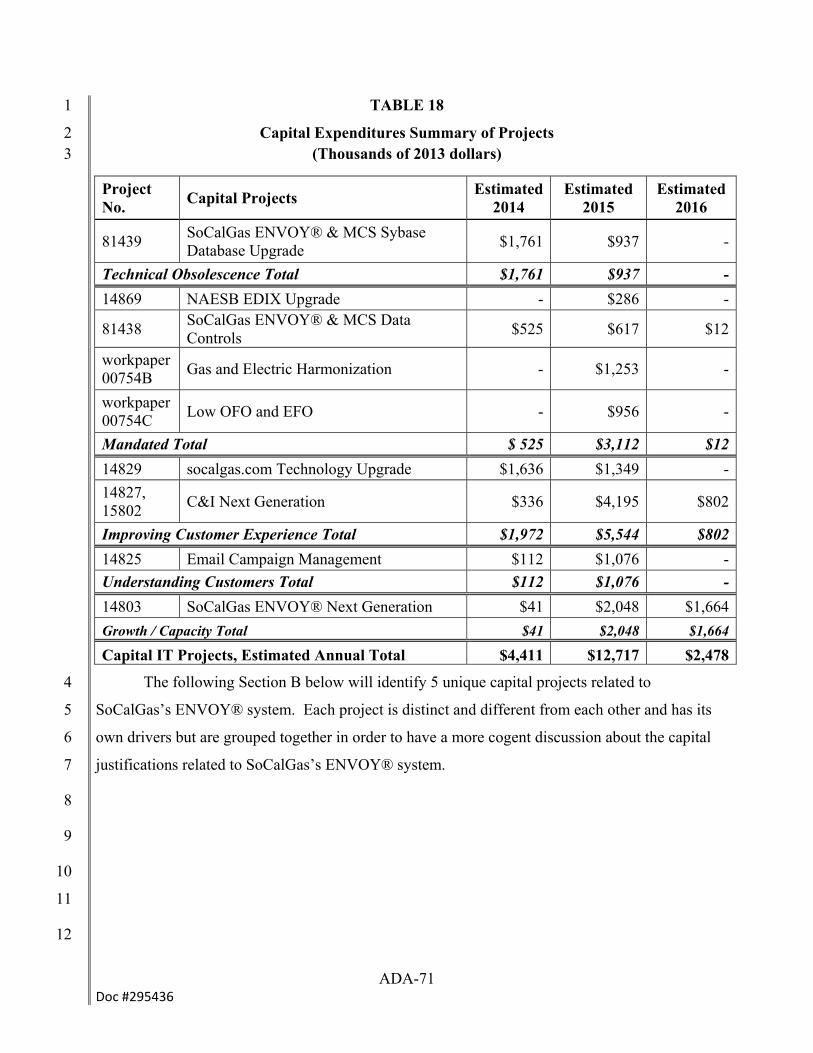
ADA-71 Doc #295436
TABLE 18 1
Capital Expenditures Summary of Projects 2 (Thousands of 2013 dollars) 3
Project No.
Capital Projects Estimated
2014 Estimated
2015 Estimated
2016
81439 SoCalGas ENVOY® & MCS Sybase Database Upgrade
$1,761 $937 -
Technical Obsolescence Total $1,761 $937 -
14869 NAESB EDIX Upgrade - $286 -
81438 SoCalGas ENVOY® & MCS Data Controls
$525 $617 $12
workpaper 00754B
Gas and Electric Harmonization - $1,253 -
workpaper 00754C
Low OFO and EFO - $956 -
Mandated Total $ 525 $3,112 $12
14829 socalgas.com Technology Upgrade $1,636 $1,349 -
14827, 15802
C&I Next Generation $336 $4,195 $802
Improving Customer Experience Total $1,972 $5,544 $802
14825 Email Campaign Management $112 $1,076 -
Understanding Customers Total $112 $1,076 -
14803 SoCalGas ENVOY® Next Generation $41 $2,048 $1,664
Growth / Capacity Total $41 $2,048 $1,664
Capital IT Projects, Estimated Annual Total $4,411 $12,717 $2,478
The following Section B below will identify 5 unique capital projects related to 4
SoCalGas’s ENVOY® system. Each project is distinct and different from each other and has its 5
own drivers but are grouped together in order to have a more cogent discussion about the capital 6
justifications related to SoCalGas’s ENVOY® system. 7
8
9
10
11
12

ADA-72 Doc #295436
B. SoCalGas ENVOY® 1
The forecast for all the SoCalGas ENVOY® related projects (Project/Workpaper #81439, 2
#81438, #00754B, #00754C, #14803) for 2014, 2015 and 2016 are shown in Table 18 3
above. SoCalGas plans to build and place in service these projects by the Test Year 2016. 4
SoCalGas ENVOY® is our online electronic bulletin board where customers, marketers, 5
producers and Energy Service Providers (“ESPs”) can manage their gas supplies, submit real-6
time nominations for gas delivery, trade imbalance positions, monitor metered gas consumption, 7
manage storage accounts, and receive up-to-the minute news and information on our pipeline 8
operations. SoCalGas provides its customers access to its electronic bulletin board (“EBB”) 9
system via SoCalGas ENVOY®, to facilitate communication and utility-to-customer and 10
customer-to-customer transactions for balancing and secondary market trading. The SoCalGas 11
ENVOY® service is governed by Rule 33 of SoCalGas’ tariffs. This system is mandated by 12
the Commission and must be in compliance with Affiliate Transactions Rules (D.97-12-088 13
issued in December 1997 revised in August 1998 and revised again in December 2006) and 14
Remedial Measures (D.98-03-073). 15
1. SoCalGas ENVOY® & MCS Sybase Database Upgrade, Project 16 #81439 17 a. Description 18
MCS is our Measurement Collection System, which captures metered gas consumption 19
data. The MCS system is the data input into the SoCalGas ENVOY® system. Project #81439 20
proposes replacement hardware and software which allows this data interface with a change in 21
vendor, which is a lower cost alternative compared to upgrading to new hardware and software 22
with the current vendor (this alternative would have incurred an additional $240,000 per year 23
over the cost of Project #81439 due to higher vendor support costs). 24
The specific project cost details regarding SoCalGas ENVOY® & MCS Sybase Database 25
Upgrade, Project #81439 are found in witness Christopher Olmsted’s capital workpapers 26
(Ex.SCG-18-CWP-774J). 27
2. SoCalGas ENVOY® MCS Data Controls, Project #81438 28
a. Description 29
To ensure historical data remains compliant with SoCalGas’ policy on data retention, 30
audit guidelines, and record management policies, SoCalGas ENVOY® currently utilizes a 31
manual purge process and MCS contains limited automated processes to purge selective data. 32
ADA-73 Doc #295436
SoCalGas ENVOY® & MCS Data Controls, Project #81438 will provide for automated purge 1
processes, new data control functionalities to periodically remove expired data and ensure 2
continual data retention compliance, and testing functionalities to support development of new 3
criteria for deleting outdated records to comply with SoCalGas’ records retention rules. 4
The specific cost details regarding SoCalGas ENVOY® & MCS Data Controls, Project 5
#81438 are found in witness Christopher Olmsted’s capital workpapers (Ex.SCG-18-CWP-6
774K). 7
3. Gas and Electric Harmonization, Workpaper #00754B 8
a. Description 9
The forecast for Gas and Electric Harmonization, Workpaper #00754B for 2015 is $1.253 10
million. SoCalGas plans to build and place in service Gas and Electric Harmonization, 11
Workpaper #00754B by the Test Year. 12
This project will support compliance with the Federal Energy Regulatory Commission’s 13
(“FERC”) rulemaking decision regarding the gas and electric harmonization proposal.139 The 14
mandated business rules would implement the following changes: 15
Begin the natural gas operating day five hours earlier; 16
Move the first day-ahead gas nomination opportunity an hour and a half later; and 17
Add two more nomination cycles per day (for a total of four).140 18
Modifications to the SoCalGas ENVOY® application include changing the gas day start, 19
changing the time cycle deadline, increasing processing load for more nomination cycles, 20
decreasing processing time between confirmation deadline and scheduled quantity posting, as 21
well as modifying associated reports and screens. 22
The specific cost details regarding Gas and Electric Harmonization, Workpaper #00754B 23
are found in witness Christopher Olmsted’s capital workpapers (Ex.SCG-18-CWP-754B). 24
25
26
27
28
29 139 FERC. Notice of Proposed Rulemaking (“NOPR”) Docket No. RM14-2-000. 140 Marren, Joe. “FERC Takes Three Actions to Harmonize Gas and Electric Coordination”, March 20, 2014, http://sustainableferc.org/ferc-takes-three-actions-to-harmonize-gas-and-electric-coordination/.
ADA-74 Doc #295436
4. Low OFO and EFO, Workpaper #00754C 1
a. Description 2
The forecast for Low Operational Flow Orders (Low “OFO”) and Emergency Flow 3
Orders (“EFO”), Workpaper #00754C for 2015 is $0.956 million. SoCalGas plans to build and 4
place in service Low OFO and EFO, Workpaper #00754C by the Test Year. 5
To support compliance with proposed changes to SoCalGas tariff G-IMB, Rule 30, and 6
Rule 41, system enhancements are required in the SoCalGas ENVOY® application and in the 7
Specialized Contract Billing System (“SCBS”). The changes include the following: 8
Elimination of Winter Balancing rules; and 9
Adding new Low OFO and EFO rules. 10
Costs for Low OFO and EFO, Workpaper #00754C are for enhancements and 11
modifications which include changing Specialized Contract Billing System billing logic to assess 12
the new low and emergency operational flow order compliance, remove the previous winter 13
balancing logic, calculate and bill balancing charges, and modifying SoCalGas ENVOY®’s 14
affected reports, monitoring pages, and noticing pages. 15
The specific cost details regarding Low OFO and EFO, Workpaper #00754C are found in 16
witness Christopher Olmsted’s capital workpapers (Ex.SCG-18-CWP-754C). 17
5. SoCalGas ENVOY® Next Generation, Project #14803 18
a. Description 19
The SoCalGas ENVOY® Next Generation Project entails a fully revamped interface and 20
navigational menus, expanded to provide customers with up-to-date information, additional data 21
querying functions and reporting, additional accessibility (neutral web browser use and mobile 22
platforms), customizable account functions, and stronger web security. These additional 23
capabilities were developed based on input from SoCalGas ENVOY® service users. 24
The specific cost details regarding SoCalGas ENVOY® Next Generation, Project #14803 25
are found in witness Christopher Olmsted’s capital workpapers (Ex.SCG-18-CWP-774A). 26
C. NAESB EDIX Upgrade, Project #14869 27
1. Description 28
The forecast for NAESB EDIX Upgrade, Project #14869 for 2015 is $0.286 million. 29
SoCalGas plans to implement the NAESB EDIX Upgrade, Project #14869 by the test year. 30
The North American Energy Standard Board (“NAESB”) Electronic Data Interchange 31
Extended (“EDIX”) upgrade will allow SoCalGas ENVOY® gas scheduling system to continue 32
ADA-75 Doc #295436
the electronic exchange of gas transportation nomination and scheduling data with all of the 1
upstream pipelines that deliver gas to its system. SoCalGas has Trading Partner agreements with 2
6 upstream pipelines (El Paso Natural Gas [“EPNG”], Transwestern Pipeline, Kern River Gas 3
Transmission, PG&E, Southern Trails, and Mojave Pipeline) for the electronic transfer of gas 4
flow information data files currently under NAESB EDIX Version 1.6. Kinder Morgan, the 5
parent company for EPNG and Mojave Pipelines, is upgrading to NAESB EDIX version 2.0 by 6
1st quarter of 2016 with no backward compatibility to version 1.6. In order to maintain a timely 7
scheduling process with EPNG, our largest supplier, SoCalGas will have to implement version 8
2.0 by 1st quarter 2016 as well. Other upstream pipelines have already made this upgrade but 9
have maintained backward compatibility with version 1.6. Unfortunately Kinder Morgan has 10
declined to do so with their upgrade thus requiring SoCalGas to make the upgrade to Version 2.0 11
concurrently to avoid disruption as well. 12
The specific cost details regarding NAESB EDIX Upgrade, Project #14869 are found in 13
witness Christopher Olmsted’s capital workpapers (Ex.SCG-18-CWP-766A). 14
D. Socalgas.com Technology Upgrade, Project #14829 15
1. Description 16
The forecast for Socalgas.com Technology Upgrade, Project #14829 for 2014 and 2015 17
are $1.636 million and $1.349 million, respectively. SoCalGas plans to build and place in 18
service Socalgas.com Technology Upgrade, Project #14829 by the Test Year. 19
In order to provide reliable information, self-help tools and eServices on socalgas.com, 20
the Content Management Software (“CMS”) used to manage web pages on socalgas.com needs 21
to be upgraded as it is no longer supported by the vendor. SoCalGas cancelled support from the 22
current vendor since the current CMS software is unreliable and inflexible and would require an 23
incremental dedicated team in the web group to manage all new updates or additions to 24
socalgas.com, as it does not support distributed updates by content business owners. The new 25
CMS software will enhance information security and increase cyber security. The latest software 26
version will also permit content business owners to self-update materials. 27
Key enhancements for the socalgas.com Technology Upgrade project are: 28
Have high availability during emergencies so customers trying to access updates will be able 29
to receive safety and restoration information during an emergency or high activity event; 30
ADA-76 Doc #295436
Permit distributed content updates, which enables business owner organizations outside the 1
web team to update and maintain content with added ease and frequency; 2
Responsive web design, to provide a consistent user experience across all devices, platforms 3
(e.g., mobile phones, tablets, desktop browsers), and with other communication channels. 4
Visits to SoCalGas’ www.socalgas.com exceeded 16 million in 2013, growing by over 5
36% over the last four years with an annual growth rate of 8%. Socalgas.com is an important 6
source for information for our customers, especially about customer assistance programs, with 7
visits to CARE information pages growing by 47% in 2013 from 2012 and visits to ESAP 8
information pages growing by 83% in 2013 from 2012. A new refreshed design for socalgas.com 9
will enhance customer service by providing a better and easier user experience that will help 10
customers find more information about program participation and enable enrollment in those 11
programs and services. 12
The specific cost details regarding Socalgas.com Technology Upgrade, Project #14829 is 13
found in SoCalGas witness Christopher Olmsted’s capital workpapers (Ex.SCG-18-CWP-774C). 14
E. C&I Next Generation, Project #14827, #15802 15
1. Description 16
The forecast for C&I Next Generation, Projects #14827, #15802 for 2014, 2015, and 17
2016 are $0.336 million, $4.195 million, and $0.802 million, respectively. SoCalGas plans to 18
build and place in service C&I Next Generation, Projects #14827, #15802 by the Test Year. 19
The C&I Next Generation project is an Account Representative mobile enablement tool 20
that connects our service representatives to various enterprise database systems and allows them 21
to present this information as support during their customer interactions. Presently, ARs interact 22
with customers in a non-connected environment, requiring them to access data from multiple 23
databases and anticipate and prepare support material in advance of customer meetings. Mobile 24
enablement with the C&I Next Generation project will provide tools for the ARs to present 25
customer data in real-time, improving customer interactions with the ability to tailor data for 26
specific discussions, and also enables the ARs to capture customer equipment and site details 27
while at a customer’s facility. 28
C&I Next Generation consists of: 29
Creating new mobile applications and consolidation of data where possible into a single 30
mobile Customer Information Application; 31

ADA-77 Doc #295436
Development of a mobile integration layer for real time push/pull access of enterprise 1
databases across multiple programs (e.g., Customer Information System, Specialized 2
Customer Billing System, Customer Contract System, New Business Management System, 3
etc.); 4
Integrated roadmaps that would do the following: 5
o Connect, consolidate and integrate current AR accessible information systems 6
containing billing data, mapping, customer relationship management, contracts, 7
construction and planning, etc., 8
o Provide integrated access to additional information systems currently not easily 9
accessible to ARs– meter records, meter calibration data & reports, energy efficiency, 10
customer order history, non-core daily usage and services, 11
o Provide a mobile optimized user interface that enables quick access to major 12
functions, possibly in the form of dashboards designed specifically for mobile 13
devices, and 14
o Allow for single sign on to the system, as well as single read/write information into 15
existing systems of records. 16
Forms and tools that are linked and will auto-populate by pulling information from existing 17
systems, thus minimizing duplicate input efforts; 18
Online brochures that describe programs and services and encourage customer interaction by 19
responding in real-time to customer inputs, resulting in customized recommendations based 20
on these inputs. These interactive brochures will enable customers to fill out online program 21
applications, check status of applications, and apply for services offered by SCG; and 22
Documentation access that provides products and services enrollment forms. 23
The specific cost details regarding C&I Next Generation, Projects #14827, #15802 are 24
found in witness Christopher Olmsted’s capital workpapers (Ex.SCG-18-CWP-774G and 25
Ex.SCG-18-CWP-774I). 26
F. Email Campaign Management, Project #14825 27
1. Description 28
The forecast for Email Campaign Management, Project #14825 for 2014 and 2015 are 29
$0.112 million and $1.076 million, respectively. SoCalGas plans to build and place in service 30
Email Campaign Management, Project #14825 by the Test Year. 31
ADA-78 Doc #295436
SoCalGas does not have a system to properly manage the number of different emails sent 1
about different subjects to different customer segments. Currently SoCalGas gets limited support 2
from our email service provider which is inadequate to support this growing communication 3
channel. Because of the ability for email to rapidly communicate relevant information, its use at 4
SoCalGas has grown over 123% in the last two years, with 22 million emails sent to customers in 5
2011 growing to over 49 million emails sent to customers in 2013. This project will reduce the 6
time needed to create emails and improve the effectiveness of messages through subject line and 7
content testing. The project will provide the management and control required by the increasing 8
use of emails, increasing customer segmentation approach, increasing specific communication 9
needs, and the increasing competition for awareness in the customers’ inbox. Email 10
communication is a cost-effective and expedient method for providing education and outreach to 11
customers. Email provides faster feedback than traditional media such as direct mail, bill inserts 12
or brochures. 13
SoCalGas must leverage customer information about current and past program 14
participation, demographics, energy usage, bill history and personal preferences for tailoring 15
email content and effectiveness. To collect and use this segmentation information, SoCalGas 16
will implement an Email Campaign Management system that will manage and track every 17
campaign, providing analytics that will increase the effectiveness and efficiency of every 18
subsequent outreach and promotion campaign. 19
Key functions of the Email Campaign Management system are: 20
Tracking of email campaigns; 21
Segmentation of customers by current and past program participation, demographics, energy 22
usage, bill history, personal preferences, and prior campaign behavior/response; 23
Standardizing the process for campaign creation, review, and deployment; and 24
Integrating with My Account and socalgas.com to allow customers to directly manage their 25
communication preferences, including message types (e.g., promotional messages, new 26
product announcements, informational newsletters); delivery frequency; message format 27
(e.g., HTML, text, wireless); and acceptable communication. 28
The specific cost details regarding Email Campaign Management, Project #14825 are 29
found in Christopher Olmsted’s capital workpapers (Ex.SCG-18-CWP-774B). 30
31
ADA-79 Doc #295436
V. CONCLUSION 1
SoCalGas CS&I O&M and capital project justifications were diligently developed and 2
reviewed. They represent a reasonable projection of the level of funding required to support 3
SoCalGas’ goals of safety, reliability, customer service, and compliance. 4
This concludes my revised prepared direct testimony. 5
6
ADA-80 Doc #295436
VI. WITNESS QUALIFICATIONS 1
My name is Ann D. Ayres. I am currently the Director of Customer Engagement & 2
Insights for SoCalGas. My responsibilities include: development and execution of marketing 3
and communications strategies; management of all primary and secondary customer research to 4
assess customer satisfaction with services and set company service strategy; and development 5
and management of the company’s website including My Account portal and intranet site. Prior 6
to my current position I was the Customer Research Manager from 2007 to 2010 for both 7
SoCalGas and SDG&E. I joined SoCalGas in 1985 and have held positions of increasing 8
responsibilities primarily in the customer research and communications area until my promotion 9
to Director of Customer Engagement & Insights in 2012. I received a Bachelor of Arts in 10
Behavioral Science and a minor in Criminal Justice and Corrections from California State 11
Polytechnic University, Pomona in 1985. I have not previously testified before the California 12
Public Utilities Commission.13

Doc # 295436
APPENDICES
APPENDIX A – WEB/SOCIAL MEDIA and CUSTOMER CONTACT CENTER
INTERACTION MATRIX
APPENDIX B – CUSTOMER ENGAGEMENT & INSIGHTS AND BUSINESS CLIENTS
2013 ACTIVITIES
APPENDIX C – GLOSSARY OF ACRONYMS
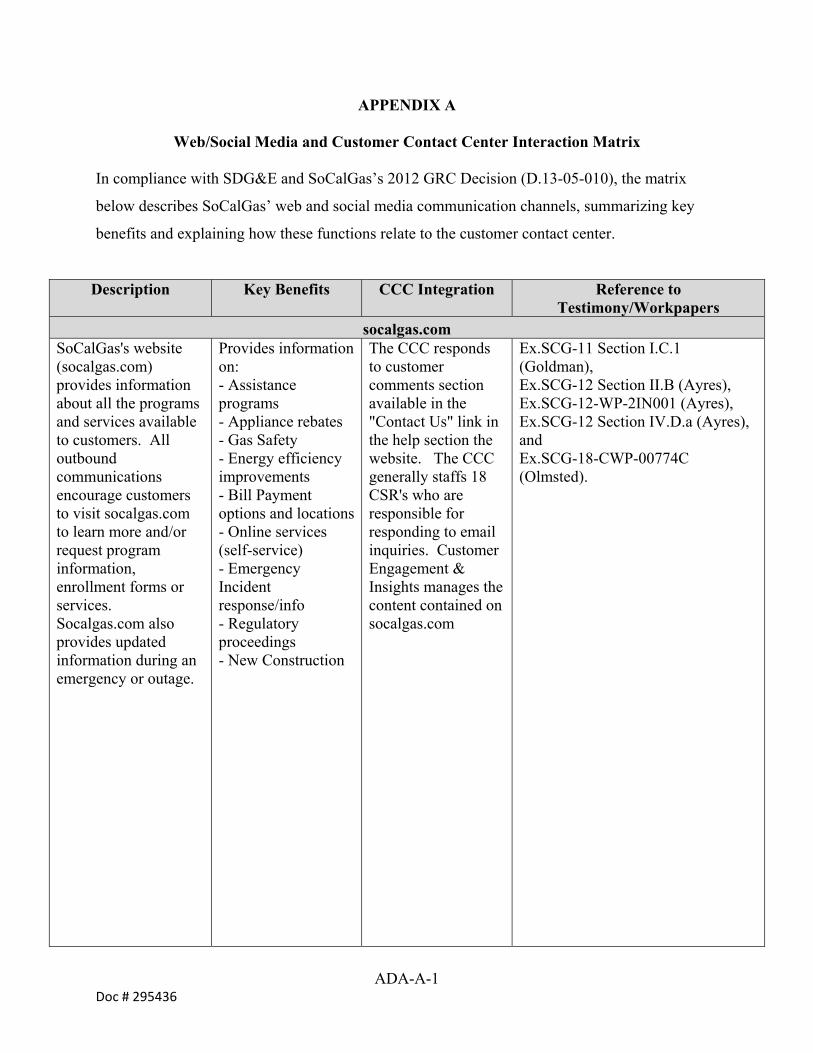
ADA-A-1 Doc # 295436
APPENDIX A
Web/Social Media and Customer Contact Center Interaction Matrix
In compliance with SDG&E and SoCalGas’s 2012 GRC Decision (D.13-05-010), the matrix
below describes SoCalGas’ web and social media communication channels, summarizing key
benefits and explaining how these functions relate to the customer contact center.
Description Key Benefits CCC Integration Reference to Testimony/Workpapers
socalgas.com SoCalGas's website (socalgas.com) provides information about all the programs and services available to customers. All outbound communications encourage customers to visit socalgas.com to learn more and/or request program information, enrollment forms or services. Socalgas.com also provides updated information during an emergency or outage.
Provides information on: - Assistance programs - Appliance rebates - Gas Safety - Energy efficiency improvements - Bill Payment options and locations- Online services (self-service) - Emergency Incident response/info - Regulatory proceedings - New Construction
The CCC responds to customer comments section available in the "Contact Us" link in the help section the website. The CCC generally staffs 18 CSR's who are responsible for responding to email inquiries. Customer Engagement & Insights manages the content contained on socalgas.com
Ex.SCG-11 Section I.C.1 (Goldman), Ex.SCG-12 Section II.B (Ayres), Ex.SCG-12-WP-2IN001 (Ayres), Ex.SCG-12 Section IV.D.a (Ayres), and Ex.SCG-18-CWP-00774C (Olmsted).

ADA-A-2 Doc # 295436
Description Key Benefits CCC Integration Reference to Testimony/Workpapers
MyAccount My Account is a secure transactional website for customers to view and pay their bill, request service, request a payment extension, or view energy usage and analysis.
Provides access to: - Account information - Bill and Bill history (25 months) - Bill Payment (one-time and repeating) - Energy usage analysis tools - Online services (self-service) - Alerts and Notifications
The CCC handles all phone inquiries from customers experiencing difficulties using My Account. This may include browser troubleshooting, password resets, or individual customer account issues.
Ex. SCG-11 Section II.B.2 (Goldman),
Ex. SCG-11-WP-2OO000 (Goldman),
Ex.SCG-11 Section IV.B.4 (Goldman),
Ex.SCG-18-CWP-00774M (Olmsted),
Ex.SCG-11 Section IV.B.5 (Goldman),
Ex.SCG-18-CWP-00776V (Olmsted),
Ex.SCG-11 Section IV.C.1 (Goldman),
Ex.SCG-18-CWP-00774L (Olmsted),
Ex. SCG-12 Section II.B (Ayres), Ex. SCG-11 Section II.B.3
(Goldman), Ex. SCG-11-WP-2OO001
(Goldman), Ex. SCG-11 Section II.J.3
(Goldman), Ex. SCG-11-WP-2OO005.001
(Goldman), Ex. SCG-11 Section II.K.3
(Goldman), and Ex. SCG-11 Section III.C.1
(Goldman)
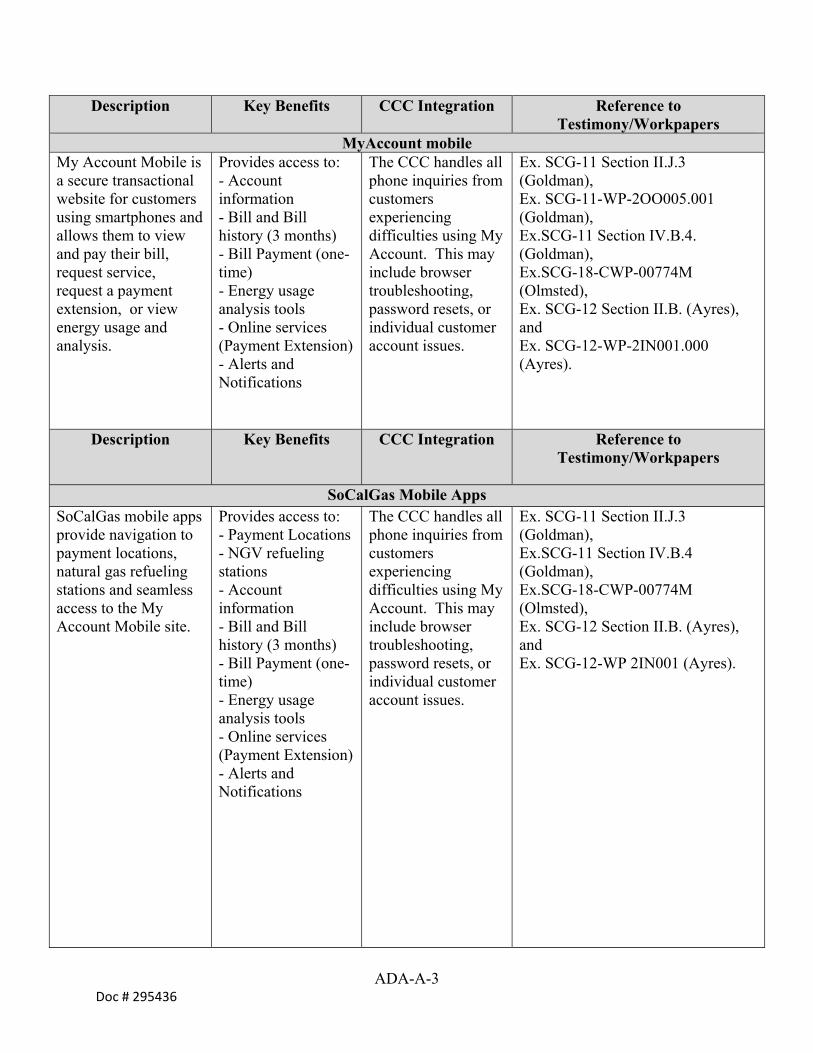
ADA-A-3 Doc # 295436
Description Key Benefits CCC Integration Reference to Testimony/Workpapers
MyAccount mobile My Account Mobile is a secure transactional website for customers using smartphones and allows them to view and pay their bill, request service, request a payment extension, or view energy usage and analysis.
Provides access to: - Account information - Bill and Bill history (3 months) - Bill Payment (one-time) - Energy usage analysis tools - Online services (Payment Extension)- Alerts and Notifications
The CCC handles all phone inquiries from customers experiencing difficulties using My Account. This may include browser troubleshooting, password resets, or individual customer account issues.
Ex. SCG-11 Section II.J.3 (Goldman), Ex. SCG-11-WP-2OO005.001 (Goldman), Ex.SCG-11 Section IV.B.4. (Goldman), Ex.SCG-18-CWP-00774M (Olmsted), Ex. SCG-12 Section II.B. (Ayres), and Ex. SCG-12-WP-2IN001.000 (Ayres).
Description Key Benefits CCC Integration Reference to Testimony/Workpapers
SoCalGas Mobile Apps SoCalGas mobile apps provide navigation to payment locations, natural gas refueling stations and seamless access to the My Account Mobile site.
Provides access to: - Payment Locations- NGV refueling stations - Account information - Bill and Bill history (3 months) - Bill Payment (one-time) - Energy usage analysis tools - Online services (Payment Extension)- Alerts and Notifications
The CCC handles all phone inquiries from customers experiencing difficulties using My Account. This may include browser troubleshooting, password resets, or individual customer account issues.
Ex. SCG-11 Section II.J.3 (Goldman), Ex.SCG-11 Section IV.B.4 (Goldman), Ex.SCG-18-CWP-00774M (Olmsted), Ex. SCG-12 Section II.B. (Ayres), and Ex. SCG-12-WP 2IN001 (Ayres).
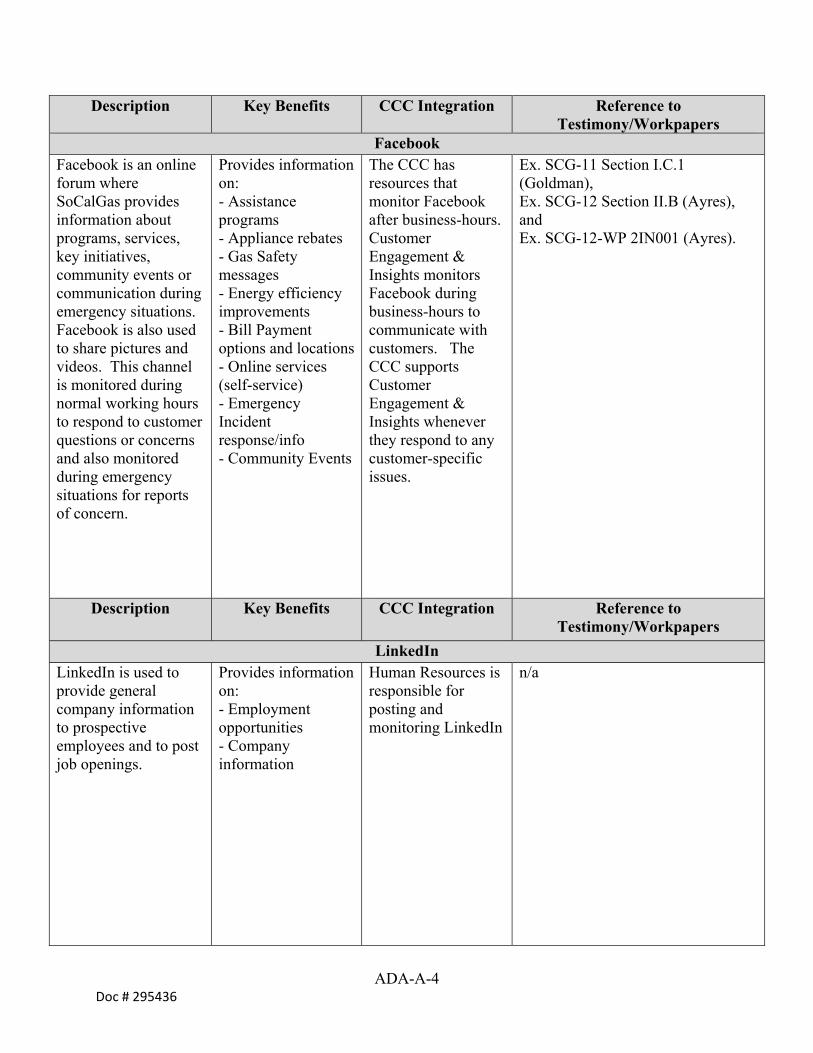
ADA-A-4 Doc # 295436
Description Key Benefits CCC Integration Reference to Testimony/Workpapers
Facebook Facebook is an online forum where SoCalGas provides information about programs, services, key initiatives, community events or communication during emergency situations. Facebook is also used to share pictures and videos. This channel is monitored during normal working hours to respond to customer questions or concerns and also monitored during emergency situations for reports of concern.
Provides information on: - Assistance programs - Appliance rebates - Gas Safety messages - Energy efficiency improvements - Bill Payment options and locations- Online services (self-service) - Emergency Incident response/info - Community Events
The CCC has resources that monitor Facebook after business-hours. Customer Engagement & Insights monitors Facebook during business-hours to communicate with customers. The CCC supports Customer Engagement & Insights whenever they respond to any customer-specific issues.
Ex. SCG-11 Section I.C.1 (Goldman), Ex. SCG-12 Section II.B (Ayres), and Ex. SCG-12-WP 2IN001 (Ayres).
Description Key Benefits CCC Integration Reference to Testimony/Workpapers
LinkedIn LinkedIn is used to provide general company information to prospective employees and to post job openings.
Provides information on: - Employment opportunities - Company information
Human Resources is responsible for posting and monitoring LinkedIn
n/a

ADA-A-5 Doc # 295436
Description Key Benefits CCC Integration Reference to Testimony/Workpapers
Twitter Twitter is used to communicate with a targeted audience of customers about programs and services or communicate during emergency situations. Tweets contain a call to action for customers to go socalgas.com for more information. This channel is monitored during normal working hours to respond to customer questions or concerns and also monitored during emergency situations for reports of concern.
Provides information on: - Assistance programs - Appliance rebates - Gas Safety messages - Energy efficiency improvements - Bill Payment options and locations- Online service info- Emergency Incident response/info - Community Events
The CCC has resources that monitor Twitter after business-hours. Customer Engagement & Insights monitors Twitter during business-hours to communicate with customers. The CCC supports Customer Engagement & Insights whenever they respond to any customer-specific issues.
Ex. SCG-11 Section I.C.1 (Goldman), Ex. SCG-12 Section II.B (Ayres), and Ex. SCG-12-WP 2IN001(Ayres).
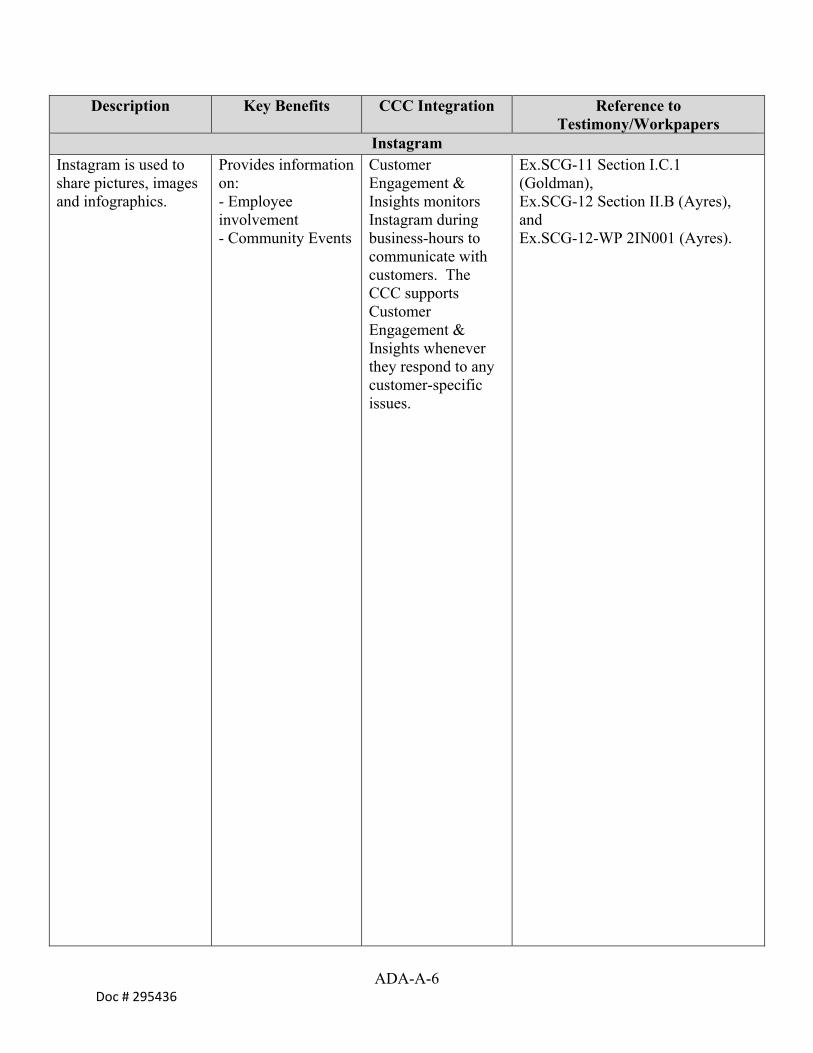
ADA-A-6 Doc # 295436
Description Key Benefits CCC Integration Reference to Testimony/Workpapers
Instagram Instagram is used to share pictures, images and infographics.
Provides information on: - Employee involvement - Community Events
Customer Engagement & Insights monitors Instagram during business-hours to communicate with customers. The CCC supports Customer Engagement & Insights whenever they respond to any customer-specific issues.
Ex.SCG-11 Section I.C.1 (Goldman), Ex.SCG-12 Section II.B (Ayres), and Ex.SCG-12-WP 2IN001 (Ayres).

ADA-A-7 Doc # 295436
Description Key Benefits CCC Integration Reference to Testimony/Workpapers
Youtube
You-Tube is used to share videos with customers. Examples include emergency preparedness, program information and energy efficiency how-to videos.
Provides information on: - Assistance programs - Appliance rebates - Gas Safety - Energy efficiency improvements - Bill Payment options - Online services (self-service) - Gas Sustainability/ Innovation
Customer Engagement & Insights is responsible for posting videos to You-Tube.
Ex.SCG-11 Section I.C.1 (Goldman), Ex.SCG-12 Section II.B (Ayres), and Ex.SCG-12-WP 2IN001 (Ayres).

ADA-B-1 Doc # 295436
eServices & Data Analysis
Customer Engagement & Insights
Customer Programs - Energy Efficiency ("EE")
Public AwarenessAdvanced Meter
Infrastructure ("AMI")Pipeline Safety
Enhancement Plan Customer Programs -
Energy Savings Assistance
Customer Marketing & Communications
Creative ServicesCustomer Insight &
AnalyticsMonitor and maintain social media channels, generate new communication messages for various communication channels (radio, television, print, e-mail, social media)
Maintain photo and video media library, responsible for unifying content and timing of various communication messages
Communication content: seasonal messages and outreach campaigns such as "Pilot Relight", broad company wide safety messages such as pipeline safety, dig-alert messages, general conservation and energy savings messages, etc.
Measurements of Customer Experience Survey, continual investigation of customer needs and integration of findings with clients, data research
Maintain, upgrade, and improve internal and external websites, mobile, and online billing platforms.
2013 GRC funded labor & non-labor ($000s):
$2,957
2013 GRC funded labor & non-labor ($000s):
$371
2013 GRC funded labor & non-labor ($000s):
$ 1,689
2013 GRC funded labor & non-labor ($000s):
$903
*Business Owners (Clients)
*These are only an approximation and are not a comprehensive list of the work various business owners or clients within SoCalGas fund. The type of work and clients vary depending on business needs, timing, and other drivers. These business owners include both GRC and GRC-excluded activities.
Communication content: EE general awareness campaigns, various materials for: 3rd party programs, partnership programs, CA advanced home program, EE rebate for business program, On Bill Financing program, Point-of-Sales Rebate applications, EE calculated incentive
Communication content: Incremental safety education and outreach tailored for specific demographic or topics such as Sewer Lateral Inspection Program ("SLIP"), Distribution Riser Implementation Program ("DRIP"), etc.
Communication content: Educational materials, informational outreach regarding AMI such as notice of 'installation time' mailed notices and 'service completed' door hangar notices, etc.
2013 non-GRC funded labor & non-labor ($000s): $1,722
*2013 GRC funded non-labor only ($000s):
$604
2013 non-GRC funded non-labor only ($000s):
$280
*Note: Costs reside in Ex.SCG-07 (Stanford).
2013 non-GRC funded labor & non-labor ($000s): $2,079
Customer Programs - CARE
Communication content: outreach/awareness campaigns, enrollment applications, collateral, with targeted outreach towards the eligible customer segments regarding alternate rates (discount on monthly bill, or discount on Service Establishment Charge)
2013 non-GRC funded labor & non-labor ($000s): $1,805
Communication content: Informational notices and specific safety messages to potentially impacted customers in inspection zones, educational and presentation outreach materials to explain PSEP process and activities to communities,
Communication content: Campaigns including print, radio, promotional items, outreach events, and application designs regarding no-cost energy-saving home improvements (low flow shower heads, faucet aerators, weather-stripping, pipe insulation…etc)
Communication content: Outreach, education, and collateral for programs such as Solar Statewide and Self Generation Incentive programs, which include radio, television, collateral, and demonstration units for outreach exhibits
Statewide Programs
2013 non-GRC funded non-labor only ($000s):
$104
2013 non-GRC funded labor & non-labor ($000s): $1,166
APPENDIX B - CUSTOMER ENGAGEMENT & INSIGHTS
Customer Engagement & Insights and Business Clients 2013 Activities
ADA-C-1 Doc #295436
APPENDIX C – GLOSSARY OF ACRONYMS
A: Application
AB: Assembly Bill
AC: Air Conditioning
ACWA: Association of California Water Agencies
AEE: Association of Energy Engineers
AIA: American Institute of Architects
AL: Advice Letter
AMI: Advanced Metering Infrastructure
AR: Account Representative
BOMA: Building Owners and Managers Association Conference
BTS: Backbone Transportation Service
CARB: California Air Resources Board
CARE: California Alternate Rates for Energy
CBOs: Community Based Organizations
CCC: Customer Contact Center
CCS: Customer Contract System
CEC: California Energy Commission
CES: Customer Experience Survey
CFR: Code of Federal Regulations
CGR: California Gas Report
CHP: Combined Heat and Power
CMS: Content Management System
CPUC: California Public Utilities Commission
CS-I: Customer Service - Information
CSD: Community Service and Development
CSR: Customer Service Representative
CSS: Customer Satisfaction Survey
D.: Decision
DBE: Diverse Business Enterprise
ADA-C-2 Doc #295436
EBB: Electronic Bulletin Board (a.k.a. “SoCalGas ENVOY®”, “ENVOY®”)
EDIX: Electronic Data Interchange Extended
EG: Electric Generation
EOR: Enhanced Oil Recovery
EPNG: El Paso Natural Gas
ERC: Energy Resource Center
ESA: Energy Savings Assistance
ESP: Energy Service Provider
Ex: Exhibit
FERC: Federal Energy Regulatory Commission
FERP: Federal Energy Retrofit Program
FTEs: Full Time Equivalents
GAF: Gas Assistance Fund
GHG: Greenhouse Gas
GRC: General Rate Case
GRIT: GreenBook Research Industry Trends
ICF International: Inner City Fund International
IIAR: Institute of Ammonia Refrigeration
IT: Information Technology
IVR: Interactive Voice Response
LIB: Line Item Billing
LIEE: Low Income Energy Efficiency
LIHEAP: Low Income Home Energy Assistance Program
LNG: Liquefied Natural Gas
LTPP: Long Term Power Procurement
MBL: Medical Baseline
MCS: Measurement Collection System
MOU: Memorandum of Understanding
MW: Megawatt
NAESB: North American Energy Standard Board
NAESCO: National Association of Energy Service Companies
ADA-C-3 Doc #295436
NBMS: New Business Management System
NGAT: Natural Gas Appliance Testing
NOPR: Notice of Proposed Rulemaking
O&M: Operations and Maintenance
OFO: Operational Flow Order
OSD: Off System Delivery
PFM: Petition for Modification
PG&E: Pacific Gas and Electric Company
QFER: Quarterly Fuel and Energy Report
R.: Order Instituting Rulemaking
RFO: Request For Offer
RPS: Renewable Portfolio Standard
SCAQMD: South Coast Air Quality Management District
SCBS: Specialized Contract Billing System
SCE: Southern California Edison Company
SDG&E: San Diego Gas & Electric Company
Sempra: Sempra Energy
SGIP: Self Generation Incentive Program
SMB: Small, Medium Business
SMS: Short Message Service
SoCalGas: Southern California Gas Company
TCAP: Triennial Cost Allocation Proceeding
TY: Test Year
UWGLA: United Way of Greater Los Angeles
VP: Vice President
WCAG: Web Content Accessibility Guidelines
WCEMC: West Coast Energy Management Congress
WECC California (CAMX): Western Electric Coordinating Council (California-Mexico Power Area)

ADA-D-1 Doc #295436
SoCal Gas 2016 GRC Testimony Revision Log – March 2015
Exhibit Witness Page Line Revision Detail SCG-12 Ann Ayres Title page n/a Update “November 2014” to “March 2015”. SCG-12 Ann Ayres ADA-ii n/a Table of Contents, remove ‘IV.B.5. CA Producers Envoy’.
SCG-12 Ann Ayres ADA-iii n/a Update ‘Total Capital IT Costs Table’ to “$4,411 for Estimated 2014’ to reflect removal of CA Producers Envoy project.
SCG-12 Ann Ayres ADA-10 6 Correct “$8,891 million” to “$8.891 million”
SCG-12 Ann Ayres ADA-26 Table 6 Correct labor $s between e-Service designer and Web editor from $83 to $96, and $96 to $83, respectively.
SCG-12 Ann Ayres ADA-56 Table 12 Residential Services, $345 labor, description corrected to “4 FTEs” from “3”, and “2 market advisors” from “1”.
SCG-12 Ann Ayres ADA-59 14 Correct the line: In the area of Clean Energy Builder Services, I am forecasting an incremental “4 FTEs” from “3”.
SCG-12 Ann Ayres ADA-71 Table 18
Remove “81421 California Producers SoCalGas ENVOY” project, update ‘2014 Mandated Total’ and ‘2014 Estimated Annual Total’ to reflect accordingly.
SCG-12 Ann Ayres ADA-71 4 Correct the line: The following Section B below will identify “5” unique capital projects from “6”.
SCG-12 Ann Ayres ADA-72 3 Delete “#81421” to reflect the removal of the CA Producers Envoy project. SCG-12 Ann Ayres ADA-74 18 Remove CA Producers Envoy project.
SCG-12 Ann Ayres ADA-74 18 Bullet number update from “6.” to “5. SoCalGas ENVOY Next Generation, Project #14803”