REVISED HRS DOCUMENTATION RECORD DOCUMENTATION RECORD COVER SHEET. ... SBA SBA Shipyard SCDM...
100
HRS DOCUMENTATION RECORD COVER SHEET Name of Site: SBA Shipyard CERCLIS No.: LAD008434185 Contact Persons Site Investigation: Brenda Nixon Cook, EPA Region 6 (214) 665-7436 (Name) (Telephone) Documentation Record: Brenda Nixon Cook, EPA Region 6 (214) 665-7436 (Name) (Telephone) Pathways, Components, or Threats Not Scored 1) Ground Water Pathway: The ground water migration pathway has not been scored. Ground water monitoring wells located on SBA Shipyard have shown elevated levels of polycyclic aromatic hydrocarbons (PAHs) (Ref. 4, p.48). Based on information available at this time, further evaluation of the ground water migration pathway would not significantly affect the listing decision (Ref. 1, Sec. 2.2.3). 2) Surface Water Pathway: Ground Water to Surface Water Migration Component: The overland/flood migration component of the Surface Water Migration Pathway has been scored for the Human Food Chain Threat and Environmental Threat. The Ground Water to Surface Water Migration component has not been scored. Based on information available at this time, evaluation of this component would not significantly affect the listing decision (Ref. 1, Sec. 2.2.3). 3) Air Migration Pathway: Based on information available at this time, evaluation of the air migration pathway would not significantly affect the listing decision (Ref. 1, Sec. 2.2.3). 4) Soil Exposure Pathway: Based on information available at this time, further evaluation of the soil exposure pathway would not significantly affect the listing decision (Ref. 1, Sec. 2.2.3). These pathways and components are of concern to the U.S. Environmental Protection Agency (EPA) and may be considered during a future evaluation.
Transcript of REVISED HRS DOCUMENTATION RECORD DOCUMENTATION RECORD COVER SHEET. ... SBA SBA Shipyard SCDM...

HRS DOCUMENTATION RECORD COVER SHEET
Name of Site: SBA Shipyard
CERCLIS No.: LAD008434185
Contact Persons
Site Investigation: Brenda Nixon Cook, EPA Region 6 (214) 665-7436(Name) (Telephone)
Documentation Record: Brenda Nixon Cook, EPA Region 6 (214) 665-7436(Name) (Telephone)
Pathways, Components, or Threats Not Scored
1) Ground Water Pathway: The ground water migration pathway has not been scored. Groundwater monitoring wells located on SBA Shipyard have shown elevated levels of polycyclicaromatic hydrocarbons (PAHs) (Ref. 4, p.48). Based on information available at this time,further evaluation of the ground water migration pathway would not significantly affect thelisting decision (Ref. 1, Sec. 2.2.3).
2) Surface Water Pathway: Ground Water to Surface Water Migration Component: Theoverland/flood migration component of the Surface Water Migration Pathway has been scoredfor the Human Food Chain Threat and Environmental Threat. The Ground Water to SurfaceWater Migration component has not been scored. Based on information available at this time,evaluation of this component would not significantly affect the listing decision (Ref. 1, Sec.2.2.3).
3) Air Migration Pathway: Based on information available at this time, evaluation of the airmigration pathway would not significantly affect the listing decision (Ref. 1, Sec. 2.2.3).
4) Soil Exposure Pathway: Based on information available at this time, further evaluation of thesoil exposure pathway would not significantly affect the listing decision (Ref. 1, Sec. 2.2.3).
These pathways and components are of concern to the U.S. Environmental Protection Agency (EPA) and may be considered during a future evaluation.

HRS DOCUMENTATION RECORD
Name of Site: SBA Shipyard Date Prepared: September, 2015 Date Revised: September, 2016
CERCLIS Number: LAD008434185
Site Spill Identifier Number (SSID): A6FX
EPA Region: 6
Street Address of Site*: Section 19 of Range 2 West, Township 10 South and is located at the end of State Highway 3166 and adjacent to the west bank of the Mermentau River (Ref. 5, p. 9, Fig. 1 of this HRS documentation record)
City, County, State, Zip Code: Jennings, Jefferson Davis Parish, LA 70546
General Location in the State: SBA Shipyard is located southeast of the city of Jennings in the south central portion of the state (Figure 1)
Topographic Map: Mermentau Quadrangle Louisiana (Ref. 3, p. 1)
Latitude: 30 o 9' 38.17" North Longitude: 92o 36' 44.05" West Location coordinates were taken at location SBA-003 (Ref. 4, p. 175; Figure 3)
Air Pathway Not Scored Ground Water Pathway Not Scored Soil Exposure Pathway Not Scored Surface Water Pathway 100.00
HRS SITE SCORE 50.00
* The street address, coordinates, and contaminant locations presented in this HRS documentation record identify the general area the site is located. They represent one or more locations EPA considers to be part of the site based on the screening information EPA used to evaluate the site for NPL listing. EPA lists national priorities among the known "releases or threatened releases" of hazardous substances; thus, the focus is on the release, not precisely delineated boundaries. A site is defined as where a hazardous substance has been "deposited, stored, disposed, or placed, or has otherwise come to be located." Generally, HRS scoring and the subsequent listing of a release merely represent the initial determination that a certain area may need to be addressed under CERCLA. Accordingly, EPA contemplates that the preliminary description of facility boundaries at the time of scoring will be refined as more information is developed as to where the contamination has come to be located.
September 2016 1

FIGURES Figure 1 Facility Location Map Figure 2 Aerial Site Sketch Figure 3 Sources with Site Inspection & Expanded Site Inspection Sampling Locations Figure 4 PPE Locations and Overland Flow Pathways Map Figure 5 Level II Contamination Segments Figure 6 Surface Water Migration Pathway
NOTES TO THE
READER The following rules were used when citing references in the HRS (Hazard Ranking System) package.
1. Hazardous substances are listed by how they appear in the Superfund Chemical Data Matrix (SCDM).
2. Significant figures: Calculations are reported to two significant figures to the right of the decimal place when the HRS does not specify rounding.
3. Abbreviations/Conventions used to identify references and citations: Figure Fig Number No. Reference Ref Section Sec. Single Pages p. Multiple Pages pp. “.” Next Reference () Selected acronyms
2

ABBREVIATIONS
BGS Below Ground Surface CACO Consent Agreement and Consent Order CDD Chlorinated Dibenzo-p-Dioxins CDF Chlorinated Dibenzofurans CERLA CERCLIS
Comprehensive Environmental Response, Compensation, and Liability Act Comprehensive Environmental Response, Compensation, and Liability Information System
CFS Cubic feet per second DRO Diesel Range Organics COC Contaminants of Concern ERT Environmental Response Team ESI Expanded Site Inspection FIRM Flood Insurance Rate Map ft2 Square Feet ft3 Cubic Feet HRS Hazard Ranking System IM/RA Interim Measures/Removal Actions LBS Pounds LDEQ Louisiana Department of Environmental
Quality LDWF Louisiana Department of Wildlife and
Fisheries LTU Land Treatment Unit MSDS Material Safety Data Sheet NRC National Response Center NWI National Wetlands Inventory OCDD Octachlorodibenzo-p-dioxin OPA Oil Pollution Act ORO Oil Range Organics QASP Quality Assurance Sampling Plan PAH Polycyclic Aromatic Hydrocarbons PCB Polychlorinated Biphenyl PID Photoionization Detector PPE Probable Point of Entry RCRA Resource Conservation and Recovery Act RFI RCRA Facility Investigation RL Reporting Limit SBA SBA Shipyard SCDM Superfund Chemical Data Matrix SFHA Special Flood Hazard Area SI Site Inspection SOP Standard Operating Procedure
3

SSID Site Spill Identifier Number START Superfund Technical Assessment and
Response Team SVOA Semi-Volatile Organic Analysis SWD Solid Waste Division TAL Target Analyte List TCL Target Compound List TDL Target Distance Limit TPH Total Petroleum Hydrocarbon USGS United States Geological Survey VOA Volatile Organic Analysis VOC Volatile Organic Compounds yd3 Cubic Yards
4

Figure References
Figure 1: Base Map Source* 2013 National Geographic Society, i-cubed
*Map annotated by EPA START-3 on 05/30/2013 (Ref. 4, p. 12; Ref. 5, pp. 9, 23 & 46; Ref. 24, p. 6)
Figure 2: Base Map Source* Esri**, DigitalGlobe, GeoEye, i-cubed, USDA, USGS, AEX, Getmapping, Aerogrid, IGN, IGP, swisstopo, and the GIS User Community
*Map annotated by EPA START-3 on 6/25/2015 (Ref. 5, p. 24, Ref. 16, p. 2; Ref. 24, p. 10; Ref. 29,p.1)** The source of this map image is Esri, used by EPA with Esri’s permission.
Figure 3: Base Map Source* Esri**, DigitalGlobe, GeoEye, i-cubed, USDA, USGS, AEX, Getmapping, Aerogrid, IGN, IGP, swisstopo, and the GIS User Community
*Map Annotated by EPA START-3 on 7/15/2015 to depict source locations and sample locations (Ref.4, pp. 18-22, 26-35, 38-39, 41-47, 57, 109-120, 128-134, 138-142, 147-157, 175, 868-880 &971-1026;Ref. 5, p. 24; Ref. 7, pp. 18-21, 25-27, 30, 32-33, 35-37, 40, 50, 89-91, 93-94, 96-99, 101-103, 105-106,110-111, 114-115, 118-119, 122-123, 126-127, 133-135, 137, 139-142, 173 & 967-982; Ref. 16, p.2** The source of this map image is Esri, used by EPA with Esri’s permission.
Figure 4: Base Map Source* Esri**, DigitalGlobe, GeoEye, i-cubed, USDA, USGS, AEX, Getmapping, Aerogrid, IGN, IGP, swisstopo, and the GIS User Community
*Map annotated by EPA START-3 on 7/6/2015 for PPE, Drainage, Overland Flow, Sourcesand START-3 Observations/Logbooks (Ref. 4, pp. 147-157; Ref. 5, pp. 24 & 46; Ref. 7, p.147-167; Ref. 9, pp. 44-49; Ref. 16, pp. 1-2; Ref. 20, pp. 4-5; Ref. 24, pp. 10, 12, 16 & 128)** The source of this map image is Esri, used by EPA with Esri’s permission.
Figure 5 Base Map Source* Esri**, DigitalGlobe, GeoEye, i-cubed, USDA, USGS, AEX, Getmapping, Aerogrid, IGN, IGP, swisstopo, and the GIS User Community
*Map Annotated by EPA START-3 on 7/15/2015 to depict background and release samplelocations, PPEs, Fishery & Wetland Contamination and START-3 observations/logbooks(Ref. 4, pp. 26-27, 31, 33, 41, 43, 57, 109-113, 116-128, 147-157, 175, 868, 971-979,
September 2016 5
1007-1008, 1011, 1013, 1015, 1017 & 1019; Ref. 5, p. 24; Ref. 7, pp. 20-21, 25, 33-36, 50, 89-91, 97-98, 101-103, 110-112, 114-116, 118-120, 126-127, 133 135, 140-141 &146-167;Ref. 9, pp. 44-49; Ref. 16, p. 2; Ref. 20, pp. 4-5; Ref. 24, pp. 12, 16 & 128)** The source of this map image is Esri, used by EPA with Esri’s permission.
Figure 6: Base Map Source* Esri**, DigitalGlobe, GeoEye, i-cubed, USDA, USGS, AEX, Getmapping, Aerogrid, IGN, IGP, swisstopo, and the GIS User Community; National Wetlands Inventory; and National Hydrography Dataset.
*Map annotated by EPA START-3 on 7/15/2015 for Surface Water Flow, Common Drainage,Facility Boundary, Wetland delineation Maps, National Wetland Inventory and START-3observations/logbooks (Ref. 3, p. 1; Ref. 4, pp. 12, 116, 119-127 & 147-157; Ref. 5, pp. 9, 23 & 46; Ref.7, pp. 140-141 & 146-167; Ref. 9, pp. 44-49; Ref. 10, p. 1; Ref. 24, p. 6)** The source of this map image is Esri, used by EPA with Esri’s permission.
September 2016 6

_̂
_̂
US EPA Region 6START-3
Figure 1. Facility Location Map (SBA Shipyard)
9040 Castex Landing Road, Highway 3166, Jefferson Davis Parish, Jennings, LA 70546
CERCLIS: LAD008434185TDD #: TO-0009-12-10-02
Map of Louisiana
.1:24,000
May 2013
Legend
_̂ Facility Entrance
Facility Boundary
0 2,500 5,0001,250Feet

Land Treatment Unit
Water Pit 1
Oil Pit
WaterPit 2
WaterPit 3
PartiallyBuried Barge
Buried Barge and Associated Alkyne Storage Tank Pump House
Horizontal Saddle Tank
Barge Slip
Dry Dock
Barge Slip
BargeSlip
Figure 2. Aerial Site Sketch (SBA Shipyard)
9040 Castex Landing Road, Highway 3166, Jefferson Davis Parish, Jennings, LA 70546
CERCLIS: LAD008434185TDD #: 9/TO-0009-12-10-02 September 2013
.1:4,000
0 300 600150 Feet
_̂
Map of LouisianaLegend
Sources
Main Office/Entrance
US EPA Region 6START-3

!(
!(!(
!(!(
!(
!(
!(
!(!(
!(
!(
!(
!(
!(
!(
!(
!(
!(
!(
!(
!(
!(
!(!(
!(
!(
!(
!(
!(
!( !(
!(!(
!(
!(
!(
!(
!(
!(
!(
!( !(
Main Office/Entrance
SBA-ESI-02 SBA-ESI-01
SBA-ESI-04
SBA-ESI-07
SBA-ESI-06
SBA-ESI-05SBA-ESI-11 SBA-ESI-15
SBA-011
SBA-006
SBA-005
SBA-010SBA-009
SBA-ESI-10
SBA-003
SBA-002SBA-004
Source No. 1
Source No. 4
Source No. 3
SBA-ESI-09
SBA-ESI-08
Source No. 6
Source No. 5
SBA-040SBA-039
SBA-033
SBA-032
SBA-031
SBA-030
SBA-029
SBA-028
SBA-027
SBA-026
SBA-025SBA-024
SBA-008SBA-007
SBA-001
CERCLIS: LAD008434185TDD #: 9/TO-0009-12-10-02 September 2016
.
1:5,000
0 250 500 750 1,000125 Feet
_̂
Map of Louisiana US EPA Region 6START-3
Figure 3. Sources with Site Inspection andExpanded Site Inspection Sampling
Locations Map(SBA Shipyard)
9040 Castex Landing Road, Highway 3166,Jefferson Davis Parish, Jennings, LA 70546
Legend!( Sediment
!( Soil
!( Waste
Sources
Main Office/Entrance
Source No. 1Source No. 3
Source No. 6
Source No. 5
Source No. 4
PPE 3
PPE 2
PPE 1
PPE 4
CERCLIS: LAD008434185TDD #: 9/TO-0009-12-10-02 September 2016
.
1:5,000
0 250 500 750 1,000125 Feet
_̂
Map of Louisiana US EPA Region 6START-3
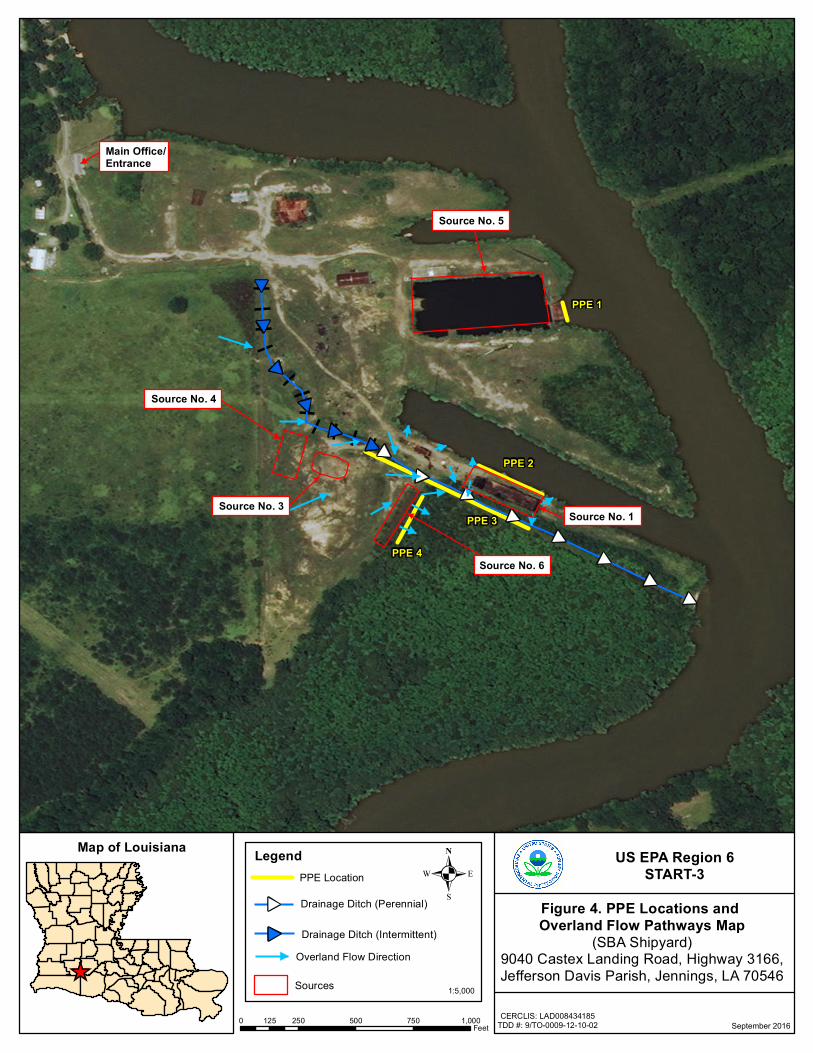
Figure 4. PPE Locations and Overland Flow Pathways Map
(SBA Shipyard)9040 Castex Landing Road, Highway 3166,Jefferson Davis Parish, Jennings, LA 70546
Legend
Overland Flow Direction
Sources
Drainage Ditch (Perennial)
Drainage Ditch (Intermittent)
PPE Location

!H
!(
!(
!H
!(
!(
!H
!(
!(
!(
!H!H
!(
!(
!(
!(
!(
!H
!H
Main Office/Entrance
SBA-ESI-02 SBA-ESI-01
SBA-ESI-04
SBA-ESI-06
SBA-ESI-05SBA-ESI-11
Wetland 1 Level IIContamination
Wetland 2 Level IIContamination
PPE 4
PPE 3
PPE 2
PPE 1
SBA-ESI-10
SBA-ESI-09
SBA-ESI-08
Wetland 3 Level II Contamination
Fishery Level II Contamination
SBA-039
SBA-033
SBA-032
SBA-031
SBA-030
SBA-029
SBA-028
SBA-025SBA-024
SBA-001
CERCLIS: LAD008434185TDD #: 9/TO-0009-12-10-02 September 2013
.1:5,000
0 250 500 750 1,000125 Feet
_̂
Map of Louisiana US EPA Region 6START-3
Figure 5. Level IIContamination Segments
(SBA Shipyard)9040 Castex Landing Road, Highway 3166,Jefferson Davis Parish, Jennings, LA 70546
Legend
SBA Shipyard, Inc.
Segment 2: Potential Contamination
PPE !H Background Sample
!( Release Sample
Potential ContaminationFishery Level II ContaminationWetland Level II Contamination

!(!(!(!(PPE 4
PPE 3
PPE 2
PPE 1
15-Mile TDL
US EPA Region 6START-3
Figure 6. Surface Water Migration Pathway(SBA Shipyard)
9040 Castex Landing Road, Highway 3166, Jefferson Davis Parish, Jennings, LA 70546
CERCLIS: LAD008434185TDD #: TO-0009-12-10-02 January 2013
_̂
Map of Louisiana
Lake Arthur
LegendFacility Boundary
Surface Water Flow
Freshwater Emergent Wetland
Freshwater Forested/Shrub Wetland
Freshwater Pond
Lake
Other
Riverine1 0 10.5 Miles
.1:75,000

WORKSHEET FOR COMPUTING HRS SITE SCORE
s
1. Ground Water Migration Pathway Score (Sgw) NS
2a. Surface Water Overland/Flood Migration Component 100.00 (from Section 4.3 of the HRS Documentation Record)
2b. Ground Water to Surface Water Migration Component NS
2c. Surface Water Migration Pathway Score (Ssw) 100.00 Enter the larger of the line 2a and 2b as the pathway score
3. Soil Exposure Pathway Score (Ss) NS
4. Air Migration Pathway Score (Sa) NS
2 25. Total of Sgw +Ssw2+Ss
2+Sa
6. HRS Site Score: Divide the value on line 5 by 4 and take thesquare root.
NS = Not Scored
2s
NS
10,000
NS
10,000
NS
NS
10,000
50.00
13

Table 4-1 Surface Water Overland/Flood Migration Component Score Sheet
Factor Categories and Factors Maximum Value Value Assigned DRINKING WATER THREAT
Likelihood of Release 1. Observed Release 550 550
2. Potential to Release by Overland Flow:2a. Containment 10 2b. Runoff2c. Distance to Surface Water 25 2d. Potential to Release by Overland Flow (Lines 2a X [2b+2c]) 500 NS
3 Potential to Release by Flood 3a. Containment (Flood) 10 3b. Flood Frequency 50 3c. Potential to Release by Flood (Line 3a X 3b) 500 NS
4. Potential to Release(Lines 2d + 3c, subject to a maximum of500) 500 NS
5. Likelihood to Release(Higher of Lines 1 and 4) 550 550 NS
Waste Characteristics
6. Toxicity/Persistence *
7. Hazardous Waste Quantity *
8. Waste Characteristics 100 NS
Targets
9. Nearest Intake 50 NS
10. Population:10a. Level I Concentrations ** NS 10b. Level II Concentrations ** NS 10c. Potential Contamination ** NS 10d. Population (Lines 10a+10b+10c) ** NS
14

11. Resources 5 NS
12. Targets (Lines 9+10d+11) ** NS
DRINKING WATER THREAT (Concluded) Drinking Water Threat Score
13. Drinking Water Threat Score([Lines 5 x 8 x 12]/82,500,subject to a maximum of 100) 550 NS
HUMAN FOOD CHAIN THREAT Likelihood of Release
14. Likelihood of Release(Same value as Line 5) 550 550 Waste Characteristics
15. Toxicity/Persistence/Bioaccumulation * 5x10⁸
16. Hazardous Waste Quantity * 10,00017. Waste Characteristics 1,000 1,000
Targets18. Food Chain Individual 50 45 19. Population:
19a. Level I Concentrations ** 0 19b. Level II Concentrations ** 0.03 19c. Potential Contamination ** 0.000006 19d. Population (Lines 10a+10b+10c) ** 0.030006
20. Targets ** 45.030006 (Value from Lines 18+19d)Human Food Chain Threat Score
21. Human Food Chain Threat Score 100 100.00 ([Lines 14 x 17 x 20]/82,500,subject to a maximum of 100)
ENVIORNMENTAL THREAT Likelihood of Release
22. Likelihood of Release(Same value as Line 5) 550 550
Waste Characteristics23. Ecosystem Toxicity/Persistence/
Bioaccumulation * 5 X 10⁸
24. Hazardous Waste Quantity * 10,000
25. Waste Characteristics 1,000 1,000
Targets
15

26. Sensitive Environments:26a. Level I Concentrations ** 0 26b. Level II Concentrations ** 25 26c. Potential Contamination ** 0.065 26d. Sensitive Environments(Lines 26a+26b+26c) ** 25.065
27. Targets(Value from Line 26d) ** 25.065
ENVIORNMENTAL THREAT 28. Environmental Threat Score
([Lines 22 x 25 x 27]/82,500subject to amaximum of 60)
60 60.00
SURFACE WATER OVERLAND/FLOOD MIGRATION COMPONENT SCORE FOR A WATERSHED 29. WATERSHED SCORE
(Lines 13 + 21 + 28, subject to a maximumof 100)
100 100.00
30. Component Score (S0,)(Highest score from Line 29 for allwatersheds evaluated, subject to amaximum of 100)
100 100.00
Maximum value applies to waste characteristic category Maximum value applicable Do not round to the nearest integer
16

REFERENCE SHEET
Ref. No. Description of the Reference
1. U.S. EPA. Hazard Ranking System (HRS); Final Rule. Federal Register. Volume 55, Number241.Washington, DC: U.S. Government Printing Office, December 14, 1990. Title Page only. A complete version of this document is available online at:https://semspub.epa.gov/work/HQ/174028.pdf
2. U.S. EPA Superfund Chemical Data Matrix. Appendix B. June 20, 2014. Excerpt Pages: 13. A complete version of SCDM is available at:https://www.epa.gov/superfund/superfund-chemical-data-matrix-scdm
3. U.S. Geological Survey (USGS). 7.5’ Topographic Quadrangle. Mermentau Quadrangle Louisiana. 2012. Total Pages: 1.
4. Dynamac Corp. Site Inspection. SBA Shipyard Inc., Jennings, Jefferson Davis Parish, Louisiana. Prepared in cooperation with U.S. EPA Region 6. August 6, 2014. Total Pages: 1028.
5. Michael Pisani and Associates Inc. Interim Measures/Removal Action Completion Report. SBA Shipyards Site, Jennings, Louisiana. August 15, 2005. Total Pages: 629.
6. Woodward-Clyde Consultants. RCRA Facility Investigation Work Plan. SBA Shipyard Site, Jennings, Louisiana. Prepared for SBA Shipyard, Inc. October 1996. Total Pages: 98.
7. Dynamac Corp. Expanded Site Inspection Report. SBA Shipyard Inc., Jennings, Jefferson Davis Parish, Louisiana. Prepared in cooperation with U.S. EPA Region 6. July 24, 2015. Total Pages: 1017.
8. U.S. Department of Agriculture. Soil Survey of Jefferson Davis Parish, Louisiana. Total Pages: 234.
9. Dynamac Corporation. Preliminary Assessment Report for SBA Shipyard, Jennings, Jefferson Davis Parish, Louisiana. Prepared for U.S. EPA Region 6. June 3, 2013. Total Pages: 66.
10. U.S. Fish and Wildlife Service. National Wetlands Inventory. Wetland Mapper Digital Wetland Map and Wetlands and Deepwater Habitats Classification Key. Accessed athttp://www.fws.gov/wetlands/Data/Mapper.html &http://www.fws.gov/wetlands/Documents/Wetlands-and-Deepwater-Habitats-Classification-chart.pdf. February 26, 2015 and March 2, 2015. Total Pages: 5.
11. United States Geological Survey (USGS). National Water Information System: Web Interface, USGS 08012150 Mermentau River At Mermentau, LA. Accessed at
17 September 2016

http://waterdata.usgs.gov/nwis/annual?referred_module=sw&site_no=08012150&por_08012150_18=198538,00060,18,1990,2015&partial_periods=on&year_type=W&format=html_table&date_format=YYYY-MM-DD&rdb_compression=file&submitted_form=parameter_selection_list. Accessed July 7, 2015. Total Pages: 2.
12. United States Geological Survey (USGS). National Water Information System: Web Interface,USGS 08012470 Bayou Lacassine Near Lake Arthur, LA. Accessed athttp://waterdata.usgs.gov/la/nwis/annual?referred_module=sw&site_no=08012470&por_08012470_13=198550,00060,13,1988,2005&partial_periods=on&year_type=W&format=html_table&date_format=YYYY-MM-DD&rdb_compression=file&submitted_form=parameter_selection_list. AccessedJuly 7, 2015. Total Pages: 2.
13. Louisiana Department of Environmental Quality Field Interview Form. SBA Shipyard. AgencyInterest # 1478. July 30, 2008. Total pages: 1.
14. Louisiana Department of Wildlife & Fisheries. Louisiana Commercial Fishing Regulations.Accessed at http://www.wlf.louisiana.gov/sites/default/files/pdf/publication/31745-commercial-fishing-regulations/commercial_fishing_2011.pdf. 2011. Total Pages: 44.
15. Hook and Bullet. Lake Arthur, LA – Fishing, Guides, Charters, Bait Information. Accessed at:http://www.hookandbullet.com/c/fishing-lake-arthur-la/. Accessed July 13, 2104. Total Pages:2.
16. Woodward-Clyde Consultants. Figures from the RCRA Facility Investigation Work Plan. SBAShipyard Site, Jennings, Louisiana. Prepared for SBA Shipyard, Inc. September 1996. TotalPages: 5.
17. FTN Associates, Ltd. Lake Arthur, Grand Lake, and Gulf Intercostal Waterway TMDLS ForDissolved Oxygen, Nutrients, and Ammonia. Prepared for U.S. EPA Region 6. April 19, 2002.Total Pages: 61.
18. CSS-Dynamac Corp. Memorandum to File. Subject: Historical Google Earth MapRepresentation. July 13, 2015. Total Pages: 3.
19. Dynamac Corporation. U.S. EPA Preliminary Assessment Logbook and Photo log. SBAShipyards Site, Jennings, Louisiana. December 11, 2012. Total Pages: 11.
20. Louisiana Department of Environmental Quality (LDEQ) Electronic Document ManagementSearch (EDMS). Reports. Reference Material. Search AI#1478. Document ID# 4111647.Accessed at: http://edms.deq.louisiana.gov/app/doc/querydef.aspx. December 26, 1996. TotalPages: 6.
21. Louisiana Department of Environmental Quality. Correspondence National Response CenterReport. October 23, 2012. Total Pages: 14.
18

22. Fagan, Nancy L. RCRA Corrective Action Site Visit Report. SBA Shipyards, Inc. EPA IDNumber LAD008434185, Hwy 3166, Jennings, LA 70546. Prepared for U.S. EnvironmentalProtection Agency. February 12, 1998. Total pages: 8.
23. Woodward-Clyde Consultants. Groundwater Remediation and Monitoring Plan. SBA ShipyardSite, Jennings, Louisiana. Prepared for SBA Shipyard. October 1996. Total Pages: 31.
24. PRC Environmental Management Inc. Compliance Evaluation and Sampling Inspection At SBAShipyards, Inc., Jennings, Louisiana, LAD008434185. Summary Report. Prepared for U.S.Environmental Protection Agency, Office of Solid Waste. October 26, 1994. Total Pages: 138.
25. Hutton, T. D., MSTC. Barge Scrapping at SBA Shipyard, Jennings, LA, 23 & 25 October 2012,Potential Discharge of an Unknown Amount of Waste Oil/Water. Total Pages: 15.
26. Federal Emergency Management Agency. Flood Insurance Rate Maps, Jefferson Davis Parish,Louisiana. Accessed athttp://map1.msc.fema.gov/idms/IntraView.cgi?JX=1130&JY=503&ROT=0&KEY=92603394&IFIT=1. Accessed July 13, 2015. Total Pages: 2.
27. Letter, Joseph V. Jr. Grand and White Lakes Flood Control Project. Numerical ModelInvestigation. Prepared for U.S. Army Engineer District, New Orleans. August 1993. TotalPages: 129.
28. U.S. Environmental Protection Agency. Envirofacts. Accessed at:http://oaspub.epa.gov/enviro/multisys2_v2.get_list?facility_uin=110007299967. Accessed July8, 2015. Total Pages: 2.
29. Reference Number Reserved.
30. Environmental Solutions Inc. Solid Waste Closure Plan. SBA Shipyard, Inc. SurfaceImpoundments, Jennings, LA. December 28, 1990. Total Pages: 115.
31. U.S. EPA, Office of Emergency and Remedial Response. Using Qualified Data to Document anObserved Release and Observed Contamination. Publication 9285.7-14FS. November 1996. TotalPages: 18.
32. Woodward-Clyde Consultants. Corrective Measures Implementation Plan-SurfaceImpoundments, Tanks and Land Treatment Unit and Closure and Post-Closure ImplementationSchedule and Cost Estimate. Closure Project, Jennings, Louisiana. Prepared for SBA ShipyardInc. October 1996. Total Pages: 131.
33. Louisiana Department of Environmental Quality (LDEQ) Electronic Document ManagementSearch (EDMS). Reports. Reference Material. Search AI#1478. Document ID#837689.Accessed at: http://edms.deq.louisiana.gov/app/doc/querydef.aspx. October 5, 1992. TotalPages: 140.
19

34. Louisiana Department of Environmental Quality (LDEQ) Electronic Document ManagementSearch (EDMS). Reports. Inspection. Search AI#1478. Document ID#837959. Accessed at:http://edms.deq.louisiana.gov/app/doc/querydef.aspx. May 11, 1993. Total Pages: 235.
35. Louisiana Department of Environmental Quality (LDEQ) Electronic Document ManagementSearch (EDMS). Reports. Inspection. Search AI#1478. Document ID#840744. Accessed at:http://edms.deq.louisiana.gov/app/doc/querydef.aspx. July 2, 1997. Total Pages: 21.
36. Woodward-Clyde Consultants. Water Permit Application. SBA Shipyard Inc., Jennings,Louisiana. Prepared for SBA Shipyard Inc. October 1997. Total Pages: 317.
37. Louisiana Department of Environmental Quality (LDEQ) Electronic Document ManagementSearch (EDMS). Reports. Inspection. Search AI#1478. Document ID#8914440. Accessed at:http://edms.deq.louisiana.gov/app/doc/querydef.aspx. June 15, 1993. Total Pages: 41.
38. U.S. Environmental Protection Agency. Pollution/Situation Report. SBA Shipyards – RemovalPolrep. Final Removal Polrep. June 23, 2015. Total Pages: 6.
39. GCAL Analytical Laboratories, LLC. Analytical Results. GCAL Report 215061151. June 19,2015. Total Pages: 27.
40. Early, Brian Sean. Memorandum to File. Subject: HRS Wetland Status at SBA Shipyard. July22, 2015. Total Pages: 2.
41. SBA Shipyards. Work Orders, Marine Chemist Certificates, Laboratory Data, Memorandumsand Miscellaneous Notes associated with Ashland- 9535410. Date: August 31, 1995. PageNumber: 11. Total Pages: 268.
42. SBA Shipyards. Work Orders and Miscellaneous Notes associated with Conoco-9535412. Date:April 13, 1981. Page Number: 16. Total Pages: 77.
43. SBA Shipyards. Invoices, Work Orders, Miscellaneous Notes associated with Leevac-9535414.Date: May 6, 1993. Page Number: 33. Total Pages: 37.
44. SBA Shipyard. Work Orders, Invoices, Marine Chemist Certificates Associated withRedrope#1- 9535415. Dates: December 1, 1976; May 14, 1977; July 9, 1981; July 1, 1982;November 28, 1983; and February 14, 1980. Page Numbers: 162, 226, 232, 254, 274, and 379.Total Pages: 432.
45. SBA Shipyard. Work Orders, Invoices, and Miscellaneous Notes associated with Redrope#2 -9535410. Dates: October 29, 1984 and June 3, 1981. Page Numbers: 115 and 197. Total Pages:246.
46. SBA Shipyard. Work Orders, Invoices, Marine Chemist Certificates and Miscellaneous Notesassociated with Redrope#4 - 9535418. Dates: October 3, 1979 and September 22, 1988. PageNumbers: 9 and 203. Total Pages: 214.
20

47. SBA Shipyard. Marine Chemist Certificates and Miscellaneous Notes associated with Redrope#5 - 9535419. Dates: July 9, 1994; June 8, 1988; September 22, 1988; April 12, 1990; April 10, 1978; May 15, 1978; May 29, 1978; May 21, 1979; April 17, 1984; May 22, 1984; and July 28, 1993. Page Numbers: 4, 15, 40, 50, 76, 78-79, 81, 125,-126 and 241. Total Pages: 317.
48. SBA Shipyard. Regulatory Documents, Letters, Work Orders, Invoices, Marine Chemist Certificates, Certified Mail, and Miscellaneous Notes associated with Customer Notice Files - 9535425. Dates: April 24, 1986; August 1, 1986; and August 21, 1989. Page Numbers: 14, 16, and 388. Total Pages: 402.
49. SBA Shipyard. Work Orders, Invoices, Marine Chemist Certificates, Letters, Regulatory Documents and Miscellaneous Notes associated with National Marine, Union/Dravo Mechling - 9535427. Dates: October 3, 1979; July 10, 1996; August 4, 1977; November 7, 1981; May 15, 1978; May 29, 1979; September 17, 1978; November 11, 1982; April 18, 1979; and March 16, 1990. Page Numbers: 3, 5- 13, 33-34, 38-40, 110, 236, and 266. Total Pages: 292.
50. SBA Shipyard. Marine Chemist Certificates, Letters, Certified Mailing, Technical Reports, Laboratory Reports, and Miscellaneous Notes associated with PRPS - 9535428. Dates: March 8, 1996; July 9, 1994; July 28, 1993; and February 20, 1992. Page Numbers: 18-19, 25, 130, and 133. Total Pages: 432.
51. SBA Shipyards, Inc. Customer Information Relating to Historical Barge Cleaning Activities. Date: March 22, 1996. Page Numbers: 1 – 39. Total Pages: 39.
52. U.S. EPA. Email of Clarification. From Rick McMillin, EPA. To Brenda Cook, EPA. Subject: Region 6 Houston Lab's Definition of A Reporting Limit (RL). August 4, 2015. Total Pages: 1.
53. Louisiana Department of Environmental Quality LDEQ) Electronic Document Management Search (EDMS). Reports. Inspection. Search AI#1478. Document ID# 4111644. Accessed at: http://edms.deq.louisiana.gov/app/doc/querydef.aspx. February 27, 1986. Total Pages: 1.
54. Louisiana Department of Environmental Quality LDEQ) Electronic Document Management Search (EDMS). Reports. Inspection. Search AI#1478. Document ID# 4111643. Accessed at: http://edms.deq.louisiana.gov/app/doc/querydef.aspx. September 15, 1986. Total Pages: 3.
55. Louisiana Department of Environmental Quality LDEQ) Electronic Document Management Search (EDMS). Reports. Inspection. Search AI#1478. Document ID# 837675. Accessed at: http://edms.deq.louisiana.gov/app/doc/querydef.aspx. August 15, 1980. Total Pages: 4.
21

SITE DESCRIPTION AND HISTORY: The site defines the release from SBA Shipyard (SBA) referring to sources of hazardous substances and areas of contaminated water that are to be scored as a single unit. SBA Shipyard (SBA) is situated on approximately 98 acres of land located in a rural-industrial area, at 9040 Castex Landing Road, Jennings, Jefferson Davis Parish, LA 70546, at the end of State Highway 3166 and adjacent to the west bank of the Mermentau River (Ref. 6, p. 7 & 17; Ref. 9, p. 7; Figure 1). SBA is located approximately 2.3 miles southwest (downstream) of Mermentau, Louisiana (Ref. 5, p. 9; Ref. 6, p. 7). SBA is bordered to the north by residents, south and west by wetlands, and to the east by the Mermentau River (Ref. 4, pp. 12-13; Figure 1). Property ownership of SBA is divided into two parcels, with the property north of the dry dock owned by LeeVac Shipyard, Inc. and the property south of the dry dock owned by Louis & Suzanne Smailhall (Ref. 5, pp. 10, 23 & 46; Ref. 7, p. 167; Ref. 9, p. 46). Property division of SBA is between the dry dock and barge slip (Ref. 5, pp. 24 & 46; Ref. 20, p. 5). Currently SBA is inactive and vacant (Ref. 9, p. 9). The SBA Shipyard site as scored includes five sources: a partially buried barge container, one buried/backfilled surface impoundments, the former land treatment unit (LTU) and surface impoundments that have not been buried/backfilled, as well as a documented release to surface water. Contamination in the sources document numerous hazardous substances, including petroleum hydrocarbons, numerous polycyclic aromatic hydrocarbons (PAHs), dioxins/furans, metals and volatile organic compounds (VOCs) (Ref. 4, p.48; Ref. 7, pp. 40-42). Metal and PAH surface water contamination is documented based on wetland and channel sediment samples from one of the barge slips and the Mermentau River. Slightly greater than 2,800 feet of wetland frontage is located within the zone of Level II contamination, and an estimated 24.5 miles of wetland frontage is located along the 15-mile target distance limit (TDL) outside of the zone of actual contaminations (Figure 5 & 6). Additionally, the HRS documentation record identifies a human food fishery in the Mermentau River both within and outside the zone of actual contamination as well as in Lake Arthur at the terminus of the 15-mile TDL (Figure 5 & 6; Ref. 7, pp. 42, 984- 992). The surface water overland migration pathway is the pathway of concern being evaluated for this HRS package. An observed release has been documented to the Mermentau River and associated wetlands. Contaminates of Concern (COCs) for the surface water pathway include: aroclor-1254, benzo(a)anthracene, benzo(a)pyrene, cadmium, copper, dibenz(a,h)anthracene, hexachlorodibenzo-p-dioxin 1,2,3,7,8,9-, hexachlorodibenzofuran 1,2,3,4,7,8-, hexachlorodibenzofuran 1,2,3,6,7,8-, hexachlorodibenzofuran 2,3,4,6,7,8,-, mercury, octachlorodibenzo-p-dioxin (OCDD), pentachlorodibenzofuran 2,3,4,7,8-, phenol and pyrene. SBA used the facility for construction, repair, retrofitting, sandblasting, and cleaning and painting of barges beginning in 1965 (Ref. 7, p. 13). Three barge slips and a dry dock are located off the Mermentau River (Ref. 5, pp. 38-39; Ref. 6, p. 7; Figure 2). Two of the barge slips are located on the northern portion of the property and are not included in the site as scored; the third barge slip is applicable and will be considered in the site HRS scoring (Figure 2). The slips were used to dock barges during cleaning or repair (Ref. 7, p. 13). The wastes from barges consisted of hydrocarbons and typically held diesel, coal, tar crude oil, gasoline and asphalt (Ref. 6, p. 10). Mr. Smailhall stated that the facility had in the past cleaned barges which previously contained coal tar (Ref. 33, p. 1). Some of the barges serviced at the facility held coal tar, creosote, miscellaneous chemicals or agricultural related materials such as tallow, corn oil or soybean (Ref. 32, p. 46). A deposition taken from the owner, Mr. Smailhall, indicated that he had used chlorinated solvents in his cleaning process in the past (Ref. 22, p.
September 2016 22

3). Solvents used to clean painting equipment were saved and used to thin coatings applied to the barges. Paint cans were then taken to a central location at the western end of the facility and turned upside down to drain on the ground (Ref. 33, p. 2). Material Data Safety Sheets (MSDS) provided by Mr. Smailhall in 1993 listed the paints and coatings used on the barges within the previous two years (Ref. 34, pp. 2 & 80-235). A review of the MSDSs revealed that the material was hazardous when discarded due to ignitability (EPA Hazardous Waste Code D0010) and the material exhibited the characteristic for MEK (EPA Hazardous Waste Code D035 - methyl ethyl ketone) (Ref. 34, p. 2). The barge cleaning services operation provided by SBA included the following steps: A barge was floated into the barge slip adjacent to the boilers and operations area (Ref. 16, p. 2; Ref. 36, p. 38); The first step in cleaning and gas freeing barges was to remove the gross residuals from the entire barge or just those compartments scheduled for maintenance (Ref. 42 p. 51; Ref 43. P.5; Ref. 51, p. 5). The barge was then cleaned by a combination of methods including: spraying with high pressure hot water, and/or removing solids and sludges by hand shoveling, and removing any remaining residual with a “butterworth” apparatus which consisted of a high pressure wash with diesel, water and a surfactant (Ref. 51, pp. 5-6). Originally, all residuals along with any wash water were pumped from the barge to the surface impoundments (Ref. 51, p. 5). The solids were then carried to a double walled container and solidified/stabilized with the addition of lime, fly ash and fertilizer (Ref. 36, p. 38). The waste water generated as a result of washing comprises the predominant water flow (Ref. 36, p. 38). The waste water was initially pumped into an oil water settling tank WT-8, with the separated oil flowing to T-1 or T-2 (Ref. 16, p. 2; Ref. 36, p. 38; Ref. 50, pp. 5-6). Since the wash water may have contained contaminates from the washing, it was pumped through WT-2 or WT-3 then through an oil water separator OWS-1 (Ref. 16, p. 2; Ref. 36, p. 38; Ref. 51, pp. 5-6). The oil within T-1 and T-2 was transported off-site for recovery of thermal value within 90 days (Ref. 36, p. 38). The oil/water from OSW-1was recycled back to WT-8 (Ref. 16, p. 2; Ref. 36, p.38). The water from OWS-1 flows to WT-5 and was used as the primary source of water for barge cleaning (Ref. 16, p. 2; Ref. 36, p.38). Some of the water was recycled or converted to steam for the cleaning operations (Ref. 6, p. 10). Water, hydrocarbon and water/hydrocarbon emulsions generated by the sludge and residue removal process were stored on-site in a variety of tanks and converted barges (Ref. 51, p. 6). As part of the cleaning process the petroleum hydrocarbons were separated from the water into surface impoundments that were known as the Oil Pit, Water Pit 1, Water Pit 2 and Water Pit 3 (Ref. 6, p. 10). A large quantity of water/hydrocarbon emulsions was stored in one of the surface impoundments, the Oil Pit (Ref. 16, p. 2; Ref. 51, p. 6). Waste water was stored in two of the surface impoundments, the Oil Pit and Pit No. 2 prior to closure of the surface impoundments (Ref. 51, p. 6). Aboveground oil/water separators and storage tanks eventually replaced the functions of the pits (a.k.a. surface impoundments) (Ref. 6, p. 10). Figure 2 provides a layout of SBA features and former waste management areas. Wastes from the barge cleaning, for the most part, consisted of petroleum hydrocarbon residues (Ref. 6, p. 10). In addition to the hydrocarbons other wastes on site included asphalt, creosote, methyl-methacrylate, methanol, caustic soda, styrene, coal tar, vinyl acetate, carbon tetra chloride, ethyl acrylate and acrylates (Ref. 41, p. 11; Ref. 44, pp. 162, 226, 232, 254, 274 & 379; Ref. 45, pp. 115 & 197; Ref. 46, pp. 9 & 203; Ref. 47, pp. 4, 15, 40, 50, 76, 78, 79, 125, 126, 236 & 241; Ref. 48, pp. 14, 16 & 388; Ref. 49, pp. 3, 33, 34, 38, 39, 110 & 236; Ref. 50, pp. 25, 130 & 133; Ref. 51, pp. 1-3 & 36-39). Waste samples taken from the water pits were found to contain benzene, vinyl chloride, 1,2-dichloroethane, tetrachloroethylene, trichloroethylene, methylene chloride, methyl ethyl ketone, carbon tetrachloride, acetone and styrene (Ref. 35, pp. 6 -7; Ref. 37, pp .1, 4-12 & 19-41). Since approximately 1970, D018
23

(EPA Hazardous Waste Code – benzene), D043 (EPA Hazardous Waste Code – vinyl chloride) and D019 (EPA Hazardous Waste Code - carbon tetrachloride) toxicity characteristic waste were placed in Water Pit 1 and 2 per a 1997 EPA Compliant, Compliance Order and Notice of Opportunity Hearing (Ref. 35, p.10). Beginning in 1991 and on several occasions since 1991, sludge from Water Pit 1 was mixed with fly ash and lime, removed and placed on the ground surface adjacent to the Water Pit 1 (Ref. 35, p. 12). Samples collected in October 1995 detected waste in some of the tanks to be characteristically hazardous based on benzene, 1,2-dichloroethane, tetrachloroethene, vinyl chloride or ignitability (Ref. 32, p. 46). The presence of petroleum products at the site, as part of a site contamination, does not exclude the site from Comprehensive Environmental Response, Compensation and Liability Act (CERCLA) consideration. Sites are excluded from HRS scoring if they contain only CERCLA-excluded petroleum products. Any fractions of petroleum product that may fall under the Petroleum Exclusion in CERCLA have been comingled with other CERCLA hazardous substances onsite. The CERLCA hazardous substances are subject to CERCLA response authority and responsibility. In 1980 SBA submitted a notification of hazardous waste activity to SBA as a generator of a Resource Conservation Recovery Act (RCRA) listed hazardous waste, D001 (ignitable waste) (Ref. 6, p. 44). Invoices and manifests from customers that had barges repaired, retrofitted or cleaned and painted during the operational period of SBA contained CERLCA eligible substances which included: asphalt, creosote, methyl-methacrylate, methanol, caustic soda, styrene, coal tar, vinyl acetate, carbon tetra chloride, ethyl acrylate and acrylates (Ref. 41, p. 11; p. 33; Ref. 44, pp. 162, 226, 232, 254, 274 & 379; Ref. 45, pp. 115 & 197; Ref. 46, pp. 9 & 203; Ref. 47, pp. 4, 15, 40, 50, 76, 78, 79, 125, 126, 236 & 241; Ref. 48, pp. 14, 16 & 388; Ref. 49, pp. 3, 33, 34, 38, 39, 110 & 236; Ref. 50, pp. 25, 130 & 133; Ref. 51, pp. 1-3 & 36-39). Chemical hazards at this site included: arsenic, barium, mercury, lead, benzene, chloroform, 1,1,1-trichloroethane, 1,2-dichloroethane, ethylbenzene, tetrachloroethene, trichloroethene, toluene, vinyl chloride, ortho-cresol, meta-cresol, styrene and pyridine based on analysis of samples collected from the facilities four surface impoundments (Ref. 32, p. 49-52 & 75-94; Ref. 34, p. 1). Louisiana Department of Environmental Quality (LDEQ) concluded that the only explanation for the presence of chlorinated hydrocarbons in the sludge and water samples collected and analyzed from the four impoundments on site, was that someone had negligently or intentionally mixed spent solvents with the barge contents, or that one of the barges contained these compounds as pure commodities (Ref. 33, p .15). Wastes from the barge cleaning operations were managed in a waste management area that included four impoundments (Oil Pit, Water Pit 1, Water Pit 2, and Water Pit 3), a land treatment unit (LTU) and storage tanks (Ref. 6, pp. 5, 7-8). Waste from cleaning operations on site were comingled within the waste management units and not segregated during the operations or processing (Ref. 30, pp. 5, 21-26). SBA has a regulatory history in regards to the storage and handling of hazardous wastes. In 1980, SBA submitted a RCRA Part A Application to EPA indicating that SBA did not treat, store or dispose of hazardous waste (Ref .6, p. 44). In late 1989, SBA entered into an agreement with a contractor to handle the remediation and closure the former oil pit and former water pits 1, 2 and 3 that were in service since 1968 (Ref. 6, pp. 10 & 44). Visual indications of the possible presence of contamination were observed during subsurface investigations conducted from November 1989 to February 1990 by SBA contractors (Ref 6, pp. 25 & 44). In 1990, SBA submitted a notification to LDEQ as generator of hazardous waste (Ref. 6, p. 45). On February 15, 1990, the LDEQ Groundwater Protection Division (GWPD) issued a notification to SBA for the presence of subsurface contamination at the SBA site (Ref. 6, p. 45). In August 1990, the LDEQ, Solid Waste Division (SWD) issued an Order (OC-159) to SBA to close the
24

waste management units (Ref. 6, p. 45). In early1991, the bio-remediation started on May 29, 1990 on one of the impoundments (Water Pit 1) was deemed unsuccessful (Ref. 6, p. 10). During 1994 LDEQ and EPA determined that closure activities for the site would be handled under the regulatory authority of either LDEQ Hazardous Waste Division or EPA (Ref. 6, pp. 10-11 & 46). In 1994 the EPA Region 6 RCRA Enforcement Branch assumed the role for regulatory authority for the site, and hired a contractor to conduct a Compliance Evaluation Inspection (Ref. 6, p. 47; Ref. 22, p. 3). SBA proposed to implement the RCRA Facility Investigation (RFI) and submitted an RCRA RFI work plan in 1996, that proposed the compete closure of the impoundments and tanks (Ref. 6, pp 5 & 11). EPA issued a RCRA 3008(a) Compliant, Compliance Order on July 1, 1997 (Ref. 22, p. 4). On September 9, 1997 SBA entered into a Consent Agreement and Consent Order (CACO) with EPA to resolve all issues presented in the complaint of storage, disposal and treatment of hazardous waste without a permit, and clean-up the facility (Ref. 22, p. 4; Ref. 35, pp. 5-13). In December 2002 EPA issued an Order and Agreement for Interim Measures/Removal Action (IM/RA) of Hazardous/Principal Threat Wastes at SBA Shipyards, Inc., pursuant to RCRA Section 3008(h) (Ref. 5, pp. 29-37). Interim removal activities were conducted from March 2001 through January 2005 under the EPA 2002 Order and Agreement for IM/RA (Ref. 5, p. 6). Interim removal activities consisted of the removal of approximately 33.8 million pounds of oils, waxes and sludges, pumpable oily material and oily tank heels, 70 tons of contaminated debris, and 88 tons of recyclable scrap metal from the site (Ref. 5, p. 6). Since regulatory site closure in 2002, tar-like material was observed in 2008 by LDEQ in soils down to a depth of 3 to 4 feet below ground surface (bgs) (Ref. 13, p. 1). During the August 2013 EPA Site Inspection (SI) soil samples were collected down to 16 feet below ground surface (bgs) to identify the source material and contamination at SBA, ground water was collected to assess migration of contamination in the ground water pathway, and surface water samples and sediment samples were collected to assess the migration of contamination in the surface water pathway (Ref. 4, p.47). Analytical data from the soil and ground water samples indicated that the presence of numerous polycyclic aromatic hydrocarbons (PAHs) that exceeded background sample concentrations and met observed release criteria (Ref. 4, p. 48). As stated in the HRS, observed releases may be established based on either direct observation or chemical analysis of samples (Ref. 1, p. 51589). Direct observation of the release of a hazardous substance into the media being evaluated establishes an observed release (Ref. 1, p. 51589). An observed release by chemical analysis is established when analytical evidence of a hazardous substance in the media being evaluated is significantly above the background level, and available information attributes some portion of the significant increase in the concentration of the hazardous substance to the site (Ref. 1, p. 51589). During the September 2014 EPA Expanded Site Inspection (ESI) river sediment samples from the Mermentau River and wetland sediment samples were collected to identify and assess the migration of contamination at SBA to the surface water pathway (Ref. 7, p. 40). Additional ground water was collected on-site to assess the migration of contamination to the ground water pathway (Ref. 7, p.40). Waste samples were collected to identify the source material and contamination at SBA (Ref. 7, p. 40). Analytical data from the sediment samples indicated the presence of polycyclic aromatic hydrocarbons (PAHs) that met observed release criteria (Ref. 7, pp. 41-42). Mermentau River is fished recreationally as was observed and documented during the September 2014 ESI (Ref. 7, pp. 34 & 89-90). During the September 2014 ESI, a family of five was observed fishing in
25

the Barge Slip adjacent to the Mermentau River and fishermen were observed during sediment sample collection along the Mermentau River (Ref. 7, pp. 89-91). Largemouth bass, crappie, bream, bluegill, catfish, gar, bullhead, carp, striped bass and sunfish are caught from Lake Arthur (Ref. 15, p. 1).
26

SO-Source Characterization
2.2 SOURCE CHARACTERIZATION
The sources evaluated at SBA Shipyard, for HRS purposes, are:
• Source No. 1: Partially Buried Barge (Container) • Source No. 3: Former Water Pit 1 (Surface Impoundment, Buried/Backfilled) • Source No. 4: Former Land Treatment Unit (Land Treatment) • Source No. 5: Dry Dock (Surface Impoundment, Not Buried/Backfilled) • Source No. 6: Former Water Pit 3 (Surface Impoundment, Not Buried/Backfilled)
September 2016 27
SO-Source Characterization Source No.: 1
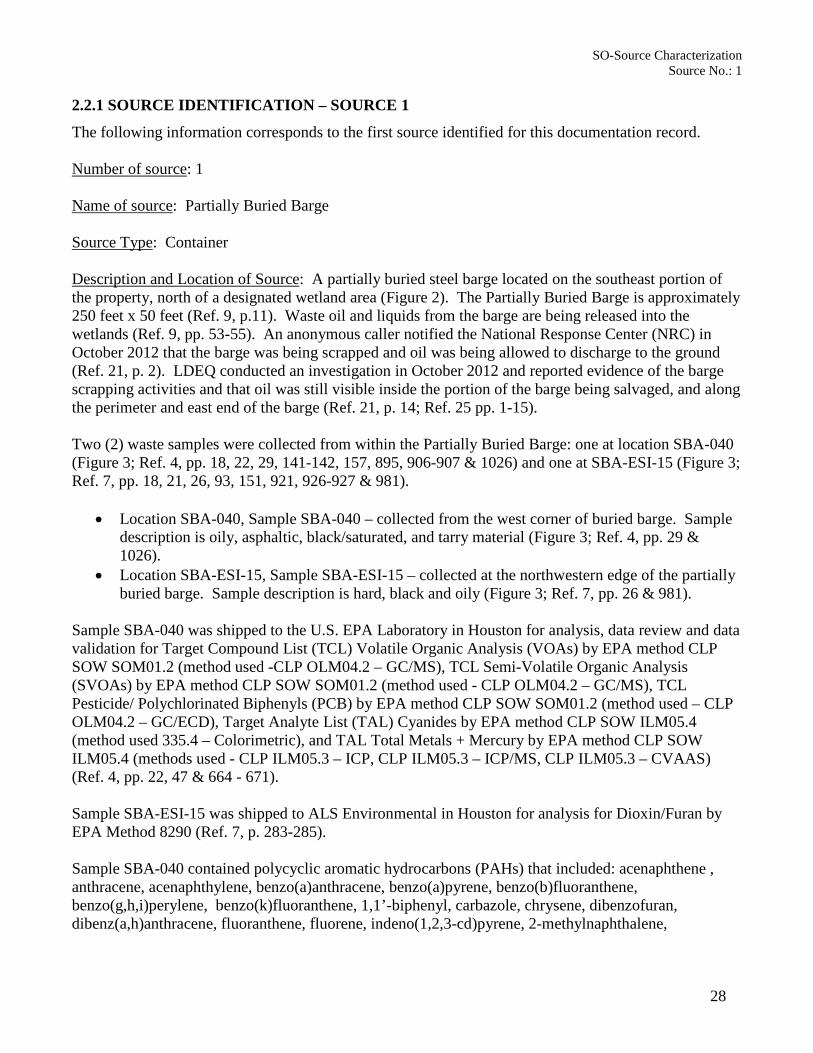
2.2.1 SOURCE IDENTIFICATION – SOURCE 1
The following information corresponds to the first source identified for this documentation record. Number of source: 1 Name of source: Partially Buried Barge Source Type: Container Description and Location of Source: A partially buried steel barge located on the southeast portion of the property, north of a designated wetland area (Figure 2). The Partially Buried Barge is approximately 250 feet x 50 feet (Ref. 9, p.11). Waste oil and liquids from the barge are being released into the wetlands (Ref. 9, pp. 53-55). An anonymous caller notified the National Response Center (NRC) in October 2012 that the barge was being scrapped and oil was being allowed to discharge to the ground (Ref. 21, p. 2). LDEQ conducted an investigation in October 2012 and reported evidence of the barge scrapping activities and that oil was still visible inside the portion of the barge being salvaged, and along the perimeter and east end of the barge (Ref. 21, p. 14; Ref. 25 pp. 1-15). Two (2) waste samples were collected from within the Partially Buried Barge: one at location SBA-040 (Figure 3; Ref. 4, pp. 18, 22, 29, 141-142, 157, 895, 906-907 & 1026) and one at SBA-ESI-15 (Figure 3; Ref. 7, pp. 18, 21, 26, 93, 151, 921, 926-927 & 981).
• Location SBA-040, Sample SBA-040 – collected from the west corner of buried barge. Sample description is oily, asphaltic, black/saturated, and tarry material (Figure 3; Ref. 4, pp. 29 & 1026).
• Location SBA-ESI-15, Sample SBA-ESI-15 – collected at the northwestern edge of the partially buried barge. Sample description is hard, black and oily (Figure 3; Ref. 7, pp. 26 & 981).
Sample SBA-040 was shipped to the U.S. EPA Laboratory in Houston for analysis, data review and data validation for Target Compound List (TCL) Volatile Organic Analysis (VOAs) by EPA method CLP SOW SOM01.2 (method used -CLP OLM04.2 – GC/MS), TCL Semi-Volatile Organic Analysis (SVOAs) by EPA method CLP SOW SOM01.2 (method used - CLP OLM04.2 – GC/MS), TCL Pesticide/ Polychlorinated Biphenyls (PCB) by EPA method CLP SOW SOM01.2 (method used – CLP OLM04.2 – GC/ECD), Target Analyte List (TAL) Cyanides by EPA method CLP SOW ILM05.4 (method used 335.4 – Colorimetric), and TAL Total Metals + Mercury by EPA method CLP SOW ILM05.4 (methods used - CLP ILM05.3 – ICP, CLP ILM05.3 – ICP/MS, CLP ILM05.3 – CVAAS) (Ref. 4, pp. 22, 47 & 664 - 671). Sample SBA-ESI-15 was shipped to ALS Environmental in Houston for analysis for Dioxin/Furan by EPA Method 8290 (Ref. 7, p. 283-285).
Sample SBA-040 contained polycyclic aromatic hydrocarbons (PAHs) that included: acenaphthene , anthracene, acenaphthylene, benzo(a)anthracene, benzo(a)pyrene, benzo(b)fluoranthene, benzo(g,h,i)perylene, benzo(k)fluoranthene, 1,1’-biphenyl, carbazole, chrysene, dibenzofuran, dibenz(a,h)anthracene, fluoranthene, fluorene, indeno(1,2,3-cd)pyrene, 2-methylnaphthalene,
28

SO-Source Characterization Source No.: 1
naphthalene, phenanthrene and pyrene at concentrations equal to or greater than their corresponding report limits (RLs) (Ref. 4, pp. 29 & 70; Table 4). Semi-volatile organic compounds (VOCs) identified included: cyclohexane, benzene, methylcyclohexane, tetrachloroethene, toluene, ethylbenzene, xylene, isopropylbenzene, 1,2-dichlorobenzene and vinyl chloride were also detected at concentrations equal to or greater than their corresponding RLs (Ref. 4, pp. 29 & 70; Table 4). Metals constituents included: arsenic, chromium, cobalt, lead and mercury at concentrations equal to or greater than their corresponding RLs (Ref. 4, pp. 29 & 70; Table 4). Sample SBA-ESI-15 contained Chlorinated Dibenzo-p-Dioxins (CDDs) and Chlorinated Dibenzofurans (CDFs). Those with some of the highest TEQs include: 2,3,4,7,8-Pentacholordibenzofuran (PeCDF), 2,3,4,6,7,8-Hexacholordibenzofuran (HxCDF), 1,2,3,6,7,8-Hexachlorodibenzofuran (HxCDF), 2,3,4,6,7,8-Hexachlorodibenzofuran (HxCDF), 1,2,3,7,8,9-Hexachlorodibenzo-p-dioxin (HxCDD) and Octachlorodibenzo-p-dioxin (Ref. 7, pp. 26-27, 57 & 1005-1008; Table 3).
2.2.2 HAZARDOUS SUBSTANCES ASSOCIATED WITH THE SOURCE
The substances listed in Table 1 and 2 are associated with Source No. 1 based on analytical results from waste samples collected from the Partially Buried Barge during the 2013 SBA Shipyard SI and 2014 ESI. Sampling was conducted following the procedures set forth in the Quality Assurance Sampling Plan (QASP) (Ref. 4, pp. 882-969).
29
SO-Source Characterization Source No.: 1
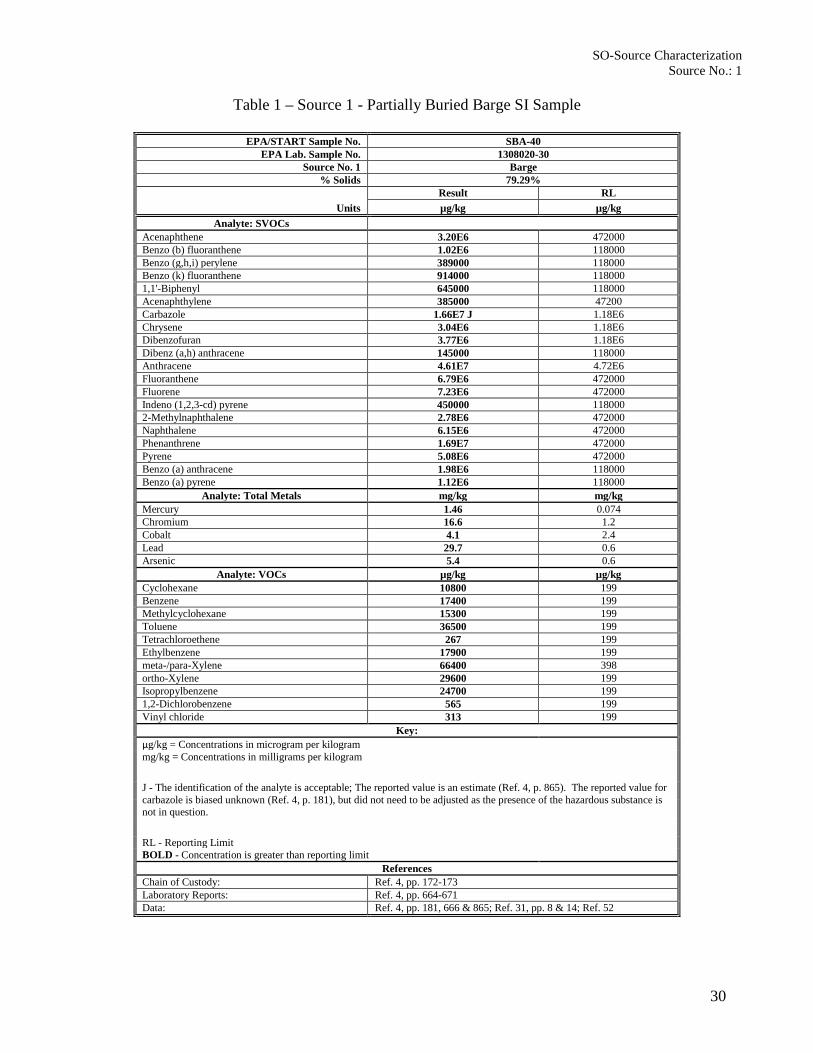
Table 1 – Source 1 - Partially Buried Barge SI Sample
EPA/START Sample No. SBA-40 EPA Lab. Sample No. 1308020-30
Source No. 1 Barge % Solids 79.29%
Units Result RL µg/kg µg/kg
Analyte: SVOCs Acenaphthene 3.20E6 472000 Benzo (b) fluoranthene 1.02E6 118000 Benzo (g,h,i) perylene 389000 118000 Benzo (k) fluoranthene 914000 118000 1,1'-Biphenyl 645000 118000 Acenaphthylene 385000 47200 Carbazole 1.66E7 J 1.18E6 Chrysene 3.04E6 1.18E6 Dibenzofuran 3.77E6 1.18E6 Dibenz (a,h) anthracene 145000 118000 Anthracene 4.61E7 4.72E6 Fluoranthene 6.79E6 472000 Fluorene 7.23E6 472000 Indeno (1,2,3-cd) pyrene 450000 118000 2-Methylnaphthalene 2.78E6 472000 Naphthalene 6.15E6 472000 Phenanthrene 1.69E7 472000 Pyrene 5.08E6 472000 Benzo (a) anthracene 1.98E6 118000 Benzo (a) pyrene 1.12E6 118000
Analyte: Total Metals mg/kg mg/kg Mercury 1.46 0.074 Chromium 16.6 1.2 Cobalt 4.1 2.4 Lead 29.7 0.6 Arsenic 5.4 0.6
Analyte: VOCs µg/kg µg/kg Cyclohexane 10800 199 Benzene 17400 199 Methylcyclohexane 15300 199 Toluene 36500 199 Tetrachloroethene 267 199 Ethylbenzene 17900 199 meta-/para-Xylene 66400 398 ortho-Xylene 29600 199 Isopropylbenzene 24700 199 1,2-Dichlorobenzene 565 199 Vinyl chloride 313 199
Key: µg/kg = Concentrations in microgram per kilogram mg/kg = Concentrations in milligrams per kilogram
J - The identification of the analyte is acceptable; The reported value is an estimate (Ref. 4, p. 865). The reported value for carbazole is biased unknown (Ref. 4, p. 181), but did not need to be adjusted as the presence of the hazardous substance is not in question.
RL - Reporting Limit BOLD - Concentration is greater than reporting limit
References Chain of Custody: Ref. 4, pp. 172-173 Laboratory Reports: Ref. 4, pp. 664-671 Data: Ref. 4, pp. 181, 666 & 865; Ref. 31, pp. 8 & 14; Ref. 52
30

SO-Source Characterization Source No.: 1
Table 2- Source 1- Partially Buried Barge ESI Sample
EPA/START Sample Number: SBA-ESI-15 ELS Laboratory Sample Number: E1401160-002
Sampling Location: SBA-ESI-15
Sample Description: Waste sample from NW corner of partially buried barge (Source 1)
% Solids: 80.30% Units: ng/kg
Analyte: Dioxins and Furans Result Flag MRL TEQ 1,2,3,4,7,8-Hexachlorodibenzofuran (HxCDF) 26.6 KJ 16 2.66 1,2,3,6,7,8-Hexachlorodibenzofuran (HxCDF) 26.2 KJ 18.6 2.62 2,3,4,6,7,8-Hexachlorodibenzofuran (HxCDF) 32.2 J 22.8 3.22 2,3,4,7,8-Pentachlorodibenzofuran (PeCDF) 46.8 KJ 38.9 14.0 1,2,3,7,8,9-Hexachlorodibenzo-p-dioxin (HxCDD) 52.1 J 19.4 5.21 Octachlorodibenzo-p-dioxin (OCDD) 1370 J 6.1 0.411 Total TCDD TEQ - 2005 WHO (ND = MRL) 30.2
Key:
MRL - Method Reporting Limit ND - Indicates concentration is reported "Not Detected"
ng/kg - nanograms per kilogram MRL = Method Reporting Limit TCDD -Tetrachlorodibenzodioxins TEQ - Toxicity Equivalency Quotient U = Undetected at Reporting Limit WHO - World Health Organization J = an estimated value (Ref. 7, p. 262). The reported value for octachlorodibenzo-p-dioxin (OCDD) is biased unknown (Ref. 7, p. 998) but did not need to be adjusted as the presence of the hazardous substance is not in question. K = estimated maximum possible concentration for the associated compound (Ref. 7, p. 262). Bold = Concentration detected above the Reporting Limits
References Chain of Custody: Ref. 7, p. 171 Laboratory Results: Ref. 7, pp. 1005-1008
Data: Ref. 7, pp. 262, 998 & 1005; Ref. 52
31
SO-Source Characterization Source No.: 1
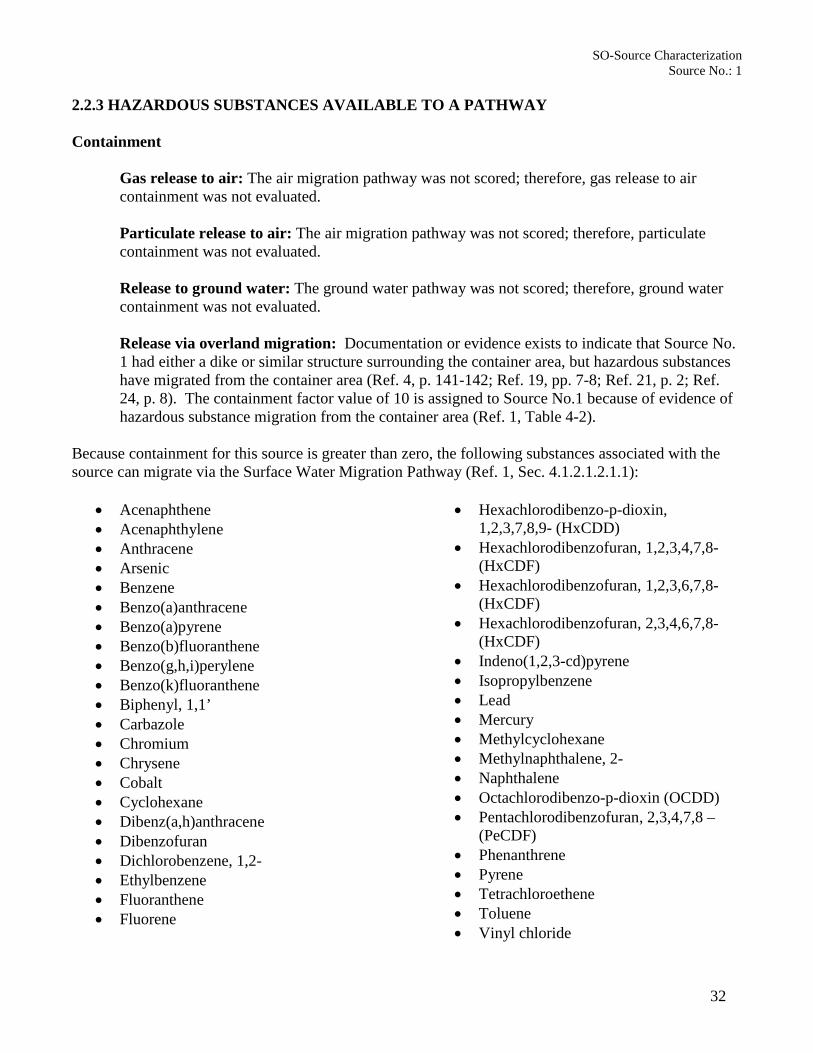
2.2.3 HAZARDOUS SUBSTANCES AVAILABLE TO A PATHWAY Containment
Gas release to air: The air migration pathway was not scored; therefore, gas release to air containment was not evaluated. Particulate release to air: The air migration pathway was not scored; therefore, particulate containment was not evaluated. Release to ground water: The ground water pathway was not scored; therefore, ground water containment was not evaluated. Release via overland migration: Documentation or evidence exists to indicate that Source No. 1 had either a dike or similar structure surrounding the container area, but hazardous substances have migrated from the container area (Ref. 4, p. 141-142; Ref. 19, pp. 7-8; Ref. 21, p. 2; Ref. 24, p. 8). The containment factor value of 10 is assigned to Source No.1 because of evidence of hazardous substance migration from the container area (Ref. 1, Table 4-2).
Because containment for this source is greater than zero, the following substances associated with the source can migrate via the Surface Water Migration Pathway (Ref. 1, Sec. 4.1.2.1.2.1.1):
• Acenaphthene • Acenaphthylene • Anthracene • Arsenic • Benzene • Benzo(a)anthracene • Benzo(a)pyrene • Benzo(b)fluoranthene • Benzo(g,h,i)perylene • Benzo(k)fluoranthene • Biphenyl, 1,1’ • Carbazole • Chromium • Chrysene • Cobalt • Cyclohexane • Dibenz(a,h)anthracene • Dibenzofuran • Dichlorobenzene, 1,2- • Ethylbenzene • Fluoranthene • Fluorene
• Hexachlorodibenzo-p-dioxin, 1,2,3,7,8,9- (HxCDD)
• Hexachlorodibenzofuran, 1,2,3,4,7,8- (HxCDF)
• Hexachlorodibenzofuran, 1,2,3,6,7,8- (HxCDF)
• Hexachlorodibenzofuran, 2,3,4,6,7,8- (HxCDF)
• Indeno(1,2,3-cd)pyrene • Isopropylbenzene • Lead • Mercury • Methylcyclohexane • Methylnaphthalene, 2- • Naphthalene • Octachlorodibenzo-p-dioxin (OCDD) • Pentachlorodibenzofuran, 2,3,4,7,8 –
(PeCDF) • Phenanthrene • Pyrene • Tetrachloroethene • Toluene • Vinyl chloride
32

SO-Source Characterization Source No.: 1
• Xylene, -m, -p, -o
2.4.2 HAZARDOUS WASTE QUANTITY
2.4.2.1.1. Hazardous Constituent Quantity – Tier A
The total Hazardous Constituent Quantity for Source 1 could not be adequately determined according to the HRS requirements; that is, the total mass of all CERCLA hazardous substances in the source and releases from the source is not known and cannot be estimated with reasonable confidence (Ref. 1, pp. 51590-51591). Insufficient historical and current data (manifests, potentially responsible party [PRP] records, State records, permits, waste concentration data, etc.) are available to adequately calculate the total or partial mass of all CERCLA hazardous substances in the source and the associated releases from the source. Therefore, there is insufficient information to calculate a total or partial Hazardous Constituent Quantity estimate for Source 1 with reasonable confidence.
Hazardous Constituent Quantity Value (S): Not Calculated Are the data complete for hazardous constituent quantity for this area? No
2.4.2.1.2. Hazardous Wastestream Quantity – Tier B
The total Hazardous Wastestream Quantity for Source 1 could not be adequately determined according to the HRS requirements; that is, the total mass of all hazardous waste streams and CERCLA pollutants and contaminants for the source and releases from the source is not known and cannot be estimated with reasonable confidence (Ref. 1, p. 51591). Insufficient historical and current data (manifests, PRP records, State records, permits, waste concentration data, annual reports, etc.) are available to adequately calculate the total or partial mass of all hazardous waste streams and CERCLA pollutants and contaminants for the source and the associated releases from the source. Therefore, there is insufficient information to adequately calculate or extrapolate a total or partial Hazardous Wastestream Quantity for Source 1 with reasonable confidence.
Hazardous Wastestream Quantity Value (W): Not Calculated Are the data complete for hazardous constituent quantity for this area? No.
2.4.2.1.3. Volume – Tier C
The volume of Source 1 can be adequately determined based on a one time capacity volume, and not the actual contents of the source (Ref 1, Sec. 2.4.2.1.3). Completed interim measures/removal actions (IM/RA) at SBA specify that a total of 1.19 million gallons of pumpable oily material was pumped from the Partially Buried Barge and thermal destroyed (Ref. 5, p. 14). Pumpable oily material was removed from the partially buried barge till approximately 4 to 6 inches of heel remained between the structural members in the vessel, which could not be removed (Ref. 5, p. 14). After completion of the IM/RA on the Partially Buried Barge the emptied vessel was used as a collection tank for contaminated water generated by subsequent (IM/RA) cleanup activities (Ref. 5, p.14). The approximate 850,000 gallons of contaminated water collected in the Partially Buried Barge was later removed (Ref. 5, p. 8). The partially buried barge was ultimately emptied of all but
33

SO-Source Characterization Source No.: 1
approximately 2 to 6 inches of water and oily heel retained by structural members in the vessel (Ref. 5, p. 17). To prevent water from refilling the vessel, all hatches and covers on the Partially Buried Barge were tack-welded shut (Ref. 5, p. 17). This was ineffective, because in October 2012 an anonymous caller notified the National Response Center (NRC) that the barge was being scrapped and oil was being allowed to discharge to the ground (Ref. 21, p. 2). LDEQ conducted an investigation and reported evidence of the barge scrapping activities and that oil was still visible inside the portion of the barge being salvaged, and along the perimeter and east end of the barge (Ref. 21, p. 14). Based on the IM/RA information available the one time volume capacity volume can be determined for the Partially Buried Barge (Source No. 1). According to the pumpable oily material inventory the estimated maximum capacity was calculated for each compartment of the vessel (Ref. 5, p. 47). The one time capacity volume will be based on the IM/RA which calculated the estimated maximum capacity for each compartment of the partially buried barge. Bow Rake Tank 26,853 gallons Deck Tank S Not Measured Deck Tank P Not Measured Compartment 1S 75,054 gallons Compartment 1P 75,054 gallons Compartment 2S 71,808 gallons Compartment 2P 71,808 gallons Compartment 3S 100,279 gallons Compartment 3P 100,279 gallons Compartment 4S 100,279 gallons Compartment 4P 100,279 gallons Compartment 5S 86,908 gallons Compartment 5P 86,908 gallons Aft Trim Tank 18,388 gallons TOTAL 913, 897 gallons The hazardous waste quantity evaluation equation applied for the conversion of gallons to cubic yards (yds3) is 1 yd3 = 200 gallons (Ref. 1, Table 2-5, footnote b). The one time estimated capacity of the Partially Buried Barge is 4,569.49 cubic yards (Ref. 1, Sec 2.4.2.1.3). 913,897 gallons X 1 yd3 / 200 gallons per 1 yd3 = 4,569.49 yd3 The hazardous waste quantity evaluation equation for a container is V/2.5 (Ref. 1, Table 2-5). The volume source will be assigned a volume hazardous waste quantity value of 1,827.79 4,569.49 yd3 / 2.5 = 1,827.79
Volume of Source No. 1 (yd3): 4,569.49 Reference(s): Ref. 1, Table 2-5, p. 51591
Volume Assigned Value: 1,827.79
34

SO-Source Characterization Source No.: 1
2.4.2.1.4. Area – Tier D
Area was not calculated for Source 1 since volume was adequately determined and assigned a value. Therefore, according to HRS, area is not calculated (Ref. 1, Sec. 2.4.2.1.3 and 2.4.2.1.4).
Area of Source No. 1 in square feet (ft2): Not calculated Area Assigned Value: 0
References: Ref. 1, Sec. 2.4.2.1.4
2.4.2.1.5. Source Hazardous Waste Quantity Value Source No. 1, Partially Buried Barge.
Measures Surface Water, Ground Water and Air Pathways
Tier A NC Tier B NC Tier C 1,827.79 Tier D NC
Assigned Source Hazardous Waste Quantity Value (Ref. 1,
Sec. 2.4.2.1.5)
1,827.79
NC: Not Calculated The highest value assigned to either Tier A, Tier B, Tier C, or Tier D is assigned as the Source No. 1 Hazardous Waste Quantity Value (Ref. 1, Section 2.4.2.1.5). The highest value assigned is Tier C.
Source No. 1 Hazardous Waste Quantity Value: 1,827.79
35

SO-Source Characterization Source No.: 3
2.2.1 SOURCE IDENTIFICATION – SOURCE 3 The following information corresponds to the third source identified for this documentation record. Name of source: Former Water Pit 1 Number of source: 3 Source Type: Surface Impoundment Buried/Backfilled Description and Location of Source: Former Water Pit 1 was a surface impoundment located on the southeast portion of the property, northwest of a designated wetland area (Figure 2; Ref. 16, p. 2; Ref. 18, p. 2). The Former Water Pit 1 was used to treat and store wastewater and sludges generated during the barge cleaning activities (Ref. 24, p. 8). The Former Water Pit 1 was excavated to an approximate depth of 18 feet bgs around 1968, and the soils below the unlined impoundment consisted of clay to an approximately depth of 20 to 25 feet bgs (Ref. 24, pp. 8 & 107). During operation, Water Pit 1 received wastewater from the oil pit and the oil/water separator (Ref. 24, pp. 12-13). Oil was returned to the oil pit, and water was pumped to Water Pit 2 (Ref. 24, p.13). Three barge tanks used for oil/water/sludge separation and storage were located south of Water Pit 1 (Ref. 24, p. 12). The oil/water tanks consisted of three converted barge tanks (Ref. 24, p. 14). The three tanks were fabricated by cutting a barge into three sections, sealing the ends, and placing the barges upside next to Water Pit 1 (Ref. 24, p.14). The tanks had a total capacity of 9,500 barrels, were used to store and separate oil, water, and sludge (Ref. 24, p. 14). Subsequently, aboveground oil/water separators and storage tanks replaced the functions of Water Pit 1 prior to undergoing closure beginning in 1991(Ref. 6, p. 10; Ref. 16, pp. 2-5). By 1994, Water Pit 1 was inactive and had undergone partial closure (Ref. 24, p. 13). In mid-1990 SBA began closure on Water Pit 1 by using an aerator to biologically treat the wastewater and sludges, and by early 1991 the process was deemed unsuccessful (Ref. 6, p. 10; Ref. 24, p. 13). Prior to closure activities in 1991, an estimated 2,542 cubic yards of sludge was present in Water Pit 1 (Ref. 24, p. 13). In 1992, SBA implemented a new closure technique, the free water and oil was pumped from Water Pit 1 to the storage tanks or into the oil pit (Ref. 6, p. 10; Ref. 24, p. 13). The remaining sludge in Water Pit 1 was then solidified by mixing with fly ash and lime (Ref. 6, p. 10). Approximately one third of the solidified/stabilized sludges was removed from Water Pit 1 and placed on the ground at the area formerly designated as the Land Treatment Unit (Ref. 6, p. 10; Ref. 24, p. 13). The remaining sludges in Water Pit 1 were piled in the southeast/east end of the impoundment, with accumulated rainwater periodically pumped to storage tanks (Ref. 6, p. 10; Ref. 24, p. 13). No information has been found mentioning or detailing the closure of Water Pit 1. The impoundment formerly known as Water Pit 1 had dimensions of approximately 160 feet x 100 feet x 15 feet and was estimated to contain an approximate 6,900 cubic yards of solidified sludge piled in the east end of the impoundment in 1996 (Ref. 4, p. 30; Ref. 6, p. 7). Prior to closure activities in 1991, an estimated 2,542 cubic yards of sludge was present in the impoundment (Ref. 24, p. 13).
Soil borings were advanced using direct push technology at three (3) locations from the Former Water Pit 1 area during the August 2013 EPA SI (Ref. 4, pp. 57, 906 & 908; Figure 3). The borings were advanced to a maximum depth of 16 feet below ground surface (bgs) using the procedures in the EPA
36

SO-Source Characterization Source No.: 3
Environmental Response Team (ERT) Standard Operating Procedure (SOP) 2050, modified for the actual unit used by the driller (Ref. 4, pp. 20 & 934-946). Grab soil samples were collected from each boring, from intervals of visual contamination or where PID readings for VOCs above background were detected (Ref. 4, pp. 20, 153, 893 & 934-946). Soil samples were shipped to the U.S. EPA Laboratory in Houston for analysis, data review and data validation for Target Compound List (TCL) Volatile Organic Analysis (VOAs) by EPA method CLP SOW SOM01.2(method used -CLP OLM04.2 – GC/MS), TCL Semi-Volatile Organic Analysis (SVOAs) by EPA method CLP SOW SOM01.2 (method used - CLP OLM04.2 – GC/MS), TCL Pesticide/PCBs by EPA method CLP SOW SOM01.2 (method used – CLP OLM04.2 – GC/ECD), TAL Cyanides by EPA method CLP SOW ILM05.4 (method used 335.4 – Colorimetric), and TAL Total Metals + Mercury by EPA method CLP SOW ILM05.4 (methods used - CLP ILM05.3 – ICP, CLP ILM05.3 – ICP/MS, CLP ILM05.3 – CVAAS) (Ref. 4, pp. 20, 47, 482-491, 546-563, 582-607). Location SBA-002 was sampled north of the Former Water Pit 1 along the overland flow pathway for this source, Location SBA-004 was sampled along the approximate former east end of the Former Water Pit 1 where remaining solidified/stabilized sludge was piled, and Location SBA-005 was sampled in the area of the former oil/water separator associated with the former Water Pit 1(Figure 3). The following samples were collected (Ref. 4, pp. 30-31, 57, 149, 869 & 871):
• Sample SBA-002PD (6-8 feet bgs) – collected at highest PID reading; chemical odor; silty clay with gray and orange mottled coloring, and slightly plastic (Ref. 4, pp. 30, 57, 869 & 980);
• Sample SBA-002WT (10-12 feet bgs) – collected above water table; chemical odor; clay with silt seams, and visible product in seam (Ref. 4, pp. 30, 57& 981);
• Sample SBA-004-24 (2-4 feet bgs) – heavy chemical odor, staining with a sheen; clay-ey/silt, and moist stained, black (Ref. 4, pp. 30, 57, 871 & 984);
• Sample SBA -004 004WT (12-14 feet bgs) – collected above water table; chemical odor, sheen present; silty-clay, and moist stained, black (Ref. 4, p. 30, 57, 871& 985);
• Sample SBA-005PD (12-14 feet bgs) – collected at the highest PID reading; clay-ey/silt, tan stained dark grey coloring. (Ref. 4, pp. 31, 57, 872 & 986)
• Sample SBA-005WT (14-16 feet bgs) – collected above water table; clay-ey/silt, grey color with black staining odor. (Ref. 4, pp. 31, 57, 872 & 987)
The soil sample results from these source areas were compared to the concentrations in the corresponding foot intervals from the background soil sample (Table 3), while this increase in concentration is not required to associate the substances with the source, it does demonstrate the level in the soil samples are significantly above background. PAHs such as acenaphthene, acenaphthylene, anthracene, benzo(a)anthracene, benzo(a)pyrene, benzo(b)fluoranthene, benzo(g,h,i)perylene, benzo(k)fluoranthene, bis(2-ethylhexyl)phthalate, carbazole, chrysene, dibenz(a,h)anthracene, dibenzofuran, 2,4-dimethylphenol, fluoranthene, fluorene, indeno(1,2,3-cd)pyrene, 2-methylnaphthalene, 2-methylphenol, 3 &/or 4-methylphenol, naphthalene, phenanthrene, and pyrene were detected greater than background levels. Constituents were detected at 2 to 4 feet bgs, 6 to 8 feet bgs, 10 to 12 feet bgs, 12 to 14 feet bgs and/or at between 14 to 16 feet bgs (Ref. 4, pp. 30-31, 482-491, 546-563 & 582-607; Tables 3 & 5).
37
SO-Source Characterization Source No.: 3
VOCs were detected above background concentrations (See Table 3) in the 2 to 4 feet bgs, 6 to 8 feet bgs, 10 to 12 feet bgs, 12 to 14 feet bgs and/or at depths between 14 to 16 feet bgs for cyclohexane, methylcyclohexane, ethylbenzene, cis-1,2-dichloroethane, tetrachloroethene, styrene, isopropylbenzene, 1,4-dichlorobenzene, 1,2-dichlorobenzene toluene, benzene, xylene and toluene (Ref. 4, pp. 30-31, 482-491, 546-563 & 582-607; Tables 3 & 5). While this increase in concentration is not required to associate the substances with the source, it does demonstrate the level in the soil samples are significantly above background. In addition, numerous metal concentrations from the 2 to 4 feet bgs, 6 to 8 feet bgs, 10 to 12 feet bgs, 12 to 14 feet bgs and/or between 14 to 16 feet bgs intervals were detected at concentrations above background levels. Metals concentrations detected above background levels include: copper, manganese, mercury, nickel, zinc, barium, cadmium, cobalt, lead and arsenic (Ref. 4, p. 30-31, 482-491, 546-563 & 582-607; Tables 3 & 5). Again, while this increase in concentration is not required to associate the substances with the source, it does demonstrate the level in the soil samples are significantly above background. 2.2.2 HAZARDOUS SUBSTANCES ASSOCIATED WITH THE SOURCE
Soil sample results from former source areas representing Source No. 3 included PAHs such as acenaphthene, acenaphthylene, anthracene, benzo(a)anthracene, benzo(a)pyrene, benzo(b)fluoranthene, benzo(g,h,i)perylene, benzo(k)fluoranthene, 1,1’-biphenyl, bis(2-ethylhexyl)phthalate, carbazole, chrysene, dibenz(a,h)anthracene, dibenzofuran, 2,4-dimenthylphenol, fluoranthene, fluorene, indeno(1,2,3-cd)pyrene, 2-methylnaphthalene, 2-methylphenol, 3 &/or 4-methylphenol, naphthalene, phenanthrene, and pyrene (Table 5). This is consistent with identification of buried impoundments used in the barge cleaning operations (Ref. 4, p. 31). These constituents are also detected in other sources at SBA including the Dry Dock and Partially Buried Barge (Sources 6, and 1 respectively) (Ref. 4, p. 31; Ref. 7, p. 36). In addition, numerous VOCs such as cyclohexane, methylcyclohexane, ethylbenzene, cis-1,2-dichloroethane, tetrachloroethene, styrene, isopropylbenzene, 1,4-dichlorobenzene, 1,2-dichlorobenzene toluene, benzene, xylene and toluene were detected. Metal concentrations were detected to include mercury, copper, manganese, nickel, zinc, barium, cadmium, chromium, cobalt, lead and arsenic (Ref. 4, pp. 30-31, 482-491, 546-563 & 582-606; Tables 3 & 5).
38

SO-Source Characterization Source No.: 3
Table 5 – Source 3 – Former Water Pit 1 Samples
EPA/START Sample No.: SBA-002-PD SBA-002-WT SBA-004-24 EPA Laboratory Sample No.: 1308020-16 1308020-17 1308020-20
Depth of Sample: 6 to 8 feet internal 10 to 12 feet internal 2 to 4 feet interval % Solids: 73.22% 73.83% 80.81%
Unit: Result RL > 3x Bkgd or > RL Result RL > 3x Bkgd or >
RL Result RL > 3x Bkgd or > RL
Analyte: SVOCs µg/kg µg/kg µg/kg µg/kg µg/kg µg/kg µg/kg µg/kg µg/kg Acenaphthene 70900 6710 246 (RL) 141000 23900 240 (RL) 1.12E6 47300 256 (RL) Benzo (b) fluoranthene 24000 1680 615 (RL) 54900 5970 599 (RL) 481000 118000 639 (RL) Benzo (g,h,i) perylene 9830 1680 615 (RL) 25000 5970 599 (RL) 303000 118000 639 (RL) Benzo (k) fluoranthene 16300 1680 615 (RL) 44000 5970 599 (RL) 486000 118000 639 (RL) 1,1'-Biphenyl 22100 1680 615 (RL) 37300 5970 599 (RL) 257000 118000 639 (RL) Bis(2-ethylhexyl)phthalate U 1680 615 (RL) U 5970 599 (RL) 13100 N 11800 639 (RL) Acenaphthylene 4970 671 246 (RL) 6460 2390 240 (RL) 323000 47300 256 (RL)
Carbazole 45200 J (4520)* 16800 615 (RL) 51600 J
(5160)* 5970 599 (RL) 5.94E6 J (5.94E5)* 1.18E6 639 (RL)
Chrysene 54700 16800 615 (RL) 93300 5970 599 (RL) 1.20E6 118000 639 (RL) Dibenzofuran 74200 16800 615 (RL) 151000 59700 599 (RL) 1.55E6 118000 639 (RL) Dibenz (a,h) anthracene 3540 1680 615 (RL) 8740 5970 599 (RL) 108000 106000 639 (RL) 2,4-Dimethylphenol 111000 6710 615 (RL) 115000 2390 599 (RL) U 11800 639 (RL) Anthracene 111000 6710 246 (RL) 115000 2390 240 (RL) 1.66E7 473000 256 (RL) Fluoranthene 210000 6710 246 (RL) 495000 23900 240 (RL) 3.62E6 473000 256 (RL) Fluorene 106000 6710 246 (RL) 208000 23900 240 (RL) 2.85E6 473000 256 (RL) Indeno (1,2,3-cd) pyrene 11900 1680 615 (RL) 27700 5970 599 (RL) 343000 118000 639 (RL) 2-Methylnaphthalene 63300 6710 246 (RL) 86600 2390 240 (RL) 1.01E6 47300 256 (RL) 2-Methylphenol U 1680 615 (RL) U 5970 599 (RL) U 11800 639 (RL) 3 &/or 4-Methylphenol 428000 67100 615 (RL) 946000 23900 599 (RL) 13500 11800 639 (RL) Naphthalene 251000 6710 246 (RL) 191000 23900 240 (RL) 2.52E6 473000 256 (RL) Phenanthrene 428000 67100 246 (RL) 946000 23900 240 (RL) 8.33E6 473000 256 (RL) Pyrene 138000 6710 246 (RL) 333000 23900 240 (RL) 2.47E6 473000 256 (RL) Benzo (a) anthracene 45500 16800 615 (RL) 98700 5970 599 (RL) 921000 118000 639 (RL) Benzo (a) pyrene 23700 1680 615 (RL) 57600 5970 599 (RL) 610000 118000 639 (RL) Analyte: Total Metals mg/kg mg/kg mg/kg mg/kg mg/kg mg/kg mg/kg mg/kg mg/kg Mercury U 0.075 0.08 (RL) U 0.08 0.076 (RL) 0.709 0.075 0.082 (RL) Copper 39.8 2.6 19.8 (3x) 29.0 2.5 22.8 (3x) 75.5 2.4 24.6 (3x) Manganese 10900 0.6 68.7 (3x) 587 0.6 166.2 (3x) 156 0.6 435 (3x) Nickel 70.9 2.6 14.4 (3x) 27.8 2.5 32.1 (3x) 17.5 2.4 14.1 (RL) Zinc 66.7 2.6 33.6 (3x) 70.4 2.5 51.3 (3x) 150 2.4 89.7 (RL) Barium 3730 1.3 591 (3x) 179 1.2 336 (3x) 246 1.2 285 (RL) Cadmium 2.3 0.6 0.60 (RL) 1.5 0.6 0.60 (RL) 0.8 0.6 2.1 (3x) Cobalt 200 2.6 9.6 (3x) 9.5 2.5 17.7 (3x) 10.2 2.4 2.5 (RL) Lead 39.9 0.6 31.2 (3x) 20.7 0.6 44.7 (3x) 32.4 0.6 46.5 (3x) Arsenic 18.2 0.6 9.9 (3x) 11.9 0.6 6.9 (3x) 3.5 0.6 13.2 (3x) Analyte: VOCs µg/kg µg/kg µg/kg µg/kg µg/kg µg/kg µg/kg µg/kg µg/kg Cyclohexane 229 99.9 4.1 (RL) 220 L 89.0 3.9 (RL) 735 100 4.1 (RL) Methylcyclohexane 680 99.9 4.1 (RL) 566 L 89.0 3.9 (RL) 1350 100 4.1 (RL) Ethylbenzene 498 99.9 4.1 (RL) 403 L 89.0 3.9 (RL) 2090 100 4.1 (RL) meta-/para-Xylene 743 200 8.3 (RL) 908L 178 7.8 (RL) 12400 200 8.2 (RL) ortho-Xylene 418 99.9 4.1 (RL) 343 4.5 3.9 (RL) 4830 100 4.1 (RL) cis-1,2-Dichloroethene UJ 4.5 4.1 (RL) 30.3 4.5 3.9 (RL) 36.7 5.0 4.1 (RL) Benzene 295 L 4.5 4.1 (RL) 273 4.5 3.9 (RL) 5570 100 4.1 (RL) Toluene 191 L 4.5 4.1 (RL) 560 L 89.0 3.9 (RL) 6270 100 4.1 (RL) Tetrachloroethene UJ 4.5 4.1 (RL) 9.7 4.5 3.9 (RL) 37.1 5.0 4.1 (RL) Styrene UJ 4.5 4.1 (RL) 15.1 J (1.51)* 4.5 3.9 (RL) 2560 100 4.1 (RL) Isopropylbenzene 102 L 4.5 4.1 (RL) 73.2 4.5 3.9 (RL) 2250 100 4.1 (RL) 1,4-Dichlorobenzene 32.3 L 4.5 4.1 (RL) 18.6 4.5 3.9 (RL) U 5.0 4.1 (RL) 1,2-Dichlorobenzene 312 L 4.5 4.1 (RL) 178 4.5 3.9 (RL) 5.8 5.0 4.1 (RL)
Key: µg/kg = Concentrations in micrograms per kilograms RL - Reporting Limit mg/kg = Concentrations in milligrams per kilogram
PD - Highest PID Reading
WT - Above the Water Table U - Undetected J - The identification of the analyte is acceptable; The reported value is an estimate (Ref. 4, p. 865). The reported values for carbazole in samples SBA-002-PD, SBA-002-WT, SBA-004-24, SBA-004-WT, SBA-005-PD, and SBA-005-WT are biased unknown (Ref. 4, p. 181). The reported values for anthracene, fluoranthene, phenanthrene, cyclohexane, and methylcyclohexane in sample SBA-005-PD are biased unknown (Ref. 31, pp. 181 & 186). The reported value for styrene in sample SBA-002-WT is biased unknown (Ref. 31, p. 185). The reported value for tetrachloroethene in sample SBA-005-WT is biased unknown (Ref. 31, p. 185). The presence of these substances is not in doubt. L - The identification of the analyte is acceptable; the reported value may be biased low. The actual value is expected to be greater than the reported value (Ref. 4, 865). N - There is a presumptive evidence that the analyte present; the analyte is reported as a tentative identification (Ref. 4, p. 865). * - The detected concentration was adjusted by using the guidance document "Using Qualified Data to Document and Observed Release and Observed Contamination" (Ref. 31, pp. 8, 12, 14, & 15). After adjusting the value for the qualified data to reflect the possible effect of the bias on the substance concentration, there is still a significant increase in contamination. BOLD - Concentration detected significantly above the background concentration or reporting limits.
References Chain of Custody: Ref. 4, p. 170 Ref. 4, p. 170 Ref. 4, p. 171 Laboratory Results: Ref. 4, pp. 546-554 Ref. 4, pp. 555-563 Ref. 4, pp. 582-590
Data Ref. 4, p. 181, 474-481, 549 & 865; Ref. 31, pp. 8 and 14; Ref. 52
Ref. 4, p. 181, 185, 442-479, 556, 558 & 865; Ref. 31, pp. 8, 12, and 14; Ref. 52
Ref. 4, p. 181, 466-473, 585 & 865; Ref. 31, pp. 8 and 14; Ref. 52
39

SO-Source Characterization Source No.: 3
Table 5 (continued) – Source 3 – Former Water Pit 1 Samples
EPA/START Sample No.: SBA-004-WT SBA-005-PD SBA-005-WT EPA Laboratory Sample No.: 1308020-21 1308020-22 1308020-08
Depth of Sample: 12 to 14 feet interval 12 to 14 feet interval 14 to 16 feet interval % Solids: 81.66% 83.19% 76.84%
Unit: Result RL 3x Bkgd or > RL Result RL 3x Bkgd or > RL Result RL 3x Bkgd or >
RL Analyte: SVOCs µg/kg µg/kg µg/kg µg/kg µg/kg µg/kg µg/kg µg/kg µg/kg Acenaphthene 1.33E6 48300 259 (RL) 4590 475 259 (RL) 44000 1250 247 (RL) Benzo (b) fluoranthene 552000 121000 649 (RL) 2610 1190 649 (RL) 18400 3120 618 (RL) Benzo (g,h,i) perylene 317000 121000 649 (RL) 2510 1190 649 (RL) 11400 3120 618 (RL) Benzo (k) fluoranthene 584000 121000 649 (RL) 2010 1190 649 (RL) 14700 3120 618 (RL) 1,1'-Biphenyl 455000 121000 649 (RL) 1480 1190 649 (RL) 15400 3120 618 (RL) Bis(2-ethylhexyl)phthalate U 12100 649 (RL) U 1190 649 (RL) U 3120 618 (RL) Acenaphthylene 409000 48300 259 (RL) 542 475 259 (RL) 4060 1250 247 (RL)
Carbazole 1.40E7 J (1.40E6)* 1.21E6 649 (RL) 6420 J
(642.0)* 1190 649 (RL) 25800 J (2580)* 3120 618 (RL)
Chrysene 1.68E6 121000 649 (RL) 4510 1190 649 (RL) 31300 3120 618 (RL) Dibenzofuran 2.38E6 1.21E6 649 (RL) 5220 1190 649 (RL) 52800 3120 618 (RL) Dibenz (a,h) anthracene 113000 112000 649 (RL) U 1190 649 (RL) 3210 3120 618 (RL) 2,4-Dimethylphenol 22500 12100 649 (RL) U 1190 649 (RL) U 3120 618 (RL)
Anthracene 3.87E7 4.83E6 259 (RL) 16700 J (1670)* 475 259 (RL) 41100 1250 247 (RL)
Fluoranthene 4.23E6 483000 259 (RL) 16900 J (1690)* 475 259 (RL) 133000 12500 247 (RL)
Fluorene 4.81E6 483000 259 (RL) 5760 475 259 (RL) 65300 12500 247 (RL) Indeno (1,2,3-cd) pyrene 361000 121000 649 (RL) 1800 1190 649 (RL) 12000 3120 618 (RL) 2-Methylnaphthalene 1.89E6 48300 259 (RL) 4080 475 259 (RL) 44500 1250 247 (RL) 2-Methylphenol 16100 12100 649 (RL) U 1190 649 (RL) U 3120 618 (RL) 3 &/or 4-Methylphenol 36000 12100 259 (RL) U 1190 259 (RL) U 3120 618 (RL) Naphthalene 4.46E6 483000 259 (RL) 12100 475 259 (RL) 170000 12500 247 (RL)
Phenanthrene 1.19E7 483000 259 (RL) 32200 J (3220)* 4750 259 (RL) 273000 12500 247 (RL)
Pyrene 2.58E6 483000 259 (RL) 12800 475 259 (RL) 98800 12500 247 (RL) Benzo (a) anthracene 1.09E6 121000 649 (RL) 4090 1190 649 (RL) 29500 3120 618 (RL) Benzo (a) pyrene 706000 121000 649 (RL) 2760 1190 649 (RL) 20200 3120 618 (RL) Analyte: Total Metals mg/kg mg/kg mg/kg mg/kg mg/kg mg/kg mg/kg mg/kg mg/kg Mercury 1.75 0.076 0.075 (RL) U 0.071 0.075 (RL) U 0.074 0.079 (RL) Copper 104 2.3 54 (3x) 7.4 2.3 54 (3x) 13.6 2.5 12.3 (3x) Manganese 161 0.6 498 (3x) 138 0.6 498 (3x) 891 0.6 110.1 (3x) Nickel 16.8 2.3 54 (3x) 8.7 2.3 54 (3x) 26.5 2.5 24.6 (3x) Zinc 205 2.3 158.7 (3x) 21.1 2.3 158.7 (3x) 45.3 2.5 42.6 (3x) Barium 325 1.2 375 (3x) 87.4 1.1 375 (3x) 151 1.2 184.5 (3x) Cadmium 0.8 0.6 2.1 (3x) U 0.6 2.1 (3x) 0.7 0.6 0.6 (RL) Cobalt 9.9 2.3 19.5 (3x) 3.0 2.3 19.5 (3x) 10.2 2.5 23.1 (3x) Lead 48.0 0.6 44.4 (3x) 4.9 0.6 44.4 (3x) 14.0 0.6 23.4 (3x) Arsenic 5.1 0.6 12 (3x) 0.7 0.6 12 (3x) 8.3 0.6 2.1 (3x) Analyte: VOCs µg/kg µg/kg µg/kg µg/kg µg/kg µg/kg µg/kg µg/kg µg/kg Cyclohexane 1140 99.8 4.2 (RL) 62.6 J (6.26)* 4.1 4.2 (RL) 928 L 83.5 41.9 (RL) Methylcyclohexane 1970 99.8 4.2 (RL) 172 J (17.2)* 4.1 4.2 (RL) 4010 L 83.5 41.9 (RL) Ethylbenzene 3020 99.8 4.2 (RL) 23.3 4.1 4.2 (RL) 8330 L 83.5 41.9 (RL) meta-/para-Xylene 17200 200 8.3 (RL) 76.9 8.1 8.3 (RL) 18900 L 167 41.9 (RL) ortho-Xylene 6820 99.8 4.2 (RL) 33.9 4.1 4.2 (RL) 6850 L 83.5 41.9 (RL) cis-1,2-Dichloroethene 64.1 4.9 4.2 (RL) U 4.1 4.2 (RL) 330 L 83.5 41.9 (RL) Benzene 8320 99.8 4.2 (RL) 4.2 4.1 4.2 (RL) 2160 L 83.5 41.9 (RL) Toluene 9220 99.8 4.2 (RL) 9.1 4.1 4.2 (RL) 8400 L 83.5 41.9 (RL) Tetrachloroethene 252 99.8 4.2 (RL) 8.3 4.1 4.2 (RL) 60.3 J (6.03)* 4.1 41.9 (RL) Styrene 3900 99.8 4.2 (RL) 4.7 4.1 4.2 (RL) 1590 L 83.5 41.9 (RL) Isopropylbenzene 3240 99.8 4.2 (RL) 13.1 4.1 4.2 (RL) 1000 L 83.5 41.9 (RL) 1,4-Dichlorobenzene U 4.9 4.2 (RL) U 4.1 4.2 (RL) 165 L 83.5 41.9 (RL) 1,2-Dichlorobenzene 152 99.8 4.2 (RL) 12.4 4.1 4.2 (RL) 1640 L 83.5 41.9 (RL)
Key: µg/kg = Concentrations in micrograms per kilograms mg/kg = Concentrations in milligrams per kilogram RL - Reporting Limit
U - Undetected
WT - Above the Water Table
PD - Highest PID Reading J - The identification of the analyte is acceptable; The reported value is an estimate (Ref. 4, p. 865). The reported values for carbazole in samples SBA-002-PD, SBA-002-WT, SBA-004-24, SBA-004-WT, SBA-005-PD, and SBA-005-WT are biased unknown (Ref. 4, p. 181). The reported values for anthracene, fluoranthene, phenanthrene, cyclohexane, and methylcyclohexane in sample SBA-005-PD are biased unknown (Ref. 31, pp. 181 & 186). The reported value for styrene in sample SBA-002-WT is biased unknown (Ref. 31, p. 185). The reported value for tetrachloroethene in sample SBA-005-WT is biased unknown (Ref. 31, p. 185). The presence of the substance is not in doubt. L - The identification of the analyte is acceptable; the reported value may be biased low. The actual value is expected to be greater than the reported value (Ref. 4, 865). N - There is a presumptive evidence that the analyte present; the analyte is reported as a tentative identification (Ref. 4, p. 865). * - The detected concentration was adjusted by using the guidance document "Using Qualified Data to Document and Observed Release and Observed Contamination" (Ref. 31, pp. 8, 12, 14, & 15). After adjusting the value for the qualified data to reflect the possible effect of the bias on the substance concentration, there is still a significant increase in contamination. BOLD - Concentration detected significantly above the background concentration or the reporting limits.
References Chain of Custody: Ref. 4, p. 171 Ref. 4, p. 171 Ref. 4, p. 168 Laboratory Results: Ref. 4, pp. 591-599 Ref. 4, pp. 600-607 Ref. 4, pp. 482-491
Data: Ref. 4, p. 181, 450-457, 594 & 865; Ref. 31, pp. 8 and 14; Ref. 52
Ref. 4, p. 181, 186, 450-457, 600, 602-604 & 865; Ref. 31, pp. 8, 14 & 15; Ref. 52
Ref. 4, p. 181, 185, 458-465, 485- 486 & 865; Ref. 31, pp. 8, 12 and 14; Ref. 52
40

SO-Source Characterization Source No.: 3
2.2.3 HAZARDOUS SUBSTANCES AVAILABLE TO A PATHWAY Containment
Gas release to air: The air migration pathway was not scored; therefore, gas release to air containment was not evaluated. Particulate release to air: The air migration pathway was not scored; therefore, particulate containment was not evaluated. Release to ground water: The ground water pathway was not scored; therefore, ground water containment was not evaluated. Release via overland migration: There is no evidence to indicate the former source was lined since the Former Water Pit 1 consisted of a clay bottom (Ref. 24, p. 107). There is no evidence that the Former Water Pit had any containment features when in operation. The containment factor value for Source No. 3 is 10 (Ref. 1, Table 4-2).
Because containment for this source is greater than zero, the following substances associated with the source can migrate via the Surface Water Pathways (Ref. 1, Sec. 4.1.2.1.2.1.1):
• Acenaphthene • Acenaphthylene • Anthracene • Arsenic • Barium • Benzene • Benzo(a)anthracene • Benzo(a)pyrene • Benzo(b)fluoranthene • Benzo(g,h,i)perylene • Benzo(k)fluoranthene • Biphenyl, 1,1’- • Bis(2-ethylhexyl)phthalate • Cadmium • Carbazole • Cobalt • Copper • Chrysene • Cyclohexane • Dibenz(a,h)anthracene • Dibenzofuran • Dichlorobenzene, 1,2- & 1,4-
• Dichloroethene, cis-1,2- • Dimethylphenol, 2,4- • Ethylbenzene • Fluoranthene • Fluorene • Indeno(1,2,3-cd)pyrene • Isopropylbenzene • Lead • Manganese • Mercury • Methylcyclohexane • Methylnaphthalene, 2- • Methylphenol, 2- & 3&/or4- • Naphthalene • Nickel • Phenanthrene • Pyrene • Styrene • Tetrachloroethene • Toluene • Xylene, -m, -p, -o • Zinc
41

SO-Source Characterization Source No.: 3
2.4.2 HAZARDOUS WASTE QUANTITY 2.4.2.1.1. Hazardous Constituent Quantity – Tier A
The total Hazardous Constituent Quantity for Source 3 could not be adequately determined according to the HRS requirements; that is, the total mass of all CERCLA hazardous substances in the source and releases from the source is not known and cannot be estimated with reasonable confidence (Ref. 1, pp. 51590-51591, Section 2.4.2.1.1). Insufficient historical and current data (manifests, PRP] records, State records, permits, waste concentration data, etc.) are available to adequately calculate the total or partial mass of all CERCLA hazardous substances in the source and the associated releases from the source. Therefore, there is insufficient information to calculate a total or partial Hazardous Constituent Quantity estimate for Source 3 with reasonable confidence.
Hazardous Constituent Quantity Value (S): Not Calculated Are the data complete for hazardous constituent quantity for this area? No
2.4.2.1.2. Hazardous Wastestream Quantity – Tier B
The total Hazardous Wastestream Quantity for Source 3 could not be adequately determined according to the HRS requirements; that is, the total mass of all hazardous wastestreams and CERCLA pollutants and contaminants for the source and releases from the source is not known and cannot be estimated with reasonable confidence (Ref. 1, p. 51591, Section 2.4.2.1.2). Insufficient historical and current data (manifests, PRP records, State records, permits, waste concentration data, annual reports, etc.) are available to adequately calculate the total or partial mass of all hazardous wastestreams and CERCLA pollutants and contaminants for the source and the associated releases from the source. Therefore, there is insufficient information to adequately calculate or extrapolate a total or partial Hazardous Wastestream Quantity for Source 3 with reasonable confidence.
Hazardous Wastestream Quantity Value (W): Not Calculated Are the data complete for hazardous constituent quantity for this area? No
2.4.2.1.3. Volume – Tier C Initially, the Former Water Pit 1 was excavated for active use to an approximate depth of 18 feet bgs around 1968 (Ref. 24, pp. 8 & 107). Prior to closure activities in 1991, an estimated 2,542 cubic yards of sludge was present in Water Pit 1 (Ref. 24, p. 13). By 1994, Water Pit 1 was inactive and had undergone partial closure (Ref. 24, p. 13). In 1996 dimensions were approximated at 160 feet x 100 feet x 15 feet and was estimated to contain an approximate 6,900 cubic yards of solidified sludge piled in the east end of the impoundment (Ref. 4, p. 30; Ref. 6, p. 7). However, the information available is not sufficient to evaluate an score Tier C because details of closure activities on Water Pit 1 are incomplete, the dimensions of Water Pit 1 are approximate, there exists an inconsistency and conflict in the depth of the pit according to site evidence from 1968 and 1996, the depth of excavation is unknown and may not have been uniform and unvarying throughout the source, and closure details mention solidified/stabilized sludge being piled and remaining in the southeast/east end of the impoundment (Ref. 6, p. 10; Ref. 24, p. 13); therefore, it is not possible to
42

SO-Source Characterization Source No.: 3
adequately determine a source volume (Tier C) (Ref. 1, Sec. 2.4.2.1.3, p. 51591). As a result, the evaluation of source volume proceeds to the evaluation of Tier D, source area (Ref. 1, Sec. 2.4.2.1.4, p. 51591).
Volume of source (yd3): Not Scored Reference(s): Ref. 1, Table 2-5, p. 51591
Volume Assigned Value: 0 2.4.2.1.4. Area – Tier D Historical maps and historical aerial photographs were used to estimate the size of the former Water Pit 1 (Ref. 16, p. 2; Ref. 18, p. 2). Based on Figure 2, the scale of the figures in reference 16, page 2 and 18, page 2, the former Water Pit 1 dimensions were 135 feet in length and approximately 85 feet in width; therefore, it occupied 11,475 square feet (ft2). The hazardous waste quantity evaluation equation for a buried/backfilled surface impoundment is A/13 (Ref. 1, Table 2-5). The area source will be assigned an area hazardous waste quantity value of 882.69. 11,475 ft2/13 = 882.69
Area of source (ft2): 11,475.00 Area Assigned Value: 882.69
References: Fig. 2; Ref. 1, Sec. 2.4.2.1.4 2.4.2.1.5. Source Hazardous Waste Quantity Value Source No. 3, Former Water Pit 1.
Measures Surface Water, Ground Water and Air Pathways
Tier A NC Tier B NC Tier C NS Tier D 882.69
Assigned Source Hazardous Waste Quantity Value (Ref. 1,
Sec. 2.4.2.1.5)
882.69
NS: Not Scored NC: Not Calculated The highest value assigned to either Tier A, Tier B, Tier C, or Tier D is assigned as the Source No. 3 Hazardous Waste Quantity Value (Ref. 1, Section 2.4.2.1.5). The highest value assigned is Tier D.
Source No. 3 Hazardous Waste Quantity Value: 882.69
43
SO-Source Characterization Source No.: 4
2.2.1 SOURCE IDENTIFICATION – SOURCE 4 The following information corresponds to the fourth source identified for this documentation record. Name of source: Former Land Treatment Unit (LTU) Number of source: 4 Source Type: Land Treatment Description and Location of Source: The Former Land Treatment Unit (LTU) was present west of the surface impoundments located on the southeast portion of the property (Figure 2). The land farm was a solid waste management unit on which sludge from the surface impoundments were dewatered and treated (Ref. 24, p. 5). The LTU was located approximately 200 feet northwest of Water Pit 1 and had approximate dimensions of 100 feet wide and 200 feet long (Ref. 24, pp. 15 & 107). The LTU is currently covered with soil (Ref. 4, p. 32). Surface water runoff from the LTU forms small puddles in the grass that is north of the unit (Ref. 24, pp. 15 & 107). The ground surface slopes to the northeast, and there is no surface water run-on or runoff control (Ref. 24, pp. 15 & 107). Runoff from the LTU area enters the drainage canal which discharges into the Mermentau River and adjacent wetlands (Ref. 24, pp. 5 & 107). In early 1992, SBA began using a LTU to treat solidified sludges that had been removed from Water Pit 1 during closure of the impoundment (Ref. 24, pp. 15 & 107). The LTU was used to bio treat stabilized sludge that was removed from Water Pit 1 during bioremediation activities from 1990-1991 (Ref. 6, p. 10; Ref 24, pp. 13 & 107). The sludges in Water Pit 1 were solidified with fly ash and lime (Ref. 24, pp. 15 & 107). Approximately one third of Water Pit 1 sludges were placed directly on the ground surface of the LTU (Ref. 24, p. 15). The solidified material on the LTU was periodically disked to enhance bio treatment until approximately 1993 (Ref. 6, p.45). The LTU had dimensions of approximately 190 feet x 93 feet x 3 feet and was estimated to contain approximately 2,000 cubic yards of solidified sludge (Ref. 6, p. 8). As of October 26, 1994, no closure or post closure care measures have been enacted for the LTU (Ref. 24, p. 15). Documentation has not been obtained to indicate that closure or post-closure care measures have been enacted at the LTU from October 26, 1994 to the present. Soil borings were advanced using direct push technology at two (2) locations in the former LTU area (Ref. 4, pp. 57, 906 & 908; Figure 3). The borings were advanced to a maximum depth of 16 feet bgs using the procedures in the EPA Environmental Response Team (ERT) Standard Operating Procedure (SOP) 2050, modified for the actual unit used by the driller (Ref. 4, pp. 20 & 934-946). Grab soil samples were collected from each boring, from intervals of visual contamination or where PID readings for VOCs above background were detected (Ref. 4, pp. 20, 874-875, 893, 934-946). Location SBA-007 was sampled at the southwest corner of the former LTU, and Location SBA-008 was sampled in the approximate center of the former LTU (Figure 3). Three (3) soil samples were collected from the two (2) boring locations in the area of the Former Land Treatment Unit (Ref. 4, p. 32 & 908; Figure 3):
• Sample SBA-007WT (8-10 feet bgs) – collected above water table; chemical odor
44
SO-Source Characterization Source No.: 4
• Sample SBA-008-24 (2-4 feet bgs) – no stains, no odor • Sample SBA-008WT (10-12 feet bgs) – collected above water table; chemical odor
Soil samples was shipped to the U.S. EPA Laboratory in Houston for analysis, data review and data validation for Target Compound List (TCL) Volatile Organic Analysis (VOAs) by EPA method CLP SOW SOM01.2(method used -CLP OLM04.2 – GC/MS), TCL Semi-Volatile Organic Analysis (SVOAs) by EPA method CLP SOW SOM01.2 (method used - CLP OLM04.2 – GC/MS), TCL Pesticide/PCB by EPA method CLP SOW SOM01.2 (method used – CLP OLM04.2 – GC/ECD), TAL Cyanides by EPA method CLP SOW ILM05.4 (method used 335.4 – Colorimetric), and TAL Total Metals + Mercury by EPA method CLP SOW ILM05.4 (methods used - CLP ILM05.3 – ICP, CLP ILM05.3 – ICP/MS, CLP ILM05.3 – CVAAS) (Ref. 4, pp. 20, 47, 316-324, & 333-343). The soil sample results from this source area were compared to the concentrations in the corresponding foot intervals from the background soil sample (Tables 3 and 6). The hazardous substances associated with the former land treatment unit are polycyclic aromatic hydrocarbons (PAHs), volatile organic compounds (VOCs) and metals (Table 6).
2.2.2 HAZARDOUS SUBSTANCES ASSOCIATED WITH THE SOURCE
Elevated levels of PAHs were found to include: acenaphthene, acenaphthylene, anthracene, benzo(a)anthracene, benzo(a)pyrene, benzo(b)fluoranthene, benzo(g,h,i)perylene, benzo(k)fluoranthene, 1,1’-biphenyl, chrysene, dibenzofuran, fluoranthene, fluorene, indeno(1,2,3-cd)pyrene, 2-methylnaphthalene, naphthalene, phenanthrene, phenol and pyrene in concentrations greater than comparable background soils at these depths (Ref. 4, p. 32; Table 6). While this increase in concentration is not required to associate the substances with the source, it does demonstrate the level in the samples are significantly above background. In addition, numerous VOCs such as cyclohexane, methylcyclohexane, ethylbenzene, xylene, cis-1,2-dichloroethene, benzene, toluene and vinyl chloride were detected. Metals concentrations of manganese, nickel, beryllium, cadmium, and arsenic were also detected (Table 6).
45

SO-Source Characterization Source No.: 4
Table 6 – Source 4 - Land Treatment Unit (LTU) Samples
EPA/START Sample No.: SBA-007-WT SBA-008-WT EPA Laboratory Sample No.: 1308018-06 1308018-08
Depth of Sample: 8 to 10 ft interval 10 to 12 ft interval % Solids: 76.78% 76.57%
Units: Result RL 3x Bkgd. or > Bkgd. RL Result RL 3x Bkgd. or >
Bkgd. RL Analyte: SVOCs µg/kg µg/kg µg/g µg/kg µg/kg µg/g Acenaphthene 26300 643 236 (RL) 15300 1100 240 (RL) Benzo (b) fluoranthene 7740 1610 590 (RL) 7240 2760 599 (RL) Benzo (g,h,i) perylene 2890 1610 590 (RL) 5210 2760 599 (RL) Benzo (k) fluoranthene 6130 1610 590 (RL) 7640 2760 599 (RL) 1,1'-Biphenyl 6760 1610 590 (RL) 5640 2760 599 (RL) Acenaphthylene 2410 643 236 (RL) U 1100 240 (RL) Carbazole 12600 J (1260)* 1610 590 (RL) 15000 J (1500)* 2760 599 (RL) Chrysene 13700 1610 590 (RL) 14400 2760 599 (RL) Dibenzofuran 28300 1610 590 (RL) 21400 2760 599 (RL) Anthracene 21700 643 795 (3x) 17800 1100 240 (RL) Fluoranthene 48700 12900 236 (RL) 51600 1100 240 (RL) Fluorene 35700 12900 236 (RL) 24500 1100 240 (RL) Indeno (1,2,3-cd) pyrene 3560 1610 590 (RL) 5230 2760 599 (RL) 2-Methylnaphthalene 22400 643 236 (RL) 14100 1100 240 (RL) Naphthalene 85800 12900 236 (RL) 54300 1100 240 (RL) Phenanthrene 131000 12900 236 (RL) 113000 11000 240 (RL) Phenol 2640 1610 590 (RL) U 2760 599 (RL) Pyrene 48100 12900 236 (RL) 42500 1100 240 (RL) Benzo (a) anthracene 13900 1610 590 (RL) 13000 2760 599 (RL) Benzo (a) pyrene 8110 1610 590 (RL) 9540 2760 599 (RL) Analyte: Total Metals mg/kg mg/kg mg/g mg/kg mg/kg mg/g Manganese 680 0.6 117 (3x) 501 0.6 166.2 (3x) Nickel 25.2 2.3 19.8 (3x) 20.8 2.3 32.1 (3x) Beryllium 1.0 0.6 0.6 (RL) 0.9 0.6 1.8 (3x) Cadmium 0.8 0.6 0.6 (RL) 0.9 0.6 0.6 (RL) Arsenic 10.1 0.6 0.6 (RL) 10.3 0.6 6.9 (3x) Analyte: VOCs µg/kg µg/kg µg/kg µg/kg µg/kg µg/kg Cyclohexane 138 L 89.7 3.9 (RL) 75.7 J (7.57)* 4.3 3.9 (RL) Methylcyclohexane 168 L 89.7 3.9 (RL) 247 J (24.7) 4.3 3.9 (RL) Ethylbenzene 159 L 89.7 3.9 (RL) 152 99.9 3.9 (RL) meta-/para-Xylene 1070 L 179 7.8 (RL) 474 200 7.8 (RL) ortho-Xylene 393 L 89.7 3.9 (RL) 321 J (3.21)* 4.3 3.9 (RL) cis-1,2-Dichloroethene 252 L 89.7 3.9 (RL) 52.0 J (5.20)* 4.8 3.9 (RL) Benzene 218 L 89.7 3.9 (RL) 61.1 4.3 3.9 (RL) Toluene 367 L 89.7 3.9 (RL) 222 J (22.2)* 4.3 3.9 (RL) Vinyl chloride UJ 89.7 3.9 (RL) 6.4 J (0.64)* 4.8 3.9 (RL)
Key: µg/kg = Concentrations in micrograms per kilograms Bkgd. - Background mg/kg = Concentrations in milligrams per kilograms RL - Reporting Limit U- Undetected WT - Above the Water Table BOLD - Concentration detected significantly above background concentration or above background reporting limit J - The identification of the analyte is acceptable; the reported value is an estimate (Ref. 4, p. 865). The reported values for carbazole in samples SBA-007-WT and SBA-008-WT are biased unknown (Ref. 31, p. 181). The reported values for cyclohexane, methylcyclohexane, o-xylene, cis-1,2-Dichloroethene, and toluene are biased unknown (Ref. 4, pp. 185 and 187). The presence of the substances is not in doubt. L - The identification of the analyte is acceptable; the reported value may be biased low. The actual value is expected to be greater than the reported value (Ref. 4, p. 865). * - The detected concentration was adjusted by using the guidance document "Using Qualified Data to Document an Observed Release and Observed Contamination" (Ref. 31, pp. 5-14). After adjusting the reported value for the qualified data to reflect the possible effect of the bias on the substance concentration, there is still a significant increase in contamination.
References Chain of Custody: Ref. 4, p. 162 Ref. 4, p. 162 Laboratory Results: Ref. 4, pp. 316-324 Ref. 4, pp. 333-343
Data: Ref. 4, pp. 181, 316-324 & 865; Ref. 31, pp. 5-14; Ref. 52
Ref. 4, pp. 185 & 187, 333-343 & 865; Ref. 31, pp. 5-14; Ref.52
46

SO-Source Characterization Source No.: 4
2.2.3 HAZARDOUS SUBSTANCES AVAILABLE TO A PATHWAY
Containment
Gas release to air: The air migration pathway was not scored; therefore, gas release to air containment was not evaluated. Particulate release to air: The air migration pathway was not scored; therefore, particulate containment was not evaluated. Release to ground water: The ground water pathway was not scored, therefore, ground water containment was not evaluated. Release via overland migration: There is was no functioning or maintained run-on or runoff management system (Ref. 24, p. 15). Surface water runoff from the LTU forms small puddles in the grass north of the unit (Ref. 24, p. 15). Runoff water flows into a drainage ditch that empties into the Mermentau River (Ref. 24, p. 107). The containment factor value for Source No. 4 is 10 (Ref. 1, Table 4-2).
Because containment for this source is greater than zero, the following substances associated with the source can migrate via the Surface Water Pathways (Ref. 1, Sec. 4.1.2.1.2.1.1):
• Acenaphthene • Acenaphthylene • Anthracene • Arsenic • Benzene • Benzo(a)anthracene • Benzo(a)pyrene • Benzo(b)fluoranthene • Benzo(g,h,i)perylene • Benzo(k)fluoranthene • Beryllium • Biphenyl, 1,1'- • Cadmium • Chrysene • Cyclohexane • Dibenzofuran
• Dichloroethene, cis-1,2- • Ethylbenzene • Fluoranthene • Fluorene • Indeno(1,2,3-cd)pyrene • Manganese • Methylcyclohexane • Methylnaphthalene, 2- • Naphthalene • Nickel • Phenanthrene • Phenol • Pyrene • Toluene • Vinyl Chloride • Xylene, -m, -p, -o
2.4.2 HAZARDOUS WASTE QUANTITY
2.4.2.1.1. Hazardous Constituent Quantity – Tier A
The total Hazardous Constituent Quantity for Source 4 could not be adequately determined according to the HRS requirements; that is, the total mass of all CERCLA hazardous substances in the source and releases from the source is not known and cannot be estimated with reasonable confidence (Ref. 1, pp.
47

SO-Source Characterization Source No.: 4
51590-51591, Section 2.4.2.1.1). Insufficient historical and current data (manifests, PRP records, State records, permits, waste concentration data, etc.) are available to adequately calculate the total or partial mass of all CERCLA hazardous substances in the source and the associated releases from the source. Therefore, there is insufficient information to calculate a total or partial Hazardous Constituent Quantity estimate for Source 4 with reasonable confidence.
Hazardous Constituent Quantity Value (S): Not Calculated Are the data complete for hazardous constituent quantity for this area? No
2.4.2.1.2. Hazardous Wastestream Quantity – Tier B
The total Hazardous Wastestream Quantity for Source 4 could not be adequately determined according to the HRS requirements; that is, the total mass of all hazardous wastestreams and CERCLA pollutants and contaminants in the source and releases from the source is not known and cannot be estimated with reasonable confidence (Ref. 1, pp. 51590-51591, Section 2.4.2.1.2). Insufficient historical and current data (manifests, PRP records, State records, permits, waste concentration data, etc.) are available to adequately calculate the total or partial mass of all CERCLA hazardous substances in the source and the associated releases from the source. Therefore, there is insufficient information to calculate a total or partial Hazardous Constituent Quantity estimate for Source 4 with reasonable confidence.
Hazardous Wastestream Quantity Value (S): Not Calculated Are the data complete for hazardous constituent quantity for this area? No
2.4.2.1.3. Volume – Tier C
Volume was not calculated by reason of Source No. 4 being a land treatment source type and the depth of contamination in the soil is unknown; therefore, it is not possible to adequately determine a source volume (Tier C) in cubic yards (yd3) (Ref. 1, Sec. 2.4.2.1.3, p. 51591). As a result, the evaluation of source volume proceeds to the evaluation of Tier D, source area (Ref. 1, Sec. 2.4.2.1.4, p. 51591).
Volume of Source (yd3): Not Calculated Volume Assigned Value: 0
2.4.2.1.4. Area – Tier D
The LTU was located approximately 200 feet northwest of water pit 1, and had approximate dimensions of 100 feet wide and 200 feet long when put into use (Ref. 24, pp. 15 & 107). In 1996 it was noted that the LTU had approximate surface dimensions of 190 feet x 93 feet (Ref. 6, p. 8). The LTU is currently covered with soil and no closure or post closure care measures have been enacted for the LTU (Ref. 4, p. 32; Ref. 24, p. 15). Using the most conservative estimate for the source area of the former LTU of 190 feet x 93, it occupied approximately 17,670 square feet (ft2) (Ref. 6, p. 8). The hazardous waste quantity evaluation equation for a land treatment unit is A/270 (Ref. 1, Table 2-5). The area source will be assigned an area hazardous waste quantity value of 65.44. 17,670 ft2/270 = 65.44
48

SO-Source Characterization Source No.: 4
Area of source (ft2): 17,670.00 Area Assigned Value: 65.44
References: Fig. 2; Ref. 1, Sec. 2.4.2.1.4 2.4.2.1.5. Source Hazardous Waste Quantity Value Source No. 4, Former Land Treatment Unit (LTU).
Measures Surface Water, Ground Water and Air Pathways
Tier A NC Tier B NC Tier C NC Tier D 65.44
Assigned Source Hazardous Waste Quantity Value (Ref. 1,
Sec. 2.4.2.1.5)
65.44
NC: Not Calculated The highest value assigned to either Tier A, Tier B, Tier C, or Tier D is assigned as the Source No. 4 Hazardous Waste Quantity Value (Ref. 1, Section 2.4.2.1.5). The highest value assigned is Tier D.
Source No. 4 Hazardous Waste Quantity Value: 65.44
49
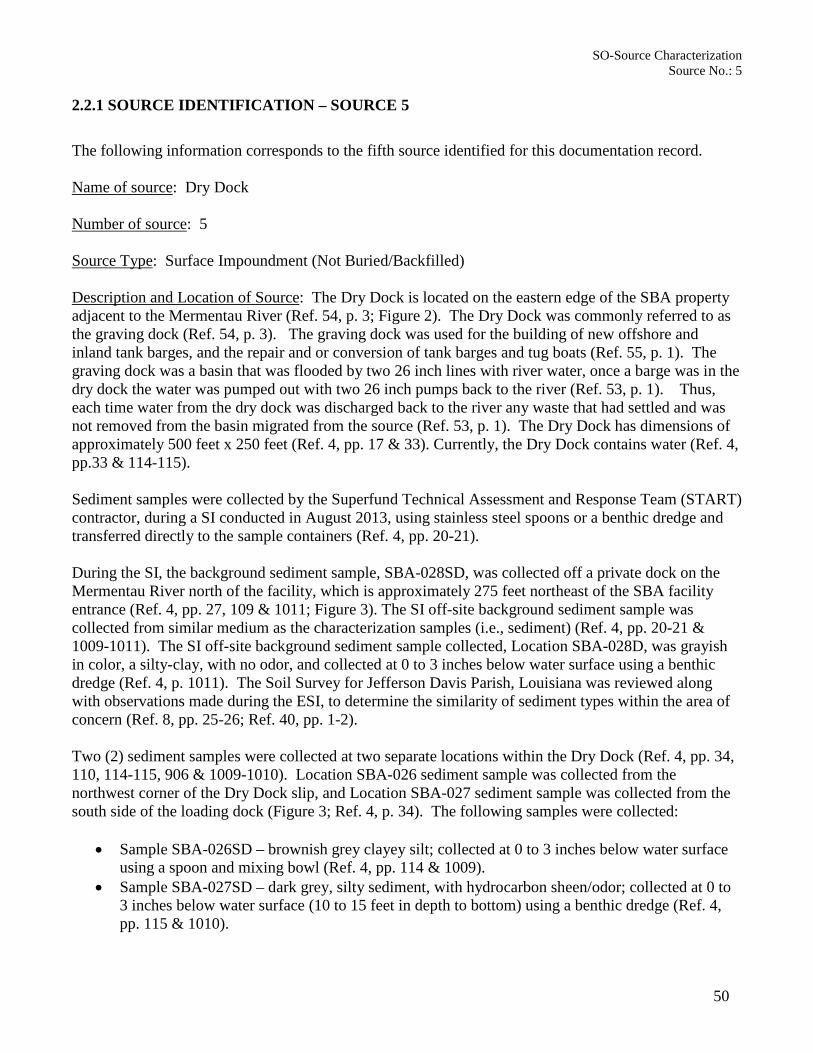
SO-Source Characterization Source No.: 5
2.2.1 SOURCE IDENTIFICATION – SOURCE 5
The following information corresponds to the fifth source identified for this documentation record. Name of source: Dry Dock Number of source: 5 Source Type: Surface Impoundment (Not Buried/Backfilled) Description and Location of Source: The Dry Dock is located on the eastern edge of the SBA property adjacent to the Mermentau River (Ref. 54, p. 3; Figure 2). The Dry Dock was commonly referred to as the graving dock (Ref. 54, p. 3). The graving dock was used for the building of new offshore and inland tank barges, and the repair and or conversion of tank barges and tug boats (Ref. 55, p. 1). The graving dock was a basin that was flooded by two 26 inch lines with river water, once a barge was in the dry dock the water was pumped out with two 26 inch pumps back to the river (Ref. 53, p. 1). Thus, each time water from the dry dock was discharged back to the river any waste that had settled and was not removed from the basin migrated from the source (Ref. 53, p. 1). The Dry Dock has dimensions of approximately 500 feet x 250 feet (Ref. 4, pp. 17 & 33). Currently, the Dry Dock contains water (Ref. 4, pp.33 & 114-115). Sediment samples were collected by the Superfund Technical Assessment and Response Team (START) contractor, during a SI conducted in August 2013, using stainless steel spoons or a benthic dredge and transferred directly to the sample containers (Ref. 4, pp. 20-21). During the SI, the background sediment sample, SBA-028SD, was collected off a private dock on the Mermentau River north of the facility, which is approximately 275 feet northeast of the SBA facility entrance (Ref. 4, pp. 27, 109 & 1011; Figure 3). The SI off-site background sediment sample was collected from similar medium as the characterization samples (i.e., sediment) (Ref. 4, pp. 20-21 & 1009-1011). The SI off-site background sediment sample collected, Location SBA-028D, was grayish in color, a silty-clay, with no odor, and collected at 0 to 3 inches below water surface using a benthic dredge (Ref. 4, p. 1011). The Soil Survey for Jefferson Davis Parish, Louisiana was reviewed along with observations made during the ESI, to determine the similarity of sediment types within the area of concern (Ref. 8, pp. 25-26; Ref. 40, pp. 1-2). Two (2) sediment samples were collected at two separate locations within the Dry Dock (Ref. 4, pp. 34, 110, 114-115, 906 & 1009-1010). Location SBA-026 sediment sample was collected from the northwest corner of the Dry Dock slip, and Location SBA-027 sediment sample was collected from the south side of the loading dock (Figure 3; Ref. 4, p. 34). The following samples were collected:
• Sample SBA-026SD – brownish grey clayey silt; collected at 0 to 3 inches below water surface using a spoon and mixing bowl (Ref. 4, pp. 114 & 1009).
• Sample SBA-027SD – dark grey, silty sediment, with hydrocarbon sheen/odor; collected at 0 to 3 inches below water surface (10 to 15 feet in depth to bottom) using a benthic dredge (Ref. 4, pp. 115 & 1010).
50

SO-Source Characterization Source No.: 5
Sediment samples SBA-026SD, SBA-027SD and SBA-028SD were sent to the U.S. EPA Laboratory in Houston for analysis, data review and data validation for Target Compound List (TCL) Volatile Organic Analysis (VOAs) by EPA method CLP SOW SOM01.2(method used -CLP OLM04.2 – GC/MS), TCL Semi-Volatile Organic Analysis (SVOAs) by EPA method CLP SOW SOM01.2 (method used - CLP OLM04.2 – GC/MS), TCL Pesticide/PCB by EPA method CLP SOW SOM01.2 (method used – CLP OLM04.2 – GC/ECD), TAL Cyanides by EPA method CLP SOW ILM05.4 (method used 335.4 – Colorimetric), and TAL Total Metals + Mercury by EPA method CLP SOW ILM05.4 (methods used - CLP ILM05.3 – ICP, CLP ILM05.3 – ICP/MS, CLP ILM05.3 – CVAAS) (Ref. 4, pp. 21-23, 47, 180, 244-251 & 389-404).
The sediment sample results from the source area were compared to the concentrations in the in the background sediment sample (Tables 7 and 8). Analysis of the sediments from the Dry Dock detected numerous PAHs, select metals and the chlorinated PCBs, Aroclor-1254 (Ref. 4, pp. 34 & 389-404; Table 7-8).
2.2.2 HAZARDOUS SUBSTANCES ASSOCIATED WITH THE SOURCE
Analysis of the sediments from within the Dry Dock detected various PAHs such as: acenaphthylene, anthracene, benzo(a)anthracene, benzo(a)pyrene, benzo(b)fluoranthene, benzo (k) fluoranthene. benzo(g,h,i)perylene, carbazole, chrysene, dibenzofuran, fluoranthene, fluorene, indeno(1,2,3-cd)pyrene, 2-methylnaphthalene, naphthalene, phenanthrene and pyrene above concentrations in background sediment levels (Tables 7-8). While the increase in concentration is not required to associate the substances with the source, it does demonstrate the level in the sediment samples are significantly above background. The constituents detected in the dry dock sediment samples are the same or similar to those detected in the waste sample collected from the Partially Buried Barge (Source 1) used in the barge cleaning process (Ref. 4, p. 34 & 389-404; Table 1). Metals detected included mercury, zinc, and arsenic while no volatile organic compounds (VOCs) were detected in the samples (Ref. 4, p. 70 & 389-404; Table 8). The chlorinated polychlorinated biphenyl (PCB), Aroclor-1254 was detected in sediment sample SBA-026SD (Ref. 4, pp. 70 & 396; Table 4).
51

SO-Source Characterization Source No.: 5
Table 7 - Background Sediment Samples
EPA/START Sample No.: SBA-28SD EPA Laboratory Sample No.: 1308016-03
Matrix: Sediment Background Unit: RL Result
% Solids 69.74 Analyte: SVOCs µg/Kg µg/Kg Acenaphthene 286 U Benzo (b) fluoranthene 715 U Benzo (g,h,i) perylene 715 U Benzo (k) fluoranthene 715 U Acenaphthylene 286 U Carbazole 715 U Chrysene 715 U Dibenzofuran 715 U Dibenz (a,h) anthracene 715 U Anthracene 286 U Fluoranthene 286 U Fluorene 286 U Indeno (1,2,3-cd) pyrene 715 U 2-Methylnaphthalene 286 U Naphthalene 286 U Phenanthrene 286 U Pyrene 286 U Benzo (a) anthracene 715 U Benzo (a) pyrene 715 U Analyte: Total Metals mg/kg mg/kg Barium 1.3 214 Chromium 1.3 8.1 Cobalt 2.5 6 Copper 2.5 6.1 Manganese 0.6 292 Mercury 0.07 U Nickel 2.5 7.4 Vanadium 2.5 16.7 Zinc 2.5 21.2 Lead 0.6 11.7 Arsenic 0.6 U Analyte: PCBs µg/Kg µg/Kg Aroclor-1254 23.4 U
Key: µg/Kg - Concentrations in micrograms per kilogram U - Undetected mg/Kg - Concentration in milligrams per kilogram SD- Sediment PCBs - Polychlorinated biphenyls RL - Reporting Limit
References Chain of Custody: Ref. 4, p. 160 Laboratory Results: Ref. 4, pp. 244-251
52

SO-Source Characterization Source No.: 5
Table 8 – Source 5 - Dry Dock Samples
EPA/START Sample No.: SBA-26SD SBA-27SD EPA Laboratory Sample No.: 1308018-14 1308018-15
Location (Source 5): Dry Dock W Dry Dock S % Solids: 45.52% 43.06%
Result RL 3x Bkgd. or > Bkgd. RL Result RL
3x Bkgd. or > Bkgd.
RL Unit: µg/kg µg/kg µg/kg µg/kg µg/kg µg/kg
Analyte: SVOCs Benzo (b) fluoranthene 12800 J (1280)* 1090 715 (RL) 8030 J (803)* 1140 715 (RL) Benzo (g,h,i) perylene 8210 J (821)* 1090 715 (RL) 6660 J (666)* 1140 715 (RL) Benzo (k) fluoranthene 10100 J (1010)* 1090 715 (RL) 6290 J (629)* 1140 715 (RL) Acenaphthylene 1690 438 286 (RL) 1160 458 286 (RL)
Carbazole 3460 J (346.0)* 1090 715 (RL) 50400 J (5040.0)* 11400 715 (RL)
Chrysene 10100 1090 715 (RL) 9090 1140 715 (RL) Dibenzofuran U 1090 715 (RL) 4270 1140 715 (RL) Dibenz (a,h) anthracene 1830 J (183)* 1090 715 (RL) 1320 J (132)* 1140 715 (RL) Anthracene 11000 438 286 (RL) 137000 4580 286 (RL) Fluoranthene 11600 438 286 (RL) 7280 4580 286 (RL) Fluorene 937 438 286 (RL) 12000 458 286 (RL) Indeno (1,2,3-cd) pyrene 7610 J (716)* 1090 715 (RL) 5630 J (563)* 1140 715 (RL) 2-Methylnaphthalene U 438 286 (RL) 2710 458 286 (RL) Naphthalene 1270 438 286 (RL) 3180 458 286 (RL) Phenanthrene 6260 438 286 (RL) 24200 4580 286 (RL) Pyrene 19000 438 286 (RL) 8210 458 286 (RL) Benzo (a) anthracene 8650 1090 715 (RL) 4030 1140 715 (RL) Benzo (a) pyrene 11000 J (1100)* 1090 715 (RL) 7480 J (748)* 1140 715 (RL) Analyte: Total Metals mg/kg mg/kg mg/kg mg/kg mg/kg mg/kg Mercury 0.109 0.095 0.07 (RL) 0.203 0.084 0.07 (RL) Zinc 73.8 3.7 63.6 (3x) 243 3.7 63.6 (3x) Arsenic 5.2 0.9 0.6 (RL) 3.8 0.9 0.6 (RL) Analyte: PCBs µg/kg µg/kg µg/Kg µg/kg µg/kg µg/kg Aroclor-1254 39.6 J 39.3 23.4 (RL) U 154 23.4 (RL)
Key: µg/kg - Concentrations in microgram per kilogram U - Undetected mg/kg - Concentrations in milligrams per kilogram SD - Sediment S - South W - West Bkgd. - Background sample RL - Reporting Limit J - The identification of the analyte is acceptable; The reported value is an estimate (Ref. 4, 865). The reported values for benzo (b) fluoranthene, benzo (g,h,i) perylene, benzo (k) fluoranthene, carbazole, dibenz (a,h) anthracene, indeno (1,2,3-cd) pyrene, and benzo (a) pyrene in samples SBA-026SD and SBA-027SD are biased unknown (Ref. 4, p. 181). The reported value for Arochlor-1254 in sample SBA-026SD is biased unknown (Ref. 4, p. 182). The presence of the substances is not in doubt. ( )* - The detected concentration was adjusted by using the guidance document "Using Qualified Data to Document an Observed Release and Observed Contamination" (Ref. 31, pp. 8, 14-16). After adjusting the reported value for the qualified data to reflect the possible effect of the bias on the substance concentration , there is still a significant increase in contamination. Bold - Concentration detected is significantly above the background concentration or greater than the background reporting limit.
References Chain of Custody: Ref. 4, p. 163 Ref. 4, p. 163 Laboratory Results: Ref. 4, pp. 389-396 Ref. 4, pp. 397-404
Data: Ref. 4, pp. 181-182, 244-251, 391-392, 396, & 865; Ref. 31, pp. 8, 14-16; Ref.52
Ref. 4, pp. 181-182, 244-251, 399-400, & 865; Ref. 31, pp. 8, 14-15; Ref. 52
53

SO-Source Characterization Source No.: 5
2.2.3 HAZARDOUS SUBSTANCES AVAILABLE TO A PATHWAY
Containment
Gas release to air: The air migration pathway was not scored; therefore, gas release to air containment was not evaluated. Particulate release to air: The air migration pathway was not scored; therefore, particulate containment was not evaluated. Release to ground water: The ground water pathway was not scored, therefore, ground water containment was not evaluated. Release via overland migration: There is no evidence that the Dry Dock had a liner. The Dry Dock appears to be an earthen berm enclosure reinforced with metal sheeting and bound with a 76 foot gate along the Mermentau River (Ref. 4, p.114; Ref. 7, p. 110; Ref. 54, p. 3). Contaminants were detected down gradient of the Dry Dock in the Mermentau River, due to seepage around or underneath the 76 ft gate in place or when the gate was opened. Also, Source No. 5 is designated by the Flood Insurance Rate Map (FIRM) as flood zones AE, and considered a Special Flood Hazard Area (SFHA). The SFHA is an area that would be inundated by flooding having a one (1) percent chance of being equaled or exceeded base flood level in any given year (Ref. 26, pp. 1-2). The containment factor value of 10 is assigned to Source No. 5 (Ref. 1, Table 4-2 & Table 4-9).
Because containment for this source is greater than zero, the following substances associated with the source can migrate via the Surface Water Pathways (Ref. 1, Sec. 4.1.2.1.2.1.1):
• Acenaphthylene • Anthracene • Aroclor-1254 • Arsenic • Benzo(a)anthracene • Benzo(b)fluoranthene • Benzo (k) fluoranthene • Benzo(g,h,i)perylene • Benzo(a)pyrene • Carbazole • Chrysene • Copper
• Dibenzofuran • Fluoranthene • Fluorene • Indeno (1,2,3-cd) pyrene • Manganese • Mercury • Methylnaphthalene, 2- • Naphthalene • Phenanthrene • Pyrene • Zinc
2.4.2 HAZARDOUS WASTE QUANTITY
2.4.2.1.1. Hazardous Constituent Quantity – Tier A
The total Hazardous Constituent Quantity for Source 5 could not be adequately determined according to the HRS requirements; that is, the total mass of all CERCLA hazardous substances in the source and
54
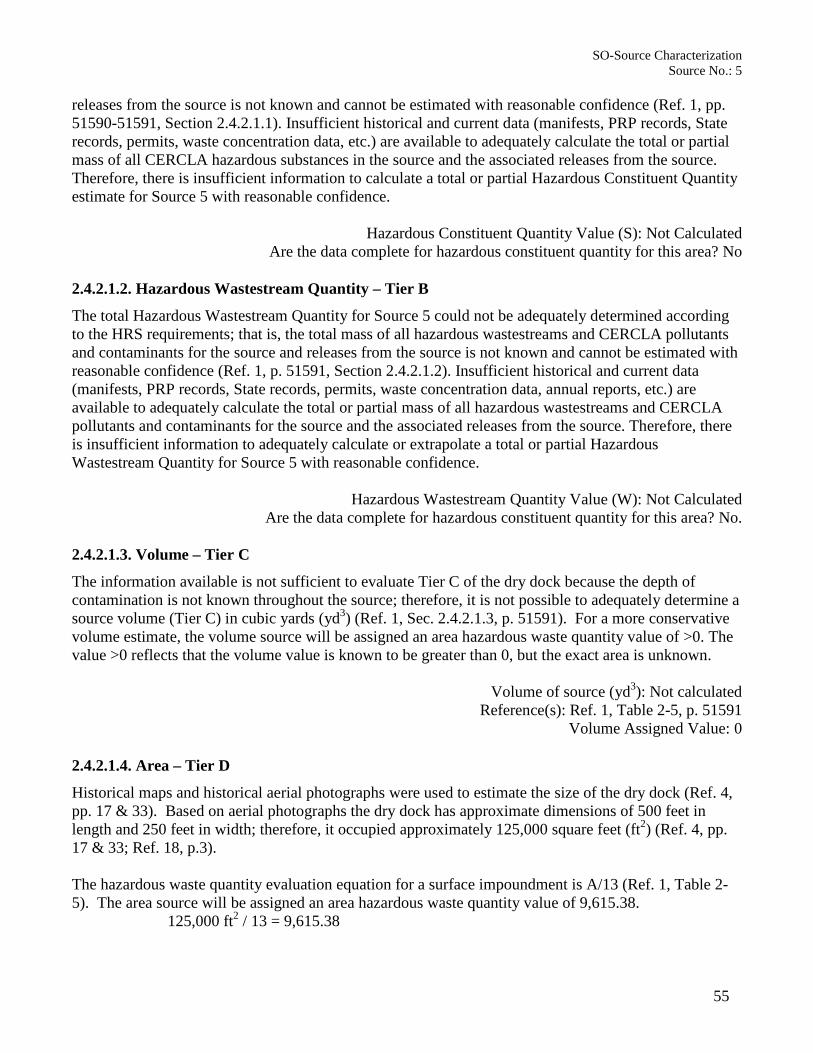
SO-Source Characterization Source No.: 5
releases from the source is not known and cannot be estimated with reasonable confidence (Ref. 1, pp. 51590-51591, Section 2.4.2.1.1). Insufficient historical and current data (manifests, PRP records, State records, permits, waste concentration data, etc.) are available to adequately calculate the total or partial mass of all CERCLA hazardous substances in the source and the associated releases from the source. Therefore, there is insufficient information to calculate a total or partial Hazardous Constituent Quantity estimate for Source 5 with reasonable confidence.
Hazardous Constituent Quantity Value (S): Not Calculated Are the data complete for hazardous constituent quantity for this area? No
2.4.2.1.2. Hazardous Wastestream Quantity – Tier B
The total Hazardous Wastestream Quantity for Source 5 could not be adequately determined according to the HRS requirements; that is, the total mass of all hazardous wastestreams and CERCLA pollutants and contaminants for the source and releases from the source is not known and cannot be estimated with reasonable confidence (Ref. 1, p. 51591, Section 2.4.2.1.2). Insufficient historical and current data (manifests, PRP records, State records, permits, waste concentration data, annual reports, etc.) are available to adequately calculate the total or partial mass of all hazardous wastestreams and CERCLA pollutants and contaminants for the source and the associated releases from the source. Therefore, there is insufficient information to adequately calculate or extrapolate a total or partial Hazardous Wastestream Quantity for Source 5 with reasonable confidence.
Hazardous Wastestream Quantity Value (W): Not Calculated Are the data complete for hazardous constituent quantity for this area? No.
2.4.2.1.3. Volume – Tier C
The information available is not sufficient to evaluate Tier C of the dry dock because the depth of contamination is not known throughout the source; therefore, it is not possible to adequately determine a source volume (Tier C) in cubic yards (yd3) (Ref. 1, Sec. 2.4.2.1.3, p. 51591). For a more conservative volume estimate, the volume source will be assigned an area hazardous waste quantity value of >0. The value >0 reflects that the volume value is known to be greater than 0, but the exact area is unknown.
Volume of source (yd3): Not calculated Reference(s): Ref. 1, Table 2-5, p. 51591
Volume Assigned Value: 0 2.4.2.1.4. Area – Tier D
Historical maps and historical aerial photographs were used to estimate the size of the dry dock (Ref. 4, pp. 17 & 33). Based on aerial photographs the dry dock has approximate dimensions of 500 feet in length and 250 feet in width; therefore, it occupied approximately 125,000 square feet (ft2) (Ref. 4, pp. 17 & 33; Ref. 18, p.3). The hazardous waste quantity evaluation equation for a surface impoundment is A/13 (Ref. 1, Table 2-5). The area source will be assigned an area hazardous waste quantity value of 9,615.38. 125,000 ft2 / 13 = 9,615.38
55

SO-Source Characterization Source No.: 5
Area of source (ft2): 125,000.00 References: Fig. 2; Ref. 1, Sec. 2.4.2.1.4
Area Assigned Value: 9,615.38 2.4.2.1.5. Source Hazardous Waste Quantity Value Source No. 5, Dry Dock.
Measures Surface Water, Ground Water and Air Pathways
Tier A NC Tier B NC Tier C NC Tier D 9, 615.38
Assigned Source Hazardous Waste Quantity Value (Ref. 1,
Sec. 2.4.2.1.5)
9, 615.38
NC: Not Calculated The highest value assigned to either Tier A, Tier B, Tier C, or Tier D is assigned as the Source No. 5 Hazardous Waste Quantity Value (Ref. 1, Section 2.4.2.1.5). The highest value assigned is Tier D.
Source No. 5 Hazardous Waste Quantity Value: 9,615.38
56

SO-Source Characterization Source No.: 6
2.2.1 SOURCE IDENTIFICATION – SOURCE 6 The following information corresponds to the sixth source identified for this documentation record. Name of source: Former Water Pit 3 Number of source: 6 Source Type: Surface Impoundment (Not Buried/Backfilled) Description and Location of Source: Surface impoundment located in the southeast portion of the property, adjoining a designated wetland area (Figure 2). Former Water Pit 3 was originally excavated to an approximate depth of 6 feet bgs around 1968, and the soils below the unlined Water Pit 3 consisted of clay to an approximately depth of 20 to 25 feet bgs (Ref. 24, p. 14). Water pit 3 was approximately 150 feet long, 50 feet wide and 6 feet deep in 1996 (Ref. 24, p. 14). Water Pit 3 was used to treat and store wastewater and sludges generated during the barge cleaning activities, with Water Pit 3 receiving wastewater from Water Pit 2 (Ref. 24, pp. 8 & 12-14). Subsequently, aboveground oil/water separators and storage tanks replaced the functions of the surface impoundments (Ref. 4, p. 13). In 1997, the inactive surface impoundment had approximately 600 cubic yards of sediment/sludge excavated and stacked alongside the surface impoundment (Ref. 6, p. 8). During storm events rainwater accumulates in the impoundment (Ref. 6, pp. 10). The impoundment formerly known as Water Pit 3 is located on the southeast portion of the property, bordering a designated wetland area (Figure 2). The dimensions were approximately 283 feet x 55 feet x 6 feet and contained water (Ref. 4, p. 30; Ref. 6, p. 8). According to the December 2002 IM/RA agreed order 750,000 gallons of water was pumped from Former Water Pit 3 (former water pit) to the drainage ditch that drains to the Mermentau River (Ref. 5, pp. 8, 20-21 & 24). The emptied Water Pit 3 (former water pit) was then used to receive treated storm water from the Partially Buried Barge (Ref. 5, pp. 8, 20 & 24). Approximately 100,000 gallons of treated storm water was left in Water Pit 3 (former water pit) (Ref. 5, pp. 8 & 21). Water Pit 3 (former water pit) was later closed by using a hydraulic excavator to break a wide gap in the earthen berm separating it from the Mermentau River bottomland directly east of the water pit (Ref. 5, pp. 8, 21). Upon removal of the segment of the earthen berm, water from the Mermentau River flowed into the Former Water Pit 3 (former water pit), raising the level of the water in the pit to approximately four (4) feet deep (Ref. 5, pp. 8, 21). Thus, linking Former Water Pit 3 with the designated wetland area to the immediate west (Figure 2).
Two (2) wetland sediment grab samples were collected from the Former Water Pit 3 area, which is now part of the wetlands to the east (Figure 3). During the SI of August 2013 one (1) sediment sample, SBA-032D, was collected using a benthic dredge, and during the ESI of September 2014 one (1) wetland sediment sample, SBA-ESA-10 was collected using a metal retrieval pole with a beaker attachment to a depth of 1-6 inches bgs (Ref. 4, pp. 117-118 & 1018; Ref. 7, p. 35-36 & 135-136). All grab samples were transferred directly into sample containers (Ref. 4, pp. 20-21; Ref. 7, pp. 36).
Grab wetland sediment samples were collected from locations of visual contamination (Ref. 4, pp. 31 & 117-118; Ref. 7, pp. 36, 135-136 & 164).
57

SO-Source Characterization Source No.: 6
Wetland sediment sample SBA-32SD was collected from the southwest corner of Former Water Pit 3 that is presently part of the wetland area, and sediment sample SBA-ESI-10SD was collected from approximately the southwest corner of Former Water Pit 3 that is currently part of the wetland area (Ref. 4, pp. 57, 117-118 & 1018; Ref. 7, pp. 50 & 135-136). The following samples were collected:
• Sample SBA-032SD –oily matrix; glades of oil; light gray; clayey; collected at 2 to 3 inches below ground surface (Ref. 4, pp. 117-118 & 1018).
• Sample SBA‐ESI‐10SD – noticeable hydrocarbon odor; contained a sizeable amount of organic debris; collected in the wetland near source 6 (Ref. 7, pp. 135-136, 164 & 976).
The wetland sediment sample results from Location SBA-032 were compared to the background sediment levels established from a wetland sediment sample collected south of the former facility operations, Location SBA-031 (Figure 3). Location SBA-031, Sample SBA-031SD was collected southwest of the source areas and is considered the background sample for the wetlands (Figure 3; Ref. 4, pp. 116 & 121-127). The wetland sediment sample results from Location SBA-ESI-10 was compared to the higher of the four background sediment levels established from two wetland sediment samples collected north of the former facility operations (Location SBA-ESI-01 and SBA-ESI-02), and two wetland sediment samples collected downstream of the former facility operations (Location SBA-ESI-08 and SBA-ESI-09) (Figure 3; Ref. 7, pp. 97-98, 101-102, 126-127, 133 & 967-968). Wetland sediment samples SBA-031SD and SBA-032SD was sent to the U.S. EPA Laboratory in Houston for analysis, data review and data validation for Target Compound List (TCL) Volatile Organic Analysis (VOAs) by EPA method CLP SOW SOM01.2(method used -CLP OLM04.2 – GC/MS), TCL Semi-Volatile Organic Analysis (SVOAs) by EPA method CLP SOW SOM01.2 (method used - CLP OLM04.2 – GC/MS), TCL Pesticide/PCB by EPA method CLP SOW SOM01.2 (method used – CLP OLM04.2 – GC/ECD), TAL Cyanides by EPA method CLP SOW ILM05.4 (method used 335.4 – Colorimetric), and TAL Total Metals + Mercury by EPA method CLP SOW ILM05.4 (methods used - CLP ILM05.3 – ICP, CLP ILM05.3 – ICP/MS, CLP ILM05.3 – CVAAS) (Ref. 4, pp. 21-23, 47, 632-647). Wetland sediment samples SBA-ESI-01, SBA-ESI-02, SBA-ESI-08, SBA-ESI-09 and SBA-ESI-10SD were shipped to the U.S. EPA Laboratory in Houston for analysis, data review and data validation for TCL SVOAs by EPA method CLP OLM04.2 – GC/MS (Ref. 7, pp. 22 & 632-647). Analysis of the background wetland sediment sample, SBA-031SD did not detect any organic or volatile organic constituents. Metals such as mercury, copper, manganese, nickel, vanadium, zinc, barium, chromium, lead and arsenic were detected above the reporting limits (Ref. 4, pp. 43 & 632-639; Table 9). In wetland sediment sample SBA-032SD PAHs such as acenaphthene, acenaphthylene, anthracene, benzo(a)anthracene, benzo(a)pyrene, benzo(b)fluoranthene, benzo(g,h,i)perylene, benzo(k)fluoranthene, chrysene, dibenzofuran, fluoranthene, fluorene, indeno(1,2,3-cd)pyrene, 2-methylnaphthalene,
58

SO-Source Characterization Source No.: 6
naphthalene, phenanthrene, and pyrene were detected at greater than background levels (Ref. 4, pp. 70, 642-644; Table 9). In addition, metal concentrations were detected at greater than background levels for beryllium and cobalt (Ref. 4, pp. 646-647; Table 9). While this increase in concentration is not required to associate the substances with the source, it does demonstrate the level in the source sample is significantly above background. Analysis of the background wetland sediment samples, SBA-ESI-01, SBA-ESI-02, SBA-ESI-08 and SBA-ESI-09 did not detect any semi-volatile organic constituents (Ref. 7, pp. 25, 34, 192-197 & 201-206; Table 10). PAHs were detected in wetland sediment sample SBA-ESI-10SD. PAHs such as acenaphthene, acenaphthylene, anthracene, benzo(a)anthracene, benzo(a)pyrene, benzo(b)fluoranthene, benzo(g,h,i)perylene, benzo(k)fluoranthene, chrysene, dibenz(a,h)anthracene, dibenzofuran, fluoranthene, fluorene, indeno(1,2,3-cd)pyrene, 2-methylnaphthalene, naphthalene, phenanthrene and pyrene were detected at greater than background sediment levels (Ref. 7, pp. 213-215; Table 10). While this increase in concentration is not required to associate the substances with the source, it does demonstrate the level in the waste sample is significantly above background. 2.2.2 HAZARDOUS SUBSTANCES ASSOCIATED WITH THE SOURCE
Analysis of the sediments from Former Water Pit 3 detected numerous PAHs such as: acenaphthene, acenaphthylene, anthracene, benzo(a)anthracene, benzo(a)pyrene, benzo(b)fluoranthene, benzo(g,h,i)perylene, benzo(k)fluoranthene, chrysene, dibenz(a,h)anthracene, dibenzofuran, fluoranthene, fluorene, indeno(1,2,3-cd)pyrene, 2-methylnaphthalene, naphthalene, phenanthrene, and pyrene (Ref. 4, pp. 640-647; Ref. 7, pp. 213-215; Tables 9 and 10). Metals such as beryllium and cobalt were also detected (Ref. 4, pp. 646-647). These constituents are also detected in other sources on site including the Dry Dock and Partially Buried Barge (Sources 5 and 1 respectively).
59

SO-Source Characterization Source No.: 6
Table 9 - Background and Source 6 (Former Water Pit 3) Wetland Samples From SI
EPA/START Sample No.: SBA-31SD SBA-32SD EPA Laboratory Sample No.: 1308020-26 1308020-27
Matrix: Background Sediment Wetland Sediment % Solids: 53.54% 62.29%
Units:
Result RL Result RL 3x Bkgd or > Bkgd RL
µg/kg µg/kg µg/kg µg/kg µg/kg Analyte: SVOC Acenaphthene U 367 7520 311 367 (RL) Benzo (b) fluoranthene U 918 12700 3890 918 (RL) Benzo (g,h,i) perylene U 918 7620 3890 918 (RL) Benzo (k) fluoranthene U 918 6900 3890 918 (RL) Acenaphthylene U 367 1150 311 367 (RL) Butyl benzyl phthalate U 918 U 778 918 Carbazole U 918 2540 J (254.0)* 778 918 (RL) Chrysene U 918 12800 3890 918 (RL) Dibenzofuran U 918 3340 778 918 (RL) Dibenz (a,h) anthracene U 918 2070 J (207.0)* 778 918 (RL) Anthracene U 367 21400 1560 367 (RL) Fluoranthene U 367 20300 1560 367 (RL) Fluorene U 367 10500 311 367 (RL) Indeno (1,2,3-cd) pyrene U 918 8830 3890 918 (RL) 2-Methylnaphthalene U 367 1880 311 367 (RL) Naphthalene U 367 786 311 367 (RL) Phenanthrene U 367 26600 1560 367 (RL) Pyrene U 367 21800 1560 367 (RL) Benzo (a) anthracene U 918 8910 3890 918 (RL) Benzo (a) pyrene U 918 13800 3890 918 (RL) Analyte: Total Metals mg/kg mg/kg mg/kg mg/kg mg/kg Beryllium U 0.7 0.7 0.7 0.7 (RL) Cobalt U 2.8 6.0 2.8 2.8 (RL)
Key: µg/kg = Concentrations in micrograms per kilogram RL - Reporting Limit mg/kg = Concentrations in milligrams per kilograms SD - Sediment Bkgd - Background U - Undetected J - The identification of the analyte is acceptable; The reported value is an estimate (Ref. 4, p. 865). The reported values for carbazole and dibenz (a,h) anthracene in sample SBA-32SD are biased unknown (Ref. 4, pp. 181, 642-643). * - The detected concentration was adjusted by using the guidance document "Using Qualified Data to Document an Observed Release and Observed Contamination" (Ref. 31, pp. 8 and 14). After Adjusting the value for the qualified data to reflect the possible effect of the bias on the substance concentration, there is still a significant increase in contamination. BOLD - concentration detected significantly above the background concentration or above the reporting limits.
References Chain of Custody: Ref. 4, p. 172 Ref. 4. p. 172 Laboratory Results: Ref. 4, pp. 632-639 Ref. 4. pp. 640-647
Data: Ref. 4, p. 181; 632-639 & 865; Ref. 31, pp. 8 & 14; Ref. 52
Ref. 4, p. 181; 642-643 & 865; Ref. 31, pp. 8 & 14; Ref. 52
60

SO-Source Characterization Source No.: 6
Table 10 - Background and Source 6 (Former Water Pit 3) Samples From ESI
EPA/START Sample No.: SBA-ESI-01SD SBA-ESI-02SD SBA-ESI-08SD SBA-ESI-09SD SBA-ESI-10SD EPA Laboratory Sample No.: 1409034-01SD 1409034-02SD 1409028-04SD 1409028-05SD 1409034-05SD
Sampling Location: SBA-ESI-01 SBA-ESI-02 SBA-ESI-08 SBA-ESI-09 SBA-ESI-10
Sample Description: Background Wetland
Sediment along the main shipping channel
Background Wetland Sediment along the
original river channel
Background Sediment along wetland boundary on right descending bank of river
Background Sediment along wetland boundary on left descending bank
of river
Wetland Sediment SE of Former Water Pit 3
% Solids: 67.42% 41.91% 35.36% 60.85% 26.10%
Units: Result RL Result RL Result RL Result RL Result RL
3x Bkgd or >
Bkgd RL
µg/kg µg/kg µg/kg µg/kg µg/kg µg/kg µg/kg µg/kg µg/kg µg/kg µg/kg Analyte: SVOCs 2-Methylnaphthalene 277 U 277 476 U 476 543 U 543 307 U 307 35,900 5,490 543 U Acenaphthene 277 U 277 476 U 476 543 U 543 307 U 307 250,000 5,490 543 U Acenaphthylene 277 U 277 476 U 476 543 U 543 307 U 307 46,400 5,490 543 U Anthracene 277 U 277 476 U 476 543 U 543 307 U 307 1,040,000 54,900 543 U Benzo (a) anthracene 693 U 693 693 U 693 1360 U 1360 768 U 768 664,000 137,000 1360 U Benzo (a) pyrene 693 U 693 693 U 693 1360 U 1360 768 U 768 507,000 137,000 1360 U Benzo (b) fluoranthene 693 U 693 1190 U 1190 1360 U 1360 768 U 768 484,000 137,000 1360 U Benzo (g,h,i) perylene 693 U 693 1190 U 1190 1360 U 1360 768 U 768 150,000 137,000 1360 U Benzo (k) fluoranthene 693 U 693 1190 U 1190 1360 U 1360 768 U 768 495,000 137,000 1360 U
Carbazole 693 U 693 1190 U 1190 1360 U 1360 768 U 768 16100 J (1610)* 13,700 1360 U
Chrysene 693 U 693 1190 U 1190 1360 U 1360 768 U 768 822,000 137,000 1360 U Dibenz (a,h) anthracene 693 U 693 1190 U 1190 1360 U 1360 768 U 768 61,900 54,900 1360 U Dibenzofuran 693 U 693 1190 U 1190 1360 U 1360 768 U 768 157,000 13,700 1360 U Fluoranthene 277 U 277 476 U 476 543 U 543 307 U 307 1,540,000 54,900 543 U Fluorene 277 U 277 476 U 476 543 U 543 307 U 307 510,000 54,900 543 U Indeno (1,2,3-cd) pyrene 693 U 693 1190 U 1190 1360 U 1360 768 U 768 167,000 137,000 1360 U Naphthalene 277 U 277 476 U 476 543 U 543 307 U 307 9,140 5,490 543 U Phenanthrene 277 U 277 476 U 476 543 U 543 307 U 307 1,590,000 54,900 543 U Pyrene 277 U 277 476 U 476 543 U 543 307 U 307 1,380,000 54,900 543 U
Key: µg/kg - Concentrations in micrograms per kilogram RL - Reporting Limit Bkgd - Background U - Undetected at Reporting Limit J - The identification of the analyte is acceptable; the reported value is an estimate (Ref. 7, p. 251). The reported value for carbazole in sample SBA-ESI-10SD is biased unknown (Ref. 7, p. 179). * - The detected concentration was adjusted by using the guidance "Using Qualified Data to Document an Observed Release and Observed Contamination" (Ref. 31, pp. 8 & 14). After adjusting the value for the qualified data to reflect possible bias, there is still a significant increase in contamination. BOLD - Concentration detected is significantly above the background concentration or the Reporting Limits.
References: Chain of Custody: Ref. 7, p. 170 Ref. 7, p. 170 Ref 7, p .169 Ref. 7, p. 169 Ref. 7, p. 170 Laboratory Results: Ref. 7, pp. 201-203 Ref. 7, pp. 204-206 Ref. 7, pp. 192-194 Ref. 7, pp. 195-197 Ref. 7, pp. 213-215
Data: Ref. 7, pp. 201-203; Ref. 52 Ref. 7, pp. 204-206; Ref. 52 Ref. 7, pp. 192-194; Ref. 52 Ref. 7, pp. 195-197; Ref.
52 Ref. 7, pp. 179, 213, & 251; Ref. 31, pp. 8 & 14; Ref. 52
61

SO-Source Characterization Source No.: 6
2.2.3 HAZARDOUS SUBSTANCES AVAILABLE TO A PATHWAY Containment
Gas release to air: The air migration pathway was not scored; therefore, gas release to air containment was not evaluated. Particulate release to air: The air migration pathway was not scored; therefore, particulate containment was not evaluated. Release to ground water: The ground water pathway was not scored, therefore, ground water containment was not evaluated. Release via overland migration: Upon removal of the segment of the earthen berm, water from the Mermentau River flowed into the Former Water Pit 3, raising the level of the pit to approximately four (4) feet deep (Ref. 5, pp. 8, 20-21 & 24). Thus, making the former surface impoundment combined with the designated wetland area to the immediate west (Figure 2). In addition, there is no evidence to indicate the former source had an artificial liner since Water Pit 3 consisted of a local (native) clay bottom (Ref. 24, pp. 8 & 107). Also, Source No. 6 is designated by the Flood Insurance Rate Map (FIRM) as flood zones AE, and considered a Special Flood Hazard Area (SFHA). The SFHA is an area that would be inundated by flooding having a one (1) percent chance of being equaled or exceeded base flood level in any given year (Ref. 26, pp. 1-2). The containment factor value of 10 is assigned to Source No. 6 (Ref. 1, Table 4-2).
Because containment for this source is greater than zero, the following substances associated with the source can migrate via the Surface Water Pathways (Ref. 1, Sec. 4.1.2.1.2.1.1):
• Acenaphthene • Acenaphthylene • Anthracene • Benzo(a)anthracene • Benzo(a)pyrene • Benzo(b)fluoranthene • Benzo(g,h,i)perylene • Benzo(k)fluoranthene • Beryllium • Chrysene
• Cobalt • Dibenz(a,h)anthracene • Dibenzofuran • Fluoranthene • Fluorene • Indeno(1,2,3-cd)pyrene • Methylnaphthalene, 2- • Naphthalene • Phenanthrene • Pyrene
2.4.2 HAZARDOUS WASTE QUANTITY 2.4.2.1.1. Hazardous Constituent Quantity – Tier A
The total Hazardous Constituent Quantity for Source 6 could not be adequately determined according to the HRS requirements; that is, the total mass of all CERCLA hazardous substances in the source and releases from the source is not known and cannot be estimated with reasonable confidence (Ref. 1, pp.
62

SO-Source Characterization Source No.: 6
51590-51591, Section 2.4.2.1.1). Insufficient historical and current data (manifests, PRP records, State records, permits, waste concentration data, etc.) are available to adequately calculate the total or partial mass of all CERCLA hazardous substances in the source and the associated releases from the source. Therefore, there is insufficient information to calculate a total or partial Hazardous Constituent Quantity estimate for Source 6 with reasonable confidence.
Hazardous Constituent Quantity Value (S): Not Calculated Are the data complete for hazardous constituent quantity for this area? No
2.4.2.1.2. Hazardous Wastestream Quantity – Tier B
The total Hazardous Wastestream Quantity for Source 6 could not be adequately determined according to the HRS requirements; that is, the total mass of all hazardous wastestreams and CERCLA pollutants and contaminants for the source and releases from the source is not known and cannot be estimated with reasonable confidence (Ref. 1, p. 51591, Section 2.4.2.1.2). Insufficient historical and current data (manifests, PRP records, State records, permits, waste concentration data, annual reports, etc.) are available to adequately calculate the total or partial mass of all hazardous wastestreams and CERCLA pollutants and contaminants for the source and the associated releases from the source. Therefore, there is insufficient information to adequately calculate or extrapolate a total or partial Hazardous Wastestream Quantity for Source 6 with reasonable confidence.
Hazardous Wastestream Quantity Value (W): Not Calculated Are the data complete for hazardous constituent quantity for this area? No.
2.4.2.1.3. Volume – Tier C
The volume of Source 6 can be adequately determined based on a one time capacity volume, and not the actual contents of the source (Ref 1, Sec. 2.4.2.1.3). According to the December 2002 IM/RA agreed order the Former Water Pit 3 was closed by using a hydraulic excavator to break a wide gap in the earthen berm separating it from the Mermentau River bottomland directly east of the water pit (Ref. 5, p. 21). Upon removal of the segment of the earthen berm, water from the Mermentau River flowed into Water Pit 3, raising the level of the water in the pit to approximately four (4) feet deep (Ref. 5, pp. 8, 21). Thus, linking the Former Water Pit 3 with the designated wetland area to the immediate west (Figure 2). In addition, there is no evidence to indicate Former Water Pit 3 (former water pit) was lined with an artificial liner, since the impoundment consisted of a local (native) clay bottom (Ref. 24, pp. 8 & 107). Based on the IM/RA information available the one time volume capacity volume can be determined for Former Water Pit 3 (surface impoundment). The dimensions for Former Water Pit 3 are approximately 283 feet x 55 feet x 6 feet; therefore, it occupied approximately 93,390 cubic feet (ft3) (Ref. 4, pp. 16 & 30; Ref. 6, p. 8; Figure 2). The most common value used for cubic yards to cubic feet volume conversion is 1 yd3 = 27 ft3. The estimated source volume of Former Water Pit 3 is 3,458.89 yd3. 93,390 ft3 / 27 ft3 per 1 yd3 = 3,458.89 yd3
63

SO-Source Characterization Source No.: 6
The hazardous waste quantity evaluation equation for a surface impoundment is V/2.5 (Ref. 1, Table 2-5). The volume source will be assigned a volume hazardous waste quantity value of 1,383.56. 3,458.89 yd3 / 2.5 = 1,383.56
Volume of Source (yd3): 3,458.89 Reference(s): Ref. 1, Table 2-5, p. 51591
Volume Assigned Value: 1,383.56 2.4.2.1.4. Area – Tier D
Area was not calculated by reason of Source 6 yielding a volume that can be assigned a value. Therefore, area is assigned a value of 0 and scoring will be based on the evaluation of volume according to the HRS (Ref. 1, Sec. 2.4.2.1.3).
Area of source (ft2): Not calculated Area Assigned Value: 0
2.4.2.1.5. Source Hazardous Waste Quantity Value Source No. 6, Water Pit 3.
Measures Surface Water, Ground Water and Air Pathways
Tier A NC Tier B NC Tier C 1,383.56 Tier D NC
Assigned Source Hazardous Waste Quantity Value (Ref. 1,
Sec. 2.4.2.1.5)
1,383.56
NC: Not Calculated The highest value assigned to either Tier A, Tier B, Tier C, or Tier D is assigned as the Source No. 6 Hazardous Waste Quantity Value (Ref. 1, Section 2.4.2.1.5). The highest value assigned is Tier C.
Source No. 6 Hazardous Waste Quantity Value: 1,383.56 2.4.2.2.5 Calculation of Hazardous Waste Quantity Factor Value
64

SO-Summary Other Possible Sources
SITE SUMMARY OF SOURCE DESCRIPTIONS
Containment
Source No.
Source Hazardous Waste Quantity Value
Ground Water
Surface Water
Air
Surface Water Migration Pathway
Soil Exposure Pathway
Gas Air Particulate
1 1,827.79 NS NS 10 NS NS 3 882.69 NS NS 10 NS NS 4 65.44 NS NS 10 NS NS 5 9,615.38 NS NS 10 NS NS 6 1,383.56 NS NS 10 NS NS
Total 13,744.86 NS: Not Scored
September 2016
Other Possible Sources
Other possible sources at SBA include a buried barge/associated alkyne storage tank pump house, a former oil pit, and stained soils (Figure 2). The buried barge and associated alkyne storage tank pump house are located on the eastern portion of the property, south of the barge slip and west of the partially buried barge (Figure 2). The tank and equipment were used in the barge cleaning process, but not part of the RCRA facility investigation study performed in 1996. Contents of the alkyne storage pump house have been observed leaking into the wetlands located to the southwest and are evident by the stained soils west of the buried barge (Ref. 4, pp. 34-35 & 135-140; Ref. 7, pp. 27, 40-41 & 94-95). During the 2013 SI one sludge sample Location SBA-038, was collected from southwest corner of the tank area (Ref .4, pp. 34, 57, 135-139 & 1024). Again in 2014, during the ESI another sample was collected from the stained soil observed near the alkyne storage tank building, Location SBA-ESI-14 (Ref. 7, pp. 27, 50, 94-95 & 980). Hazardous substances related to the buried barge and associated alkyne storage tank pump house are numerous PAHs and the chlorinated PCB, Aroclor-1254 (Ref. 4, p. 35, 70-71 & 218-225). Hazardous substances related to the stained soils originating from the buried barge and alkyne storage tank pump house are Chlorinated Dibenzo-p-Dioxins (CDDs) and Chlorinated Dibenzofurans (CDFs) (Ref. 7, pp. 27, 40-41, 57 & 279-282). In October 2014, two samples were collected to assess the contents of the buried barge, the threat posed to the nearby wetland and the Mermentau River, and the necessary steps to mitigate that threat (Ref. 38, p. 2). Samples collected from the barge indicated results of elevated concentrations of Polycyclic Aromatic Hydrocarbons (PAH) and Total Petroleum Hydrocarbons (TPH) in the form of diesel (DRO) and motor oil range organics (ORO). Sample results confirmed that the removal should be funded as an Oil Pollution Act (OPA) removal action (Ref. 38, p. 2). In May and June of 2015 an OPA removal was performed on the buried barged and associated alkyne storage tank pump house to remove the oily water waste that had been observed leaking (Ref. 38, p. 2).
65

SO-Summary Other Possible Sources
In June 2015, a composite sample of sludge was taken from three hatch openings on the north side of the buried barge, and a grab sample was taken from the diesel tank inside the barge for laboratory analysis and characterization of contents. Removal and offsite disposal of sludge contents that remained in the buried barge was postponed until sample characterization was complete (Ref. 38, p. 3). CERCLA wastes were identified in the analytical results of the sludge taken from the barge and diesel tank inside the barge (Ref. 38, pp. 3 & 5; Ref. 39, pp. 6-17). Thus, additional CERCLA wastes identified at the site will be addressed using CERCLA funding and authority (Ref. 38, p. 5). The former oil pit is a former surface impoundment located in the southeast portion of the property, northwest of a designated wetland area (Figure 2; Ref. 16, p. 2). The former oil pit was originally excavated to approximately 18 feet deep circa 1968, and the soils below the unlined impoundment consisted of clay to a depth of 20 – 25 feet below ground surface (bgs) (Ref. 24, p. 8). Waste from the barge cleaning services at SBA that were stored in the former oil pit mainly consisted of hydrocarbons residues (Ref. 6, p. 10). A partially buried barge tank used for sludge storage (Source 1) was adjoining and positioned on the lower west side of the Oil Pit (Ref. 16, p. 2; Ref. 24, p. 12). The sludge storage tank was a converted barge that was sealed, overturned, and tested for leaks before entering service (Ref. 24, p. 14). The tank was used to store sludge from the other tanks and impoundments, and had observed leaks on the west side of the barge (Ref. 24, p. 14). Subsequently, aboveground oil/water separators and storage tanks replaced the functions of the surface impoundments (Ref. 6, p. 10). The former oil pit contained oils, waxes and sludges (Ref. 5, p. 10). There is no evidence to indicate the former oil pit was lined since it consisted of a clay bottom (Ref. 24, p.107). The former oil pit also had minimal containment when in operation in the form of a 5 foot berm above the surrounding ground surface on the north perimeter of the former oil pit (Ref. 24, p. 8). The former oil pit underwent an IM/RA under RCRA in accordance with the December 2002 IM/RA agreed order (Ref. 5, p. 6). During the IM/RA, a stabilizing agent was mixed into oily material in the Former Oil Pit, allowed to cure for a minimum of three days, and later excavated from the oil pit until underlying clayey soils showed no staining (Ref. 5, pp. 15 & 57-59). Excavated material from the oil pit was temporarily stockpiled on-site in a bermed area lined with plastic sheeting (Ref. 5, pp. 15 & 60-63). The oil pit was excavated of an estimated 11,954 tons of oily material, and portions of the former oil pit were backfilled with clean clay soil and fill material acquired onsite from unaffected areas southwest of the former oil pit (Ref. 5, pp. 7, 16, 64 & 86-87). In addition, 4,119 tons of clean fill soil and 15 tons of roadbed gravel were imported from off-site (Ref. 5, p. 7). Storm water control berms around the temporary stockpiles diverted and collected water that came into contact with uncovered oily materials into the open excavation of the Former Oil Pit (Ref. 5, p.15). Storm water that collected in the excavated former oil pit was pumped to the partially buried barge, but there is no indication further excavation was completed after the removal of storm water (Ref. 5, p. 19). A 1994 report recorded that the impoundment formerly known as the oil pit had estimated dimensions of 100 feet long, 75 feet wide and 18 feet deep (Ref. 24, p. 8). In a work plan dated 1996, the oil pit’s dimensions were given as approximately 160 feet x 100 feet x 6 feet, and the pit was estimated to contain approximately 3,600 cubic yards of oily sludge (Ref. 4, p. 30; Ref. 6, p.7). During the August 2013 EPA SI soil borings were advanced using direct push technology at two (2) locations near the former oil pit area (Ref. 4, pp. 57; Figure 3). The borings were advanced to a maximum depth of 16 feet bgs using the procedures in the EPA Environmental Response Team (ERT)
September 2016 66

SO-Summary Other Possible Sources
Standard Operating Procedure (SOP) 2050, modified for the actual unit used by the driller (Ref. 4, pp. 20, 149 & 934-946). Grab soil samples were collected from each boring from intervals of visual contamination, or where photoionization detector (PID) readings for VOCs above background were detected (Ref. 4, pp. 20, 893 & 934-946). Sample location SBA-003 was near the northern edge of the Former Oil Pit, and sample location SBA-009 was in the area of concern for the former sludge storage tank located on the west side of the former oil pit (Figure 3). The following samples were collected (Ref. 4, pp. 30-31, 57):
• Sample Location SBA-003 Sample SBA-003-68 (6-8 feet bgs) – chemical odor • Sample SBA-003WT (10-12 feet bgs) –collected above water table; chemical odor • Sample SBA-009-02 (0-2 feet bgs) – asphalt like material, slight odor • Sample SBA-009WT (12-14 feet bgs) – collected above water table; chemical odor
PAHs such as acenaphthene, acenaphthylene, anthracene, benzo(a)anthracene, benzo(a)pyrene, benzo(b)fluoranthene, benzo(g,h,i)perylene, benzo(k)fluoranthene, 1,1’-biphenyl, chrysene, carbazole, dibenz(a,h)anthracene, dibenzofuran, fluoranthene, fluorene, indeno(1,2,3-cd)pyrene, 2-methylnaphthalene, naphthalene, phenanthrene, phenol, and pyrene were detected. These constituents were also detected in other sources at SBA including the Dry Dock and Partially Buried Barge (Sources 6 and 1, respectively). In addition, numerous volatile organic compounds (VOCs) such as benzene, cyclohexane, methylcyclohexane, 1,2-dichlorobenzene, ethylbenzene, tetrachloroethene, styrene, isopropylbenzene, tetrachloroethene, xylene, cis-1,2-dichloroethane, and toluene were detected. Metal concentrations included manganese and cadmium (Ref. 4, pp. 31, 564-581 & 608-623). During historical sampling events prior to IM/RA removal activities additional samples were collected from the oil pit. These included:
• Sludge from the oil pit sampled November 22, 1989. • Sludge from the oil pit sampled August 24-25, 1994. • Sludge from the oil pit sampled October 25, 1995 (Ref. 6, pp. 18-19).
Volatile organic compounds detected included benzene, ethylbenzene, toluene, xylenes, chloroform, carbon tetrachloride, 1,2-dichloroethane, 1,1,1-trichloroethane, trichloroethene, tetrachloroethene. Semivolatile organic compounds detected included acenaphthene, acenaphthylene, anthracene, benzo(a)anthracene, benzo(a)pyrene, benzo(ghi)perylene, benzo(k)fluoranthene, chrysene, fluoranthene, fluorine, indeno(1,2,3-cd)pyrene, naphthalene, phenanthrene, and pyrene. Metals including cadmium were also detected (Ref. 6, pp. 19-21, 49, 52-54, 57). Another potential source at SBA include contaminated soil located in an area south of Source No. 3 (water pit 1) and west of the former oil pit (Figure 2). The contaminated soil, as delineated by samples SBA-005, SBA-006, SBA-010, and SBA-011, is located south of where wastes from the barge cleaning operations were managed in a waste management area that included the former oil pit. Water Pit 2, a land treatment unit (LTU) and storage tanks (Figure 3). Six soil samples were collected from three locations in this locale during the 2014 SI, Location SBA-006, SBA-010 and SBA-011(Figure 3; Ref. 4, pp. 31, 57, 988-989 & 995-998). The following samples were collected:
September 2016 67

SO-Summary Other Possible Sources
• Location SBA-006, Sample SBA-006-24: Collected approximately 2-4 feet bgs; clay; grey-ish tan with dark streaks; PID: 0.4 ppm; Visible hydrocarbon, oil material (Ref. 4, p. 988)
• Location SBA-006, Sample SBA-006-WT: Collected approximately 14-16 feet bgs and above the water table; clay with some silt, tan, orange mottled; PID: 7.8 ppm; no visible hydrocarbon, oil material (Ref. 4, p. 989).
• Location SBA-010, Sample SBA-010-PD: Collected approximately 6-8 feet bgs at the highest PID reading, 2.9 parts per million (ppm); silty clay; reddish brown; no visible hydrocarbon, oil material (Ref. 4, p.995).
• Location SBA-010, Sample SBA-010-WT: Collected approximately 8-10 feet bgs above the water table; sand-silt and clay; reddish-brown; no visible hydrocarbon, oil material (Ref. 4, p.996).
• Location SBA-011,Sample SBA-011-PD: Collected approximately 8-10 feet bgs at the highest PID reading; silt; tan; loose soft dry; no visible hydrocarbon, oil material (Ref. 4, p, 997)
• Location SBA-011, Sample SBA-011-WT: Collected approximately 8-10 feet bgs above the water table; clay; orange/tan mottled; dense plastic; no visible hydrocarbon, oil material (Ref. 4, p. 998).
Hazardous substances associated with the soil samples collected south of the former oil pit, Water Pit 2, a land treatment unit (LTU) and storage tanks are PAHs, VOCs and various metals at depths ranging from 2 to 4 feet, 6 to 8 feet, 8 to 10 feet and 14 to 16 feet bgs (Ref. 4, pp. 74-79, 344-359 & 492-526). Although there is no evidence to indicate that this area was used in the management of waste during barge cleaning operations at SBA, these constituents are also detected in surrounding units that were used as waste management areas at SBA during operations including the former oil pit, Water Pit 1 (Source No. 3), and the Land Treatment Unit (LTU) (Source No. 4).
September 2016 68

SWOF-Surface Water Overland Flow/Flood Migration Component Observed Release
SURFACE WATER MIGRATION PATHWAY
4.1 OVERLAND/FLOOD MIGRATION COMPONENT
4.1.1.1 Definition of Hazardous Substance Migration Path for Overland/Flood Component
General Considerations:
Four probable points of entries (PPEs) have been identified:
• PPE 1 is a zone located on the eastern portion of the SBA property along the man-made structure between the dry dock and Mermentau River (Figure 4).
• PPE 2, located directly north of the partially buried barge is a zone where the overland flow meets the barge slip, is also located on the eastern portion of the property and a probable entry point from Source No. 1. (Figure 4).
• PPE 3 is a segment along where the partially buried barge and former water pit 3 (Sources No.1 & 6), have been reported to have discharged into the adjacent wetlands along a perennial drainage ditch which runs on the property from the northwest, through the wetlands and drains to the Mermentau River (Ref. 6, p. 13; Ref. 20, pp. 4 & 5; Ref. 24, pp. 5, 10 & 128; Figure 4). Surface run-off from Sources No. 3 & 4 eventually flow into a segment of PPE-3 , the depressed area of the drainage ditch that flows through the wetland that drains to the Mermentau River (Ref. 24, p. 5,107 & 128; Ref. 20, pp. 4-5; Figure 5).
• PPE 4 is a zone located along the eastern edge of former water pit 3 (Source No. 6) (Figure 4). The former water pit 3 was closed by using a hydraulic excavator to break a wide gap in the earthen berm separating it from the Mermentau River bottomland directly east of the water pit (Ref. 5, pp. 8 & 21). Upon removal of the segment of the earthen berm, water from the Mermentau River flowed into the former water pit 3, raising the level of the water in the pit to approximately four (4) feet deep (Ref. 5, pp. 8, 21 & 24). Thus, linking the former surface impoundment with the designated wetland area to the immediate west (Figure 2).
Contamination could have entered the Mermentau River anywhere along the boundary of the perennial drainage ditch, wetlands, barge slip or dry dock and PPE 1 releases directly to the Mermentau River from the dry dock (Source No. 5). The migration route of all sources and PPEs eventually flow toward and into the Mermentau River (Figure 5). From this point, PPE 1, the Mermentau River flows for approximately 10.2 miles until it enters Lake Arthur. The remainder of the 15-mile Target Distance Limit (TDL) for the surface water migration pathway is located in Lake Arthur (Figure 6).
Surface Water Pathway Description for Each Source Source
No Pathway Description PPE
1 A Partially Buried Barge located on the southeast portion of the property, north of a designated wetland area. Distance to the PPE-2 is approximately 25 feet and distance to PPE-3 is approximately 35 feet (Ref. 5, p . 24; Figure 2 & 4)
PPE 2 Zone adjacent to the Barge Slip that is part of the Mermentau River. PPE 3: A segment of the drainage ditch that flows through the Palustrine Forested Wetlands contiguous with Mermentau River.
3 Former Water Pit 1 located on the southeast portion of the property, northwest of a designated wetland area. Distance to the PPE is approximately 122 feet (Ref. 24, p.
PPE 3: A segment of the drainage ditch that flows through the Palustrine Forested Wetlands contiguous with Mermentau River.
September 2016 69

SWOF-Surface Water Overland Flow/Flood Migration Component Observed Release
Surface Water Pathway Description for Each Source 12; Figure 2 & 4)
4 A former LTU located west of Source No. 3 on the southeast portion of the property, northwest of a designated wetland. Distance to the PPE is approximately 261 feet (Ref. 24, p. 12; Figure 2 & 4)
PPE 3: A segment of the drainage ditch that flows through the Palustrine Forested Wetlands contiguous with Mermentau River.
5 A Dry (Graving) Dock is located on the eastern edge of the property adjacent to the Mermentau River (Ref. 5, p. 24; Figure 2 & 4)
PPE 1: A zone of water flow around/under the man-made structure along the east side of the dry dock.
6 Former Water Pit 3 located on the southeast portion of the property, bordering a designated wetland area to the east. Distance to the PPE-3 is approximately 71 feet. (Ref. 24, p. 12; Figure 2 & 4)
PPE 3: A segment of the drainage ditch that flows through the Palustrine Forested Wetlands contiguous with Mermentau River. PPE 4 A zone along the Palustrine Forested Wetlands contiguous with Mermentau River.
Definition of In-Water Segments The in-water segment of the 15 mile TDL consists of the most upstream point of PPE 1 and the most downstream point of PPE 4, from which the 15 mile TDL starts. The Mermentau River flows for approximately 10.2 miles of the 15 mile TDL until it enters Lake Arthur (Figure 6). Segment 1 Mermentau River, consisting of the branch segments which include PPE 1, the barge slip and the wetlands to sample location SBA-030, flows for approximately a quarter mile of the 15 TDL (Figure 5). PPEs 2, 3 and 4 flow into this segment. A United States Geological Survey (USGS) gauging station 08012150, located in Jefferson Davis Parish in Mermentau, Louisiana has an average annual flow rate of the Mermentau River as measured for water years 1990 through 2015 of 1,976 cubic feet per second (cfs) (Ref. 11, pp. 1-2). USGS gauging station, 08012150, is located approximately 3.0 miles upstream of site on the Mermentau River at latitude 30o 11'24.00" North and longitude 92o 35' 26.00" West (Ref. 11, p. 1). A large stream to river with an average stream flow greater than 1,000 cfs to 10,000 cfs receives a dilution value of 0.001 (Ref. 1, Table 4-13). The Mermentau consists of an upper and lower portion. The Mermentau at the upper end of Lake Arthur is considered the upper Mermentau River and the lower Mermentau River is located at the lower end of Grand Lake (Ref. 17, pp. 3 & 8). During low flows the hydraulic system of the lower Mermentau River is affected by water levels in the Gulf of Mexico and by operation of several Corp of Engineer control structures in the lower Mermentau Basin (Ref. 17, p. 10). The lower Mermentau River is tidal downstream of the Catfish Point Control Structure, at the outlet of Grand Lake into the lower Mermentau River (Ref. 27, p. 11). During low river flows the system upstream of the closed control structures can be viewed as a large storage basin with no tidal influence, and at higher river flows when the structures are opened tidal effects are temporarily reduced in a local portion of the system (Ref. 27, p. 11). When Gulf water levels are abnormally high tidal influences and salinity intrude through the myriad of small bayous and canals, this intrusion has a minor influence on the primary lakes and inland waterways (Ref. 27, p.11). The upper Mermentau River lies north of the designated Louisiana saltwater line definition provided by Louisiana Department of Wildlife and Fisheries (LDWF) (Ref. 14, p. 16).
70

SWOF-Surface Water Overland Flow/Flood Migration Component Observed Release
Segment 2 The remainder of the 15-mile TDL surface water migration pathway starts at and continues into Lake Arthur. No published average flow data is available for Lake Arthur. The flow rate at the target location was assigned a dilution weight based on the sum of the average annual flows for the headwaters of Bayou Lacassine near Lake Arthur and the Mermentau River (Ref. 11, pp. 1-2; Ref. 12, pp. 1-2). According to gauging station 08012470 located at Bayou Lacassine near Lake Arthur, Louisiana the average annual flow rate of Bayou Lacassine as measured for water year 1988 through 2005 is 594 cfs. Lake Arthur will be assigned the average flow rate of 2,570 cfs, based on Bayou Lacassine average annual flow rate and the Mermentau River average flow rate. Thus, this segment will be considered to be a large stream to river and will be assigned a dilution value of 0.001 (Ref. 1, Table 4-13). 4.1.2.1 Likelihood of Release
4.1.2.1.1 Observed Release
Direct Observation: Two (2) sediment samples were collected, one during the August 2013 SI and the other during the September 2014 ESI, to identify and assess the migration and observed release by direct observation of contamination in the surface water pathway from Former Water Pit 3 (Source No. 6) and associated with PPE 4 (Figures 3 & 4). Former Water Pit 3 was closed according to the December 2002 IM/RA by using a hydraulic excavator to break a wide gap in the earthen berm separating it from the Mermentau River bottomland directly east of the water pit (Ref. 5, pp. 8 & 21). Upon removal of the segment of the earthen berm, water from the Mermentau River flowed into Former Water Pit 3 (former water pit), raising the level of water in the pit to approximately four (4) feet deep (Ref. 5, pp. 8, 21 & 24). Thus, making Former Water Pit 3 combined with the designated wetland area to the immediate west and being designated not only as a source but an observed release by direct observation to the wetlands based on prior documentation of contamination in Water Pit 3 (Ref. 4, pp. 642-644). The following samples were collected:
• Sample SBA-032SD –oily matrix; glades of oil; light gray; clayey; collected at 2 to 3 inches below ground surface (Ref. 4, pp. 117-118 & 1018). See Table 11 for observed release sample concentrations.
• Sample SBA‐ESI‐10SD – noticeable hydrocarbon odor; contained a sizeable amount of organic debris (Ref. 7, pp. 135-136, 164 & 976). See Table 12 for observed release sample concentrations.
The release sediment samples along PPE 4 contained concentrations of PAHs that met observed release by direct observation criteria (Ref. 1, Table 2-3) were: acenaphthene, acenaphthylene, anthracene, benzo(a)anthracene, benzo(a)pyrene, benzo(b)fluoranthene, benzo(g,h,i)perylene, benzo(k)fluoranthene, chrysene, dibenz(a,h)anthracene, dibenzofuran, fluoranthene, fluorene, indeno(1,2,3-cd)pyrene, 2-methylnaphthalene, naphthalene, phenanthrene and pyrene (Tables 11 & 12).
71

SWOF-Surface Water Overland Flow/Flood Migration Component Observed Release
Chemical Analyses: Sediment samples (SBA-24SD, SBA-25SD, SBA-029SD and SBA-30SD) and wetland samples (SBA-32SD, SBA-33SD and SBA-39SD) collected during the August 2013 SI, were compared to the representative background samples (sediment sample SBA-28SD and wetland sediment sample SBA-31SD) also collected during that specific sampling event (Table 11). Background sediment sample SBA-28SD was collected off-site, from the bank of the Mermentau River located approximately 275 feet northeast of the facility entrance (Ref. 4, p. 27; Figure 5). SBA-28SD was designated as a background sediment sample since no organic or volatile organic compounds were detected (Ref. 4, p. 28 & 246-250). SBA-31SD was collected southwest of the source areas and is considered the background sample for the wetlands as analysis of the sample did not detect any organic or volatile organic constituents (Ref. 4, pp. 43 & 634-639; Figure 5). See Table 11 for background sediment and wetland samples, and observed release sample concentrations. Respectively, sediment samples (SBA-ESI-04, SBA-ESI-05 and SBA-ESI-06) and wetland samples (SBA-ESI-10 and SBA-ESI-11) collected during the September 2014 ESI were compared to the representative background samples (sediment samples SBA-ESI-01 and SBA-ESI-02 and wetland sediment samples SBA-ESI-08 and SBA-ESI-09) also collected during that specific sampling event (Table 12). Background sediment samples SBA-ESI-01 and SBA-ESI-02 were collected off-site along the Mermentau River approximately 500 to 600 feet upstream from the shoreline of the site (Ref. 7, p. 25; Figures 5). Sample location SBA-ESI-01 is located northeast of the site approximately 600 feet upstream and along the main/shipping channel of the Mermentau River (Ref. 7, p. 25; Figure 5). SBA-ESI-02 is located northwest and approximately 500 feet upstream and along the original river channel (Ref. 7, p. 25; Figure 5). No semi-volatile organics analytes were detected in either background sediment sample, SBA-ESI-01SD or SBA-ESI-02SD (Ref. 7, pp. 26 & 201-206). Background sediment samples, SBA-ESI-08 and SBA-ESI-09, were collected along the downstream wetland boundary of the site (Ref. 7, p. 34; Figure 5). Sediment sample SBA-ESI-08 was collected along the west bank of the Mermentau River along the wetland boundary in an area subject to sediment build up, and sediment sample SBA-ESI-09 was collected off-site long the east bank of the Mermentau River along the wetland boundary (Ref. 7, p. 34; Figure 5). Given no semi-volatiles constituents were detected in either sediment sample collected along the wetland boundary of the Mermentau River, SBA-ESI-08 and SBA-ESI-09 were defined as background sediment samples (Ref. 7 p. 34 & 192-197; Figure 5). See Table 12 for background sediment and wetland samples, and observed release sample concentrations. Two (2) sediment samples were collected, one during the August 2013 SI and the other during the September 2014 ESI, to identify and assess the migration of contamination in the surface water pathway from the Dry Dock (Source 5) and associated with PPE 1 (Figures 3 & 4). The following samples were collected:
• Sample SBA-029SD – sediment sample from north of Dry Dock Slip (Ref .4, p. 41) • Sample SBA-ESI-04SD – collected down gradient of the Dry Dock (Ref. 7, p. 33)
The release sediment samples associated with the Dry Dock and PPE 1 contained concentrations of PAHs that met observed release criteria (Ref. 1, Table 2-3) were: chrysene, fluoranthene, fluorene, phenanthrene and pyrene (Table 12).
72
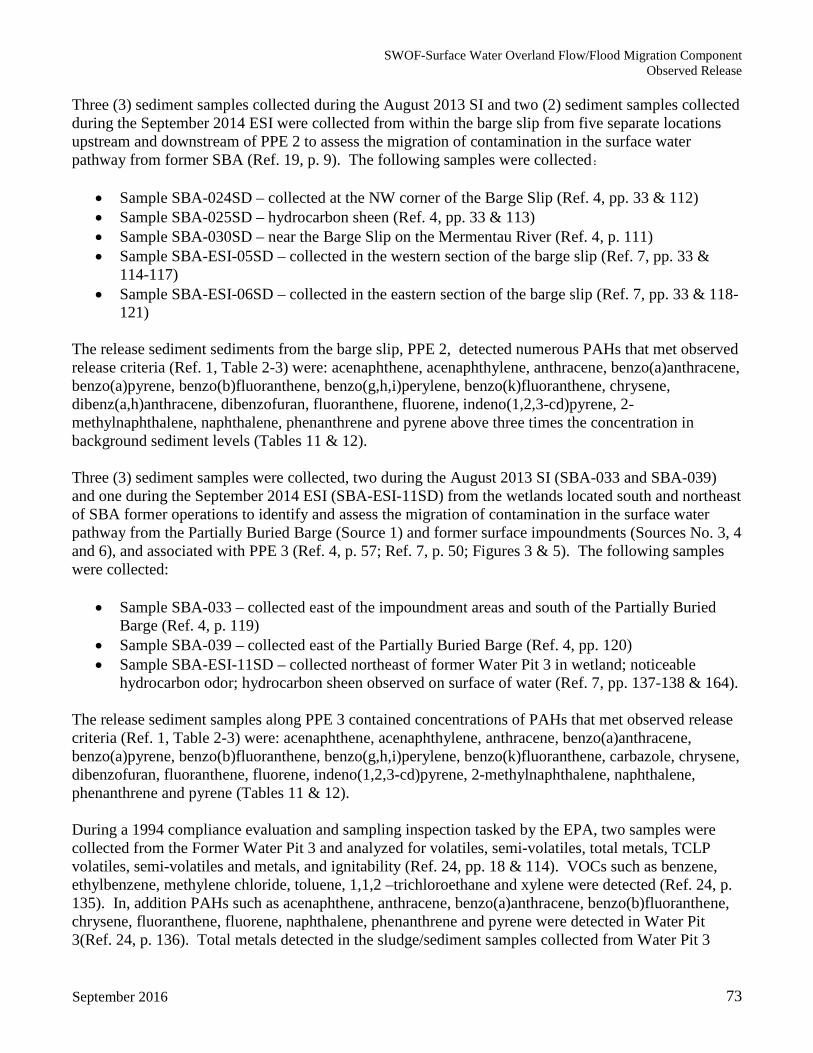
SWOF-Surface Water Overland Flow/Flood Migration Component Observed Release
Three (3) sediment samples collected during the August 2013 SI and two (2) sediment samples collected during the September 2014 ESI were collected from within the barge slip from five separate locations upstream and downstream of PPE 2 to assess the migration of contamination in the surface water pathway from former SBA (Ref. 19, p. 9). The following samples were collected:
• Sample SBA-024SD – collected at the NW corner of the Barge Slip (Ref. 4, pp. 33 & 112) • Sample SBA-025SD – hydrocarbon sheen (Ref. 4, pp. 33 & 113) • Sample SBA-030SD – near the Barge Slip on the Mermentau River (Ref. 4, p. 111) • Sample SBA-ESI-05SD – collected in the western section of the barge slip (Ref. 7, pp. 33 &
114-117) • Sample SBA-ESI-06SD – collected in the eastern section of the barge slip (Ref. 7, pp. 33 & 118-
121) The release sediment sediments from the barge slip, PPE 2, detected numerous PAHs that met observed release criteria (Ref. 1, Table 2-3) were: acenaphthene, acenaphthylene, anthracene, benzo(a)anthracene, benzo(a)pyrene, benzo(b)fluoranthene, benzo(g,h,i)perylene, benzo(k)fluoranthene, chrysene, dibenz(a,h)anthracene, dibenzofuran, fluoranthene, fluorene, indeno(1,2,3-cd)pyrene, 2-methylnaphthalene, naphthalene, phenanthrene and pyrene above three times the concentration in background sediment levels (Tables 11 & 12). Three (3) sediment samples were collected, two during the August 2013 SI (SBA-033 and SBA-039) and one during the September 2014 ESI (SBA-ESI-11SD) from the wetlands located south and northeast of SBA former operations to identify and assess the migration of contamination in the surface water pathway from the Partially Buried Barge (Source 1) and former surface impoundments (Sources No. 3, 4 and 6), and associated with PPE 3 (Ref. 4, p. 57; Ref. 7, p. 50; Figures 3 & 5). The following samples were collected:
• Sample SBA-033 – collected east of the impoundment areas and south of the Partially Buried Barge (Ref. 4, p. 119)
• Sample SBA-039 – collected east of the Partially Buried Barge (Ref. 4, pp. 120) • Sample SBA-ESI-11SD – collected northeast of former Water Pit 3 in wetland; noticeable
hydrocarbon odor; hydrocarbon sheen observed on surface of water (Ref. 7, pp. 137-138 & 164). The release sediment samples along PPE 3 contained concentrations of PAHs that met observed release criteria (Ref. 1, Table 2-3) were: acenaphthene, acenaphthylene, anthracene, benzo(a)anthracene, benzo(a)pyrene, benzo(b)fluoranthene, benzo(g,h,i)perylene, benzo(k)fluoranthene, carbazole, chrysene, dibenzofuran, fluoranthene, fluorene, indeno(1,2,3-cd)pyrene, 2-methylnaphthalene, naphthalene, phenanthrene and pyrene (Tables 11 & 12). During a 1994 compliance evaluation and sampling inspection tasked by the EPA, two samples were collected from the Former Water Pit 3 and analyzed for volatiles, semi-volatiles, total metals, TCLP volatiles, semi-volatiles and metals, and ignitability (Ref. 24, pp. 18 & 114). VOCs such as benzene, ethylbenzene, methylene chloride, toluene, 1,1,2 –trichloroethane and xylene were detected (Ref. 24, p. 135). In, addition PAHs such as acenaphthene, anthracene, benzo(a)anthracene, benzo(b)fluoranthene, chrysene, fluoranthene, fluorene, naphthalene, phenanthrene and pyrene were detected in Water Pit 3(Ref. 24, p. 136). Total metals detected in the sludge/sediment samples collected from Water Pit 3
September 2016 73

SWOF-Surface Water Overland Flow/Flood Migration Component Observed Release
included silver, arsenic, cadmium, chromium, copper, mercury, nickel, lead, antimony, selenium, thallium and zinc (Ref. 24, p. 137).
Samples SBA-24SD, SBA-025SD, SBA-029SD, SBA-030SD, SBA-033 and SBA-039 were sent to the U.S. EPA Laboratory in Houston for analysis, data review and data validation for Target Compound List (TCL) Volatile Organic Analysis (VOAs) by EPA method CLP SOW SOM01.2(method used -CLP OLM04.2 – GC/MS), TCL Semi-Volatile Organic Analysis (SVOAs) by EPA method CLP SOW SOM01.2 (method used - CLP OLM04.2 – GC/MS), TCL Pesticide/PCBs by EPA method CLP SOW SOM01.2 (method used – CLP OLM04.2 – GC/ECD), TAL Cyanides by EPA method CLP SOW ILM05.4 (method used 335.4 – Colorimetric), and TAL Total Metals + Mercury by EPA method CLP SOW ILM05.4 (methods used - CLP ILM05.3 – ICP, CLP ILM05.3 – ICP/MS, CLP ILM05.3 – CVAAS) (Ref. 4, pp. 22-23, 47, 230-243, 262-275, 640-647, 648-655, 658-660, ). Samples SBA-ESI-04SD, SBA-ESI-05SD, SBA-ESI-06SD, and SBA-ESI-11SD were shipped to the U.S. EPA Laboratory in Houston for analysis, data review and data validation for TCL SVOAs by EPA method CLP OLM04.2 – GC/MS (Ref. 7, pp. 22, 183-189, 210-218, ). An observed release by chemical analysis of the sediment samples collected at and down gradient of PPE 1, within the barge slip for PPE 2, along the drainage ditch of PPE 3 that flows through the wetland and finally into the Mermentau River is analytical evidence of a hazardous substance in the media significantly above background and attribution of at least part of the increase to the site.
74

SWOF-Surface Water Overland Flow/Flood Migration Component Observed Release
Table 11 – Site Inspection Background and Release Samples
EPA/START Sample No.: SBA-28SD SBA-029SD SBA-24SD SBA-25SD SBA-30SD SBA-31SD SBA-33SD SBA-39SD SBA-32SD EPA Laboratory Sample No.: 1308016-03 1308016-05 1308016-01 1308016-02 1308016-06 1308020-26 1308020-28 1308020-29 1308020-27
Sample Location: Sediment Background (PPE 1) Sediment (PPE 2) Barge Slip NW Sediment
(PPE 2) Barge Slip N Sediment (PPE 2) Sediment Wetland Background (PPE 3) Wetland (PPE 3) Wetland (PPE 4) Wetland
% Solids: 69.74% 70.49% 71.26% 56.39% 69.98% 53.54% 73.91% 17.25% 62.29%
Units: Result RL 3x Bkgd. or > RL Result RL Result RL Result RL Result RL RL Result 3x Bkgd.
or > RL Result RL Result RL Result RL
Analyte: SVOCs µg/kg µg/kg µg/kg µg/kg µg/kg µg/kg µg/kg µg/kg µg/kg µg/kg µg/Kg µg/kg µg/kg µg/kg µg/kg µg/kg µg/kg µg/kg µg/kg µg/kg Acenaphthene U 286 286 (RL) U 283 1270 279 U 346 U 278 367 U 367 (RL) U 2410 U 1130 7520 311
Benzo (b) fluoranthene U 715 715 (RL) 1510 J (151)* 707 4100 697 22500 8660 4450 695 918 U 918 (RL) 53,200 30100 U 2820 12700 3890
Benzo (g,h,i) perylene U 715 715 (RL) 1750 J (175)* 707 2860 697 11000 866 2990 695 918 U 918 (RL) 32,900 30100 U 2820 7620 3890
Benzo (k) fluoranthene U 715 715 (RL) 976 J (97.6)* 707 2950 697 16300 8660 2640 695 918 U 918 (RL) 38,600 30100 U 2820 6900 3890
Acenaphthylene U 286 286 (RL) U 283 621 279 3000 346 376 278 367 U 367 (RL) 3,980 2410 U 1130 6900 3890
Carbazole U 715 715 (RL) U 707 U 697 2880 J (288)* 866 U 695 918 U 918 (RL) 119000 J
(11900)* 6010 U 2820 2540 J (254)* 778
Chrysene U 715 715 (RL) 1040 J (104)* 707 5240 697 19200 8660 9130 695 918 U 918 (RL) 44400 6010 U 2820 12800 3890
Dibenzofuran U 715 715 (RL) U 707 U 697 1860 866 U 695 918 U 918 (RL) 9960 6010 U 2820 3340 778
Dibenz (a,h) anthracene U 715 715 (RL) U 707 712 697 3780 866 852 695 918 U 918 (RL) 6720 J (672)* 6010 U 2820 2070 J
(207)* 778
Anthracene U 286 286 (RL) 873 J (87.3)* 283 1030 279 4750 3460 278 J
(27.8)* 278 367 U 367 (RL) 353000 12000 U 1130 21400 1560
Fluoranthene U 286 286 (RL) 418 J (41.8)* 283 8440 279 33600 3460 2110 J
(211)* 278 367 U 367 (RL) 52200 2410 U 1130 20300 1560
Fluorene U 286 286 (RL) U 283 395 279 2330 346 U 278 367 U 367 (RL) 32000 2410 U 1130 10500 311
Indeno (1,2,3-cd) pyrene U 715 715 (RL) 1630 J (163)* 707 3090 697 12900 866 3490 695 918 U 918 (RL) 38300 30100 U 2820 8830 3890
2-Methylnaphthalene U 286 286 (RL) U 707 U 279 700 346 U 278 367 U 367 (RL) 5970 2410 U 1130 1880 311 Naphthalene U 286 286 (RL) U 283 U 279 4170 346 U 278 367 U 367 (RL) 10600 2410 U 1130 786 311
Phenanthrene U 286 286 (RL) U 283 404 279 21400 3460 285 J (28.5)* 278 367 U 367 (RL) 61000 2410 U 1130 26600 1560
Pyrene U 286 286 (RL) 903 J (90.3)* 283 12600 279 33700 3460 4780 278 367 U 367 (RL) 62000 2410 U 1130 21800 1560
Benzo (a) anthracene U 715 715 (RL) U 707 3470 697 16000 866 3680 695 918 U 918 (RL) 27500 6010 U 2820 8910 3890
Benzo (a) pyrene U 715 715 (RL) 1630 J (163)* 707 5500 697 21000 8660 5120 695 918 U 918 (RL) 50800 30100 U 2820 13800 3890
Key: µg/kg = Concentrations in microgram per kilogram RL - Reporting Limit Bkgd - Background SD - Sediment N - North U - Undetected NW - Northwest PPE - Probable Point of Entry
ntification of the analyte is acceptable; The reported value is an estimate (Ref. 4, p. 865). The reported values for the SVOCs detected in sample SBA-029SD are biased unknown (Ref. 4, pp. 181, 262-265). The reported values for carbazole in samples SBA-35SD, SBA-32SD, and SBA-33SD are ased unknown (Ref. 4, pp. 181, 238, 642 & 650). The reported value for Dibenz (a,h) anthracene in samples SBA-32D and SBA-33SD are biased unknown (Ref.4, pp. 181, 251 & 643).
ected concentration was adjusted by using the guidance document "Using Qualified Data to Document an Observed Release and Observed Contamination" (Ref. 31, pp. 8, 14-15). After adjusting the value for the qualified data to reflect he possible bias, the concentration of the analyte still meets the quirement for an observed release by chemical analysis.
References
Chain of Custody: Ref. 4, p. 160 Ref. 4, p. 160 Ref. 4, p. 160 Ref. 4, p. 160 Ref. 4, p. 160 - 161 Ref. 4, p. 172 Ref. 4, p. 172 Ref. 4, p. 172 Ref. 4. p. 172
Laboratory Results: Ref. 4, pp. 246-251 Ref. 4, pp. 262-267 Ref. 4, pp. 230-235 Ref. 4, pp. 238-243 Ref. 4, pp. 270-275 Ref. 4, pp. 634-639 Ref. 4, pp. 650-655 Ref. 4, pp. 658-663
Ref. 4. pp. 642-647
Data: Ref. 4, pp. 246-250; Ref. 52
Ref. 4, p. 181, 262-264, & 865; Ref. 31, pp. 8, 14-15; Ref. 52
Ref. 4, pp. 230-235; Ref. 52
Ref. 4, pp. 181, 238 & 865; Ref. 31, pp. 8 & 14; Ref. 52
Ref. 4, pp. 270-275; Ref. 52 Ref. 4, pp. 634-639; Ref. 52
Ref. 4, pp. 181, 650-651 & 865; Ref. 31, pp. 8 & 14; Ref. 52
Ref. 4, pp. 658-660 & 662; Ref. 52
Ref. 4, pp. 181, 642-643, 865; Ref. 31, pp. 8 & 14: Ref. 52
75
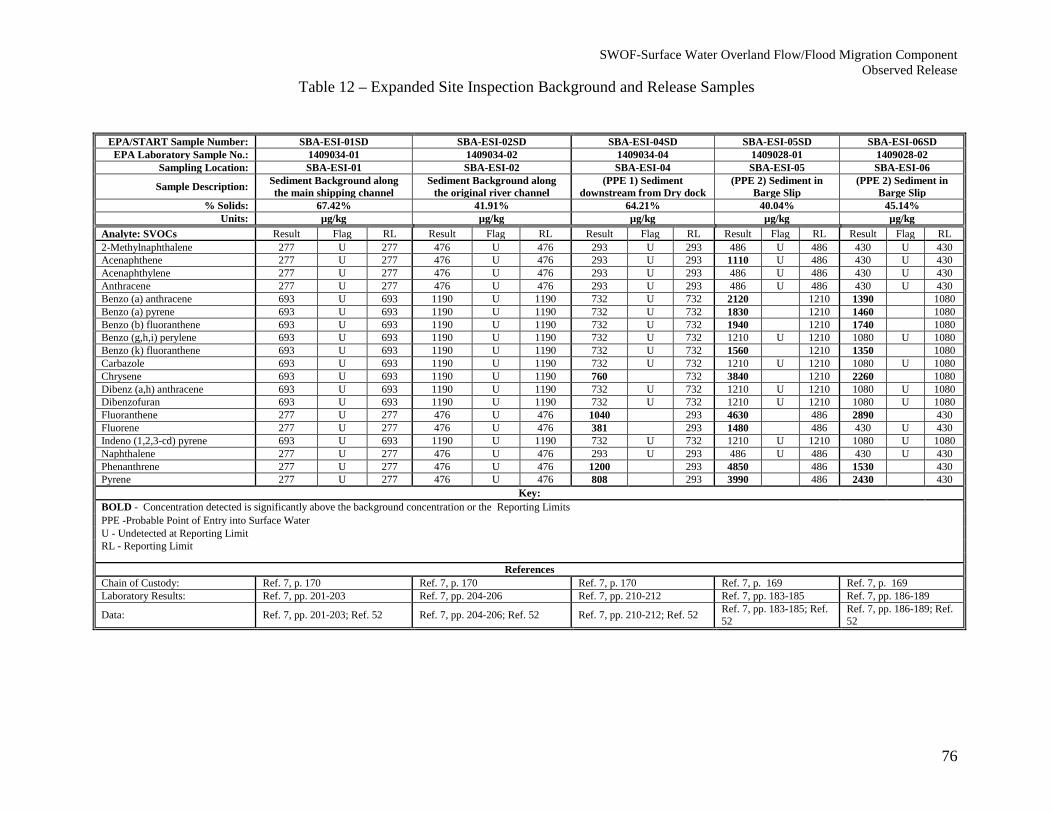
SWOF-Surface Water Overland Flow/Flood Migration Component Observed Release
Table 12 – Expanded Site Inspection Background and Release Samples
EPA/START Sample Number: SBA-ESI-01SD SBA-ESI-02SD SBA-ESI-04SD SBA-ESI-05SD SBA-ESI-06SD
EPA Laboratory Sample No.: 1409034-01 1409034-02 1409034-04 1409028-01 1409028-02 Sampling Location: SBA-ESI-01 SBA-ESI-02 SBA-ESI-04 SBA-ESI-05 SBA-ESI-06
Sample Description: Sediment Background along the main shipping channel
Sediment Background along the original river channel
(PPE 1) Sediment downstream from Dry dock
(PPE 2) Sediment in Barge Slip
(PPE 2) Sediment in Barge Slip
% Solids: 67.42% 41.91% 64.21% 40.04% 45.14% Units: µg/kg µg/kg µg/kg µg/kg µg/kg
Analyte: SVOCs Result Flag RL Result Flag RL Result Flag RL Result Flag RL Result Flag RL 2-Methylnaphthalene 277 U 277 476 U 476 293 U 293 486 U 486 430 U 430 Acenaphthene 277 U 277 476 U 476 293 U 293 1110 U 486 430 U 430 Acenaphthylene 277 U 277 476 U 476 293 U 293 486 U 486 430 U 430 Anthracene 277 U 277 476 U 476 293 U 293 486 U 486 430 U 430 Benzo (a) anthracene 693 U 693 1190 U 1190 732 U 732 2120 1210 1390 1080 Benzo (a) pyrene 693 U 693 1190 U 1190 732 U 732 1830 1210 1460 1080 Benzo (b) fluoranthene 693 U 693 1190 U 1190 732 U 732 1940 1210 1740 1080 Benzo (g,h,i) perylene 693 U 693 1190 U 1190 732 U 732 1210 U 1210 1080 U 1080 Benzo (k) fluoranthene 693 U 693 1190 U 1190 732 U 732 1560 1210 1350 1080 Carbazole 693 U 693 1190 U 1190 732 U 732 1210 U 1210 1080 U 1080 Chrysene 693 U 693 1190 U 1190 760 732 3840 1210 2260 1080 Dibenz (a,h) anthracene 693 U 693 1190 U 1190 732 U 732 1210 U 1210 1080 U 1080 Dibenzofuran 693 U 693 1190 U 1190 732 U 732 1210 U 1210 1080 U 1080 Fluoranthene 277 U 277 476 U 476 1040 293 4630 486 2890 430 Fluorene 277 U 277 476 U 476 381 293 1480 486 430 U 430 Indeno (1,2,3-cd) pyrene 693 U 693 1190 U 1190 732 U 732 1210 U 1210 1080 U 1080 Naphthalene 277 U 277 476 U 476 293 U 293 486 U 486 430 U 430 Phenanthrene 277 U 277 476 U 476 1200 293 4850 486 1530 430 Pyrene 277 U 277 476 U 476 808 293 3990 486 2430 430
Key: BOLD - Concentration detected is significantly above the background concentration or the Reporting Limits
PPE -Probable Point of Entry into Surface Water
U - Undetected at Reporting Limit
RL - Reporting Limit
References Chain of Custody: Ref. 7, p. 170 Ref. 7, p. 170 Ref. 7, p. 170 Ref. 7, p. 169 Ref. 7, p. 169 Laboratory Results: Ref. 7, pp. 201-203 Ref. 7, pp. 204-206 Ref. 7, pp. 210-212 Ref. 7, pp. 183-185 Ref. 7, pp. 186-189
Data: Ref. 7, pp. 201-203; Ref. 52 Ref. 7, pp. 204-206; Ref. 52 Ref. 7, pp. 210-212; Ref. 52 Ref. 7, pp. 183-185; Ref. 52
Ref. 7, pp. 186-189; Ref. 52
76

SWOF-Surface Water Overland Flow/Flood Migration Component Observed Release
Table 12 (continued) – Expanded Site Inspection Background and Release Samples
EPA/START Sample Number: SBA-ESI-08SD SBA-ESI-09SD SBA-ESI-11SD SBA-ESI-10SD EPA Laboratory Sample No.: 1409028-04 1409028-05 1409034-06 1409034-05
Sampling Location: SBA-ESI-08 SBA-ESI-09 SBA-ESI-11 SBA-ESI-10
Sample Description: Sediment Background along wetland boundary on right descending bank of river
Sediment Background along wetland boundary on left descending bank of river
(PPE 3) Wetland Sediment NE of Former Water Pit 3
(PPE 4) Wetland Sediment SE of Former Water Pit 3
% Solids: 35.36% 60.85% 57.57% 26.10% Units: µg/kg µg/kg µg/kg µg/kg
Analyte: SVOCs Result Flag RL Result Flag RL Result Flag RL Result Flag RL 2-Methylnaphthalene 543 U 543 307 U 307 32,400 1,520 35,900 5,490 Acenaphthene 543 U 543 307 U 307 51,100 1,520 250,000 5,490 Acenaphthylene 543 U 543 307 U 307 8,820 1,520 46,400 5,490 Anthracene 543 U 543 307 U 307 1,190,000 152,000 1,040,000 54,900 Benzo (a) anthracene 1360 U 1360 768 U 768 114,000 38,000 664,000 137,000 Benzo (a) pyrene 1360 U 1360 768 U 768 92,100 38,000 507,000 137,000 Benzo (b) fluoranthene 1360 U 1360 768 U 768 107,000 38,000 484,000 137,000 Benzo (g,h,i) perylene 1360 U 1360 768 U 768 35,600 34,200 150,000 137,000 Benzo (k) fluoranthene 1360 U 1360 768 U 768 98,200 38,000 495,000 137,000
Carbazole 1360 U 1360 768 U 768 308000 (30,800)* J 38,000 16100
(1619)* J 13,700
Chrysene 1360 U 1360 768 U 768 177,000 38,000 822,000 137,000 Dibenz (a,h) anthracene 1360 U 1360 768 U 768 10100 (1,010)* J 3,800 61,900 54,900 Dibenzofuran 1360 U 1360 768 U 768 57,600 3,800 157,000 13,700 Fluoranthene 543 U 543 307 U 307 413,000 15,200 1,540,000 54,900 Fluorene 543 U 543 307 U 307 173,000 15,200 510,000 54,900 Indeno (1,2,3-cd) pyrene 1360 U 1360 768 U 768 44,300 38,000 167,000 137,000 Naphthalene 543 U 543 307 U 307 15,000 1,520 9,140 5,490 Phenanthrene 543 U 543 307 U 307 477,000 15,200 1,590,000 54,900 Pyrene 543 U 543 307 U 307 297,000 15,200 1,380,000 54,900
Key: BOLD - Concentration detected is significantly above the background concentration or the Reporting Limits
µg/kg = micrograms per kilogram PPE -Probable Point of Entry into Surface Water RL - Reporting Limit U - Undetected at Reporting Limit J - The identification of the analyte is acceptable; The reported value is an estimate (Ref. 7, p. 251). The reported values for carbazole in samples SBA-ESI-10SD and ESI-11SD are biased unknown (Ref. 7, pp. 179, 213 and 216). The reported value for Dibenz (a,h) anthracene in sample SBA-ESI-11SD is biased unknown (Ref. 7, pp. 179 and 217). * - The detected concentration was adjusted by using the guidance document "Using Qualified Data to Document an Observed Release and Observed Contamination" (Ref. 31, pp. 8 and 14). After adjusting the value for the qualified data to reflect the possible bias, the concentration of the analyte still meets the requirement for an observed release by chemical analysis.
References Chain of Custody: Ref 7, p .169 Ref. 7, p. 169 Ref. 7, p. 170 Ref. 7, p. 170 Laboratory Results: Ref. 7, pp. 192-194 Ref. 7, pp. 195-197 Ref. 7, pp. 216-218 Ref. 7, pp. 213-215
Data: Ref. 7, pp. 192-194; Ref. 52 Ref. 7, pp. 195-197; Ref. 52 Ref. 7, pp. 179, 216-217 & 251; Ref. 31, pp. 8 and 14; Ref. 52
Ref. 7, pp. 179, 213 and 251; Ref. 31, pp. 8 and 14; Ref. 52
77

SWOF-Surface Water Overland Flow/Flood Migration Component Observed Release
Attribution: SBA Shipyard previously used the property for construction, repair, retrofitting and cleaning of barges since the mid-1960’s (Ref. 6, p.7). Three barge slips and a dry dock are located off the Mermentau River (Figure 2; Ref. 5, pp. 38-39; Ref. 6, p. 7). The slips were used to dock barges during cleaning or repair (Ref. 7, p. 13). Barges serviced by SBA typically held diesel, coal tar, crude oil, gasoline and asphalt (Ref. 6, p. 10). Mr. Smailhall stated that the facility had in the past cleaned barges which previously contained coal tar, and acknowledged in another statement that chlorinated solvents were used in the cleaning process in the past (Ref. 22, p. 3: Ref. 33, pp. 1-2). Also, Mr. Smailhall provided MSDS’s for paints used on the barges for the previous two years (Ref. 34, pp. 2 & 80-235). Review of the MSDS revealed that the material was hazardous when discarded due to ignitability, and also the material exhibited the characteristic for methyl ethyl ketone (Ref. 34, p. 2). During the painting of barges, solvents used for cleaning painting equipment were saved and used to thin coatings applied to barges (Ref. 33, p. 2). Some barges held coal tar, creosote, miscellaneous chemicals or agricultural related materials such as tallow, corn oil or soybean (Ref. 32, p. 46). SBA was an industrial location for waste and fuel storage associated with past barge cleaning operations (Ref. 6, p. 17). Wastes from the barge cleaning, for the most part, consisted of hydrocarbons (Ref. 6, p. 10). In addition to the hydrocarbons other waste streams on site included asphalt, creosote, methyl-methacrylate, methanol, caustic soda, styrene, coal tar, vinyl acetate, carbon tetra chloride, ethyl acrylate and acrylates (Ref. 41, p. 11; Ref. 44, pp. 162, 226, 232, 254, 274 & 379; Ref. 45, pp. 115 & 197; Ref. 46, pp. 9 & 203; Ref. 47, pp. 4, 15, 40, 50, 76, 78, 79, 125, 126, 236 & 241; Ref. 48, pp. 14, 16 & 388; Ref. 49, pp. 3, 33, 34, 38, 39, 110 & 236; Ref. 50, pp. 25, 130 & 133: Ref. 51, pp. 1-3 & 36-39). Waste samples taken from Water Pits 1, 2, and 3 were found to contain vinyl chloride, 1,2-dichloroethane, tetrachloroethylene, trichloroethylene, methylene chloride, methyl ethyl ketone, carbon tetrachloride, acetone and styrene (Ref. 35, pp. 6 -7; Ref. 37, pp .1, 4-12 & 19-41). Since approximately 1970, benzene, vinyl chloride, and carbon tetrachloride toxicity characteristic wastes were placed in Water Pit 1 and 2 (Ref. 35, p.10). Waste in some of the tanks were found to be characteristically hazardous based on benzene, 1,2-dichloroethane, tetrachloroethane, vinyl chloride or ignitability (Ref. 32, p. 46). COCs at the site that are being scored are not normally found in petroleum products, or can be associated with non-petroleum excluded products historically associated with the site. CERLCA hazardous substances are subject to CERCLA response authority and responsibility. Invoices and manifests from customers that had barges repaired, retrofitted or cleaned and painted during the operational period of SBA contained CERLCA eligible waste to include: asphalt, creosote, methyl-methacrylate, methanol, caustic soda, styrene, coal tar, vinyl acetate, carbon tetra chloride, ethyl acrylate and acrylates (Ref. 41, p. 11; Ref. 44, pp. 162, 226, 232, 254, 274 & 379; Ref. 45, pp. 115 & 197; Ref. 46, pp. 9 & 203; Ref. 47, pp. 4, 15, 40, 50, 76, 78, 79, 125, 126, 236 & 241; Ref. 48, pp. 14, 16 & 388; Ref. 49, pp. 3, 33, 34, 38, 39, 110 & 236; Ref. 50, pp. 25, 130 & 133: Ref. 51, pp. 1-3 & 36-39). Potential chemical hazards at this site included: chloroform, 1,2-dichloroethane, tetrachloroethene, trichloroethene, vinyl chloride, ortho-cresol, meta-cresol and pyridine (Ref. 32, p. 49; Ref. 34, p. 1). Additional, possible constituents of concern at the site identified include 1,1,1-trichloroethane, vinyl chloride, 1,2-dichloroethene, benzene, tetrachloroethylene, toluene, ethylbenzene, xylene, styrene, chloroform, creosol, pyridine, arsenic, barium, mercury and lead (Ref. 32, pp. 49-52 & 75-94; Ref. 34, p. 1). Wastes from the barge cleaning operations were managed in a waste management area that included impoundments (Oil Pit, Water Pit 1, Water Pit 2, and Water Pit 3), a land treatment unit (LTU) and storage tanks (Ref. 6, p. 5). All wastes managed on site consisted of non-petroleum and petroleum
78

SWOF-Surface Water Overland Flow/Flood Migration Component Observed Release
products that were comingled within the waste management units and not segregated during the operations or processing (Ref. 24, pp. 5 & 7; Ref. 30, pp. 5, 21-26). Two sediment samples were collected from two separate locations in the vicinity of the Dry Dock (PPE 1) (Figure 5). Location SBA-029, Sample SBA-029SD from the north of the dry dock , and Location SBA-ESI-04, Sample SBA-ESI-04SD down gradient of the dry dock (Ref. 4, p. 41: Ref. 7, p. 33). In the release sediment samples from the Dry Dock, chrysene, fluoranthene, fluorene, phenanthrene, and pyrene were detected and met observed release criteria (Ref. 4, pp. 260-267; Ref. 7, pp. 210-212; Tables 11 & 12). Five (5) sediment samples (SBA-024SD, SBA-025SD, SBA-030SD, SBA-ESI-05SD, SBA-ESI-06SD) were collected from within the barge slip from four separate locations upstream and at PPE 2 to determine the migration of contamination in the surface water pathway from former SBA operations (Figure 5). The samples had the same constituents as the other sediment samples collected from the Partially Buried Barge scored as Source 1, and which receives drainage from Source 1(Ref. 4, pp. 228-243 & 268-275; Ref. 7, pp. 183-188; Tables 11 & 12). Three (3) sediment samples (Sample SBA-33, Sample SBA-39 and SBA-ESI-11SD) were collected from the wetland located south and northeast of SBA former operations to identify and assess the migration of contamination in the surface water pathway from the partially buried barge (Source 1) and former surface impoundments (the former oil pit and Sources No. 3, 4 and 6) and associated with PPE 3 (Figure 5). The wetland sediment samples had the same constituents as the other samples collected from the Partially Buried Barge (Source 1), the two former surface impoundments (the former oil pit and Source 3), LTU (Source 4) and surface impoundment that is now part of the wetland (Source 6) (Tables 11 & 12). The wetland located south and northeast of former SBA operation receives drainage from all site sources (Figures 4 & 5). Two (2) wetland sediment samples (SBA-032 and SBA-ESI-10) were collected from the location of Former Water Pit 3 that is currently a part of the wetland and document an observed release by direct observation associated with PPE 4 (Figure 5). The wetland sediment samples had the same constituents as the other samples collected from the Partially Buried Barge (Source No. 1), the two former surface impoundments (the former oil pit and Source No. 3) and the LTU (Source 4) (Tables 11 & 12). Former Water Pit 3, that is presently part of the wetlands and PPE 4, is along the surface water migration pathway and receives drainage from the former oil pit, Former Water Pit 1 (Source No. 3) and the former LTU (Source No. 4) Alternative sites that could potentially be contributing releases of hazardous substances to those found at the SBA facility were identified. A former terminal is located north of the site, which consists of two storage tanks (Ref. 6, p. 17; Ref. 28, p. 1). Little information is known about the dates of operation at this facility. Available information indicates that the property north of the SBA facility was occupied by Citgo (Ref. 28). There are no other industries located within a 2-mile radius of the property that might be responsible for the contamination in the PPE or the wetlands. Background sediment samples collected upstream from the site indicate the former terminal is unlikely to be impacting sediments at, or downstream of, SBA shipyard. Residential areas are located north of the property, wetlands to the south and west, and the Mermentau River to the east (Ref. 4, pp. 12-13). The area west of the property
Septem ber 20 16 79

SWOF-Surface Water Overland Flow/Flood Migration Component Observed Release
includes agricultural use such as pastures (Ref. 6, p. 17). The frontage along highway 3166 includes a number of residential structures, some residences may be used as recreational properties, others may be year round residences (Ref. 6, p. 17). Background sediment samples collected did not detect any contaminants of concern that have been associated with the site (Tables 11 & 12). The background sediment samples SBA-28SD, SBA-ESI-01 and SBA-ESI-02 were collected upstream of the site while SBA-31SD, SBA-ESI-08 and SBA-ESI-09 were collected downstream from the site. The background sediment sample results indicate that the significant increase in the concentration of the hazardous substances in the observed release is not due to other sites. The sources contained the same constituents in the observed release and in the drainage pathway to the wetlands and Mermentau River (Tables 1, 4, 5, 6, 7, 8, 9 & 10).
Observed Release Factor Value: 550
80

SWOF/ Human Food Chain-Toxicity/Persistence/Bioaccumulation
4.1.3.2 HUMAN FOOD CHAIN THREAT - WASTE CHARACTERISTICS 4.1.3.2.1 Toxicity/Persistence/Bioaccumulation The human food chain waste characteristics section provides the toxicity, persistence and bioaccumulation factor values for hazardous substances that are available to migrate from sources at the site to surface water in the watershed via the overland/flood hazardous substances migration path for the watershed (Ref. 1, Section 4.1.3.2.1), the hazardous waste quantity value for the watershed (Ref. 1, Section 4.1.3.2.2), and the calculation of the human food chain threat-waste characteristics factor category value (Ref. 1, Section 4.1.3.2.3). The highest combined toxicity, persistence and bioaccumulation factor is used to determine the waste characteristics factor value for the human food chain threat of the surface water migration pathway (Ref. 1, Section 4.1.3.2.1.4). Hazardous substances that meet the criteria for an observed release to surface water and all hazardous substances associated with the sources that have a surface water containment factor value greater than 0 for the watershed are presented in Table 13 below. Each hazardous substance eligible to be evaluated is assigned a toxicity/persistence/bioaccumulation factor value. The hazardous substance with the highest toxicity/persistence/bioaccumulation
81

SWOF/ Human Food Chain-Toxicity/Persistence/Bioaccumulation
Table 13 – Human Food Chain Threat - Toxicity/Persistence/Bioaccumulation Summary
Hazardous Substance Source No. Toxicity Factor Value
Persistence Factor Value*
Toxicity/ Persistence
Factor Value (Table 4-12)
Bioaccumulation Factor Value **
Toxicity/Persistence / Bioaccumulation Factor
Value (Table 4-16) Reference
Acenaphthene 1, 3, 4, 6 , OR 10 0.4 4 500 2,000
Ref. 1, Table 4-12, 4-16; Ref. 2, Appendix B, pp.
1-10
Acenaphthylene 1, 3-6, OR 1 0.4 0.4 500 200 Anthracene 1, 3-6, OR 10 0.4 4 50,000 200,000 Aroclor-12541 5 10,000 1 10,000 50,000 500,000,000 Arsenic 1, 3-5 10,000 1 10,000 5 50,000 Barium 3 10,000 1 10,000 500 5,000,000 Benzene 1, 3, 4 1,000 0.4 400 5,000 2,000,000 Benzo(a)anthracene 1, 3-6, OR 1,000 1 1,000 50,000 50,000,000 Benzo(a)pyrene 1, 3-6, OR 10,000 1 10,000 50,000 500,000,000 Benzo(g,h,i)perylene 1, 3-6, OR 0 1 0 50,000 0 Benzo(b)fluoranthene 1, 3-6, OR Benzo(k)fluoranthene 1, 3-6, OR 100 1 100 50,000 5,000,000 Beryllium 4, 6 10,000 1 10,000 50 500,000 Biphenyl, 1,1'- 1, 3, 4 Bis (2-ethylhexyl) phthalate 3 100 1 100 50,000 5,000,000 Cadmium 3, 4 10,000 1 10,000 50,000 500,000,000 Carbazole 1, 3-6, OR 10 1 10 500 5,000 Chromium 1 10,000 1 10,000 5 50,000 Chrysene 1, 3-6, OR 10 1 10 5 50 Cobalt 1, 3, 5, 6 10,000 1 10,000 50 500,000 Copper 3-5 100 1 100 50,000 5,000,000 Cyclohexane 1,3,4 Dibenz(a,h)anthracene 1, 3, 5, 6, OR 10,000 1 10,000 50,000 500,000,000 Dibenzofuran 1, 3-6,OR 1,000 0.4 400 500 200,000 Dichlorobenzene, 1,2- 1, 3 Dichlorobenzene, 1,4- 3 10 0.4 4 5,000 20,000 Dichloroethene, 1,2-cis-2 3, 4 1,000 0.4 400 50 20,000 Dimethyl phenol, 2,4- 3 100 1 100 500 50,000 Ethylbenzene 1, 3, 4 10 0.4 4 50 200 Fluoranthene3 1, 3-6,OR 100 1 100 5,000 500,000 Fluorene 1, 3-6,OR 100 0.4 40 500 20,000 Hexachlorodibenzo-p-dioxin 1,2,3,7,8,9- 1 10,000 1 10,000 50,000 500,000,000 Hexachlorodibenzofuran 1,2,3,4,7,8- 1 10,000 1 10,000 50,000 500,000,000 Hexachlorodibenzofuran 1,2,3,6,7,8- 1 10,000 1 10,000 50,000 500,000,000 Hexachlorodibenzofuran 2,3,4,6,7,8- 1 10,000 1 10,000 50,000 500,000,000 Indeno (1,2,3-cd) pyrene 1, 3-6,OR 1,000 1 1,000 50,000 50,000,000 Isopropylbenzene4 1, 3 10 0.4 4 500 2,000 Lead 1, 3 10,000 1 10,000 5,000 50,000,000 Manganese 3-5 10,000 1 10,000 500 5,000,000 Mercury 1, 3, 5 10,000 1 10,000 50,000 500,000,000 Methylphenol, 2- 3 Methyl phenol, 4- 3 10 0.0007 0.007 50 0.35 Methylcyclohexane 1, 3, 4 2-Methylnaphthalene 1, 3-6, OR 1,000 0.4 400 50,000 20,000,000 Naphthalene 1, 3-6, OR 1,000 0.4 400 50,000 20,000,000 Nickel 3, 4, 6 10,000 1 10,000 5 50,000 Octachlorodibenzo-p-dioxin (OCDD) 1 10,000 1 10,000 5,000 50,000,000 Pentachlorodibenzofuran 2,3,4,7,8- 1 10,000 1 10,000 50,000 500,000,000 Phenanthrene 1, 3-6,OR 1 0.4 0.4 5,000 2,000 Phenol 4 10 1 10 50 500 Pyrene 1, 3-6,OR 100 1 100 50,000 5,000,000 Styrene 3 10 0.4 4 50 200 Tetrachloroethene5 1, 3 100 0.4 40 50 2,000 Toluene 1, 3, 4 10 0.4 4 50 200 Vanadium 4 10,000 1 10,000 500 5,000,000 Vinyl Chloride 1, 4 10,000 0.0007 7 5 35 Xylene, m- & p- 1, 3, 4 100 0.4 40 50 2,000 Xylene, o- 1, 3, 4 100 0.4 40 50 2,000 Zinc 3, 5 10 1 10 500 5,000
September 2016 82

SWOF/ Human Food Chain-Toxicity/Persistence/Bioaccumulation
* Persistence values assigned are based on Mermentau River, which is a perennially flowing water classified as a River. ** Bioaccumulation values are food chain values assigned based on the surface water category of fresh water (Ref. 27, p.1). 1Aroclor-1254 is listed as polychlorinated biphenyls (PCBs) in the Superfund Chemical Data Matrix (SCDM) and given a general value (Ref. 2, p. 8). 2Dichloroethene, 1, 2- cis- is listed as dichloroethylene, 1,2-cis- in the SCDM (Ref. 2, p. 4). 3 Fluoranthene is listed as benzo(j,k)fluoranthene in the SCDM (Ref. 2, p. 2). 4Isopropylbenzene is listed as cumene in the SCDM (Ref. 2, p. 3). 5Tetrachloroethene is listed as tetrachloroethylene in the SCDM (Ref. 2, p. 9). OR – Substance documented in the observed release The hazardous substances with the highest Toxicity/Persistence/Bioaccumulation Factor Values are aroclor-1254, benzo(a)pyrene, cadmium, dibenz(a,h)anthracene, hexachlorodibenzo-p-dioxin 1,2,3,7,8,9-, hexachlorodibenzofuran 1,2,3,4,7,8-, hexachlorodibenzofuran 1,2,3,6,7,8-, hexachlorodibenzofuran 2,3,4,6,7,8-, mercury, and pentachlorodibenzofuran 2,3,4,7,8-.
Toxicity/Persistence/Bioaccumulation Factor Value: 500,000,000
83

SWOF/Human Food Chain-Hazardous Waste Quantity
4.1.3.2.2 Hazardous Waste Quantity
Source Number
Source Hazardous Waste Quantity Value (Section 2.4.2.1.5)
Is Source Hazardous Constituent Quantity Data Complete? (yes/no)
1 1,827.79 No 3 882.69 No 4 65.44 No 5 9,615.38 No 6 1,383.56 No TOTAL 13,744.86
The sum of the source hazardous waste quantity values is assigned as the Hazardous Waste Quantity Factor Value (Ref.1, Sec. 2.4.2.2 and Table 2-6). The sum of the source hazardous waste quantity values for Surface Water Pathway, rounded to the nearest integer, is 13,745.
Sum of Values: 13,745 Hazardous Waste Quantity Assigned: 10,000 (Ref. 1 Table 2-6)
September 2016 84

SWOF/Human Food Chain-Hazardous Waste Quantity
4.1.3.2.3 Waste Characteristics Factor Category Value The waste characteristics factor category value is assigned based on the Waste Characteristics Product. The Waste Characteristics Product is the product of the Toxicity/Persistence Factor Value and the Hazardous Waste Quantity Factor Value subject to a maximum of 1 x 10⁸. This product is multiplied by the Bioaccumulation Potential Factor Value subject to a maximum value of 1 x 10¹². The hazardous substances with the highest Toxicity/Persistence/Bioaccumulation factor values for the watershed Aroclor-1254, benzo(a)pyrene, cadmium, dibenz(a,h)anthracene, hexachlorodibenzo-p-dioxin 1,2,3,7,8,9-, hexachlorodibenzofuran 1,2,3,4,7,8-, hexachlorodibenzofuran 1,2,3,6,7,8-, hexachlorodibenzofuran 2,3,4,6,7,8-, mercury, and pentachlorodibenzofuran 2,3,4,7,8- (Ref. 1, Section 4.1.3.2.1.4).
Toxicity/Persistence Factor Value: 10,000 x Hazardous Waste Quantity Factor Value: 10,000
(Toxicity/Persistence x Hazardous Waste Quantity):
10,000 X 10,000 = 1 X 10⁸ (Subject to a maximum product of 1.0 x 10⁸
Bioaccumulation Potential Factor Value: 50,000
(Toxicity/Persistence x Hazardous Waste Quantity) x Bioaccumulation Potential Factor Value:
(1 X 108) X (50,000) = 5.0 X 10¹²
(Subject to a maximum product of 1.0 x 10¹²)
A Waste Characteristics Product value of 1.0 X 10¹² receives a waste characteristics factor value of 1,000 (Ref. 1, Table 2-7).
Hazardous Waste Quantity Assigned Value: 10,000 Waste Characteristics Factor Category Value: 1,000
85

SWOF/Human Food Chain-Targets
4.1.3.3 HUMAN FOOD CHAIN THREAT-TARGETS
Largemouth bass, crappie, bream, bluegill, catfish, gar, bullhead, carp, striped bass and sunfish are caught from Lake Arthur (Ref. 15, p. 1). Mermentau River is also fished recreational as was observed and documented during the September 2014 ESI (Ref. 7, pp. 34 & 89-90). During the September 2014 ESI, a family of five was observed fishing in the Barge Slip (PPE 2) adjacent to the Mermentau River (near sample location SBA‐ESI‐05 and PPE 2). The family stated that they do not fish in the barge slip often, but when they do, they only catch catfish for consumption (Ref. 7, pp. 34 & 984-992). The Mermentau River is fished recreationally, as is evident by the fishermen observed during the ESI during sediment sample collection along the Mermentau River (Ref. 7, pp. 89-91).
4.1.3.3.1 Food Chain Individual
A food chain individual factor value of 45 is assigned based on an observed release by chemical analyses of acenaphthene , anthracene, barium, benzo(a)anthracene, benzo(a)pyrene, benzo(k)fluoranthene, cadmium, carbazole, copper, dibenz(a,h)anthracene, dibenzofuran, fluoranthene (benzo(j,k) fluoranthene), fluorene, indeno (1,2,3-cd) pyrene, lead, manganese, mercury, 2-methylnaphthalene, naphthalene, nickel, phenanthrene, pyrene, vanadium and zinc sediments within the fishery present in the barge slip, a branch of the Mermentau River (Sec. 4.1.3.2.3)(Ref.1, Sec. 4.1.3.3.1; Ref. 2, pp. 1-5, 7-8 & 10; Ref. 7, pp. 984-992; Figure 6; Tables 11 & 12).
Food Chain Individual Factor Value: 45 (Ref. 1, Section 4.1.3.3.1)
86

SWOF/Human Food Chain-Targets
4.1.3.3.2 Population
The Population Factor for the watershed is based on three factors: Level I concentrations, Level II concentrations, and potential human food chain contamination.
4.1.3.3.2.1 Level I Concentrations
There are no Level I concentrations established because there were no tissue samples collected (Ref. 1, Sec. 4.1.3.3.2.1).
4.1.3.3.2.2 Level II Concentrations
Level II concentrations have been established for approximately 1,300 feet of the Mermentau River (Figure 5). During the September 2014 ESI, a family of five was observed fishing in the Barge Slip (PPE 2) adjacent to the Mermentau River (near sample location SBA‐ESI‐05). The family stated that they do not fish in the barge slip often, but when they do, they only catch catfish for consumption (Ref. 7, pp. 984 & 987). Recreation fishing is common, and conducted within the Mermentau River (Ref. 7, pp. 34 & 988-991). The Louisiana Department of Wildlife and Fisheries (LDWF) does not keep records on pounds of fish caught and consumed annually per water body; however, fishing for consumption is known to occur within the zone of Level II contamination as discussed above. Therefore, a human food chain population value of 0.03 is assigned for production greater than zero (>0) and less than 100 (<100) pounds per year of annual human consumption (Ref. 1, Table 4-18; Ref. 7, pp. 34, 89-91, 149 & 984-992).
Level II Human Food Chain Contamination Factor Value: 0.03 (Ref 1, Table 4-18)
4.1.3.3.2.3 Potential Human Food Chain Contamination
Recreation fishing is common in the Mermentau River and Lake Arthur. Recreational fishing is conducted within Mermentau River (Ref. 7, pp. 34, 984 & 988-981). The Louisiana Department of Wildlife and Fisheries (LDWF) does not keep records on pounds (lbs) of fish caught and consumed annually per water body; therefore the most conservative estimate of fish caught and consumed annually (0 lbs < 100 lbs) from the Mermentau River and Lake Arthur will be used (Ref. 7, pp. 34, 89-91, 149 & 984-992). According to gauging station 08012150, located in Jefferson Davis Parish in Mermentau, Louisiana, approximately 3.0 miles upstream of site, the average annual flow rate of the Mermentau River as measured for water year 1990 through 2015 is 1,975.82 cfs (Ref. 11, pp. 1-2). The flow rate for the Mermentau river falls into the large stream to river category which has an assigned dilution value of 0.001 (Ref. 1, Table 4-13). No gauging stations are located in Lake Arthur. The flow rate at that target location was extrapolated using the flow data for Mermentau River and for the headwaters of Bayou Lacassine near Lake Arthur (Ref. 11, pp. 1-2; Ref. 12, pp. 1-2). According to gauging station 08012470 located at Bayou Lacassine near Lake Arthur, Louisiana the average annual flow rate of Bayou Lacassine as measured for water year 1988 through 2005 is 594.18 cfs. Lake Arthur will set to the average flow rate of 2,570 cfs based
87

SWOF/Human Food Chain-Targets
on Bayou Lacassine and Mermentau River average annual flow rate. Therefore, Lake Arthur will be considered to be a large stream to river and will be assigned a dilution value of 0.001 (Ref. 1, Table 4-13).
Table 14 – Fishery Identification Study
Identity of Fishery
Annual Production (pounds)
Type of Surface Water Body
Average Annual
Flow Population Value (Pi)
Dilution Weight
(Di) PixDi Reference Mermentau River
>0-100 Large stream to River
1,975.82 cfs
0.03 0.001 0.00003 Ref.1, Tables 4-13; Ref. 11, pp. 1-2
Lake Arthur
>0-100 Large stream to River
2,570 cfs 0.03 0.001 0.00003 Ref.1, Tables 4-13; Ref. 12, p. 1-2
Sum: 0.00006 (Sum of P1 x 01)/10: 0.000006
Potential Human Food Chain Contamination Factor Value: 6.0 x 10 -6
4.1.3.3.2.4 Calculation of Population Factor Value
The population factor value is equal to: Level I Concentrations (0) + Level II Concentrations (0.03) + Potential Human Food Chain Contamination (0.000006) = 0.030006. A value of 3.0006 x 10⁻² is assigned as the Population Factor Value.
Population Factor Value: 3.0006 x 10⁻²
88

SWOF/Human Food Chain-Targets
4.1.3.3.3 Calculation of Human Food Chain Threat- Targets Factor Category Value The Human Food Chain Threat - Targets Factor Category value is calculated by summing the food chain individual and population factor values for the watershed: Food Chain Individual + Population Factor = 45 + 0.030006 = 45.030006
Target Factor Category Value: 45.030006
4.1.3.4 Calculation of Human Food Chain Threat Score for a Watershed
The Human Food Chain Threat score is calculated by multiplying the human food chain threat factor category values for likelihood of release, waste characteristics, and targets for the watershed (Ref. 1, Section 4.1.3.4). Likelihood of Release (550) x Waste Characteristics (1,000) x Targets (45.030006) = 24,766,503 (rounded to the nearest integer). This product is then divided by 82,500:
24,766,503 ÷ 82,500 = 300.20 The resulting value, subject to a maximum of 100, is assigned as the Human Food Chain Threat Score.
Human Food Chain Threat Score= 100
89
SWOF/Environmental-Toxicity/Persistence/Bioaccumulation
4.1.4.2 ENVIRONMENTAL THREAT - WASTE CHARACTERISTICS
4.1.4.2.1 Ecosystem Toxicity/Persistence/Bioaccumulation
The environmental threat waste characteristics section provides the ecosystem toxicity, persistence and bioaccumulation factor values for hazardous substances that are available to migrate from sources at the site to surface water in the watershed via the overland/flood hazardous substances migration path for the watershed (Ref. 1, Section 4.1.4.2.1), the hazardous waste quantity value for the watershed (Ref. 1, Section 4.1.4.2.2), and the calculation of the environmental threat-waste characteristics factor category value. The highest combined ecosystem toxicity, persistence and ecobioaccumulation factor is used to determine the waste characteristics factor value for the environmental threat of the surface water migration pathway (Ref. 1, Section 4.1.4.2.3) Hazardous substances that meet the criteria for an observed release to surface water and all hazardous substances associated with the sources that have a surface water containment factor value greater than 0 for the watershed are presented in Table 15 below. Each hazardous substance eligible to be evaluated is assigned an ecosystem toxicity/persistence/bioaccumulation factor value. The hazardous substance with the highest ecosystem toxicity/persistence/ecobioaccumulation factor value for the watershed is used to assign the value to this factor (Ref. 1, Section 4.1.4.2.1.4).
90

SWOF/Environmental-Toxicity/Persistence/Bioaccumulation
Table 15- Ecosystem Toxicity/Persistence/EcoBioaccumulation Factor Summary
Hazardous Substance Source No.
Eco Toxicity Factor Value
Persistence Factor Value*
Eco Toxicity/ Persistence
Factor Value (Table 4-12)
Bioaccumulation Factor Value **
Eco Toxicity/Persistence/ Bioaccumulation Factor
Value (Table 4-16) Reference
Acenaphthene 1, 3, 4, 6 , OR 500 0.4 200 500 10,000
Ref. 1, Table 4-12, 4-16;
Ref. 2, pp. 1-10
Acenaphthylene 1, 3-6, OR 0 0.4 0 500 0 Anthracene 1, 3-6, OR 10,000 0.4 4,000 50,000 200,000,000 Aroclor-12541 5 10,000 1 10,000 50,000 500,000,000 Arsenic 1, 3 - 5 10 1 10 50,000 500,000 Barium 3 1 1 1 500 500 Benzene 1, 3, 4 1,000 0.4 400 5,000 2,000,000 Benzo(a)anthracene 1, 3-6, OR 10,000 1 10,000 50,000 500,000,000 Benzo(a)pyrene 1, 3-6, OR 10,000 1 10,000 50,000 500,000,000 Benzo(g,h,i)perylene 1, 3-6, OR 0 1 0 50,000 0 Benzo(b)fluoranthene 1, 3-6, OR Benzo(k)fluoranthene 1, 3-6, OR 0 1 0 50,000 0 Beryllium 4, 6 1,000 1 1,000 50 50,000 Biphenyl, 1,1'- 1, 3, 4 Bis (2-ethylhexyl) phthalate 3 1,000 1 1,000 50,000 50,000,000 Cadmium 3, 4 10,000 1 10,000 50,000 500,000,000 Carbazole 1, 3-6, OR 1,000 1 1,000 500 500,000 Chromium 1 10,000 1 10,000 500 5,000,000 Chrysene 1, 3-6, OR 1,000 1 1,000 5,000 5,000,000 Cobalt 1, 3, 5, 6 0 1 0 50 0 Copper 3-5 1,000 1 1,000 50,000 50,000,000 Cyclohexane 1, 3, 4 Dibenz(a,h)anthracene 1, 3, 5, 6, OR 0 1 0 50,000 0 Dibenzofuran 1, 3-6,OR 1,000 0.4 400 500 200,000 Dichlorobenzene, 1,2- 1, 3 Dichlorobenzene, 1,4- 3 1,000 0.4 400 5,000 200,000 Dichloroethene, 1,2-cis-2 3, 4 0 1 0 50 0 Dimethyl phenol, 2,4- 3 100 1 100 500 50,000 Ethylbenzene 1, 3, 4 100 0.4 40 50 2,000 Fluoranthene3 1, 3-6,OR 10,000 1 10,000 5,000 50,000,000 Fluorene 1, 3-6,OR 1,000 0.4 400 5,000 2,000,000 Hexachlorodibenzo-p-dioxin 1,2,3,7,8,9- 1 0 1 0 50,000 0 Hexachlorodibenzofuran 1,2,3,4,7,8- 1 0 1 0 50,000 0 Hexachlorodibenzofuran 1,2,3,6,7,8- 1 0 1 0 50,000 0 Hexachlorodibenzofuran 2,3,4,6,7,8- 1 0 1 0 50,000 0 Indeno (1,2,3-cd) pyrene 1, 3-6,OR 0 1 0 50 0 Isopropylbenzene4 1, 3 100 0.4 4 500 20,000 Lead 1, 3 1,000 1 1,000 50,000 50,000,000 Manganese 3-5 100 1 100 50,000 5,000,000 Mercury 1, 3, 5 10,000 1 10,000 50,000 500,000,000 Methyl phenol, 2- 3 Methyl phenol, 4- 3 100 0.0007 0.07 50 3.5 Methylcyclohexane 1, 3, 4 2-Methylnaphthalene 1, 3-6, OR 1000 0.4 400 50,000 2,000,000 Naphthalene 1, 3-6, OR 1,000 0.4 400 50,000 20,000,000 Nickel 3, 4, 6 100 1 100 50 5,000 Octachlorodibenzo-p-dioxin (OCDD) 1 0 1 0 50,000 0 Pentachlorodibenzofuran 2,3,4,7,8- 1 0 1 0 50,000 0 Phenanthrene 1, 3-6,OR 10,000 0.4 4,000 50,000 200,000,000 Phenol 4 10,000 1 10,000 50,000 500 Pyrene 1, 3-6,OR 100 1 100 50,000 500,000,000 Styrene 3 100 0.4 40 50 2,000 Tetrachloroethene5 1, 3 100 0.4 40 50 2,000 Toluene 1, 3, 4 100 0.4 40 5,000 200,000 Vanadium 4 100 1 100 50,000 5,000,000 Vinyl Chloride 1, 4 0 0.0007 0 5 0 Xylene, m- & p- 1, 3, 4 Xylene, o- 1, 3, 4 100 0.4 40 50 2,000 Zinc 3, 5 10 1 10 50,000 500,000
* Persistence values assigned are based on Mermentau River, which is a perennially flowing water classified as a River. ** Bioaccumulation values are assigned based on the surface water category of fresh water (Ref. 27, p.1). 1Aroclor-1254 is listed as polychlorinated biphenyls (PCBs) in the Superfund Chemical Data Matrix (SCDM) and given a general value (Ref. 2, p. 8). 2Dichloroethene, 1, 2- cis- is listed as dichloroethylene, 1,2-cis- in the SCDM (Ref. 2, p. 4).
September 2016 91

SWOF/Environmental-Toxicity/Persistence/Bioaccumulation
3Fluoranthene is listed as benzo(j,k) fluoranthene in the SCDM (Ref. 2, p. 2). 4Isopropylbenzene is listed as cumene in the SCDM (Ref. 2, p. 3). 5Tetrachloroethene is listed as tetrachloroethylene in the SCDM (Ref. 2, p. 9). OR – Substance documented in the observed release The contaminant with the highest Ecosystem Toxicity/Persistence/Bioaccumulation Factor Value are Aroclor-1254, benzo(a)anthracene, benzo(a)pyrene, cadmium, mercury and pyrene (Ref. 1, Table 4-21; Ref. 2, pp. 2, 6-8 & 10).
Ecosystem Toxicity/Persistence/Bioaccumulation Factor Value: 500,000,000
92
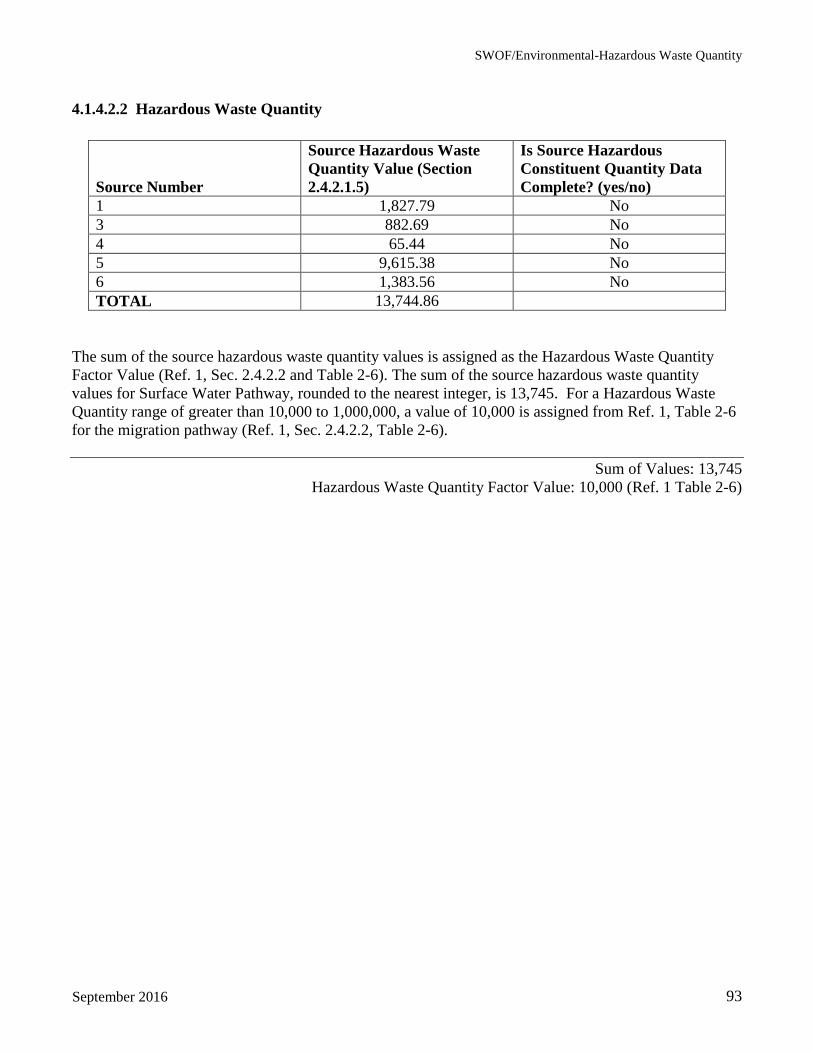
SWOF/Environmental-Hazardous Waste Quantity
4.1.4.2.2 Hazardous Waste Quantity
Sum of Values: 13,745
September 2016
Source Number
Source Hazardous Waste Quantity Value (Section 2.4.2.1.5)
Is Source Hazardous Constituent Quantity Data Complete? (yes/no)
1 1,827.79 No 3 882.69 No 4 65.44 No 5 9,615.38 No 6 1,383.56 No TOTAL 13,744.86
The sum of the source hazardous waste quantity values is assigned as the Hazardous Waste Quantity Factor Value (Ref. 1, Sec. 2.4.2.2 and Table 2-6). The sum of the source hazardous waste quantity values for Surface Water Pathway, rounded to the nearest integer, is 13,745. For a Hazardous Waste Quantity range of greater than 10,000 to 1,000,000, a value of 10,000 is assigned from Ref. 1, Table 2-6 for the migration pathway (Ref. 1, Sec. 2.4.2.2, Table 2-6).
Hazardous Waste Quantity Factor Value: 10,000 (Ref. 1 Table 2-6)
93

SWOF/Environmental-Hazardous Waste Quantity
4.1.4.2.3 Waste Characteristics Factor Category Value
A Waste Characteristics Factor Category Value is assigned based on the Waste Characteristic Product. The hazardous substances with the highest ecosystem toxicity/persistence/bioaccumulation factor value for the watershed are aroclor-1254, benzo(a)pyrene, cadmium, dibenz(a,h)anthracene, hexachlorodibenzo-p-dioxin 1,2,3,7,8,9-, hexachlorodibenzofuran 1,2,3,4,7,8-, hexachlorodibenzofuran 1,2,3,6,7,8-, hexachlorodibenzofuran 2,3,4,6,7,8-, mercury, pentachlorodibenzofuran 2,3,4,7,8-, and vanadium (Ref. 1, Section 4.1.4.2.3). These values are used to determine the water characteristic product. The Waste Characteristic Product is the product of the Ecosystem Toxicity/Persistence/ Factor Value and the Hazardous Waste Quantity Factor Value subject to a maximum product of 1 x 10⁸. This product is multiplied by the Ecosystem Bioaccumulation Potential Factor Value Subject to a maximum product of 1 x 10¹². Using HRS Table 4-20 and Table 15 of this HRS documentation record, the Ecosystem Toxicity/Persistence value for Aroclor-1254, benzo(a)anthracene, benzo(a)pyrene, cadmium, mercury, and pyrene is 10,000. A Hazardous Waste Quantity Factor Value of 10,000 is assigned from the sum of Source Hazardous Waste Quantity Value and the documented observed release (Ref. 1, Section 2.4.2.2, Table 2-6).
Ecosystem Toxicity/Persistence Factor Value= 10,000 Hazardous Waste Quantity Factor Value = 10,000
10,000 X 100 =1.0 X 10⁸ (Subject to a maximum product of 1.0 x 10⁸
The Ecosystem Bioaccumulation Value for Aroclor-1254, benzo(a)anthracene, benzo(a)pyrene, cadmium, mercury and pyrene is 50,000 (Ref. 2, pp. 2, 6-8 & 10).
Ecosystem Bioaccumulation Value = 50,000 (Ecosystem Toxicity/Persistence x Hazardous Waste Quantity) x Bioaccumulation Factor Value:
(1 X 108) X (50,000) = 5 x 10¹²
(Subject to a maximum product of 1 x 10¹²) A Waste Characteristics Product Value of 1 x 10¹² receives a Waste Characteristic Factor Value of 1,000 (Ref. 1, Table 2-7).
(Ecosystem Toxicity/Persistence Factor Value x Hazardous Waste Quantity Factor Value) x Bioaccumulation Factor Value: 1 x 10¹²
Waste Characteristics Factor Value: 1,000
94

SWOF/Environmental-Targets
4.1.4.3 ENVIRONMENTAL THREAT- TARGETS
4.1.4.3.1 Sensitive Environments
4.1.4.3.1.1 Level I Concentrations
No water, benthic, or tissue samples have been collected within the Surface Water Pathway; therefore, Level l concentrations are not being scored (Ref. 1, Sec. 4.1.4.3.1.1).
Level I Concentrations Factor Value: 0
95

SWOF/Environmental-Level II Concentrations
4.1.4.3.1.2 Level II Concentrations
Wetlands, as identified on National Wetland Inventory (NWI) as a PFO2/1F designation, palustrine forested needle-leaved deciduous/broad leaved deciduous wetland, meets the 40 CFR 230.3 definition of a wetland, are located on the southeast side of SBA and along the east bank of the Mermentau River, across from PPE 1 and PPE 2, and are contiguous with the Mermentau River (Ref. 4, pp. 116-127; Ref. 7, pp. 135 & 139-142; Ref. 10, pp. 1-4; Ref. 40, pp. 1-2). Level II concentrations have been established in the wetlands by chemical analysis of wetland samples that met observed release criteria (Tables 11 & 12). The total frontage of wetlands subject to Level II contamination is approximately 2,823 feet (Figure 5). The frontage of Wetland 1 is determined by the distance, approximately 1,380 feet, measured from PPE 1 (Sample SBA-029SD) to PPE 3 (SBA-030SD) along the left descending bank of the Mermentau River and the continuous wetland (Figure 5). The frontage for Wetland 2 is determined by the distance, approximately 1,160 feet, measured from the northwest corner of the wetlands (SBA-033SD) to the Mermentau River (Figure 5). The frontage of Wetland 3 is determined to by the length of the Former Water Pit 3, approximately 283 feet (Ref. 6, p. 8). A value of 25 is assigned from Table 4-24 of the HRS for the approximate 2,823 feet of wetland subject to Level II contamination (Ref. 1, sec. 4.1.4.3.1.2). Threatened and endangered species have been reported within the general area; however, it is not known if their habitats overlap the zone of Level II contamination therefore, these other sensitive environments will not be evaluated. The Level II concentration factor value is the sum of the wetlands value (25) and sensitive environments value (0): 25 + 0 = 25
Level II Concentrations Factor Value: 25 (Ref. 1, Sec. 4.1.4.3.1.2 and Table 4-24)
96

SWOF/Environmental-Potential Contamination
4.1.4.3.1.3 Potential Contamination
Wetlands
Palustrine forested needle-leaved deciduous/broad leaved deciduous wetlands, as identified on NWI that are semi-permanently flooded are located on the frontage along the Mermentau River and Lake Arthur (Ref. 4, pp. 116 & 119-127; Ref. 7, pp. 140-141; Ref. 10, pp. 1-4; Ref. 40, pp. 1-2). These wetlands meet the criteria as defined in 40 CFR 230.3, classified in the palustrine system and subcategory of a forested wetland (Ref. 10, pp. 1 - 4). The wetland frontage along the Mermentau River was measured from National Wetland Inventory (NWI) maps (Ref. 10, p. 5).
Type of Surface Water Body
Wetland Frontage (miles) Reference
Wetland Value (Ref. 1, Table 4-24)
Mermentau River 20.4 Ref. 10, p. 2; Figure 6 500 Lake Arthur 4.05 Ref. 10, p. 2; Figure 6 150
To obtain the Potential Contamination Factor Value, the sum of the sensitive environments value is added to the wetland value, which is then multiplied by the assigned dilution for each in-water segment. This value is then divided by 10 to obtain the Potential Contamination Factor Value (Ref. 1, Section 4.1.4.3.1.3).
Type of Surface Water Body
Sum of Sensitive Environment Values (Sj)
Wetland Frontage Value
(Wj)
Adjusted Dilution
Weight (Dj)
(Wj + Sj)Dj
Mermentau River 0 500 .001 0.5 Lake Arthur 0 150 .001 0.15
Potential Contamination Factor Value 0.65/10 = 0.065
Sum of Sensitive Environments Value+ Wetland Value: 0 Potential Contamination Factor Value: 0.065
97

SWOF/Environmental-Factor Category Value
4.1.4.3.1.4 Environmental Threat- Targets Factor Category Value
The environmental threat target factor category value for the watershed is the sum of the values for the Level l (0), Level II (25), and Potential Contamination factors (0.065) (Ref. 1, Section 4.1.4.3.1.4).
0 + 25 + 0.065 = 25.065
4.1.4.4 Calculation of Environmental Threat Score
The environmental threat score is calculated by multiplying the environmental threat factor category values for likelihood of release (550), waste characteristics (1,000), and targets (25.07) for the watershed; rounding the product to the nearest integer; and dividing by 82,500. The resulting value (167.13), subject to a maximum of 60, is assigned as the environmental threat score for the watershed (Ref. 1, Sections 4.1.4.4 and 4.1.4.3.1.4). Calculations:
550 X 1,000 X 25.065 = 13,785,750/82,500 = 167.1 (subject to a maximum of 60)
4.1.5 Calculation of Overland/Flood Migration Component Score for a Watershed
The overland/flood migration component score for the watershed is calculated by summing the scores for the drinking water threat (0), human food chain threat (100), and environmental threat (60) assigned as the surface water overland/flood migration component score for a watershed (Ref. 1, Section 4.1.5). Calculations:
0 + 100 + 60 = 160 (subject to a maximum value of 100)
4.1.6 Calculation of Overland/Flood Migration Component Score
The highest surface water overland/flood migration component score from the watersheds evaluated (in this case, only one watershed was evaluated) is selected and assigned as the surface water overland/flood migration component score for the site, subject to a maximum of 100. The overland/flood migration component score is assigned a value of 100 (Ref. 1, Section 4.1.6).
98

SWOF–Pathway Score
4.2 GROUND WATER TO SURFACE WATER MIGRATION COMPONENT
This component was not scored because an observed release was documented for the overland flow/flood component.
4.3 CALCULATION OF SURFACE WATER MIGRATION PATHWAY SCORE
The overland/flood migration component was scored and this value (100) is assigned to the surface water migration pathway score.
Ground Water to Surface Water Factor Value: NS Surface Water Migration Pathway Score: 100
99