REVISED GUIDELINES ON EVACUATION ANALYSIS FOR NEW AND ... · MSC.1/Circ.1533 ...
46
https://edocs.imo.org/Final Documents/English/MSC.1-CIRC.1533 (E).docx E 4 ALBERT EMBANKMENT LONDON SE1 7SR Telephone: +44 (0)20 7735 7611 Fax: +44 (0)20 7587 3210 MSC.1/Circ.1533 6 June 2016 REVISED GUIDELINES ON EVACUATION ANALYSIS FOR NEW AND EXISTING PASSENGER SHIPS 1 The Maritime Safety Committee, at its seventy-first session (19 to 28 May 1999), having approved the Interim guidelines for a simplified evacuation analysis of ro-ro passenger ships (MSC/Circ.909) as a guide for the implementation of SOLAS regulation II-2/28-1.3, requested the Sub-Committee on Fire Protection (FP) to also develop guidelines on evacuation analysis for passenger ships in general and high-speed passenger craft. 2 The Committee, at its seventy-fourth session (30 May to 8 June 2001), following a recommendation of the forty-fifth session of the FP Sub-Committee (8 to 12 January 2001), approved the Interim guidelines for a simplified evacuation analysis of high-speed passenger craft (MSC/Circ.1001). The Committee, at its eightieth session (11 to 20 May 2005), after having considered a proposal by the forty-ninth session of the FP Sub-Committee (24 to 28 January 2005) in light of the experience gained in the application of the aforementioned interim guidelines, approved the Guidelines for a simplified evacuation analysis of high-speed passenger craft (MSC/Circ.1166), which superseded MSC/Circ.1001, together with the worked example appended thereto. 3 The Committee, at its seventy-fifth session (15 to 24 May 2002), further approved the Interim guidelines on evacuation analyses for new and existing passenger ships (MSC/Circ.1033) and invited Member States to collect and submit to the FP Sub-Committee for further consideration, any information and data resulting from research and development activities, full-scale tests and findings on human behaviour which may be relevant for the necessary future upgrading of the interim guidelines. 4 The Committee, at its eighty-third session (3 to 12 October 2007), approved the Guidelines on evacuation analyses for new and existing passenger ships (MSC.1/Circ.1238), including ro-ro passenger ships. 5 The Committee, at its ninety-sixth session (11 to 20 May 2016), approved the Revised Guidelines on evacuation analyses for new and existing passenger ships, as set out in the annexes, as a guide for the implementation of amendments to SOLAS regulation II-2/13.3.2.7 1 , making evacuation analysis mandatory not only for ro-ro passenger ships but also for other passenger ships constructed on or after 1 January 2020. 1 The amendments to SOLAS regulation II-2/13.3.2.7 were adopted by the Committee, at its ninety-sixth session (11 to 20 May 2016) and are expected to enter into force on 1 January 2020.
Transcript of REVISED GUIDELINES ON EVACUATION ANALYSIS FOR NEW AND ... · MSC.1/Circ.1533 ...

https://edocs.imo.org/Final Documents/English/MSC.1-CIRC.1533 (E).docx
E
4 ALBERT EMBANKMENT
LONDON SE1 7SR Telephone: +44 (0)20 7735 7611 Fax: +44 (0)20 7587 3210
MSC.1/Circ.1533 6 June 2016
REVISED GUIDELINES ON EVACUATION ANALYSIS FOR NEW AND EXISTING PASSENGER SHIPS
1 The Maritime Safety Committee, at its seventy-first session (19 to 28 May 1999), having approved the Interim guidelines for a simplified evacuation analysis of ro-ro passenger ships (MSC/Circ.909) as a guide for the implementation of SOLAS regulation II-2/28-1.3, requested the Sub-Committee on Fire Protection (FP) to also develop guidelines on evacuation analysis for passenger ships in general and high-speed passenger craft. 2 The Committee, at its seventy-fourth session (30 May to 8 June 2001), following a recommendation of the forty-fifth session of the FP Sub-Committee (8 to 12 January 2001), approved the Interim guidelines for a simplified evacuation analysis of high-speed passenger craft (MSC/Circ.1001). The Committee, at its eightieth session (11 to 20 May 2005), after having considered a proposal by the forty-ninth session of the FP Sub-Committee (24 to 28 January 2005) in light of the experience gained in the application of the aforementioned interim guidelines, approved the Guidelines for a simplified evacuation analysis of high-speed passenger craft (MSC/Circ.1166), which superseded MSC/Circ.1001, together with the worked example appended thereto. 3 The Committee, at its seventy-fifth session (15 to 24 May 2002), further approved the Interim guidelines on evacuation analyses for new and existing passenger ships (MSC/Circ.1033) and invited Member States to collect and submit to the FP Sub-Committee for further consideration, any information and data resulting from research and development activities, full-scale tests and findings on human behaviour which may be relevant for the necessary future upgrading of the interim guidelines. 4 The Committee, at its eighty-third session (3 to 12 October 2007), approved the Guidelines on evacuation analyses for new and existing passenger ships (MSC.1/Circ.1238), including ro-ro passenger ships. 5 The Committee, at its ninety-sixth session (11 to 20 May 2016), approved the Revised Guidelines on evacuation analyses for new and existing passenger ships, as set out in the annexes, as a guide for the implementation of amendments to SOLAS regulation II-2/13.3.2.71, making evacuation analysis mandatory not only for ro-ro passenger ships but also for other passenger ships constructed on or after 1 January 2020.
1 The amendments to SOLAS regulation II-2/13.3.2.7 were adopted by the Committee, at its ninety-sixth
session (11 to 20 May 2016) and are expected to enter into force on 1 January 2020.

MSC.1/Circ.1533 Page 2
https://edocs.imo.org/Final Documents/English/MSC.1-CIRC.1533 (E).docx
6 The annexed revised guidelines offer the possibility of using two distinct methods:
.1 a simplified evacuation analysis (annex 2); and/or .2 an advanced evacuation analysis (annex 3).
7 The assumptions inherent within the simplified method are by their nature limiting. As the complexity of the ships increases (through the mix of passenger types, accommodation types, number of decks and number of stairways), these assumptions become less representative of reality. In such cases, the use of the advanced method would be preferred. However, in early design iterations of the ship, the simplified method has merit due to its relative ease of use and its ability to provide an approximation to expected evacuation performance. 8 It is also to be noted that the acceptable evacuation durations in these guidelines are based on an analysis of fire risk. 9 Member States are invited to bring the annexed guidelines (annexes 1 to 3) to the attention of all those concerned and, in particular, to:
.1 recommend them to use these guidelines when conducting evacuation analyses, early in the design process, on new ro-ro passenger ships in compliance with SOLAS regulation II-2/13.7.4 (which entered into force on 1 July 2002) and SOLAS regulation II-2/13.3.2.7 (which is expected to enter into force on 1 January 2020);
.2 recommend them to use these guidelines when conducting evacuation
analyses, early in the design process, on new passenger ships other than ro-ro passenger ships constructed on or after 1 January 2020 carrying more than 36 passengers in compliance with SOLAS regulation II-2/13.3.2.7 (which is expected to enter into force on 1 January 2020); and
.3 encourage them to conduct evacuation analyses on existing passenger ships
using these guidelines. 10 Member States are also encouraged to:
.1 collect and submit to the Sub-Committee on Ship Systems and Equipment for further consideration, any information and data resulting from research and development activities, full-scale tests and findings on human behaviour, which may be relevant for the necessary future upgrading of the present guidelines;
.2 submit to the Sub-Committee on Ship Systems and Equipment information
on experience gained in the implementation of the guidelines; and .3 use the Guidance on validation/verification of evacuation simulation tools
provided in annex 3 to the present circular when assessing the ability of evacuation simulation tools to perform an advanced evacuation analysis.
11 This circular supersedes MSC.1/Circ.1238.
***
MSC.1/Circ.1533 Annex 1, page 1
https://edocs.imo.org/Final Documents/English/MSC.1-CIRC.1533 (E).docx
ANNEX 1
REVISED GUIDELINES ON EVACUATION ANALYSIS FOR NEW AND EXISTING PASSENGER SHIPS
Preamble
1 The following information is provided for consideration by, and guidance to, the users of these guidelines:
.1 To ensure uniformity of application, typical benchmark scenarios and relevant data are specified in the guidelines. Therefore, the aim of the analysis is to assess the performance of the ship with regard to the benchmark scenarios rather than simulating an actual emergency.
.2 Although the approach is, from a theoretical and mathematical point of view, sufficiently developed to deal with realistic simulations of evacuation on board ships, there is still a shortfall in the amount of verification data and practical experience on its application. When suitable information is provided by Member Governments, the Organization should reappraise the figures, parameters, benchmark scenarios and performance standards defined in the interim guidelines.
.3 Almost all the data and parameters given in the guidelines are based on well-documented data coming from civil building experience. The data and results from ongoing research and development show the importance of such data for improving the interim guidelines. Nevertheless, the simulation of these benchmark scenarios are expected to improve ship design by identifying inadequate escape arrangements, congestion points and optimizing evacuation arrangements, thereby significantly enhancing safety.
2 For the above considerations, it is recommended that:
.1 the evacuation analysis be carried out as indicated in the guidelines, in particular using the scenarios and parameters provided;
.2 the objective should be to assess the evacuation process through benchmark cases rather than trying to model the evacuation in real emergency conditions;
.3 application of the guidelines to analyse actual events to the greatest extent possible, where passengers were called to assembly stations during a drill or where a passenger ship was actually evacuated under emergency conditions, would be beneficial in validating the guidelines;
.4 the aim of the evacuation analysis for existing passenger ships should be to identify congestion points and/or critical areas and to provide recommendations as to where these points and critical areas are located on board; and
.5 keeping in mind that it is the company's responsibility to ensure passenger and crew safety by means of operational measures, if the result of an analysis, conducted on an existing passenger ship shows that the maximum allowable evacuation duration has been exceeded, then the company should ensure that suitable operational measures (e.g. updates of the onboard emergency procedures, improved signage, emergency preparedness of the crew, etc.) are implemented.
MSC.1/Circ.1533 Annex 1, page 2
https://edocs.imo.org/Final Documents/English/MSC.1-CIRC.1533 (E).docx
1 General
The purpose of this part of the guidelines is to present the methodology for conducting an evacuation analysis and, in particular, to:
.1 confirm that the performance standards set out in these guidelines can be
met; .2 identify and eliminate, as far as practicable, congestion which may develop
during an abandonment, due to normal movement of passengers and crew along escape routes, taking into account the possibility that crew may need to move along these routes in a direction opposite the movement of passengers;
.3 demonstrate that escape arrangements are sufficiently flexible to provide for
the possibility that certain escape routes, assembly stations, embarkation stations or survival craft may be unavailable as a result of a casualty;
.4 identify areas of intense counter and cross flows; and .5 provide information gained by the evacuation analysis to the operators.
2 Definitions 2.1 Persons load is the number of persons considered in the means of escape calculations contained in chapter 13 of the International Code for Fire Safety Systems (FSS Code) (resolution MSC.98(73)). 2.2 Response duration (R) is the duration it takes for people to react to the situation. This duration begins upon initial notification (e.g. alarm) of an emergency and ends when the passenger has accepted the situation and begins to move towards an assembly station. 2.3 Individual travel duration is the duration incurred by an individual in moving from its starting location to reach the assembly station. 2.4 Individual assembly duration is the sum of the individual response and the individual travel duration. 2.5 Total assembly duration (tA) is the maximum individual assembly duration. 2.6 Total travel duration (T) is the duration it takes for all persons on board to move from where they are upon notification to the assembly stations. 2.7 Embarkation and launching duration (E+L) is the duration required to provide for abandonment by the total number of persons on board, starting from the time the abandon ship signal is given after all persons have been assembled, with lifejackets donned.

MSC.1/Circ.1533 Annex 1, page 3
https://edocs.imo.org/Final Documents/English/MSC.1-CIRC.1533 (E).docx
3 Method of evaluation
The steps in the evacuation analysis are specified as below.
3.1 Description of the system:
.1 Identification of passenger and crew assembly stations.
.2 Identification of escape routes. 3.2 Common assumptions This method of estimating the evacuation duration is based on several idealized benchmark scenarios and the following assumptions are made: .1 passengers and crew will evacuate via the main escape route towards their
assigned assembly station, as referred to in SOLAS regulation II-2/13; .2 passenger load and initial distribution are based on chapter 13 of the
FSS Code; .3 full availability of escape arrangements is considered, unless otherwise
stated; .4 assisting crew will immediately be at the evacuation duty locations ready to
assist the passengers;
.5 smoke, heat and toxic fire products are not considered to impact passenger/crew performance;
.6 family group behaviour is not considered; and .7 ship motion, heel, and trim are not considered.
4 Scenarios to be considered 4.1 As a minimum, four scenarios (cases 1 to 4) should be considered for the analysis as follows. If more detailed data considering the crew distribution is available, it may be used. .1 case 1 (primary evacuation case, night) and case 2 (primary evacuation
case, day) in accordance with chapter 13 of the FSS Code.
.2 case 3 (secondary evacuation cases, night) and case 4 (secondary evacuation cases, day). In these cases only the main vertical zone, which generates the longest individual assembly duration, is further investigated. These cases utilize the same population demographics as the primary evacuation cases. The following are two alternatives that should be considered for both cases 3 and 4. For ro-ro passenger ships, alternative 1 should be the preferred option:
.1 alternative 1: one complete run of the stairways having largest
capacity previously used within the identified main vertical zone is considered unavailable for the simulation; or

MSC.1/Circ.1533 Annex 1, page 4
https://edocs.imo.org/Final Documents/English/MSC.1-CIRC.1533 (E).docx
.2 alternative 2: 50% of the persons in one of the main vertical zones neighbouring the identified main vertical zone are forced to move into the zone and to proceed to the relevant assembly station. The neighbouring zone with the largest population should be selected.
4.2 The following additional scenarios may be considered as appropriate:
.1 case 5 (Open Deck): If an open deck is outfitted for use by passengers and its gross deck surface area is larger than 400 m² or accommodates more than 200 persons, the following, additional day case should be analysed: All persons are to be distributed as defined in the primary day case (case 2) considering the open deck as an additional public space with an initial density of 0.5 persons/m², calculated using the gross deck surface area.
.2 case 6 (Embarkation): If separate embarkation and assembly stations are
employed, an analysis of travel duration from assembly station to the entry point of LSA should be taken into account in the process of determining embarkation and launching duration (E+L). All persons which the ship is certified to carry are initially distributed according to the designated capacities of the assembly stations. The persons will move to the entry point of LSA according to the operator's procedures and designated routes. The time for boarding the LSA is determined during LSA prototype test and thus need not be addressed in detail in the simulation. However, congestion directly in front of the LSA should be considered as part of the simulation. These congestions need to be considered as blockage or obstacle for passenger and crew passing, i.e. generated with a LSA entry flow rate equal to the one observed during the LSA test.
4.3 If the total number of persons on board calculated, as indicated in the above cases, exceeds the maximum number of persons the ship will be certified to carry, the initial distribution of people should be scaled down so that the total number of persons is equal to what the ship will be certified to carry. 5 Performance standards 5.1 The following performance standards, as illustrated in figure 5.1, should be complied with:
Calculated total evacuation duration:
1.25 (R+T) + 2/3 (E+L) n (1)
(E+L) 30 min (2) 5.2 In performance standard (1):
.1 for ro-ro passenger ships, n = 60; and .2 for passenger ships other than ro-ro passenger ships, n = 60 if the ship has
no more than three main vertical zones; and 80, if the ship has more than three main vertical zones.
5.3 Performance standard (2) complies with SOLAS regulation III/21.1.3.

MSC.1/Circ.1533 Annex 1, page 5
https://edocs.imo.org/Final Documents/English/MSC.1-CIRC.1533 (E).docx
(1) according to detailed specification of analysis method (2) calculated as in the annexes to these guidelines (3) maximum 30 min in compliance with SOLAS regulation III/21.1.3 (4) overlap duration = 1/3 (E+L) (5) values of n (min) provided in 5.2
Figure 5.1
5.4 E + L should be calculated separately based upon: .1 results of full scale trials on similar ships and evacuation systems;
.2 results of a simulation based embarkation analysis; or
.3 data provided by the manufacturers. However, in this case, the method of
calculation should be documented, including the value of correction factor used.
The embarkation and launching duration (E+L) should be clearly documented to be available in case of change of LSA. 5.5 For cases where neither of the three above methods can be used, (E+L) should be assumed equal to 30 min. 6 Documentation
The documentation of the analysis should report on the following items:
.1 basic assumptions for the analysis;
.2 schematic representation of the layout of the zones subjected to the analysis;
.3 initial distribution of persons for each considered scenario; .4 methodology used for the analysis if different from these guidelines;

MSC.1/Circ.1533 Annex 1, page 6
https://edocs.imo.org/Final Documents/English/MSC.1-CIRC.1533 (E).docx
.5 details of the calculations;
.6 total evacuation duration;
.7 identified congestion points; and
.8 identified areas of counter and crossing flows.
7 Corrective actions
7.1 For new ships, if the total evacuation duration calculated is in excess of the allowed total evacuation duration, corrective actions should be considered at the design stage by suitably modifying the arrangements affecting the evacuation system in order to reach an acceptable total evacuation duration. 7.2 For existing ships, if the total evacuation duration calculated is in excess of the allowed total evacuation duration, onboard evacuation procedures should be reviewed with a view toward taking appropriate actions which would reduce congestion which may be experienced in locations as indicated by the analysis.
***

MSC.1/Circ.1533 Annex 2, page 1
https://edocs.imo.org/Final Documents/English/MSC.1-CIRC.1533 (E).docx
ANNEX 2
GUIDELINES FOR A SIMPLIFIED EVACUATION ANALYSIS FOR NEW AND EXISTING PASSENGER SHIPS
1 Specific assumptions This method of estimating evacuation duration is basic in nature and, therefore, common evacuation analysis assumptions should be made as follows:
.1 all passengers and crew will begin evacuation at the same time and will not
hinder each other;
.2 initial walking speed depends on the density of persons, assuming that the flow is only in the direction of the escape route, and that there is no overtaking;
.3 people can move unhindered;
.4 counterflow is accounted for by a counterflow correction factor; and
.5 simplifications are accounted for in a correction factor and a safety factor.
The safety factor has a value of 1.25. 2 Calculation of the evacuation duration The following components should be considered:
.1 response duration (R) should be 10 min for the night time scenarios
and 5 min for the day time scenarios;
.2 method to calculate the travel duration (T) is given in appendix 1; and
.3 embarkation and launching duration (E+L). 3 Identification of congestion Congestion is identified by the following criteria:
.1 initial density equal to, or greater than, 3.5 persons/m2; and
.2 the difference between inlet and outlet of calculated flows (FC) is larger
than 1.5 persons per second.

MSC.1/Circ.1533 Annex 2, page 2
https://edocs.imo.org/Final Documents/English/MSC.1-CIRC.1533 (E).docx
APPENDIX 1
METHOD TO CALCULATE THE TRAVEL DURATION (T)
1 Parameters to be considered 1.1 Clear width (Wc)
Clear width is measured off the handrail(s) for corridors and stairways and the actual passage width of a door in its fully open position. 1.2 Initial density of persons (D) The initial density of persons in an escape route is the number of persons (p) divided by the available escape route area pertinent to the space where the persons are originally located and expressed in (p/m2). 1.3 Speed of persons (S) The speed (m/s) of persons along the escape route depends on the specific flow of persons (as defined in paragraph 1.4) and on the type of escape facility. People speed values are given in tables 1.1 (initial speed) and 1.3 below (speed after transition point as a function of specific flow). 1.4 Specific flow of persons (Fs) Specific flow (p/m/s) is the number of escaping persons past a point in the escape route per unit time per unit of clear width Wc of the route involved. Values of FS are given in tables 1.1 (initial Fs as a function of initial density) and 1.2 (maximum value) below.
Table 1.12 – Values of initial specific flow and initial speed as a function of density
Type of facility Initial density
D (p/m2) Initial specific flow Fs (p/m/s)
Initial speed of persons S (m/s)
Corridors
0 0 1.2
0.5 0.65 1.2
1,9 1.3 0.67
3.2 0.65 0.20
3.5 0.32 0.10
Table 1.22 – Value of maximum specific flow
Type of facility Maximum specific flow Fs (p/m/s)
Stairs (down) 1.1
Stairs (up) 0.88
Corridors 1.3
Doorways 1.3
2 Data derived from land-based stairs, corridors and doors in civil building and extracted from the publication
SFPE Fire Protection Engineering Handbook, 2nd edition, NFPA 1995.

MSC.1/Circ.1533 Annex 2, page 3
https://edocs.imo.org/Final Documents/English/MSC.1-CIRC.1533 (E).docx
Table 1.32 – Values of specific flow and speed
Type of facility Specific flow Fs (p/m/s) Speed of persons S
(m/s)
Stairs (down)
0 1.0
0.54 1.0
1.1 0.55
Stairs (up)
0 0.8
0.43 0.8
0.88 0.44
Corridors
0 1.2
0.65 1.2
1.3 0.67
1.5 Calculated flow of persons (Fc)
The calculated flow of persons (p/s) is the predicted number of persons passing a particular point in an escape route per unit time. It is obtained from:
Fc = Fs Wc (1.5) 1.6 Flow duration (tF)
Flow duration (s) is the total duration needed for N persons to move past a point in the egress system, and is calculated as:
tF = N / Fc (1.6) 1.7 Transitions
Transitions are those points in the egress system where the type (e.g. from a corridor to a stairway) or dimension of a route changes or where routes merge or ramify. In a transition, the sum of all the outlet-calculated flow is equal to the sum of all the inlet-calculated flow:
Σ Fc(in)i = Σ Fc(out)j (1.7)
where:
Fc(in)i = calculated flow of route (i) arriving at transition point Fc(out)j = calculated flow of route (j) departing from transition point
1.8 Travel duration T, correction factor and counterflow correction factor
Travel duration T expressed in seconds as given by:
T = (+ ) tI (1.8)
where:
= is the correction factor to be taken equal to 2 for cases 1 and 2 and 1.3 for cases 3 and 4;
= is the counterflow correction factor to be taken equal to 0.3; and
2 Data derived from land-based stairs, corridors and doors in civil building and extracted from the publication
SFPE Fire Protection Engineering Handbook, 2nd edition, NFPA 1995.

MSC.1/Circ.1533 Annex 2, page 4
https://edocs.imo.org/Final Documents/English/MSC.1-CIRC.1533 (E).docx
tI = is the highest travel duration expressed in seconds in ideal conditions resulting from application of the calculation procedure outlined in paragraph 2 of this appendix.
2 Procedure for calculating the travel duration in ideal conditions 2.1 Symbols To illustrate the procedure, the following notation is used:
tstair = stairway travel duration (s) of the escape route to the assembly station
tdeck = travel duration (s) to move from the farthest point of the escape route of a deck to the stairway
tassembly = travel duration (s) to move from the end of the stairway to the entrance of the assigned assembly station
2.2 Quantification of flow duration The basic steps of the calculation are the following:
.1 Schematization of the escape routes as a hydraulic network, where the pipes
are the corridors and stairways, the valves are the doors and restrictions in general, and the tanks are the public spaces.
.2 Calculation of the density D in the main escape routes of each deck. In the
case of cabin rows facing a corridor, it is assumed that the people in the cabins simultaneously move into the corridor; the corridor density is, therefore, the number of cabin occupants per corridor unit area calculated considering the clear width. For public spaces, it is assumed that all persons simultaneously begin the evacuation at the exit door (the specific flow to be used in the calculations is the door's maximum specific flow); the number of evacuees using each door may be assumed proportional to the door clear width.
.3 Calculation of the initial specific flows Fs, by linear interpolation from
table 1.1, as a function of the densities. .4 Calculation of the flow Fc for corridors and doors, in the direction of the
correspondent assigned escape stairway. .5 Once a transition point is reached; formula (1.7) is used to obtain the outlet
calculated flow(s) Fc. In cases where two or more routes leave the transition point, it is assumed that the flow Fc of each route is proportional to its clear width. The outlet specific flow(s), Fs, is obtained as the outlet calculated flow(s) divided by the clear width(s); two possibilities exist:
.1 Fs does not exceed the maximum value of table 1.2; the
corresponding outlet speed (S) is then taken by linear interpolation from table 1.3, as a function of the specific flow; or

MSC.1/Circ.1533 Annex 2, page 5
https://edocs.imo.org/Final Documents/English/MSC.1-CIRC.1533 (E).docx
.2 Fs exceeds the maximum value of table 1.2 above; in this case, a queue will form at the transition point, Fs is the maximum of table 1.2 and the corresponding outlet speed (S) is taken from table 1.3.
.6 The above procedure is repeated for each deck, resulting in a set of values
of calculated flows Fc and speed S, each entering the assigned escape stairway.
.7 Calculation, from N (number of persons entering a flight or corridor) and from
the relevant Fc, of the flow duration tF of each stairway and corridor. The flow duration tF of each escape route is the longest among those corresponding to each portion of the escape route.
.8 Calculation of the travel duration tdeck from the farthest point of each escape
route to the stairway, is defined as the ratio of length/speed. For the various portions of the escape route, the travel durations should be summed up if the portions are used in series, otherwise the largest among them should be adopted. This calculation should be performed for each deck; as the people are assumed to move in parallel on each deck to the assigned stairway, the dominant value tdeck should be taken as the largest among them. No tdeck is calculated for public spaces.
.9 Calculation, for each stair flight, of its travel duration as the ratio of inclined
stair flight length and speed. For each deck, the total stair travel duration, tstair, is the sum of the travel durations of all stairs flights connecting the deck with the assembly station.
.10 Calculation of the travel duration tassembly from the end of the stairway (at the
assembly station deck) to the entrance of the assembly station. .11 The overall duration to travel along an escape route to the assigned
assembly station is:
tI = tF + tdeck + tstair + tassembly (2.2.11)
.12 The procedure should be repeated for both the day and night cases. This will result in two values (one for each case) of tI for each main escape route leading to the assigned assembly station.
.13 Congestion points are identified as follows:
.1 in those spaces where the initial density is equal, or greater
than, 3.5 persons/m2; and .2 in those locations where the difference between inlet and outlet
calculated flows (FC) is in more than 1.5 persons per second.
.14 Once the calculation is performed for all the escape routes, the highest tI should be selected for calculating the travel duration T using formula (1.8).

MSC.1/Circ.1533 Annex 2, page 6
https://edocs.imo.org/Final Documents/English/MSC.1-CIRC.1533 (E).docx
APPENDIX 2
EXAMPLE OF APPLICATION
1 General 1.1 This example provides an illustration on the application of the guidelines regarding cases 1 and 2. Therefore, it should not be viewed as a comprehensive and complete analysis nor as an indication of the data to be used. 1.2 The present example refers to an early design analysis of arrangements of a hypothetical new cruise ship. Moreover, the performance standard is assumed to be 60 min, as for ro-ro passenger ships. It should be noted that, at the time this example was developed, no such requirement is applicable for passenger ships other than ro-ro passenger ships. This example is, therefore, to be considered purely illustrative.
2 Ship characteristics 2.1 The example is limited to two main vertical zones (MVZ 1 and MVZ 2) of a hypothetical cruise ship. For MVZ 1, a night scenario is considered, hereinafter called case 1 (see figure 1) while a day scenario (case 2, see figure 2) is considered for MVZ 2. 2.2 In case 1, the initial distribution corresponds to a total of 449 persons located in the crew and passengers cabins as follows: 42 in deck 5; 65 in deck 6 (42 in the fore part and 23 in the aft part); 26 in deck 7; 110 in deck 9; 96 in deck 10; and 110 in deck 11. Deck 8 (assembly station) is empty. 2.3 In case 2, the initial distribution corresponds to a total of 1,138 persons located in the public spaces as follows: 469 in deck 6; 469 in deck 7; and 200 in deck 9. Deck 8 (assembly station) is empty.
3 Description of the system
3.1 Identification of assembly stations
For both MVZ 1 and MVZ 2, the assembly stations are located at deck 8, which is also the embarkation deck. 3.2 Identification of escape routes
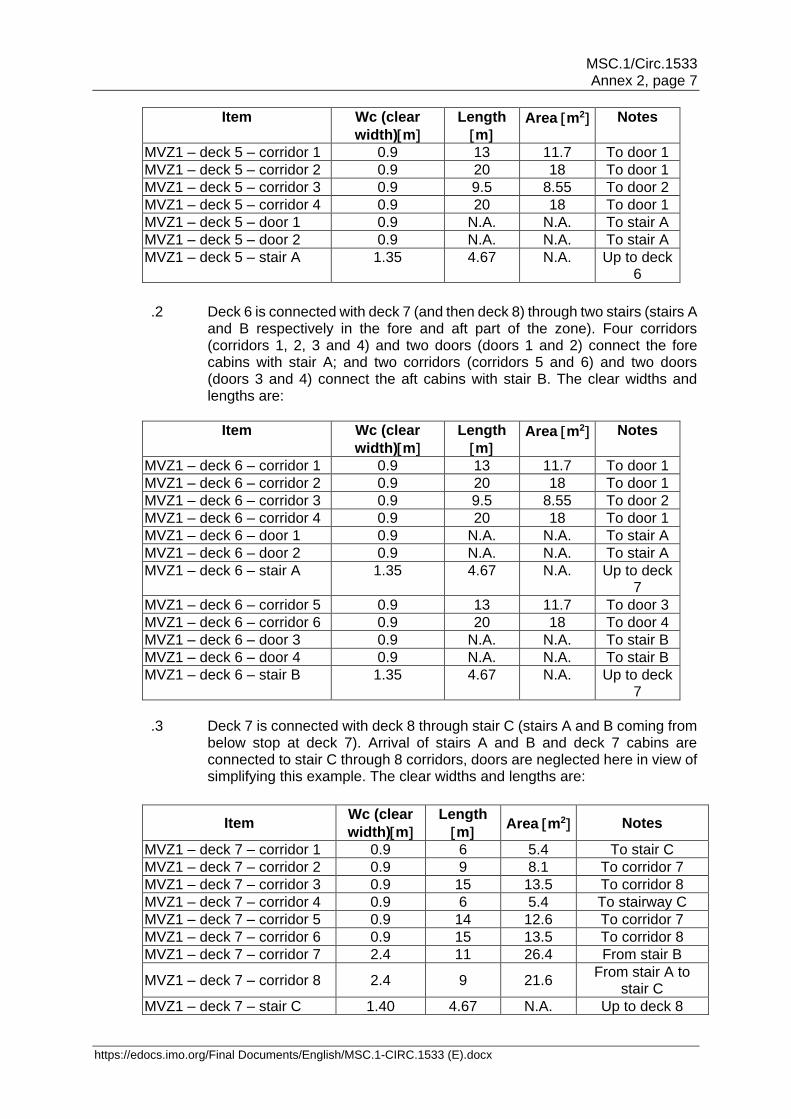
3.2.1 In MVZ 1, the escape routes are as follows (see figure 3):
.1 Deck 5 is connected with deck 6 (and then deck 8 where assembly stations are located) through one stair (stair A) in the fore part of the zone. Four corridors (corridors 1, 2, 3 and 4) and two doors (respectively door 1 and 2) connect the cabins with stair A. The clear widths and lengths are:
MSC.1/Circ.1533 Annex 2, page 7
https://edocs.imo.org/Final Documents/English/MSC.1-CIRC.1533 (E).docx
Item Wc (clear
width)m
Length
m Area m2 Notes
MVZ1 – deck 5 – corridor 1 0.9 13 11.7 To door 1
MVZ1 – deck 5 – corridor 2 0.9 20 18 To door 1
MVZ1 – deck 5 – corridor 3 0.9 9.5 8.55 To door 2
MVZ1 – deck 5 – corridor 4 0.9 20 18 To door 1
MVZ1 – deck 5 – door 1 0.9 N.A. N.A. To stair A
MVZ1 – deck 5 – door 2 0.9 N.A. N.A. To stair A
MVZ1 – deck 5 – stair A 1.35 4.67 N.A. Up to deck 6
.2 Deck 6 is connected with deck 7 (and then deck 8) through two stairs (stairs A and B respectively in the fore and aft part of the zone). Four corridors (corridors 1, 2, 3 and 4) and two doors (doors 1 and 2) connect the fore cabins with stair A; and two corridors (corridors 5 and 6) and two doors (doors 3 and 4) connect the aft cabins with stair B. The clear widths and lengths are:
Item Wc (clear
width)m
Length
m Area m2 Notes
MVZ1 – deck 6 – corridor 1 0.9 13 11.7 To door 1
MVZ1 – deck 6 – corridor 2 0.9 20 18 To door 1
MVZ1 – deck 6 – corridor 3 0.9 9.5 8.55 To door 2
MVZ1 – deck 6 – corridor 4 0.9 20 18 To door 1
MVZ1 – deck 6 – door 1 0.9 N.A. N.A. To stair A
MVZ1 – deck 6 – door 2 0.9 N.A. N.A. To stair A
MVZ1 – deck 6 – stair A 1.35 4.67 N.A. Up to deck 7
MVZ1 – deck 6 – corridor 5 0.9 13 11.7 To door 3
MVZ1 – deck 6 – corridor 6 0.9 20 18 To door 4
MVZ1 – deck 6 – door 3 0.9 N.A. N.A. To stair B
MVZ1 – deck 6 – door 4 0.9 N.A. N.A. To stair B
MVZ1 – deck 6 – stair B 1.35 4.67 N.A. Up to deck 7
.3 Deck 7 is connected with deck 8 through stair C (stairs A and B coming from
below stop at deck 7). Arrival of stairs A and B and deck 7 cabins are connected to stair C through 8 corridors, doors are neglected here in view of simplifying this example. The clear widths and lengths are:
Item Wc (clear
width)m
Length
m Area m2 Notes
MVZ1 – deck 7 – corridor 1 0.9 6 5.4 To stair C
MVZ1 – deck 7 – corridor 2 0.9 9 8.1 To corridor 7
MVZ1 – deck 7 – corridor 3 0.9 15 13.5 To corridor 8
MVZ1 – deck 7 – corridor 4 0.9 6 5.4 To stairway C
MVZ1 – deck 7 – corridor 5 0.9 14 12.6 To corridor 7
MVZ1 – deck 7 – corridor 6 0.9 15 13.5 To corridor 8
MVZ1 – deck 7 – corridor 7 2.4 11 26.4 From stair B
MVZ1 – deck 7 – corridor 8 2.4 9 21.6 From stair A to
stair C
MVZ1 – deck 7 – stair C 1.40 4.67 N.A. Up to deck 8

MSC.1/Circ.1533 Annex 2, page 8
https://edocs.imo.org/Final Documents/English/MSC.1-CIRC.1533 (E).docx
.4 Deck 11 is connected with deck 10 through a double stair (stair C) in the aft part of the zone. Two corridors (corridor 1 and 2) connect the cabins with stair C through two doors (respectively doors 1 and 2). The clear widths and lengths are:
Item Wc (clear
width)m
Length
m Area m2 Notes
MVZ1 – deck 11 – corridor 1 0.9 36 32.4 To door 1
MVZ1 – deck 11 – corridor 2 0.9 36 32.4 To door 2
MVZ1 – deck 11 – door 1 0.9 N.A. N.A. To stair C
MVZ1 – deck 11 – door 2 0.9 N.A. N.A. To stair C
MVZ1 – deck 11 – stair C 2.8 4.67 N.A. down to deck 10
.5 Deck 10 has a similar arrangement as deck 11. The clear widths and lengths
are:
Item Wc (clear
width)m
Length
m Area m2 Notes
MVZ1 – deck 10 – corridor 1 0.9 36 32.4 To door 1
MVZ1 – deck 10 – corridor 2 0.9 36 32.4 To door 2
MVZ1 – deck 10 – door 1 0.9 N.A. N.A. To stair C
MVZ1 – deck 10 – door 2 0.9 N.A. N.A. To stair C
MVZ1 – deck 10 – stair C 2.8 4.67 N.A. down to deck 9
.6 Deck 9 has a similar arrangement as deck 11. The clear widths and lengths
are:
Item Wc (clear
width)m
Length
m Area m2 Notes
MVZ1 – deck 9 – corridor 1 0.9 36 32.4 To door 1
MVZ1 – deck 9 – corridor 2 0.9 36 32.4 To door 2
MVZ1 – deck 9 – door 1 0.9 N.A. N.A. To stair C
MVZ1 – deck 9 – door 2 0.9 N.A. N.A. To stair C
MVZ1 – deck 9 – stair C 2.8 4.67 N.A. down to deck 8
.7 Deck 8, people coming from decks 5, 6 and 7 (stair C) and from decks 11, 10 and 9 (stair C) enters the assembly station through paths 1 and 2. The clear widths and lengths are:
Item Wc (clear
width)m
Length
m
Notes
MVZ1 – deck 8 – path 1 2.00 9.50 to assembly station
MVZ1 – deck 8 – path 2 2.50 7.50 to assembly station
3.2.2 In MVZ 2, the escape routes are as follows (see figure 4):
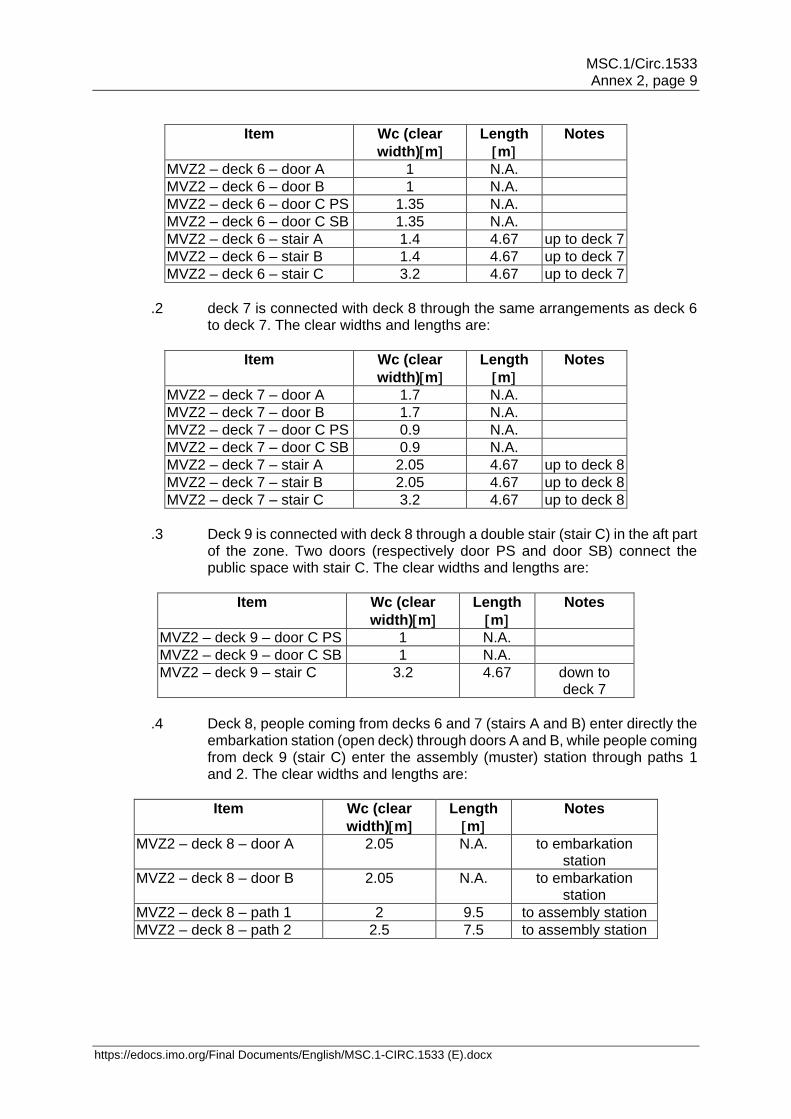
.1 Deck 6 is connected with deck 7 (and then deck 8 where assembly stations are located) through two stairs (stair A and B respectively) in the fore part of the zone and through a double stair (stair C) in the aft part of the zone. Two doors (respectively door A and B) connect the public space with stairs A and B; and two doors (respectively door port side (PS) and door starboard side (SB)) connect the public space with stair C. The clear widths and lengths are:
MSC.1/Circ.1533 Annex 2, page 9
https://edocs.imo.org/Final Documents/English/MSC.1-CIRC.1533 (E).docx
Item Wc (clear
width)m
Length
m
Notes
MVZ2 – deck 6 – door A 1 N.A.
MVZ2 – deck 6 – door B 1 N.A.
MVZ2 – deck 6 – door C PS 1.35 N.A.
MVZ2 – deck 6 – door C SB 1.35 N.A.
MVZ2 – deck 6 – stair A 1.4 4.67 up to deck 7
MVZ2 – deck 6 – stair B 1.4 4.67 up to deck 7
MVZ2 – deck 6 – stair C 3.2 4.67 up to deck 7
.2 deck 7 is connected with deck 8 through the same arrangements as deck 6
to deck 7. The clear widths and lengths are:
Item Wc (clear
width)m
Length
m
Notes
MVZ2 – deck 7 – door A 1.7 N.A.
MVZ2 – deck 7 – door B 1.7 N.A.
MVZ2 – deck 7 – door C PS 0.9 N.A.
MVZ2 – deck 7 – door C SB 0.9 N.A.
MVZ2 – deck 7 – stair A 2.05 4.67 up to deck 8
MVZ2 – deck 7 – stair B 2.05 4.67 up to deck 8
MVZ2 – deck 7 – stair C 3.2 4.67 up to deck 8
.3 Deck 9 is connected with deck 8 through a double stair (stair C) in the aft part
of the zone. Two doors (respectively door PS and door SB) connect the public space with stair C. The clear widths and lengths are:
Item Wc (clear
width)m
Length
m
Notes
MVZ2 – deck 9 – door C PS 1 N.A.
MVZ2 – deck 9 – door C SB 1 N.A.
MVZ2 – deck 9 – stair C 3.2 4.67 down to deck 7
.4 Deck 8, people coming from decks 6 and 7 (stairs A and B) enter directly the
embarkation station (open deck) through doors A and B, while people coming from deck 9 (stair C) enter the assembly (muster) station through paths 1 and 2. The clear widths and lengths are:
Item Wc (clear
width)m
Length
m
Notes
MVZ2 – deck 8 – door A 2.05 N.A. to embarkation station
MVZ2 – deck 8 – door B 2.05 N.A. to embarkation station
MVZ2 – deck 8 – path 1 2 9.5 to assembly station
MVZ2 – deck 8 – path 2 2.5 7.5 to assembly station

MSC.1/Circ.1533 Annex 2, page 10
https://edocs.imo.org/Final Documents/English/MSC.1-CIRC.1533 (E).docx
NOTE: "Muster Station" has the same meaning as "Assembly Station". Refer to Indication of the assembly station in passenger ships (MSC/Circ.777).

MSC.1/Circ.1533 Annex 2, page 11
https://edocs.imo.org/Final Documents/English/MSC.1-CIRC.1533 (E).docx
NOTE: "Muster Station" has the same meaning as "Assembly Station". Refer to Indication of the assembly station in passenger ships (MSC/Circ.777).

MSC.1/Circ.1533 Annex 2, page 12
https://edocs.imo.org/Final Documents/English/MSC.1-CIRC.1533 (E).docx
4 Scenarios considered 4.1 Case 1 refers to a day scenario in MVZ 1, according to chapter 13 of the FSS Code, the 449 persons are initially distributed as follows: 42 in deck 5; 65 in deck 6 (42 in the fore part and 23 in the aft part); 26 in deck 7; 110 in deck 9; 96 in deck 10; and 110 in deck 11. Deck 8 (assembly station) is empty. In accordance with paragraph 2.2 of appendix 1 to the guidelines, all persons in the cabins are assumed to simultaneously move into the corridors. The corresponding initial conditions are:
MVZ 1 – Corridors Persons
Initial density D (p/m2)
Initial specific flow
Fs (p/m/s)
Calculated flow
Fc (p/s)
Initial speed of persons S
(m/s)
Deck 5 – corridor 1 11 0.94 0.85 0.77 1.03
Deck 5 – corridor 2 12 0.67 0.73 0.65 1.14
Deck 5 – corridor 3 8 0.94 0.85 0.77 1.04
Deck 5 – corridor 4 11 0.61 0.7 0.63 1.16
Deck 6 – corridor 1 11 0.94 0.85 0.77 1.03
Deck 6 – corridor 2 12 0.67 0.73 0.65 1.14
Deck 6 – corridor 3 8 0.94 0.85 0.77 1.04
Deck 6 – corridor 4 11 0.61 0.7 0.63 1.16
Deck 6 – corridor 5 11 0.94 0.85 0.77 1.03
Deck 6 – corridor 6 12 0.67 0.73 0.65 1.14
Deck 7 – corridor 1 4 0.74 0.76 0.69 1.11
Deck 7 – corridor 2 4 0.49 0.64 0.58 1.2
Deck 7 – corridor 3 6 0.44 0.58 0.52 1.2
Deck 7 – corridor 4 4 0.74 0.76 0.69 1.11
Deck 7 – corridor 5 6 0.48 0.62 0.56 1.2
Deck 7 – corridor 6 2 0.15 0.19 0.17 1.2
Deck 7 – corridor 7 0 0 N.A. N.A. N.A.
Deck 7 – corridor 8 0 0 N.A. N.A. N.A.
Deck 11 – corridor 1 55 1.7 1.21 1.09 0.75
Deck 11 – corridor 2 55 1.7 1.21 1.09 0.75
Deck 10 – corridor 1 48 1.48 1.11 1 0.83
Deck 10 – corridor 2 48 1.48 1.11 1 0.83
Deck 9 – corridor 1 55 1.7 1.21 1.09 0.74
Deck 9 – corridor 2 55 1.7 1.21 1.09 0.74

MSC.1/Circ.1533 Annex 2, page 13
https://edocs.imo.org/Final Documents/English/MSC.1-CIRC.1533 (E).docx
MVZ 1 – Stairs,
doors & corridors
Persons (N)
Specific
flow Fs in
(p/m/s)
Max. specific
flow Fs
(p/m/s)
Specific
flow Fs
(p/m/s)
Cal-culated
flow Fc (p/s)
Speed of persons S (m/s)
Queue Comments Notes From
current route
Total including
those from other routes
Deck 5 – door 1
34 34 2.28 1.3 1.3 1.17 N.A. Yes From corridors 1, 2 and 4
1
Deck 5 – door 2
8 8 1.85 1.3 0.85 0.77 N.A. From corridor 3 1
Deck 5 – stair A
42 42 1.43 0.88 0.88 1.188 0.44 Yes From doors 1 and 2
1, 2
Deck 6 – door 1
34 34 2.58 1.30 1.3 1.17 N.A. Yes From corridors 1, 2, and 4;
1
Deck 6 – door 2
8 8 0.85 1.30 0.85 0.77 N.A. From corridor 3 1
Deck 6 – stair A
42 84 2.32 0.88 0.88 1.188 0.44 Yes From doors 1 and 2, from deck 5
1, 2
Deck 6 – door 3
11 11 0.85 1.30 0.85 0.77 N.A. From corridor 5 1
Deck 6 – door 4
12 12 0.73 1.30 0.81 0.73 N.A. From corridor 4 1
Deck 6 – stair B
23 23 1.05 0.88 0.88 1.188 0.44 Yes From doors 3 and 4
1, 2
Deck 7 – corridor 8
8 92 0.78 1.3 0.78 1.88 1.09 From corridors 3 and 6, from deck 6, stair A
1, 3
Deck 7 – corridor 7
18 125 1.75 1.3 1.3 3.12 0.67 Yes
From corridors 2, 5 and 8, from deck 6, stair B
1, 4
Deck 7 – stair C
8 133 3.21 0.88 0.88 1.232 0.44 Yes From corridors 1, 4 and 7; up to deck 8
1, 2, 5
Deck 11 – door 1
55 55 1.21 1.3 1.21 1.09 N.A. To stair C 1
Deck 11 – door 2
55 55 1.21 1.3 1.21 1.09 N.A. To stair C 1
Deck 11 – stair C
110 110 0.78 1.1 0.78 2.17 0.81 Down to deck 10
1, 2
Deck 10 – door 1
48 48 1.11 1.3 1.11 1 N.A. To stair C 1
Deck 10 – door 2
48 48 1.11 1.3 1.11 1 N.A. To stair C 1
Deck 10 – stair C
96 206 1.49 1.1 1.10 3.08 0.55 Yes Down to deck 9 1, 2
Deck 9 – door 1
55 55 1.21 1.3 1.21 1.09 N.A. To stair C 1
Deck 9 – door 2
55 55 1.21 1.3 1.21 1.09 N.A. To stair C 1
Deck 9 – stair C
110 316 1.88 1.1 1.10 3.08 0.55 Yes Down to deck 8 1, 2
Deck 8 – path 1
0 200 0.96 1.3 0.96 1.92 0.95 To assembly stat
1, 6
Deck 8 – path 2
0 249 0.96 1.3 0.96 2.4 0.95 To assembly stat
1, 6
MSC.1/Circ.1533 Annex 2, page 14
https://edocs.imo.org/Final Documents/English/MSC.1-CIRC.1533 (E).docx
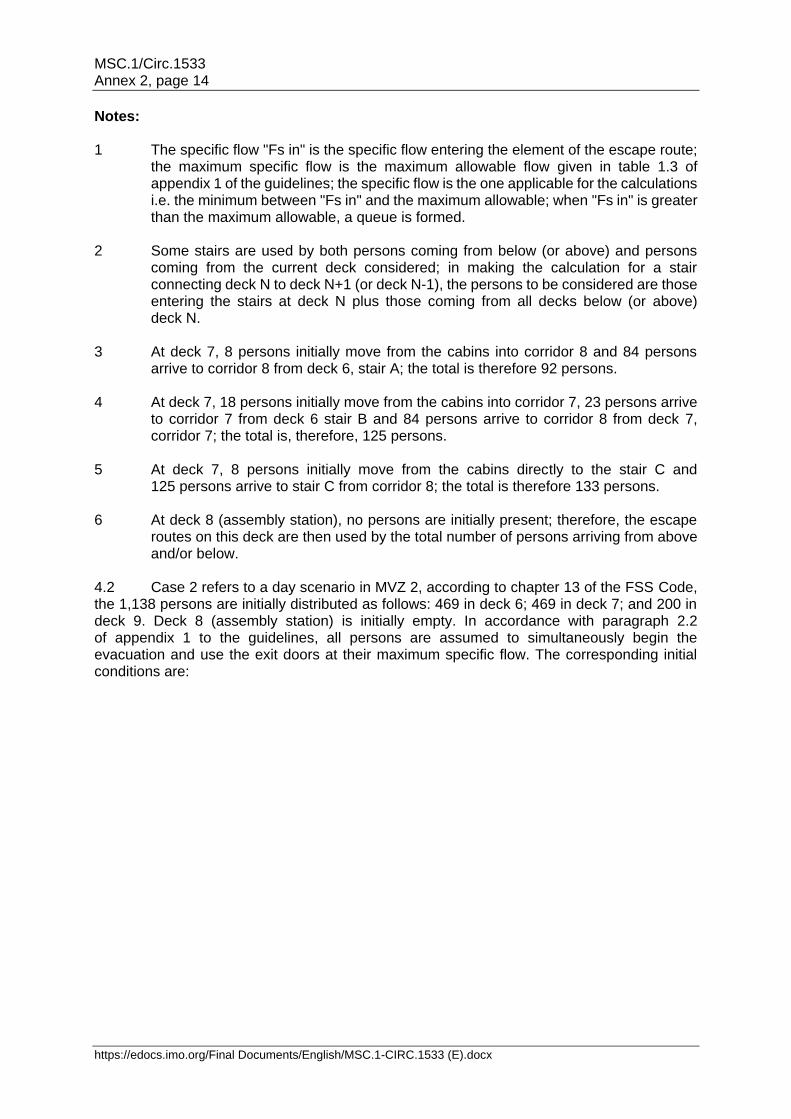
Notes: 1 The specific flow "Fs in" is the specific flow entering the element of the escape route;
the maximum specific flow is the maximum allowable flow given in table 1.3 of appendix 1 of the guidelines; the specific flow is the one applicable for the calculations i.e. the minimum between "Fs in" and the maximum allowable; when "Fs in" is greater than the maximum allowable, a queue is formed.
2 Some stairs are used by both persons coming from below (or above) and persons
coming from the current deck considered; in making the calculation for a stair connecting deck N to deck N+1 (or deck N-1), the persons to be considered are those entering the stairs at deck N plus those coming from all decks below (or above) deck N.
3 At deck 7, 8 persons initially move from the cabins into corridor 8 and 84 persons
arrive to corridor 8 from deck 6, stair A; the total is therefore 92 persons. 4 At deck 7, 18 persons initially move from the cabins into corridor 7, 23 persons arrive
to corridor 7 from deck 6 stair B and 84 persons arrive to corridor 8 from deck 7, corridor 7; the total is, therefore, 125 persons.
5 At deck 7, 8 persons initially move from the cabins directly to the stair C and
125 persons arrive to stair C from corridor 8; the total is therefore 133 persons. 6 At deck 8 (assembly station), no persons are initially present; therefore, the escape
routes on this deck are then used by the total number of persons arriving from above and/or below.
4.2 Case 2 refers to a day scenario in MVZ 2, according to chapter 13 of the FSS Code, the 1,138 persons are initially distributed as follows: 469 in deck 6; 469 in deck 7; and 200 in deck 9. Deck 8 (assembly station) is initially empty. In accordance with paragraph 2.2 of appendix 1 to the guidelines, all persons are assumed to simultaneously begin the evacuation and use the exit doors at their maximum specific flow. The corresponding initial conditions are:

MSC.1/Circ.1533 Annex 2, page 15
https://edocs.imo.org/Final Documents/English/MSC.1-CIRC.1533 (E).docx
MVZ 2 – Doors Persons
Initial density D (p/m2)
Initial Specific
flow Fs (p/m/s)
Calculated flow
Fc (p/s)
Initial speed of persons S (m/s)
Deck 6 – door A 100 N.A. 1.3 1.3 N.A.
Deck 6 – door B 100 N.A. 1.3 1.3 N.A.
Deck 6 – door C PS
134 N.A. 1.3 1.76 N.A.
Deck 6 – door C SB
135 N.A. 1.3 1.76 N.A.
Deck 7 – door A 170 N.A. 1.3 2.21 N.A.
Deck 7 – door B 170 N.A. 1.3 2.21 N.A.
Deck 7 – door C PS
65 N.A. 1.3 1.17 N.A.
Deck 7 – door C SB
64 N.A. 1.3 1.17 N.A.
Deck 9 – door C SB
100 N.A. 1.3 1.3 N.A.
Deck 9 – door C PS
100 N.A. 1.3 1.3 N.A.

MSC.1/Circ.1533 Annex 2, page 16
https://edocs.imo.org/Final Documents/English/MSC.1-CIRC.1533 (E).docx
MVZ 2 – Stairs
Persons (N)
Specific flow Fs in
(p/m/s)
Max. specific
flow Fs
(p/m/s)
Specific flow Fs
(p/m/s)
Calcu-lated flow Fc
(p/s)
Speed of
persons S (m/s)
Queue Comments Notes From current route
Total including
those from other routes
Deck 6 – stair A
100 100 0.93 0.88 0.88 1.23 0.44 Yes up to deck 7
1
Deck 6 – stair B
100 100 0.93 0.88 0.88 1.23 0.44 Yes up to deck 7
1
Deck 6 – stair C
269 269 1.1 0.88 0.88 2.82 0.44 Yes up to deck 7
1
Deck 7 – stair A
170 270 1.68 0.88 0.88 1.8 0.44 Yes up to deck 8
1, 2
Deck 7 – stair B
170 270 1.68 0.88 0.88 1.8 0.44 Yes up to deck 8
1, 2
Deck 7 – stair C
129 398 1.61 0.88 0.88 2.82 0.44 Yes up to deck 8
1, 2
Deck 9 – stair C
200 200 0.81 1.1 0.81 2.60 0.78 down to deck 8
Deck 8 – path 1
0 266 1.2 1.3 1.2 2.41 0.75 from decks 7 and 9
1, 3
Deck 8 – path 2
0 332 1.2 1.3 1.2 3.01 0.75 from decks 7 and 9
1, 3
Deck 8 – door A
0 270 0.88 1.3 0.88 1.8 N.A. from deck 7 1, 3
Deck 8 – door B
0 270 0.88 1.3 0.88 1.8 N.A. from deck 7 1, 3
Notes: 1 The specific flow "Fs in" is the specific flow entering the element of the escape route;
the maximum specific flow is the maximum allowable flow given in table 1.3 of appendix 1 of the guidelines; the specific flow is the one applicable for the calculations i.e. the minimum between "Fs in" and the maximum allowable; when "Fs in" is greater than the maximum allowable, a queue is formed.
2 Some stairs are used by both persons coming from below (or above) and persons
coming from the current deck considered; in making the calculation for a stair connecting deck N to deck N+1 (or deck N-1), the persons to be considered are those entering the stairs at deck N plus those coming from all decks below (or above) deck N.
3 At deck 8 (assembly station), no persons are initially present; therefore, the escape
routes on this deck are then used by the total number of persons arriving from above and/or below.

MSC.1/Circ.1533 Annex 2, page 17
https://edocs.imo.org/Final Documents/English/MSC.1-CIRC.1533 (E).docx
5 Calculation of tF, tdeck and tstair
5.1 For case 1:
Item Persons
N Length L (m)
Calculated flow
Fc (p/s)
Speed S (m/s)
Flow dur. tF (s)
tF = N/ Fc
Deck or stairs dur., tdeck, tstairs
T = L/S Entering
Deck 5 – corridor 1 11 13 0.77 1.03 14.3 12.6 Door 1
Deck 5 – corridor 2 12 20 0.65 1.14 18.3 17.6 Door 1
Deck 5 – corridor 3 8 9.5 0.77 1.04 10.4 9.2 Door 2
Deck 5 – corridor 4 11 20 0.63 1.16 17.4 17.3 Door 1
Deck 5 – door 1 34 N.A. 1.17 N.A. 29.1 N.A. Stair A
Deck 5 – door 2 8 N.A. 0.77 N.A. 10.4 N.A. Stair A
Deck 5 – stair A 42 4.67 1.188 0.44 35.4 10.6 Deck 6
Deck 6 – corridor 1 11 13 0.77 1.03 14.3 12.6 Door 1
Deck 6 – corridor 2 12 20 0.65 1.14 18.3 17.6 Door 1
Deck 6 – corridor 3 8 9.5 0.77 1.04 10.4 9.2 Door 2
Deck 6 – corridor 4 11 20 0.63 1.16 17.4 17.3 Door 1
Deck 6 – door 1 34 N.A. 1.17 N.A. 29.1 N.A. Stair A
Deck 6 – door 2 8 N.A. 0.77 N.A. 10.4 N.A. Stair A
Deck 6 – stair A 84 4.67 1.188 0.44 70.7 10.6 Deck 7
Deck 6 – corridor 5 11 13 0.77 1.03 14.3 12.6 Door 3
Deck 6 – corridor 6 12 20 0.65 1.14 18.3 17.6 Door 4
Deck 6 – door 3 11 N.A. 0.77 N.A. 14.3 N.A. Stair B
Deck 6 – door 4 12 N.A. 0.65 N.A. 18.3 N.A. Stair B
Deck 6 – stair B 23 4.67 1.188 0.44 19.4 10.6 Deck 7
Deck 7 – corridor 1 4 6 0.69 1.11 5.8 5.4 Stair C
Deck 7 – corridor 2 4 9 0.58 1.2 6.9 7.5 Corridor 7
Deck 7 – corridor 3 6 15 0.52 1.2 11.5 12.5 Corridor 8
Deck 7 – corridor 4 4 6 0.69 1.11 5.8 5.4 Stair C
Deck 7 – corridor 5 6 14 0.56 1.2 10.8 11.7 Corridor 7
Deck 7 – corridor 6 2 15 0.17 1.2 11.5 12.5 Corridor 8
Deck 7 – corridor 8 92 9 1.88 1.09 48.9 8.2 Corridor 7
Deck 7 – corridor 7 125 11 3.12 0.67 40.1 16.4 Stair C
Deck 7 – stair C 133 4.67 1.232 0.44 108 10.6 Deck 8
Deck 11– corridor 1 55 36 1.09 0.75 50.7 48.2 Door 1
Deck 11– corridor 2 55 36 1.09 0.75 50.7 48.2 Door 2
Deck 11 – door 1 55 N.A. 1.09 N.A. 50.7 N.A. Stair C
Deck 11 – door 2 55 N.A. 1.09 N.A. 50.7 N.A. Stair C
Deck 11 – stair C 110 4.67 2.17 0.81 50.7 5.8 Deck 10
Deck 10– corridor 1 48 36 1 0.83 48.2 43.5 Door 1
Deck 10– corridor 2 48 36 1 0.83 48.2 43.5 Door 2
Deck 10 – door 1 48 N.A. 1 N.A. 48.2 N.A. Stair C
Deck 10 – door 2 48 N.A. 1 N.A. 48.2 N.A. Stair C
Deck 10 – stair C 206 4.67 3.08 0.55 66.9 8.5 Deck 9
Deck 9 – corridor 1 55 36 1.09 0.74 50.7 48.4 Door 1
Deck 9 – corridor 2 55 36 1.09 0.74 50.7 48.4 Door 2
Deck 9 – door 1 55 N.A. 1.09 N.A. 50.7 N.A. Stair C
Deck 9 – door 2 55 N.A. 1.09 N.A. 50.7 N.A. Stair C
Deck 9 – stair C 316 4.67 3.08 0.55 102.6 8.5 Deck 8

MSC.1/Circ.1533 Annex 2, page 18
https://edocs.imo.org/Final Documents/English/MSC.1-CIRC.1533 (E).docx
5.2 For case 2: since in this particular arrangement there are no corridors, the deck duration is zero.
Item Persons
N Length
L (m)
Calculated
flow Fc
(p/s)
Speed S
(m/s)
Flow dur. tF (s) tF = N/ Fc
Deck or stairs dur., tdeck, tstairs
t = L/S
Entering
Deck 6 – door A 100 N.A. 1.3 N.A 76.9 N.A. Stair A
Deck 6 – door B 100 N.A. 1.3 N.A. 76.9 N.A. Stair B
Deck 6 – door C PS 134 N.A. 1.76 N.A. 76.4 N.A. Stair C
Deck 6 – door C SB 135 N.A. 1.76 N.A. 76.9 N.A. Stair C
Deck 6 – stair A 100 4.67 1.23 0.44 81.2 10.6 Deck 7
Deck 6 – stair B 100 4.67 1.23 0.44 81.2 10.6 Deck 7
Deck 6 – stair C 269 4.67 2.82 0.44 95.5 10.6 Deck 7
Deck 7 – door A 170 N.A. 2.21 N.A 76.9 N.A. Stair A
Deck 7 – door B 170 N.A. 2.21 N.A. 76.9 N.A. Stair B
Deck 7 – door C PS 65 N.A. 1.17 N.A. 55.6 N.A. Stair C
Deck 7 – door C SB 64 N.A. 1.17 N.A. 54.7 N.A. Stair C
Deck 7 – stair A 270 4.67 1.8 0.44 149.7 10.6 Deck 8
Deck 7 – stair B 270 4.67 1.8 0.44 149.7 10.6 Deck 8
Deck 7 – stair C 398 4.67 2.82 0.44 141.3 10.6 Deck 8
Deck 8 – door A 270 N.A. 1.8 N.A. 149.7 N.A. Embarkation
Deck 8 – door B 270 N.A. 1.8 N.A. 149.7 N.A. Embarkation
Deck 9 – door PS 100 N.A. 1.3 N.A. 76.9 N.A. Stair C
Deck 9 – door SB 100 N.A. 1.3 N.A. 76.9 N.A. Stair C
Deck 9 – stair C 200 4.67 2.6 0.78 76.9 6 Deck 8
6 Calculation of tassembly 6.1 Case 1: In this case, all the 429 persons use stair C (316 coming from above deck 8 and 133 from below) and, once arrived at deck 8, need to travel on deck 8 to reach the assembly station using either path 1 or path 2. The corresponding duration is as follows:
Item Persons
N Length L (m)
Calculated flow
Fc (p/s)
Speed
S (m/s)
Flow dur. tF (s)
tF = N/ Fc
tassembly
t = L/S Entering
Deck 8 – path 1 200 9.5 1.92 0.95 104.4 10 Assembly station
Deck 8 – path 2 249 7.5 2.4 0.95 103.9 7.9 Assembly station

MSC.1/Circ.1533 Annex 2, page 19
https://edocs.imo.org/Final Documents/English/MSC.1-CIRC.1533 (E).docx
6.2 Case 2: In this case, all the persons using stair C (totalling 598), once arrived at deck 8, need to travel through on deck 8 to reach the assembly station using either path 1 or path 2. The corresponding duration is as follows:
Item Persons
N Length L (m)
Calculated flow
Fc (p/s)
Speed
S (m/s)
Flow dur. tF (s)
tF = N/ Fc
tassembly
t = L/S Entering
Deck 8 – path 1 266 9.5 2.41 0.75 110.5 12.7 Assembly
station
Deck 8 – path 2 332 7.5 3.01 0.75 110.3 10 Assembly
station
7 Calculation of T 7.1 Case 1: The travel duration T, according to appendix 1 to the interim guidelines, is the maximum tI (equation 2.2.11) multiplied by 2.3 (sum of correction factor and counterflow correction factor). The maximum values of tI for each escape route are given in the following:
Escape route on Tdeck tf tstair tassembly tI T Notes
Deck 11 48.2 104.4 22.7 10 185.3 426.2 1
Deck 10 43.5 104.4 17 10 174.8 402 1, 2
Deck 9 48.4 104.4 8.5 10 171.3 394 1, 2
Deck 8 0 104.4 0 10 114.4 286.1
Deck 7 37.1 108 10.6 10 163.9 377 1
Deck 6 – stair A (fore) 42.4 108 21.2 10 179.6 413.1 1, 3
Deck 6 – stair B (aft) 34 108 21.2 10 170.2 391.5 1, 3
Deck 5 42.2 108 31.8 10 190.2 437.5 1, 3
Notes:
1 The flow duration, tf, is the maximum flow duration recorded on the whole
escape route from the deck where persons started evacuating up to the assembly station.
2 The travel duration on the stairways (tstair) is the total duration necessary to
travel along all the stairs from the deck where persons originally started evacuating up to the deck where the assembly station is located; in the present case, tstair for persons moving down from deck 11 is, therefore, the sum of tstair from deck 11 to 10 (5.7 s), from deck 10 to 9 (8.5 s) and from deck 9 to 8 (8.5 s), in total 22.7 s; similarly for the other cases.
3 The travel duration on the stairways (tstair) is the total duration necessary to
travel along all the stairs from the deck where persons originally started evacuating up to the deck where the assembly station is located; in the present case, tstair for persons moving up from deck 5 is, therefore, the sum of tstair from deck 5 to 6 (10.6 s.), from deck 6 to 7 (10.6 s) and from deck 7 to 8 (10.6 s), in total 31.8 s; similarly for the other cases.

MSC.1/Circ.1533 Annex 2, page 20
https://edocs.imo.org/Final Documents/English/MSC.1-CIRC.1533 (E).docx
Accordingly, the corresponding value of T is 437.5 s. 7.2 Case 2: The travel duration T, according to appendix 1 to the guidelines, is the maximum tI equation 2.2.11) multiplied by 2.3 (sum of correction factor and counterflow correction factor). The maximum values of tI for each escape route are given in the following:
Escape route on Tdeck tf tstair tassembly tI T Notes
Deck 9 0 110.4 6 12.7 168.3 387.2 1, 2
Deck 8 0 110.4 0 12.7 162.4 373.4
Deck 7 – stair A 0 149.7 10.6 0 160.3 368.6
Deck 7 – stair B 0 149.7 10.6 0 160.3 368.6
Deck 7 – stair C 0 141.3 10.6 12.7 164.6 378.7 2
Deck 6 – stair A 0 149.7 21.2 0 170.9 393 1, 3
Deck 6 – stair B 0 149.7 21.2 0 170.9 393 1, 3
Deck 6 – stair C 0 141.3 21.2 12.7 175.2 403.1 1, 2, 3
Notes: 1 The flow duration, tf, is the maximum flow duration recorded on the whole
escape route from the deck where persons started evacuating up to the assembly station.
2 In this example, stairs A and B are already leading to the embarkation station;
therefore, only those escape routes passing through stair C need additional duration, tassembly, to reach the assembly station.
3 The travel duration on the stairways (tstair) is the total duration necessary to
travel along all the stairs from the deck where persons originally started evacuating up to the deck where the assembly station is located; in the present case, tstair for persons moving from deck 6 is therefore the sum of tstair from deck 6 to 7 (10.6 s) and from deck 7 to 8 (10.6 s).
Accordingly, the corresponding value of T is 403.1 s.
8 Identification of congestion
8.1 Case 1: Congestion takes place on deck 5 (door 1 and stair A), deck 6 (door 1, stairs A and B), deck 7 (corridor 7 and stair C), deck 10 (stair C) and deck 9 (stair C). However, since the total duration is below the limit (see paragraph 9.1 of this example) no design modifications are needed. 8.2 Case 2: Congestion takes place on deck 6 (stairs A, B and C) and deck 7 (stairs A, B and C). However, since the total duration is below the limit (see paragraph 9.2 of this example) no design modifications are needed.
9 Performance standard
9.1 Case 1: The total evacuation duration, according to paragraph 5.1 of the revised guidelines is as follows:
1.25 (R+T) + 2/3 (E+L) = 1.25 x (10' + 7'18") + 20 = 41' 38" (9.1)

MSC.1/Circ.1533 Annex 2, page 21
https://edocs.imo.org/Final Documents/English/MSC.1-CIRC.1533 (E).docx
where: (E+L) is assumed to be 30' R = 10' (night case) T = 7' 18"
9.2 Case 2: The total evacuation duration, according to paragraph 5.1 of the revised guidelines is as follows:
1.25 (R+T) + 2/3 (E+L) = 1.25 x (5' + 6' 43") + 20 = 34' 39" (9.2)
where: (E+L) is assumed to be 30' R = 5' (day case) T = 6' 43".
***


MSC.1/Circ.1533 Annex 3, page 1
https://edocs.imo.org/Final Documents/English/MSC.1-CIRC.1533 (E).docx
ANNEX 3
GUIDELINES FOR AN ADVANCED EVACUATION ANALYSIS OF NEW AND EXISTING PASSENGER SHIPS3
1 Specific assumptions This method of estimating the evacuation duration is based on several idealized benchmark scenarios and the following assumptions are made:
.1 the passengers and crew are represented as unique individuals with
specified individual abilities and response durations; .2 a safety factor having a value of 1.25 is introduced in the calculation to take
account of model omissions, assumptions, and the limited number and nature of the benchmark scenarios considered.
2 Calculation of the evacuation duration The following components should be included in the calculation of the evacuation duration as specified in the appendix:
.1 the response duration (R) distribution to be used in the calculations; .2 the method to determine the travel duration (T); and .3 embarkation and launching duration (E+L).
3 Identification of congestion 3.1 Congestion within regions is identified by local population densities exceeding 4 p/m2 for significant duration. These levels of congestion may or may not be significant to the overall assembly process. 3.2 If any identified congestion region is found to persist for longer than 10% of the simulated total assembly duration (tA), it is considered to be significant.
3 Note: Advanced evacuation analysis is taken to mean a computer-based simulation that represents each
occupant as an individual that has a detailed representation of the layout of a ship and represents the interaction between the occupants and the layout.

MSC.1/Circ.1533 Annex 3, page 2
https://edocs.imo.org/Final Documents/English/MSC.1-CIRC.1533 (E).docx
APPENDIX 1
METHOD TO DETERMINE THE TRAVEL DURATION (T) BY SIMULATION TOOLS FOR THE ADVANCED EVACUATION ANALYSIS
1 Characteristics of the models 1.1 Each person (p) is represented in the model individually. 1.2 The abilities of each person are determined by a set of parameters, some of which are probabilistic. 1.3 The movement of each person is recorded. 1.4 The parameters should vary among the individuals of the population. 1.5 The basic rules for personal decisions and movements are the same for everyone, described by a universal algorithm. 1.6 The time difference between the actions of any two persons in the simulation should be not more than one second of simulated time, e.g. all persons proceed with their action in one second (a parallel update is necessary). 2 Parameters to be used 2.1 In order to facilitate their use, the parameters are grouped into the same 4 categories as used in other industrial fields, namely: GEOMETRICAL, POPULATION, ENVIRONMENTAL and PROCEDURAL. 2.2 Category GEOMETRICAL: layout of escape routes, their obstruction and partial unavailability, initial passenger and crew distribution conditions. 2.3 Category POPULATION: ranges of parameters of persons and population demographics. 2.4 Category ENVIRONMENTAL: static and dynamic conditions of the ship. 2.5 Category PROCEDURAL: crew members available to assist in emergency. 3 Recommended values of the parameters 3.1 Category GEOMETRICAL
3.1.1 General The evacuation analysis specified in this annex is aimed at measuring the performance of the ship in reproducing benchmark scenarios rather than simulating an actual emergency situation. Four benchmark cases should be considered, namely cases 1, 2, 3 and 4 (refer to paragraph 4 for detailed specifications) corresponding to primary evacuation cases (cases1 and 2, where all the escape routes should be assumed to be in operation) and secondary evacuation cases (cases 3 and 4, where some of the escape route should be assumed to be unavailable).

MSC.1/Circ.1533 Annex 3, page 3
https://edocs.imo.org/Final Documents/English/MSC.1-CIRC.1533 (E).docx
3.1.2 Layout of escape routes – primary evacuation cases (cases 1 and 2): Passengers and crew should be assumed to proceed along the primary escape routes and to know their ways up to the assembly stations; to this effect, signage, low-location lighting, crew training and other relevant aspects connected with the evacuation system design and operation should be assumed to be in compliance with the requirements set out in IMO instruments. 3.1.3 Layout of escape routes – secondary evacuation cases (cases 3 and 4): Those passengers and crew who were previously assigned to the now unavailable primary escape route should be assumed to proceed along the escape routes determined by the ship designer. 3.1.4 Initial passenger and crew distribution condition. The occupant distribution should be based upon the cases defined in chapter 13 of the FSS Code, as outlined in section 4. 3.2 Category POPULATION
3.2.1 This describes the make-up of the population in terms of age, gender, physical attributes and response durations. The population is identical for all scenarios with the exception of the response duration and passenger initial locations. The population is made of the following mix:
Table 3.1 – Population's composition (age and gender)
Population groups – passengers Percentage of passengers (%)
Females younger than 30 years 7
Females 30-50 years old 7
Females older than 50 years 16
Females older than 50, mobility impaired (1) 10
Females older than 50, mobility impaired (2) 10
Males younger than 30 years 7
Males 30-50 years old 7
Males older than 50 years 16
Males older than 50, mobility impaired (1) 10
Males older than 50, mobility impaired (2) 10
Population groups – crew Percentage of crew (%)
Crew females 50
Crew males 50
All of the attributes associated with this population distribution should consist of a statistical distribution within a fixed range of values. The range is specified between a minimum and maximum value with a uniform random distribution. 3.2.2 Response duration The response duration distributions for the benchmark scenarios should be truncated logarithmic normal distributions4 as follows:
4 "Recommendations on the Nature of the Passenger Response Time Distribution to be used in the MSC.1033
Assembly Time Analysis Based on Data Derived from Sea Trials", Galea, E. R., Deere, S., Sharp, G., Fillips, L., Lawrence, P., and Gwunne, S., The Transaction of The Royal Institution of Naval Architects, Part A – International Journal of Maritime Engineering ISSN 14798751.2007.

MSC.1/Circ.1533 Annex 3, page 4
https://edocs.imo.org/Final Documents/English/MSC.1-CIRC.1533 (E).docx
For Cases 1 and 3 (Night cases):
2
2
84.02
95.3400lnexp
)400(84.02
01875.1 x
xy
(3.2.2.1)
400 < x < 700
For Cases 2 and 4 (Day cases):
2
2
94.02
44.3lnexp
94.02
00808.1 x
xy
(3.2.2.2)
0 < x < 300
where x is the response duration in seconds and y is the probability density at response duration x.
3.2.3 Unhindered travel speeds on flat terrain (e.g. corridors) The maximum unhindered travel speeds to be used are those derived from data published by Ando5 which provides male and female walk rates as a function of age. These are distributed according to figure 3.1 and represented by approximate piecewise functions shown in table 3.3.
Female
Male
0 10 20 30 40 50 60 70 0
1.0
2.0
Age (years)
Walking
speed
(m/s)
Figure 3.1 – Walking speeds as a function of age and gender
5 Ando K, Ota H, and Oki T, Forecasting The Flow Of People, Railway Research Review, (45), pp 8-14, 1988.

MSC.1/Circ.1533 Annex 3, page 5
https://edocs.imo.org/Final Documents/English/MSC.1-CIRC.1533 (E).docx
Table 3.3 – Regression formulation for mean travel speed values6
Gender Age (years) Speed (m/s)
Female
2 - 8.3 0.06 * age + 0.5
8.3 - 13.3 0.04 * age + 0.67
13.3 - 22.25 0.02 * age + 0.94
22.25 - 37.5 -0.018 * age + 1.78
37.5 - 70 -0.01 * age + 1.45
Male
2 - 5 0.16 * age + 0.3
5 - 12.5 0.06 * age + 0.8
12.5 - 18.8 0.008 * age + 1.45
18.8 - 39.2 -0.01 * age + 1.78
39.2 - 70 -0.009 * age + 1.75
For each gender group specified in table 3.1, the walking speed should be modelled as a statistical uniform distribution having minimum and maximum values as follows:
Table 3.4 – Walking speed on flat terrain (e.g. corridors)
Population groups – passengers
Walking speed on flat terrain (e.g. corridors)
Minimum (m/s) Maximum (m/s)
Females younger than 30 years 0.93 1.55
Females 30-50 years old 0.71 1.19
Females older than 50 years 0.56 0.94
Females older than 50, mobility impaired (1) 0.43 0.71
Females older than 50, mobility impaired (2) 0.37 0.61
Males younger than 30 years 1.11 1.85
Males 30-50 years old 0.97 1.62
Males older than 50 years 0.84 1.4
Males older than 50, mobility impaired (1) 0.64 1.06
Males older than 50, mobility impaired (2) 0.55 0.91
Population groups – crew
Walking speed on flat terrain (e.g. corridors)
Minimum (m/s) Maximum (m/s)
Crew females 0.93 1.55
Crew males 1.11 1.85
6 Maritime EXODUS V4.0, USER GUIDE AND TECHNICAL MANUAL, Authors: E R Galea,
S Gwynne, P. J. Lawrence, L. Filippidis, D. Blackshields and D. Cooney, CMS Press, May 2003 Revision 1.0, ISBN: 1 904521 38 X.

MSC.1/Circ.1533 Annex 3, page 6
https://edocs.imo.org/Final Documents/English/MSC.1-CIRC.1533 (E).docx
3.2.4 Unhindered stair speeds7
Speeds are given on the base of gender, age and travel direction (up and down). The speeds in table 3.5 are those along the inclined stairs. It is expected that all the data above will be updated when more appropriate data and results become available.
Table 3.5 – Walking speed on stairs
Population groups – passengers
Walking speed on stairs (m/s)
Stairs down Stairs up
Min. Max. Min. Max.
Females younger than 30 years 0.56 0.94 0.47 0.79
Females 30-50 years old 0.49 0.81 0.44 0.74
Females older than 50 years 0.45 0.75 0.37 0.61
Females older than 50, mobility impaired (1) 0.34 0.56 0.28 0.46
Females older than 50, mobility impaired (2) 0.29 0.49 0.23 0.39
Males younger than 30 years 0.76 1.26 0.5 0.84
Males 30-50 years old 0.64 1.07 0.47 0.79
Males older than 50 years 0.5 0.84 0.38 0.64
Males older than 50, mobility impaired (1) 0.38 0.64 0.29 0.49
Males older than 50, mobility impaired (2) 0.33 0.55 0.25 0.41
Population groups – Crew
Walking speed on stairs (m/s)
Stairs down Stairs up
Min. Max. Min. Max.
Crew females 0.56 0.94 0.47 0.79
Crew males 0.76 1.26 0.5 0.84
3.2.5 Consistency of travel speed The unhindered travel speeds of each evacuee on flat terrain and on stairs (down and up) are consistent within the respective ranges specified in tables 3.4 and 3.5. 3.2.6 Exit flow rate (doors) The specific unit flow rate is the number of escaping persons past a point in the escape route per unit time per unit width of the route involved, and is measured in number of persons (p). The specific unit flow rate8 for any exit should not exceed 1.33 p/m/s. 3.3 Category ENVIRONMENTAL Static and dynamic conditions of the ship. These parameters will influence the moving speed of persons. Presently no reliable figures are available to assess this effect; therefore, these parameters could not yet be considered. This effect will not be accounted for in the scenarios (cases 1, 2, 3 and 4) until more data has been gathered.
7 The maximum unhindered stair speeds are derived from data generated by J. Fruin. Pedestrian planning
and design, Metropolitan Association of Urban Designers and Environmental Planners, New York, 1971. The study comprises two staircase configurations.
8 Value based on data accepted in civil building applications in Japan, the United Kingdom and the United
States; this value is also consistent with the simplified evacuation analysis method.

MSC.1/Circ.1533 Annex 3, page 7
https://edocs.imo.org/Final Documents/English/MSC.1-CIRC.1533 (E).docx
3.4 Category PROCEDURAL
For the purposes of the four benchmark cases, it is not required to model any special crew procedures. However, the distribution of the crew for the benchmark cases should be in accordance with 4.
3.5 It is expected that all data provided in paragraphs 3.2 and 3.3 will be updated when more appropriate data and results become available.
4 Detailed specifications (scenarios) for the 4 cases to be considered
For the purpose of conducting the evacuation analysis, the following initial distributions of passengers and crew should be considered as derived from chapter 13 of the FSS Code, with the additional indications only relevant for the advanced evacuation analysis. If more detailed data considering the distribution of crew is available, the distribution may deviate from the following specifications:
4.1 Cases 1 and 3 (night)
Passengers in cabins with maximum berthing capacity fully occupied; 2/3 of crew members in their cabins; of the remaining 1/3 of crew members:
.1 50% should be initially located in service spaces;
.2 25% should be located at their emergency stations and should not be explicitly modelled; and
.3 25% should be initially located at the assembly stations and should proceed towards the most distant passenger cabin assigned to that assembly station in counterflow with evacuees; once this passenger cabin is reached, these crew are no longer considered in the simulation. The ratio between the passenger and counterflow crew should be the same in each main vertical zone.
4.2 Cases 2 and 4 (day)
Public spaces, as defined by SOLAS regulation II-2/3.39, will be occupied to 75% of maximum capacity of the spaces by passengers. Crew will be distributed as follows:
.1 1/3 of the crew will be initially distributed in the crew accommodation spaces (cabins and crew day spaces);
.2 1/3 of the crew will be initially distributed in the public spaces;
.3 the remaining 1/3 should be distributed as follows:
.1 50% should be located in service spaces;
.2 25% should be located at their emergency duty locations and should not be explicitly modelled; and
.3 25% should be initially located at the assembly stations and should proceed towards to the most distant passenger cabin assigned to that assembly station in counterflow with evacuees; once this passenger cabin is reached, these crew are no longer considered in the simulation. The ratio between the passenger and counterflow crew should be the same in each main vertical zone.

MSC.1/Circ.1533 Annex 3, page 8
https://edocs.imo.org/Final Documents/English/MSC.1-CIRC.1533 (E).docx
5 Procedure for calculating the travel duration T 5.1 The travel duration, both that predicted by models and as measured in reality, is a random quantity due to the probabilistic nature of the evacuation process. 5.2 In total, a minimum of 500 different simulations should be carried out for each of the benchmark cases. This will yield, for each case, a total of at least 500 values of tA. 5.3 These simulations should be made up of at least 100 different randomly generated populations (within the range of population demographics specified in paragraph 3). Simulations based on each of these different populations should be repeated at least 5 times. If these 5 repetitions produce insignificant variations in the results, the total number of populations analysed should be 500 rather than 100, with only a single simulation performed for each population. 5.4 The minimum number of 500 different simulations can be reduced when a convergence is determined by an appropriate method, such as the one shown in appendix 3. The total number of different simulations should be in this case not less than 50.
5.5 The value of the travel duration for each of cases 1 to 4: the value tI is taken which is higher than 95% of all the calculated values (i.e. for each of cases 1 to 4, the durations tA are ranked from lowest to highest and tI is selected for which 95% of the ranked values are lower).
5.6 The value of the travel duration to comply with the performance standard T is the highest of the four calculated travel durations tI (one for each of cases 1 to 4). 5.7 The procedure for calculating the travel duration for cases 5 and 6 should be based on the same principles as for cases 1 to 4. 6 Documentation of the simulation model used
6.1 The assumptions made for the simulation should be stated. Assumptions that contain simplifications above those in paragraph 3.2 of the Guidelines for the advanced evacuation analysis of new and existing passenger ships, should not be made. 6.2 The documentation of the algorithms should contain:
.1 the variables used in the model to describe the dynamics, e.g. walking speed and direction of each person;
.2 the functional relation between the parameters and the variables;
.3 the type of update, e.g. the order in which the persons move during the simulation (parallel, random sequential, ordered sequential or other);
.4 the representation of stairs, doors, assembly stations, embarkation stations, and other special geometrical elements and their influence on the variables during the simulation (if there is any) and the respective parameters quantifying this influence; and
.5 a detailed user guide/manual specifying the nature of the model and its
assumptions and guidelines for the correct use of the model and interpretations of results should be readily available.

MSC.1/Circ.1533 Annex 3, page 9
https://edocs.imo.org/Final Documents/English/MSC.1-CIRC.1533 (E).docx
APPENDIX 2
GUIDANCE ON VALIDATION/VERIFICATION OF EVACUATION SIMULATION TOOLS
1 Software verification is an ongoing activity. For any complex simulation software, verification is an ongoing activity and is an integral part of its life cycle. There are at least four forms of verification that evacuation models should undergo. These are9:
.1 component testing;
.2 functional verification; .3 qualitative verification; and
.4 quantitative verification.
Component testing 2 Component testing involves checking that the various components of the software perform as intended. This involves running the software through a battery of elementary test scenarios to ensure that the major sub-components of the model are functioning as intended. The following is a non-exhaustive list of suggested component tests that should be included in the verification process. Test 1: Maintaining set walking speed in corridor 3 One person in a corridor 2 m wide and 40 m long with a walking speed of 1 m/s should be demonstrated to cover this distance in 40 s. Test 2: Maintaining set walking speed up staircase 4 One person on a stair 2 m wide and a length of 10 m measured along the incline with a walking speed of 1 m/s should be demonstrated to cover this distance in 10 s. Test 3: Maintaining set walking speed down staircase 5 One person on a stair 2 m wide and a length of 10 m measured along the incline with a walking speed of 1 m/s should be demonstrated to cover this distance in 10 s. Test 4: Exit flow rate 6 100 persons (p) in a room of size 8 m by 5 m with a 1 m exit located centrally on the 5 m wall. The flow rate over the entire period should not exceed 1.33 p/s. Test 5: Response duration 7 Ten persons in a room of size 8 m by 5 m with a 1 m exit located centrally on the 5 m wall. Impose response durations as follows uniformly distributed in the range between 10 s and 100 s. Verify that each occupant starts moving at the appropriate time.
9 Note: This procedure has been highlighted in ISO document ISO/TR 13387-8:1999.

MSC.1/Circ.1533 Annex 3, page 10
https://edocs.imo.org/Final Documents/English/MSC.1-CIRC.1533 (E).docx
Test 6: Rounding corners 8 Twenty persons approaching a left-hand corner (see figure 1) will successfully navigate around the corner without penetrating the boundaries. Test 7: Assignment of population demographics parameters
9 Choose a panel consisting of males 30-50 years old from table 3.4 in the appendix to the Guidelines for the advanced evacuation analysis of new and existing ships and distribute the walking speeds over a population of 50 people. Show that the distributed walking speeds are consistent with the distribution specified in the table.
Figure 1: Transverse corridor Functional verification
10 Functional verification involves checking that the model possesses the ability to exhibit the range of capabilities required to perform the intended simulations. This requirement is task specific. To satisfy functional verification the model developers must set out in a comprehensible manner the complete range of model capabilities and inherent assumptions and give a guide to the correct use of these capabilities. This information should be readily available in technical documentation that accompanies the software. Qualitative verification
11 The third form of model validation concerns the nature of predicted human behaviour with informed expectations. While this is only a qualitative form of verification, it is nevertheless important, as it demonstrates that the behavioural capabilities built into the model are able to produce realistic behaviours.

MSC.1/Circ.1533 Annex 3, page 11
https://edocs.imo.org/Final Documents/English/MSC.1-CIRC.1533 (E).docx
Test 8: Counterflow – two rooms connected via a corridor 12 Two rooms 10 m wide and long connected via a corridor 10 m long and 2 m wide starting and ending at the centre of one side of each room. Choose a panel consisting of males 30-50 years old from table 3.4 in the appendix to the Guidelines for the advanced evacuation analysis of new and existing ships with instant response time and distribute the walking speeds over a population of 100 persons. 13 Step 1: One hundred persons move from room 1 to room 2, where the initial distribution is such that the space of room 1 is filled from the left with maximum possible density (see figure 2). The time the last person enters room 2 is recorded. 14 Step 2: Step one is repeated with an additional ten, fifty, and one hundred persons in room 2. These persons should have identical characteristics to those in room 1. Both rooms move off simultaneously and the duration for the last persons in room 1 to enter room 2 is recorded. The expected result is that the recorded duration increases with the number of persons in counterflow increases.
Figure 2: Two rooms connected via a corridor Test 9: Exit flow: crowd dissipation from a large public room 15 Public room with four exits and 1,000 persons (see figure 3) uniformly distributed in the room. Persons leave via the nearest exits. Choose a panel consisting of males 30-50 years old from table 3.4 in the appendix to the Guidelines for the advanced evacuation analysis of new and existing ships with instant response time and distribute the walking speeds over a population of 1,000 persons. Step 1: Record the amount of time the last person needs to leave the room. Step 2: Close doors 1 and 2 and repeat step 1.

MSC.1/Circ.1533 Annex 3, page 12
https://edocs.imo.org/Final Documents/English/MSC.1-CIRC.1533 (E).docx
The expected result is an approximate doubling of the duration to empty the room.
Figure 3: Exit flow from a large public room Test 10: Exit route allocation 16 Construct a cabin corridor section as shown in figure 4 populated as indicated with a panel consisting of males 30-50 years old from table 3.4 in the appendix to the Guidelines for the advanced evacuation analysis of new and existing ships with instant response time and distribute the walking speeds over a population of 23 persons. The people in cabins 1, 2, 3, 4, 7, 8, 9, and 10 are allocated the main exit. All the remaining passengers are allocated the secondary exit. The expected result is that the allocated passengers move to the appropriate exits.

MSC.1/Circ.1533 Annex 3, page 13
https://edocs.imo.org/Final Documents/English/MSC.1-CIRC.1533 (E).docx
Figure 4: Cabin area
Test 11: Staircase 17 Construct a room connected to a stair via a corridor as shown in figure 5 populated as indicated with a panel consisting of males 30-50 years old from table 3.4 in the appendix to the Guidelines for the advanced evacuation analysis of new and existing ships with instant response time and distribute the walking speeds over a population of 150 persons. The expected result is that congestion appears at the exit from the room, which produces a steady flow in the corridor with the formation of congestion at the base of the stairs.
Figure 5: Escape route via stairs

MSC.1/Circ.1533 Annex 3, page 14
https://edocs.imo.org/Final Documents/English/MSC.1-CIRC.1533 (E).docx
Test 12: Flow density relation 18 The software should be tested for a corridor without any obstructions. It should be demonstrated that the flow of persons in the corridor is generally smaller at very high population densities compared with that at moderate densities. Quantitative verification 19 Quantitative verification involves comparing model predictions with reliable data generated from evacuation demonstrations. At this stage of development there is insufficient reliable experimental data to allow a thorough quantitative verification of egress models. Until such data becomes available the first three components of the verification process are considered sufficient.

MSC.1/Circ.1533 Annex 3, page 15
https://edocs.imo.org/Final Documents/English/MSC.1-CIRC.1533 (E).docx
APPENDIX 3
EXAMPLE OF A CONVERGENCE CRITERION The following process is given as an example of a convergence criterion mentioned in paragraph 5.4 of appendix 1.
1 In total, a minimum of 50 different simulations should be carried out for each of the benchmark cases. This will yield, for each case, a total of at least 50 values of tA. More than 50 simulations may be required according to the outcome of the convergence test (3 and 4 below), which requires to increment the number of simulations one by one (see 3) and to test the criterion every batch of 50 simulation runs (see 4). 2 These simulations should be made up of at least 10 different randomly generated populations (within the range of population demographics specified in paragraph 3 of appendix 1). Simulations based on each of these different populations should be repeated at least 5 times. If these 5 repetitions produce insignificant variations in the results, the total number of populations analysed should be 50 rather than 10, with only a single simulation performed for each population. 3 Observed 95th centile of tA 3.1 For each case, the evaluation of the 95th centile is an incremental evaluation which is performed every simulation run using all available tA previously calculated from the first to the last simulation run of the case studied.
3.2 The value of the 95th centile of all calculated total assembly times (noted T0.95) is taken which is higher than 95% of all the previous calculated values (i.e. for each of the four cases, for each simulation run increment, indexed on letter "i" below, all available values of
assembly times tA of the case are ranked from lowest to highest and T0.95i is selected for
which 95% of the ranked values are lower. Consequently, at the simulation number i, there is
a series of i values of T0.95i ).
4 Convergence criterion 4.1 For each case, the convergence test is an evaluation of the following criterion which is performed every batch of 50 simulation runs. N denotes the number of simulations that have been run every time the criterion is tested (i.e. N = 50 for the first batch, N = 100 for the second batch etc.)
4.2 The distance between the maximum to the minimum of T0.95i obtained over the 50 last
simulation increments should not exceed the distance (in absolute value) of the mean of T0.95i
over the 50 last simulation increments, to the maximum allowable assembly time (Tlim):
|Tlim − T0.95mean50| ≥ T0.95
max50 − T0.95min50
Where:
Tlim =n−
2
3(E+L)
1.25 with n, E, and L, as defined in Annex1, §5.1 (1),
T0.95mean50 = mean(T0.95
i ), with i between (N − 49) and N,
T0.95max50 = maximum(T0.95
i ), with i between (N − 49) and N, and
T0.95min50 = minimu m(T0.95
i ) , with i between (N − 49)and N.

MSC.1/Circ.1533 Annex 3, page 16
https://edocs.imo.org/Final Documents/English/MSC.1-CIRC.1533 (E).docx
4.3 For each of the four cases, the following iterative method should be followed to determine the travel Time Tcase:
- If the criterion is not met, another batch of 50 simulations should be run; - If the criterion is met, sufficient number of simulations has been run for the case.
T0.95mean50 (for the first N which satisfies the criterion) is selected as the travel time
Tcase; and - If a total of 500 simulations have been run for the case, the process should be
stopped and T0.95mean50 is selected as the travel time Tcase.
5 The value of the travel time to comply with the performance standard T is the highest of the four calculated travel times Tcase (one for each of the four cases). 6 The same procedure for a convergence criterion for case 5 and the travel duration in case 6 (travel duration from assembly stations to the LSA entry points) can be based on the same principle (paragraph 1 to 5). For case 6, the procedure requires to adapt the notations (tA) and to take into account (E+L) ≤ 30' (see annex 1, paragraph 5.1 (2) for the definition of Tlim.
___________


![44161289 MSC Circ 456 Stabilty Criteria[1]](https://static.fdocuments.in/doc/165x107/577cc6061a28aba7119d87b1/44161289-msc-circ-456-stabilty-criteria1.jpg)