REVISED GUIDELINES FOR FORMAL SAFETY …research.dnv.com/skj/IMO/MSC-MEPC 2_Circ 12 FSA... · ·...
72
I:\CIRC\MSC-MEPC\2\12.doc E 4 ALBERT EMBANKMENT LONDON SE1 7SR Telephone: +44 (0)20 7735 7611 Fax: +44 (0)20 7587 3210 MSC-MEPC.2/Circ.12 8 July 2013 REVISED GUIDELINES FOR FORMAL SAFETY ASSESSMENT (FSA) FOR USE IN THE IMO RULE-MAKING PROCESS 1 The Maritime Safety Committee, at its seventy-fourth session (30 May to 8 June 2001), and the Marine Environment Protection Committee, at its forty-seventh session (4 to 8 March 2002), approved: .1 Guidelines for Formal Safety Assessment (FSA) for use in the IMO rule-making process (MSC/Circ.1023-MEPC/Circ.392); and .2 Guidance on the use of Human Element Analysing Process (HEAP) and Formal Safety Assessment (FSA) in the IMO rule-making process (MSC/Circ.1022-MEPC/Circ.391). 2 The Maritime Safety Committee, at its ninety-first session (26 to 30 November 2012), and the Marine Environment Protection Committee, at its sixty-fifth session (13 to 17 May 2013), reviewed the aforementioned Guidelines and Guidance in the light of the experience gained with their application and approved the Revised Guidelines for Formal Safety Assessment (FSA) for use in the IMO rule-making process, as set out in the annex. 3 Member States and non-governmental organizations are invited to apply the Revised Guidelines contained in this circular. 4 The Revised Guidelines supersede the previous Guidelines contained in MSC/Circ.1023-MEPC/Circ.392, as amended by MSC/Circ.1180-MEPC/Circ.474 and MSC-MEPC.2/Circ.5, and the Guidance contained in MSC/Circ.1022-MEPC/Circ.391, as amended by MSC-MEPC.2/Circ.6. ***
-
Upload
truongkhanh -
Category
Documents
-
view
261 -
download
2
Transcript of REVISED GUIDELINES FOR FORMAL SAFETY …research.dnv.com/skj/IMO/MSC-MEPC 2_Circ 12 FSA... · ·...
I:\CIRC\MSC-MEPC\2\12.doc
E
4 ALBERT EMBANKMENT
LONDON SE1 7SR Telephone: +44 (0)20 7735 7611 Fax: +44 (0)20 7587 3210
MSC-MEPC.2/Circ.12 8 July 2013
REVISED GUIDELINES FOR FORMAL SAFETY ASSESSMENT (FSA)
FOR USE IN THE IMO RULE-MAKING PROCESS 1 The Maritime Safety Committee, at its seventy-fourth session (30 May to 8 June 2001), and the Marine Environment Protection Committee, at its forty-seventh session (4 to 8 March 2002), approved: .1 Guidelines for Formal Safety Assessment (FSA) for use in the IMO
rule-making process (MSC/Circ.1023-MEPC/Circ.392); and .2 Guidance on the use of Human Element Analysing Process (HEAP) and
Formal Safety Assessment (FSA) in the IMO rule-making process (MSC/Circ.1022-MEPC/Circ.391).
2 The Maritime Safety Committee, at its ninety-first session (26 to 30 November 2012), and the Marine Environment Protection Committee, at its sixty-fifth session (13 to 17 May 2013), reviewed the aforementioned Guidelines and Guidance in the light of the experience gained with their application and approved the Revised Guidelines for Formal Safety Assessment (FSA) for use in the IMO rule-making process, as set out in the annex. 3 Member States and non-governmental organizations are invited to apply the Revised Guidelines contained in this circular. 4 The Revised Guidelines supersede the previous Guidelines contained in MSC/Circ.1023-MEPC/Circ.392, as amended by MSC/Circ.1180-MEPC/Circ.474 and MSC-MEPC.2/Circ.5, and the Guidance contained in MSC/Circ.1022-MEPC/Circ.391, as amended by MSC-MEPC.2/Circ.6.
***

MSC-MEPC.2/Circ.12 Annex, page 1
I:\CIRC\MSC-MEPC\2\12.doc
ANNEX
REVISED GUIDELINES FOR FORMAL SAFETY ASSESSMENT (FSA) FOR USE IN THE IMO RULE-MAKING PROCESS
Table of Contents
1 INTRODUCTION
1.1 Purpose of FSA 1.2 Scope of the Guidelines 1.3 Application
2 BASIC TERMINOLOGY 3 METHODOLOGY
3.1 Process 3.2 Information and data 3.3 Expert judgement 3.4 Incorporation of the human element 3.5 Evaluating regulatory influence
4 PROBLEM DEFINITION
4.1 Preparation for the study 4.2 Generic model 4.3 Results
5 FSA STEP 1 – IDENTIFICATION OF HAZARDS
5.1 Scope 5.2 Methods 5.3 Results
6 FSA STEP 2 – RISK ANALYSIS
6.1 Scope 6.2 Methods 6.3 Results
7 FSA STEP 3 – RISK CONTROL OPTIONS
7.1 Scope 7.2 Methods 7.3 Results
8 FSA STEP 4 – COST-BENEFIT ASSESSMENT 8.1 Scope 8.2 Methods 8.3 Results
MSC-MEPC.2/Circ.12 Annex, page 2
I:\CIRC\MSC-MEPC\2\12.doc
9 FSA STEP 5 – RECOMMENDATIONS FOR DECISION-MAKING
9.1 Scope 9.2 Methods 9.3 Results
10 PRESENTATION OF FSA RESULTS 11 APPLICATION AND REVIEW PROCESS OF FSA List of figures Figure 1 – Flow chart of the FSA methodology Figure 2 – Example of loss matrix Figure 3 – Components of the integrated system Figure 4 – Incorporation of Human Reliability Analysis (HRA) into the FSA process Figure 5 – Risk matrix Figure 6 – Example of a risk contribution tree List of appendices Appendix 1 – Guidance on Human Reliability Analysis (HRA) Appendix 2 – Examples of hazards Appendix 3 – Hazard identification and risk analysis techniques Appendix 4 – Initial ranking of accident scenarios Appendix 5 – Measures and tolerability of risks Appendix 6 – Attributes of risk control measures Appendix 7 – Examples of calculation of indices for cost-effectiveness Appendix 8 – Standard format for reporting an application of FSA to IMO Appendix 9 – Degree of agreement between experts concordance matrix Appendix 10 – Guidance for practical application and review process of FSA
MSC-MEPC.2/Circ.12 Annex, page 3
I:\CIRC\MSC-MEPC\2\12.doc
1 INTRODUCTION
1.1 Purpose of FSA 1.1.1 Formal Safety Assessment (FSA) is a structured and systematic methodology, aimed at enhancing maritime safety, including protection of life, health, the marine environment and property, by using risk analysis and cost-benefit assessment. 1.1.2 FSA can be used as a tool to help in the evaluation of new regulations for maritime safety and protection of the marine environment or in making a comparison between existing and possibly improved regulations, with a view to achieving a balance between the various technical and operational issues, including the human element, and between maritime safety or protection of the marine environment and costs. 1.1.3 FSA is consistent with the current IMO decision-making process and provides a basis for making decisions in accordance with resolutions A.500(XII) on Objectives of the Organization in the 1980s, A.777(18) on Work methods and organization of work in committees and their subsidiary bodies and A.900(21) on Objectives of the Organization in the 2000s. 1.1.4 The decision makers at IMO, through FSA, will be able to appreciate the effect of proposed regulatory changes in terms of benefits (e.g. expected reduction of lives lost or of pollution) and related costs incurred for the industry as a whole and for individual parties affected by the decision. FSA should facilitate the development of regulatory changes equitable to the various parties thus aiding the achievement of consensus. 1.2 Scope of the Guidelines These Guidelines are intended to outline the FSA methodology as a tool, which may be used in the IMO rule-making process. In order that FSA can be consistently applied by different parties, it is important that the process is clearly documented and formally recorded in a uniform and systematic manner. This will ensure that the FSA process is transparent and can be understood by all parties irrespective of their experience in the application of risk analysis and cost-benefit assessment and related techniques. 1.3 Application 1.3.1 The FSA methodology can be applied by:
.1 a Member Government or an organization in consultative status with IMO, when proposing amendments to maritime safety, pollution prevention and response-related IMO instruments in order to analyse the implications of such proposals; or
.2 a Committee, or an instructed subsidiary body, to provide a balanced view of a framework of regulations, so as to identify priorities and areas of concern and to analyse the benefits and implications of proposed changes.
1.3.2 It is not intended that FSA should be applied in all circumstances, but its application would be particularly relevant to proposals which may have far-reaching implications in terms of either costs (to society or the maritime industry), or the legislative and administrative burdens which may result. FSA may also be useful in those situations where there is a need for risk reduction but the required decisions regarding what to do are unclear, regardless of the scope of the project. In these circumstances, FSA will enable the benefits of proposed changes to be properly established, so as to give Member Governments a clearer perception of the scope of the proposals and an improved basis on which they take decisions.
MSC-MEPC.2/Circ.12 Annex, page 4
I:\CIRC\MSC-MEPC\2\12.doc
2 BASIC TERMINOLOGY The following definitions apply in the context of these Guidelines: Accident: An unintended event involving fatality, injury, ship loss or
damage, other property loss or damage, or environmental damage.
Accident category: A designation of accidents reported in statistical tables
according to their nature, e.g. fire, collision, grounding, etc. Accident scenario: A sequence of events from the initiating event to one of the final
stages. Consequence: The outcome of an accident. Frequency: The number of occurrences per unit time (e.g. per year). Generic model: A set of functions common to all ships or areas under
consideration. Hazard: A potential to threaten human life, health, property or the
environment. Initiating event: The first of a sequence of events leading to a hazardous
situation or accident. Probability (Objective/frequentistic):
The relative frequency that an event will occur, as expressed by the ratio of the number of occurrences to the total number of possible occurrences.
Probability (Subjective/Bayesian):
The degree of confidence in the occurrence of an event, measured on a scale from zero to one. An event with a probability of zero means that it is believed to be impossible; an event with the probability of 1 means that it is believed it will certainly occur."
Risk: The combination of the frequency and the severity of the
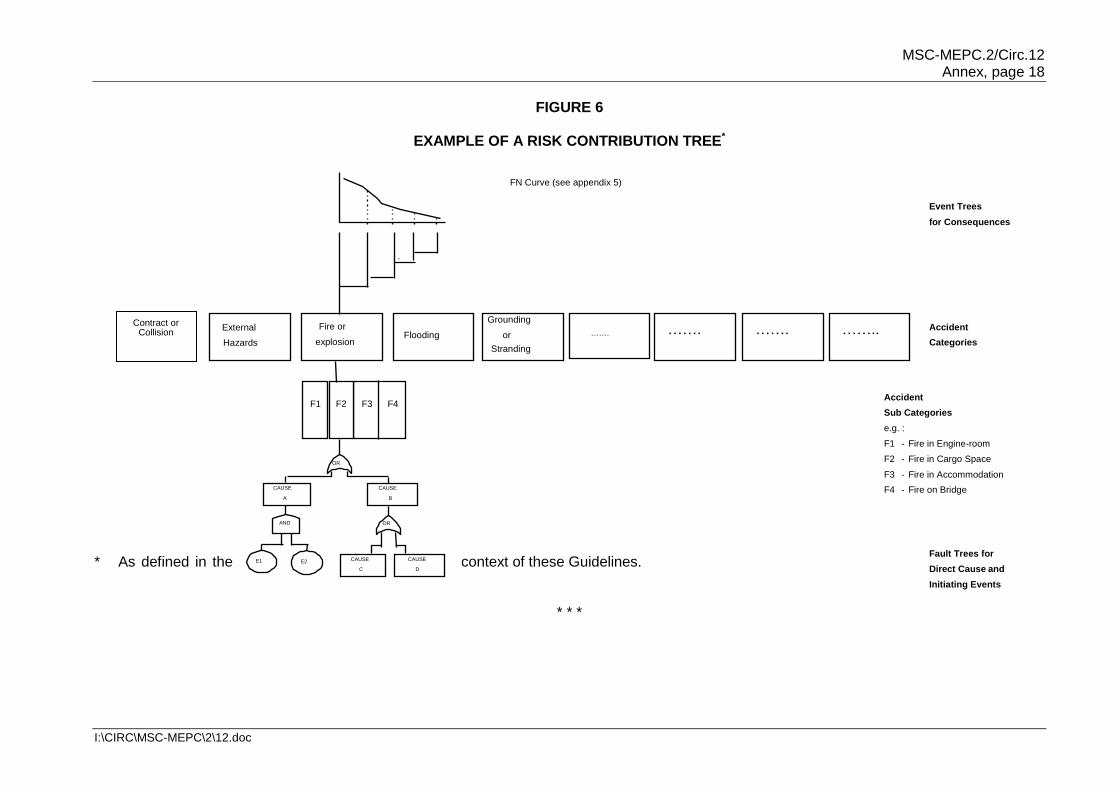
consequence. Risk contribution tree: The combination of all fault trees and event trees that constitute (RCT) the risk model. Risk control measure: A means of controlling a single element of risk. (RCM) Risk control option (RCO): A combination of risk control measures. Risk evaluation criteria: Criteria used to evaluate the acceptability/tolerability of risk.
MSC-MEPC.2/Circ.12 Annex, page 5
I:\CIRC\MSC-MEPC\2\12.doc
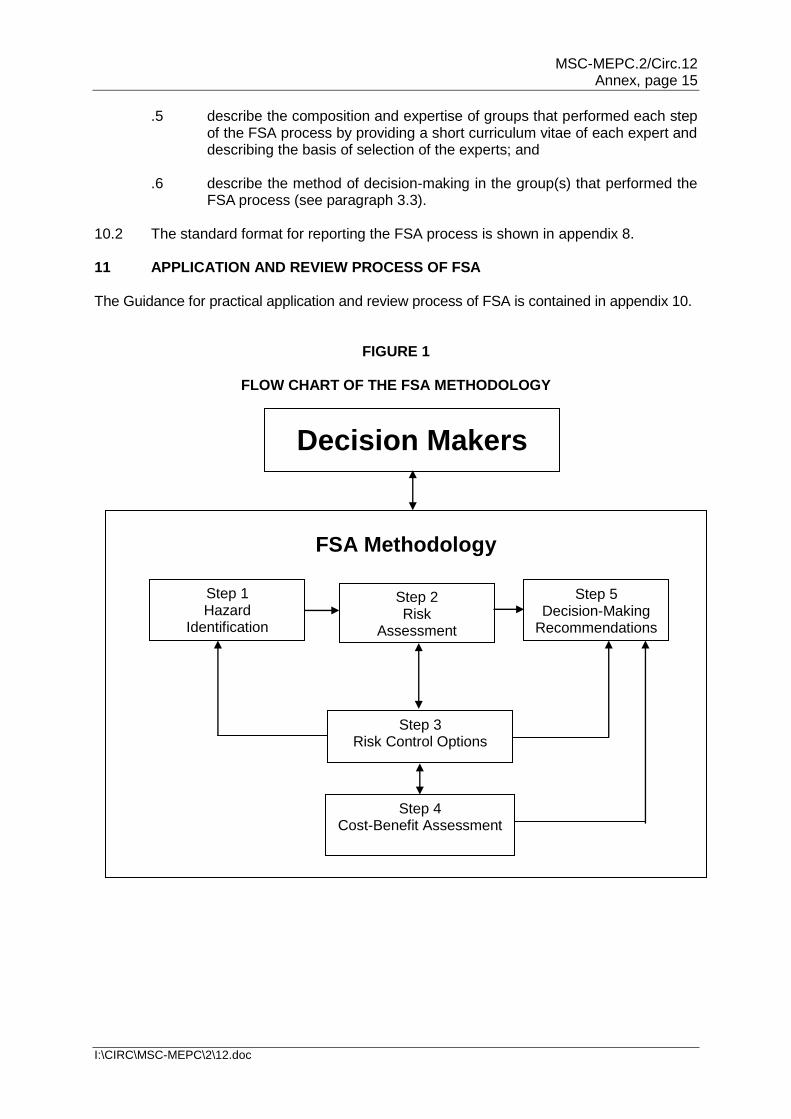
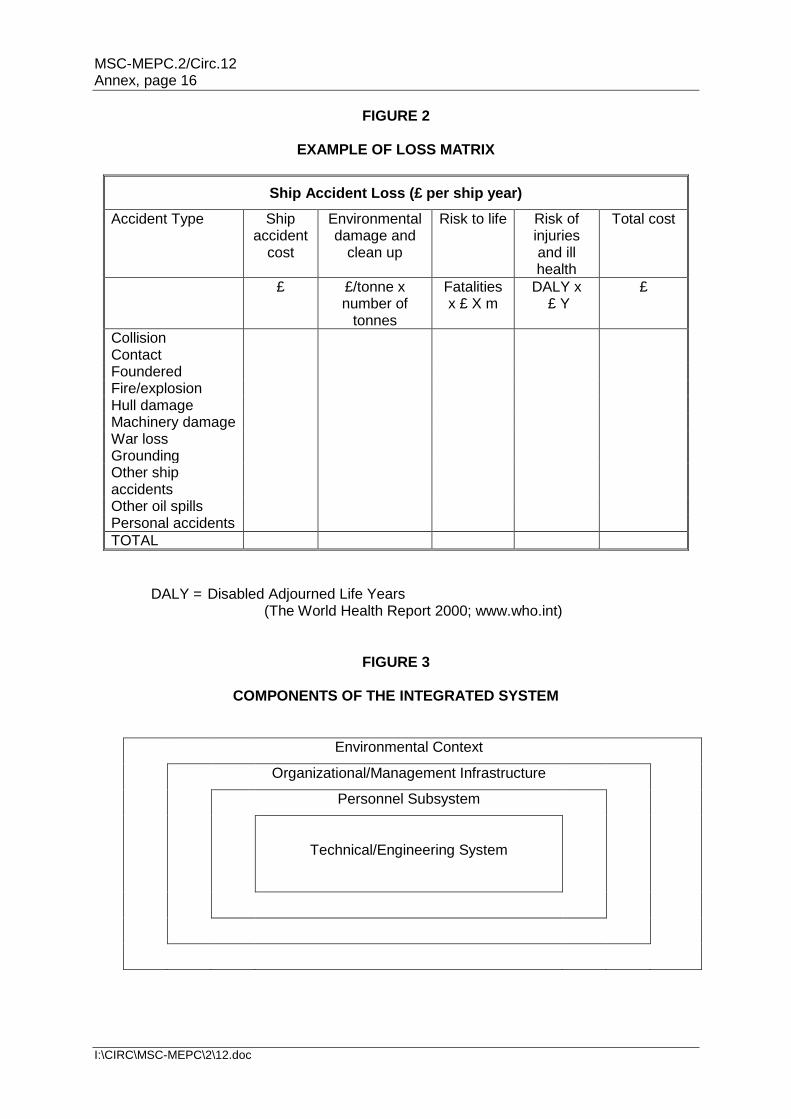
3 METHODOLOGY 3.1 Process 3.1.1 Steps 3.1.1.1 FSA should comprise the following steps: .1 identification of hazards; .2 risk analysis; .3 risk control options; .4 cost-benefit assessment; and .5 recommendations for decision-making. 3.1.1.2 Figure 1 is a flow chart of the FSA methodology. The process begins with the decision makers defining the problem to be assessed along with any relevant boundary conditions or constraints. These are presented to the group who will carry out the FSA and provide results to the decision makers for use in their resolutions. In cases where decision makers require additional work to be conducted, they would revise the problem statement or boundary conditions or constraints, and resubmit this to the group and repeat the process as necessary. Within the FSA methodology, step 5 interacts with each of the other steps in arriving at decision-making recommendations. The group carrying out the FSA process should comprise suitably qualified and experienced people to reflect the range of influences and the nature of the "event" being addressed. 3.1.2 Screening approach 3.1.2.1 The depth or extent of application of the methodology should be commensurate with the nature and significance of the problem; however, experience indicates that very broad FSA studies can be harder to manage. To enable the FSA to focus on those areas that deserve more detailed analysis, a preliminary coarse qualitative analysis is suggested for the relevant ship type or hazard category, in order to include all aspects of the problem under consideration. Whenever there are uncertainties, e.g. in respect of data or expert judgement, the significance of these uncertainties should be assessed. 3.1.2.2 Characterization of hazards and risks should be both qualitative and quantitative, and both descriptive and mathematical, consistent with the available data, and should be broad enough to include a comprehensive range of options to reduce risks. 3.1.2.3 A hierarchical screening approach may be utilized. This would ensure that excessive analysis is not performed by utilizing relatively simple tools to perform initial analyses, the results of which can be used to either support decision-making (if the degree of support is adequate) or to scope/frame more detailed analyses (if not). The initial analyses would therefore be primarily qualitative in nature, with a recognition that increasing degrees of detail and quantification will come in subsequent analyses as necessary. 3.1.2.4 A review of historical data may also be useful as a preparation for a detailed study. For this purpose a loss matrix may be useful. An example can be found in figure 2.
MSC-MEPC.2/Circ.12 Annex, page 6
I:\CIRC\MSC-MEPC\2\12.doc
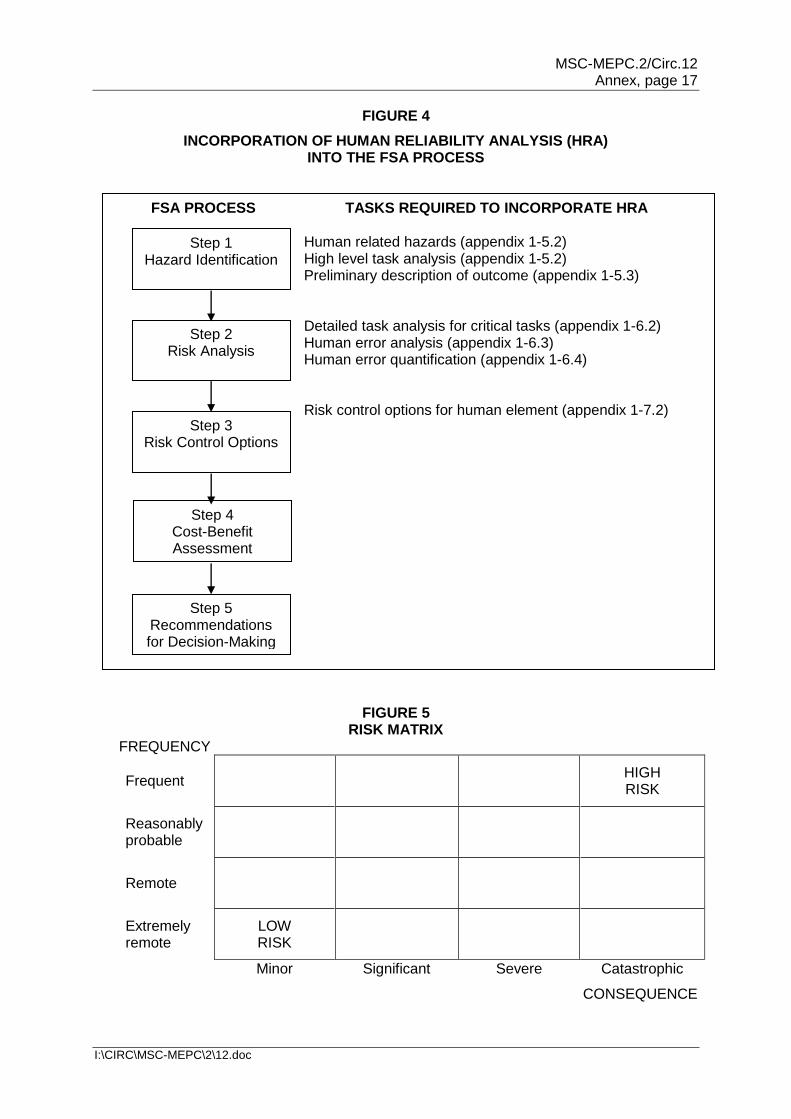
3.2 Information and data 3.2.1 The availability of suitable data necessary for each step of the FSA process is very important. When data are not available, expert judgment, physical models, simulations and analytical models may be used to achieve valuable results. Consideration should be given to those data which are already available at IMO (e.g. casualty and deficiency statistics) and to potential improvements in those data in anticipation of an FSA implementation (e.g. a better specification for recording relevant data including the primary causes, underlying factors and latent factors associated with a casualty). 3.2.2 Data concerning incident reports, near misses and operational failures may be very important for the purpose of making more balanced, proactive and cost-effective legislation, as required in paragraph 4.2 of appendix 8. Such data must be reviewed objectively and their reliability, uncertainty and validity assessed and reported. The assumptions and limitations of these data must also be reported. 3.2.3 However, one of the most beneficial qualities of FSA is the proactive nature. The proactive approach is reached through the probabilistic modelling of failures and development of accident scenarios. Analytical modelling has to be used to evaluate rare events where there is inadequate historical data. A rare event is decomposed into more frequent events for which there is more experience available (e.g. evaluate system failure based on component failure data). 3.2.4 Equally, consideration should also be given to cases where the introduction of recent changes may have affected the validity of historic data for assessing current risk. 3.3 Expert judgment 3.3.1 The use of expert judgment is considered to be an important element within the FSA methodology. It not only contributes to the proactive nature of the methodology, but is also essential in cases where there is a lack of historical data. Further historical data may be evaluated by the use of expert judgment by which the quality of the historical data may be improved. 3.3.2 In applying expert judgment, different experts may be involved in a particular FSA study. It is unlikely that the experts' opinions will always be in agreement. It might even be the case that the experts have strong disagreements on specific issues. Preferably, a good level of agreement should be reached. It is highly recommended to report the level of agreement between the experts in the results of an FSA study. It is important to know the level of agreement, and this may be established by the use of a concordance matrix or by any other methodology. For example, appendix 9 describes the use of a concordance matrix. 3.4 Incorporation of the human element 3.4.1 The human element is one of the most important contributory aspects to the causation and avoidance of accidents. Human element issues throughout the integrated system shown in figure 3 should be systematically treated within the FSA framework, associating them directly with the occurrence of accidents, underlying causes or influences. Appropriate techniques for incorporating human factors should be used. 3.4.2 The human element can be incorporated into the FSA process by using human reliability analysis (HRA). Guidance for the use of HRA within FSA is given in appendix 1 and diagrammatically in figure 4. To allow easy referencing the numbering system in appendix 1 is consistent with that of the rest of the FSA Guidelines.
skj
Highlight
skj
Highlight
MSC-MEPC.2/Circ.12 Annex, page 7
I:\CIRC\MSC-MEPC\2\12.doc
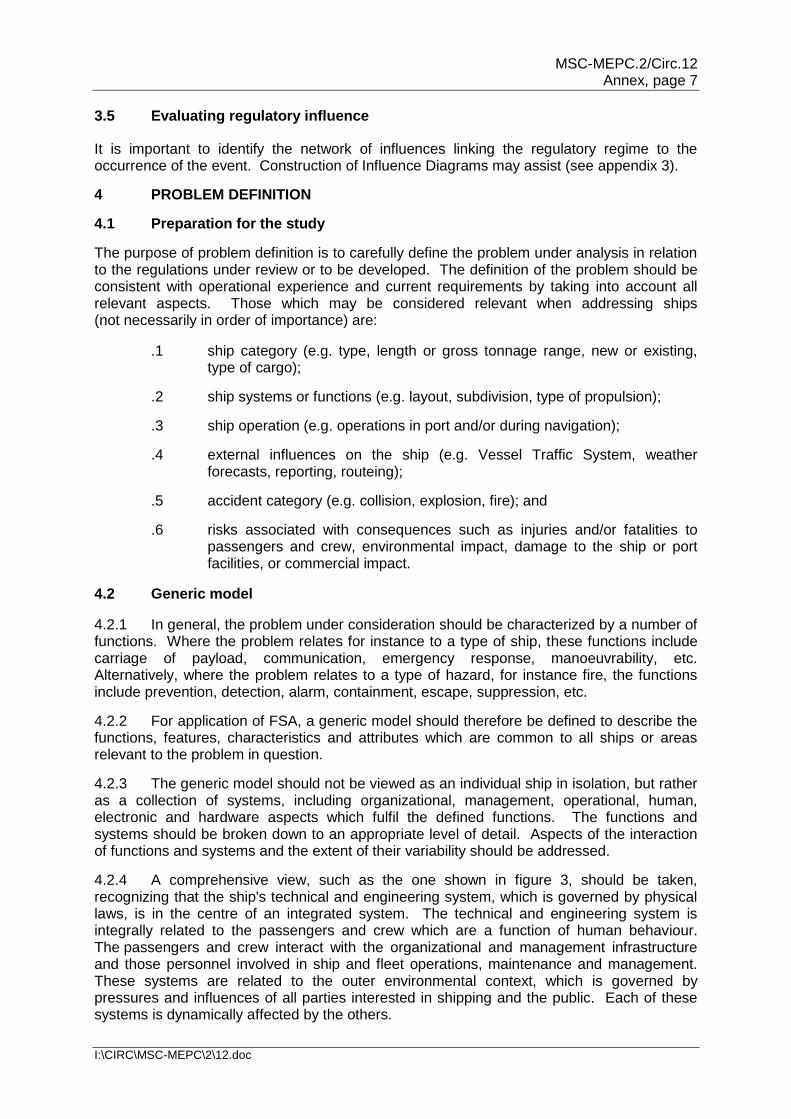
3.5 Evaluating regulatory influence
It is important to identify the network of influences linking the regulatory regime to the occurrence of the event. Construction of Influence Diagrams may assist (see appendix 3).
4 PROBLEM DEFINITION
4.1 Preparation for the study
The purpose of problem definition is to carefully define the problem under analysis in relation to the regulations under review or to be developed. The definition of the problem should be consistent with operational experience and current requirements by taking into account all relevant aspects. Those which may be considered relevant when addressing ships (not necessarily in order of importance) are:
.1 ship category (e.g. type, length or gross tonnage range, new or existing, type of cargo);
.2 ship systems or functions (e.g. layout, subdivision, type of propulsion);
.3 ship operation (e.g. operations in port and/or during navigation);
.4 external influences on the ship (e.g. Vessel Traffic System, weather forecasts, reporting, routeing);
.5 accident category (e.g. collision, explosion, fire); and
.6 risks associated with consequences such as injuries and/or fatalities to passengers and crew, environmental impact, damage to the ship or port facilities, or commercial impact.
4.2 Generic model
4.2.1 In general, the problem under consideration should be characterized by a number of functions. Where the problem relates for instance to a type of ship, these functions include carriage of payload, communication, emergency response, manoeuvrability, etc. Alternatively, where the problem relates to a type of hazard, for instance fire, the functions include prevention, detection, alarm, containment, escape, suppression, etc.
4.2.2 For application of FSA, a generic model should therefore be defined to describe the functions, features, characteristics and attributes which are common to all ships or areas relevant to the problem in question.
4.2.3 The generic model should not be viewed as an individual ship in isolation, but rather as a collection of systems, including organizational, management, operational, human, electronic and hardware aspects which fulfil the defined functions. The functions and systems should be broken down to an appropriate level of detail. Aspects of the interaction of functions and systems and the extent of their variability should be addressed.
4.2.4 A comprehensive view, such as the one shown in figure 3, should be taken, recognizing that the ship's technical and engineering system, which is governed by physical laws, is in the centre of an integrated system. The technical and engineering system is integrally related to the passengers and crew which are a function of human behaviour. The passengers and crew interact with the organizational and management infrastructure and those personnel involved in ship and fleet operations, maintenance and management. These systems are related to the outer environmental context, which is governed by pressures and influences of all parties interested in shipping and the public. Each of these systems is dynamically affected by the others.
MSC-MEPC.2/Circ.12 Annex, page 8
I:\CIRC\MSC-MEPC\2\12.doc
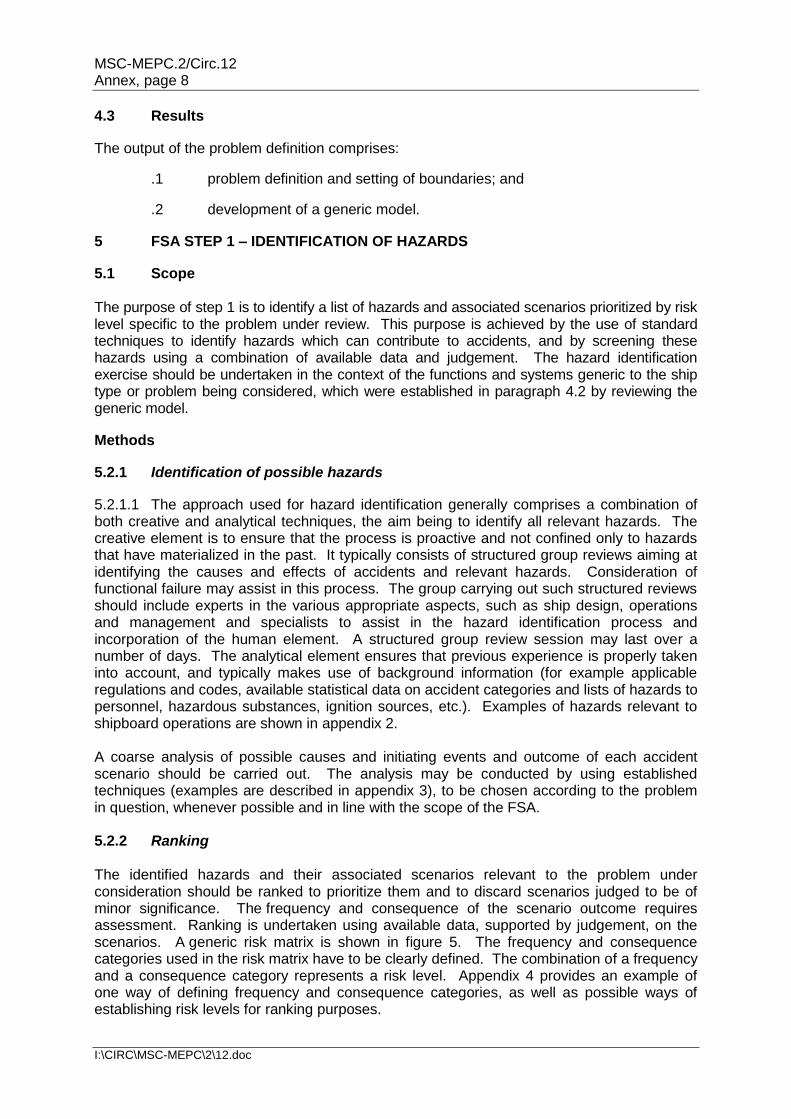
4.3 Results
The output of the problem definition comprises:
.1 problem definition and setting of boundaries; and
.2 development of a generic model.
5 FSA STEP 1 – IDENTIFICATION OF HAZARDS
5.1 Scope The purpose of step 1 is to identify a list of hazards and associated scenarios prioritized by risk level specific to the problem under review. This purpose is achieved by the use of standard techniques to identify hazards which can contribute to accidents, and by screening these hazards using a combination of available data and judgement. The hazard identification exercise should be undertaken in the context of the functions and systems generic to the ship type or problem being considered, which were established in paragraph 4.2 by reviewing the generic model.
Methods
5.2.1 Identification of possible hazards
5.2.1.1 The approach used for hazard identification generally comprises a combination of both creative and analytical techniques, the aim being to identify all relevant hazards. The creative element is to ensure that the process is proactive and not confined only to hazards that have materialized in the past. It typically consists of structured group reviews aiming at identifying the causes and effects of accidents and relevant hazards. Consideration of functional failure may assist in this process. The group carrying out such structured reviews should include experts in the various appropriate aspects, such as ship design, operations and management and specialists to assist in the hazard identification process and incorporation of the human element. A structured group review session may last over a number of days. The analytical element ensures that previous experience is properly taken into account, and typically makes use of background information (for example applicable regulations and codes, available statistical data on accident categories and lists of hazards to personnel, hazardous substances, ignition sources, etc.). Examples of hazards relevant to shipboard operations are shown in appendix 2. A coarse analysis of possible causes and initiating events and outcome of each accident scenario should be carried out. The analysis may be conducted by using established techniques (examples are described in appendix 3), to be chosen according to the problem in question, whenever possible and in line with the scope of the FSA. 5.2.2 Ranking The identified hazards and their associated scenarios relevant to the problem under consideration should be ranked to prioritize them and to discard scenarios judged to be of minor significance. The frequency and consequence of the scenario outcome requires assessment. Ranking is undertaken using available data, supported by judgement, on the scenarios. A generic risk matrix is shown in figure 5. The frequency and consequence categories used in the risk matrix have to be clearly defined. The combination of a frequency and a consequence category represents a risk level. Appendix 4 provides an example of one way of defining frequency and consequence categories, as well as possible ways of establishing risk levels for ranking purposes.

MSC-MEPC.2/Circ.12 Annex, page 9
I:\CIRC\MSC-MEPC\2\12.doc
5.3 Results
The output from step 1 comprises:
.1 a list of hazards and their associated scenarios (including initiating events); and
.2 an assessment of accident scenarios (prioritized by risk level).
6 FSA STEP 2 – RISK ANALYSIS
6.1 Scope
6.1.1 The purpose of the risk analysis in step 2 is a detailed investigation of the causes and initiating events and consequences of the more important accident scenarios identified in step 1. This can be achieved by the use of suitable techniques that model the risk. This allows attention to be focused upon high-risk areas and to identify and evaluate the factors which influence the level of risk.
6.1.2 Different types of risk (i.e. risks to people, the environment or property) should be addressed as appropriate to the problem under consideration. Measures of risk are discussed in appendix 5.
6.2 Methods
6.2.1 There are several methods/tools that can be used to perform a risk analysis. The scope of the FSA, types of hazards identified in step 1, and the level of failure data available will all influence which method/tool works best for each specific application. Examples of the different types of risk analysis methods/tools are outlined in appendix 3.
6.2.2 Quantification makes use of accident and failure data and other sources of information as appropriate to the level of analysis. Where data is unavailable, calculation, simulation or the use of established techniques for expert judgement may be used.
6.2.3 Sensitivity analysis and uncertainty analysis should be considered in the quantified and/or qualified risk and risk models and the results should be reported together with the quantitative data and explanation of models used. Methodologies of sensitivity analysis and uncertainty analysis would depend on the method of risk analysis and/or risk models used.
6.3 Results
The output from step 2 comprises:
.1 the identification of the high-risk areas which need to be addressed; and
.2 the explanation of risk models.
7 FSA STEP 3 – RISK CONTROL OPTIONS
7.1 Scope
7.1.1 The purpose of step 3 is to first identify Risk Control Measures (RCMs) and then to group them into a limited number of Risk Control Options (RCOs) for use as practical regulatory options. Step 3 comprises the following four stages:
.1 focusing on risk areas needing control;
.2 identifying potential RCMs;
MSC-MEPC.2/Circ.12 Annex, page 10
I:\CIRC\MSC-MEPC\2\12.doc
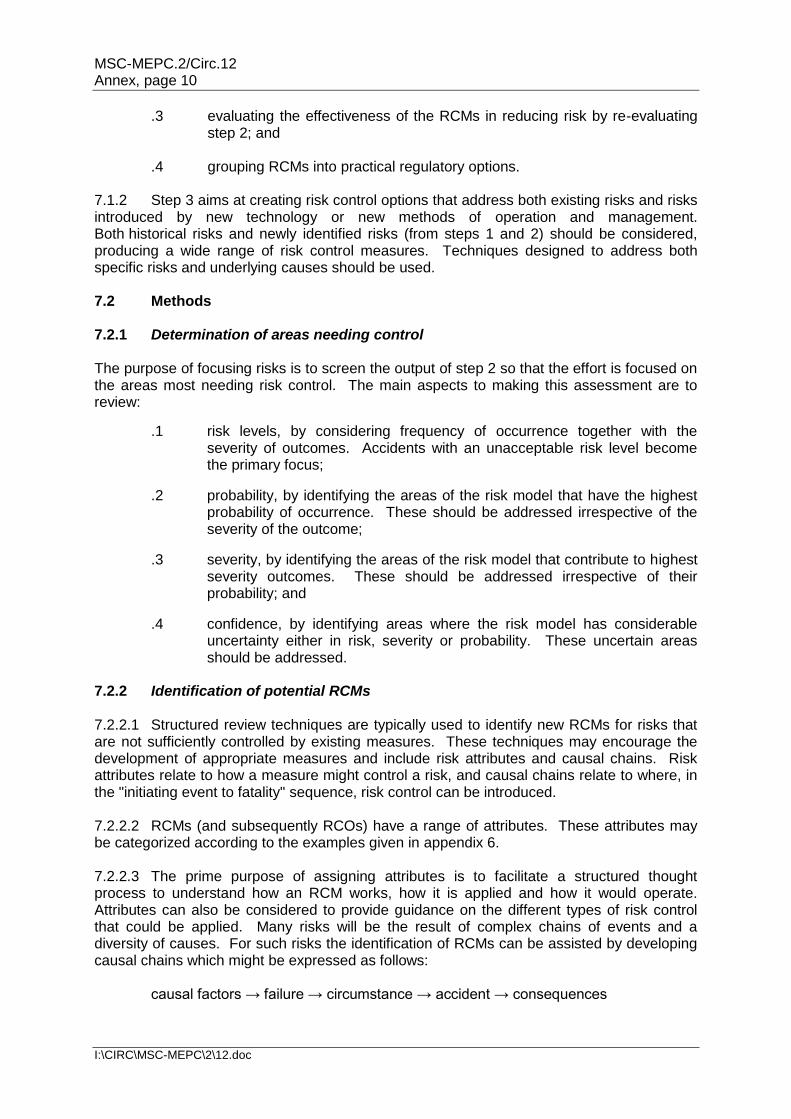
.3 evaluating the effectiveness of the RCMs in reducing risk by re-evaluating step 2; and
.4 grouping RCMs into practical regulatory options. 7.1.2 Step 3 aims at creating risk control options that address both existing risks and risks introduced by new technology or new methods of operation and management. Both historical risks and newly identified risks (from steps 1 and 2) should be considered, producing a wide range of risk control measures. Techniques designed to address both specific risks and underlying causes should be used. 7.2 Methods 7.2.1 Determination of areas needing control The purpose of focusing risks is to screen the output of step 2 so that the effort is focused on the areas most needing risk control. The main aspects to making this assessment are to review:
.1 risk levels, by considering frequency of occurrence together with the severity of outcomes. Accidents with an unacceptable risk level become the primary focus;
.2 probability, by identifying the areas of the risk model that have the highest probability of occurrence. These should be addressed irrespective of the severity of the outcome;
.3 severity, by identifying the areas of the risk model that contribute to highest severity outcomes. These should be addressed irrespective of their probability; and
.4 confidence, by identifying areas where the risk model has considerable uncertainty either in risk, severity or probability. These uncertain areas should be addressed.
7.2.2 Identification of potential RCMs 7.2.2.1 Structured review techniques are typically used to identify new RCMs for risks that are not sufficiently controlled by existing measures. These techniques may encourage the development of appropriate measures and include risk attributes and causal chains. Risk attributes relate to how a measure might control a risk, and causal chains relate to where, in the "initiating event to fatality" sequence, risk control can be introduced. 7.2.2.2 RCMs (and subsequently RCOs) have a range of attributes. These attributes may be categorized according to the examples given in appendix 6. 7.2.2.3 The prime purpose of assigning attributes is to facilitate a structured thought process to understand how an RCM works, how it is applied and how it would operate. Attributes can also be considered to provide guidance on the different types of risk control that could be applied. Many risks will be the result of complex chains of events and a diversity of causes. For such risks the identification of RCMs can be assisted by developing causal chains which might be expressed as follows: causal factors → failure → circumstance → accident → consequences
MSC-MEPC.2/Circ.12 Annex, page 11
I:\CIRC\MSC-MEPC\2\12.doc
7.2.2.4 RCMs should in general be aimed at one or more of the following: .1 reducing the frequency of failures through better design, procedures,
organizational polices, training, etc.;
.2 mitigating the effect of failures, in order to prevent accidents;
.3 alleviating the circumstances in which failures may occur; and
.4 mitigating the consequences of accidents. 7.2.2.5 RCMs should be evaluated regarding their risk reduction effectiveness by using step 2 methodology, including consideration of any potential side effects of the introduction of the RCM. 7.2.3 Composition of RCOs 7.2.3.1 The purpose of this stage is to group the RCMs into a limited number of well thought out Risk Control Options (RCOs). There is a range of possible approaches to grouping individual measures into options. The following two approaches, related to likelihood and escalation, can be considered: .1 "general approach" which provides risk control by controlling the likelihood
of initiation of accidents and may be effective in preventing several different accident sequences; and
.2 "distributed approach" which provides control of escalation of accidents,
together with the possibility of influencing the later stages of escalation of other, perhaps unrelated, accidents.
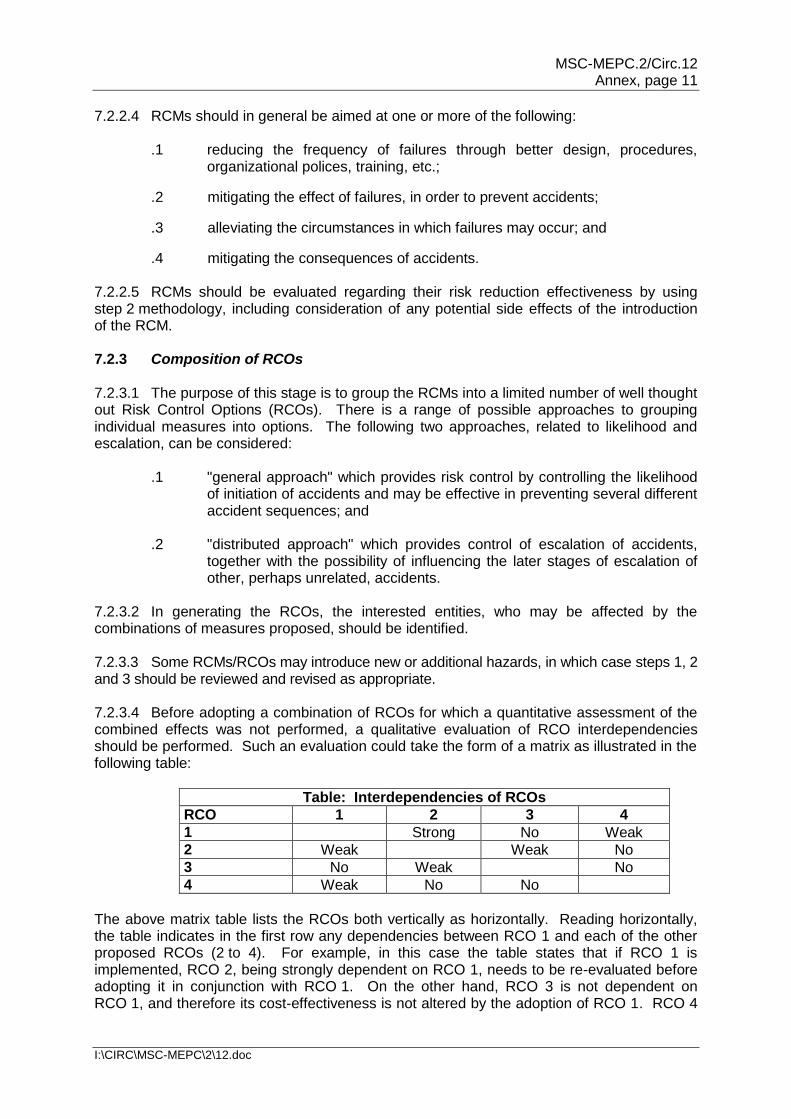
7.2.3.2 In generating the RCOs, the interested entities, who may be affected by the combinations of measures proposed, should be identified. 7.2.3.3 Some RCMs/RCOs may introduce new or additional hazards, in which case steps 1, 2 and 3 should be reviewed and revised as appropriate. 7.2.3.4 Before adopting a combination of RCOs for which a quantitative assessment of the combined effects was not performed, a qualitative evaluation of RCO interdependencies should be performed. Such an evaluation could take the form of a matrix as illustrated in the following table:
Table: Interdependencies of RCOs
RCO 1 2 3 4
1 Strong No Weak
2 Weak Weak No
3 No Weak No
4 Weak No No
The above matrix table lists the RCOs both vertically as horizontally. Reading horizontally, the table indicates in the first row any dependencies between RCO 1 and each of the other proposed RCOs (2 to 4). For example, in this case the table states that if RCO 1 is implemented, RCO 2, being strongly dependent on RCO 1, needs to be re-evaluated before adopting it in conjunction with RCO 1. On the other hand, RCO 3 is not dependent on RCO 1, and therefore its cost-effectiveness is not altered by the adoption of RCO 1. RCO 4
MSC-MEPC.2/Circ.12 Annex, page 12
I:\CIRC\MSC-MEPC\2\12.doc
is weakly dependent on RCO 1, so re-evaluation may not be necessary. In principle one dependency table could be given for cost, benefits and risk reduction. The interdependencies in the above matrix may or may not be symmetric. 7.2.3.5 Where more than one RCOs are proposed to be implemented at the same time, the effectiveness of such combination in reducing the risk should be assessed. 7.2.3.6 Sensitivity analysis and uncertainty analysis should be considered in the analysis of effectiveness of RCMs and RCOs, and the results of sensitivity analysis and uncertainty analysis should be reported. 7.3 Results The output from step 3 comprises: .1 a list of RCOs with their effectiveness in reducing risk, including the method
of analysis;
.2 a list of interested entities affected by the identified RCOs;
.3 a table stating the interdependencies between the identified RCOs; and
.4 results of analysis of side effects of RCOs. 8 FSA STEP 4 – COST-BENEFIT ASSESSMENT 8.1 Scope 8.1.1 The purpose of step 4 is to identify and compare benefits and costs associated with the implementation of each RCO identified and defined in step 3. A cost-benefit assessment may consist of the following stages: .1 consider the risks assessed in step 2, both in terms of frequency and
consequence, in order to define the base case in terms of risk levels of the situation under consideration;
.2 arrange the RCOs, defined in step 3, in a way to facilitate understanding of the costs and benefits resulting from the adoption of an RCO;
.3 estimate the pertinent costs and benefits for all RCOs;
.4 estimate and compare the cost-effectiveness of each option, in terms of the cost per unit risk reduction by dividing the net cost by the risk reduction achieved as a result of implementing the option; and
.5 rank the RCOs from a cost-benefit perspective in order to facilitate the decision-making recommendations in step 5 (e.g. to screen those which are not cost effective or impractical).
8.1.2 Costs should be expressed in terms of life cycle costs and may include initial, operating, training, inspection, certification, decommission, etc. Benefits may include reductions in fatalities, injuries, casualties, environmental damage and clean-up, indemnity of third party liabilities, etc., and an increase in the average life of ships.
MSC-MEPC.2/Circ.12 Annex, page 13
I:\CIRC\MSC-MEPC\2\12.doc
Methods 8.2.1 Definition of interested entities 8.2.1.1 The evaluation of the above costs and benefits can be carried out by using various methods and techniques. Such a process should be conducted for the overall situation and then for those interested entities which are the most influenced by the problem in question. 8.2.1.2 In general, an interested entity can be defined as the person, organization, company, coastal State, flag State, etc., who is directly or indirectly affected by an accident or by the cost-effectiveness of the proposed new regulation. Different interested entities with similar interests can be grouped together for the purpose of applying the FSA methodology and identifying decision-making recommendations. 8.2.2 Calculation indices for cost-effectiveness There are several indices which express cost-effectiveness in relation to safety of life such as Gross Cost of Averting a Fatality (Gross CAF) and Net Cost of Averting a Fatality (Net CAF) as described in appendix 7. Other indices based on damage to and effect on property and environment may be used for a cost-benefit assessment relating to such matters. Comparisons of cost-effectiveness for RCOs may be made by calculating such indices. 8.2.3 For evaluation of RCOs focusing on prevention of oil spill from ships, environmental risk evaluation criteria as described in appendix 7 can be used. 8.2.4 Sensitivity analysis and uncertainty analysis should be considered in the cost-benefit analysis and cost-effectiveness, and the results should be reported. 8.3 Results The output from step 4 comprises: .1 costs and benefits for each RCO identified in step 3 from an overview
perspective; .2 costs and benefits for those interested entities which are the most
influenced by the problem in question; and .3 cost-effectiveness expressed in terms of suitable indices. 9 FSA STEP 5 – RECOMMENDATIONS FOR DECISION-MAKING 9.1 Scope 9.1.1 The purpose of step 5 is to define recommendations which should be presented to the relevant decision makers in an auditable and traceable manner. The recommendations would be based upon the comparison and ranking of all hazards and their underlying causes; the comparison and ranking of risk control options as a function of associated costs and benefits; and the identification of those risk control options which keep risks as low as reasonably practicable. 9.1.2 The basis on which these comparisons are made should take into account that, in ideal terms, all those entities that are significantly influenced in the area of concern should be equitably affected by the introduction of the proposed new regulation. However, taking into
MSC-MEPC.2/Circ.12 Annex, page 14
I:\CIRC\MSC-MEPC\2\12.doc
consideration the difficulties of this type of assessment, the approach should be, at least in the earliest stages, as simple and practical as possible. Methods
9.2.1 Scrutiny of results
Recommendations should be presented in a form that can be understood by all parties irrespective of their experience in the application of risk and cost-benefit assessment and related techniques. Those submitting the results of an FSA process should provide timely and open access to relevant supporting documents and a reasonable opportunity for and a mechanism to incorporate comments. 9.2.2 Risk evaluation criteria
There are several standards for risk acceptance criteria, none as yet universally accepted. While it is desirable for the Organization and Member Governments which propose new regulations or modifications to existing regulations to determine agreed risk evaluation criteria after wide and deep consideration, those used within an FSA should be explicit.
9.3 Results
The output from step 5 comprises:
.1 an objective comparison of alternative options, based on the potential reduction of risks and cost-effectiveness, in areas where legislation or rules should be reviewed or developed;
.2 feedback information to review the results generated in the previous steps;
and .3 recommended RCO(s) accompanied with the application of the RCO(s),
e.g. application of ship type(s) and construction date and/or systems to be fitted on board.
10 PRESENTATION OF FSA RESULTS 10.1 To facilitate the common understanding and use of FSA at IMO in the rule-making process, each report of an FSA process should: .1 provide a clear statement of the final recommendations, ranked and
justified in an auditable and traceable manner; .2 list the principal hazards, risks, costs and benefits identified during the
assessment; .3 explain and reference the basis for significant assumptions, limitations,
uncertainties, data models, methodologies and inferences used or relied upon in the assessment or recommendations, results of hazard identifications and risk analysis, risk control options and results of cost-benefit analysis to be considered in the decision-making process;
.4 describe the sources, extent and magnitude of significant uncertainties
associated with the assessment or recommendations;
MSC-MEPC.2/Circ.12 Annex, page 15
I:\CIRC\MSC-MEPC\2\12.doc
.5 describe the composition and expertise of groups that performed each step of the FSA process by providing a short curriculum vitae of each expert and describing the basis of selection of the experts; and
.6 describe the method of decision-making in the group(s) that performed the
FSA process (see paragraph 3.3). 10.2 The standard format for reporting the FSA process is shown in appendix 8. 11 APPLICATION AND REVIEW PROCESS OF FSA The Guidance for practical application and review process of FSA is contained in appendix 10.
FIGURE 1
FLOW CHART OF THE FSA METHODOLOGY
Decision Makers
FSA Methodology
Step 1 Hazard
Identification
Step 2 Risk
Assessment
Step 5 Decision-Making
Recommendations
Step 3 Risk Control Options
Step 4 Cost-Benefit Assessment
MSC-MEPC.2/Circ.12 Annex, page 16
I:\CIRC\MSC-MEPC\2\12.doc
FIGURE 2
EXAMPLE OF LOSS MATRIX
Ship Accident Loss (£ per ship year)
Accident Type Ship accident
cost
Environmental damage and
clean up
Risk to life Risk of injuries and ill health
Total cost
£ £/tonne x number of
tonnes
Fatalities x £ X m
DALY x £ Y
£
Collision Contact Foundered Fire/explosion Hull damage Machinery damage War loss Grounding Other ship accidents
Other oil spills Personal accidents
TOTAL
DALY = Disabled Adjourned Life Years (The World Health Report 2000; www.who.int)
FIGURE 3
COMPONENTS OF THE INTEGRATED SYSTEM
Environmental Context
Organizational/Management Infrastructure
Personnel Subsystem
Technical/Engineering System
MSC-MEPC.2/Circ.12 Annex, page 17
I:\CIRC\MSC-MEPC\2\12.doc
Step 1 Hazard Identification
Step 2 Risk Analysis
Step 3 Risk Control Options
Step 4 Cost-Benefit Assessment
Step 5 Recommendations for Decision-Making
FIGURE 4
INCORPORATION OF HUMAN RELIABILITY ANALYSIS (HRA) INTO THE FSA PROCESS
FSA PROCESS TASKS REQUIRED TO INCORPORATE HRA Human related hazards (appendix 1-5.2) High level task analysis (appendix 1-5.2) Preliminary description of outcome (appendix 1-5.3) Detailed task analysis for critical tasks (appendix 1-6.2) Human error analysis (appendix 1-6.3) Human error quantification (appendix 1-6.4) Risk control options for human element (appendix 1-7.2)
FIGURE 5 RISK MATRIX
FREQUENCY
Frequent
HIGH RISK
Reasonably probable
Remote
Extremely remote
LOW RISK
Minor Significant Severe Catastrophic
CONSEQUENCE
MSC-MEPC.2/Circ.12 Annex, page 18
I:\CIRC\MSC-MEPC\2\12.doc
FIGURE 6
EXAMPLE OF A RISK CONTRIBUTION TREE*
* As defined in the context of these Guidelines.
* * *
Fire or
explosion
External Hazards
…….
Grounding or
Stranding Flooding ……. …….. …….
FN Curve (see appendix 5)
.
Event Trees for Consequences
Accident Sub Categories e.g. : F1 - Fire in Engine-room F2 - Fire in Cargo Space F3 - Fire in Accommodation F4 - Fire on Bridge
Fault Trees for Direct Cause and Initiating Events
Accident Categories
OR
AND
CAUSE A
OR
CAUSE B
CAUSE D
CAUSE C
E2 E1
F1 F2 F3 F4
Contract or Collision
MSC-MEPC.2/Circ.12 Annex, page 19
I:\CIRC\MSC-MEPC\2\12.doc
Appendix 1
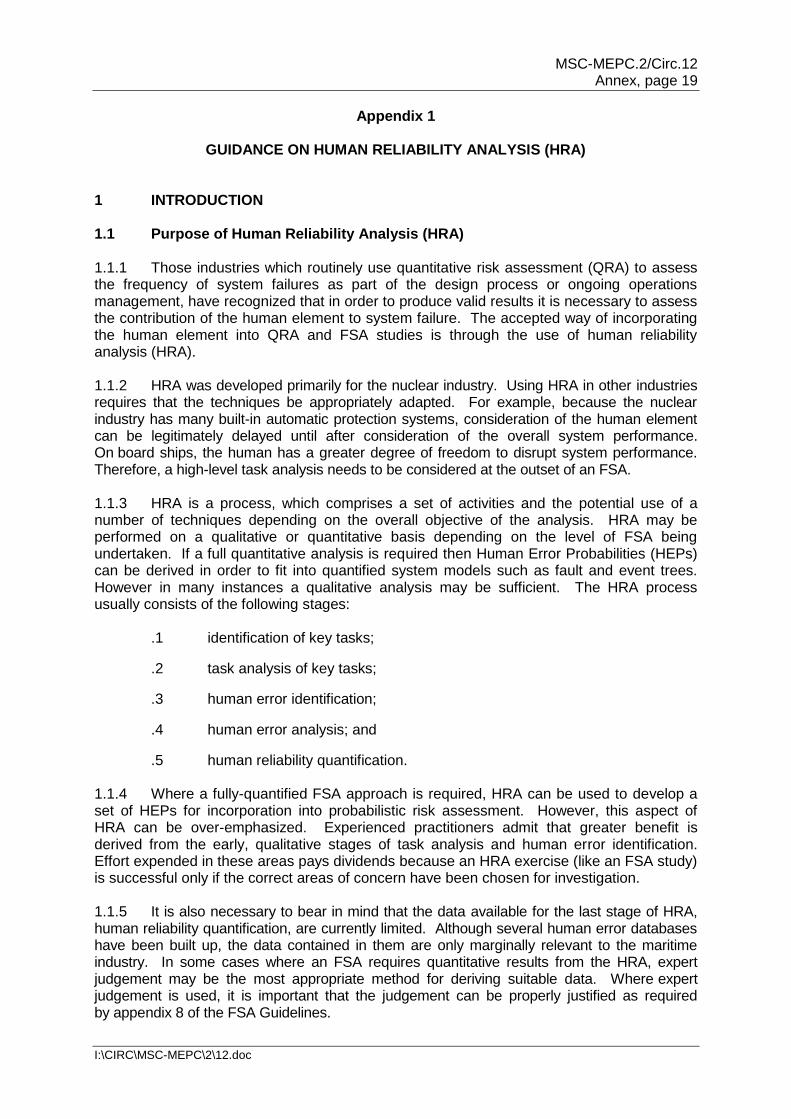
GUIDANCE ON HUMAN RELIABILITY ANALYSIS (HRA) 1 INTRODUCTION 1.1 Purpose of Human Reliability Analysis (HRA) 1.1.1 Those industries which routinely use quantitative risk assessment (QRA) to assess the frequency of system failures as part of the design process or ongoing operations management, have recognized that in order to produce valid results it is necessary to assess the contribution of the human element to system failure. The accepted way of incorporating the human element into QRA and FSA studies is through the use of human reliability analysis (HRA). 1.1.2 HRA was developed primarily for the nuclear industry. Using HRA in other industries requires that the techniques be appropriately adapted. For example, because the nuclear industry has many built-in automatic protection systems, consideration of the human element can be legitimately delayed until after consideration of the overall system performance. On board ships, the human has a greater degree of freedom to disrupt system performance. Therefore, a high-level task analysis needs to be considered at the outset of an FSA. 1.1.3 HRA is a process, which comprises a set of activities and the potential use of a number of techniques depending on the overall objective of the analysis. HRA may be performed on a qualitative or quantitative basis depending on the level of FSA being undertaken. If a full quantitative analysis is required then Human Error Probabilities (HEPs) can be derived in order to fit into quantified system models such as fault and event trees. However in many instances a qualitative analysis may be sufficient. The HRA process usually consists of the following stages:
.1 identification of key tasks;
.2 task analysis of key tasks;
.3 human error identification;
.4 human error analysis; and
.5 human reliability quantification. 1.1.4 Where a fully-quantified FSA approach is required, HRA can be used to develop a set of HEPs for incorporation into probabilistic risk assessment. However, this aspect of HRA can be over-emphasized. Experienced practitioners admit that greater benefit is derived from the early, qualitative stages of task analysis and human error identification. Effort expended in these areas pays dividends because an HRA exercise (like an FSA study) is successful only if the correct areas of concern have been chosen for investigation. 1.1.5 It is also necessary to bear in mind that the data available for the last stage of HRA, human reliability quantification, are currently limited. Although several human error databases have been built up, the data contained in them are only marginally relevant to the maritime industry. In some cases where an FSA requires quantitative results from the HRA, expert judgement may be the most appropriate method for deriving suitable data. Where expert judgement is used, it is important that the judgement can be properly justified as required by appendix 8 of the FSA Guidelines.
MSC-MEPC.2/Circ.12 Annex, page 20
I:\CIRC\MSC-MEPC\2\12.doc
1.2 Scope of the HRA Guidance 1.2.1 Figure 4 of the FSA Guidelines shows how the HRA Guidance fits into the FSA process. 1.2.2 The amount of detail provided in this Guidance is at a level similar to that given in the FSA Guidelines, i.e. it states what should be done and what considerations should be taken into account. Details of some techniques used to carry out the process are provided in the appendices of this Guidance. 1.2.3 The sheer volume of information about this topic prohibits the provision of in-depth information: there are numerous HRA techniques, and task analysis is a framework encompassing dozens of techniques. Table 1 lists the main references which could be pursued. 1.2.4 As with FSA, HRA can be applied to the design, construction, maintenance and operations of a ship. 1.3 Application It is intended that this guidance should be used wherever an FSA is conducted on a system which involves human action or intervention which affects system performance. 2 BASIC TERMINOLOGY Error producing condition: Factors that can have a negative effect on human performance. Human error: A departure from acceptable or desirable practice on the part an individual or a group of individuals that can result in unacceptable or undesirable results. Human error recovery: The potential for the error to be recovered, either by the individual or by another person, before the undesired consequences are realized. Human error consequence: The undesired consequences of human error. Human error probability: Defined as follows:
error human for iesopportunit of Number
occurred have that errors human of Number = HEP
Human reliability: The probability that a person: (1) correctly performs some system-required activity in a required time period (if time is a limiting factor) and (2) performs no extraneous activity that can degrade the system. Human unreliability is the opposite of this definition. Performance shaping factors: Factors that can have a positive or negative effect on human performance. Task analysis: A collection of techniques used to compare the demands of a system with the capabilities of the operator, usually with a view to improving performance, e.g. by reducing errors.
MSC-MEPC.2/Circ.12 Annex, page 21
I:\CIRC\MSC-MEPC\2\12.doc
3 METHODOLOGY HRA can be considered to fit into the overall FSA process in the following way:
.1 identification of key human tasks consistent with step 1; .2 risk assessment, including a detailed task analysis, human error analysis
and human reliability quantification consistent with step 2; and .3 risk control options consistent with step 3.
4 PROBLEM DEFINITION Additional human element issues which may be considered in the problem definition include:
.1 personal factors, e.g. stress, fatigue; .2 organizational and leadership factors, e.g. manning level; .3 task features, e.g. task complexity; and .4 onboard working conditions, e.g. human-machine interface.
5 HRA STEP 1 – IDENTIFICATION OF HAZARDS 5.1 Scope 5.1.1 The purpose of this step is to identify key potential human interactions which, if not performed correctly, could lead to system failure. This is a broad scoping exercise where the aim is to identify areas of concern (e.g. whole tasks or large sub-tasks) requiring further investigation. The techniques used here are the same as those used in step 2, but in step 2 they are used much more rigorously. 5.1.2 Human hazard identification is the process of systematically identifying the ways in which human error can contribute to accidents during normal and emergency operations. As detailed in paragraph 5.2.2 below, standard techniques such as Hazard and Operability (HazOp) study and Failure Mode and Effects Analysis (FMEA) can be, and are, used for this purpose. Additionally, it is strongly advised that a high-level functional task analysis is carried out. This section discusses those techniques which were developed solely to address human hazards. 5.2 Methods for hazard identification 5.2.1 In order to carry out a human hazard analysis, it is first necessary to model the system in order to identify the normal and emergency operating tasks that are carried out by the crew. This is achieved by the use of a high-level task analysis (as described in table 2) which identifies the main human tasks in terms of operational goals. Developing a task analysis can utilize a range of data collection techniques, e.g. interviews, observation, critical incident, many of which can be used to directly identify key tasks. Additionally, there are many other sources of information which may be consulted, including design information, past experience, normal and emergency operating procedures, etc.
MSC-MEPC.2/Circ.12 Annex, page 22
I:\CIRC\MSC-MEPC\2\12.doc
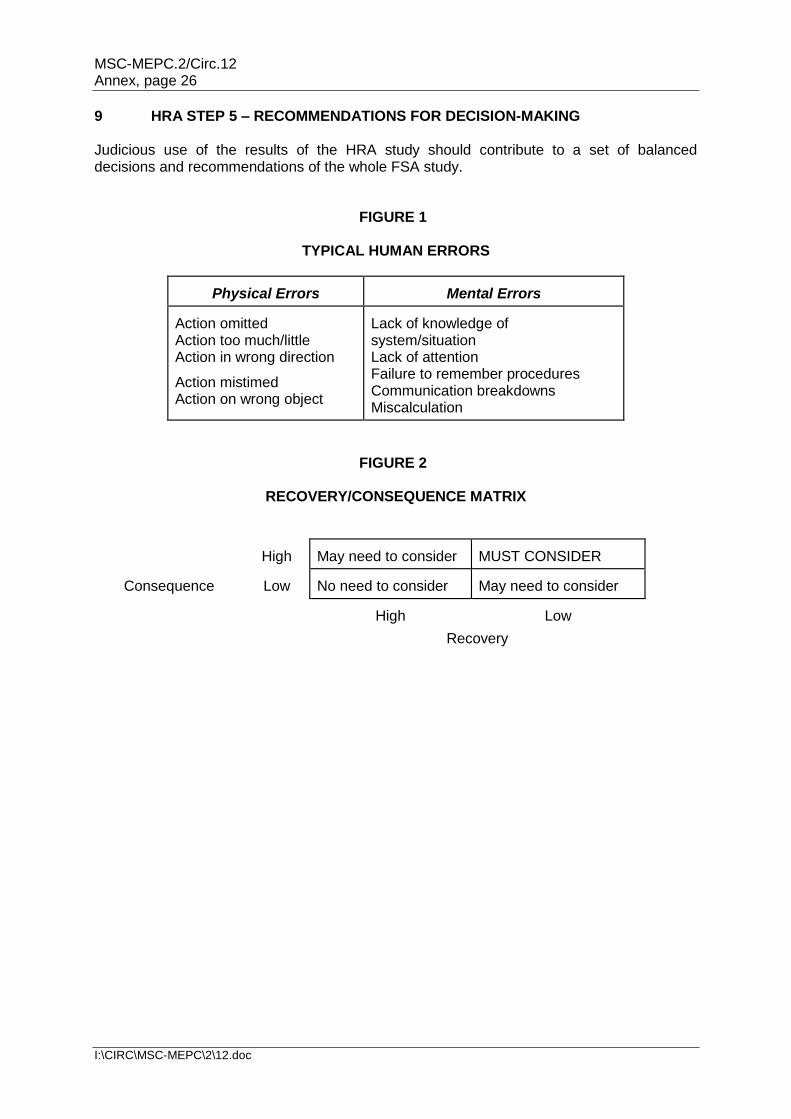
5.2.2 At this stage it is not necessary to generate a lot of detail. The aim is to identify those key human interactions which require further attention. Therefore, once the main tasks, sub-tasks and their associated goals have been listed, the potential contributors to human error of each task need to be identified together with the potential hazard arising. There are a number of techniques which may be utilized for this purpose, including human error HazOp, Hazard Checklists, etc. An example of human-related hazards identifying a number of different potential contributors to sub-standard performance is included in table 3. 5.2.3 For each task and sub-task identified, the associated hazards and their associated scenarios should be ranked in order of their criticality in the same manner as discussed in section 5.2.2 of the FSA Guidelines. 5.3 Results The output from step 1 is a set of activities (tasks and sub-tasks) with a ranked list of hazards associated with each activity. This list needs to be coupled with the other lists generated by the FSA process, and should therefore be produced in a common format. Only the top few hazards for critical tasks are subjected to risk assessment, less critical tasks are not examined further. 6 HRA STEP 2 – RISK ANALYSIS 6.1 Scope The purpose of step 2 is to identify those areas where the human element poses a high risk to system safety and to evaluate the factors influencing the level of risk. 6.2 Detailed task analysis 6.2.1 At this stage, the key tasks are subjected to a detailed task analysis. Where the tasks involve more decision-making than action, it may be more appropriate to carry out a cognitive task analysis. Table 2 outlines the extended task analysis which was developed for analysing decision-making tasks. 6.2.2 The task analysis should be developed until all critical sub-tasks have been identified. The level of detail required is that which is appropriate for the criticality of the operation under investigation. A good general rule is that the amount of detail required should be sufficient to give the same degree of understanding as that provided by the rest of the FSA exercise. 6.3 Human error analysis 6.3.1 The purpose of human error analysis is to produce a list of potential human errors that can lead to the undesired consequence that is of concern. To help with this exercise, some examples of typical human errors are included in figure 1. 6.3.2 Once all potential errors have been identified, they are typically classified along the following lines. This classification allows the identification of a critical subset of human errors that must be addressed:
.1 the supposed cause of the human error;
MSC-MEPC.2/Circ.12 Annex, page 23
I:\CIRC\MSC-MEPC\2\12.doc
.2 the potential for error-recovery, either by the operator or by another person (this includes consideration of whether a single human error can result in undesired consequences); and
.3 the potential consequences of the error.
6.3.3 Often, a qualitative analysis should be sufficient. A simple qualitative assessment can be made using a recovery/consequence matrix such as that illustrated in figure 2. Where necessary, a more detailed matrix can be developed using a scale for the likely consequences and levels of recovery. 6.4 Human error quantification 6.4.1 This activity is undertaken where a probability of human error (HEP) is required for input into a quantitative FSA. Human error quantification can be conducted in a number of ways. 6.4.2 In some cases, because of the difficulties of acquiring reliable human error data for the maritime industry, expert judgement techniques may need to be used for deriving a probability for human error. Expert judgment techniques can be grouped into four categories: .1 paired comparisons; .2 ranking and rating procedures; .3 direct numerical estimation; and .4 indirect numerical estimation. It is particularly important that experts are provided with a thorough task definition. A poor definition invariably produces poor estimates. 6.4.3 Absolute Probability Judgement (APJ) is a good direct method. It can be used in various forms, from the single expert assessor to large groups of individuals whose estimates are mathematically aggregated (see table 4). Other techniques which focus on judgements from multiple experts include: brainstorming; consensus decision-making; Delphi; and the Nominal Group technique. 6.4.4 Alternatives to expert opinion are historic data (where available) and generic error probabilities. Two main methods for HRA which have databases of human error probabilities (mainly for the nuclear industry) are the Technique for Human Error Rate Prediction (THERP) and Human Error Assessment and Reduction Technique (HEART) (see table 4). 6.4.5 Technique for Human Error Rate Prediction (THERP) THERP was developed by Swain and Guttmann (1983) of Sandia National Laboratories for the US Nuclear Regulatory Commission, and has become the most widely used human error quantitative prediction technique. THERP is both a human reliability technique and a human error databank. It models human errors using probability trees and models of dependence, but also considers performance shaping factors (PSFs) affecting action. It is critically dependent on its database of human error probabilities. It is considered to be particularly effective in quantifying errors in highly procedural activities.
MSC-MEPC.2/Circ.12 Annex, page 24
I:\CIRC\MSC-MEPC\2\12.doc
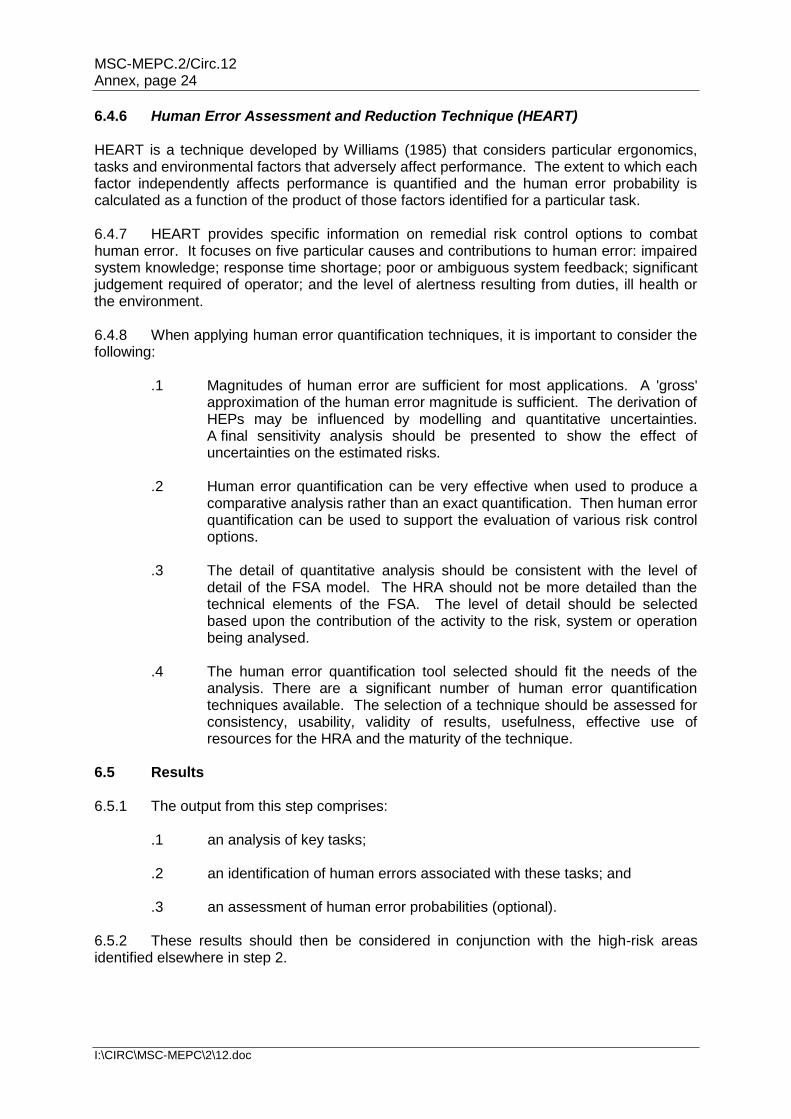
6.4.6 Human Error Assessment and Reduction Technique (HEART) HEART is a technique developed by Williams (1985) that considers particular ergonomics, tasks and environmental factors that adversely affect performance. The extent to which each factor independently affects performance is quantified and the human error probability is calculated as a function of the product of those factors identified for a particular task. 6.4.7 HEART provides specific information on remedial risk control options to combat human error. It focuses on five particular causes and contributions to human error: impaired system knowledge; response time shortage; poor or ambiguous system feedback; significant judgement required of operator; and the level of alertness resulting from duties, ill health or the environment. 6.4.8 When applying human error quantification techniques, it is important to consider the following: .1 Magnitudes of human error are sufficient for most applications. A 'gross'
approximation of the human error magnitude is sufficient. The derivation of HEPs may be influenced by modelling and quantitative uncertainties. A final sensitivity analysis should be presented to show the effect of uncertainties on the estimated risks.
.2 Human error quantification can be very effective when used to produce a
comparative analysis rather than an exact quantification. Then human error quantification can be used to support the evaluation of various risk control options.
.3 The detail of quantitative analysis should be consistent with the level of
detail of the FSA model. The HRA should not be more detailed than the technical elements of the FSA. The level of detail should be selected based upon the contribution of the activity to the risk, system or operation being analysed.
.4 The human error quantification tool selected should fit the needs of the
analysis. There are a significant number of human error quantification techniques available. The selection of a technique should be assessed for consistency, usability, validity of results, usefulness, effective use of resources for the HRA and the maturity of the technique.
6.5 Results 6.5.1 The output from this step comprises: .1 an analysis of key tasks; .2 an identification of human errors associated with these tasks; and .3 an assessment of human error probabilities (optional). 6.5.2 These results should then be considered in conjunction with the high-risk areas identified elsewhere in step 2.
MSC-MEPC.2/Circ.12 Annex, page 25
I:\CIRC\MSC-MEPC\2\12.doc
7 HRA STEP 3 – RISK CONTROL OPTIONS 7.1 Scope The purpose of step 3 is to consider how the human element is considered within the evaluation of technical, human, work environment, personnel and management related risk control options. 7.2 Application 7.2.1 The control of risks associated with the human interaction with a system can be approached in the same way as for the development of other risk control measures. Measures can be specified in order to:
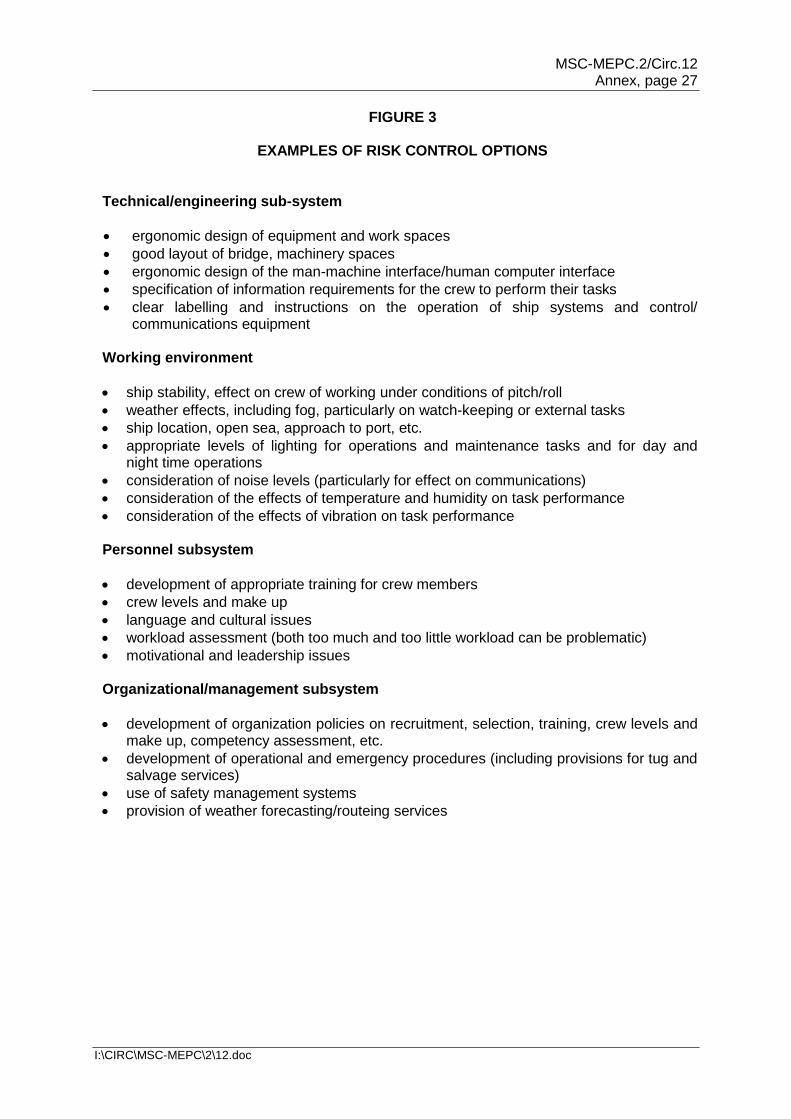
.1 reduce the frequency of failure; .2 mitigate the effects of failure; .3 alleviate the circumstances in which failures occur; and .4 mitigate the consequences of accidents. 7.2.2 Proper application of HRA can reveal that technological innovations can also create problems which may be overlooked by FSA evaluation of technical factors only. A typical example of this is the creation of long periods of low workload when a high degree of automation is used. This in turn can lead to an inability to respond correctly when required or even to the introduction of 'risk taking behaviour' in order to make the job more interesting. 7.2.3 When dealing with risk control concerning human activity, it is important to realize that more than one level of risk control measure may be necessary. This is because human involvement spans a wide range of activities from day-to-day operations through to senior management levels. Secondly, it must also be stressed that a basic focus on good system design utilizing ergonomics and human factor principles is needed in order to achieve enhanced operational safety and performance levels. 7.2.4 In line with figure 3 of the FSA Guidelines, risk control measures for human interactions can be categorized into four areas as follows: (1) technical/engineering subsystem, (2) working environment, (3) personnel subsystem and (4) organizational/management subsystem. A description of the issues that may be considered within each of these areas is given in figure 3. 7.2.5 Once the risk control measures have been initially specified, it is important to reassess human intervention in the system in order to assess whether any new hazards have been introduced. For example, if a decision had been taken to automate a particular task, then the new task would need to be re-evaluated. 7.3 Results The output from this step comprises a range of risk control options categorized into 4 areas as presented in figure 3, easing the integration of human related risk into step 3. 8 HRA STEP 4 – COST-BENEFIT ASSESSMENT No specific HRA guidance for this section is required.
MSC-MEPC.2/Circ.12 Annex, page 26
I:\CIRC\MSC-MEPC\2\12.doc
9 HRA STEP 5 – RECOMMENDATIONS FOR DECISION-MAKING Judicious use of the results of the HRA study should contribute to a set of balanced decisions and recommendations of the whole FSA study.
FIGURE 1
TYPICAL HUMAN ERRORS
Physical Errors
Mental Errors
Action omitted Action too much/little Action in wrong direction
Action mistimed Action on wrong object
Lack of knowledge of system/situation Lack of attention Failure to remember procedures Communication breakdowns Miscalculation
FIGURE 2
RECOVERY/CONSEQUENCE MATRIX
Consequence
High
May need to consider
MUST CONSIDER
Low
No need to consider
May need to consider
High
Low
Recovery
MSC-MEPC.2/Circ.12 Annex, page 27
I:\CIRC\MSC-MEPC\2\12.doc
FIGURE 3
EXAMPLES OF RISK CONTROL OPTIONS Technical/engineering sub-system
ergonomic design of equipment and work spaces
good layout of bridge, machinery spaces
ergonomic design of the man-machine interface/human computer interface
specification of information requirements for the crew to perform their tasks
clear labelling and instructions on the operation of ship systems and control/ communications equipment
Working environment
ship stability, effect on crew of working under conditions of pitch/roll
weather effects, including fog, particularly on watch-keeping or external tasks
ship location, open sea, approach to port, etc.
appropriate levels of lighting for operations and maintenance tasks and for day and night time operations
consideration of noise levels (particularly for effect on communications)
consideration of the effects of temperature and humidity on task performance
consideration of the effects of vibration on task performance Personnel subsystem
development of appropriate training for crew members
crew levels and make up
language and cultural issues
workload assessment (both too much and too little workload can be problematic)
motivational and leadership issues Organizational/management subsystem
development of organization policies on recruitment, selection, training, crew levels and make up, competency assessment, etc.
development of operational and emergency procedures (including provisions for tug and salvage services)
use of safety management systems
provision of weather forecasting/routeing services
MSC-MEPC.2/Circ.12 Annex, page 28
I:\CIRC\MSC-MEPC\2\12.doc
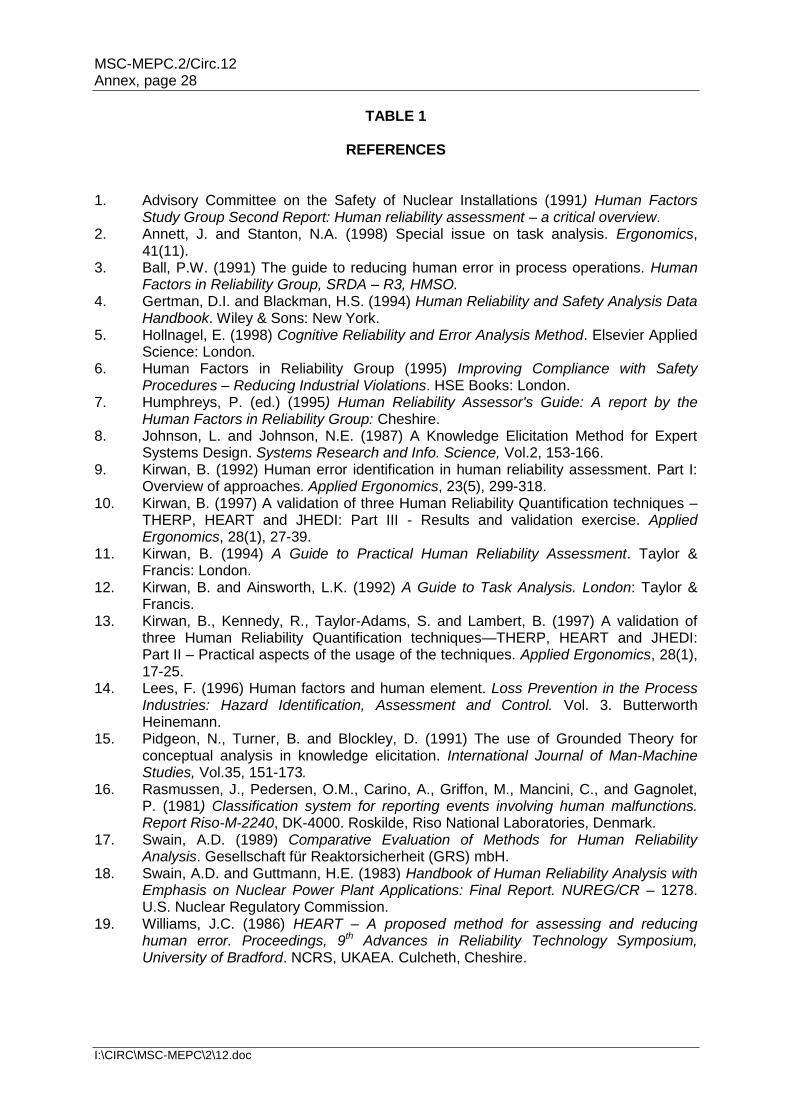
TABLE 1
REFERENCES 1. Advisory Committee on the Safety of Nuclear Installations (1991) Human Factors
Study Group Second Report: Human reliability assessment – a critical overview. 2. Annett, J. and Stanton, N.A. (1998) Special issue on task analysis. Ergonomics,
41(11). 3. Ball, P.W. (1991) The guide to reducing human error in process operations. Human
Factors in Reliability Group, SRDA – R3, HMSO. 4. Gertman, D.I. and Blackman, H.S. (1994) Human Reliability and Safety Analysis Data
Handbook. Wiley & Sons: New York. 5. Hollnagel, E. (1998) Cognitive Reliability and Error Analysis Method. Elsevier Applied
Science: London. 6. Human Factors in Reliability Group (1995) Improving Compliance with Safety
Procedures – Reducing Industrial Violations. HSE Books: London. 7. Humphreys, P. (ed.) (1995) Human Reliability Assessor's Guide: A report by the
Human Factors in Reliability Group: Cheshire. 8. Johnson, L. and Johnson, N.E. (1987) A Knowledge Elicitation Method for Expert
Systems Design. Systems Research and Info. Science, Vol.2, 153-166. 9. Kirwan, B. (1992) Human error identification in human reliability assessment. Part I:
Overview of approaches. Applied Ergonomics, 23(5), 299-318. 10. Kirwan, B. (1997) A validation of three Human Reliability Quantification techniques –
THERP, HEART and JHEDI: Part III - Results and validation exercise. Applied Ergonomics, 28(1), 27-39.
11. Kirwan, B. (1994) A Guide to Practical Human Reliability Assessment. Taylor & Francis: London.
12. Kirwan, B. and Ainsworth, L.K. (1992) A Guide to Task Analysis. London: Taylor & Francis.
13. Kirwan, B., Kennedy, R., Taylor-Adams, S. and Lambert, B. (1997) A validation of three Human Reliability Quantification techniques—THERP, HEART and JHEDI: Part II – Practical aspects of the usage of the techniques. Applied Ergonomics, 28(1), 17-25.
14. Lees, F. (1996) Human factors and human element. Loss Prevention in the Process Industries: Hazard Identification, Assessment and Control. Vol. 3. Butterworth Heinemann.
15. Pidgeon, N., Turner, B. and Blockley, D. (1991) The use of Grounded Theory for conceptual analysis in knowledge elicitation. International Journal of Man-Machine Studies, Vol.35, 151-173.
16. Rasmussen, J., Pedersen, O.M., Carino, A., Griffon, M., Mancini, C., and Gagnolet, P. (1981) Classification system for reporting events involving human malfunctions. Report Riso-M-2240, DK-4000. Roskilde, Riso National Laboratories, Denmark.
17. Swain, A.D. (1989) Comparative Evaluation of Methods for Human Reliability Analysis. Gesellschaft für Reaktorsicherheit (GRS) mbH.
18. Swain, A.D. and Guttmann, H.E. (1983) Handbook of Human Reliability Analysis with Emphasis on Nuclear Power Plant Applications: Final Report. NUREG/CR – 1278. U.S. Nuclear Regulatory Commission.
19. Williams, J.C. (1986) HEART – A proposed method for assessing and reducing human error. Proceedings, 9th Advances in Reliability Technology Symposium, University of Bradford. NCRS, UKAEA. Culcheth, Cheshire.
MSC-MEPC.2/Circ.12 Annex, page 29
I:\CIRC\MSC-MEPC\2\12.doc
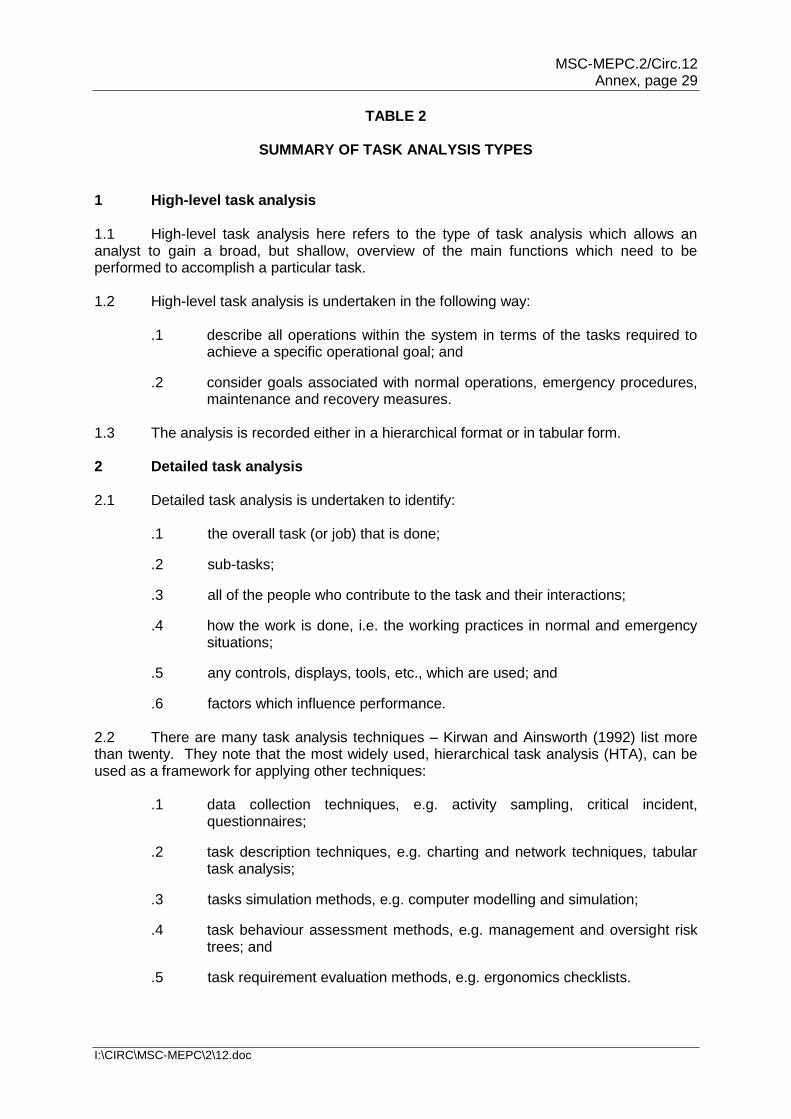
TABLE 2
SUMMARY OF TASK ANALYSIS TYPES 1 High-level task analysis 1.1 High-level task analysis here refers to the type of task analysis which allows an analyst to gain a broad, but shallow, overview of the main functions which need to be performed to accomplish a particular task. 1.2 High-level task analysis is undertaken in the following way:
.1 describe all operations within the system in terms of the tasks required to achieve a specific operational goal; and
.2 consider goals associated with normal operations, emergency procedures, maintenance and recovery measures.
1.3 The analysis is recorded either in a hierarchical format or in tabular form. 2 Detailed task analysis 2.1 Detailed task analysis is undertaken to identify: .1 the overall task (or job) that is done;
.2 sub-tasks;
.3 all of the people who contribute to the task and their interactions;
.4 how the work is done, i.e. the working practices in normal and emergency situations;
.5 any controls, displays, tools, etc., which are used; and
.6 factors which influence performance. 2.2 There are many task analysis techniques – Kirwan and Ainsworth (1992) list more than twenty. They note that the most widely used, hierarchical task analysis (HTA), can be used as a framework for applying other techniques: .1 data collection techniques, e.g. activity sampling, critical incident,
questionnaires;
.2 task description techniques, e.g. charting and network techniques, tabular task analysis;
.3 tasks simulation methods, e.g. computer modelling and simulation;
.4 task behaviour assessment methods, e.g. management and oversight risk trees; and
.5 task requirement evaluation methods, e.g. ergonomics checklists.
MSC-MEPC.2/Circ.12 Annex, page 30
I:\CIRC\MSC-MEPC\2\12.doc
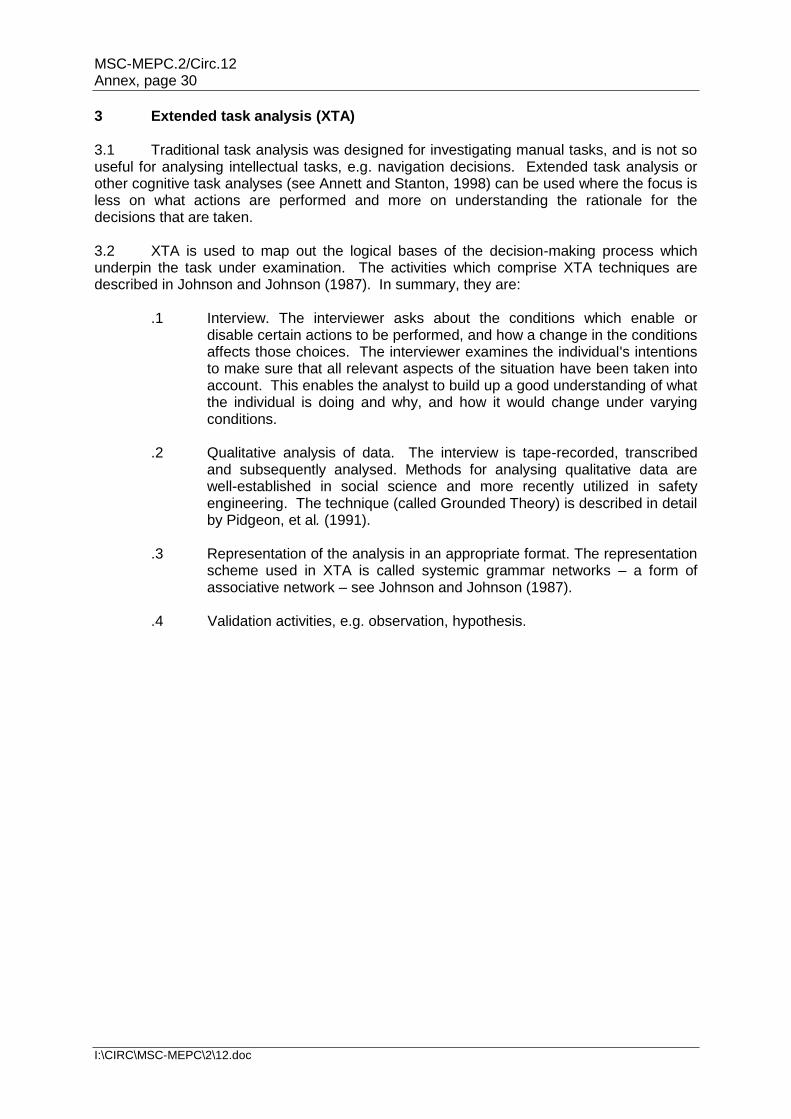
3 Extended task analysis (XTA) 3.1 Traditional task analysis was designed for investigating manual tasks, and is not so useful for analysing intellectual tasks, e.g. navigation decisions. Extended task analysis or other cognitive task analyses (see Annett and Stanton, 1998) can be used where the focus is less on what actions are performed and more on understanding the rationale for the decisions that are taken. 3.2 XTA is used to map out the logical bases of the decision-making process which underpin the task under examination. The activities which comprise XTA techniques are described in Johnson and Johnson (1987). In summary, they are: .1 Interview. The interviewer asks about the conditions which enable or
disable certain actions to be performed, and how a change in the conditions affects those choices. The interviewer examines the individual's intentions to make sure that all relevant aspects of the situation have been taken into account. This enables the analyst to build up a good understanding of what the individual is doing and why, and how it would change under varying conditions.
.2 Qualitative analysis of data. The interview is tape-recorded, transcribed
and subsequently analysed. Methods for analysing qualitative data are well-established in social science and more recently utilized in safety engineering. The technique (called Grounded Theory) is described in detail by Pidgeon, et al. (1991).
.3 Representation of the analysis in an appropriate format. The representation
scheme used in XTA is called systemic grammar networks – a form of associative network – see Johnson and Johnson (1987).
.4 Validation activities, e.g. observation, hypothesis.
MSC-MEPC.2/Circ.12 Annex, page 31
I:\CIRC\MSC-MEPC\2\12.doc
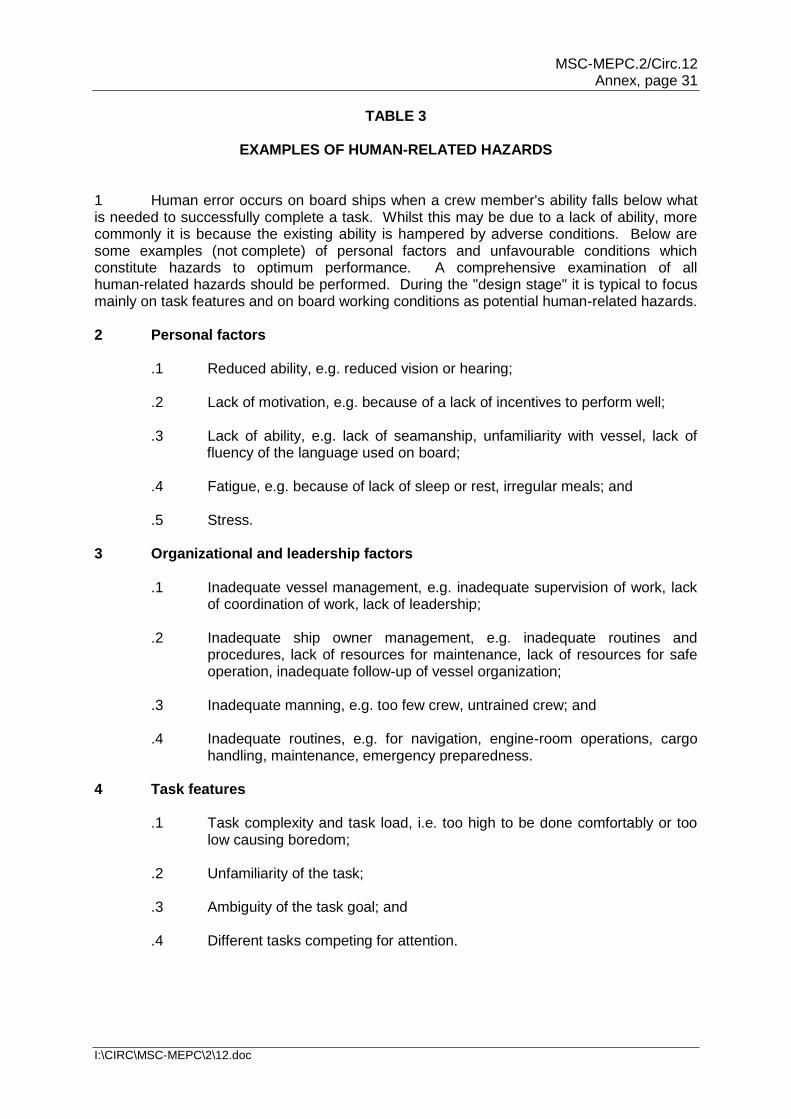
TABLE 3
EXAMPLES OF HUMAN-RELATED HAZARDS 1 Human error occurs on board ships when a crew member's ability falls below what is needed to successfully complete a task. Whilst this may be due to a lack of ability, more commonly it is because the existing ability is hampered by adverse conditions. Below are some examples (not complete) of personal factors and unfavourable conditions which constitute hazards to optimum performance. A comprehensive examination of all human-related hazards should be performed. During the "design stage" it is typical to focus mainly on task features and on board working conditions as potential human-related hazards. 2 Personal factors
.1 Reduced ability, e.g. reduced vision or hearing;
.2 Lack of motivation, e.g. because of a lack of incentives to perform well; .3 Lack of ability, e.g. lack of seamanship, unfamiliarity with vessel, lack of
fluency of the language used on board;
.4 Fatigue, e.g. because of lack of sleep or rest, irregular meals; and
.5 Stress. 3 Organizational and leadership factors
.1 Inadequate vessel management, e.g. inadequate supervision of work, lack of coordination of work, lack of leadership;
.2 Inadequate ship owner management, e.g. inadequate routines and
procedures, lack of resources for maintenance, lack of resources for safe operation, inadequate follow-up of vessel organization;
.3 Inadequate manning, e.g. too few crew, untrained crew; and
.4 Inadequate routines, e.g. for navigation, engine-room operations, cargo
handling, maintenance, emergency preparedness. 4 Task features
.1 Task complexity and task load, i.e. too high to be done comfortably or too low causing boredom;
.2 Unfamiliarity of the task;
.3 Ambiguity of the task goal; and
.4 Different tasks competing for attention.

MSC-MEPC.2/Circ.12 Annex, page 32
I:\CIRC\MSC-MEPC\2\12.doc
5 Onboard working conditions
.1 Physical stress from, e.g. noise, vibration, sea motion, climate, temperature, toxic substances, extreme environmental loads, night-watch;
.2 Ergonomic conditions, e.g. inadequate tools, inadequate illumination,
inadequate or ambiguous information, badly-designed human-machine interface;
.3 Social climate, e.g. inadequate communication, lack of cooperation; and
.4 Environmental conditions, e.g. restricted visibility, high traffic density,
restricted fairway.
MSC-MEPC.2/Circ.12 Annex, page 33
I:\CIRC\MSC-MEPC\2\12.doc
TABLE 4
SUMMARY OF HUMAN ERROR ANALYSIS TECHNIQUES The two main HRA quantitative techniques (HEART and THERP) are outlined below. CORE-DATA provides data on generic probabilities. As the data from all of these sources are based on non-marine industries, they need to be used with caution. A good alternative is to use expert judgement and one technique for doing this is Absolute Probability Judgement. 1 Absolute Probability Judgement (APJ) 1.1 APJ refers to a group of techniques that utilize expert judgement to develop human error probabilities (HEPs) detailed in Kirwan (1994) and Lees (1996). These techniques are used when no relevant data exist for the situation in question, making some form of direct numerical estimation the only way of developing values for HEPs. 1.2 There are a variety of techniques available. This gives the analyst some flexibility in accommodating different types of analysis. Most of the techniques avoid potentially detrimental group influences such as group bias. Typically the techniques used are: the Delphi technique, the Nominal Group Technique and Paired Comparisons. The number and type of experts that are required to participate in the process are similar to that required for Hazard Identification techniques such as HazOp. 1.3 Paired Comparisons is a significant expert judgement technique. Using this technique, an individual makes a series of judgements about pairs of tasks. The results for each individual are analysed and the relative values for HEPs for the tasks derived. Use of the technique rests upon the ability to include at least two tasks with known HEPs. CORE-DATA and data from other industries may be useful. 1.4 The popularity of these techniques has reduced in recent times, probably due to the requirement to get the relevant groups of experts together. However, these techniques may be very appropriate for the maritime industry. 2 Technique for Human Error Rate Prediction (THERP) 2.1 THERP is one of the best known and most often utilized human reliability analysis techniques. At first sight the technique can be rather daunting due to the volume of information provided. This is because it is a comprehensive methodology covering task analysis, human error identification, human error modelling and human error quantification. However, it is best known for its human error quantification aspects, which includes a series of human error probability (HEP) data tables and data quantifying the effects of various performance shaping factors (PSFs). The data presented is generally of a detailed nature and so not readily transferable to the marine environment.
2.2 THERP contains a dependence model which is used to model the dependence relationship between errors. For example, the model could be used to assess the dependence between the helmsman making an error and the bridge officer noticing it. Operational experience does show that there are dependence effects between people and between tasks. Whilst this is the only human error model of its type, it has not been comprehensively validated.
MSC-MEPC.2/Circ.12 Annex, page 34
I:\CIRC\MSC-MEPC\2\12.doc
2.3 A full THERP analysis can be resource-intensive due to the level of detail required to utilize the technique properly. However, the use of this technique forces the analyst to gain a detailed appreciation of the system and of the human error potential. THERP models humans as any other subsystem in the FSA modelling process. The steps are as follows: .1 identify all the systems in the operation that are influenced and affected by
human operations; .2 compile a list and analyse all human operations that affect the operations of
the system by performing a detailed task analysis; .3 determine the probabilities of human errors through error frequency data
and expert judgements and experiences; and .4 determine the effects of human errors by integrating the human error into
the PRA modelling procedure. 2.4 THERP includes a set of performance shaping factors (PSFs) that influence the human errors at the operator level. These performance factors include experience, situational stress factors, work environment, individual motivation, and the human-machine interface. The PSFs are used as a basis for estimating nominal values and value ranges for human error. 2.5 There are advantages to using THERP. First it is a good tool for relative risk comparisons. It can be used to measure the role of human error in an FSA and to evaluate risk control options not necessarily in terms of a probability or frequency, but in terms of risk magnitude. Also, THERP can be used with the standard event-tree/fault-tree modelling approaches that are sometimes preferred by FSA practitioners. THERP is a transparent technique that provides a systematic, well-documented approach to evaluating the role of human errors in a technical system. The THERP database can be used through systematic analysis or, where available, external human error data can be inserted. 3 Human Error Assessment and Reduction Technique (HEART) 3.1 HEART is best known as a relatively simple way of arriving at human error probabilities (HEPs). The basis of the technique is a database of nine generic task descriptions and an associated human error probability. The analyst matches the generic task description to the task being assessed and then modifies the generic human error probability according to the presence and strength of the identified error producing conditions (EPCs). EPCs are conditions that increase the order of magnitude of the error frequency or probability measurements, similar in concept to PSFs in THERP. A list of EPCs is supplied as part of the technique, but it is up to the analyst to decide on the strength of effect for the task in question. 3.2 Whilst the generic data is mainly derived from the nuclear industry, HEART does appear amenable to application within other industries. It may be possible to tailor the technique to the marine environment by including new EPCs such as weather. However, it needs careful application to avoid ending up with very conservative estimates of HEPs.
MSC-MEPC.2/Circ.12 Annex, page 35
I:\CIRC\MSC-MEPC\2\12.doc
4 CORE-DATA 4.1 CORE-DATA is a database of human error probabilities. Access to the database is available through the University of Birmingham in the United Kingdom. The database has been developed as a result of sponsorship by the UK Health and Safety Executive with support from the nuclear, rail, chemical, aviation and offshore industries and contains up to 300 records as of January 1999. 4.2 Each record is a comprehensive presentation of information including, e.g. a task summary, industry origin, country of origin, type of data collection used, a database quality rating, description of the operation, performance shaping factors, sample size and HEP. 4.3 As with all data from other industries, care needs to be taken when transferring the data to the maritime industry. Some of the offshore data may be the most useful.
* * *
MSC-MEPC.2/Circ.12 Annex, page 36
I:\CIRC\MSC-MEPC\2\12.doc
Appendix 2
EXAMPLES OF HAZARDS 1 SHIPBOARD HAZARDS TO PERSONNEL
.1 asbestos inhalation;
.2 burns from caustic liquids and acids;
.3 electric shock and electrocution;
.4 falling overboard; and
.5 pilot ladder/pilot hoist operation. 2 HAZARDOUS SUBSTANCES ON BOARD SHIP Accommodation areas:
.1 combustible furnishings;
.2 cleaning materials in stores; and
.3 oil/fat in galley equipment;
Deck areas:
.4 cargo; and
.5 paint, oils, greases etc., in deck stores; and
Machinery spaces:
.6 cabling;
.7 fuel and diesel oil for engines, boilers and incinerators;
.8 fuel, lubricating and hydraulic oil in bilges, save alls, etc.;
.9 refrigerants; and
.10 thermal heating fluid systems.
3 POTENTIAL SOURCES OF IGNITION
General:
.1 electrical arc;
.2 friction;
.3 hot surface;
.4 incendiary spark;
.5 naked flame; and
.6 radio waves;
Accommodation areas (including bridge):
.7 electronic navigation equipment; and
.8 laundry facilities – irons, washing machines, tumble driers, etc.
Deck areas:
.9 deck lighting;
.10 funnel exhaust emissions; and
.11 hot work sparking; and
MSC-MEPC.2/Circ.12 Annex, page 37
I:\CIRC\MSC-MEPC\2\12.doc
Machinery spaces:
.12 air compressor units; and
.13 generator engine exhaust manifold. 4 HAZARDS EXTERNAL TO THE SHIP
.1 storms;
.2 lightning;
.3 uncharted submerged objects; and
.4 other ships.
* * *
MSC-MEPC.2/Circ.12 Annex, page 38
I:\CIRC\MSC-MEPC\2\12.doc
Appendix 3
HAZARD IDENTIFICATION AND RISK ANALYSIS TECHNIQUES
1 FAULT TREE ANALYSIS 1.1 A Fault Tree is a logic diagram showing the causal relationship between events which singly or in combination occur to cause the occurrence of a higher level event. It is used in Fault Tree Analysis to determine the probability of a top event, which may be a type of accident or unintended hazardous outcome. Fault Tree Analysis can take account of common cause failures in systems with redundant or standby elements. Fault Trees can include failure events or causes related to human factors. 1.2 The development of a Fault Tree is by a top-down approach, systematically considering the causes or events at levels below the top level. If two or more lower events need to occur to cause the next higher event, this is shown by a logic "and" gate. If any one of two or more lower events can cause the next higher event, this is shown by a logic "or" gate. The logic gates determine the addition or multiplication of probabilities (assuming independence) to obtain the values for the top event. 2 EVENT TREE ANALYSIS 2.1 An Event Tree is a logic diagram used to analyse the effects of an accident, a failure or an unintended event. The diagram shows the probability or frequency of the accident linked to those safeguard actions required to be taken after occurrence of the event to mitigate or prevent escalation. 2.2 The probabilities of success or failure of these actions are analysed. The success and failure paths lead to various consequences of differing severity or magnitude. Multiplying the likelihood of the accident by the probabilities of failure or success in each path gives the likelihood of each consequence. 3 FAILURE MODE AND EFFECT ANALYSIS (FMEA) FMEA is a technique in which the system to be analysed is defined in terms of functions or hardware. Each item in the system is identified at a required level of analysis. This may be at a replaceable item level. The effects of item failure at that level and at higher levels are analysed to determine their severity on the system as a whole. Any compensating or mitigating provisions in the system are taken account of and recommendations for the reduction of the severity are determined. The analysis indicates single failure modes which may cause system failure. 4 HAZARD AND OPERABILITY STUDIES (HAZOP) 4.1 These studies are carried out to analyse the hazards in a system at progressive phases of its development from concept to operation. The aim is to eliminate or minimize potential hazards. 4.2 Teams of safety analysts and specialists in the subject system, such as designers, constructors and operators are formally constituted. The team members may change at successive phases depending on the expertise required. In examining designs they systematically consider deviations from the intended functions, looking at causes and effects. They record the findings and recommendations and follow-up actions required.
MSC-MEPC.2/Circ.12 Annex, page 39
I:\CIRC\MSC-MEPC\2\12.doc
5 WHAT IF ANALYSIS TECHNIQUE
5.1 What If Analysis Technique is a hazard identification technique suited for use in a hazard identification meeting. The typical participants in the meeting may be: a facilitator leader, a recorder and a group of carefully selected experienced persons covering the topics under consideration. Usually a group of 7 to 10 persons is required.
5.2 The group first discusses in detail the system, function or operation under consideration. Drawings, technical descriptions etc., are used, and the experts may have to clarify to each other how the details of the system, function or operation work and may fail.
5.3 The next phase of the meeting is brainstorming, where the facilitator leader guides by asking questions starting with "what if?". The questions span topics like operation errors, measurement errors, equipment malfunction, maintenance, utility failure, loss of containment, emergency operation and external influences. When the ideas are exhausted, previous accident experience may be used to check for completeness.
5.4 The hazards are considered in sequence and structured into a logical sequence, in particular to allow cross-referencing between hazards.
5.5 The hazard identification report is usually developed and agreed in the meeting, and the job is done and reported when the meeting is adjourned.
5.6 The technique requires that the participants are senior personnel with detailed knowledge within their field of experience. A meeting typically takes three days. If the task requires long meetings it should be broken down into smaller sub-tasks.
5.7 SWIFT (Structured What If Technique) is one example of a What If Analysis Technique (http://www.dnv.nl/Syscert/training&consultancy.htm).
6 RISK CONTRIBUTION TREE (RCT)
6.1 RCT may be used as a mechanism for displaying diagrammatically the distribution of risk amongst different accident categories and sub-categories, as shown in figure 6 of the FSA Guidelines. Structuring the tree starts with the accident categories, which may be divided into sub-categories to the extent that available data allow and logic dictates. The preliminary fault and event trees can be developed based on the hazards identified in step 1 to demonstrate how direct causes initiate and combine to cause accidents (using fault trees), and also how accidents may progress further to result in different magnitudes of loss (using event trees). Whilst the example makes use of fault and event tree techniques, other established methods could be used if appropriate.
6.2 Quantifying the RCT is typically undertaken in three stages using available accident statistics:
.1 categories and sub-categories of accidents are quantified in terms of the frequency of accidents;
.2 the severity of accident outcomes is quantified in terms of magnitude and consequence; and
.3 the risk of the categories and sub-categories of accidents can be expressed as F-N curves (see appendix 5) or potential loss of lives (PLL) based on the frequency of accidents and the severity of the outcome of the accidents. Thus, the distribution of risks across all the sub-categories of accidents is determined in risk terms, so as to display which categories contribute how much risk.
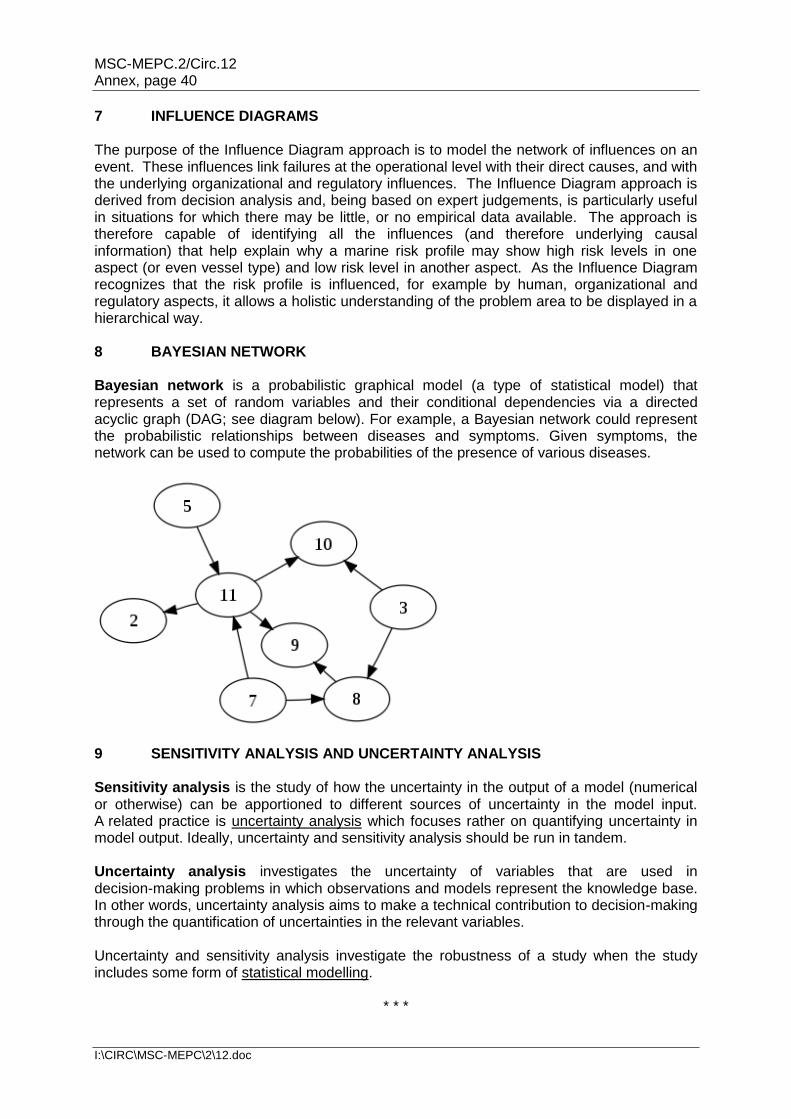
MSC-MEPC.2/Circ.12 Annex, page 40
I:\CIRC\MSC-MEPC\2\12.doc
7 INFLUENCE DIAGRAMS The purpose of the Influence Diagram approach is to model the network of influences on an event. These influences link failures at the operational level with their direct causes, and with the underlying organizational and regulatory influences. The Influence Diagram approach is derived from decision analysis and, being based on expert judgements, is particularly useful in situations for which there may be little, or no empirical data available. The approach is therefore capable of identifying all the influences (and therefore underlying causal information) that help explain why a marine risk profile may show high risk levels in one aspect (or even vessel type) and low risk level in another aspect. As the Influence Diagram recognizes that the risk profile is influenced, for example by human, organizational and regulatory aspects, it allows a holistic understanding of the problem area to be displayed in a hierarchical way. 8 BAYESIAN NETWORK Bayesian network is a probabilistic graphical model (a type of statistical model) that represents a set of random variables and their conditional dependencies via a directed acyclic graph (DAG; see diagram below). For example, a Bayesian network could represent the probabilistic relationships between diseases and symptoms. Given symptoms, the network can be used to compute the probabilities of the presence of various diseases.
9 SENSITIVITY ANALYSIS AND UNCERTAINTY ANALYSIS Sensitivity analysis is the study of how the uncertainty in the output of a model (numerical or otherwise) can be apportioned to different sources of uncertainty in the model input. A related practice is uncertainty analysis which focuses rather on quantifying uncertainty in model output. Ideally, uncertainty and sensitivity analysis should be run in tandem. Uncertainty analysis investigates the uncertainty of variables that are used in decision-making problems in which observations and models represent the knowledge base. In other words, uncertainty analysis aims to make a technical contribution to decision-making through the quantification of uncertainties in the relevant variables. Uncertainty and sensitivity analysis investigate the robustness of a study when the study includes some form of statistical modelling.
* * *
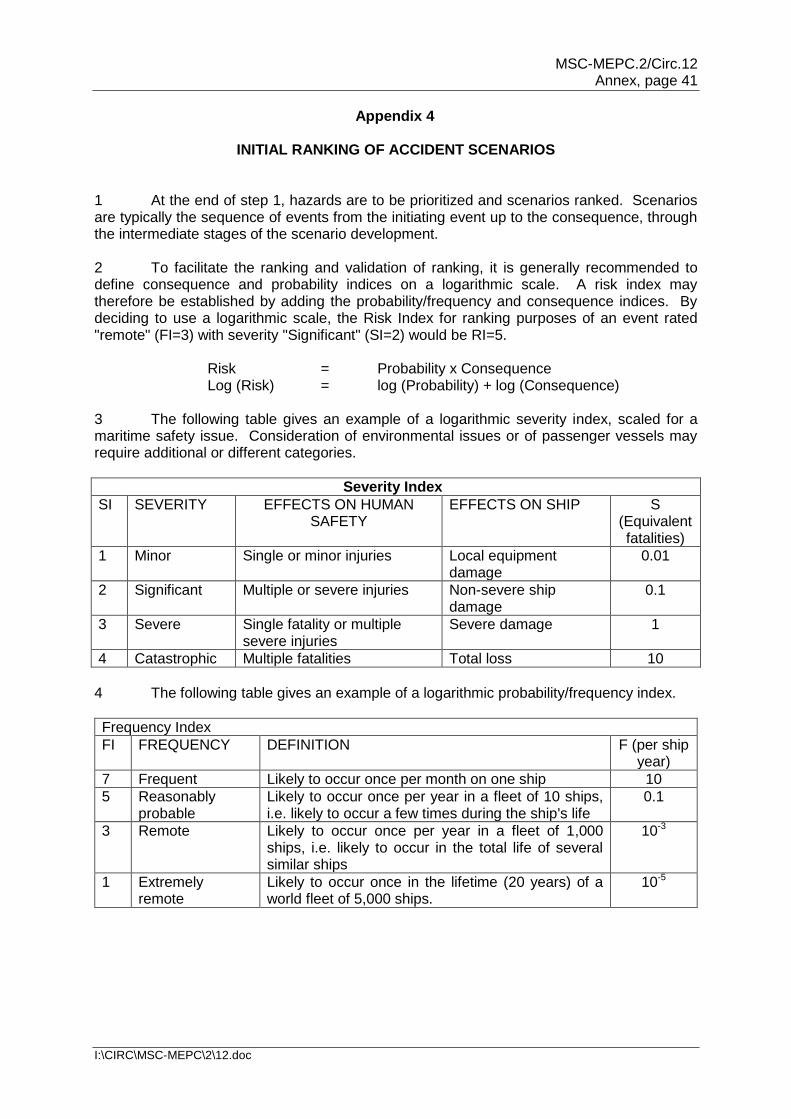
MSC-MEPC.2/Circ.12 Annex, page 41
I:\CIRC\MSC-MEPC\2\12.doc
Appendix 4
INITIAL RANKING OF ACCIDENT SCENARIOS 1 At the end of step 1, hazards are to be prioritized and scenarios ranked. Scenarios are typically the sequence of events from the initiating event up to the consequence, through the intermediate stages of the scenario development. 2 To facilitate the ranking and validation of ranking, it is generally recommended to define consequence and probability indices on a logarithmic scale. A risk index may therefore be established by adding the probability/frequency and consequence indices. By deciding to use a logarithmic scale, the Risk Index for ranking purposes of an event rated "remote" (FI=3) with severity "Significant" (SI=2) would be RI=5. Risk = Probability x Consequence Log (Risk) = log (Probability) + log (Consequence) 3 The following table gives an example of a logarithmic severity index, scaled for a maritime safety issue. Consideration of environmental issues or of passenger vessels may require additional or different categories.
Severity Index
SI SEVERITY EFFECTS ON HUMAN SAFETY
EFFECTS ON SHIP S (Equivalent fatalities)
1 Minor Single or minor injuries Local equipment damage
0.01
2 Significant Multiple or severe injuries Non-severe ship damage
0.1
3 Severe Single fatality or multiple severe injuries
Severe damage 1
4 Catastrophic Multiple fatalities Total loss 10
4 The following table gives an example of a logarithmic probability/frequency index.
Frequency Index
FI FREQUENCY DEFINITION F (per ship year)
7 Frequent Likely to occur once per month on one ship 10
5 Reasonably probable
Likely to occur once per year in a fleet of 10 ships, i.e. likely to occur a few times during the ship's life
0.1
3 Remote Likely to occur once per year in a fleet of 1,000 ships, i.e. likely to occur in the total life of several similar ships
10-3
1 Extremely remote
Likely to occur once in the lifetime (20 years) of a world fleet of 5,000 ships.
10-5
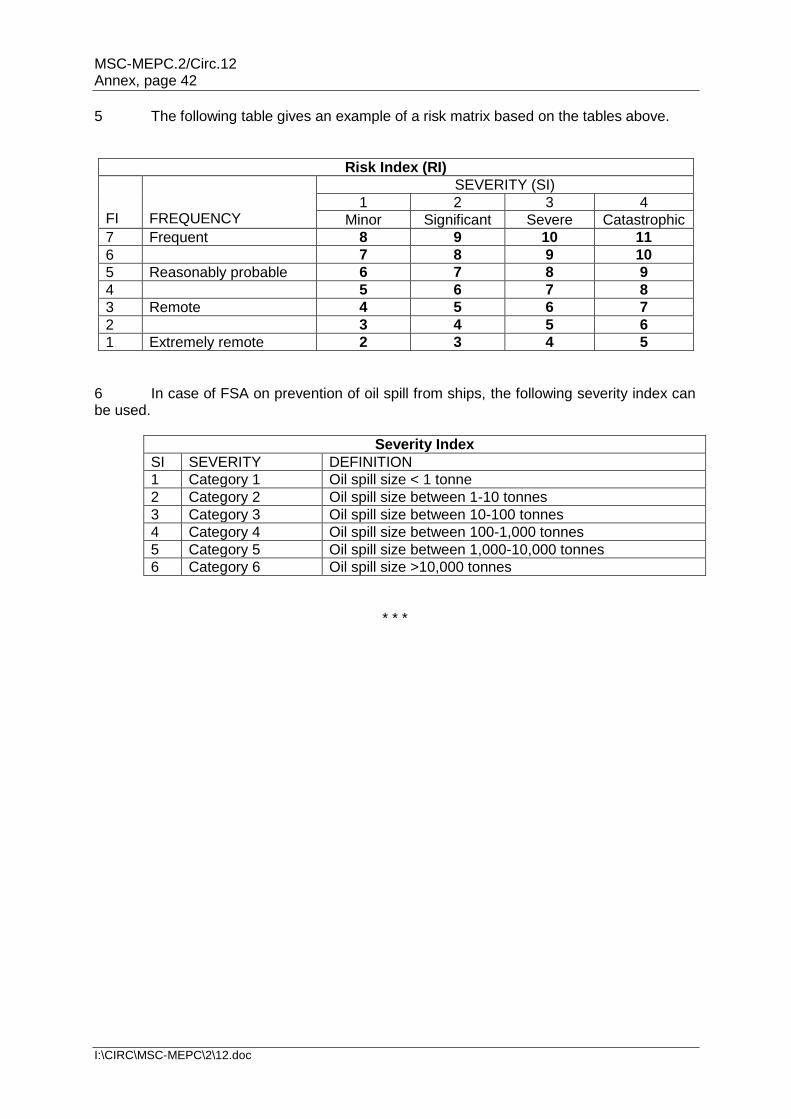
MSC-MEPC.2/Circ.12 Annex, page 42
I:\CIRC\MSC-MEPC\2\12.doc
5 The following table gives an example of a risk matrix based on the tables above.
Risk Index (RI)
FI
FREQUENCY
SEVERITY (SI)
1 2 3 4
Minor Significant Severe Catastrophic
7 Frequent 8 9 10 11
6 7 8 9 10
5 Reasonably probable 6 7 8 9
4 5 6 7 8
3 Remote 4 5 6 7
2 3 4 5 6
1 Extremely remote 2 3 4 5
6 In case of FSA on prevention of oil spill from ships, the following severity index can be used.
Severity Index
SI SEVERITY DEFINITION
1 Category 1 Oil spill size < 1 tonne
2 Category 2 Oil spill size between 1-10 tonnes
3 Category 3 Oil spill size between 10-100 tonnes
4 Category 4 Oil spill size between 100-1,000 tonnes
5 Category 5 Oil spill size between 1,000-10,000 tonnes
6 Category 6 Oil spill size >10,000 tonnes
* * *
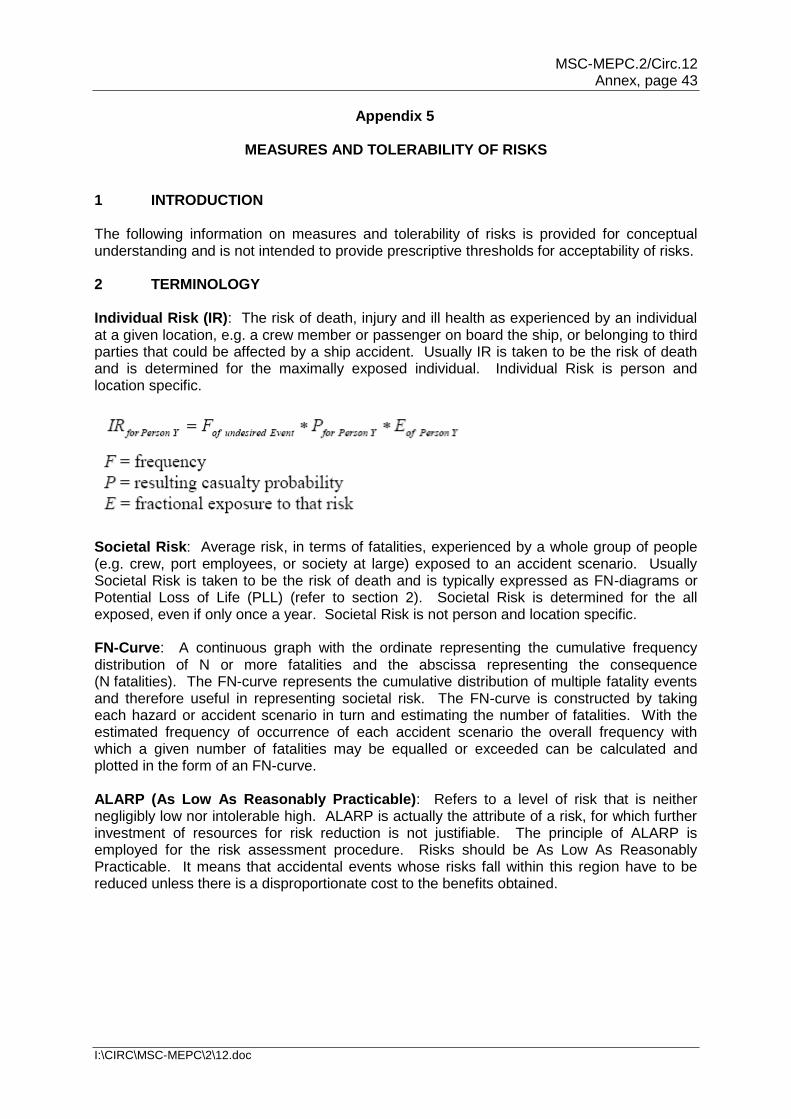
MSC-MEPC.2/Circ.12 Annex, page 43
I:\CIRC\MSC-MEPC\2\12.doc
Appendix 5
MEASURES AND TOLERABILITY OF RISKS 1 INTRODUCTION The following information on measures and tolerability of risks is provided for conceptual understanding and is not intended to provide prescriptive thresholds for acceptability of risks. 2 TERMINOLOGY Individual Risk (IR): The risk of death, injury and ill health as experienced by an individual at a given location, e.g. a crew member or passenger on board the ship, or belonging to third parties that could be affected by a ship accident. Usually IR is taken to be the risk of death and is determined for the maximally exposed individual. Individual Risk is person and location specific.
Societal Risk: Average risk, in terms of fatalities, experienced by a whole group of people (e.g. crew, port employees, or society at large) exposed to an accident scenario. Usually Societal Risk is taken to be the risk of death and is typically expressed as FN-diagrams or Potential Loss of Life (PLL) (refer to section 2). Societal Risk is determined for the all exposed, even if only once a year. Societal Risk is not person and location specific. FN-Curve: A continuous graph with the ordinate representing the cumulative frequency distribution of N or more fatalities and the abscissa representing the consequence (N fatalities). The FN-curve represents the cumulative distribution of multiple fatality events and therefore useful in representing societal risk. The FN-curve is constructed by taking each hazard or accident scenario in turn and estimating the number of fatalities. With the estimated frequency of occurrence of each accident scenario the overall frequency with which a given number of fatalities may be equalled or exceeded can be calculated and plotted in the form of an FN-curve. ALARP (As Low As Reasonably Practicable): Refers to a level of risk that is neither negligibly low nor intolerable high. ALARP is actually the attribute of a risk, for which further investment of resources for risk reduction is not justifiable. The principle of ALARP is employed for the risk assessment procedure. Risks should be As Low As Reasonably Practicable. It means that accidental events whose risks fall within this region have to be reduced unless there is a disproportionate cost to the benefits obtained.
MSC-MEPC.2/Circ.12 Annex, page 44
I:\CIRC\MSC-MEPC\2\12.doc
3 PRINCIPLES OF RISK EVALUATION Risk can be expressed in several complementary fashions. Concerning life safety, the most commonly used expressions are Individual Risk and Societal Risk. This is risk of death, injuries and ill health experienced by an individual and/or a group of people. The notion of risk combines frequency and an identified level of harm. Commonly, the level of harm is narrowed down to the loss of life and risk is an expression of frequency and number of fatalities. In other words, life safety is usually taken to refer to the risk of loss of life, and usually expressed as fatalities per year. In order to address not only fatalities, but also disabilities and injuries, the Equivalent Fatality Concept as specified below is advocated. Risk should at least be judged from two viewpoints. The first point of view is that of the individual, which is dealt with by the Individual Risk. The second point of view is that of society, considering whether a risk is acceptable for (large) group of people. This is dealt with by the Societal Risk. 3.1 The use of Individual Risk 3.1.1 This risk expression is used, when the risk from an accident is to be estimated for a particular individual at a given location. Individual Risk considers not only the frequency of the accident and the consequence (here: fatality or injury), but also the individual's fractional exposure to that risk, i.e. the probability of the individual of being in the given location at the time of the accident. 3.1.2 Example: The risk for a person to be killed or injured in a harbour area, due to a tanker explosion is the higher the closer the person is located to the explosion location, and the more likely the person will be in that location at the time of the explosion. Therefore, the Individual Risk for a worker in the vicinity of the explosion will be higher than for an occupant in the neighbourhood of the harbour terminal. 3.1.3 The purpose of estimating the Individual Risk is to ensure that individuals, who may be affected by a ship accident, are not exposed to excessive risks. 3.2 The use of Societal Risk 3.2.1 Societal Risk is used to estimate risks of accidents affecting many persons, e.g. catastrophes, and acknowledging risk averse or neutral attitudes. Societal Risk includes the risk to every person, even if a person is only exposed on one brief occasion to that risk. For assessing the risk to a large number of affected people, Societal Risk is desirable because Individual Risk is insufficient in evaluating risks imposed on large numbers of people. Societal Risk expressions can be generated for each type of accident (e.g. collision), or a single overall Societal Risk expression can be obtained, e.g. for a ship type, by combining all accidents together (e.g. collision, grounding, fire). Societal Risk may be expressed as: .1 FN-diagrams showing explicitly the relationship between the cumulative
frequency of an accident and the number of fatalities in a multidimensional diagram.
.2 Annual fatality rate: frequency and fatality are combined into a convenient
one-dimensional measure of societal risk. This is also known as Potential Loss of Life (PLL).
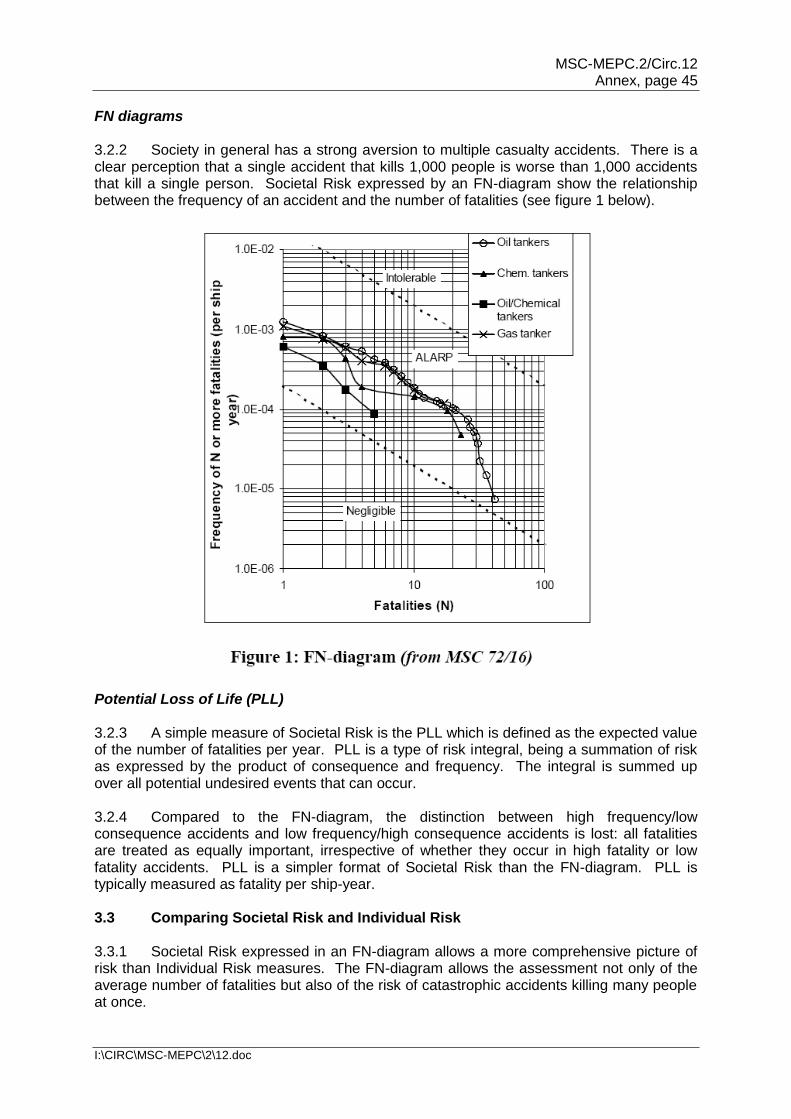
MSC-MEPC.2/Circ.12 Annex, page 45
I:\CIRC\MSC-MEPC\2\12.doc
FN diagrams 3.2.2 Society in general has a strong aversion to multiple casualty accidents. There is a clear perception that a single accident that kills 1,000 people is worse than 1,000 accidents that kill a single person. Societal Risk expressed by an FN-diagram show the relationship between the frequency of an accident and the number of fatalities (see figure 1 below).
Potential Loss of Life (PLL) 3.2.3 A simple measure of Societal Risk is the PLL which is defined as the expected value of the number of fatalities per year. PLL is a type of risk integral, being a summation of risk as expressed by the product of consequence and frequency. The integral is summed up over all potential undesired events that can occur. 3.2.4 Compared to the FN-diagram, the distinction between high frequency/low consequence accidents and low frequency/high consequence accidents is lost: all fatalities are treated as equally important, irrespective of whether they occur in high fatality or low fatality accidents. PLL is a simpler format of Societal Risk than the FN-diagram. PLL is typically measured as fatality per ship-year. 3.3 Comparing Societal Risk and Individual Risk 3.3.1 Societal Risk expressed in an FN-diagram allows a more comprehensive picture of risk than Individual Risk measures. The FN-diagram allows the assessment not only of the average number of fatalities but also of the risk of catastrophic accidents killing many people at once.
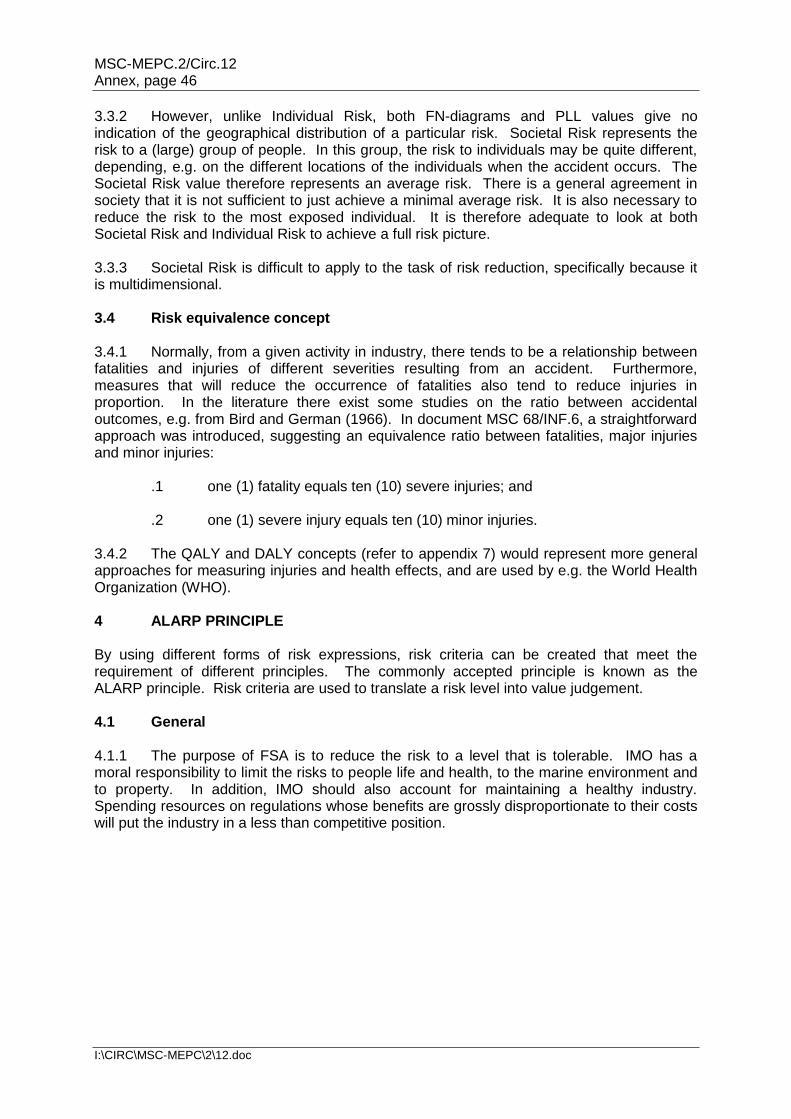
MSC-MEPC.2/Circ.12 Annex, page 46
I:\CIRC\MSC-MEPC\2\12.doc
3.3.2 However, unlike Individual Risk, both FN-diagrams and PLL values give no indication of the geographical distribution of a particular risk. Societal Risk represents the risk to a (large) group of people. In this group, the risk to individuals may be quite different, depending, e.g. on the different locations of the individuals when the accident occurs. The Societal Risk value therefore represents an average risk. There is a general agreement in society that it is not sufficient to just achieve a minimal average risk. It is also necessary to reduce the risk to the most exposed individual. It is therefore adequate to look at both Societal Risk and Individual Risk to achieve a full risk picture. 3.3.3 Societal Risk is difficult to apply to the task of risk reduction, specifically because it is multidimensional. 3.4 Risk equivalence concept 3.4.1 Normally, from a given activity in industry, there tends to be a relationship between fatalities and injuries of different severities resulting from an accident. Furthermore, measures that will reduce the occurrence of fatalities also tend to reduce injuries in proportion. In the literature there exist some studies on the ratio between accidental outcomes, e.g. from Bird and German (1966). In document MSC 68/INF.6, a straightforward approach was introduced, suggesting an equivalence ratio between fatalities, major injuries and minor injuries: .1 one (1) fatality equals ten (10) severe injuries; and .2 one (1) severe injury equals ten (10) minor injuries. 3.4.2 The QALY and DALY concepts (refer to appendix 7) would represent more general approaches for measuring injuries and health effects, and are used by e.g. the World Health Organization (WHO). 4 ALARP PRINCIPLE By using different forms of risk expressions, risk criteria can be created that meet the requirement of different principles. The commonly accepted principle is known as the ALARP principle. Risk criteria are used to translate a risk level into value judgement. 4.1 General 4.1.1 The purpose of FSA is to reduce the risk to a level that is tolerable. IMO has a moral responsibility to limit the risks to people life and health, to the marine environment and to property. In addition, IMO should also account for maintaining a healthy industry. Spending resources on regulations whose benefits are grossly disproportionate to their costs will put the industry in a less than competitive position.
MSC-MEPC.2/Circ.12 Annex, page 47
I:\CIRC\MSC-MEPC\2\12.doc
4.1.2 This is realized in the ALARP principle, which is shown in figure 2.
4.1.3 It states that there is a risk level that is intolerable above an upper bound. In this region, risk cannot be justified and must be reduced, irrespectively of costs. The principle also states that there is a risk level that is 'broadly acceptable' below a lower bound. In this region risk is negligible and no risk reduction required. If the risk level is in between the two bounds, the ALARP region, risk should be reduced to meet economic responsibility: Risk is to be reduced to a level as low as is reasonably practicable. The term reasonable is interpreted to mean cost-effective. Risk reduction measures should be technically practicable and the associated costs should not be disproportionate to the benefits gained. This is examined in a cost-effectiveness analysis. 4.2 Cost-effectiveness Analysis (CEA) With this approach the amount of risk reduction that can be justified in the ALARP region is determined. Several researchers have proven that most risks in shipping fall into this region. As such, most of risk-based decisions will require a CEA. However, it should be noted that this has not yet been verified for all ship types. There are several indices which express cost-effectiveness in relation to safety of life such as GCAF and NCAF, as described in appendix 7. 5 RECOMMENDED RISK EVALUATION CRITERIA 5.1 Individual Risk 5.1.1 Individual Risk criteria for hazardous activities are often set using risk levels that have already been accepted from other industrial activities. 5.1.2 The level of risk that will be accepted for an individual depends upon two aspects: .1 if the risk is taken involuntarily or voluntarily; and .2 if the individual has control over the risk or no control.
MSC-MEPC.2/Circ.12 Annex, page 48
I:\CIRC\MSC-MEPC\2\12.doc
5.1.3 If a person is voluntarily exposing himself to a risk and/or has some control over it, then the risk level that is accepted is higher as if this person was exposed involuntarily to that risk or had no control over it. 5.1.4 For example: A passenger on a cruise ship or an occupant living in the vicinity of a port have little or no control over the risks they are exposed to from the ship and/or the port activity. They are involuntarily exposed to risks. A crew member on a ship, instead, has chosen his work place on a voluntary basis, and due to skills and training has some control over the risks he/she is exposed to at the work place. 5.1.5 An appropriate level for the risk acceptance criteria would be substantially below the total accident risks experienced in daily life, but might be similar to risks that are accepted from other involuntary sources. 5.1.6 The lower and upper bound risk acceptance criteria as listed in table 1 are provided for illustrative purposes only. The specific values selected as appropriate should be explicitly defined in FSA studies. 5.2 Societal Risk/FN-Diagram 5.2.1 When setting upper and lower bounds for societal risk acceptance, both an anchor point and a slope should be defined. The slope reveals the risk inherent attitude: risk prone, neutral or averse. It is recommended to use a slope equal of -1 on a log/log scale to reflect the risk aversion. 5.2.2 In document MSC 72/16 it was pointed out that Societal Risk acceptance criteria cannot be simply transferred from one industrial activity to another. This could lead to illogical and unpredictable results. A method was introduced where the Societal Risk acceptance criteria reflect the importance of the activity to the society (for more detail, refer to document MSC 72/16, Skjong and Eknes (2001, 2002)). 5.2.3 For a given activity, an average acceptable Potential Loss of Life (PLL) is developed by considering the economic value of the activity and its relation to the gross national product. This can be done for crew/workers, passengers and other third parties. The risk is defined to be intolerable if it exceeds the average acceptable risk by more than one order of magnitude, and it is negligible (broadly acceptable), if it is one order of magnitude below the average acceptable risk. These upper and lower bounds represent the ALARP region, which thus ranges over two orders of magnitude, which is in agreement with other published Societal Risk acceptance criteria. 5.2.4 It is recommended to apply this method to define Societal Risk acceptance criteria on different ship types and/or marine activities, as the method can contribute to transparency in using risk acceptance criteria for Societal Risk. In document MSC 72/16, Societal Risk criteria developed with this method and expressed in FN-diagrams are provided for different ship types. 5.3 Examples of risk acceptance criteria 5.3.1 The following criteria are broadly used in other industries and have been also published in HSE (2001).
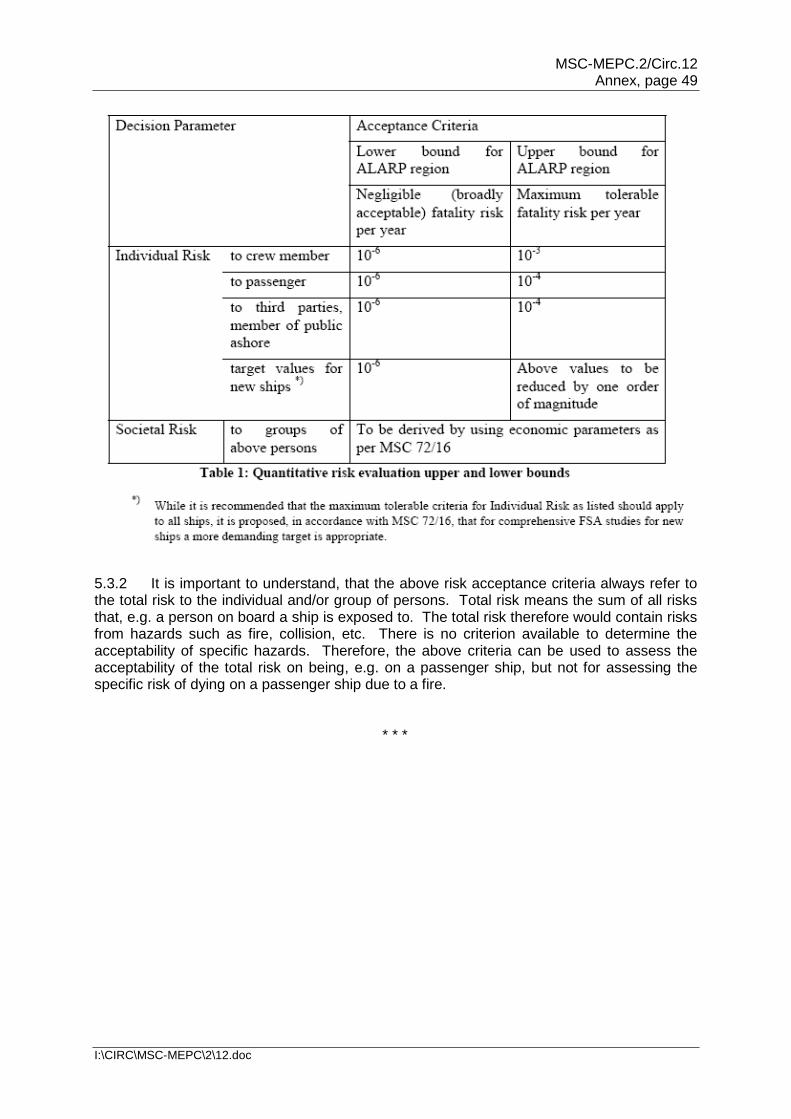
MSC-MEPC.2/Circ.12 Annex, page 49
I:\CIRC\MSC-MEPC\2\12.doc
5.3.2 It is important to understand, that the above risk acceptance criteria always refer to the total risk to the individual and/or group of persons. Total risk means the sum of all risks that, e.g. a person on board a ship is exposed to. The total risk therefore would contain risks from hazards such as fire, collision, etc. There is no criterion available to determine the acceptability of specific hazards. Therefore, the above criteria can be used to assess the acceptability of the total risk on being, e.g. on a passenger ship, but not for assessing the specific risk of dying on a passenger ship due to a fire.
* * *
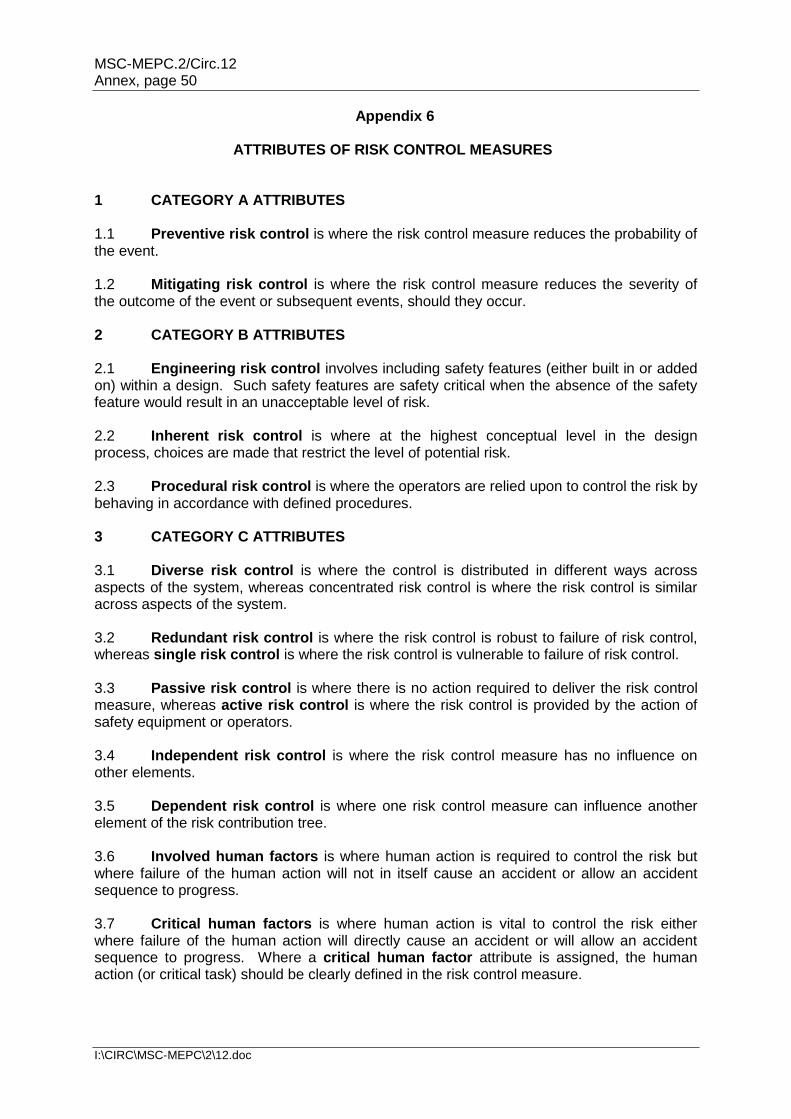
MSC-MEPC.2/Circ.12 Annex, page 50
I:\CIRC\MSC-MEPC\2\12.doc
Appendix 6
ATTRIBUTES OF RISK CONTROL MEASURES 1 CATEGORY A ATTRIBUTES 1.1 Preventive risk control is where the risk control measure reduces the probability of the event. 1.2 Mitigating risk control is where the risk control measure reduces the severity of the outcome of the event or subsequent events, should they occur. 2 CATEGORY B ATTRIBUTES 2.1 Engineering risk control involves including safety features (either built in or added on) within a design. Such safety features are safety critical when the absence of the safety feature would result in an unacceptable level of risk. 2.2 Inherent risk control is where at the highest conceptual level in the design process, choices are made that restrict the level of potential risk. 2.3 Procedural risk control is where the operators are relied upon to control the risk by behaving in accordance with defined procedures. 3 CATEGORY C ATTRIBUTES 3.1 Diverse risk control is where the control is distributed in different ways across aspects of the system, whereas concentrated risk control is where the risk control is similar across aspects of the system. 3.2 Redundant risk control is where the risk control is robust to failure of risk control, whereas single risk control is where the risk control is vulnerable to failure of risk control. 3.3 Passive risk control is where there is no action required to deliver the risk control measure, whereas active risk control is where the risk control is provided by the action of safety equipment or operators. 3.4 Independent risk control is where the risk control measure has no influence on other elements. 3.5 Dependent risk control is where one risk control measure can influence another element of the risk contribution tree. 3.6 Involved human factors is where human action is required to control the risk but where failure of the human action will not in itself cause an accident or allow an accident sequence to progress. 3.7 Critical human factors is where human action is vital to control the risk either where failure of the human action will directly cause an accident or will allow an accident sequence to progress. Where a critical human factor attribute is assigned, the human action (or critical task) should be clearly defined in the risk control measure.
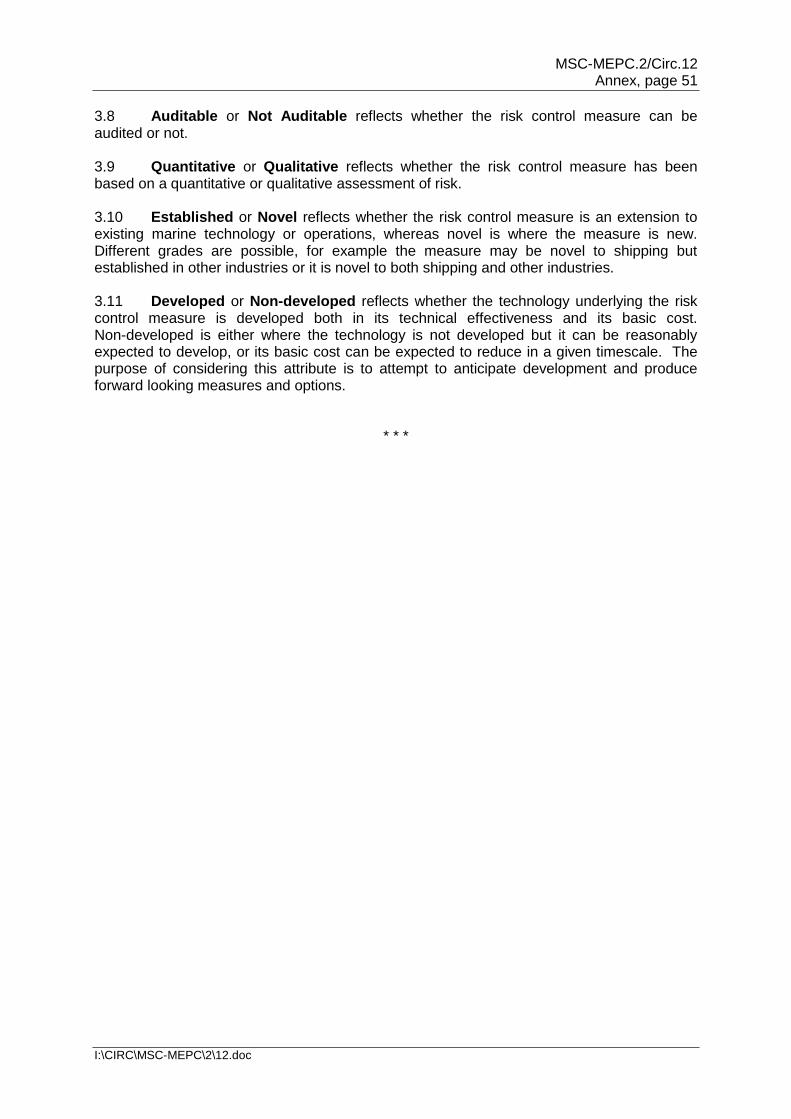
MSC-MEPC.2/Circ.12 Annex, page 51
I:\CIRC\MSC-MEPC\2\12.doc
3.8 Auditable or Not Auditable reflects whether the risk control measure can be audited or not. 3.9 Quantitative or Qualitative reflects whether the risk control measure has been based on a quantitative or qualitative assessment of risk. 3.10 Established or Novel reflects whether the risk control measure is an extension to existing marine technology or operations, whereas novel is where the measure is new. Different grades are possible, for example the measure may be novel to shipping but established in other industries or it is novel to both shipping and other industries. 3.11 Developed or Non-developed reflects whether the technology underlying the risk control measure is developed both in its technical effectiveness and its basic cost. Non-developed is either where the technology is not developed but it can be reasonably expected to develop, or its basic cost can be expected to reduce in a given timescale. The purpose of considering this attribute is to attempt to anticipate development and produce forward looking measures and options.
* * *
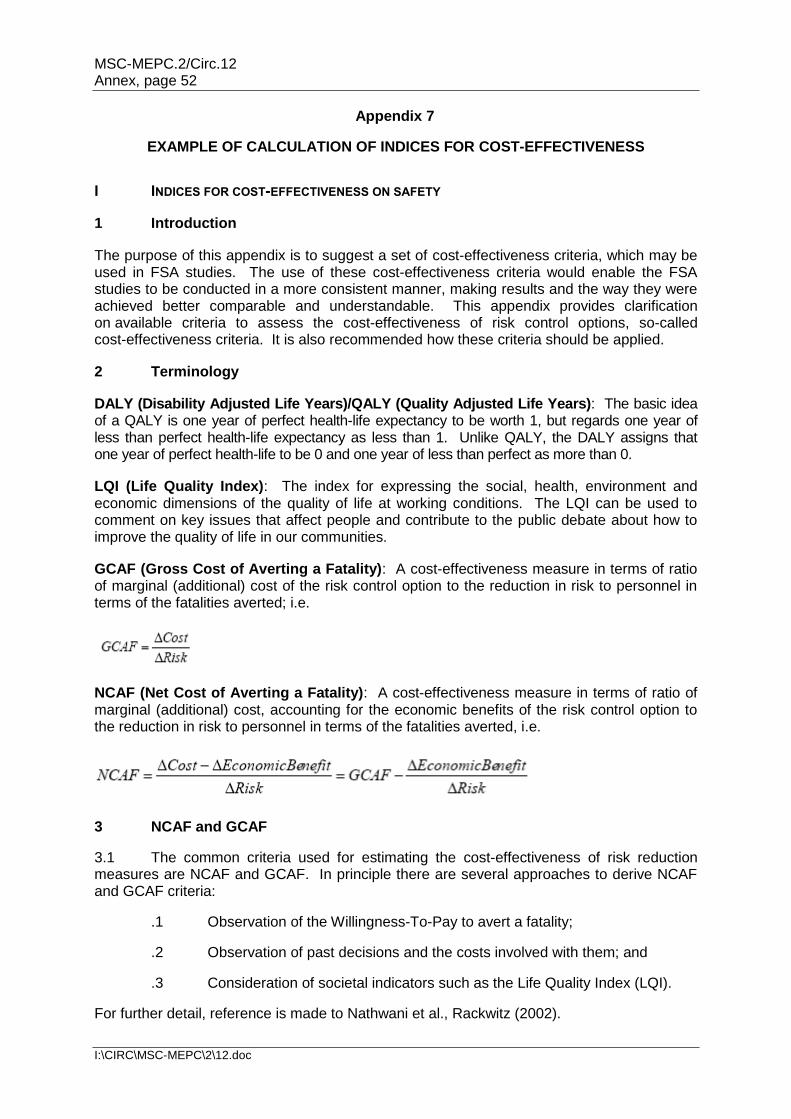
MSC-MEPC.2/Circ.12 Annex, page 52
I:\CIRC\MSC-MEPC\2\12.doc
Appendix 7
EXAMPLE OF CALCULATION OF INDICES FOR COST-EFFECTIVENESS
I INDICES FOR COST-EFFECTIVENESS ON SAFETY
1 Introduction
The purpose of this appendix is to suggest a set of cost-effectiveness criteria, which may be used in FSA studies. The use of these cost-effectiveness criteria would enable the FSA studies to be conducted in a more consistent manner, making results and the way they were achieved better comparable and understandable. This appendix provides clarification on available criteria to assess the cost-effectiveness of risk control options, so-called cost-effectiveness criteria. It is also recommended how these criteria should be applied.
2 Terminology
DALY (Disability Adjusted Life Years)/QALY (Quality Adjusted Life Years): The basic idea of a QALY is one year of perfect health-life expectancy to be worth 1, but regards one year of less than perfect health-life expectancy as less than 1. Unlike QALY, the DALY assigns that one year of perfect health-life to be 0 and one year of less than perfect as more than 0.
LQI (Life Quality Index): The index for expressing the social, health, environment and economic dimensions of the quality of life at working conditions. The LQI can be used to comment on key issues that affect people and contribute to the public debate about how to improve the quality of life in our communities.
GCAF (Gross Cost of Averting a Fatality): A cost-effectiveness measure in terms of ratio of marginal (additional) cost of the risk control option to the reduction in risk to personnel in terms of the fatalities averted; i.e.
NCAF (Net Cost of Averting a Fatality): A cost-effectiveness measure in terms of ratio of marginal (additional) cost, accounting for the economic benefits of the risk control option to the reduction in risk to personnel in terms of the fatalities averted, i.e.
3 NCAF and GCAF
3.1 The common criteria used for estimating the cost-effectiveness of risk reduction measures are NCAF and GCAF. In principle there are several approaches to derive NCAF and GCAF criteria:
.1 Observation of the Willingness-To-Pay to avert a fatality;
.2 Observation of past decisions and the costs involved with them; and
.3 Consideration of societal indicators such as the Life Quality Index (LQI).
For further detail, reference is made to Nathwani et al., Rackwitz (2002).
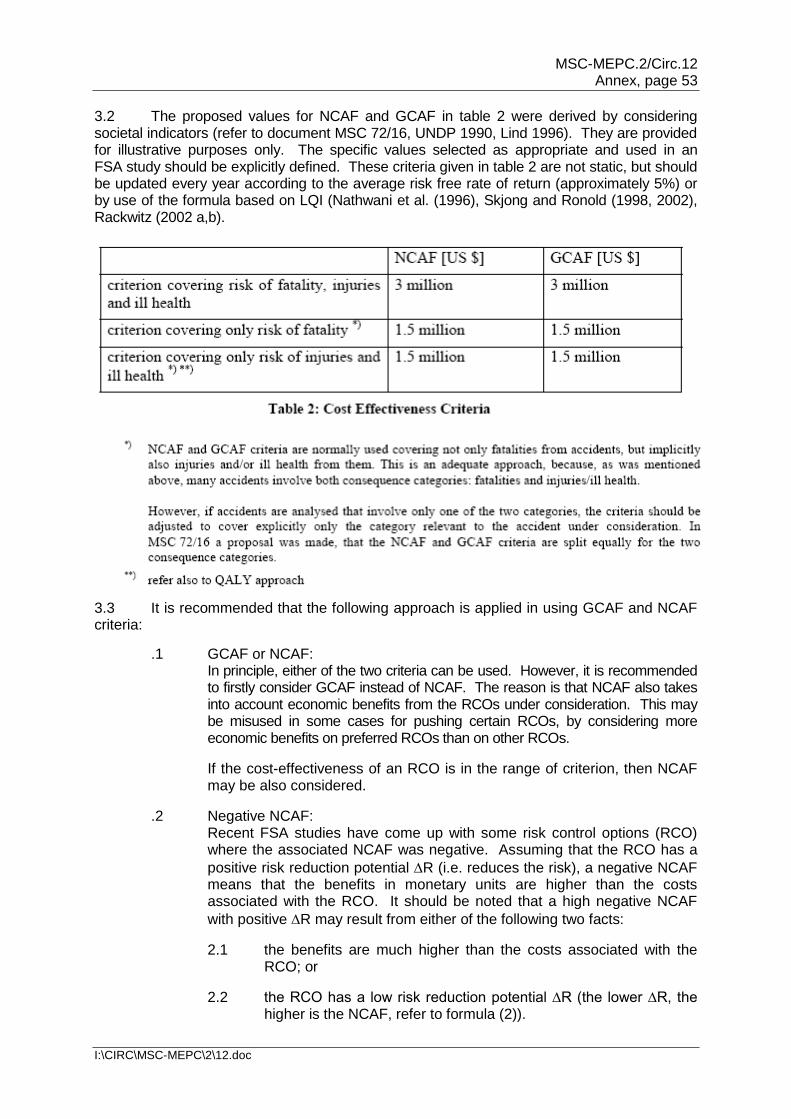
MSC-MEPC.2/Circ.12 Annex, page 53
I:\CIRC\MSC-MEPC\2\12.doc
3.2 The proposed values for NCAF and GCAF in table 2 were derived by considering societal indicators (refer to document MSC 72/16, UNDP 1990, Lind 1996). They are provided for illustrative purposes only. The specific values selected as appropriate and used in an FSA study should be explicitly defined. These criteria given in table 2 are not static, but should be updated every year according to the average risk free rate of return (approximately 5%) or by use of the formula based on LQI (Nathwani et al. (1996), Skjong and Ronold (1998, 2002), Rackwitz (2002 a,b).
3.3 It is recommended that the following approach is applied in using GCAF and NCAF criteria:
.1 GCAF or NCAF: In principle, either of the two criteria can be used. However, it is recommended to firstly consider GCAF instead of NCAF. The reason is that NCAF also takes into account economic benefits from the RCOs under consideration. This may be misused in some cases for pushing certain RCOs, by considering more economic benefits on preferred RCOs than on other RCOs.
If the cost-effectiveness of an RCO is in the range of criterion, then NCAF may be also considered.
.2 Negative NCAF: Recent FSA studies have come up with some risk control options (RCO) where the associated NCAF was negative. Assuming that the RCO has a
positive risk reduction potential R (i.e. reduces the risk), a negative NCAF means that the benefits in monetary units are higher than the costs associated with the RCO. It should be noted that a high negative NCAF
with positive R may result from either of the following two facts:
2.1 the benefits are much higher than the costs associated with the RCO; or
2.2 the RCO has a low risk reduction potential ∆R (the lower ∆R, the higher is the NCAF, refer to formula (2)).
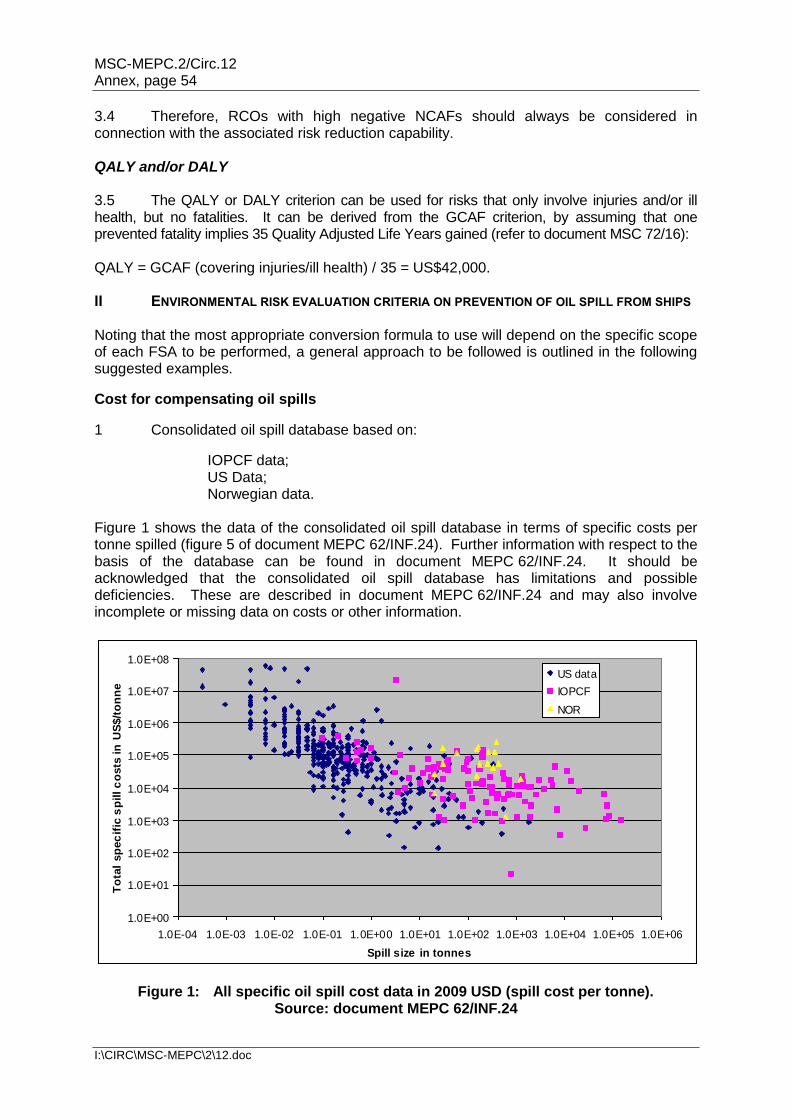
MSC-MEPC.2/Circ.12 Annex, page 54
I:\CIRC\MSC-MEPC\2\12.doc
3.4 Therefore, RCOs with high negative NCAFs should always be considered in connection with the associated risk reduction capability. QALY and/or DALY 3.5 The QALY or DALY criterion can be used for risks that only involve injuries and/or ill health, but no fatalities. It can be derived from the GCAF criterion, by assuming that one prevented fatality implies 35 Quality Adjusted Life Years gained (refer to document MSC 72/16): QALY = GCAF (covering injuries/ill health) / 35 = US$42,000. II ENVIRONMENTAL RISK EVALUATION CRITERIA ON PREVENTION OF OIL SPILL FROM SHIPS Noting that the most appropriate conversion formula to use will depend on the specific scope of each FSA to be performed, a general approach to be followed is outlined in the following suggested examples.
Cost for compensating oil spills
1 Consolidated oil spill database based on:
IOPCF data; US Data; Norwegian data.
Figure 1 shows the data of the consolidated oil spill database in terms of specific costs per tonne spilled (figure 5 of document MEPC 62/INF.24). Further information with respect to the basis of the database can be found in document MEPC 62/INF.24. It should be acknowledged that the consolidated oil spill database has limitations and possible deficiencies. These are described in document MEPC 62/INF.24 and may also involve incomplete or missing data on costs or other information.
1.0E+00
1.0E+01
1.0E+02
1.0E+03
1.0E+04
1.0E+05
1.0E+06
1.0E+07
1.0E+08
1.0E-04 1.0E-03 1.0E-02 1.0E-01 1.0E+00 1.0E+01 1.0E+02 1.0E+03 1.0E+04 1.0E+05 1.0E+06
Spill size in tonnes
To
tal
sp
ec
ific
sp
ill c
osts
in
US
$/t
on
ne
US data
IOPCF
NOR
Figure 1: All specific oil spill cost data in 2009 USD (spill cost per tonne). Source: document MEPC 62/INF.24
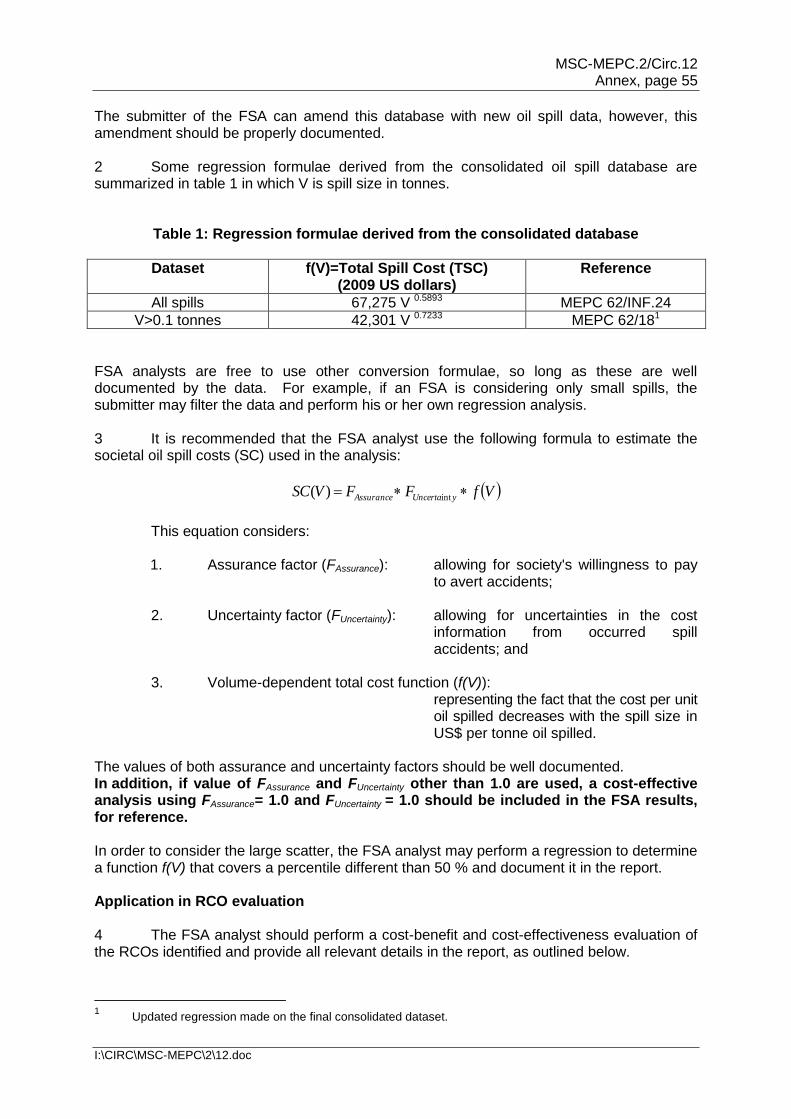
MSC-MEPC.2/Circ.12 Annex, page 55
I:\CIRC\MSC-MEPC\2\12.doc
The submitter of the FSA can amend this database with new oil spill data, however, this amendment should be properly documented. 2 Some regression formulae derived from the consolidated oil spill database are summarized in table 1 in which V is spill size in tonnes.
Table 1: Regression formulae derived from the consolidated database
Dataset f(V)=Total Spill Cost (TSC) (2009 US dollars)
Reference
All spills 67,275 V 0.5893 MEPC 62/INF.24
V>0.1 tonnes 42,301 V 0.7233 MEPC 62/181
FSA analysts are free to use other conversion formulae, so long as these are well documented by the data. For example, if an FSA is considering only small spills, the submitter may filter the data and perform his or her own regression analysis. 3 It is recommended that the FSA analyst use the following formula to estimate the societal oil spill costs (SC) used in the analysis:
VfFFVSC yUncertaAssurance int)(
This equation considers: 1. Assurance factor (FAssurance): allowing for society's willingness to pay
to avert accidents; 2. Uncertainty factor (FUncertainty): allowing for uncertainties in the cost
information from occurred spill accidents; and
3. Volume-dependent total cost function (f(V)):
representing the fact that the cost per unit oil spilled decreases with the spill size in US$ per tonne oil spilled.
The values of both assurance and uncertainty factors should be well documented. In addition, if value of FAssurance and FUncertainty other than 1.0 are used, a cost-effective analysis using FAssurance= 1.0 and FUncertainty = 1.0 should be included in the FSA results, for reference. In order to consider the large scatter, the FSA analyst may perform a regression to determine a function f(V) that covers a percentile different than 50 % and document it in the report. Application in RCO evaluation 4 The FSA analyst should perform a cost-benefit and cost-effectiveness evaluation of the RCOs identified and provide all relevant details in the report, as outlined below.
1 Updated regression made on the final consolidated dataset.
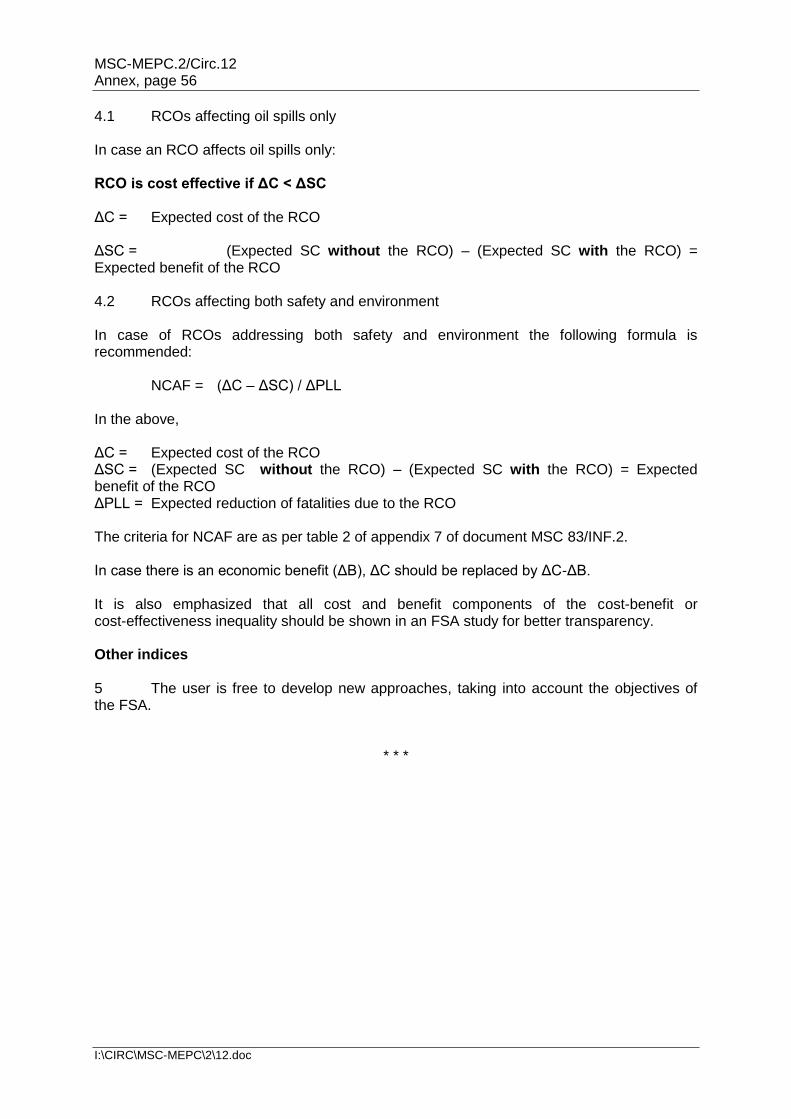
MSC-MEPC.2/Circ.12 Annex, page 56
I:\CIRC\MSC-MEPC\2\12.doc
4.1 RCOs affecting oil spills only In case an RCO affects oil spills only: RCO is cost effective if ΔC < ΔSC ΔC = Expected cost of the RCO ΔSC = (Expected SC without the RCO) – (Expected SC with the RCO) = Expected benefit of the RCO 4.2 RCOs affecting both safety and environment In case of RCOs addressing both safety and environment the following formula is recommended: NCAF = (ΔC – ΔSC) / ΔPLL In the above, ΔC = Expected cost of the RCO ΔSC = (Expected SC without the RCO) – (Expected SC with the RCO) = Expected benefit of the RCO ΔPLL = Expected reduction of fatalities due to the RCO The criteria for NCAF are as per table 2 of appendix 7 of document MSC 83/INF.2. In case there is an economic benefit (ΔB), ΔC should be replaced by ΔC-ΔB. It is also emphasized that all cost and benefit components of the cost-benefit or cost-effectiveness inequality should be shown in an FSA study for better transparency. Other indices 5 The user is free to develop new approaches, taking into account the objectives of the FSA.
* * *
MSC-MEPC.2/Circ.12 Annex, page 57
I:\CIRC\MSC-MEPC\2\12.doc
Appendix 8
STANDARD FORMAT FOR REPORTING AN APPLICATION OF FORMAL SAFETY ASSESSMENT TO IMO
1 This standard format is intended to facilitate the compilation of the results of applications according to the Guidelines for Formal Safety Assessment (FSA) for use in the IMO rule-making process and the consistent presentation of those results to IMO. 2 Interested parties having carried out an FSA application should provide the most significant results in a clear and concise manner, which can also be understood by other parties not having the same experience in the application of risk assessment techniques. 3 The report of an FSA application should contain an executive summary and the following sections: definition of the problem, background information, method of work, description of the results achieved in each step and final recommendations arising from the FSA study. 4 The level of detail of the report depends on the problem under consideration. In order for users and reviewers to understand the results of FSA, the results of the FSA should be reported by: .1 a summary report of limited length (i.e. maximum 20 pages); .2 a full report that includes a detailed presentation and an explanation; and .3 if necessary, background data on an Internet site which is accessible by
reviewers of the Organization. 5 Those submitting the results of the FSA application should provide the other interested parties with timely and open access to relevant supporting documentation and sources of information or data which are referred to in the above-mentioned report, as reflected in paragraph 9.2.1 of the FSA Guidelines. 6 The following section presents the standard format of FSA application reports. The subjects expected to be presented in each section of the report are listed in italic characters and reference is made, in brackets, to the relevant paragraph(s) of the FSA Guidelines.
STANDARD REPORTING FORMAT
1 TITLE OF THE APPLICATION OF FSA 2 SUMMARY (maximum 1/2 page) 2.1 Executive summary: scope of the application and reference to the paragraph defining the problem assessed and its boundaries. 2.2 Actions to be taken: type of action requested (e.g. for information or review) and summary of the final recommendations listed in section 7. 2.3 Related documents: reference to any supporting documentation.
MSC-MEPC.2/Circ.12 Annex, page 58
I:\CIRC\MSC-MEPC\2\12.doc
3 DEFINITION OF THE PROBLEM (maximum 1 page) 3.1 Definition of the problem to be assessed in relation to the proposal under consideration by the decision-makers. 3.2 Reference to the regulation(s) affected by the proposal to be reviewed or developed (in an annex). 3.3 Definition of the generic model ( e.g. functions, features, characteristics or attributes which are relevant to the problem under consideration, common to all ships of the type affected by the proposal). (refer to paragraphs 4.1 and 4.2 of the FSA Guidelines) 4 BACKGROUND INFORMATION (maximum 3 pages) 4.1 Lessons learned from recently introduced measures to address similar problems. 4.2 Casualty statistics concerning the problem under consideration (e.g. ship types or accident category) including data analysis (i.e. time dependence, ship size influence, variability assessment, hypothesis testing, etc.). 4.3 Any other sources of data and relevant limitations. (refer to paragraph 3.2 of the FSA Guidelines) 5 METHOD OF WORK (maximum 3 pages) 5.1 Composition and expertise of those having performed each step of the FSA process by providing e.g.name and expertise of the experts involved in the application and name and contact point (e-mail address, telephone number and mailing address) of the coordinator of the FSA. 5.2 Description of how the assessment has been conducted in terms of organization of working groups and, method of decision-making in the group(s) that performed each step of the FSA process. 5.3 Start and finish date of the assessment. (refer to paragraph 3.1.1.2 of the FSA Guidelines) 6 DESCRIPTION OF THE RESULTS ACHIEVED IN EACH STEP (maximum 10 pages) For each step, describe: .1 method and techniques used to carry out the assessment; .2 assumptions, limitations or uncertainties and the basis for them; and .3 outcomes of each step of the FSA methodology, including:
MSC-MEPC.2/Circ.12 Annex, page 59
I:\CIRC\MSC-MEPC\2\12.doc
STEP 1 – HAZARD IDENTIFICATION: (refer to paragraph 5.3 of the FSA Guidelines)
prioritized list of hazards and description of their associated scenarios
identified significant accident scenarios including causes and initiating events in line with the scope of the FSA
STEP 2 – RISK ANALYSIS: (refer to paragraph 6.3 of the FSA Guidelines)
types of risk (e.g. individual, societal, environmental, business)
presentation of the distribution of risks depending on the problem under consideration
identified significant risks
principal influences that affect the risks
sources of accident and reliability statistics STEP 3 – RISK CONTROL OPTIONS: (refer to paragraph 7.3 of the FSA Guidelines)
what hazards are covered by current regulations
identified risk control options
assessment of the control options as a function of their effectiveness against risk reduction
STEP 4 – COST-BENEFIT ASSESSMENT: (refer to paragraph 8.3 of the FSA Guidelines)
identified types of cost and benefits involved for each risk control option
cost-benefit assessment for the entities which are influenced by each option
identification of the cost-effectiveness expressed in terms of cost per unit risk reduction
STEP 5 – RECOMMENDATIONS FOR DECISION-MAKING (refer to paragraph 9.3 of the FSA Guidelines)
objective comparison of alternative options
discussion on how recommendations could be implemented by decision-makers 7 FINAL RECOMMENDATIONS FOR DECISION-MAKING (maximum 2 1/2 pages) List of final recommendations, ranked and justified in an auditable and traceable manner. (refer to paragraph 9.3 of the FSA Guidelines)
ANNEXES (as necessary)
.1 explanation of the background of each expert (e.g. a short curriculum vitae) and the basis of selection of the experts;
.2 list of references; .3 sources of data; .4 accident statistics; .5 technical support material; and .6 any further information.
* * *
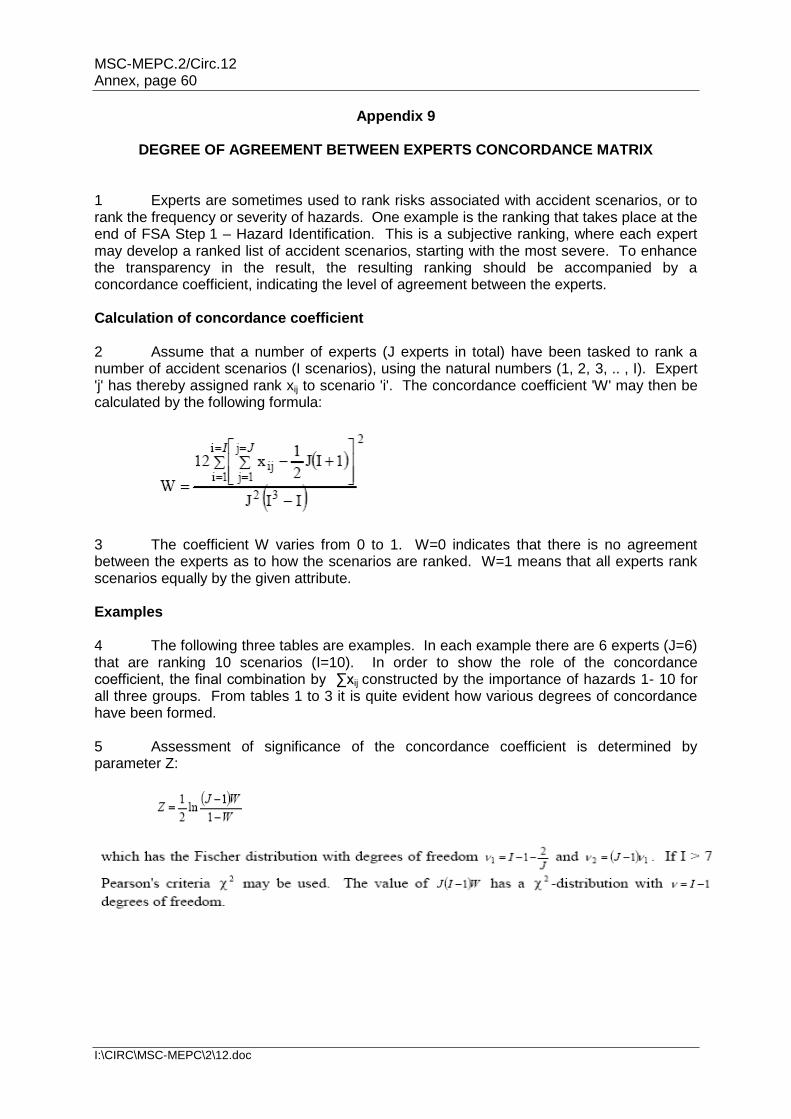
MSC-MEPC.2/Circ.12 Annex, page 60
I:\CIRC\MSC-MEPC\2\12.doc
Appendix 9
DEGREE OF AGREEMENT BETWEEN EXPERTS CONCORDANCE MATRIX 1 Experts are sometimes used to rank risks associated with accident scenarios, or to rank the frequency or severity of hazards. One example is the ranking that takes place at the end of FSA Step 1 – Hazard Identification. This is a subjective ranking, where each expert may develop a ranked list of accident scenarios, starting with the most severe. To enhance the transparency in the result, the resulting ranking should be accompanied by a concordance coefficient, indicating the level of agreement between the experts. Calculation of concordance coefficient 2 Assume that a number of experts (J experts in total) have been tasked to rank a number of accident scenarios (I scenarios), using the natural numbers (1, 2, 3, .. , I). Expert 'j' has thereby assigned rank xij to scenario 'i'. The concordance coefficient 'W' may then be calculated by the following formula:
3 The coefficient W varies from 0 to 1. W=0 indicates that there is no agreement between the experts as to how the scenarios are ranked. W=1 means that all experts rank scenarios equally by the given attribute. Examples 4 The following three tables are examples. In each example there are 6 experts (J=6) that are ranking 10 scenarios (I=10). In order to show the role of the concordance coefficient, the final combination by ∑xij constructed by the importance of hazards 1- 10 for all three groups. From tables 1 to 3 it is quite evident how various degrees of concordance have been formed. 5 Assessment of significance of the concordance coefficient is determined by parameter Z:

MSC-MEPC.2/Circ.12 Annex, page 61
I:\CIRC\MSC-MEPC\2\12.doc
Table 3 Group of experts with low degree of agreement
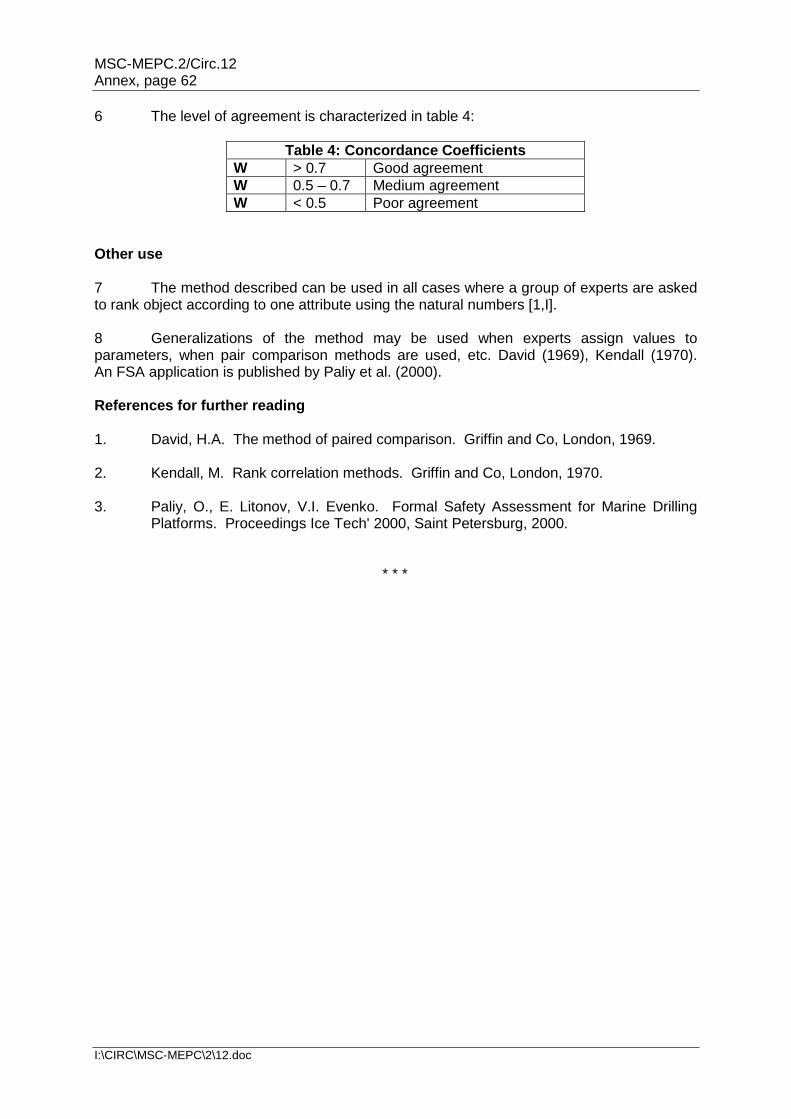
MSC-MEPC.2/Circ.12 Annex, page 62
I:\CIRC\MSC-MEPC\2\12.doc
6 The level of agreement is characterized in table 4:
Table 4: Concordance Coefficients
W > 0.7 Good agreement
W 0.5 – 0.7 Medium agreement
W < 0.5 Poor agreement
Other use 7 The method described can be used in all cases where a group of experts are asked to rank object according to one attribute using the natural numbers [1,I]. 8 Generalizations of the method may be used when experts assign values to parameters, when pair comparison methods are used, etc. David (1969), Kendall (1970). An FSA application is published by Paliy et al. (2000). References for further reading 1. David, H.A. The method of paired comparison. Griffin and Co, London, 1969. 2. Kendall, M. Rank correlation methods. Griffin and Co, London, 1970. 3. Paliy, O., E. Litonov, V.I. Evenko. Formal Safety Assessment for Marine Drilling
Platforms. Proceedings Ice Tech' 2000, Saint Petersburg, 2000.
* * *
MSC-MEPC.2/Circ.12 Annex, page 63
I:\CIRC\MSC-MEPC\2\12.doc
Appendix 10
GUIDANCE FOR PRACTICAL APPLICATION AND REVIEW PROCESS OF FSA INTRODUCTION 1 The Guidance provides information on the following subjects:
.1 project management issues to be considered for an FSA study;
.2 application of FSA by a Member State or an organization having a consultative status with the IMO (hereinafter called Member), when proposing amendments to maritime safety and pollution prevention instruments, to support or analyse the implications of such proposals;
.3 application of FSA by a Committee or instructed subsidiary body, to provide
a balanced view of a framework of regulations, so as to identify priorities and areas of concern, and to analyse the benefits and implications of proposed changes;
.4 consideration of the expertise for the team carrying out an FSA study and
qualifications for those experts; and .5 review of an FSA study.
2 Recommendations resulting from an FSA study should aim to be used by decision makers at all levels and in a variety of contexts at the IMO, without a requirement of specialist expertise. For this purpose, an FSA study should be open and transparent for review by all interested Member States and non-governmental organizations which have not participated in the conduct of the FSA study. 3 FSA studies submitted to the Organization in accordance with the Guidelines for formal safety assessment (FSA), for use in IMO rule-making process for consideration, when introducing or amending IMO instruments should be considered as one source but not the only source of valuable information to support IMO decision-making. PRACTICE/CONDUCT OF FSA STUDY Project management 4 Any activity that uses resources to transform inputs to outputs can be considered a process, and this definition also fits FSA. Quality management in FSA can be applied by identifying each FSA step as a sub-process involving a number of interrelated activities, and by establishing means to facilitate, monitor and control these activities to achieve the desired objectives. 5 In principle, critical issues, controls and controlling measurements to monitor the quality of the process should be defined for each FSA step. Moreover, several issues should be identified up front, before the study initiation and periodically reviewed during the study: .1 basic reasons to undertake the study;
.2 responsibilities and skills of the team in the various stages of the study;
MSC-MEPC.2/Circ.12 Annex, page 64
I:\CIRC\MSC-MEPC\2\12.doc
.3 clear authority chart; .4 extent of the coverage of the study (in particular, how many of the FSA
steps are required, which tools are expected to be used); .5 a project plan including the time scale of the study; .6 potentially critical areas and key measures of quality assurance; and .7 risk evaluation criteria. Application of FSA by a Member 6 A Member Government or an organization having a consultative status with IMO, or a pool of Members, may decide to carry out an FSA and submit its results for consideration by a Committee or instructed subsidiary body. The scope of the FSA definition of the problem and its boundaries should be decided by the Member(s) conducting the study, in the context of the submitted proposal. The costs involved in carrying out the study should be covered by the Member(s) conducting the study, who will also coordinate and keep responsibility for the work of subcontractors, if any. 7 The Member(s) carrying out the FSA study should make its/their best efforts to ensure that the report is presented in accordance with the Standard Format for Reporting FSA Applications, given in appendix 8 of the FSA Guidelines. It is important that the FSA report includes the names and credentials of the experts who have carried out or have been involved in the FSA. Application of FSA by a Committee or an instructed sub-committee 8 The Committee may decide to carry out an FSA study following:
.1 a proposal by a Member; .2 a proposal from a subsidiary body; or
.3 discussion in the Committee of an agenda item. 9 There are different options which may be followed by the Committee for undertaking the FSA study. In some circumstances, for instance when a proposal has far reaching implications and requires a balanced view between all relevant issues, the Committee may decide that the FSA study should be carried out by an instructed Sub-Committee, as described in paragraphs 15 to 24 below. 10 Further options for undertaking an FSA study may also be appropriate, one of which could be to invite a Member, or a pool of Members, to carry out the FSA study and report its results for consideration by the Committee. The Member(s) accepting this proposal could proceed according to the steps given in paragraphs 4 to 9 above. 11 In cases where the Committee decides that the study should be carried out by instructed sub-committee(s), the FSA study may be conducted in accordance with the flow chart shown in figure 1, as described below.
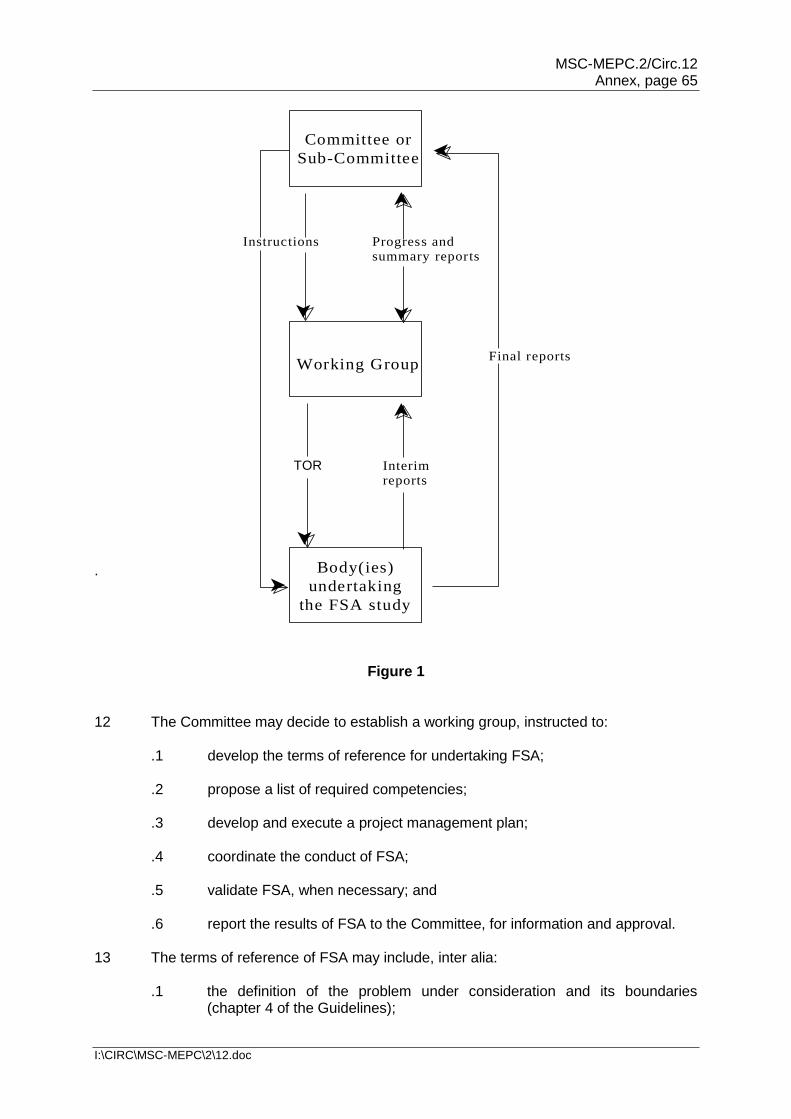
MSC-MEPC.2/Circ.12 Annex, page 65
I:\CIRC\MSC-MEPC\2\12.doc
.
Figure 1 12 The Committee may decide to establish a working group, instructed to:
.1 develop the terms of reference for undertaking FSA; .2 propose a list of required competencies; .3 develop and execute a project management plan; .4 coordinate the conduct of FSA; .5 validate FSA, when necessary; and .6 report the results of FSA to the Committee, for information and approval.
13 The terms of reference of FSA may include, inter alia: .1 the definition of the problem under consideration and its boundaries
(chapter 4 of the Guidelines);
Committee or
Sub-Committee
Body(ies)
undertaking
the FSA study
Working Group
Progress andsummary reports
Instructions
Tor Interimreports
Final reports
TOR
MSC-MEPC.2/Circ.12 Annex, page 66
I:\CIRC\MSC-MEPC\2\12.doc
.2 characterization of the problem under consideration, for example in terms or features, characteristics and attributes which are relevant to the problem concerned (section 4.2 of the Guidelines);
.3 the organization and tasks proposed for carrying out the 5 steps of the FSA process, including instructions to the relevant subsidiary bodies; and
.4 the list of competencies required for carrying out each step of FSA.
14 The Committee should examine the draft terms of reference developed by the working group, including in particular the necessary competencies, for approval. On the basis of the approved terms of reference, the Committee will:
.1 instruct the sub-committee(s) to undertake FSA (for instance a sub-committee or several sub-committees);
.2 endorse the list of competencies for carrying out each step of FSA; and
.3 invite Members willing to participate in the conduct of the FSA study to provide persons with the required competencies.
15 Members interested in participating in FSA should provide the Committee with a list of persons proposed to participate in the sub-committees instructed to carry out the FSA study, together with details of their relevant competencies. The working group should determine that such a list, when completed, covers the competencies deemed necessary for carrying out each step of the FSA study, and report to the Committee to decide as appropriate.
16 Each instructed subsidiary body should carry out the parts of the FSA study assigned to them. Any progress reports that the Committee may require, and, on completion of the FSA study, the final report should be submitted to the Committee. This final report should be in accordance with the Standard Reporting Format, given in annex 2 of the FSA Guidelines. 17 Interim reports may be submitted to the working group for the purposes of providing inputs to other parts of the process and enabling the working group to facilitate and monitor progress according to the project plan. The working group should review these reports and inform the Committee whether the FSA study proceeds in accordance with the approved project management plan. The working group should also propose necessary corrective actions, if any.
18 In addition to the final report submitted to the Committee by the sub-committees undertaking the FSA study, the working group should, at the completion of the FSA study, present to the Committee a summary report, which may include, inter alia:
.1 an evaluation that the methodology applied is in accordance with the Interim Guidelines;
.2 any proposals for improvement of the Interim Guidelines;
.3 deviations, if any, from the terms of reference approved by the Committee, and reasons therefor; and
.4 a list of recommendations resulting from the FSA study for a decision by the Committee.
19 The Committee should receive the recommendations made by the working group and decide as appropriate.
MSC-MEPC.2/Circ.12 Annex, page 67
I:\CIRC\MSC-MEPC\2\12.doc
Participation of experts in an FSA study 20 The participation of experts in the various fields is an essential part for the success of an FSA application. The team carrying out the FSA study should be selected in accordance with the area of interest of the study and related problems. A number of other experts should be involved to gather expert views and judgements throughout the five steps of the FSA process. 21 The team carrying out an FSA study should cover the fields of expertise necessary to progress within the five steps of the FSA process. The composition of the team depends on the type of problem and level of detail of the assessment. For instance, the team might include:
.1 experts in risk assessment techniques;
.2 experts in statistical data gathering and analysing; .3 experts involved in casualty investigations; .4 experts in the human element; .5 experts in the applicable rules and regulations; .6 experts from the technical, operational and organizational field,
(e.g. designers, builders and operators); .7 experts in consequence assessment (e.g. SAR, salvage and environment
protection); and .8 experts in cost-benefit assessment.
22 The team carrying out an FSA study may involve other experts in order to provide additional expert views, technical evaluations and/or judgements. All the experts involved in FSA study should have, as far as possible, a basic knowledge and understanding of the FSA methodology, as set out in the FSA Guidelines. 23 The experts to be involved should cover the widest possible range of knowledge, qualifications and competence relevant to the problem under consideration, including for instance:
.1 organizational and managerial aspects, e.g. pertinent to shipping companies; .2 technical aspects, e.g. design, construction, operation and maintenance; .3 legal, finance and insurance matters; and .4 matters of concern to flag Administrations and port State controls.
24 The names and expertise of the members of the team carrying out an FSA study and other experts involved should be included in an annex to the report containing the results of the study. 25 Other experts in various fields may be involved when reviewing and discussing the results of the FSA study.
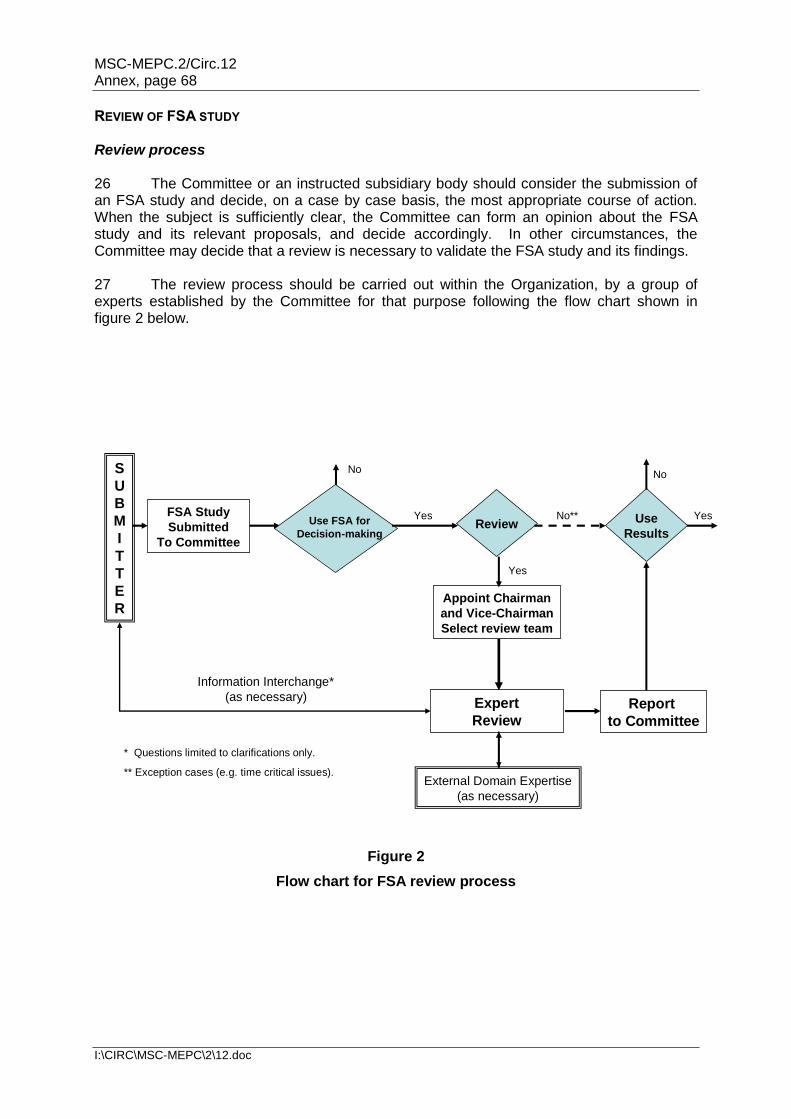
MSC-MEPC.2/Circ.12 Annex, page 68
I:\CIRC\MSC-MEPC\2\12.doc
REVIEW OF FSA STUDY Review process 26 The Committee or an instructed subsidiary body should consider the submission of an FSA study and decide, on a case by case basis, the most appropriate course of action. When the subject is sufficiently clear, the Committee can form an opinion about the FSA study and its relevant proposals, and decide accordingly. In other circumstances, the Committee may decide that a review is necessary to validate the FSA study and its findings. 27 The review process should be carried out within the Organization, by a group of experts established by the Committee for that purpose following the flow chart shown in figure 2 below.
Figure 2
Flow chart for FSA review process
S
U
B
M
I
T
T
E
R
FSA Study
Submitted
To Committee
Review
Yes
Appoint Chairman
and Vice-Chairman
Select review team
Expert
Review
Information Interchange*
(as necessary)
External Domain Expertise
(as necessary)
Report
to Committee
Use
Results
YesNo**
NoNo
YesUse FSA for
Decision-making
* Questions limited to clarifications only.
** Exception cases (e.g. time critical issues).
MSC-MEPC.2/Circ.12 Annex, page 69
I:\CIRC\MSC-MEPC\2\12.doc
Terms of reference of the Experts Group 28 The terms of reference of such a review should be established by the Committee, based on the matter under consideration. The terms of reference should be to review the FSA studies submitted, in particular to: .1 check
.1 the adequacy of scope of the FSA; and definition of the problem;
.2 the validity of the input data (transparency, comprehensiveness, availability, etc.);
.3 the adequacy of expertise of participants in the FSA; identified hazards and their ranking; and the reasonableness of assumptions; and
.4 the adequacy of accident scenarios, risk models and calculated risks; identified RCMs and RCOs; selection of RCOs for Cost-Benefit Analysis (CBA); and CBA results;
.2 check methodologies used and relevance of methods and tools for:
.1 decision in the group(s) in the FSA;
.2 HAZID;
.3 Calculation of risk;
.4 Cost-Benefit Analysis (CBA); and
.5 Sensitivity and uncertainty analysis;
.3 if any deficiency was identified in the items above, consider whether they affect the results;
.4 consider whether the FSA was conducted in accordance with the Guidelines;
.5 check whether the recommendations in the FSA ask to take any immediate action or propose any changes to IMO instruments;
.6 consider whether the results and the recommendations in the FSA are credible and advise the decision makers (e.g. Committees of the Organization) accordingly; and
.7 consider whether it is necessary to improve the FSA Guidelines, and, if so, the proposal for the improvement.
Establishment of, and report from, the Experts Group 29 When the Committee decides to establish a group of experts for a specific project, it should determine the number of meetings necessary to meet the target completion date.
30 The Members, having carried out the FSA study, should provide timely and open access to relevant supporting documents, and any reasonable opportunity to take into consideration the comments received.
MSC-MEPC.2/Circ.12 Annex, page 70
I:\CIRC\MSC-MEPC\2\12.doc
31 The results of the review by the group of experts should be presented to the Committee or instructed subsidiary body, as appropriate. The group of experts should, as a goal, try to reach consensus on its conclusions for the review of the FSA study, but where there are strong conflicting views, these should be indicated in the report. Structure of the Experts Group 32 Participation in a group of experts will be voluntary and is open to all Member Governments and international organizations. 33 A Chairman and a Vice-Chairman should be selected by the Committee when it decides an FSA study should be reviewed by a group of experts. 34 When nominating experts, Governments and international organizations should nominate experts who have suitable qualifications in the field of formal safety assessment, as described in paragraph 37, and inform the Organization of particulars of the expert (e.g. name, expertise and contact details) with a short CV. 35 Participants in the group of experts should: .1 have not been involved in the FSA study to be reviewed; and .2 be capable of acting scientifically independent (i.e. acting in an individual
capacity). 36 The review work should be conducted concisely in order to give timely conclusion(s) to the Committee(s) and, in order to do so, the review work can be conducted by holding meetings of the group (without interpretation) as well as by correspondence. Qualifications of the experts 37 Members participating in a group of experts should, as a minimum, have knowledge/training in the application of the FSA Guidelines, and should have, at least, one of the following qualifications:
.1 risk assessment experience;
.2 a maritime background; or
.3 relevant knowledge or any unique concerns related to the FSA (e.g. human element).
Report of the Experts Group 38 Experts Groups' reports should only include the names of the experts but not of the nominating Governments and organizations.
___________