REVISED EXPLORATION AND DEVELOPMENT (E&D) SCENARIO …
28
REVISED EXPLORATION AND DEVELOPMENT (E&D) SCENARIO FOR ENVIRONMENTAL IMPACT STATEMENT LEASE SALE 258 COOK INLET, ALASKA September 2021 U.S. Department of the Interior Bureau of Ocean Energy Management Alaska OCS Region
Transcript of REVISED EXPLORATION AND DEVELOPMENT (E&D) SCENARIO …

REVISED EXPLORATION AND DEVELOPMENT (E&D) SCENARIO
FOR
ENVIRONMENTAL IMPACT STATEMENT
LEASE SALE 258
COOK INLET, ALASKA
September 2021
U.S. Department of the Interior Bureau of Ocean Energy Management
Alaska OCS Region

Exploration and Development Scenario – REVISED Lease Sale 258, Cook Inlet, Alaska
Contents Exploration and Development Scenarios.............................................................................................................1
Proposed Cook Inlet OCS Oil and Gas Lease Sale 258.......................................................................................1
Exploration History .........................................................................................................................................2
Prospects..........................................................................................................................................................3
Methodology for Estimating Produced Hydrocarbon Volumes...........................................................................3
Terminology ....................................................................................................................................................3
Limiting Factors ..............................................................................................................................................3
Proxy Pools and Plays Selected.......................................................................................................................4
Range of Activities ..........................................................................................................................................6
Exploration Activities ..........................................................................................................................................7
Marine Seismic Surveys ..................................................................................................................................7
Ocean-Bottom-Cable and Ocean-Bottom-Node Seismic Survey................................................................9
3D Versus 2D Marine Seismic Surveys......................................................................................................9
Geohazard Surveys....................................................................................................................................10
Other Types of Geophysical Surveys ............................................................................................................11
Exploration and Delineation Drilling ............................................................................................................12
Drilling Wastes ..............................................................................................................................................12
Composition of Typical Drilling Mud (based on EPA, Type 2, Lignosulfonate Mud) ............................13
Development Activities .....................................................................................................................................13
Platforms and Production Wells ....................................................................................................................14
Pipelines ........................................................................................................................................................16
Transportation................................................................................................................................................17
Production Activities .........................................................................................................................................18
Timing ...........................................................................................................................................................20
Decommissioning Activities ..............................................................................................................................21
References Cited ................................................................................................................................................22
Table of Contents i

Exploration and Development Scenario – REVISED Lease Sale 258, Cook Inlet, Alaska
List of Tables Table 1: Historic Exploration Wells Drilled within the Proposed Lease Sale Area.......................................2 Table 2: Exploration Activities for the Low, Medium, and High Activity Cases........................................13 Table 3: Wells, Platforms, and Facilities for the Low, Medium, and High Activity Cases .........................16 Table 4: Pipelines for the Low, Medium, and High Activity Cases.............................................................17 Table 5: Helicopter Flight and Boat Trip Distance and Frequency for the Low, Medium, and High
Activity Cases.................................................................................................................................18 Table 6: Total Production and Peak Daily Production Rates for the Low, Medium, and High
Activity Cases.................................................................................................................................20
List of Figures Figure 1: Cook Inlet Planning Area and 2017–2022 Program Area ................................................................1 Figure 2: Ranked Proxy Oil Pools from Plays 1, 2, and 3 ...............................................................................5 Figure 3: Ranked Proxy Gas Pools from Play 4 ..............................................................................................6 Figure 4: Schedule of Well Drilling and Platform Installation for the High Activity Case ..........................14 Figure 5: Schedule of Well Drilling and Platform Installation for the Medium Activity Case .....................15 Figure 6: Schedule of Well Drilling and Platform Installation for the Low Activity Case ...........................15 Figure 7: Forecasted Annual Oil and Gas Production for the High Activity Case ........................................19 Figure 8: Forecasted Annual Oil and Gas Production for the Medium Activity Case ..................................19 Figure 9: Forecasted Annual Natural Gas Production for the Low Activity Case ........................................20
Table of Contents ii

Exploration and Development Scenario – REVISED Lease Sale 258, Cook Inlet, Alaska
Acronyms and Abbreviations 2D two-dimensional 3D three-dimensional bbl barrel(s) Bcf billion cubic feet BOEM Bureau of Ocean Energy Management COST Continental Offshore Stratigraphic Test CSEM Controlled source electromagnetic cy cubic yards dB re 1 μPa at 1m 1 micropascal at 1 meter DPP Development and Production Plan E&D Exploration and Development ft feet G&G geological and geophysical GRASP Geologic Resource Assessment Program Hz hertz in3 cubic inches kHz kilohertz km/hr kilometers per hour kn Knots LS 258 Lease Sale 258 m meters Mcf million cubic feet mi miles MM million MMbbl million barrel(s) MODU Mobile Offshore Drilling Unit NTL Notice to Lessees OBC Ocean-Bottom-Cable OBN Ocean-Bottom Node OCS Outer Continental Shelf UTRR Undiscovered Technically Recoverable Resources
Table of Contents iii

Exploration and Development Scenario – REVISED Lease Sale 258, Cook Inlet, Alaska
This page intentionally left blank.
Table of Contents iv

Planning Area
Gulf of A laska Planning Area
A laska
D Map Location
Outer Continental Shelf OIi and Gas Leasing Program
Cook Inlet Planning Area 2017-2022 Program Area
IZ3 2017 - 2 022 Program A rea
D Planning A rea Boundary
N o ~ ~ Ao ■-----=====Miles 40 60 •---===::::iKilometers
NAO 83: Alaska Albers Proj .
BO EM Alaska OCS Reg ion December 29, 2020
Exploration and Development Scenario – REVISED Lease Sale 258, Cook Inlet, Alaska
Exploration and Development Scenarios Exploration and Development (E&D) scenarios are hypothetical views of future oil and gas activities based upon professional judgment of the geologic features within an area offered for lease coupled with an analysis of current exploration and production activities. E&D scenarios provide reasonably possible sets of post-lease activities that may occur as a result of leasing. Thus, E&D scenarios are a fundamental first step for environmental analysis of potential environmental effects from a proposed lease sale. This E&D Scenario is only one possible view of how the potential resources of a proposed lease sale area could be developed. It provides a possible set of activities to frame an environmental analysis and to inform decision-makers of potential environmental effects of offering certain areas for leasing.
Proposed Cook Inlet OCS Oil and Gas Lease Sale 258 The proposed Cook Inlet Lease Sale 258 (LS 258) is listed in the 2017–2022 Outer Continental Shelf (OCS) Oil and Gas Leasing Program (National Program). The OCS is defined as all submerged lands, subsoil, and seabed belonging to the United States and lying beyond the seaward extent of state jurisdiction of 3 nautical miles pursuant to the Submerged Lands Act. The Cook Inlet Planning Area covers that portion of the OCS west of the Kenai Peninsula extending south through Shelikof Strait, bordered by the Alaska Peninsula to the west and Kodiak Island to the east (Figure 1). The Bureau of Ocean Energy Management (BOEM) considers the Cook Inlet Planning Area to be an underexplored area. Resource estimates are based on seismic data, information obtained from 13 exploratory wells, and extrapolation of geologic trends from onshore and state offshore oil and gas fields.
Unlike other Alaska OCS planning areas, the Cook Inlet Planning Area has a nearby market for both oil and gas. As a result, the current Cook Inlet E&D scenario does not defer gas sales until oil production is depleted. The existing natural gas distribution system in Southcentral Alaska could be extended to transport gas from the Cook Inlet OCS to the greater Anchorage and Kenai Peninsula areas.
Figure 1: Cook Inlet Planning Area and 2017–2022 Program Area
The Cook Inlet Program Area, as defined in the 2017–2022 National Program, is the same as the area proposed for LS 258. It is confined to the northernmost part of the planning area. The southern boundary
1

Exploration and Development Scenario – REVISED Lease Sale 258, Cook Inlet, Alaska
of the proposed lease sale area is located along the Seldovia Arch. This arch marks the southern margin of the Cook Inlet Basin proper. BOEM estimates that, within the proposed lease sale area, an undiscovered economic resource in 2 fields of approximately 192.3 MMbbl of oil, and 301.9 billion cubic feet (Bcf) of natural gas could be discovered and developed as a result of LS 258.
Exploration History All the oil and gas fields developed in the Cook Inlet Basin to date are in State of Alaska waters or onshore. Richfield Oil Corporation discovered the first oil field at Swanson River on the Kenai Peninsula in 1957. Oil production began in 1959, along with a small amount of gas as a by-product. Unocal discovered the first significant gas field at Kenai in 1959 and production began in 1961. Pan American Oil Corp. discovered the first offshore oil field at Middle Ground Shoal in 1962. Offshore oil production began in 1967. Amoco discovered the first offshore gas field at North Cook Inlet in 1962, and production began in 1969. Sixteen offshore platforms are currently active north of the proposed lease sale area; the latest was installed in 2000 by Forest Oil at the Redoubt Shoal Field.
The first OCS well drilled in Lower Cook Inlet was the Arco Continental Offshore Stratigraphic Test (COST) well in 1977. This COST well was drilled under the direction of the Department of the Interior’s Minerals Management Service to provide geologic information pertinent to competitive bidding for offshore tracts. There will be no COST wells drilled in the Cook Inlet OCS in support of LS 258. The first federal lease sale, OCS Sale CI, was held in 1977 and 87 leases were awarded. The second lease sale, OCS Sale 60, was held in 1981 and 13 leases were awarded. From 1978 through 1985, 13 exploratory wells were drilled to test 10 prospects in Lower Cook Inlet. Three of those wells (Arco Y-0097, Chevron Y-0243, and Marathon Y-0086) were abandoned at shallow depths because of drilling problems and were re-drilled at approximately the same locations. All the wells were plugged and abandoned with no discoveries announced but two wells (Marathon Y-0086 and Arco Y-0097) had significant oil shows in Late Cretaceous strata. The Marathon Y-0086 well and the Arco Y-0097 well tested non-commercial oil with very low flow rates and the Chevron Y-0243 well had minor oil shows but was not tested. Both the Marathon Y-0086 and Arco Y-0097 wells tested areas that were leased in the most recent Cook Inlet OCS lease sale in 2017 (Lease Sale 244). Table 1 shows the historic exploration wells drilled within the proposed sale area. Two leases were awarded in Lease Sale 149, held in 1997, but no drilling occurred on the leases. Although Lease Sale 191, which was proposed in 2004, included preparation of an environmental impact statement and both proposed and final notices of sale, the sale was not held because industry failed to submit any bids. The most recent Cook Inlet Lease Sale, Lease 244, was held in 2017 and 14 leases were awarded.
PROSPECT WELL NAME
SALE No.
SPUD DATE
END DATE
DAYS TO
DRILL DRILLING UNIT API
No. Water Depth
(ft)
GUPPY Y-0086 LCI 7/21/1978 12/22/1978 154.00 DIAMOND M
DRAGON DRILLSHIP
55-220-00003 120
HAWK Y-0161 LCI 7/15/1979 1/21/1980 190.00 DAN PRINCE JACK-UP
55-250-00001 133
RAVEN Y-0097 LCI 4/6/1980 5/29/1980 53.00 DAN PRINCE JACK-UP
55-220-00002 192
FALCON Y-0243 60 9/19/1984 11/12/1984 54.00 KEY HAWAII JACKUP
55-220-00009 115
Table 1: Historic Exploration Wells Drilled within the Proposed Lease Sale Area
In the proposed lease sale area, a total of four exploration wells have been drilled as the result of lease sales held in 1977 and 1981. None of the four exploration wells discovered oil or natural gas in economic quantities and the last exploration well drilled was plugged and abandoned in 1984. These exploration wells tested the prospects likely to have the largest volumes of oil or natural gas given the knowledge at
2

Exploration and Development Scenario – REVISED Lease Sale 258, Cook Inlet, Alaska
the time. The high activity case in the E&D Scenario estimates the drilling of up to eight exploration and delineation wells over a 3-year time period.
Prospects Cook Inlet is part of a large forearc basin that lies between the Aleutian Trench and the active volcanic arc on the Alaska Peninsula. The southeastern boundary of the basin is the Border Ranges fault, which separates the sedimentary basin from the metamorphic rocks of a large accretionary complex exposed in the Chugach and Kenai Mountains. The northwestern boundary of the basin is the Bruin Bay fault, which separates the basin from igneous rocks of the Alaska-Aleutian Range batholith exposed on the Alaska Peninsula. The basin-bounding faults and most of the subsurface structural features trend northeast-southwest parallel to the axis of the basin. The Augustine-Seldovia Arch, which is oriented east-west transverse to the main structural trend, separates the forearc basin into two depocenters. The proposed lease sale area and hypothetical developments that could result from leasing used to develop the E&D Scenario are located in the northern depocenter, along with the commercial fields of the northern Cook Inlet.
Methodology for Estimating Produced Hydrocarbon Volumes
Terminology • Pool – An undiscovered subsurface accumulation of oil and gas.
• Proxy Pool – A hypothetical pool determined by statistical analysis using computer simulations with Geologic Resource Assessment Program (GRASP) software.
• Prospect – A prospect is a geologic feature that has the potential for having trapped oil and gas. The volume of trapped oil and gas can be estimated by mapping the size and thickness of the reservoir in the prospect. These are estimates of undiscovered resources, and there is a chance that no oil or gas will be present. Only exploratory and delineation drilling will indicate the true volume of recoverable resources, if any.
• Play – A play is a group of prospects that share similar characteristics. These prospects may have the same reservoirs, the same oil sources, or may have formed under the same natural conditions. A play containing tested oil and gas pools is called a proven play. A play can include dozens of separate oil and gas pools tens of miles apart.
• Field – A field is a prospect that has been drilled and proven to contain recoverable oil or gas. The volume of oil or gas is known with much more certainty than the estimated undiscovered resources in an undrilled prospect. However, the true reserve volume may only be known decades into the future after the field is totally produced.
Limiting Factors Two proxy pools were selected for analyzing the potential discovery and development for LS 258. These two proxy pools, assumed to be discovered and produced, represent the highest level of activity expected to occur. The following are factors that could limit the number of discoveries and developments that could result from the sale:
• Not all tracts offered for lease will receive bids. Many prospects may go unleased.
• Not all tested prospects will result in commercially viable fields. Using the past to predict future activity in the Cook Inlet OCS, operators would likely purchase some leases, drill a few exploratory wells, and relinquish the leases if commercial quantities of oil or gas are not encountered.
3

Exploration and Development Scenario – REVISED Lease Sale 258, Cook Inlet, Alaska
• The price of oil could fall to a level that renders exploration and development uneconomic. BOEM’s 2021 National Assessment estimates the undiscovered economically recoverable resource volume, for oil at $60/bbl, is 430.86 million barrels (MMbbl) and for natural gas, at $6.41/Million cubic feet (Mcf), is 166.76 Bcf in Cook Inlet.
• Not all fields are likely to be produced because the revenue generated would not cover the capital and operating expenses to develop small fields.
• Operator/lessee investment in Cook Inlet leases must compete globally with other opportunities identified by the operator/lessee.
• The primary term of a lease is up to a maximum of 10 years. If a commercial discovery is not made within the primary lease term, those leases will expire.
• The operators/lessees may not have the financial capability to drill exploration wells on all the leases purchased.
• Seasonal limitations will limit the number of exploration wells that can be drilled.
Because it is impossible to predict where, when, and how much oil and gas will be discovered for a given lease sale, professional judgment and geologic modelling are used to select proxy pools as a basis for developing E&D scenarios. An assumption was made when developing this E&D Scenario that exploration is successful and economic viability exists, invoking the aggressive pursuit of prospect exploration.
Proxy Pools and Plays Selected Proxy hydrocarbon pools are derived from the GRASP software package used by BOEM to estimate the Undiscovered Technically Recoverable Resources (UTRR) for the OCS National Assessment.
Any data available for the plays are analyzed through the subjective method using GRASP. The subjective method relies less on historical records of exploration efforts and more on descriptive geologic characteristics of an area, basin, or play. The quantities of undiscovered oil and gas are then estimated by quantifying volumetric reservoir variables and estimating the number and size of accumulations expected to exist. Distributions of reservoir variables are subjectively prepared, and through GRASP simulations, ranked pool size distributions are generated for each play.
The ranked pool sizes generated from GRASP are used to select the proxy hydrocarbon pools to be used for E&D scenarios. OCS Monograph MMS 98-0054 Chapter 9 details how GRASP software is used to assess undiscovered oil and gas (USDOI MMS, 1998).
Proxy pools selected for LS 258 were based on the following assumptions:
• The largest pools in a basin are discovered first because they are statistically the easiest to find.
• Once a field is discovered in a given play, there is a higher probability of more pools being discovered in that play.
• Operators interested in LS 258 would likely acquire multiple leases over several prospects. Typically, operators will not have the financial resources or the motivation (based on prior drilling results) to explore all of their prospects, reducing the likelihood of multiple large discoveries by a single operator. Historically this has been the case for all OCS Planning Areas.
Cook Inlet OCS plays were ranked, based on GRASP model results, to identify those with the greatest potential for oil and gas field discoveries. Four plays with the largest hydrocarbon volumes were initially considered for the selection of proxy pools. Ranked based on the summed volume of hydrocarbons, those plays were:
4
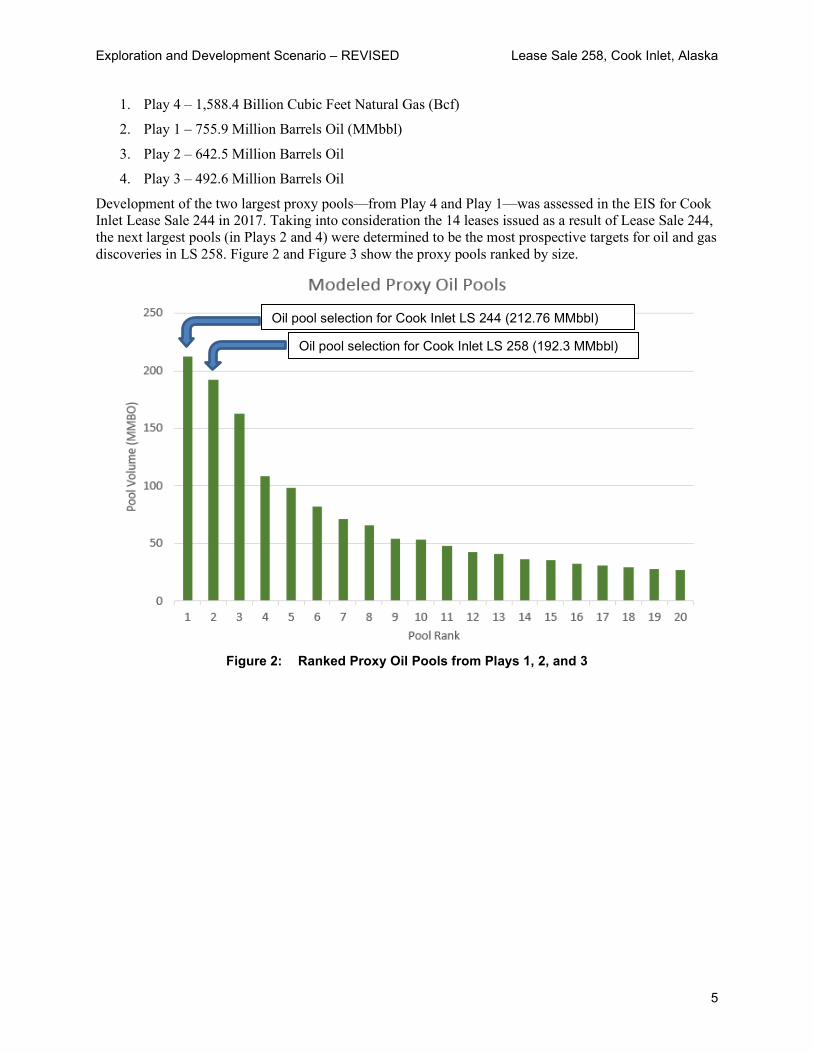
1. Play 4 – 1,588.4 Billion Cubic Feet Natural Gas (Bcf)
2. Play 1 – 755.9 Million Barrels Oil (MMbbl)
3. Play 2 – 642.5 Million Barrels Oil
4. Play 3 – 492.6 Million Barrels Oil
Development of the two largest proxy pools—from Play 4 and Play 1—was assessed in the EIS for Cook Inlet Lease Sale 244 in 2017. Taking into consideration the 14 leases issued as a result of Lease Sale 244, the next largest pools (in Plays 2 and 4) were determined to be the most prospective targets for oil and gas discoveries in LS 258. Figure 2 and Figure 3 show the proxy pools ranked by size.
250
200
0 a,
::E 150 ~ ., E :::,
0 > 100 g Q.
50
0
Modeled Proxy Oil Pools
' ,,__L_.---=1==========:::::!,
'
I I I I I I I I I I I I I I 1 2 3 4 5 6 7 8 9 W ll U ll M ~ ~ IT IB ~ W
Pool Rank
Oil pool selection for Cook Inlet LS 244 (212.76 MMbbl)
Oil pool selection for Cook Inlet LS 258 (192.3 MMbbl)
Exploration and Development Scenario – REVISED Lease Sale 258, Cook Inlet, Alaska
Figure 2: Ranked Proxy Oil Pools from Plays 1, 2, and 3
5
' ' I I I I I I I I I I I I ■ ■ ■
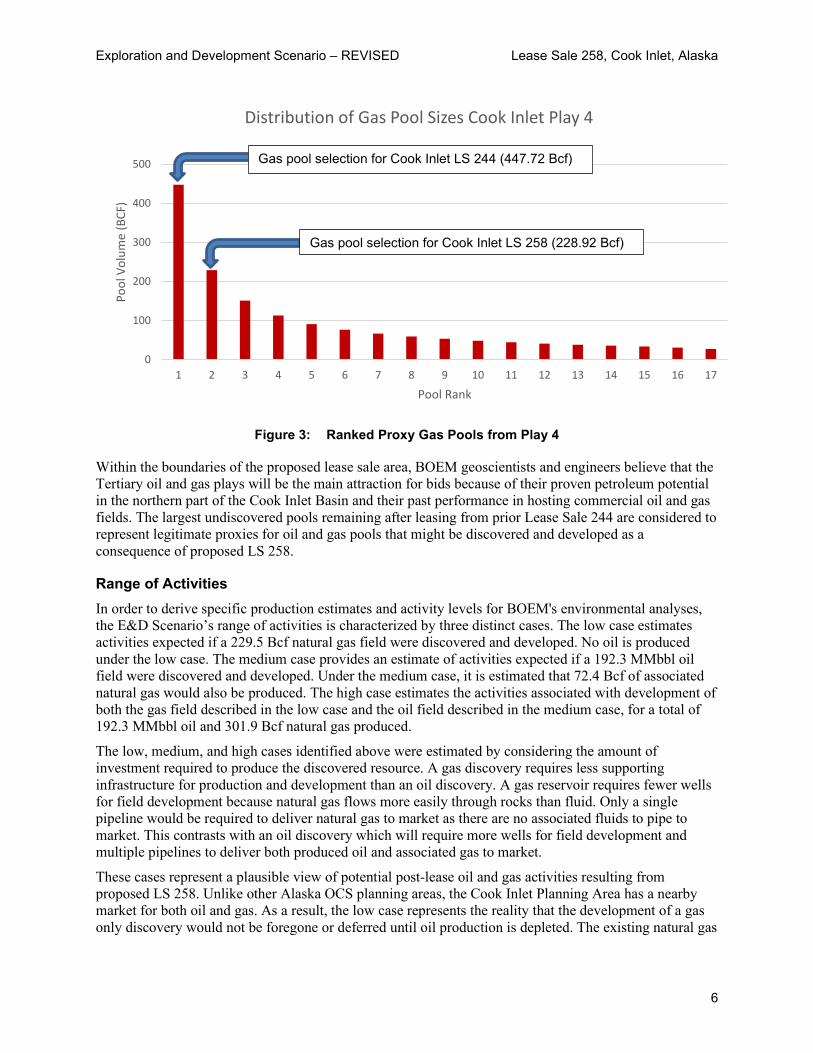
Distribution of Gas Pool Sizes Cook Inlet Play 4
500 Gas pool selection for Cook Inlet LS 244 (447.72 Bcf)
400
300
200
100
0
Pool Rank
Pool
Vol
ume
(BCF
)
Gas pool selection for Cook Inlet LS 258 (228.92 Bcf)
1 2 3 4 5 6 7 8 9 10 11 12 13 14 15 16 17
Exploration and Development Scenario – REVISED Lease Sale 258, Cook Inlet, Alaska
Figure 3: Ranked Proxy Gas Pools from Play 4
Within the boundaries of the proposed lease sale area, BOEM geoscientists and engineers believe that the Tertiary oil and gas plays will be the main attraction for bids because of their proven petroleum potential in the northern part of the Cook Inlet Basin and their past performance in hosting commercial oil and gas fields. The largest undiscovered pools remaining after leasing from prior Lease Sale 244 are considered to represent legitimate proxies for oil and gas pools that might be discovered and developed as a consequence of proposed LS 258.
Range of Activities In order to derive specific production estimates and activity levels for BOEM's environmental analyses, the E&D Scenario’s range of activities is characterized by three distinct cases. The low case estimates activities expected if a 229.5 Bcf natural gas field were discovered and developed. No oil is produced under the low case. The medium case provides an estimate of activities expected if a 192.3 MMbbl oil field were discovered and developed. Under the medium case, it is estimated that 72.4 Bcf of associated natural gas would also be produced. The high case estimates the activities associated with development of both the gas field described in the low case and the oil field described in the medium case, for a total of 192.3 MMbbl oil and 301.9 Bcf natural gas produced.
The low, medium, and high cases identified above were estimated by considering the amount of investment required to produce the discovered resource. A gas discovery requires less supporting infrastructure for production and development than an oil discovery. A gas reservoir requires fewer wells for field development because natural gas flows more easily through rocks than fluid. Only a single pipeline would be required to deliver natural gas to market as there are no associated fluids to pipe to market. This contrasts with an oil discovery which will require more wells for field development and multiple pipelines to deliver both produced oil and associated gas to market.
These cases represent a plausible view of potential post-lease oil and gas activities resulting from proposed LS 258. Unlike other Alaska OCS planning areas, the Cook Inlet Planning Area has a nearby market for both oil and gas. As a result, the low case represents the reality that the development of a gas only discovery would not be foregone or deferred until oil production is depleted. The existing natural gas
6

Exploration and Development Scenario – REVISED Lease Sale 258, Cook Inlet, Alaska
distribution system in Southcentral Alaska could be extended to transport gas from the Cook Inlet OCS to the greater Anchorage and Kenai Peninsula areas.
To produce the estimated 192.3 MMbbl of oil, and 301.9 Bcf of natural gas in the high case, a maximum of 6 24-slot platforms will be required, from which 108 wells (production and service) would be drilled. The scenario assumes separate platforms and production wells are required to produce from each prospect. If exploration drilling suggests that hydrocarbon-bearing prospects overlie each other, then they could possibly be produced through multiple completions of a single production well, reducing the project footprint. To avoid underestimating the well numbers for the environmental analyses, this scenario does not assume that wells could be repurposed. Natural gas associated with oil production under the medium and high cases would be separated and sold to the local distribution market. This has been the approach to development of offshore oil fields in state of Alaska waters in northern Cook Inlet (see tabulations of service well types; AOGCC, 2004; and AK DOG, 2009, Table I.6) where associated gas is marketed, and pressure maintenance is provided by water injection.
Exploration Activities
Marine Seismic Surveys Seismic exploration is the primary tool to determine places to explore for subsurface deposits of crude oil and natural gas. Recording, processing, and interpreting reflected seismic waves, created by introducing controlled source energy (such as seismic airgun impulses, sonar signals, and vibratory waves) into the earth, provides a means to identify rock structures that may form traps for petroleum migrating upwards from thermal generation centers. Only four exploratory wells have been drilled in the proposed lease sale area, and operators will likely need to conduct seismic surveys prior to drilling additional exploratory wells.
A geologic and geophysical permit is required to perform seismic surveying. Possession of a lease is not necessary to apply for a data acquisition permit. Seismic activity is analyzed here because, if a lease sale were held and leases issued, it would presumably create interest in performing additional surveys. Additionally, a geohazard survey is a required component of an Exploration Plan and of a Development and Production Plan (DPP), which must be approved before a well drilling permit may be issued.
The E&D model considers two types of seismic surveys: 1) deep penetrating marine seismic surveys, which generally cover a large area of leased and/or unleased acreage; and 2) geohazard surveys, which include side-scan sonar and shallow-penetrating reflection-seismic profiling conducted to detect archeological resources or seafloor features that might be problematic for operations, such as drilling a well or installing a platform or pipeline on a more specific site. Geohazard surveys are often accompanied by geotechnical surveys, which involve core sampling or measuring mechanical properties or stability of nearby seafloor sediments.
The two-dimensional (2D) and three-dimensional (3D) deep penetrating marine seismic surveys use similar survey methods, but different operational configurations. Generally, 3D survey lines are spaced more closely together and concentrated in a specific area of interest. These surveys provide the resolution needed for detailed geological evaluation. A 2D survey provides less detailed geological information because the survey lines are spaced farther apart. These surveys are used to cover wider areas to map geologic structures on a regional scale.
Seismic surveys are often characterized by the type of data being collected (e.g., 2D, 3D, high-resolution), by the acoustic sound source (e.g., airgun, water gun, sparker, pinger), or by the purpose for which the data are being collected (e.g., speculative shoot, exclusive shoot, site clearance).
Seismic surveys may be described by the configuration of the survey and/or the location of the receivers. Vertical seismic profiling and vertical cable surveys both use standard seismic sources and do not need to
7

Exploration and Development Scenario – REVISED Lease Sale 258, Cook Inlet, Alaska
be discussed separately from standard seismic surveys. Multi-azimuth and full-azimuth coil pattern surveys also use a standard source and single source/receiver vessel. A wide-azimuth survey consists of multiple source vessels and at least one receiver vessel. A rich-azimuth survey incorporates the multiple source vessel survey with a multi-azimuth survey configuration. To date, no azimuth-style survey has been performed in the Alaska OCS, but they are common elsewhere.
An energy source (e.g., airgun, water gun, sparker, or pinger) is used to transmit energy into the subsurface and generate seismic waves. Seismic waves reflect and refract off subsurface strata and travel back to acoustic receivers, called hydrophones. The characteristics of the reflected seismic waves, such as travel time and intensity, are used to evaluate geologic structures, subsurface deposits, and natural resources to help facilitate the location of prospective drilling targets. Streamers are the passive listening equipment, consisting of multiple hydrophone elements normally towed behind the vessel. Biodegradable liquid paraffin is used to fill the streamer and provide buoyancy. Solid/gel streamers also are available for use and are rapidly becoming the industry standard.
The most commonly used marine energy sources are airguns, which emit highly compressed air bubbles that transmit acoustic energy though the water column and into the subsurface. An individual airgun size can range from five to 1,500 cubic inches (in3) (0.081 to 24.58 liters). A combination of airguns is called an array. Operators vary the source-array size to optimize the resolution of the seismic data collected. Airgun array sizes for 2D/3D deep penetration seismic surveys in Cook Inlet are expected to range from 1,800–5,000 in3 (29.50 to 81.94 liters) but may range up to 6,000 in3 (98.32 liters). Airguns are fired at short, regular intervals so the arrays emit pulsed, rather than continuous, sound. While most of the energy is focused downward and the short duration of each pulse limits the total energy transmitted into the water column, the sound can propagate horizontally for several kilometers (Greene and Richardson, 1988; Hall et al., 1994).
Marine deep penetration towed-streamer 3D seismic surveys vary markedly depending on survey design specifications, subsurface geology, water depth, and target reservoir(s). Individual survey parameters may vary from the descriptions presented here. The vessels conducting these surveys generally are 70–120 meters (m) (230–394 ft) long. Vessels tow 1 to 3 source arrays of 6 to 9 airguns each, depending on the survey design specifications required for the geologic target. Most operations use a single source vessel. However, more than one source vessel will be used in wide or rich azimuth surveys or when using smaller vessels, which cannot provide a large enough platform for the total seismic gun array necessary to obtain target depth. The overall energy output for the permitted activity will be the same, but the firing of the source arrays on the individual vessels will be alternated.
Vessel transit speeds are highly variable, ranging from 8–20 knots (kn) (14.8 to 37.0 kilometers (km)/hour) depending on a number of factors including, but not limited to, the vessel itself, sea state, and urgency (the need to run at top speed versus normal cruising speed). Marine 3D surveys are acquired at typical vessel speeds of approximately 4.5 kn (8.3 km/hour). The source array is triggered approximately every 10–15 seconds (s), depending on vessel speed. The timing between shots varies and is determined by the spacing required to meet the geological objectives of the survey. Typical spacing is either 25 or 37.5 m (82 or 123 ft) but may vary depending on the design and objectives of the survey. Airguns can be fired between 20 and 70 times per km. Modern marine-seismic vessels can tow up to 20 streamers with an equipment-tow width of up to approximately 1,500 m (4,921 ft) between outermost streamers.
The 3D survey data are acquired along pre-plotted track lines within a specific permitted survey area. Adjacent track lines for a 3D survey are generally spaced parallel to each other several hundred meters apart. The areal extent of the equipment limits both the turning speed and the area a vessel covers. It is therefore common practice to acquire data using an offset racetrack pattern, whereby the next acquisition line is several km away from, and traversed in the opposite direction of, the track line just completed. Seismic vessels operate day and night, and a survey may continue for days, weeks, or months depending on the size of the survey, data-acquisition capabilities of the vessel, and weather or ice conditions. Vessel
8

Exploration and Development Scenario – REVISED Lease Sale 258, Cook Inlet, Alaska
operation time includes not only data collection, but also deployment and retrieval of gear, line turns between survey lines, equipment repair, and other planned or unplanned operations.
The 2D seismic survey vessels generally are smaller than 3D survey vessels; however, larger 2D survey vessels are also able to conduct 3D surveys. The source array typically consists of three or more sub-arrays of six to eight airgun sources each but may vary as newer technology is developed. Only one streamer is towed during 2D operations. Seismic vessels acquiring 2D data are able to acquire data at 4 to 5 kn (7.4 to 9.3 km/hour) and collect between 85–110 line-miles (137 to 177 line-km) per day, depending on the distance between line changes, weather conditions, and downtime for equipment problems. Typically, a survey vessel can collect 5,000–8,000 line-miles (8,047 to 12,875 line-km) during an open water seismic operational season.
At least one support vessel would be used for safety considerations, general support, maintenance, and resupply of the main vessel, but it would not be directly involved with the collection of seismic data. Crew changes, refueling, and resupply for seismic vessels are generally on a four to six-week schedule. Helicopters may be used for vessel support and crew changes if there are no safety concerns. An additional support vessel may be used to monitor for marine mammals ahead of the survey vessel.
Ocean-Bottom-Cable and Ocean-Bottom-Node Seismic Survey
Ocean-bottom-cable (OBC) and Ocean-bottom-node (OBN) seismic surveys are used in Alaska primarily to acquire deep penetrating seismic data in transitional zones where water is too shallow for a seismic survey vessel or, in the case of Cook Inlet, where the tides make 3D acquisition with streamers very difficult due to problems keeping the streamer straight in the tidal currents. The OBC/OBN seismic survey requires the use of multiple vessels. A typical survey includes: two vessels for cable layout/pickup, one vessel for recording, one or two source vessels, and possibly one or two smaller (10–15 m (33-49 ft)) utility boats.
Most operations use a single source vessel, but multiple source vessels may be used if size prohibits loading the full airgun array on one vessel. The overall energy output for the permitted activity would be the same for a two-vessel shoot, as the source arrays alternate vessels when firing. These vessels are generally smaller than those used in towed-streamer operations. OBC/OBN seismic arrays are frequently smaller in size than the towed marine streamer arrays due to the shallower water depths in which OBC surveys are usually conducted.
An OBC/OBN operation begins by laying cables or nodes off the back of the layout boat. Cable or node length typically is 4–6 km (2.5–3.7 mi) but can be up to 12 km (7.5 mi). Groups of seismic-survey receivers (usually a combination of both hydrophones and vertical-motion geophones) are attached to the cable in intervals of 12–50 m (39–164 ft). Multiple cables are laid on the seafloor parallel to each other, with a cable spacing of between hundreds of meters to several kilometers, depending on the geophysical objective of the seismic survey. When the cable is in place, a vessel towing the source array passes over the cables with the source being activated every 25 m (82 ft). The source array may be a single or dual array of multiple airguns, which is similar to the 3D marine seismic survey.
3D Versus 2D Marine Seismic Surveys
Marine-streamer 3D seismic surveys vary markedly from typical 2D seismic surveys because the survey lines are more closely spaced and are concentrated in a particular area. The specifications of a 3D survey depend on needs, the subsurface geology, water depth, and geological target. A sound source array typically consists of 2 to 3 subarrays of 6 to 9 airguns each. The size of the source-array can vary during the seismic survey to optimize the resolution of the geophysical data collected at any site. The energy output of the array is determined more by the number of guns than by the total array volume (Fontana, 2003, pers. comm.). Vessels usually tow up to three source arrays, depending on the survey-design
9

Exploration and Development Scenario – REVISED Lease Sale 258, Cook Inlet, Alaska
specifications. Most operations use a single source vessel, however, in a few instances more than one source vessel is used.
The sound-source level (zero-to-peak) associated with typical 3D seismic surveys ranges between 233 and 255 decibels relevant to 1 micropascal at 1 meter (dB re 1 μPa at 1 m) with most of the energy emitted between 10 and 120 Hz. Marine 3D surveys are acquired at typical vessel speeds of 4.5 kn (8.3 km/hour). A source array is activated approximately every 10 to 15 seconds, depending on vessel speed. The timing between outgoing sound signals can vary for different surveys to achieve the desired “shot point” spacing to meet the geological objectives of the survey; typical spacing is 25 or 37.5 m.
The receiving streamer arrays for a 3D survey could include multiple (4–16) streamer-receiver cables towed behind the source array. Streamer cables contain numerous hydrophone elements at fixed distances within each cable. Each streamer can be 3–8 km long with an overall array width of up to 1,500 m between outermost streamer cables.
Gridded 2D seismic data of a range of vintages and qualities exist for the Cook Inlet Basin that are a legacy of past exploration programs. This data may not meet the requirements necessary to conduct detailed modern seismic interpretation. The E&D Scenario assumes one deep penetrating marine seismic survey will occur during exploration regardless of whether the low, medium, or high development case occurs. This assumption is based on a lessee requiring additional seismic information beyond that which is available from existing information.
The survey is likely to be a 3D survey focused on clusters of tracts offering resource potential as identified in regional surveys. Due to the high cost of conducting seismic surveys, it is more likely that a survey company would collect multi-client data and license it to prospective bidders than it is for an individual lessee to collect data over a small number of tracts. Any OCS seismic survey is likely to occur in the late summer or early fall to minimize conflicts with other public and commercial users in the Cook Inlet. The most likely support base for seismic exploration would be Kenai/Nikiski or alternate locations in the Cook Inlet (Homer, Anchorage).
Geohazard Surveys
Prior to submitting an EP or DPP, operators are required to evaluate potential geological hazards and document any potential cultural resources or benthic communities pursuant to 30 CFR Part 550. BOEM has provided guidelines in Notices to Lessees (NTLs) 05-A01, 05-A02, and 05-A03 that provide guidance on the collection of high-resolution shallow hazards surveys to ensure safe conduct and operations in the OCS at drill sites and along pipeline corridors, unless the operator can demonstrate that there is sufficient existing data to evaluate the site.
The suite of equipment used during a typical shallow hazards survey consists of: single beam and multibeam echosounders which provide water depths and seafloor morphology; a side scan sonar that provides acoustic images of the seafloor; a subbottom profiler which provides 20–200 m (66–656 ft) sub-seafloor penetration with a 6–20 cm (2.4–7.9 inches (in)) resolution; a bubble pulser or boomer with 40– 600 m (131–1,969 ft) sub-seafloor penetration; and a multichannel seismic system with 1,000–2,000 m (3,280–6,562 ft) sub-seafloor penetration. Typical acoustic characteristics of these sources are summarized in Richardson et al. (1995) as following: • Echosounders: 180-200 dB re 1 µPa at 1 m between 12 and 60 kHz • Side scan sonar: 220-230 dB re 1 µPa at 1 m between 50 and 500 kHz • Subbottom profiler: 200-230 dB re 1 µPa at 1 m between 400 Hz and 30 kHz • Bubble pulser or boomer: 200 dB re 1 µPa at 1 m below 1 kHz
The echosounders and subbottom profilers are generally hull-mounted. All other equipment is usually towed behind the vessel. The towed multichannel seismic system consists of an acoustic source which
10

Exploration and Development Scenario – REVISED Lease Sale 258, Cook Inlet, Alaska
may be a single small airgun 10-to-65 in3 (0.16 to 1.1 liters) or an array of small airguns usually two or four 10 in3 (0.16 liter) guns. The source array is towed about 3 m (9.8 ft) behind the vessel with a firing interval of approximately 12.5 m (41 ft) or every 7 to 8 seconds. A single 300–600 m (984–1,969 ft), 12– 48 channel streamer with a 12.5 m (41 ft) hydrophone spacing and tail buoy is the passive receiver for the reflected seismic waves.
The ship travels at 3–4.5 kn (5.6–8.3 km/hour). These survey ships are designed to reduce vessel noise, as the higher frequencies used in high-resolution work are easily masked by the vessel noise if special attention is not paid to keeping the ships quiet. Surveys are site specific and can cover less than one lease block, but the survey extent is determined by the number of potential drill sites in an area. BOEM guidelines in NTL-A01 require data to be gathered on a 150 by 300 m (492 by 984 ft) grid within 600 m (1,969 ft) of the surface location of the drill site, a 300 by 600 m (984 by 1,969 ft) grid along the wellbore path out to 1,200 m (3,937 ft) beyond the surface projection of the conductor casing and extending an additional 1,200 m beyond that limit with a 1,200 by 1,200 m grid out to 2,400 m (7,874 ft) from the well site.
A single vertical well site survey will collect about 46 line-miles (74 line-km) of data per site and take approximately 24 hours. If there is a high probability of archeological resources, the 150 by 300 m (492 by 984 ft) grid must extend to 1,200 m (3,937 ft) from the drill site.
Other Types of Geophysical Surveys Measurements of electrical resistivity beneath the seafloor have been used in oil and gas exploration but historically have been collected through the wire-logging of wells. Since 2002, several electromagnetic methods have been developed for mapping sub-seafloor resistivity, including marine controlled source electromagnetic (CSEM) sounding (Eidesmo et al. 2002). This method uses a mobile horizontal electric dipole source and an array of seafloor electric receivers. The transmitting dipole emits a low frequency (typically 0.5 to 10 Hertz (Hz)) electromagnetic signal into the water column and into the underlying sediments. Electromagnetic energy is attenuated in the conductive sediments, but in higher resistive layers (such as hydrocarbon-filled reservoirs), the energy is less attenuated. This contrast is what is detected to provide data on potential areas of interest. The length of the dipole varies between 10–50 m (33–164 ft) and the system is towed at approximately 24–40 m (79–131 ft) above the seafloor at a speed of 2.7 kn.
Gravity surveys have been used for years in the oil and gas industry. State of the art gravity meters can sense differences in the Earth’s gravitation acceleration to one part in one billion. Because of their high sensitivity, these instruments can detect mass variations in the crustal geology, possible indicators of fault displacement and geologic structures favorable to hydrocarbon generation.
In 1994, the U.S. Department of Defense declassified the 3D full tensor gradiometer. This allowed the gravity field gradient to be determined by using accelerometers to measure the spatial multi-components of gravity. The equipment utilized for gradiometry surveys is much more complex than that of traditional gravity surveys. The new gravity data are evaluated in three dimensions instead of two dimensions in traditional gravity surveys and can better define subsurface bodies of varying densities.
The increase in gravity data resolution provided by the 3D full tensor technology has allowed the geology below salt to successfully be imaged in the Gulf of Mexico. This technology could be used in the Cook Inlet OCS as a method for identifying features such as basins and edges but would not replace 3D seismic. Regardless of whether the low, medium, or high activity case occurs, the E&D Scenario assumes one airborne gravity survey because it is a relatively low-cost, fast, and accurate method for obtaining additional geophysical information.
Operators will determine the location of exploratory wells based on mapping of subsurface structures based on 2D and 3D deep-penetration seismic data. Prior to drilling exploration wells, operators will examine the proposed exploration drilling locations for geologic hazards and archeological features using
11

Exploration and Development Scenario – REVISED Lease Sale 258, Cook Inlet, Alaska
geohazard seismic surveys and geotechnical studies, together referenced as geological and geophysical (G&G) surveys. Site clearance and other studies required for exploration will be conducted, normally the season before the drill rig is mobilized to the site.
The E&D Scenario expects a range of 1 to 6 G&G surveys may occur as a result of LS 258. It is assumed that the required (G&G) surveys for exploration drilling by an operator can usually be completed with a single survey. Additional G&G surveys are then required for placement of infrastructure on the seafloor such as pipelines and platforms.
Exploration and Delineation Drilling Exploration drilling operations are likely to employ Mobile Offshore Drilling Units (MODUs). Examples of MODUs include drillships, semisubmersibles, and jack-up rigs. Drilling operations in Cook Inlet are expected to range between 30 and 60 days at different well sites, depending on the depth of the well, delays during drilling, and time needed for well logging and testing operations.
BOEM estimates three wells per drilling rig could be drilled, tested, and abandoned/plugged during a single drilling season using one MODU. While the proposed lease sale area remains relatively ice-free during the winter, the unpredictability of winter weather conditions may limit drilling operations either by logistics or the additional expense required to conduct winter operations. After a field is discovered by an exploratory well, an operator will use MODUs to drill delineation wells to determine the volume of hydrocarbons within the field. Operators need to verify that enough volumes of oil or gas are present to justify the expense of installing a production platform and pipelines.
It is assumed that only one MODU would be used in the proposed lease sale area as a result of LS 258. This is based upon the number of exploration wells anticipated under this scenario, the number of years that exploratory drilling might be conducted and the number of wells which can be drilled by a single rig during a drilling season. It is conceivable that another rig may be operating on leases issued under Lease Sale 244, but historically there has only been one MODU working in the proposed lease sale area at one time (see Table 1). As of December 2020, there are two MODUs in Cook Inlet; both are currently out of service (PNA, 2020).
Delineation drilling would be followed by permitting activities for the OCS development project, including the submission of a DPP by the operator that would trigger further environmental review by BOEM. If the project is approved, the design, fabrication, and installation of each platform could take another two to three years. Offshore and onshore pipeline permitting, and construction would occur simultaneously with the offshore platform work. This E&D Scenario assumes that an operator will commission subsequent platforms without an extended period of evaluation of the initial wells. Setting the platforms and drilling the production wells would occur over a period of 15 years.
Based on the size and reservoir characteristics of the proxy pools identified above, as many as eight wells might be associated with exploring and delineating these prospects, including unsuccessful exploration wells on other prospects in the proposed lease sale area, the drilling of which could be prompted by news of the first commercial discovery. Successful exploration and delineation wells could be converted to production wells. However, to provide environmental analysts with the maximum well count, this Scenario assumes that exploration and delineation wells will be plugged with cement and new wells must be drilled for production. Unlike other Alaska OCS areas with limited infrastructure, the gas associated with oil production from Cook Inlet can be brought to market at the same time as the oil production.
Drilling Wastes Based on analysis of historic exploration wells in the Cook Inlet OCS, exploration and delineation wells will average about 6,000 feet in true vertical depth. The average exploration or delineation well will produce approximately 9,000 bbl of mud and 588 cubic yards (cy) of dry rock cuttings. BOEM assumes that drilling wastes (muds and cuttings) will be disposed of at the 3 to 8 drilling sites that are scattered
12

Exploration and Development Scenario – REVISED Lease Sale 258, Cook Inlet, Alaska
throughout the Cook Inlet lease sale area. If a discovery is made, development wells might average 7,500 feet in measured depth. Most development wells are drilled at an angle, rather than straight down, making the drilled distance of a typical development well longer than an exploration well drilled to the same formation. The average development well will produce approximately 588 cy of dry rock cuttings. Drilling fluids will be reused or injected into disposal wells; cuttings will be either treated, ground, and injected into a designated disposal well or barged to an onshore disposal site.
Well operations use a variety of drilling fluids, each with a different composition. The type of drilling fluid used depends on its availability, the geologic conditions, and experiences of the drilling contractor. Often, several different types of drilling fluids are used in a single well and most of the drilling fluids are recycled (80 percent). BOEM assumes that the discharged drilling fluids used for drilling the shallowest part of the well will be a common water-base mud of the generic composition shown below. Fluid discharges are regulated by federal and state agencies. Composition of Typical Drilling Mud (based on EPA, Type 2, Lignosulfonate Mud) Components: Bentonite, Lignosulfonate, Lignite, Caustic, Lime, Barite, Drilled solids, Soda ash/Sodium Bicarbonate, Cellulose Polymer, Seawater/Freshwater
Element Low Case Medium Case High Case Season Comment
Deep Penetrating Marine Seismic Surveys
1 survey of 28 blocks (3D)
1 survey of 28 blocks (3D)
1 survey of 28 blocks (3D) Open Water One 3D seismic survey
will be conducted.
Airborne Geophysical (gravity) Survey
1 survey of 1 million acres
1 survey of 1 million acres
1 survey of 1 million acres Year Round
Airborne geophysical survey could be conducted over the leasing area.
Geohazard & Geotechnical Surveys
1 survey 11 site
clearances; 1,403 line-miles and
point sampling locations
Up to 2 surveys could conduct
27 site clearances;
3,076 line-miles and point sampling locations
Up to 4 surveys could conduct 36 site clearances;
4,596 line-miles and point sampling
locations
Open Water
G&G surveys include shallow hazard site clearances and point sampling. For geohazard surveys, multiple sites may be cleared in a single survey.
Total number of exploration and delineation wells drilled
3 6 8 Open Water Drilling would be done from MODUs such as a jack-up or drillship.
Maximum number of exploration and delineation rigs operating simultaneously in a year
1 1 1 Open Water Exploration and delineation wells are drilled from the same rig.
Volume of rock cuttings discharged for exploration and delineation wells (cy)
1,764 3,528 4,704 Open Water
Exploration and delineation wells would average 588 cy of dry rock cutting per well.
Volume of drilling fluids from exploration and delineation wells (bbl)
27,000 54,000 72,000 Open Water On average, 9,000 bbl of drilling fluid would be used per exploration well.
Table 2: Exploration Activities for the Low, Medium, and High Activity Cases
Development Activities After an operator commits to develop a prospect, project designs will be evaluated and the operator will make development decisions based on, among other things, experience, expectations, and availability of equipment, personnel, and material. Another operator with a different set of experiences and expectations could make different decisions about how best to develop a prospect. An operator’s DPP will likely be
13

I I I I
I I ~ I I I I I I
■ ■ ■
Exploration and Development Scenario – REVISED Lease Sale 258, Cook Inlet, Alaska
revised during the development phase as the operator incorporates lessons learned and understanding of the reservoirs gained through drilling and production. Development activities include installing production platforms and pipelines, drilling production wells, and installing tie-ins to existing shore-based infrastructure.
Platforms and Production Wells Water depth, sea conditions, and ice conditions are important factors in selecting a platform type. The existing platforms in Cook Inlet located in State waters were constructed onshore, floated to the targeted location, and installed. Due to the extreme tides and seasonal ice conditions in Cook Inlet, there are no subsea development wells (wells that reach the seafloor via a seafloor template at distance from the offshore platform) included in the E&D Scenario for LS 258 (i.e., all wells reach the surface at a production platform). It is assumed that the production platform will be a steel-caisson platform constructed and designed to be tide and ice resistant. Each platform will contain up to 24 well slots. Each of the six platforms would house production and service (injection) wells, processing equipment, fuel, and personnel quarters. The first platform serves as a hub, connecting pipelines from other platforms to the main pipelines to shore. Based on the average time required to drill a well, a maximum of six wells per year may be drilled per platform. The total numbers of production and service wells for the low, medium, and high cases are derived from the hydrocarbon volume of the proxy pool(s) developed in each case. Figures 4, 5, and 6 show the schedule of platform installation and well drilling for each case.
Cook Inlet LS 258 - High Activity Scenario Well Drilling and Platform Installation
0
2
4
6
8
10
12
14
16
18
20
1 2 3 4 5 6 7 8 9 10 11 12 13 14 15 16 17 18 19 20 21 22 23 24 25 Year
Platrform Platform Wells Drilled Expl wells
Figure 4: Schedule of Well Drilling and Platform Installation for the High Activity Case
14

I I I I I
■ ■ ■
I I I
I I■ I
■ ■ ■
Exploration and Development Scenario – REVISED Lease Sale 258, Cook Inlet, Alaska
Cook Inlet LS 258 - Medium Activity Scenario Well Drilling and Platform Installation
20
18
16
14
12
10
8
6
4
2
0
Exploration Wells Platform Wells Drilled Platforms
1 2 3 4 5 6 7 8 9 10 11 12 13 14 15 16 17 18 19 20 21 22 23 24 25 Year
Figure 5: Schedule of Well Drilling and Platform Installation for the Medium Activity Case
Cook Inlet LS 258 - Low Activity Case Well Drilling and Platform Installation
20
18
16
14
12
10
8
6
4
2
0 1 2 3 4 5 6 7 8 9 10 11 12 13 14 15 16 17
Year wells drilled Platforms installed Exploration Wells
Figure 6: Schedule of Well Drilling and Platform Installation for the Low Activity Case
15

Exploration and Development Scenario – REVISED Lease Sale 258, Cook Inlet, Alaska
Production slurry (oil, gas, and water) will be gathered on the platforms. Gas and produced water will be separated and water re-injected into the reservoir using service wells. Gas production (from a dry-gas pool and associated gas with produced oil) will be piped to the hub platform and then to shore for marketing. Disposal wells will handle wastewater from the crew quarters and mess facilities on the platforms. Treated well cuttings and mud wastes could be injected in disposal wells or barged along with other solid waste to an onshore treatment and disposal facility located at the shore base.
Element Low Case
Medium Case
HighCase Season Comment
Production wells 8 73 81 Year Round
Production wells area disturbance is included in the platform seafloor disturbance.
Service wells 4 23 27 Year Round
Service wells area disturbance is included in the platform seafloor disturbance.
Rock cuttings from production and service wells (cy)
7,056 56,448 63,504 Year Round
Production and service wells would average 588 cy of dry rock cutting, which would be disposed of in-service wells or barged to shore for disposal and established treatment facilities.
Drilling fluids from service and production wells (bbl)
9,360 74,880 84,240 Year Round
On average, 2,369 bbls of drilling fluid would be used to drill each production well. 80% of the drilling fluid is expected to be recycled; 20% would be injected into disposal wells or discharged.
Steel jacketed platforms installed 1 5 6 Open
Water 0.14-acre footprint/platform (85 ft by 70 ft)
New shore bases 0 0 0 New onshore drilling and production waste handling facilities
0 0 0
Table 3: Wells, Platforms, and Facilities for the Low, Medium, and High Activity Cases
Pipelines The preferred method to transport oil and gas from the platform would be subsea pipelines to the nearest landfall location, likely on the southern Kenai Peninsula near either Homer or Nikiski, depending upon where the first commercial oil discovery is located. Based upon the proximity of pipelines already in place in upper Cook Inlet, it is not anticipated that any of the production platforms from any new discoveries in the lower Cook Inlet will be able to utilize any existing pipelines.
Based upon the anticipated production rates from the fields, the primary pipeline carrying produced oil from the platform to shore will be a 12-inch diameter pipeline. Where subsea soil conditions allow, the pipelines will be trenched using a subsea trenching jet similar to the method employed for the Trans-Foreland pipeline installed between the Kustatan Production Facility on the west side of Cook Inlet to the Kenai Pipeline Company Tank Farm near Nikiski. If soils are not conducive to pipeline burial, anchors may be used to provide support and stability for the pipeline to withstand tidal movements. Construction of any pipelines is anticipated to occur between the beginning of May and the end of September.
After the OCS oil and gas infrastructure is constructed, operations will largely involve resupply of material and personnel, inspections, maintenance, and repair. Maintenance and repair work will be required on the platforms and processing equipment to remove bottlenecks in production systems. Well repair work will be required to keep both production and service wells operational. Pipelines will be inspected and cleaned regularly by internal devices (pipeline inspection gauges, or “pigs”). Crews will be rotated at regular intervals.
16

Exploration and Development Scenario – REVISED Lease Sale 258, Cook Inlet, Alaska
Element Low Case Medium Case High Case Season Comment
Onshore Oil Pipeline No oil pipeline
Up to 80 miles of pipeline; up to
290 ac. footprint
Up to 80 miles of pipeline; up to
290 ac. Footprint
Year Round
Footprint based on an estimated 30-ft. wide disturbance for pipeline installation. Onshore pipeline would be buried where practical.
Onshore Gas Pipeline
1 pipeline; 4 ac. footprint
1 pipeline; 4 ac. footprint
1 pipeline; 4 ac. Footprint
Year Round
Footprint based on an estimated 30-ft. wide disturbance for pipeline installation. Onshore pipeline would be buried where practical.
Offshore Oil Pipeline No oil pipeline
Up to 80 miles of pipeline; up to
291 ac. footprint
Up to 80 miles of pipeline; up to
291 ac. Footprint
Open water
Footprint based on an estimated 30-ft. wide disturbance for pipeline installation. Offshore pipeline would be buried where practical.
Offshore Gas Pipeline
Up to 40 miles of pipeline; up to
145 ac. footprint
Up to 80 miles of pipeline; up to
291 ac. footprint
Up to 120 miles of pipeline; up to 437 ac. Footprint
Open water
Footprint based on an estimated 30-ft. wide disturbance for pipeline installation. Offshore pipeline would be buried where practical.
New Pipelines to shore
1 2 2 N/A New shoreline crossings of pipelines provided in this table.
Notes: ac = acre
Table 4: Pipelines for the Low, Medium, and High Activity Cases
Transportation The Cook Inlet basin has been producing oil and gas from State offshore leases since the mid-1960s, and it is expected that E&D Scenario activities generated from Cook Inlet OCS exploration and production would be compatible with existing usage. Because of this history, one key assumption made regarding this E&D Scenario is that the existing onshore infrastructure (i.e., boat harbors, airports, onshore pipelines, roads, etc.) serving the proposed LS 258 area has capacity to support the activities considered in the E&D Scenario without requiring major expansion efforts or modifications. During exploration seismic surveys, the vessels are largely self-contained. Seismic operations would be conducted in the summer/fall open-water season after commercial fishing season has ended. We assume that a smaller support vessel would make occasional trips (one to two per week) to refuel and resupply, likely operating out of Homer or Nikiski.
Operations at remote locations in the proposed lease sale area will require transportation of supplies and personnel by different means, depending on seasonal constraints and phase of the operations. While the lower Cook Inlet remains relatively ice-free during the winter months, water conditions may prevent supply vessels from tying up safely at the platform. Under these conditions, helicopters would be used for basic resupply and crew rotation operations.
During exploration drilling, operations would be supported by both helicopters and supply vessels. Helicopters would fly from Nikiski or Homer at a frequency of one to three flights per day. Support-vessel marine traffic would be expected to occur at a frequency of one to three trips per week, also out of Homer or Nikiski.
Platform and pipeline installation and development drilling operations would be supported by both helicopters and marine supply vessels (boats) from existing facilities located in either Homer or Nikiski. Helicopters would likely fly from either Homer or Nikiski at a frequency of one to three flights per platform, per day during development operations. Support vessel traffic is estimated to consist of one to three trips per platform per week from either Homer or Nikiski. During normal production operations, the frequency of helicopter flights offshore would remain the same (1 to 3 flights per platform per day), but marine traffic would drop to about one to two trips per week to each platform. Marine vessel traffic would occur year-round since this area remains ice free during the winter. If barges are used to transport the drill
17

Exploration and Development Scenario – REVISED Lease Sale 258, Cook Inlet, Alaska
cuttings and spent mud from production wells during drilling operations, a dedicated barge could make one to two trips per week to an onshore disposal facility.
Element Low Case
Medium Case
HighCase Season Comment
Flights per week during peak exploration activity
14 flights; 700
miles1
14 flights; 700 miles1
14 flights; 700 miles1 Year Round
Approximately 2 flights per day. Flights would depart from
Homer or Nikiski.
Boat trips per week during peak exploration activity
5 trips; 250
miles1
5 trips; 250 miles1
5 trips; 250 miles1
Open Water
Marine vessels would depart from Homer.
Flights per week during peak development, production, and decommissioning phases
7 flights; 350
miles1
35 flights; 1,750 miles1
42 flights; 2,100 miles1
Year Round One flight could service multiple platforms. Flights would depart
from Homer or Nikiski. Boat trips per week during peak development, production, and decommissioning phases
7 trips; 350
miles1
35 trips; 1,750 miles1
42 trips; 2,100 miles1
Open Water
Marine vessels would depart from Homer.
Notes: 1 Estimates use 50 miles as the typical one-way distance traveled.
Table 5: Helicopter Flight and Boat Trip Distance and Frequency for the Low, Medium, and High Activity Cases
Production Activities Oil production will commence with the drilling of the first platform production well and ramp up as more wells are drilled. In Cook Inlet, the associated gas produced with the oil can be sold to the local natural gas distribution system. Gas sales begin when the first oil production well is brought online. Service wells will continue to re-inject produced water throughout oil and gas production operations. The charts below show the forecasted yearly oil and gas sales for the high, medium and low activity cases. The production information reflected on these graphs was extracted from geologic play analysis of data based upon local wells, seismic mapping, and historical production data from analog fields. These data are then used to forecast individual well-stream models coupled with well-installation scheduling to develop/forecast the field-wide production (see Figure 7, Figure 8, and Figure 9). The annual peak production rates indicated on the graphs is determined by estimating production well rates coupled with the production well drilling schedule (Figure 4, Figure 5, and Figure 6). Total oil production from the scenario model is then compared with the proxy pool volumes selected from the GRASP distribution.
18

I -
Exploration and Development Scenario – REVISED Lease Sale 258, Cook Inlet, Alaska
0.000
5.000
10.000
15.000
20.000
25.000
30.000
35.000
0.0000
2.0000
4.0000
6.0000
8.0000
10.0000
12.0000
14.0000
16.0000
1 3 5 7 9 11 13 15 17 19 21 23 25 27 29 31 33 35 37 39 41 43 45
Annu
al g
as S
ales
, BCF
/yr
Annu
al o
il sa
les,
(MM
bbl
/yr)
Forecasted Annual Cook Inlet Production LS 258
High Activity Scenario
Oil Prod (MM bbl/yr) Gas Prod. (BCF/yr)
Figure 7: Forecasted Annual Oil and Gas Production for the High Activity Case
Forecasted Annual Cook Inlet Production LS 258 Medium Activity Scenario
15.0000 6.000
5.000 12.0000
4.000 9.0000
3.000
6.0000 2.000
3.0000 1.000
0.0000 0.000
Annu
al o
il sa
les,
(MM
bbl
/yr)
1 3 5 7 9 11 13 15 17 19 21 23 25 27 29 31 33 35 37 39 41
Annu
al g
as S
ales
, BCF
/yr
Oil Prod (MM bbl/yr) Gas Prod. (BCF/yr)
Figure 8: Forecasted Annual Oil and Gas Production for the Medium Activity Case
19

Exploration and Development Scenario – REVISED Lease Sale 258, Cook Inlet, Alaska
Forecasted Annual Cook Inlet Production LS 258 Low Activity Case
30.000 1.0000
0.9000 25.000
0.8000
Annu
al o
il sa
les,
(MM
bbl
/yr)
0.7000 20.000
0.6000
0.5000 15.000
0.4000 10.000
0.3000
0.2000 5.000
0.1000
0.0000 0.000
Annu
al g
as S
ales
, BCF
/yr
1 3 5 7 9 11 13 15 17 19 21 23 25 27 29 31 33 35 37 39 41 43 45 Oil Prod (MM bbl/yr) Gas Prod. (BCF/yr)
Figure 9: Forecasted Annual Natural Gas Production for the Low Activity Case
Element Total oil production (MMbbl)
Low Case 0
Medium Case 192.3
High Case 192.3
Total gas production (Bcf) 229.5 72.4 301.9 Peak oil rate (Mbbl/day) 0 36.7 36.7 Peak gas rate (MMcf/day) 61.94 13.73 85.64
Notes: There is no oil production in the low activity case.
Table 6: Total Production and Peak Daily Production Rates for the Low, Medium, and High Activity Cases
Timing This E&D Scenario has a lifespan of 40 years. As described above, the Scenario assumes that exploration drilling can be completed within a 3-year time span. Following exploration, two factors were evaluated for possible influence on the length of time needed to complete the development and production phases of this scenario. First, each of the two fields accounts for one, 3-year environmental analysis process between delineation and development. Although these environmental analyses may draw legal challenges, due to the inability to predict accurately which issues may be litigated or how long the process could take, there are no delays for litigation accounted for in the E&D Scenario.
Second, oil and gas fields may be physically overlain, but the scenario assumes no wells or facilities could be shared. If oil and gas fields overlap, then wells from the platforms could be completed in both oil and gas zones, reducing the overall number of platforms and the number of wells. However, to not underestimate the impacts of development and production, this scenario does not assume that happens.
The main driver of the development and production phase of the E&D Scenario is the time needed to install platforms and drill their associated wells after a field is discovered. In the high case scenario, it will
20

Exploration and Development Scenario – REVISED Lease Sale 258, Cook Inlet, Alaska
take 13 years to install the 6 required production platforms. Geologic factors, such as reservoir permeability, porosity, and fluid viscosity are used to determine the total number of wells required to extract production from the field. A maximum of 6 wells per platform may be drilled per year.
Construction of a platform is assumed to take three years before installation. Each platform is installed, commissioned, and producing in its first year of operation. During the first year that a platform is operational, it is assumed that only half a year is available for drilling. The timing of drilling determines the production schedule. Because of the constraints assumed regarding the timing of well drilling and platform construction, the high case E&D Scenario will take thirteen years to build the infrastructure necessary for field development.
Oil and gas wells typically decline immediately after they begin production. Based upon the geologic parameters associated with the proxy pools, the E&D Scenario assumes that the wells have an average economic life expectancy of approximately 18 years. The first wells begin production in year 7, and the last development wells are drilled in year 21. Based upon the expected economic life of the well it is expected that the project will begin decommissioning after year 34.
Decommissioning Activities After oil and gas resources are depleted and income from production no longer pays operating expenses, the operator will begin to shut down the facilities. In a typical situation, wells will be permanently plugged with cement and wellhead equipment removed. Processing modules will be moved off the platforms. Subsea pipelines will be decommissioned by cleaning the pipeline, plugging both ends, and leaving them buried in the seabed. Lastly, the platform will be disassembled and removed from the area and the seafloor site restored to some practicable predevelopment condition. Post abandonment surveys would be required to confirm that no debris remains following decommissioning and pipelines were abandoned properly. It is expected the final decommissioning phase will take two years, making the total expected lifespan of the E&D Scenario 40 years.
21

Exploration and Development Scenario – REVISED Lease Sale 258, Cook Inlet, Alaska
References Cited ADOG (Alaska Division of Oil and Gas). Chapter Six: Oil and Gas in Cook Inlet. Available online at
http://www.google.com/url?url=http://dog.dnr.alaska.gov/Leasing/Documents%255CBIF%255CCoo k_Inlet%255CCookInlet_BIF2009_6_OilGas.pdf&rct=j&frm=1&q=&esrc=s&sa=U&ei=0BJYVJbW Oev1iQKds4GgAQ&ved=0CBQQFjAA&sig2=AUVuwHEWSTufEgoIzYePqg&usg=AFQjCNHg9I-C-TFBApr1KEeuLrTM6Dn1IQ (accessed October 29, 2014).
ADOG. 2009. 2009 Annual Report: Available online at http://dog.dnr.alaska.gov/Publications/AnnualReports.htm (accessed October 28, 2014).
ADNR (Alaska Department of Natural Resources). Trans-Foreland Pipeline Project Available online at http://www.google.com/url?url=http://dnr.alaska.gov/commis/pco/documents/Trans-Foreland/Revised%2520Project%2520Description%252020131118r.pdf&rct=j&frm=1&q=&esrc=s& sa=U&ei=yxVYVNDgMJDQiALf4YHIAQ&ved=0CBQQFjAA&sig2=ihelp5IuFFKLhOzb8rBIiA& usg=AFQjCNHbFY2d527ApVct_vgSkwVI43Kj5g (accessed October 29, 2014)
AOGCC (Alaska Oil and Gas Conservation Commission). 2004 Annual Report: Online descriptions of Alaska oil and gas fields, including the McArthur River, Middle-Ground Shoal, and Trading Bay “offshore” oil fields in State of Alaska waters. Available online at http://doa.alaska.gov/ogc/annual/2004/2004annindex.html (accessed October 28, 2014).
USDOI, BOEM. 2012. Assessment of undiscovered technically recoverable oil and gas resources of the Nation’s Outer Continental Shelf, 2011: Available online with maps, supplements, and addenda at http://www.boem.gov/Oil-and-Gas-Energy-Program/Resource-Evaluation/Resource-Assessment/2011-RA-Assessments.aspx (accessed October 28, 2014).
USDOI BOEM. 2016. Assessment of undiscovered technically recoverable oil and gas resources of the Nation’s Outer Continental Shelf, 2016: Available online with maps, supplements, and addenda at https://www.boem.gov/oil-gas-energy/resource-evaluation/assessment-undiscovered-technically-recoverable-oil-and-gas-0 (accessed November 18, 2020)
USDOI BOEM. n.d. Resource Assessment Methodology: Estimating Undiscovered Technically Recoverable Resources: Available online at https://www.boem.gov/Resource-Assessment-Methodology/ (accessed November 18, 2020)
EIA. (U.S. Energy Information Administration). 2014 Natural Gas Prices Available online at http://www.eia.gov/dnav/ng/ng_pri_sum_dcu_SAK_m.htm (accessed October 30, 2014)
EIA. 2014. U.S. Natural Gas Exports and Re-Exports by Country: Release date of October 31, 2014. Available online at http://www.eia.gov/dnav/ng/ng_move_expc_s1_a.htm (accessed October 31, 2014).
Eidesmo T, Ellingsrud S, MacGregor LM, Constable S, Sinha MC, Johansen S, Kong FN, Westerdahl H. 2002. Sea Bed Logging (SBL), a new method for remote and direct identification of hydrocarbon filled layers in deepwater areas. First Break 20(3):144–152.
USDOI MMS. 1998. Undiscovered Oil and Gas Resources, Alaska Federal Offshore (OCS Monograph MMS 98-0054): Available online at https://www.boem.gov/sites/default/files/uploadedFiles/BOEM/Oil_and_Gas_Energy_Program/Reso urce_Evaluation/Resource_Assessment/1995AlaskaResourcesMMS98_0054.pdf (accessed November 18, 2020)
USDOI MMS. 2005. Shallow Hazards Survey and Evaluation for OCS Exploration and Development Drilling (NTL 05-A01): Available online at https://www.boem.gov/sites/default/files/regulations/Notices-To-Lessees/2005/05-a01.pdf (accessed November 18, 2020)
22

Exploration and Development Scenario – REVISED Lease Sale 258, Cook Inlet, Alaska
PNA. 2014c. Construction of Cook Inlet subsea pipeline now set to begin in 2015: Petroleum News Alaska article by Wesley Loy, vol. 19, no. 18, Week of May 04, 2014, available online with subscription at http://www.petroleumnews.com/.
PNA. 2020. Alaska-Mackenzie Rig Report: Petroleum News Alaska feature by Marti Reeve, vol. 25, no. 49, week of December 6, 2020, available online with subscription at https://www.petroleumnews.com/.
PLATTS, McGraw Hill Financial: Global LNG Update, Jan JKM average $10.06/MMBtu, down 47% on year amid weak LNG demand. http://www.platts.com/news-feature/2014/naturalgas/lng/index (accessed December 22, 2014)
Richardson, W.J., C.R. Greene, Jr., J.S. Hanna, W.R. Koski, G.W. Miller, N.J. Patenaude, and M.A. Smultea. 1995. Acoustic effects of oil production activities on bowhead and white whales visible during spring migration near Pt. Barrow, Alaska-1991 and 1994 phases: Sound propagation and whale responses to playbacks of icebreaker noise. OCS Study MMS 95-0051.
23