Revised: 0 /07 JMF - International Light Technologies · Revised: 09/07 JMF. INSTRUCTION MANUAL:...
32
Revised: 09/07 JMF
Transcript of Revised: 0 /07 JMF - International Light Technologies · Revised: 09/07 JMF. INSTRUCTION MANUAL:...

Revised: 09/07 JMF
INSTRUCTION MANUAL:
ILT1400AILT1400BL
Radiometer / Photometer
© 2007 International Light Technologies, Inc.
All Rights Reserved.No part of this publication may be reproduced or transmitted in any form or by anymeans, electronic or mechanical, including photocopying, recording, or anyinformation storage and retrieval system, without permission in writing from thecopyright owner. Requests should be made through the publisher.
Technical Publications Dept.International Light Technologies, Inc.10 Technology DrivePeabody, MA 01960
Printed in the United States of America
Contents
1. CONTROLS 51.1 DISPLAY ......................................................................................................................... .51.2 BUTTONS ....................................................................................................................... .51.3 INPUTS / OUTPUTS ....................................................................................................... .5
2. OPERATION - QUICK REFERENCE 62.1 ON / OFF......................................................................................................................... .62.2 SIGNAL MODE .......................................................................................................... ......62.3 INTEGRATE MODE ........................................................................................................ .72.4 Disabling the Automatic Shut-Off Feature ................................................................. .82.5 System flashes “ NO CAL “ … … … … … … ................................................................. ..9
3. INPUTS - DETECTORS 93.1 GENERAL .................................................................................................................. .....93.2 XRL140 - UV STABILIZED SILICON PHOTODIODE DETECTOR … … … … ...............103.3 SSL001A- SUPERSLIM DETECTOR… … … … … … … … … … … … … … … … … … … … … 103.4 SEL033 - UV STABILIZED SILICON PHOTODIODE DETECTOR ..............................103.5 SEL240 - SOLAR BLIND VACUUM PHOTODIODE DETECTOR ................................103.6 SEL005 – UV-VIS GaAsP DETECTOR ....................................................................... 103.7 SEL623 THERMOPILE DETECTOR ............................................... .............................. .113.8 EXPANDED DETECTOR LIST… … … … … … … … … … … … … … … … … … … … … … … … 11
4. OUTPUTS 114.1 DISPLAY MESSAGES.................................................................................................. .114.2 ANALOG DATA RECORDER OUTPUT....................................................................... .134.3 TTL SERIAL OUTPUT .................................................................................................. .14
5. OPTICAL CALIBRATION 165.1 N.I.S.T. TRACEABLE FACTORY CALIBRATION ........................................................ .16
6. PROGRAM MODE - OPERATION 166.1 ‘ PROGRAM MODE ’ - Quick Reference: ..................................................................... .176.2 Disabling the Automatic Shut-Off.............................................................................. .186.3 Changing the Displayed Units ................................................................................... .196.4 Changing the Sensitivity Factor ................................................................................ .196.5 Read-Only Menu Screens........................................................................................... .206.7 SELF CALIBRATION ................................................................................................... .21
7. PRECAUTIONS 22
8. APPLICATIONS 228.1 CURRENT AND CONDUCTANCE MEASUREMENTS............................................... .228.2 FLUX DENSITY MEASUREMENTS ............................................................................ .238.3 FLUX MEASUREMENTS ............................................................................................. .268.4 RADIANCE / LUMINANCE (Brightness) MEASUREMENTS ....................................278.5 L.E.D MEASUREMENTS ............................................................................................. .288.6 TRANSMISSION MEASUREMENTS ........................................................................... .288.7 REFLECTANCE MEASUREMENTS............................................................................ .288.8 SPATIAL RESPONSE .................................................................................................. .298.9 TEMPORAL RESPONSE ............................................................................................. .30

9. GENERAL SPECIFICATIONS 319.1 ELECTRICAL SPECIFICATIONS ................................................................................ .319.2 OPTICAL ACCURACY ................................................................................................. .319.3 SIZE AND WEIGHT ...................................................................................................... .319.4 ENVIRONMENTAL SPECIFICATIONS ........................................................................ .31
10. MAINTENANCE AND REPAIR 3210.1 PREVENTIVE MAINTENANCE ................................................................................. .3210.2 BATTERY REPLACEMENT ....................................................................................... .3210.3 DISASSEMBLY AND PC BOARD REPLACEMENT ................................................. .3210.4 USER REPAIR POLICY ............................................................................................. .32
11. ONE YEAR WARRANTY 32

1. CONTROLS1.1 DISPLAY
The ILT1400 uses a two line, thirty-two (32) character“Supertwist” Liquid Crystal Display (see above) to portraynumerical data, units, mode of operation, and instrumentstatus alphanumerically in bit -mapped graphics. If theinstrument is turned on without a detector plugged in, thedisplay will instruct the user to ‘SHUT POWER OFF’,‘PLUG DETECTOR IN’, in order to properly initialize theILT1400 system.
The top line displays sixteen (16) characters ,representing the most recent data and units from th edetector. The detector data is displayed in three or four digit(depending on digit reliability) decimal form with a + / -sign. The SI or English optical units are displayed to theright of this numerical data in standard abbreviated form ,such as mW/cm2 (milliwatts per square centimeter), with th eprefix scaling by 1000 as the data autoranges, from femto -(10-15) to mega- (106). A typical reading for the top line ofthe display, for example, would be +123.4 mW/cm2.
The bottom line also displays sixteen (16) characters o finformation, representing the mode of operation and theinstrument status. The mode of operation, such as‘SIGNAL’, ‘HI INTEG’, ‘LO INTEG’, or ‘ZEROING’ iscontinuously displayed on the left side of the bottom line.The characters to the right are reserved for blinking statu smessages such as ‘HOLD’, ‘OVR RNG’, ‘NO OFF’ and‘BAT LO’, with up to two st atus messages being alternatel ydisplayed. In continuous measurement mode, the botto mline of the display will typically read ‘SIGNAL’, with thestatus display blank unless the hold button was depressed oran error situation arises .
1.2 BUTTONS
The five buttons on the front surface of the ILT1400were designed with ease of operation in mind, with themicroprocessor making most decisions for the use r.
The ‘ON/OFF’ button turns the instrument on or off. Adetector must be plugged in for the ILT1400 to properlyinitialize when first turned on. The instrument willautomatically turn itself off to preserve the battery life if nobuttons are pressed for a period of ten (10) minutes.
The ‘SIGNAL’ button selects the continuous wave“signal” measurement mode, for continuous monitoring of alight source. The detector memory establishes the detecto rlimits and autoranging units to provide an immediate answe rin an easily understood format.
The ‘INTEGRATE’ button selects the integration modethat was last used, ‘HI INTEG’ or ‘LO INTEG’. Pressingthe ‘INTEGRATE’ button again during integration will resetthe integration register to start over at zero, while remainingin the same mode. To select the alternate integration mode ,simply press the ‘INTEGRATE’ button twice within onesecond and the range will change from ‘HI’ to ‘LO’ or viceversa.
The ‘ZERO’ button causes the instrument to null th epresent reading to zero. Zeroing can be performed in boththe signal and integration modes to subtract ambient ligh tfrom future readings. Also, the programming mode can beaccessed by pressing the ‘ZERO’ button within 1 secondafter hitting the ‘OFF’ button.
The ‘HOLD’ button temporarily freezes the display tohold a reading for convenience when measuring in adarkroom, or in similar situations where it may beinconvenient to read the LCD display in ‘SIGNAL’ mode.In integration mode, the ‘HOLD ’ button freezes the lates tsummation on the displa y, yet continues to internall yintegrate, so that intermediate data can be taken withoutdisrupting the integration. Pressing the ‘HOLD ’ buttonagain will unfreeze the LCD to once again display th einternal integration without disruption. Pressing th e‘INTEGRATE’ button again while in ‘HOLD’ status willreset the integration to star t over from zero.
The ‘BACKLIGHT’ button ( ILT1400BL models only)turns the backlight for the LCD on or off.
1.3 INPUTS / OUTPUTS
The ILT1400 contains two I/O connectors, the analogrecorder output jack and the detector card edge connector.
The analog recorder output jack is located on the frontsurface of the ILT1400 in the lower right hand corner. Itcan be used to obtain readings outputted to a chart recorder(no longer offered by ILT, must be purchased separately)
The detector card edge connector performs severalfunctions besides carrying the signal from the detector to th eILT1400. TTL Serial data is accessed through this card edgeusing a special connector adapte r. This connector alsoprovides a selection of positive and negative bias voltagesfor almost all IL detector configurations, and provides theinput for information from the detector memory concerningcalibration and units. See section 4.3 for a pinout andgeneral description of the card edge connecto r.
5
+123.4 mW/cm2SIGNAL

Any signal that goes below the detector’s minimumsensitivity, or “zero floor”, will display 000.0 on the LCD.An alternate zero level can also be set using the ‘ZERO’button, as described below. If the light level drops belowthe set zero level, a negative reading will result.
2.2.2 Zero
If you cover up the detector and press the ‘ZERO’button while in ‘SIGNA L’ mode, the unit will take a readin gof this low level and subtract that reading from all futur ereadings, thereby establishing the ‘ZERO’ referencecondition. This ‘ZERO’ can be any reference level, such asthe ambient room illumination, or unwanted reflections froma single source. If an additional light is turned on, thedifferential magnitude will appear on the display, exclusiveof the previous room light. If the level drops below th eambient zero level, the reading will display a negativenumber. We recommend limiting unwanted backgroun dlight to less than 10 percent of the overall reading in order t ominimize the effect of variable ambient conditions.
The ‘ZERO’ button can also be used to subtract aspecific wavelength band from future readings with aconstant source. The instrument can be zeroed with a shar pcut or a narrow bandpass filter in front of the detecto r.Future readings will nullify the e ffect of all wavelengths tha twere allowed to pass through the known filter duringzeroing. CHECK THE ZERO BEFORE TAKING AMEASUREMENT. The last zero level is stored in memory,even after the unit is shut down. Failure to check the zero i sthe biggest cause for erroneous readings .
A detector must be plugged in when the ILT1400 is firstturned on for the instrument to properly initialize andinterrogate the detector for calibration factors, rang elimitations and units information. The instrument willdisplay the message shown above if the unit is turned onwithout a detector present, and will automatically shut off inthirty seconds. This same message is displayed if thedetector is removed while the instrument is running . Toremedy this situation, simply turn off the ILT1400, plug inthe detector you wish to use, and turn the unit on. Theinstrument will then initialize itself and enter signal mod eautomatically.
As an added feature for the EXPERIENCED USER, theILT1400 will operate in ‘PROGRAM’ mode by pressing the‘OFF’ button, followed by the ‘ZERO ’ button within 1second, when turning off the instrument.
2.2 SIGNAL MODE
2.2.1 Signal
The ILT1400 automatically begins operating in‘SIGNAL’ mode when turned on with a detector plugged in.Pressing the ‘SIGNAL’ button in any mode will initiat eoperation in ‘SIGNAL’ mode for constant wavemeasurement. This mode is desirable when measuring anyconstant source. The unit reads the average steady statelight level over a period of 0.5 seconds, then takes a “rollingaverage” with the last two readings, to smooth out unwantednoise.
2. OPERATION -QUICK REFERENCE
If the incoming light exceeds the maximu mmeasurement range of the detector, the IL1400 will blink‘OVR RNG’ in the status register display, and the datadisplay will show plus signs instead of numbers (‘++++++W/cm2’) on the top line.
2.1 ON / OFF
2.1.1 Turning On the ILT1400
6
SHUT POWER OFFPLUG DETECTOR IN
-123.4 mW/cm2
SIGNAL
+0.000 nW/cm2SIGNAL
+123.4 mW/cm2SIGNAL
+0.000 uW/cm2ZEROING
++++++ mW/cm2SIGNAL OVR RNG

In ‘HI INTEG’ mode, the range for an incoming signalis limited to the top 5.0 decades of the measurement rang eof the detector, capable of measuring from 3.5 nanoAmps to350 microAmps with the digital frequency values summed ina 5 byte (2565) register. With an external power suppl y, theinstrument can integrate the maximum signal for more tha nfour months, or can integrate the minimum signal for morethan 34,000 years! Since a typical signal will fallsomewhere between the maximum and minimum in themeasurement range, the only practical limit to integratio ntime is the battery life. The ILT1400 draws a mere 26milliAmps in its low power CMOS circuitry, allowing non-stop integration with four new alkali ne cells forapproximately 54 hours. Please contact a n ApplicationsEngineer at our manufacturing facility for more informationon battery life and use of external power supplies .
In ‘LO INTEG’ mode, the range for an incoming signalis limited to the bottom 4.5 decades of the measuremen trange of the detecto r, overlapping with the ‘HI INTEG ’range by 2 decades . The measurement range in ‘LO INTEG ’mode is from 10 picoAmps to 400 nanoAmps. The addedgain (256 times) and sensitivity of this mode are provided atthe expense of a narrower dynamic range, and are limited b yincreased noise on the low end.
2.3.2 ZeroThe automatic zero function allows the user to eliminat e
the effect of background light, reflections, or unwantedwavelengths to isolate and integrate only the energy sourceof interest. The microprocessor automatically subtracts th eintegral of the zero level energy from the overall integral.To perform this function properly, the background lightsource that you are subtracting should be f airly stable and/ormuch less in magnitude than the light source of interest . Agood “rule of thumb” is to limit ambient light to under 10percent of the measured source, thereby minimizing th eeffect of ambient light variation. By placing a ba fflebetween the light source and the detector during zeroing,ambient light and any incidental reflections from th eprimary source will be continuously subtracted from th eintegral. Covering the detector completely during zeroin gwill establish a very low zero reference, so that the integralwill be the sum of all the energy reaching the detector.
2.2.3 Hold
Pressing the ‘HOLD’ button while in ‘SIGNAL’ modewill freeze the last reading on the displa y, and the word‘HOLD’ will blink in the status register of the LCD. Toresume constant wave measurement, simply press the‘SIGNAL’ button or toggle the ‘HOLD ’ button again and theinstrument will return to ‘SIGNAL’ mode (with the samezero level as before).
2.3 INTEGRATE MODE
The ILT1400 can integrate light, summing up all theenergy over time and subtracting ambient ene rgy. The usercan select between two overlapping integration ranges, ‘HI’and ‘LO’ ‘INTEG’, for measuring either high or low levelsources. When the ‘INTEGRATE’ button is pressed, theinstrument begins integrating in the measurement range thatwas last used, ‘HI ’ or ‘LO’, even if the instrument had bee nturned off. The alternate range can be selected by pressin gthe ‘INTEGRATE’ button twice within one second. ‘HIINTEG’ mode is desirable for most applications, due to itswide dynamic range and very low noise. ‘LO INTEG’ isuseful for applications requiring high gain for low signa llevels.
While integrating, the instrument will not a utomaticallyshut off after ten (10) minutes as it normally does in‘SIGNAL’ mode. This allows the user to performintegrations for extended periods of time. If the ‘HOLD’button is pressed during integration, however, the blinkingmessage ‘HOLD’ will appear in the status register and th einstrument will automatically shut off after ten (10) minutesunless a keypress is detected. The ‘HOLD’ feature freezesthe display but the instrument continues to integrate whilein Hold.
2.3.1 High Integrate / Low IntegrateThe best way to di fferentiate between the high and lo w
integrate modes is to simply describe how the ILT1400operates internally. The ILT1400 uses a current-to-frequency converter and highly accurate digital bandwidthmodulation to digitize the incoming signal data for use b ythe microprocessor. In ‘SIGNAL’ mode, the instrumentautomatically switches between the high (5.0 decades) andlow (4.5 decades) auto-ranging measurement ranges with anoverlap hysteresis for a total of over 7 decades of dynamicrange. The user must select either ‘HI INTEG’ or ‘LOINTEG’ by pressing the ‘INTEGRATE’ button twice withinone second. Most users will find that the wide dynami crange and low noise of the ‘HI INTEG’ mode make it idealfor all but the very lowest level applications, where ‘LOINTEG’ is required.
7
+123.4 mW/cm2SIGNAL HOLD
+123.4 mJ/cm2SIGNAL
+396.4 nJ/cm2LO INTEG

2.4 Disabling the Automatic Shut-Off Feature
We recommend turning the ILT1400 off when not inuse, in order to prolong the life of the batteries. Theinstrument will automatically turn itself off after a period often minutes when in ‘SIGNAL’ mode. This automatic shut-off feature can be temporarily or permanently disabled. Todo this, first press the ‘OFF’ button with the instrument on,followed within one second by the ‘ZERO’ button.
The ILT1400 will display the message ‘PROGRAMMODE’, ‘ON/OFF TO EXIT’. Press the ‘ZERO’ button toselect the ‘AUTO SHUT-OFF’ menu. The ‘ZERO’ buttonselects through the numerous changeable ‘MENU’ screens.
Please note that although the auto shut -off feature isautomatically disabled during integration, when the ‘HOLD’feature is activated, the auto shut-off feature will cause theinstrument to turn off after ten (10) minutes of inactivity.The automatic shutoff is once again disabled whenintegration is resumed to provide long term integrationmeasurements.
The simplest method for setting the zero level fo rintegration is to press the ‘ZERO’ button while in ‘SIGNAL’mode. If you press the ‘ZERO ’ button when in‘INTEGRATE’ mode, the display will indicate that theinstrument is ‘ZEROING’ and then return to ‘SIGNAL’mode. This allows the user to evaluate the stability of thesubtracted source. When the ‘INTEGRATE’ button ispressed to begin integration, the ILT1400 will continuouslysubtract the new zero level from the present integral andfrom future integrations, until a new zero level is set. B ESURE TO CHECK THE ZERO BEFORE TAKING AMEASUREMENT. The last zero is stored in memory eve nafter the unit is shut down. Failure to check the zero is th ebiggest cause for erroneous readings . To check the zero,cover the detector or source being measured. If the readin gis other than zero, press the zero button to reset with th elight source removed.
2.3.3 Hold
While in ‘INTEGRATE’ mode, the ‘HOLD’ buttonfunctions to freeze or unfreeze the displa y, acting as analternate action “toggle” switch . When you press ‘HOLD’ ,the most recent integral is continuously displayed on theLCD, and the word ‘HOLD’ blinks in the status register.The ILT1400 continues to integrate internally, however. Toresume this transparent integration, simply hit the ‘HOLD’button again to unfreeze the LCD and continue to displa ythe UNINTERRUPTED integration. This feature is quiteuseful for taking intermediate readings without a ffecting theongoing integration reading. If you press ‘INTEGR ATE’after holding a reading in integrate mode, the instrumentwill abandon the previous integration, return t o‘INTEGRATE’ mode, and begin integrating again from zero.
Press the ‘INTEGRATE’ button to ‘INCREMENT’ thebottom line between three choices: ‘ENABLED (10 min)’for auto shut-off, ‘DISABLED (temp.)’ to temporarilydisable the auto shut -off for one measurement session, an d‘DISABLED (PERM.)’ to permanently disable the shut-offfeature for use with external power supplies. Press ‘HOLD’to ‘ENTER’ the selection in the detector EEPROM or thechange in RAM will be reset the next time the instrument i sturned on. Permanent changes such as ‘ENABLED (1 0min)’ and ‘DISABLED (PERM.)’ always must be‘ENTERed’, since they must be stored in permanentmemory. WE STRONGLY ADVISE THAT EVEN THE
8
+0.000 uW/cm2ZEROING
+0.000 NW/cm2SIGNAL
+123.4 mJ/cm2HI INTEG HOLD
+396 nJ/cm2LO INTEG HOLD
PROGRAM MODEON/OFF TO EXIT
SIGNAL
AUTO SHUT-OFFENABLED (10 min)
AUTO SHUT-OFFDISABLED (temp.)
AUTO SHUT-OFFDISABLED (PERM.)
EXPERIENCED USER REFER TO SECTION 6.3 ONPROGRAMMING BEFORE EXPERIMENTING WITHTHE ‘PROGRAM MODE’ CAPABILITIES.
Press the ‘ON/OFF’ button to ‘EXIT’ the programmingmode and return to ‘SIGNAL’ mode. The message ‘NOOFF’ will blink in the status register in ‘SIGNAL’ mode toindicate that the automatic shut -off has been disabled .‘DISABLED (temp.)’ will be reset to ‘ENABLED (10 min)’when the instrument is turned off. ‘DISABLED (PERM.)’or ‘ENABLED (10 min)’ is permanently stored in thedetector EEPROM memory.
To provide for long duration integration (more than 24hours), the automatic shut-off feature does not apply to the‘INTEGRATE’ modes, except for the case where the‘HOLD’ button has been pressed to pause an integration,causing the ILT1400 to turn off in ten minutes if no buttonsare pressed, providing that the automatic shut -off feature hasnot been disabled. The ILT1400 can also be customprogrammed to accommodate specialized applications.Please consult an Applications Engineer at ourmanufacturing facility for additional information.
2.5 System flashes “ NO CAL”The double EEPROM (Electrically Erasable
Programmable Read Only Memory) in the “L” connector forthe ILT1400 can be erased. The most common cause is staticelectricity or a large arch of power sometimes caused by turningon very high powered lamp, which send out a surge ofelectricity. If the system flashes “NO CAL” you will have tofollow the steps in chapter 6 to self program your calibrationfactors, being sure to press hold at the end. If this does notsuccessfully restore the calibration factor, then sensor will needEEPROM replacement. Please contact our service dept forfurther assistance.
3. INPUTS -DETECTORS
3.1 GENERAL
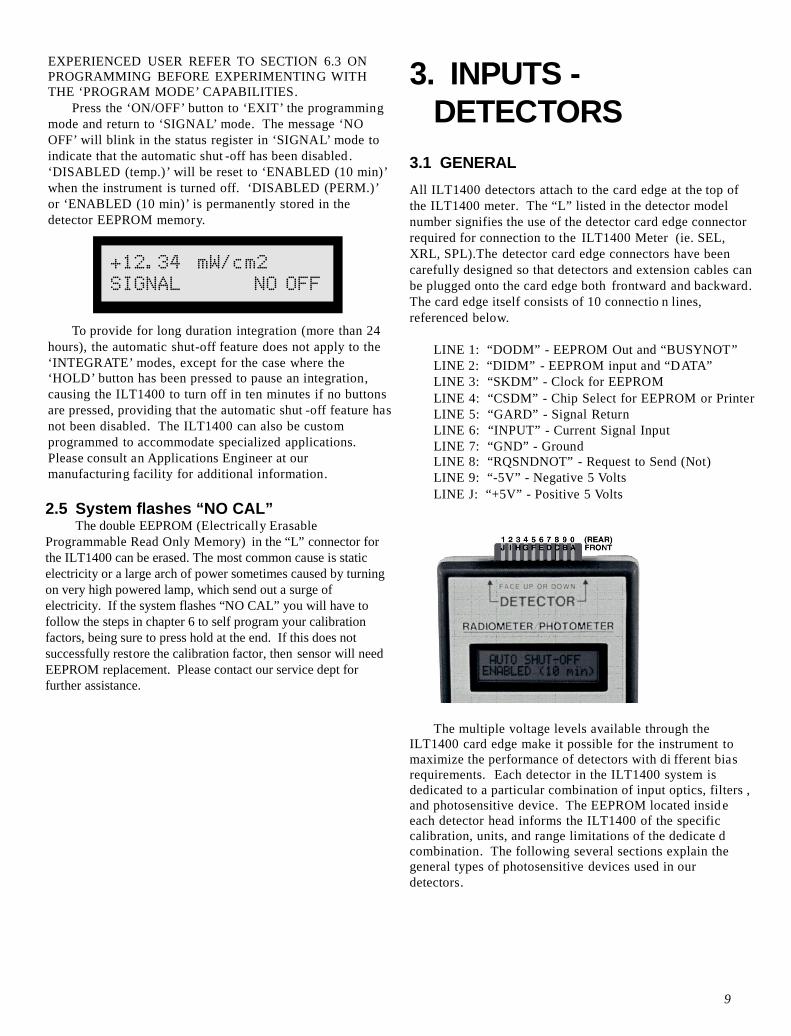
All ILT1400 detectors attach to the card edge at the top ofthe ILT1400 meter. The “L” listed in the detector modelnumber signifies the use of the detector card edge connectorrequired for connection to the ILT1400 Meter (ie. SEL,XRL, SPL).The detector card edge connectors have beencarefully designed so that detectors and extension cables canbe plugged onto the card edge both frontward and backward.The card edge itself consists of 10 connectio n lines,referenced below.
LINE 1: “DODM” - EEPROM Out and “BUSYNOT”LINE 2: “DIDM” - EEPROM input and “DATA”LINE 3: “SKDM” - Clock for EEPROMLINE 4: “CSDM” - Chip Select for EEPROM or PrinterLINE 5: “GARD” - Signal ReturnLINE 6: “INPUT” - Current Signal InputLINE 7: “GND” - GroundLINE 8: “RQSNDNOT” - Request to Send (Not)LINE 9: “-5V” - Negative 5 VoltsLINE J: “+5V” - Positive 5 Volts
The multiple voltage levels available through theILT1400 card edge make it possible for the instrument tomaximize the performance of detectors with di fferent biasrequirements. Each detector in the ILT1400 system isdedicated to a particular combination of input optics, filters ,and photosensitive device. The EEPROM located insid eeach detector head informs the ILT1400 of the specificcalibration, units, and range limitations of the dedicate dcombination. The following several sections explain thegeneral types of photosensitive devices used in ourdetectors.
9
+12.34 mW/cm2SIGNAL NO OFF

3.2 XRL140 - UV STABILIZED SILICONPHOTODIODE DETECTOR
The XRL140 Photoresist and XRL340 AttenuatedPhotoresist version combin e a silicon cell with PhotoresistA or B filters in a special low profile remote probe (13 mmx 42 mm dia.). The XRL140 probe can also be customfiltered with our narrow band, sharp cut and other band passfilters to meet customer’s spectral requirements. Pleasecontact one of our technical support representatives forassistance with custom sensor.XRL140A: Dynamic Range: 2.22e-8 to 7.78e-2 W/cm 2
Measurement Range: 320-475XRL340A; Dynamic Range: 2.50e-7 to 8.75e-1 W/cm 2
Measurement Range: 320-475 nmXRL140B Dynamic Range: 5.26e-8 to 1.84e-1 W/cm2 SpectralRange: 326 - 401 nmXRL340B Dynamic Range : 5.26e-7 to 1.84e+0 W/cm2 SpectralRange: 326 to 401 nmXRL140T254 Dynamic Range: 3.33e-7 to 1.17e+0 W/cm²Measurement range: 249-259 nm, CW 254 nm3.3 SSL001A – SUPER SLIM UV
PROBEThis “Super Slim” UV probe is a 0.64 mm2 silicon
detector with built in UV filter . It was designed for use invery low profile applications, such as printed circuit boardand printing plate exposure assemblies. Care should betaken when using the SSL001A slim probe to avoidexcessive strain or crimping of the cable and/or scratchingthe surface of the diode.
Dynamic Range: 1.11e-5 to 9.00e-1 W/cm² (limit exposureto prevent heat damage). Spectral Range: 260 - 400 nm.Dimensions: 29 x 38 x 2 mm
3.4 SEL033 - UV STABILIZED SILICONPHOTODIODE DETECTOR
The SEL033 base detector contains a specially coated0.33 cm2 UV stabilized silicon cell with a quartz window.The SEL033 is one of our most commonly used sensors. Itcan be used with a large assortment of filters, input opticsand calibrations and covering the broad spectrum of 200 -1100 nm.SEL033/QNDS2/W Solar H ead: Dynamic Range: 5.00e-7 to1.75e+0 W/cm². Measurement Range: 200-1100 nm.SEL033/F/QNDS3/HNK15 Laser Power Head. Dy namicRange: 6.10e-4 to 2.00e+2 W. Measurement Range:400-1064 nmSEL033/Y/W Photometric Head: Dynamic Range: 5.98e-2 to2.09e+5 lux. Spectral Range: 400-700 nm.SEL033/UVA/TD UVA head: Dynamic range: 2.50e-8 to 8.75e-2
W/cm2. Measurement range: 315-390 nm.SEL033/F/W Flat Radiometric Head: Dynamic Range: 7.69e-9
to 2.69e-2 W/cm². Measurement Range: 400 -1064 nm.SEL033/F/R Narrow Field Radiance Head: Dynamic Range:1.30e-7 to 4.55e-1 W/cm²/sr. Spectral Range: 400-1064 nm.
3.5 SEL240 and SEL220 - SOLARBLIND VACUUM PHOTODIODEDETECTOR
The SEL240 utilizes a 50 mm² active area Vacuumphotodiode with quartz window (visible blocking) to provideaccurate measurement in the Deep Ultraviolet whileexcluding all Visible and Infrared radiation, with a spectralrange from 185-320 nm, with a240 nm peak. The SEL220includes a fused silica window allowing measurements from160-320 nm, with a 220 nm peak.SEL240/UVB1/TD: Sharp Cut UVB Detector HeadDynamic Range: 1.11e-5 to 1.11e-1 W/cm². MeasurementRange: 265-332 nm.SEL240/UVB/W UVB phototherapy sensor: Dynamic Range:1.54e-6 to 1.54e-2 W/cm². Measurement Range:275-310 nm.SEL240/QNDS2/TD Germicidal Head For low pressuremercury lamps: Dynamic Range: 3.33e-5 to 3.33e-1 W/cm².Measurement Range: 185 - 310 nm.SEL240/NS254/TD Narrowband Head: Dynamic Range:2.08e-6 to 2.08e-2 W/cm². Measurement range: 249-259 nm 254CW.SEL240/T2ACT5 UV Actinic Head:Dynamic Range: 1.49e-7 to 1.49e-3 effective W/cm².Spectral range: 190-400 nm (Also doubles as an Effe ctiveGermicidal Radiation Head for measurement in accordance withthe IES Luckiesh and DIN standards : 235-307 nm EffectiveGermicidal).SEL220/NS185 Narrow Band Germicidal / Ozone Head:Dynamic Range: 2.50e-7 to 2.50e-3 W/cm². Measurement Range:165-200 nm.
3.6SEL005 - UV-VISIBLE GaAsPDETECTORThe SEL005 base detectors contain a 5.2 mm² Gallium-
Arsenide-Phosphide detector with quartz window. The
SEL005 is most commonly used in applications requiring IR
blocking and is required for use with most of the WBS wide
band filters due to their secondary response in the NIR.
SEL005/UVA/TD Solar UVA Head: Dynamic Range: 2.33e-7
to 8.14e-1 W/cm². Measurement Range: 315-390 nm.
SEL005/WBS320/TD UV Curing Head: Dynamic Range:
1.82e-7 to 6.36e-1 W/cm². Measurement Range: 250-400 nm.
SEL005/NS335/TD Narrow Band UV Curing Head: Dynamic
Range: 2.33e-6 to 8.14e+0 W/cm². Measurement Range: 330-340
nm.
SEL005/TLS312/TD UVB narrow band phototherapy:
Dynamic Range: 2.50e-6 to 8.75e-2 W/cm². Measurement
Range: 312 nm CW.
10

4. OUTPUTS4.1 DISPLAY MESSAGES
The 32 character Liquid Crystal Display simultaneousl ydisplays two lines of information . The top line displays thefour digit decimal numerical data and the appropriate auto-ranged optical units. The numerical data appears in three orfour digit decimal form, providing a minimum resolution of0.5 % to ensure reliable, easy to read information. Thealphanumeric units, displayed to the right of the decima ldata, are automatically ranged in the following standar dthree decade SI prefix increments: f- (“femto”, 10-15), p-(“pico”, 10-12), n- (“nano”, 10-9), µ - (“micro” , 10-6), m-(“milli”, 10-3), k- (“kilo”, 103), M- (“Mega”, 106). The baseunits are dependent on the type of detector and calibration,and can be chosen from the following list or custo mspecified: Amperes, Watts, W/cm2 (Watts per squarecentimeter), W/cm2/sr (Watts per square centimeter p ersteradian), W/cm2/nm (Watts per square centimeter pe rnanometer), lm/ft2 or fc (lumens per square foot, or foot-candles), lux or lm/m2 (lux, or lumens per square meter), fL(foot-Lamberts), E/cm2 (Einsteins per square centimeter),cd/cm2 (Candelas per square centimeter), cd/ m2 (Candelasper square meter). When integrated, these same unitsbecome Coulombs, Joules, J/cm2, etc, respectively.
The bottom line displays the present mode of operatio nand the instrument status, to indicate the type o fmeasurement being performed as well as any specialconditions that exist, such as a low battery. Error messagesappear in the instrument status register or across the entiredisplay to alert the user to special situations, and are liste dbelow along with the standard mode of operation messages.
3.7 SEL623 THERMOPILE DETECTOR
The SEL623 series detectors utilizes a 4 mm 2 multi-junction thermopile detector with quartz window and built inpreamplifier to provide a nearly fla t spectral response overthe extremely wide range of 200 to4200 nm. The multi-junction thermopile is designed tomeasure the average power of high peak power, low dutycycle pulsed lasers. The SEL623 is also useful for highintensity applications such as solar irradiance measurement.SEL623/H/N/K15: Laser Power Probe: Dynamic Range: 3.00e-3
to 3.00e+1 W. Measurement Range: 200-2100 nm.SEL623/K9: Solar Irradiance Probe: Dynamic Range: 2.00e-5
to 9.67e-2 W/cm². Measurement Range: 200-4200 nm.SEL623/SCS695/W IR Hazard Head: Dynamic Range: 8.57e-5 to4.14e-1 W/cm2. Measurement Range: 695 - 2100 nm.
3.6 Additional Photodetectors
Below is a list of the additional detectors available for usewith the ILT1400. Since our product line is continuouslygrowing please visit out website for an updated list if youcannot find your detector listed.SEL007/U IRInGaAs Detector
7 mm2 detector with spectral rangefrom 850-1700nm.
SEL100/UBroadband SiliconDetector
100 mm2 silicon detector, quartzwindow. Spectral Response: 200 -1100nm, 950nm peak.
SEL185/U GoldCathode VacuumUV Detector
50 mm2 active area Au CathodeVacuum photodiode.Spectral Range:160-240nm, 185nm peak.
SEL320/U UVGallium Nitride
Provides Uniform sensitivity from 200-320 nm. Dimensions: 20 x 42 mm dia.
SEL324/UBroadband Silicon
Large 324 mm2 active area siliconedetector. Dimensions: 20 x 42 mm dia.
SEL365/U UVGallium Nitride
Provides Uniform sensitivity from 200 -365 nm. Dimensions: 20 x 42 mm dia.
SEL624/U Multi-junction ThermopileDetector
4 mm2 thermopile detector with KBrwindow. Spectral range: 0.2-40 micron,flat > 1.0 micron.
SEL625/U Multi-junction ThermopileDetector
4 mm2 thermopile detector with BaF2window. Spectral range: 0.2-15 micron,flat > 1.0 micron.
SPL024F LaserPower / IrradianceProbe
1.2 mm2 silicon detector in pen-likehousing with 5.5 mm aperture opening,internal integrating sphere, and F FlatFilter. Measurements in W or W/cm².
SPL024Y PhotopicPen Probe
1.2 mm2 silicon detector in pen-likehousing with 5.5 mm aperture opening,internal integrating sphere, Y Filter,Measurement in Lumens or lux.
SPL025F RadiancePen Probe
1.2 mm2 silicon detector in pen-likehousing with radiance optics, and FFlat Filter, readout in W/cm²/sr.
SPL025Y ContactLuminance PenProbe
1.2 mm2 silicon detector in pen-likehousing with luminance optics, YFilter. Measurement in cd/m2.
SCL110Illuminance Probe
Photopic response from 400-700nmwith a .64 mm dia active area silicondetector.
SCL144 BilirubinPhototherapy Probe
Spectral response from 422-488nmwith a stable silicon detector.
‘SHUT POWER OFF, PLUG DETECTOR IN’: Thismessage appears across the entire screen when either theinstrument is turned on without a detector plugged in, or thedetector is removed during normal operation. The ILT1400will automatically turn itself o ff within 30 seconds after thi smessage appears. Press the ‘ON/OFF ’ button to turn the
11
+1.234 mW/cm2SIGNAL HOLD
+2.34 J/cm2HI INTEG BAT LO
SHUT POWER OFFPLUG DETECTOR IN

instrument off, plug in a detector, and press the ‘ON/OFF ’button again to turn the IL1400 on and enter ‘SIGNA L’mode.
‘SIGNAL’: This message is displayed continuously inthe ‘mode of operation’ register (lower left corner of theLCD) after the ‘SIGNA L’ button has been pressed ,indicating that the instrument is in constant wavemeasurement mode.
‘HOLD’: This message will blink in the ‘status’ register(lower right corner of the LCD) after the ‘HOLD’ button hasbeen pressed, activating the ‘HOLD ’ feature. The mostrecent reading will be frozen on the data displa y. To removethe ‘HOLD’ status, toggle the ‘HOLD’ button again or hit afunction key (‘SIGNAL’, ‘INTEGRATE’, or ‘ZERO’) toselect a new mode of operation.
‘HI INTEG’ or ‘LO INTEG’: One of these messages i sdisplayed continuously in the ‘mode of operation ’ register(lower left corner of the LCD) after the ‘INTEGRATE’button has been pressed, indicating that the instrument is inlight integration mode. Press the ‘INTEGRATE’ buttontwice within one second to alternate between the ‘HI’ and‘LO’ integration ranges. Press the integrate button once t oreset the integral register in that mode to zero .
‘BAT LO’: This message will blink in the ‘status’register (lower right corner of the LCD) when the 6 VDCbattery voltage drops below 4.9 5 V. The instrument wil loperate for approximately 54 hours before the ‘BAT LO’error status appears. The ILT1400 internal computer willcontinue to operate until the battery voltage falls below 4.7V, (approximately 10 hours after ‘BAT LO’ appears), butaccuracy can no longer be guaranteed. An external powersupply between 5 Volts and 15 Volts DC (an automobilebattery, for example) can be used where continuous use i sexpected.
‘ZEROING’: This message is displayed temporarily i nthe ‘mode of operation’ register (lower left corner of theLCD) after the ‘ZERO ’ button has been pressed, measurin gthe present light level and subsequently returning to‘SIGNAL’ mode while subtracting this ambient light fromfuture readings.
12
‘OVR RNG’: This message will blink in the ‘status’register (lower right corner of the LCD) when the inputdetector signal exceeds the measurement range of thesystem. In addition, plus signs take the place of numerals i nthe data display, so that the top line will read ‘+++++ + W/
+12.34 fcSIGNAL
+132.8 luxSIGNAL
+123.4 cd*s/ft2HI INTEG
+22.7 lm*s/m2LO INTEG
+0.000 uW/cm2ZEROING
+0.000 nW/cm2SIGNAL
+0.123 mW/cm2SIGNAL HOLD
+1.234 J/cm2HI INTEG HOLD
+154.9 nAmpereSIGNAL BAT LO
+22.7 CoulombHI INTEG BAT LO
++++++ W/cm2SIGNAL OVR RNG
++++++ J/cm2LO INTEG OVR RNG

‘PROGRAM MODE, ON/OFF TO EXIT’: Thismessage appears across the entire screen when entering the‘PROGRAM’ mode by pressing the ‘ZERO’ button within 1second after pressing the ‘OFF ’ button. We stronglyrecommend that EXPERIENCED USERS refer to section6.3 before attempting to use this mode. Press ‘ZERO’ toselect through the list of changeable ‘MENU’ screens. Press‘SIGNAL’ to ‘SELECT’ the digit or line to be changed. Press‘INTEGRATE’ to ‘INCREMENT’ the digit or line that hasbeen selected. Press ‘HOLD’ to ‘ENTER’ a changepermanently in the detector EEPROM . All changes, whether‘ENTERed’ or not, appear as a temporary change in th eRAM. Press ‘ON/OFF’ to ‘EXIT’ this mode at any time.
‘NO OFF’: This message will blink in the ‘status’register (lower right corner of the LCD) when the automati c10 minute shutoff feature has been disabled . This indicatesthat a previous user selected ‘AUTO SHUT OFF’‘DISABLED’ using the programming mode capabilities.
4.2 ANALOG DATA RECORDER OUTPUT
An analog output voltage is available via the RecorderOutput Jack located in the lower right corner of the frontpanel. This accepts a standard RCA type coaxial phonojack. The graph below shows a typical recorder plot usin gthe ILT1400.
cm2’. If the signal over ranges in ‘LO INTEG’ mode, hitthe ‘INTEGRATE’ button twice within one second to switchto ‘HI INTEG’ mode and a higher signal range .
4.2.1 Voltage RangeThe voltage is designed to be compatible with most stri p
chart and X-Y recorders, and yet provide a large enoughsignal to avoid excessive noise pickup. For these reasons,we have selected a range from 0 to 1.0 Volt (1000 mV),rescaling every decade to provide sufficient resolution. Toaccomplish this, the ILT1400 first converts the digits on th edisplay into scientific notation form, with a mantissa an dexponent component. The mantissa portion of the reading,ranges between 1.000 and 9.99 before the exponent portionis scaled either up or down by a decade . The analog voltagecreated is equal to 100 times the mantissa, in milli Volts.Consequently, a mantissa of 1.000 creates a voltage of 100mV, and a mantissa of 9.99 creates a voltage of 999 mV. Ifthe voltage goes either above or below one of thesethresholds, the recorder output ranges by a decade t oaccommodate the reading . The graph on the previous pageis given as an example of a typical strip chart recordingusing the ILT1400.
4.2.2 Auto Ranging ConsiderationsThe ILT1400 auto ranging software is designed to limit
the least significant digit to 0.5 % of the full scale reading,and the resolution on the low end to 10 picoAmperes. Theinstrument decides whether to display either three or fou rdigits of resolution. When the magnitude of the reading onthe display is greater than 2000 (disregarding the decima lpoint), the smallest digit represents less than 0.5 % of th etotal, so the instrument displays only the three most reliabl edigits. The units auto range every three decades, usin gstandard SI prefixes from femto to Mega.
The resolution of the 1000 mV Analog Recorder Outputis 7 mV, inherently limiting the minimum resolution. Inorder to display the full seven decades of dynamic rangewhile providing significant resolution, the Analog RecorderOutput auto ranges EVERY DECADE. The output spansfrom 100 mV to 1000 mV, automatically ranging uponreaching either threshold . When the output is increasing an dpasses 999 mV, the voltage instantly drops to 100 m V andcontinues increasing. Similarly, when the output isdecreasing and drops below 100 mV, the voltage instantly
13
PROGRAM MODEON/OFF TO EXIT
AUTO SHUT-OFFENABLED (10 min)
+123.4 mW/cm2SIGNAL NO OFF
+22.7 J/cm2HI INTEG NO OFF

jumps to 999 mV. These range changes are easy to spot on atypical chart recorder plot. Thus, by noting the decade atany point on the plot, the other decade changes can be easil ydeduced.
4.2.3 Negative ReadingsSince there is no such thing as negative light, we elected
to use a Unipolar Digital t o Analog (D/A) Converte r.Negative readings should not occur if the ‘ZERO’ wasproperly set and if your ambient conditions do not changethroughout the experiment. From our own experiences ,however, we understand that mistakes occasionally get madewhich make the reading go negative . The data will not ge tlost since the absolute value of the negative reading will besent out to the recorder. From the plot it is fairly easy todetermine that the reading is negative, since the curve comesback up after it hits zero. If in doubt, it would be wise torerun the experiment .
4.3 SERIAL OUTPUT
Detector Edge Connector Pinout:LINE 1: “DODM” - EEPROM Out and “BUSY NOT”LINE 2: “DIDM” - EEPROM Input and “D ATA”LINE 3: “SKDM” - Clock for EEPROMLINE 4: “CSDM” - Chip Select for EEPROM or PrinterLINE 5: “GARD” - Signal ReturnLINE 6: “INPUT” - Current Signal InputLINE 7: “GND” - GroundLINE 8: “RQSNDNOT” - Request to Send (Not)LINE 9: “-5V” - Negative 5 VoltsLINE J: “+5V” - Positive 5 Volts
For users who wish to connect to a computer the A51025-pin or the A511 9 -pin RS232 Adapter Cables can bepurchase separately. These are typically used for animmediate hard copy of time variation o r optical profilingmeasurements. We provide Complimentary LabVIEW®Virtual Instrument drivers on our website: http://www.intl-lighttech.com/library/software/
For the more experienced users who wish to connect to acomputer or data collecting device we provide detailedinformation on the data format. One of the big advantagesof the serial output is the ability to interface directly withmost computer user ports without buying a n expensivehardware adapter. A small machine language (o r evenBASIC) program can often make a direct connectionpossible. We can also provide a copy of a ver y basic programto get users started.
The ILT1400 Serial Output Port transmits a 12 byte,fixed field scientific notation reading (4 numericalmantissa digits with a +/ - sign and decimal point, the lette re, 2 exponent digits with a +/- sign, a carriage return, andline feed).
4.3.1 Baud RateThe ILT1400 is factory set to an asynchronous baud
rate of 1200 BPS. Baud rate is the number of bits persecond transmitted in each word. In this case, there are 1 0bits transmitted per characte r, which translates to amaximum of 120 characters per second. In actual practice,however, the ILT1400 computer sends character data onl yhalf the time, resulting in one transmitted character every 1 /60 of a second. This is typical for asynchronous datatransmissions.
4.3.2 Character FormatThe 20 bits that make up each character word ar e
comprised of 1 start bit, 8 data bits, and 11 stop bits. Theextra 10 stop bits provide a necessary delay to allow themicroprocessor to perform its other duties. Thanks tocrystal control, the length of a single character (before thestop bit) is exactly 7.5 milliseconds, followed by a stop bi tdelay of exactly 9.17 milliseconds . The following diagra mshows the voltage waveform for the serial character formatof the number “5”. The binary number is transmitted inreverse order, from least to most significant digit . The mostsignificant digit is always a binary zero (+ 5 Volts), whichensures a negative leading edge to the first stop bit.
Request to Send (“RQSNDNOT”) and Chip Select(“CSDM”) are held low. An external button can bewired between “RQSNDNOT” and “GND” to provideremote sampling. When the switch is closed,connecting PIN 2 to PIN 4, the ILT1400 will send acontinuous stream of data at a rate of one line (onereading) per second. The output is expressed indigital exponential notation . The ILT1400 transmitsdata once every 0.5 seconds.
14

‘e’ to separate the mantissa from the exponent . The eighthcharacter is a ‘+’ or ‘-’ sign for the exponent. The ninth andtenth characters are the 2 digit exponent. The eleventhcharacter is a carriage return. The twelfth character is a linefeed.
ASCII Decimal Hex BinaryLF 10 0a 0 0 0 0 1 0 1 0CR 13 0d 0 0 0 0 1 1 0 1+ 43 2b 0 0 1 0 1 0 1 1- 45 2d 0 0 1 0 1 1 0 1. 46 2e 0 0 1 0 1 1 1 00 48 30 0 0 1 1 0 0 0 01 49 31 0 0 1 1 0 0 0 12 50 32 0 0 1 1 0 0 1 03 51 33 0 0 1 1 0 0 1 14 52 34 0 0 1 1 0 1 0 05 53 35 0 0 1 1 0 1 0 16 54 36 0 0 1 1 0 1 1 07 55 37 0 0 1 1 0 1 1 18 56 38 0 0 1 1 1 0 0 09 57 39 0 0 1 1 1 0 0 1e 101 65 0 1 1 0 0 1 0 1
4.3.3 Voltage Levels & Current DriveThe output voltage level on PIN 3 (“DATA”) of the DIN
connector is capable of driving one TTL load. The voltageswing will be a full five (5 ) Volts instead of the typica l TTLvoltage of four (4) Volts. The serial word will be in negativelogic for the printer (positive logic for the EEPROM). Innegative logic, a logic ‘ONE ’ will be between 0.0 and 0. 8Volts and a logic ‘ZERO ’ will be between 2.4 and 5. 0 Volts.The output line is capable of ‘ sinking’ 1.3 milliAmps, and o f‘sourcing’ much more than 100 microAmps, which conformsto the one TTL load requirement. The inverted Request toSend line (“RQSNDNOT”) on PIN 1 of the DIN connectorwill initiate transmission of the data string when pulled to avoltage below +0.8 Volts, provided that the Chip Select line“CSDM” is also low.
4.3.4 Word String FormatThe ILT1400 sends out a string of serial words
(characters) to transfer the displayed data to othe requipment, such as a printer or computer. The interfacesends out exactly twelve (12) characters to portray the lineof data. The first character is a ‘+’ or ‘-’ sign for themantissa. The second character is the first digit of th emantissa. The third character is a decimal point. Thefourth, fifth, and sixth characters are the remainder of the 4digit mantissa. The seventh character is the lower case letter
4.3.5 Plug and Cable RequirementsWe offer the A510 25-pin and the A511 9-pin RS232Adapter Cables as optional accessories to the ILT1400 tofacilitate easy connection of the ILT1400 to a serial devicesuch as a printer or computer . Please contact one of our salesrepresentatives for ordering information It is also possible to use one of the many commerciallyavailable Serial-to-USB adapters to interface the ILT1400 to aUSB printer or the USB port of a computer. (requires A511 soldseperately)
15
6. PROGRAM MODE -OPERATION
WARNING: THE N.I.S.T. TRACEABLEINTERNATIONAL LIGHT CALIBRATION PROVIDEDWITH YOUR ILT1400 IS VALID ONLY FOR THESENSITIVITY FACTOR AND UNITS SPECIFIED ONYOUR CALIBRATION CERTIFICATE. PROGRAMMINGIS NOT RECOMMENDED FOR INEXPERIENCEDUSERS.
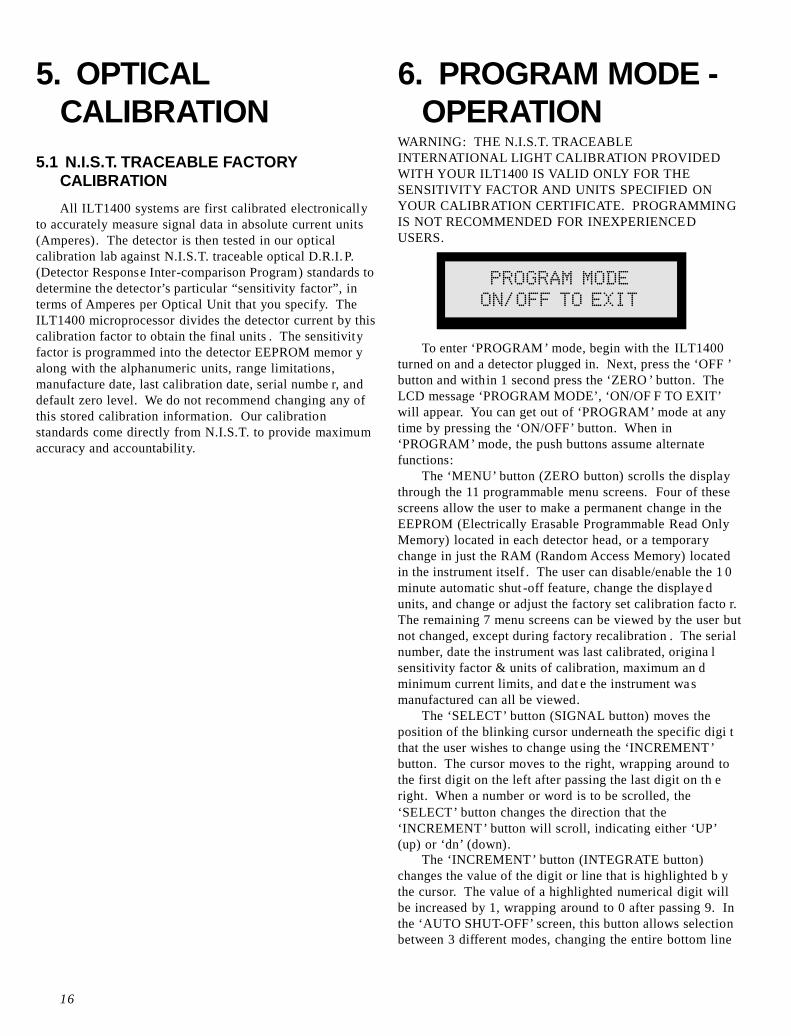
To enter ‘PROGRAM ’ mode, begin with the ILT1400turned on and a detector plugged in. Next, press the ‘OFF ’button and with in 1 second press the ‘ZERO ’ button. TheLCD message ‘PROGRAM MODE’, ‘ON/OF F TO EXIT’will appear. You can get out of ‘PROGRAM’ mode at anytime by pressing the ‘ON/OFF’ button. When in‘PROGRAM’ mode, the push buttons assume alternatefunctions:
The ‘MENU’ button (ZERO button) scrolls the displaythrough the 11 programmable menu screens. Four of thesescreens allow the user to make a permanent change in theEEPROM (Electrically Erasable Programmable Read OnlyMemory) located in each detector head, or a temporarychange in just the RAM (Random Access Memory) locatedin the instrument itself . The user can disable/enable the 1 0minute automatic shut -off feature, change the displaye dunits, and change or adjust the factory set calibration facto r.The remaining 7 menu screens can be viewed by the user butnot changed, except during factory recalibration . The serialnumber, date the instrument was last calibrated, origina lsensitivity factor & units of calibration, maximum an dminimum current limits, and dat e the instrument wasmanufactured can all be viewed.
The ‘SELECT’ button (SIGNAL button) moves theposition of the blinking cursor underneath the specific digi tthat the user wishes to change using the ‘INCREMENT’button. The cursor moves to the right, wrapping around tothe first digit on the left after passing the last digit on th eright. When a number or word is to be scrolled, the‘SELECT’ button changes the direction that the‘INCREMENT’ button will scroll, indicating either ‘UP’(up) or ‘dn’ (down).
The ‘INCREMENT’ button (INTEGRATE button)changes the value of the digit or line that is highlighted b ythe cursor. The value of a highlighted numerical digit willbe increased by 1, wrapping around to 0 after passing 9. Inthe ‘AUTO SHUT-OFF’ screen, this button allows selectionbetween 3 different modes, changing the entire bottom line
5. OPTICALCALIBRATION
5.1 N.I.S.T. TRACEABLE FACTORYCALIBRATION
All ILT1400 systems are first calibrated electronicallyto accurately measure signal data in absolute current units(Amperes). The detector is then tested in our opticalcalibration lab against N.I.S.T. traceable optical D.R.I. P.(Detector Response Inter-comparison Program) standards todetermine the detector’s particular “sensitivity factor”, interms of Amperes per Optical Unit that you specify. TheILT1400 microprocessor divides the detector current by thiscalibration factor to obtain the final units . The sensitivityfactor is programmed into the detector EEPROM memor yalong with the alphanumeric units, range limitations,manufacture date, last calibration date, serial numbe r, anddefault zero level. We do not recommend changing any ofthis stored calibration information. Our calibrationstandards come directly from N.I.S.T. to provide maximumaccuracy and accountability.
16
PROGRAM MODEON/OFF TO EXIT

of the display. In the ‘UNITS SELECT’ and ‘ADJ’ modes,the ‘INCREMENT ’ button increments the screen in eithe rthe ‘UP’ or ‘dn’ direction, chosen using the ‘SELECT’ key.
The ‘ENTER’ button (HOLD button) permanently storesany changes in a screen in the detector EEPROM memory.If this button is not pressed, the changes will appea rtemporarily in the instrument ’s RAM memory, but will berestored to the original EEPROM values if the unit is turne doff. When a screen is ‘ENTERed’, the menu advances to th enext screen.
The ‘EXIT’ button (ON/OFF button) simply exits theuser from ‘PROGRAM MODE’, returning immediately t o‘SIGNAL’ mode and initiating any temporary or perman entchanges in operation .
6.1 ‘ PROGRAM MODE ’ - Quick Reference:
6.1.1 MENU # 1:
‘ZERO’ button: To advance the ‘MENU ’ to screen # 2.‘ON/OFF’ button: To ‘EXIT’ the programming mode at
any time.
6.1.2 MENU # 2:
‘ZERO’ button: To advance the ‘MENU’ to screen # 4.‘SIGNAL’ button: To ‘SELECT’ the direction that the
list of units increments, either ‘UP’ or ‘dn’ (down).‘INTEGRATE’ button: To ‘INCREMENT’ through the
list of units in the up or down direction, selecting the unit sshown on the display. UNITS CHANGES DO NOTAFFECT THE NUMERICAL VALUE OF THE READING.
‘HOLD’ button: To ‘ENTER’ a change permanently.Changes that were not entered will be reset when th einstrument is turned off.
‘ON/OFF’ button: To ‘EXIT’ the programming mode atany time.
‘PROGRAM MODE’ - Quick Reference (continued):WARNING: THE N.I.S.T. TRACEABLE
CALIBRATION PROVIDED BY INTERNATIONALLIGHT WITH YOUR ILT1400 IS VALID ONLY FOR THESENSITIVITY FACTOR AND UNITS SPECIFIED ONYOUR CALIBRATION CERTIFICATE.
6.1.4 MENU # 4:
‘ZERO’ button: To advance the ‘MENU ’ to screen # 3.‘INTEGRATE’ button: To ‘INCREMENT’ the bottom
line between three choices: ‘ENABLED (10 min)’,‘DISABLED (temp.)’, and ‘DISABLED (PERM.)’.
‘HOLD’ button: To ‘ENTER’ a change permanently.Changes that were not entered will be reset when th einstrument is turned off.
‘ON/OFF’ button: To ‘EXIT’ the programming mode atany time.
6.1.3 MENU # 3:
‘ZERO’ button: To advance the ‘MENU ’ to screen # 5.‘SIGNAL’ button: To ‘SELECT’ the digit that you wish
to increment.‘INTEGRATE’ button: To ‘INCREMENT’ the digit that
you selected. A factor change will immediately affect thenumerical value displayed, but not the units.
‘HOLD’ button: To ‘ENTER’ a change permanently.Changes that were not entered will b e reset when theinstrument is turned off.
‘ON/OFF’ button: To ‘EXIT’ the programming mode atany time.
6.1.5 MENU # 5:
17
PROGRAM MODEON/OFF TO EXIT
AUTO SHUT-OFFENABLED (10 min)
AUTO SHUT-OFFDISABLED (temp.)
+123.4 Nw/cm2UNITS SELECT UP
+123.4 nW/cm2UNITS SELECT dn
+12.19 pW/cm2FACTOR 1.000e+00
+123.4 nW/cm2FACTOR 9.876e-05
+123.3 nW/cm2ADJ UP 9.876e-05

6.1.11 MENU # 11:
‘ZERO’ button: To advance the ‘MENU ’ to screen # 6.‘SIGNAL’ button: To ‘SELECT’ the direction that you
wish to increment the sensitivity factor, either ‘UP’ or ‘dn’(down).
‘INTEGRATE’ button: To ‘INCREMENT’ the leastsignificant digit of the sensitivity factor in the up or downdirection for minor adjustments. The displayed readingimmediately reflects this adjustment.
‘HOLD’ button: To ‘ENTER’ a change permanently.Changes that were not entered will be reset when th einstrument is turned off.
‘ON/OFF’ button: To ‘EXIT’ the programming mode atany time.
‘PROGRAM MODE’ - Quick Reference (continued):
6.1.6 MENU # 6:
‘ZERO’ button: To advance the ‘MENU’ to the nextscreen. FOLLOWING MENU # 11, THE DISPLAYRETURNS TO MENU # 1.
‘ON/OFF’ button: To ‘EXIT’ the programming mode atany time.
ANY CHANGES THAT WERE ENTERED USINGTHE ‘HOLD’ BUTTON WERE PERMANENTLY SAVEDIN THE DETECTOR’S CONSTANT MEMORY. ALL UN-ENTERED CHANGES WILL BE TEMPORARILYSTORED IN RAM, AFFECTING THE OPERATION OFTHE INSTRUMENT ONLY UNTIL THE POWER ISTURNED OFF.
6.2 Disabling the Automatic Shut-Off
6.1.7 MENU #7
6.1.8 MENU # 8:
6.1.9 MENU # 9:
6.1.10 MENU # 10:
18
The first menu screen the user encounters i n‘PROGRAM’ mode is ‘PROGRAM MODE’, ‘ON/OF F TOEXIT’. When the ‘MENU’ (ZERO) button is pressed, thedisplay scrolls to one of the ‘AUTO SHUT OFF’ screensportrayed above. When the ‘INCREMENT’ (INTEGRATE)button is pressed, the bottom line of the display change sbetween three different forms: ‘ENABLED (10 min)’,‘DISABLED (temp.)’, and ‘DISABLED (PERM.)’. Aftermaking the appropriate selection, press the ‘ENTER’(HOLD) key to permanently store the change in the detecto rEEPROM. If the user leaves this screen without first‘ENTERing’ the change, only the instrument’s RAMmemory will be a ffected, causing a temporary change tha t
+123.3 nW/cm2ADJ dn 9.876e-05
SERIAL NUMBER0123456
+123.4 nW/cm2IL CAL 9.876e-05
CALIBRATION DATEDa20 Mo03 Yr98
MANUFACTUREDDa22 Mo11 Yr97
DETECTOR CURRENTMAX COUNT 6AD8
DETECTOR CURRENTmin 1.000e-11
+123.4 mW/cm2SIGNAL NO OFF
AUTO SHUT-OFFENABLED (10 min)
AUTO SHUT-OFFDISABLED (temp.)
AUTO SHUT-OFFDISABLED (PERM.)

will be reset as soon as the power is turned off. TheILT1400 will then restore the original values from thedetector EEPROM when turned on . When the automaticshut-off has been disabled, the instrument will blink th emessage ‘NO OFF’ in the status register of the LCD durin g‘SIGNAL’ mode, shown above. Since the ILT1400 isprogrammed to allow integration for as long as necessary tocomplete a measurement, the instrument will neverautomatically shut off while actively integrating.
‘ENABLED (10 min)’ is the standard mode ofoperation, causing the instrument to aut omatically shut offif a keypress is not sensed within 10 minutes while i n‘SIGNAL’ mode. As mentioned above, while i n‘INTEGRATE’ mode, the ILT1400 will operate indefinitelywithout shutting off to provide for long term integrationmeasurement sessions. However, if ‘HOLD’ is pressedwhile in ‘INTEGRATE’ mode, the instrument willautomatically shut off in 10 minutes. Remember to hit‘ENTER’ to permanently enable (or disable) the automaticshut-off feature.
‘DISABLED (temp.)’ causes the instrument toTEMPORARILY disable the automatic shut-off. Thisparticular selection does not need to be ‘ENTERed’, since itis inherently a temporary change and will not be stored inthe detector EEPROM. The instrument will reset to th epreviously established mode when the power is lost.
‘DISABLED (PERM.)’ causes the instrument toPERMANENTLY disable the automatic shut-off, until thisfeature is enabled again in program mode. Remember to hit‘ENTER’ to permanently disable (or enable) the automaticshut-off feature.
6.3 Changing the Displayed Units
WARNING: CHANGING THE DISPLAYED UNITSMERELY CHANGES THE WORD, NOT THE ACTUALREADING. THE READING MUST BE SCALED BYCHANGING THE SENSITIVITY FACTOR. YOURINTERNATIONAL LIGHT CALIBRATION IS VALIDONLY FOR THE SENSITIVITY FACTOR AND UNITSSPECIFIED ON YOUR CALIBRATION CERTIFICATE.
Press the ‘MENU’ (ZERO) button to scroll to th e‘UNITS SELECTION’ menu screen. Use the ‘SELECT’(SIGNAL) button to choose ‘UP’ or ‘dn’, changing thedirection that you scroll in the list of units. Press the‘INCREMENT’ (INTEGRATE) button to scroll to the nextset of units in the up or down direction. Press the ‘ENTER ’(HOLD) button when you have selected the proper units i f
you would like the change to be stored permanently on th edetector EEPROM. Please note that changing the displayedunits merely changes the word portion of the display. Thenumerical readout will not be converted to the new units(except for unity conversions such as lm/m2 to lux, etc.).The mathematical conversion can, however, be accomplishedby changing the sensitivity factor.
6.4 Changing the Sensitivity FactorWARNING: THE N.I.S.T. TRACEABLE
CALIBRATION PROVIDED BY INTERNATIONALLIGHT WITH YOUR ILT1400 IS VALID ONLY FOR THESENSITIVITY FACTOR AND UNITS SPECIFIED ONYOUR CALIBRATION CERTIFICATE. ALLCALIBRATION FACTORS REQUIRE THE USE OF THEEXACT COMBINATION OF SENSOR, FILTERS ANDINPUT OPTICS THAT WERE USED DURINGCALIBRATION.
We have designed the ILT1400 to accommodate thediverse needs of our customers. Our calibrations ensureN.I.S.T. traceable accuracy in absolute optical units. Sincewe recalibrate the complex electrical circuitry of ou rinstruments before recalibrating to the N.I.S.T. opticalD.R.I.P. standard, we recommend recalibration only byInternational Light Technologies . We do recognize,however, that some customers require the capability tooptically self calibrate their own detectors to an in-housestandard or to simply read the absolute current output of adetector in Amperes. Some users may also want to chang eback and forth periodically between the English and SI unitssystems. For these reasons and many more, we allow theEXPERIENCED USER the versatility to change thesensitivity factor that determines the reading displayed onthe instrument.
The ILT1400 accurately measures over seven decades oflow level current changes, from 10 picoAmperes to 350microAmperes. The instrument is electronically calibrate dto measure this current absolutely, in Amperes. The detectorhead is then calibrated in our labs against a N.I.S.T.traceable optical standard to obtain a sensitivity factor, inAmperes per desired Optical Unit, such as 1.876 x 10⁻³
Amps/Watt/cm2.The ILT1400 divides the measured current reading by
the sensitivity factor to render an answer in the desiredoptical units. Naturall y, the sensitivity factor for direc treadout in Amperes is 1.000 x 100 Amps/Ampere, a unityconversion factor.
Self calibrating an ILT1400 to an in-house standard isremarkably easy to accomplish . The instrument displays th eongoing signal reading even as the sensitivity factor isincremented. This allows the user to adjust the reading to a nestablished optical standard in real time. For example, th esensitivity factor can be adjusted until the reading agreeswith a previously calibrated detector’s output. Forproduction environments, the reading can be adjusted to anarbitrary number, such as 100.0, that relates to the maximumoutput of a lamp standard. Readings would ther eafter bedisplayed in percent .
19
+123.4 lm/m2UNITS SELECT UP
+123.4 luxUNITS SELECT dn

Converting to a di fferent set of units, such as from foot -candles to lux is also quite simple . The conversion is 1 foot -candle = 10.76 lux. Multiply the sensitivity facto r, in Amps/fc, by 1/10.76 fc/lux to obtain a new sensitivity factor i nAmps/lux. With a foot-candle sensitivity factor of 2.152 x10⁻³ Amps/fc, the new sensitivity factor for direct readout i nlux would be 2.000 x 10⁻⁴ Amps/lux.
Since the sensitivity factor is given in Amperes perOptical Unit, a new factor can be calculated by measuringthe current output of the detector i n Amperes (sensitivit yfactor of 1.000 x 100) and dividing by the output of acalibrated detector or lamp standard in the desired Optica lUnits. A simpler trick for accomplishing this is to enter thevalue of the output (in Optical Units) of a calibrated detecto ror lamp standard as a sensitivity facto r. The instrument wil lthen read out the desired sensitivity factor as a reading.Enter that reading as the new sensitivity factor and adjustusing the ‘ADJust’ mode. Remember that the sensitivityfactor must be entered using scientific notation.
To change a sensitivity factor, first scroll to the‘FACTOR’ menu using the ‘MENU ’ (ZERO) key. Move thecursor to the mantissa or exponent digit you wish to chang eusing the ‘SELECT’ (SIGNAL) key. Increment that digitusing the ‘INCREMENT’ (INTEGRATE) button. As youincrement the digit, the displayed reading will chang eimmediately to indicate the results of the new sensitivityfactor being changed. If you wish to permanently store thenew factor on the detector memor y, simply press the‘ENTER’ (HOLD) button after changing the sensitivityfactor.
The original sensitivity factor and units are permanentlystored in an unchangeable menu screen for reference shoul dthe user desire to eventually return to the original N.I.S.T.traceable factory calibration.
To make fine adjustments to the sensitivity factor inorder to match the output of an established detector or lampstandard, scroll to the ‘FACTOR’ menu using the ‘MENU’(ZERO) key. Press the ‘SELECT’ (SIGNAL) button tochange the direction the factor will be incremented, eithe r‘UP’ to increase or ‘dn’ to decrease. Press the‘INCREMENT’ (INTEGRATE) button to increment thereading. You will notice that the reading decreases when thefactor is increased, but keep in mind that the reading is onl yupdated every half second if attempting to match the outpu tof a calibrated standard. Remember to press ‘ENTER’(HOLD) to permanently store the new facto r.
Once again, we caution that only EXPERIENCEDUSERS use the programming capabilities of the ILT1400 tochange sensitivity factors and optical units information. Amisleading reading could lead to overexposure ofphototherapy patients, underexposure of photoresists, orinvalid research results. Only a N.I.S. T. traceablecalibration can guarantee the accuracy of a reading. Ove rthe years, we have calibrated light measurement equipmentmanufactured by hundreds of different companies for ourcustomers. Many instruments have linearity problems,spectral inconsistencies, or simply display more resolutionthan the instrument is capable of measuring. It is unwise t orely on the accuracy of uncalibrated equipment .
Many companies calibrate detectors at the peak responsewavelength of the detector, without the benefit of a ‘flat’response. Measurements at different wavelengths couldappear as much as 90 % lower than the actual reading ,resulting in significant overexposure. When measuring aspectrally monochromatic source, such as a lase r, it isimperative to calibrate detectors at the isolated wavelengthunless a ‘flat’ response detector is used.
Many customers have relied on the output of lampstandards to provide a reference for calibrating measurementequipment. The amount of light emitted by some lamps canchange as much as 5 % for a 1 % change in line voltage .Lamps degenerate significantly over time, losing as much as50 % of their original brightness in the first thousand hoursof use, even though the current is accurately regulated.Whenever a lamp standard is used, it is best to verify itsoutput with calibrated measurement equipment to ensur eaccuracy.
6.5 Read-Only Menu Screens
MENU # 6:
20
+9.29 fcFACTOR 1.076e-03
+100.0 luxFACTOR 1.000e-04
+99.9 luxADJ UP 1.000e-04
+100.1 luxADJ dn 9.999e-04
SERIAL NUMBER0123456

MENU # 10:
MENU # 11:
The six View Only screens shown above cannot bereprogrammed by the use r. They do, however, provideinformation that may be useful to some users . These screensare primarily used for factory calibrations.
Screen # 6 gives the serial number of the detecto r. Thisinformation is useful if the serial number sticker on th edetector is lost or damaged .
Screen # 7 gives the original International LightTechnologies sensitivity factor and the units of calibration .This is a useful reference if the user changes the sensitivityfactor and subsequently wishes to return to the originalN.I.S.T. traceable calibration.
Screen # 8 gives the date that the detector was lastcalibrated. Screen # 9 gives the dat e the detector wasmanufactured. These dates are shown in a Day, Month,Year format. ‘Da29 Mo0 3 Yr91’ refers to 29March 1991, for example. These dates are important forretrieving previous calibration information from our files,and also alarm the user when his i nstrument has not bee ncalibrated recently.
Screen # 10 gives the maximum current count in th ecurrent to frequency converter before the ‘OVR RNG’message appears. The hexadecimal number 6AD8 is atypical value (350 microAmps). Screen # 11 gives the
MENU # 7: minimum current limit in Amperes for a down ranging limit.These screens are used by the factory calibrations engineerduring recalibration.
MENU # 8:
MENU # 9:
6.6 SELF CALIBRATION
The ‘PROGRAM’ mode is provided for thoseEXPERIENCED USERS who wish to calibrate theirdetectors to their own specifications. It is possible to selfcalibrate silicon detectors to a higher degree of accuracythan the N.I.S.T. standard, not to mention the elimination oftransfer errors. Refer to “Solar Cell Spectral Respons eCharacterization,” Edward F. Zalewski and Jon Geist,
Applied Optics, volume 18, number 23, 1 December1979; and also, “Silicon Photodiod e Absolute Spectra lResponse Self-Calibration,” E.F. Zalewski and J. Geist,Applied Optics, volume 19, number 8, 15 April 1980.
The technique they outline is independent of forme rapproaches to absolute radiometr y, which are based on th ethermal physics of blackbodies or electrical substitutionradiometers. They rely on the high level of perfectio nachieved in the manufacture of UV enhanced planar siliconphotodiodes to obtain an internal quantum efficiency withina few hundredths of one percent. Self calibration ca nachieve accuracies to within a few tenths of one percent overa wide spectral range. The National Institute of Standardsand Technology blackbody measurement standard is accurateto six percentin the ultraviolet, one percent in the visible, and four percentin the infrared.
For many users, absolute measurements can be replacedwith relative measurements. The ILT1400 can be self-calibrated to read out a number such as 100 when given a neffective dose of light for a particular process . The unit canthen be used to monitor any relative change in the receiveddose.
ILT also offers a self calibration procedure to allow addingor removing of neutral density filters. Neutral density filters areavailable in three ranges: QNDS1 for 10 times reduction insensitivity, QNDS2 for 100 times reduction in sensitivity, andQNDS3 for 1000 times reduction in sensitivity or attenuation.
To make the process easier, we have added an onlineQNDS self conversion calculator:http://www.intl-lighttech.com/library/calculators/qnds_calc.
Once you have determined your new calibration factor youmust follow the steps in chapter 6 “PROGRAM MODE” tomake the necessary adjustments to the existing calibrationfactor.
21
+123.4 nW/cm2IL CAL 9.876e-05
CALIBRATION DATEDa29 Mo03 Yr99
MANUFACTUREDDa29 Mo03 Yr98
DETECTOR CURRENTMAX COUNT 6AD8
DETECTOR CURRENTMin 1.000e-11

7. PRECAUTIONSThe ILT1400 has been designed to minimize problem s
due to improper operation of the instrument. The impactresistant, flame retardant , ABS construction of the outsid eplastic enclosure ensures durability in typical hand-heldenvironments. The case is specially coated with Nickelinside to provide RF shielding which exceeds FCCrequirements. Despite the durability that we haveengineered into the ILT1400, our 25 years of experience inmanufacturing laboratory instruments has shown us thatusers often overlook simple precautions that would preventmost mishaps from ever occurring.
A) Be certain to reset the zero level if you are in doub tabout the level it was last set to. The ILT1400 stores thezero in the detector memor y, even after the unit is o ff andthe detector removed. The previous user may have set it tosubtract a very high level, which will result in very low orpossibly negative readings.
B) Use only quality batteries in your instrument . Wehave provided you with four top -quality, leak-proof,alkaline AA batteries. Do not use rechargeable batteries.Remember, also, to replace batteries when the ‘BAT LO’message appears in the status register.
C) Use caution when measuring U V or high powersources. Proper goggles should be worn that absorb U Vwhen in the proximity of applications using in tenseultraviolet light, such as Phototherapy, UV curing,Photoresist exposure, and Printing Plate Lithograph y. Weoffer UV rejecting sunglasses (A26) that are specificallydesigned to block out all Ultraviolet wavelengths. Also,remember never to look d irectly into any laser beam, with o rwithout protective eyewear.
D) Shipping Precautions : Always pack your instrumen twell when returning it to be recalibrated or repaired. A lackof packing material can cause the instrument to accelerate atan extreme rate. These ‘G’ forces can severely damage aninstrument even when the outside carton shows no sign ofabuse.
E) When unplugging detector heads from the top of theILT1400, pull them straight off. Do not apply torque forcesto the card edge connector in any way. Periodically rub thecontacts of the edge connector with a rubber pencil eraser o rsimilar nonabrasive material to remove dirt and corrosionwhich may have built up.
F) Do not attempt to modify the circuitry in yourILT1400. Tampering with the electronics will void thewarranty. If modifications are necessary, we can provideschematics of the area to be modified and technicalassistance.
22
8. APPLICATIONS8.1 CURRENT AND CONDUCTANCE
MEASUREMENTS
Most light detectors have a linear relationship betweenthe incident irradiance and the current output as long as th edevice is biased correctly. The ILT1400 is a verysophisticated, programmable, current and conductancemeasurement instrument. Current is measured in the unit sof Amperes, while conductance is measured in units o fSiemens, where a Siemen is the reciprocal of the resistanc eunit known as the Ohm. There are many other types o ftransducers that also have an output which is a change ofcurrent or conductance. These devices cover measurementsin the fields of temperature, pressure, humidity, ionizingradiation, pH, voltage, weight, magnetic force, and so on.The instrument can be programmed to automatically displa yany measurable units over an unequalled dynamic range.The current produced by a standard I.L. device can bedisplayed by changing the sensitivity factor to 1.000 e0.
8.1.1 PolarityMost light sensitive devices can be configured to
produce a negative current (positive electron flow) easierthan a positive current. This is especially true o fphotomultipliers and vacuum photodiodes. One of th esimplest detector configurations uses a detector into anoperational amplifier, configured in the trans-conductancemode, which produces a positive output voltage. Wemeasure negative current from the sensitive input (pin 6)with respect to instrument signal ground (pin 7) or withrespect to the signal guard (pin 5), depending on the biasrequirements of the individual detectors . An alternatedetector configuration for measuring Conductance is toconnect the cathode of a semiconductor photodiode to th einput and the anode to -5 Volts (PIN 9).
8.1.2 OverloadIn order to protect the ILT1400, we have designed the
input to take a great deal of overload. There is a limit,however, due to the sensitive nature of the measured signals.It is impossible to completely protect the input from ever ykind of abuse. Generally speaking, the input will take abou t10 milliAmperes of either positive or negative current, fromD.C. to 100 MHz, for a short time (about 5 seconds). Theinput will also survive voltages of approximately plus orminus 5 volts for a similar short time duration. This type of

protection offers good survival to most modern circuitaccidents, and is designed to withstand most RadioFrequency pickup that may be present in typical use renvironments. One of the most common R. F. sources is theigniter for arc lamps. These lamps generate about 30,000volts at 1 MHz during ignition. The induced radiation fromthis process has been known to destroy volt-ohm meters andother instruments, even when they are not plugged in t oanything. The coupling is strictly radio frequenc ytransmission to a nearby circuit. This type of damage is nota rare occurrence if you operate many arc lamps, as we do i nour calibration lab. Since we have had a personal interest inwithstanding this kind of damage, we have gone to grea ttrouble to design the proper protection into the ILT1400.
8.2 FLUX DENSITY MEASUREMENTS
Flux density is properly defined as the density of ligh tincident upon a surface. Flux is a measurement of ligh tenergy, typically expressed in Watts for radiometricmeasurements or in photopically weighted Lumens fo rphotometric measurements . When a sample of this flux ismeasured over a standard area, the flux density can becalculated in units of flux per unit area, such a s Watts persquare centimeter or Lumens per square foot (foot-candles),for example. For this measurement to be accurate, th eincoming light beam must overfill the detector (be la rgerthan the entrance aperture). In all flux densitymeasurements, the density will drop o ff as the measurementplane gets farther from a point light source. This concept,the “inverse square law”, means that the reading will beinversely proportional to the square of the relative distancefrom the light source. For example, if your ILT1400 reads aflux density of 36.0 mW/cm2 when you are 1 meter from asource, it will read 1/4 of 36, or 9.00 mW/cm2, when youmove back twice as far, to 2 meters away. If you move backthree times as far, to 3 meters, your ILT1400 will read 1/9 of36, or 4.00 mW/cm2.
Distant light from the sun, moon, and stars is far enoughaway to be considered infinite, so that even large changes inearth altitude produce negligible “inverse square law” errors.Keep in mind, however, that the atmosphere acts as both anattenuator and a diffuser. If you were to measure theradiometric irradiance of the sun from a high altitudeweather balloon, the atmosphe ric attenuation would b esignificantly reduced at certain wavelengths, depending onozone levels, etc. Also, on an overcast day, the clouds act asan excellent diffuser, causing light to shine equally from al lportions of the sky. Even though the cloud ceiling may bevery close compared with the distance to the sun, th e“inverse square law” will not affect the measurement,because the detector will actually be measuring brightness(luminance or radiance), which does not change wit hdistance. This is a special phenomenon which occur swhenever a uniform source is spatially wider than theacceptance angle of the detecto r. The area of the overcas tsky is wider than the 180 degree acceptance angle of thedetector. Luminance and radiance detectors typically have
very narrow acceptance angles (2.5 degrees), for measuringthe brightness of a uniformly radiating area source . Whenyou back away from the uniform source, the detector “sees ”a wider area of the source that is proportional to the squareof the distance, exactly cancelling the drop in densit yexpected from the “inverse square law”.
8.2.1 Radiometric Irradiance (W/cm2)Irradiance is the measurement of the density of ligh t
striking a surface. The most conventional units ofmeasurement are Watts per square centimeter (W/cm2),although some users prefer nonstandard units . We canprovide detectors to measure in any system of units, or hel pyou to convert from W/cm2.
Irradiance measurements require a “flat” spectralresponse over the wavelength range of the light source. Thisensures that light density in di fferent regions of the spectru mis weighted evenly. There are two notable exceptions tothis, Photometric Illuminance and E ffective Irradiance. I nboth cases, the sensitivity to light at different wavelengths isweighted to correspond to the biological or chemical e ffectof those wavelengths. Photometric measurements match thehuman eye’s response to colors, since the eye sees greenlight proportionally better than violet or red, and cannot seeultraviolet or infrared light at all . An Effective Irradiancemeasurement uses a special function designed to match theneeds of the user. Usually, it is designed to match the actio nspectrum of some chemical reaction or polymerizatio nprocess.
UV Curing is a good example of an E ffective Irradianceapplication. The detector should be designed to match th eaction spectrum of the photoresist or polymer film, not thelight source, since the light source emits a wide range o fwavelengths of light. Some of those wavelengths will have asignificant chemical effect, some will have proportionallyless effect, and some none at all. In this wa y, the opticalreading will be directly proportional to the effect on thechemical process. The integral of this is the EffectiveEnergy (Joules/cm2). This exposure measurement directlycorrelates to how much curing took place .
In any light measurement, it is important to realiz eexactly what light the detector is measuring. A flat responsedetector “sees” much more than visua l light. It sees theInfrared light given o ff by your body or any warm object, a swell as light from any Ultraviolet sources, none of which ar evisible by the human eye. Filters may be desired to bloc kunwanted bands of light. More often, it is useful to bafflethe measurement environment. For example, an open lampon an optical bench will radiate in all directions . Anyonemoving near this lamp becomes a secondary reflectingsource of optical radiation which is sure to change th ereading. Baffles and black satin cloth curtains are ver yhelpful in isolating the experimental area. A hole down theoptical axis should have a sharp edge to avoid reflectionsfrom the edge itself. Also, square holes are better thanround holes, since edge reflections are le ss likely to bepropagated down an array of multiple ba ffles. Use plenty offlat black paint to reduce reflections to a minimum. If you
23

are working in the infrared, you might want to get some“3M Black Velvet” which is known to absorb all the way outto 60 microns.
Spatially, the irradiance detector measures with adesirable Lambertian, or “cosine” response . This means thatlight shined directly at the detector will be sensed 100% ,light from a 45 degree angle will be sensed 70.7%, and lightfrom a 90 degree angle will not be sensed . This mimics theeffect of light and reflected light shining on any flat surface ,since at oblique angles, the effective area is reduced. Forexample, if you were to look at a round piece of paper on atable from a 45 degree angle, it would look like an oval wit habout one third less area than the actual circle had whe nviewed from above. Light shining onto the circle from a 4 5degree angle also “sees” this reduced area oval, meaning thatless light will hit the circle . The cosine response i simportant for measuring the actual amount of light thatwould fall on a given planar area from a multitude o fsources.
Reference distance is also an important consideration.Your irradiance detector measures the flux densit y, which isdependent on the distance from the source and the “inversesquare law” mentioned above. If you wish to know howmuch light is hitting a particular surface, simply place th edetector at the same reference distance as that surface. I fyour application is UV Curing, place the probe in the curingoven where the process takes place. If your application isphototherapy, place the detector at the same distance fro mthe exposure lamps to the plane of the patient ’s skin. If it isimpossible to place the det ector in the proper referenc eplane, the inverse square law can be used to accuratelycalculate the proper flux density if the source is a napproximate point source .
8.2.2 Photometric Illuminance (lux or foot-candles)Photometric Illuminance is the flux density of VISIBLE
light per unit area. In common terms, it is the amount of“illumination” provided by natural and man made ligh tsources, finding applications in artificial office lighting,emergency backup lighting, entrance and stairway lighting,parking lot illumination, and even behavioral researchstudies of sleeping habits under various lighting conditions.As was mentioned above, Photometric Illuminance is anEffective Irradiance measurement that is weighted to matchthe “photopic” eye response of the CIE “Standard Observer”curve. (We also manufacture detectors to match th e“scotopic” night vision response) . The photopicallyweighted unit of flux is the lumen, which can only beconverted to optical Watts at specific wavelengths, sinceeach wavelength is weighted di fferently. One Watt of flux at555 nm is equivalent to 683 Lumens. Illuminanc emeasurements are normally expressed in the SI units o fLumens per square mete r, also called lux (lx). Occasionall yLumens per square centimeter, or phot (ph), are used. In theEnglish system, units are expressed in Lumens per squarefoot, or foot-candles (fc). One foot-candle is equal to 10.76lux. We recommend using lux, since they are recognize dworldwide.
When making an illuminance measurement, the i nputaperture of the detector must be overfilled. In order t omeasure a beam that is narrower than the opening of th edetector, simply move the detector back away from thesource until the beam spreads out enough to completel yflood the detector. Remember, of course, the implications ofthe “inverse square law”. As you move back from thesource, the flux density decreases exponentially as theinverse square of the relative distance from the source. Thiseffect can be harnessed to measure an unusually brightsource, by simply backing away from it to reduce the flu xdensity.
A general rule in illuminance measurements is to alway splace the detector in the same reference plane as the surfacethat is illuminated. If you are measuring stairwa yillumination, for example, you would want to place th edetector on the surface of the stair, not at eye level pointedat the stair. Illuminance measures all the light falling on asurface. Luminance, on the other hand, measures brightnes ssimilar to the way the human fovea (image analysis portionof the eye) analyzes a very narrow angular area.. For thestairway illumination example, illuminance is measuredbecause it is a constant. The stairs and overhead lighting arefixed. Luminance, on the other hand, could be measured inan infinite number of different ways, depending on wherethe detector is placed and what it is aimed at. Luminance isusually reserved fo r uniformly radiating area sources, suchas backlit signs or video monitors, whereas illuminance isused to measure how much light is falling on a surface. Thereference plane for photometric illuminance detectors is theoutside surface of a Teflon® diffuser (or first ring on a Wdiffuser). This surface should be placed in the samelocation as the surface that you wish to measure.
8.2.3 Phototherapy - UVAThere are many cosmetic and dermatologically
therapeutic treatments involving exposure to Ultraviolet-Alight (315 to 400 nm), the wavelength band which trigger smelanin production in the epidermis. The standard detectorfor UVA measurement is the SEL033/UVA/TD. The typicalunit will read out in Watts/cm2 in ‘SIGNAL’ mode, andJoules/cm2 in ‘INTEGRATE’ mode.
Typical UVA phototherapy exposure chambers utiliz especial fluorescent bulbs to generate UVA radiation. Theoutput of these short wave fluorescent lamps tends todegenerate significantly over time. In fact, a typical UVAlamp output will degenerate 70% in just 6000 hours. A UVAPhototherapy Radiometer will enable a medical technician tomonitor the output of the lamp array accurately in order toadjust the exposure time for the proper dose. Once a wee kor so, the technician (wearing protective eye wear) willsimply check the average flux density (Watts/cm2) at thereference plane of a typical patient ’s skin (inside the booth )to adjust the exposure times for that week based on th emeasured irradiance and the desired exposure.
24

For a more empirical calculation of the Effective Doseof UVA, simply place the detector in the booth at the leve lof the patient’s skin and put the ILT1400 in ‘INTEGRATE’mode. The instrument will automatically calculate th eongoing accumulated dose in Joules/c m2. Remember topress ‘HOLD’ if you wish to terminate or pause theintegration. If you hit ‘HOLD’ a second time, theinstrument will unfreeze the display and return to theuninterrupted integration, allowing intermediate readings tobe taken. Constant monitoring of fluorescent exposur ebooths is necessary, both to ensure a safe, effectiveultraviolet dosage and to evaluate when the fluorescentlamps need replacement . As mentioned above, after onl y6000 hours of use, a patient will need to be exposed for upto three times as long to accumulate the same treatmen tdose.
8.2.4 Phototherapy - UVBUltraviolet-B radiation consists of any light in the
spectral band between 280 and 315 nm. For manyphototherapy applications, this “Actinic” radiation can bereplaced by UVA, since UVB often irritates or damages th eskin, leading to skin cance r. For certain skin disorders,however, moderate doses of UVB light combined withcertain drugs can be remarkably beneficial. Psoriasis, askin irritation condition, can be controlled in this manner.Close monitoring of UVB lamp output and doses isESSENTIAL, considering the dangers of overexposure aswell as the lamp degradation problem mentioned above .Also, remember to always wear protective eye wear whenworking with short wavelength sources.
The technique for measuring UVB wavelength light issimilar to the UVA radiometric irradiance dose measurementdescribed above. The UVB detector should be placed at th esame reference plane as the patient ’s skin. Be sure to useyour UVB detector (SEL240/UVB1/TD, for example), notyour UVA detector, for measuring UVB light. UVB light ismuch more dangerous than UVA, and your UVA detectorwill not sense any UVB light. Typical lamps may have alarge UVA component, leading to misleading results if thewrong detector is used. All International LightTechnologies detectors are clearly marked with detector typeand serial number. If ever in doubt, simpl y check theengraved labels on the individual filter rings to be sure youare using the proper detector.
8.2.5 Hyperbilirubinemia Phototherapy - BlueVisible
Jaundice is a very common condition requiring medicalattention in newborns. The yellow coloration of the skin andsclera in newborns with jaundice is the result of accumulation ofunconjugated bilirubin, often referred to as neonatalhyperbilirubinemia.
Phototherapy is the primary treatment in neon ates withunconjugated hyperbilirubinemia. Phototherapy employs bluewavelengths of light to alter unconjugated bilirubin in the skin.Our Hyperbilirubinemia probe is designed to match thewavelength specific photo-oxidation response of bilirubin toprovide optimal measurement of the therapeutic radiation.
As with most phototherapy applications, it is importan t toplace the detector in the same reference plane as th e patient’sskin. The fact that blue light is visible mislead s most peopleinto believing that it is much safer tha n ultraviolet light.Excessive doses of blue light constitute a significant healthhazard. The U.S. National Institute of Occupational Safetyand Health (NIOSH) has accuratel y defined the “BlueHazard” wavelength band, and the maximum allowable dailydosage. Refer to NIOSH researc h publications for moreinformation on Blue Hazards.
Another important factor to consider when exposin g patientsto intense blue light is the fact that many fluorescenthyperbilirubinemia lamps emit a si gnificant amount o fradiation in the UVA band (315 - 400 nm), which is notsensed by a bilirubin probe . We strongly recommend the useof protective eye wear, especially by medical technicians,who may not realize the ambient dose radiatio n they areexposed to over time.
8.2.6 ACGIH and NIOSH Actinic UV HazardACGIH has extensively researched the effect of light at
specific wavelengths on human skin. They accurately definethe hazardous effects of ultraviolet light as a function o fwavelength. This weighted spectral effect plot is referred toas the Actinic hazard function, with the relative hazardproportionally weighted from 200 nm to 315 nm (maximumhazard at 270 nm). NIOSH also recommends the use of theACGIH standards to define hazardous working conditions.ACGIH updated the Actinic function by logarithmicallyextending this hazard data through the U VA to 400 nm. Thisrevision is an important consideration. Although the effectof the UVA band is proportionally much less than that of theUVB and UVC bands, an intense UVA source poses asignificant Actinic threat. We have custom designed ourActinic filter using thin film techniques to precisely matchthe new Actinic hazard function curve released by ACGIH,out to 400 nm. This is essential fo r accurate EffectiveIrradiance measurements. The ILT1400 combined withSEL240/T2ACT displays Effective Watts/cm2, providingimmediate, direct hazard readings when compared t oThreshold Limit Values.
8.2.7 IES Luckeish and DIN Germicidal / UVCThe germicidal band is precisely defined by IE S
Luckeish and DIN standard curves. Light in this wavelengthband acts as a germicide, killing germs and microo rganisms.Many hospital operating rooms employ mercury arc lamps,shining germicidal light inside an open wound as theoperation takes place to kill environmental germs. Almost98% of a Low Pressure Mercury lamp output occurs atprecisely 254 nm. The peak of the effective irradiancecurve, however, is at 265 nm. Light from a Mercury lamphas only 85% of the effect that an equal amount of 265 nmlight would have. Our SEL240/T2ACT5 germicidal detectorweights the effect of all light in this band to its actualgermicidal effect, regardless of the type o f source used. Anarrow band detector measuring only light at 254 nm canalso be used (XRL140T254)
25

Broadband UVC measurements require a two stepzeroing process. The SEL240/TD measures both UVB (280to 315 nm) and UVC (200 to 280 nm) wavelength light. TheSEL240/UVB1/TD combination adds a sharp cut filter(UVB1) to measure only UVB. The SEL240/TD can beused alone in a single step measurement for most genera lpurpose Ultraviolet applications. Some users requirereadings that separate the UVB and UVC components,however. For that reason, we include the following threestep measurement process for measuring both UVB andUVC individually:STEP 1: MEASURE UVB AND UVC, RECORD DATAMeasure the incoming UVB + UVC light from yourUltraviolet source using the SEL240/TD detectorconfiguration. RECORD THIS DATA.
STEP 2: MEASURE 90 % UVB, ADJUST DATA TO100 % UVB
Next, remove the empty filter ring and replace it wit hthe UVB1 filter ring, for the SEL240/UVB1/TDconfiguration. The UVB1 filter causes the detector t omeasure only the light in the UVB band. However, since theUVB1 filter has a transmission in the UVB of 90 %, thi sdata must be adjusted to determine the actual amount o fUVB light in the source . To do this, simply divide the UV Bdata by 0.90 to obtain a LARGER number. This is theamount of UVB light.
STEP 3: SUBTRACT STEP 2 FROM STEP 1 TOOBTAIN UVC
Finally, subtract the adjusted UVB data (STEP 2) fromthe UVB + UVC data recorded earlier (STEP 1). The resultshould be a positive number, since the UVB is a componentof the overall reading . The answer is equal to the UVCoutput of the source.
8.2.8 Photoresist / UV CuringIn both Photoresist and UV Curing, chemical compounds
are used for their ability to polymerize when exposed to lightat certain wavelengths. Since these chemicals are onlysensitive to certain characteristic spectral bands, a detector isrequired which measures only th e wavelengths of interest,spectrally weighting the measurement to match the effect ofeach wavelength on the polymerization process. This type ofmeasurement, referred to as Effective Irradiance (Watts/cm2
& Joules/cm2), is essential since the spectral output ofexposure lamps does not match the required spectral dose. Aflat radiometric irradiance detector would measure eachwavelength equally to accurately reflect the lamp output,whereas an effective irradiance detector measures only theuseful wavelengths, weighted proportional to their chemicaleffect, regardless of lamp output.
Photoresist applications involve selectively exposingphotosensitive chemicals to short wavelength light topolymerize the material in a particular pattern for use inphotolithography industries such as Printed Circuit Boar dmanufacturing, Printing Plate production, and XRL140Bprovide low profile and durability for repeated use
in these intense UV exposure production environments. TheSEL240/QNDS3/TD is designed for use in SemiconductorMicrolithography applications in the deep UV.
UV Curing applications typically involve exposingphotosensitive inks, glues, and epoxies to short wavelengthlight for drying and hardening purposes. We offer theSEL005/WBS320/TD for this e ffective irradiancemeasurement. For continuous monitoring in particularlyharsh environments we recommend, the RAMP18 (18” Lright angle probe) or the new high temp fiber opt ics withhigh temp right angle adapter or diffuser.
We also manufacture a self-contained, lamp systemprofiling belt radiometer, the ILT400, for the harshradiation and extreme physical punishment of conveyorbelt production processes. The ILT400 has high ‘G’ forcemounts and a low profile, solid machined aluminumencasement that is polished for high reflectivity to reducetemperature rise and UV damage. Consult with an IL SalesEngineer for more information on these new ILT products .
8.3 FLUX MEASUREMENTS
8.3.1 Laser Power - Radiometric Laser PowerRadiometric laser power is the absolute measurement of
the spectral output power of a collimated, coherent beam o flight in optical Watts. The detector uses a flat response filte rto ensure radiometric acc uracy. For this type o fmeasurement, the laser beam must under -fill the inputaperture of the detector, to completely capture the energy ofthe beam. Our standard laser power detectors use either theSEL033 (33 mm2) or the SEL100 (100mm 2) silicon celldetector with a flat response filter with various input opticsand a beam aiming aperture (K9 - 9mm dia. or K15 - 15 mmdia.). We offer other specialized detectors for varieddynamic and spectral ranges or applications requiringspecial capabilities, such as thermal averaging for pulsedlasers.
When measuring laser power, we recommend centeringthe beam on the detector with the detector face normal tothe incoming light, although the detector allows a widemargin of error. The detector face will reflect a slightamount of light back at the lase r, providing an accurateindication of any offset angle. Simply aim the reflected spotback at the laser output aperture by adjusting the angle ofthe detector, keeping the beam aimed at the center of thedetector. Slight translation or angular o ffsets will not affectthe reading (± 4.5 mm, ± 10 degrees), allowing wide under -filled beams and multiple laser sources, if necessar y.Distance to the detecto r should not matter, provided thelaser beam still under -fills the aperture.
26
8.3.2 Laser Power - Photometric Lumen FluxPhotometric laser power is the measure of the visible
output of a laser, scaled to the eye ’s photopic response tolight. This is useful for any application requiring a measureof the visibility of a laser source, for laser projectiontelevisions, health hazards, spot illumination, medical laseroutput, special e ffects lasers, laser light shows, etc . Theunits of measurement for photometric flux is the Lumen(lm). This effective flux measureme nt is photopicallyweighted according to the CIE Photopic “StandardObserver” Eye Response curve. The same spatialconsiderations apply as for the laser power measurementsin the previous section.
8.3.3 Radiometric - Total Watt FluxTotal Watt flux is the measure of the total flux output of
a wide beam source or LED. This measurement requires a nIntegrating Sphere and flat response detecto r. The detectormust be calibrated with the integrating sphere for accuracyin optical Watts. ILT offers the SEL033/F/INS250 which willprovide direct readout in Watts on the ILT1400.
8.3.4 Photometric - Total Lumen FluxTotal Lumen flux is similar to total Watt flux for a wide
beam source or LED, except that the flux being measured i srestricted to the photopic (visible) portion of the spectrum.An Integrating Sphere is required for this type ofmeasurement. ILT offers the SEL033/Y/INS250 which willprovide direct readout in lumens on the ILT1400.
8.3.5 Photometric Intensity - Mean Spherical candlePowerTo properly measure the total flux from an isotropically
radiating source, one must “catch” all the radiatio nregardless of the emission direction. A sphere is the idealchoice for this application, since you can put the lamp rightinside the Integrating Sphere . Two of the standard intensit ymeasurements would be the candela and the Watt/steradianfor photometric and radiometric applications, respectively.An intensity measurement is the best indication of the tota lefficiency of a lamp, since it indicates its ability to convertelectrical power to optical flux .
Isotropic intensity is equivalent to a point source thatradiates equally in all directions . This is not physically ver ypractical, since most lamps require electrodes and a holde rto support the lamp, tending to block some of the outputradiation. A lamp with a reflector behind it would radiate agreat deal in one direction, but the same intensity units ar eoften used, so this combination can be compared to a nisotropic radiator. The units of beam intensity for theseapplications are beam candela (or beam candle power). Fo rthis situation, the measurement is best performed with a nIlluminance detector calibrated to read out in foot -candles
(lm/ft2). Beam intensity is then calculated bymultiplying the illuminance by the distance in feet squaredto get this equivalent intensity in one direction. If theoutput of the source may be used in all directions then anintegrating sphere and the Mean Spherical Candela (MSC)measurement is a better indication of performance. On the
other hand, if the output from the source is used in onedirection, then beam intensity measurements would be moreappropriate. These could be expressed in Lumens persteradian (or Watts/ steradian) in a given orientation, or inunits of beam candela , as previously mentioned. To maketotal flux measurements in an integrating sphere requireseither a “flat” response or a photopic responsedetector/sphere combination for the radiometric orphotometric measurement, respectively. We at InternationalLight Technologies are aware of how confusing these ligh tmeasurement units and setups can be. Please contact us fo rassistance with your specific application.
8.4 RADIANCE / LUMINANCE (Brightness)MEASUREMENTS
Our eyes interpret image details over a relatively narrowangle (approximately 2.5 degrees). This is the zone of thefovea where we analyze an image, as opposed to the entirelight sensitive region of the eye. For this reason, it is veryimportant to measure light in a similar fash ion to relate tothe visual effect. This photometric concept is calle dLuminance, or brightness, and the radiometric equivalent iscalled Radiance. In making FLUX DENSITY measurementsof Illuminance or Irradiance we find that the magnitude ofthe measurement drops off inversely proportional to thesquare of the distance from a POINT SOURCE to thedetector. This is true because the light is being spread out i ntwo dimensions (area), as one backs away from a source(hence, the square function). In making Luminance orRadiance measurements, we are determining the output fro ma SURFACE as a function of FLUX PER SOLID ANGLEPER UNIT AREA. In other words, we are summing up theoutput from an infinite number of Lambertian emitters(isotropic point sources) over some test surface area. Wemeasure this by looking at the area with a very narro wacceptance angle to intercept a small area inside the unifor msample emitting surface.
Changes in the distance do not change the reading, sinc ethe area being measured inc reases directly proportional t othe square of the distance, which is in direct opposition t othe inverse square attenuation as a function of distance. Inother words, the two functions cancel to give us a constantreading. This is why Luminance is a cons tant value for asurface, no matter where it is measured. The units forquantizing Luminance are Lumens per steradian per squar emeter (lm/m2/sr or nit). For Radiance, the units are Wattsper steradian per square meter. There is also an old Englishunit, the foot-Lambert (fL) that is still in use. Forconversion, 1 fL x 3.43 = nits.
To get the proper acceptance angle, you need ourRadiance (R) barrel, an internally baffled barrel with a 1.5degree field of vie w. The baffles are extremely important ,because they remove the reflections from the wall of thetube, letting in only the “line of sight” rays coming throughthe center of the tube. Be careful that the detector is“looking” at an area located in the uniform part of the testsurface. Also, if you back away too far from the tes t
27

surface, the input angle will eventually be bigger than thetest area, and inverse square law errors will occur. Using the SEL033/F/R or the SEL033/Y/ R the ILT1400will readout directly in either W/cm 2/sr or cd/m2 respectively.Information on alternative detector combinations is availablefor luminance and contact luminance (or radiance)measurements from our technical support representatives.
8.5 L.E.D MEASUREMENTS
LED (light emitting diodes) are solid stat e lampsmanufactured from semiconductor materials. Being narrow bandemitters they illuminate in a specific visible color or in theinfrared. Visible LEDs are available in the colors of blue, green,yellow, orange, or red. Light emitting diodes are recomme ndedfor both indicator and optical applications. Infrared LEDs arerecommended as light sources for phototransistors.
IL offers a variety of products to measure luminance,illuminance, beam intensity (cd) total flux (W,lm) and meanspherical intensity (W/sr,cd) of LED.
The SPL024Y pen probe permits the measurement ofthe entire output of the L.E.D. source using a miniaturecontact integrating sphere. For customers requiring beamcandela measurements of an L.E.D. source we also offer theSEL033/Y/LED. Both detectors provide simple measurementsby inserting the LED into the small aperture of either sensorand obtaining direct readout of Lumens or Candela respectivelyon the ILT1400 display.
8.6 TRANSMISSION MEASUREMENTSTransmission measurements are typically made as a ratiobetween two readings, usually expressed in percent.For example, a typical transmission measurement might beto measure the illuminance passed through a tinted windowcompared to the illuminance directly from the light source.You will need a light source that is stable over the tim einterval used for the measurements. Keep in mind that a1% change in the lamp current of an incandescent bulboften produces a 3% change in the light output (refer toPlanck’s blackbody radiator equation for more information).Voltage regulation is therefore very important . Also be sureto let your lamp warm up su fficiently before makin gmeasurements.
Another important requirement is an aperture andbaffles. The aperture is necessary to define the cent raloptical area of the sample filte r. An exception to this rul eoccurs if using a narrow beam from a source such as a lase r.The beam defines its own aperture. The next step is to selectan optical bandwidth that is of interest. The light source orthe receiving detector is filtered to this desired region. Nowyou are ready to make everything physically stable for themeasurements. The full scale reading is taken through th elimiting aperture before the sample is placed behind thi saperture. Then the transmission sample is inserted and th eattenuated reading is taken. Simply divide the secondreading by the first reading and multiply by 100 for atransmission reading in percent.
8.7 REFLECTANCE MEASUREMENTS
Reflectance is similar to transmission, with a few morecomplications. The ultimate use determines if it i simportant to measure specular reflectance, diffusereflectance, or both. Most objects around the room arediffuse reflectors, or close approximations. So if the resultrelates to how well a human can see something, then diffusewould be appropriate. A mirror is a specular reflectordesigned to bounce the light at an angle that is equal aroun dthe normal to the surface. Many surfaces, such as coatedpaper, have a specular component as well as a diffusecomponent.
All reflectance measurements require some specialfixtures. In the case of Specular reflectance, you must hav ea detector holder that can be swept in an angular arc of 180degrees about a rotational point which has a holder fo r theflat sample reflector. A stable light source is directed acrossthe top of this rotational point where it is reflected astandard distance to the detecto r. The reference condition i sset by shining the light through the rotational point at thedetector with the mirror removed. The reflector is thenplaced directly over this rotational point at an angle of 4 5degrees to the source . The detector is rotated, also abou tthis same point, for an angle of 90 degrees or until a peakoutput is found by watching the meter readings. It isimportant that the distance is still the same as it was beforemoving the detecto r. The sample surface must be flat i norder to reproduce the same beam divergence as presentwithout any reflector present . There are many variations tothis method, depending upon the ultimate use of thereflector. Obviously, if the reflector is a curved surface thi swould not work.For diffuse reflectance, an integrating sphere o rgoniophotometer must be used to capture the di ffusecomponents of reflectance, integrating the entire divergentreflectance angles. Both methods require very specialequipment, and will be lightly discussed here. In the firs tcase, a collimated light beam projects through an integratin gsphere, out an opposite po rt on the other side (the “sample ”port). A detector with the desired spectral response isplaced in the sphere surface orthogonal to this beam so as tobe blind to either of the other ports. The ‘ZERO’ button ispressed with the sample port open . Then a white reflectancestandard is placed in the sample port, with a surface such a sbarium sulphate, magnesium oxide, etc. This reading is the100% reference value. The standard is removed andreplaced by the sample that you wish to reflect light off of.This reading is the di ffuse sample value. If the standard ha da reflectance of 98%, then you must first divide the standar dreflectance by 0.98 before dividing into the di ffuse samplevalue and multiplying by 100 for an answer in percent. Agoniophotometer uses a computer driven, rotating mirro rarm to measure total flux or total reflectance. This precisionmechanical system can scan a reflector in at least ahemispherical solid angle for the most accurate descriptio nof reflectance, at great expense, however.
28

8.8 SPATIAL RESPONSE
8.8.1 Lambertian “ Cosine” ResponseLambertian Response is in reference to a particula r
angular response which is proportional to the cosine of th eincident angle. In other words, for the angle normal to theface of the detector (0 degrees), the magnitude is the cosin eof 0 degrees, or 1.0 (100%). As the angle goes off axis andbecomes parallel to the face of the detecto r, the reading goesto zero, since the cosine of 90 degrees is zero . At 45degrees, the cosine is 0 .707, which means that the detecto rshould read the rays with 70.7% of the value produce by thesame rays entering normal to the input device .
The reason this spatial response is necessary foraccurate measurements is that it matches the spatial responseof a perfect absorbing surface. Since Irradiance andIlluminance are measurements of light falling on a surface ,the cosine is compatible with these measurements. Ananalogy of the perfect absorber might be considered as bein ga small hole in a piece of s heet metal placed over a well . Allthe light that goes in that hole will be absorbed by the deepwell hole underneath. None will get reflected back up out ofthe same hole. If we analyze the effect of a change of angle,such as the sun moving from high noon to sunset, we wil lsee that less light can make it into the hole at sunset ,because the effective area of the hole is smaller as you viewit from an oblique angle. This reduction in area is directlyproportional to the cosine of the angle normal to thissurface. On polar plotting pape r, the cosine makes a circle ,which is convenient when comparing the ideal response withthat of an actual plot.
8.8.2 Field BafflingThere are times when you should restrict the field o f view todelete oblique angles. In a lab environment, yo u may beworking with a light source on an optical bench. The onlylight of interest is from that source, yet light bounces off thepeople in the room and back to the detector, creating errorsin the readings. This means that you are better off torestrict the field of view if you know there ar e no sources tobe measured at the oblique angles . This can be done withexternal baffles or with our accessory hoo d(H). Baffles can be made from sheet metal cut to form asharp edged hole in the middle. A square hole is actuallybetter than a round hole, since it is less likely to creat ereflections in a multi -baffle array. Also, black velvet i sexcellent for dividing o ff test areas from the rest of the roo mlighting. If it is necessary to have light travel down a tube,you can thread the inside of the tube to reduce the wal lreflections. When making Luminance or Radianc emeasurements, it is absolutely necessary to restrict the fieldof view to one that ‘sees ’ only an intended test are a of areflecting or rear-lit surface. Baffles can be used toimplement this kind of measurement without resorting t oexpensive optics.
8.8.3 Narrow Angle (Luminance / Radiance)As just mentioned, there is a requirement for a narro w
field of view when making Luminance and Radiancemeasurements. This can be accomplished by lenses as in ourRadiance barrel “R” accessory. In some applications it i saccomplished by using a telescope where the light is pickedup from a small spot in the image plane. This is very nicefor measuring the brightness of an illuminated segment of a nalphanumeric display, or for measuring the dot brightness onthe face of a CRT. Unfortunately, these systems are ver yexpensive. Another alternative is to use simple lenses toimage a small portion of a test field onto an aperture whic hhas a detector behind it. This is very effective, especially ifthe source is a repetitive configuration in a productionsituation. A custom setup can be made to specificallymeasure that on a smal l emitting surface. Our “R” barrel hasa 1.5 degree field of view, with the objective lens beingabout one inch in diamete r. This is effective as long as thetarget is larger than one inch. The target requirement iscalculated by multiplying the distance(measured from the target surface to the front lens of the RBarrel, in inches) times 2*tan(2.5/2), plus the 1 inch (25.4mm) diameter of the input aperture and some margin forerror. If you were 12 inches awa y, the detector ‘sees ’ acircular target approximately 1.5 inches in diameter. Sincethe target should generally be much la rger than the field ofview of the detector, the target should be at least 2 inches indiameter when you are 12 inches away.
8.8.4 Uniform Linear Translation ResponseThe best type of detector setup for uniform receive r
sensitivity is the input port of an integrating sphere, sinceany off axis beam will still be captured in the chambe r. Forflux measurements, it is necessary to have this uniformity sothat small errors in cen tering the beam do not contribute t oany error in the measured reading. Our narrow bea madapter (H/N/K15) attachment is designed to accept a fewmillimeters of axial misalignment without appreciablechanges in the reading . This is necessary to allow fo rnon-critical positioning in laser beam measurements. The SEL100/FQ/K15 allows the greatest margin oferror in axial misalignments . The large, 100 squaremillimeter silicon cell is fitted with a 15 millimeterdiameter conical aimin g aperture with an a ttenuated “flat”response filter. The user is simply required to ai m hislaser beam inside the aperture fo r guaranteed linearcontinuity. Of course, if centering errors are compoundedby an angular offset, the laser beam ma y not directlystrike the silicon cell, causing significant errors in thereadings. Centering and normalizing the detector to theincoming beam is a simple procedure and should no tcause any problems
29
8.9 TEMPORAL RESPONSE
This refers to the light time response. There are manyfactors that should be considered when measuring fast lightpulses, including the need for instantaneous information an dthe ability to discern whether dose information is accurate .To obtain instantaneous data with a traditional voltage o rcurrent measurement system, the entire electrical system,including the final oscilloscope, must be properly designedand matched. This includes the connecting cable ,characteristic impedances, and matching amplifiers. In mostcases, it is also necessary to put a preamplifier in thedetector itself to match the high impedance of the detector t othe coaxial cable . When you use a system such as this, th edynamic range is limited to a few decades at best, and aut oranging is impractical .
For these reasons, we have chosen to design theILT1400 for optimal dose measuring ability, whichgenerally matches the ultimate goal of the light pulse and i scompatible with the same detectors used for constant wave‘SIGNAL’ measurements. The energy in a pulse is generall ythe factor that determines its effectiveness to perform work,and therefore is the best figure of merit when making ameasurement. Capacitance is one of the properties of adetector that is very detrimental to fast instantaneousmeasurements, but does not produce an e rror whenintegrating, since it just tends to store the cha rge forsubsequent removal. By designing charge measuringelectronics into the instrument, we rely on cha rge storage ina capacitor on the front end of the system to even out su rgesin line voltage or measure low amplitude flashes . TheILT1400 can store approximately 10 nanoCoulombs ofinstantaneous flash charge. This allows the instrument tomeasure fluorescent lamps and unstable sources withaccuracy averaged over a half second interval. The ILT1400is not specifically designed to measure high amplitudeflashes. We recommend at least full second of exposure tolight when measuring with the ILT1400 depending on thelight levels. The ILT1400 has the ability to extendmeasurement time when measur ing low light levels so longerexposure times may be required. For this reason ILTrecommend using the ILT1700 for pulsed light sources.Consult a Sales Engineer or review product specifications online for information on the ILT1700 Flash Photometersystems available.http://www.intl-lighttech.com/applications/photometry
8.9.1 Low Duty Cycle (Fast Pulse)As mentioned above, the ILT1400 is not designed to
maximize flash measurement performance . The instrumentmeasures the continuous current from the det ector with theadded ability to measure peak surges that would otherwiseexceed the current measurement range of the instrument .Fluorescent lamps are an example of a low duty cycle lightsource. The fluorescent bulb pulses at twice the lin efrequency, approximately 100 (EUR) or 120 (USA) timesper second. This continuous stream of pulses is averaged toprovide an accurate representation of the strength of th elamp. Momentary surges are also accommodated withoutdisrupting measurement.
For applications involving high power, low duty cyclelasers, we offer a specialized thermopile detecto r, theSEL623/K9. This detector contains a built in preamplifierstage, and inherently averages the incoming reading,measuring the thermal average of the laser power.
8.9.2 High Peak AmplitudeThe ILT1400 will not measure a continuous current
signal greater than 350 microAmperes without displayin gthe ‘OVR RNG’ status message. Due to the chargemeasuring capability of the system, the ILT1400 canmeasure a flash current of as much as 2.2 milliAmps for a 5microsecond flash. Longer duration flashes or higheramplitude peaks will cause detector saturation, since thecharge storage capacity of the system is limited to 1 0nanoCoulombs.
These peak current limitations may not mean much tomost users, since the system reads out in optical units, no tAmperes. Given the extremely wide dynamic range of theILT1400, it is unlikely that you will encounter any di fficultymeasuring most sources of light. If a signal is below th elowest range of the detector, the display will read zero. Ifthe signal exceeds the maximum range of the detecto r, thedisplay will read ‘OVR RNG’ .
30

9. ILT1400 GENERALPECIFICATIONS
9.1 ELECTRICAL SPECIFICATIONS
9.1.1 System PowerThe ILT1400 is provided with 4 quality AA alkaline
batteries, for portable operation on 6 volts DC. TheILT1400 draws a mere 26 mA during constant operation,providing a typical usable operation period of 54 hours withfresh batteries.
The ILT1400 can also be operated on a wide variety ofexternal power supplies, for extended operation time. Thevoltage regulator inside the unit accepts input voltages from5 volts DC to 15 volts DC. In practical terms, this mean sthat you can run the unit off of any DC power supply from a5 volt computer source to a 12 volt automobile battery o ralternator. The ILT1400 is equipped with an external 110Vonly AC power adapter plug to facilitate powering the ILT1400from a 110V AC main (requires optional A516 AC PowerCable).
9.1.2 Signal Input (current)The ILT1400 Radiometer/Photometer is capable of
measuring detector input currents from a displaye dresolution of 10 picoAmperes up to a maximum of 350microAmperes.
9.1.3 Current Measurement AccuracyThe LCD display is capable of displa ying full scale
current measurement to an accuracy of ± 0.92% from 100nA to 350 µA, ± 1.5% below 100 nA. The RS232 outputprovides the same accurac y. The analog recorder output i saccurate to ± 1%, or ± 4 mV.
9.1.4 Radio Frequency Output EmissionsThis equipment generates and uses radio frequency
energy and if no used properly, in strict accordance with themanufacturer’s instructions, may cause interference to radioand television reception. It has been type tested and foun dto comply with the limits for a class B computing device i naccordance with the specifications in subpart J of part 15 o fFCC rules, which are designed to provide reasonableprotection against such interference in a residentialinstallation. However, there is no guarantee thatinterference will not occur in a particular installation. TheILT1400 encasement interior is coated with a special R Fconductive shield to prevent any such interference.
9.2 OPTICAL ACCURACY
Optical accuracy is a very difficult entity to address,because it changes with wavelength and so varies by theexact detector combination used . The detectors calibrationuncertainty is listed on the Optical Calibration Certificate andis in addition to the NIST uncertainty to absolute, which canvary from less than 1% in the visible to over 6% in theultraviolet, and over 4% in the infrared .
9.2.1 Radio Frequency Input Signal InterferenceSince the normal measurement range of electrica l
currents and charges is extremely small, input errors ca noccur from large sources of radio frequency emission. Theinput is especially vulnerable to pickup if the input cable i snot shielded. All ILT detectors use shielded input cablewhich is also necessary for any user provided input device.
9.3 SIZE AND WEIGHT
Size: 185 mm height x 100 mm width x 43 mm depth.Weight: 555 grams.Dimensions do not include detector heads or remot e
probes. Please visit the website for specific detectordimensions.
9.4 ENVIRONMENTAL SPECIFICATIONS
Operating temperature range: 5 to 40 degre es celsius.Storage temperature range: -30 to +60 degrees celsius .Operating and storage relative humidity: 0 to 90 percent .
31

10. MAINTENANCEAND REPAIR
10.1 PREVENTIVE MAINTENANCE
Since there are no moving parts except for the pus hbutton switches, the biggest problem over a long period o ftime is corrosion. Remove the batteries if the unit is not t obe used for an extended period of time, and store theinstrument in its carrying case or suitable plastic bag with asmall amount of silica gel or other desiccant. The opticalwindows should be cleaned from time to time with methy lalcohol or other window cleaning fluid. Be certain that th edetector card edge connector is not dirty, as well. Store theILT1400 with the detector head removed, in order to preventunnecessary stresses on the Printed Circuit Board edgeconnector.
For reference, the top board ( viewing the instrument fromthe back) is the amplifier board. It has a square cut out inthe middle where the battery compartment fits into theinstrument. The middle board is the computer board. Thebottom board is the instrument panel board, which contain sthe buttons and Liquid Crystal Display circuitr y. Eachboard is fastened individually to the encasement. Also, takecare when unplugging the flexible ribbon cables.
10.4 USER REPAIR POLICY
Due to the sophisticated nature of this computer contro land low level amplification, we do not recommend that theuser attempt to make repairs, except by way of boar dreplacement. Specialized equipment is necessary to find thesubtle problems that occur with these circuits, and t orecalibrate them to original specifications. Schematics canbe provided, however, to assist in finding certain powervoltages and input/output pin numbers, as well a s for theunusual situation where no other alternative is available, orcustom modifications are warranted.
10.2 BATTERY REPLACEMENT
To replace the batteries, you must remove the backcover of the instrument encasement according to thefollowing procedure:
A. Remove the 4 Phillips head screws which fasten theback panel of the instrument . We recommend using astandard Phillips type screwdriver to avoid damaging thescrew heads.
B. Carefully pull the back cover o ff, making sure notto pull off the battery wires which are still connected. Thebattery compartment is affixed to the back panel. Follow theinstructions for battery polarity as marked on the batter ycompartment.
C. Carefully replace the back cove r, taking care that al lwires fit snugly inside. Naturally, be sure not to drop loosebits of wire or other conductive material inside th ecompartment. Squeeze the back cover in place tightly an dreplace the 4 screws.
11. ONE YEARWARRANTY
International Light equipment is warranted for a periodof twelve (12) months from the date of purchase to be freeof defects in material or workmanship . This warranty doesnot apply to damage resulting from accident, alteration,abuse, and loss of parts or repair by other than Internationa lLight Technologies. The equipment will be repaired orreplaced, at our option, without charge to the owner for partsor labor incurred in such repai r. This warranty shall notapply unless the equipment is returned for our examinationwith all transportation charges prepaid to: InternationalLight Technologies, Inc.; 10 Technology Drive; Peabody,MA 01960; USA. International Light Technologies, Inc. hasno other obligation or liability in connection with saidequipment. To see a full version of our terms and conditions,please visit out website:
http://www.intl-lighttech.com/services/terms-and-conditions-of-sale
10.3 DISASSEMBLY AND PC BOARDREPLACEMENT
The ILT1400 has been designed so that each of the 3printed circuit boards can be exchanged without a ffectingthe calibration accuracy of the system. If you suspect acomponent failure in your ILT1400, first check theconnector contacts, buttons and batteries. The simplest wayto determine if a board is defective is by substitution. If youhave a back up meter, you may be able to try this option at your facility. Ifalternate boards are not available, the system would need tobe returned to the factory for evaluation and repair .
32


![CRNM - Telecoms Report Revised [Sep 07]](https://static.fdocuments.in/doc/165x107/58a347e11a28ab62248b5e33/crnm-telecoms-report-revised-sep-07.jpg)