REVIEWING OF PERFORMANCE - doenets.lk 05 - 2015 Symposium.pdf · REVIEWING OF PERFORMANCE At ......
49
Research and Development Branch National Evaluation and Testing Service Department of Examinations Curriculum Assessment & Evaluation Teaching Learning N E T S REVIEWING OF PERFORMANCE At Grade Five Scholarship Examination - 2015
Transcript of REVIEWING OF PERFORMANCE - doenets.lk 05 - 2015 Symposium.pdf · REVIEWING OF PERFORMANCE At ......

Research and Development BranchNational Evaluation and Testing ServiceDepartment of Examinations
Curriculum
Assessment&
Evaluation
Teaching Learning
N E T S
REVIEWING OF
PERFORMANCE
At
Grade Five Scholarship
Examination - 2015

- 1 -
The message of the Commissioner General of Examinations
The Grade 5 Scholarship Examination is conducted with the intentions of giving bursaries to bright but economically disadvantaged students and providing opportunities to bright students to gain admission to popular schools.
Almost every student who is studying in Grade 5 sit this examination. Therefore, this has become a popular and competitive examination among candidates. Much pains are being taken by candidates to reach a high level of achievement at this examination and principals, teachers and parents toassist the realization of their goals.
This booklet presented to you by the Research and Development Branch of the Department of Examinations contain valuable statistical information for wider reference categorized under 5 sections; General information, Performance of candidates, Analyses of Paper I and Paper II, Item analyses of Paper I and Paper II, and Best performing schools in the island. It is attempted here to present comprehensive analyses to provide information in greater detail.
The information provided here is of great importance to teachers, principals, In- service advisors, and directors to understand the tendencies and patterns of this examination in order to develop the learning teaching process. It is equally important to researchers and other stake holders in numerous ways to contribute to the development of Primary Education.
I wish to extend my sincere thanks to my staff at the Research and Development Branch who worked very hard to prepare this booklet for the benefit of all stake holders in the Education sector.
W.M.N.J. Pushpakumara Commissioner General of Examinations
Research & Development Branch Department of ExaminationsPelawatta, Battaramulla

- 2 -
Guidance
Mr. W.M.N.J. Pushpakumara - Commissioner General of Examinations
Derection & Editing
Mrs. Gayathri Abeygunasekera - Commissioner of Examinations (Research and Development)
Data Analysis
Mr. L.G.S. Samarakoon - Assistant Commissioner of Examinations
Assistance
Mrs. Buddika Perera - Assistant Commissioner of Examinations
Mrs. Manomi Senewirathne - Assistant Commissioner of Examinations
Mrs. Hasantha Kuruppu - Assistant Commissioner of Examinations
Mr. E.K. Nandakumara Edirisinghe - Computer Programmer & System Analyst Type Setting & Graphics
Mrs. W.A.D. Chathurika Dissanayaka
Technical Assistance
Miss. M.H.S. Raheena Miss. Piumi Madushani Mrs. O.M.D. Sewwandi Miss. S. Kanchana Miss. Darshika Nilupuli
Cover Design
Mrs. Y.S. Anuradhi
ii

- 3 -
List of Contents
1. General Information ........................................................................................... 1 1.1 Objectives of the Examination ................................................................... 1 1.2 History of the Examination ........................................................................ 1 1.3 Structure of the Examination Papers .......................................................... 2
2. Performance of Candidates 2.1 Performance of Candidates from 2011 to 2015 .......................................... 3 2.2 Overall Performance of Candidates ........................................................... 4 Performance by Medium ........................................................................... 4 Performance by Gender ............................................................................ 4 Performance by Income ............................................................................ 5 2.3 Performance of Candidates by Province from 2011 to 2015 ....................... 6 2.4 Performance of Candidates by Province - 2015 .......................................... 6 2.5 Performance of Candidates by Province arranged in descending order - 2015 . ............................................................................................... 7 2.6 Performance of Candidates by District from 2011 to 2015 ........................ 8 2.7 Performance of Candidates by District - 2015 ........................................... 9 2.8 Performance of Candidates by District, arranged in descending order ........................................................................................................... 11 2.9 Performance of Candidates by District and Income Level ......................... 12 2.10 Performance of Candidates by District and Gender ..................................... 13 2.11 Performance of Candidates by District and Medium.................................... 14 2.12 Performance of Candidates by Education Zone - 2015 ............................... 15 2.13 Performance of Candidates by Education Zone arranged in descending order - 2015 ................................................................................................. 17
3. Analyses of Question Papers 3.1 Comparison of Distribution of Total Marks - 2014 & 2015 ........................ 23 3.2 Distribution of Frequencies of marks for Paper I by Income Level ........... 24 3.3 Distribution of Frequencies of marks for Paper II by Income Level ......... 25 3.4 Distribution of Frequencies of Total marks by Income Level .................... 26 3.5 Distribution of Frequencies of marks for Paper I by Medium ................... 27 3.6 Distribution of Frequencies of marks for Paper II by Medium .................. 28 3.7 Distribution of Frequencies of Total marks by Medium ............................ 29 3.8 Distribution of Frequencies of marks for Paper I by Gender .................... 30 3.9 Distribution of Frequencies of marks for Paper II by Gender ................... 31 3.10 Distribution of Frequencies of Total marks by Gender ............................. 32
ii

- 4 -iv
4. Item Analyses of Question Papers 4.1 Item Person Map for Paper I ...................................................................... 33 4.2 Facility Indices of Question Paper I .......................................................... 34 4.3 Distractor Analysis for Paper I .................................................................. 35 4.4 Item Person Map for Paper II .................................................................... 36 4.5 Facility Indices of Question Paper II ........................................................ 37 4.6 Category Analysis for Paper II .................................................................. 38 4.6.1. Distractor Analysis for Multiple Choice Questions ................... 38 4.6.2. Category Analysis for Short Answer Type Questions ................ 39 4.7 Analysis of Essay Question in Paper II ................................................. 40 4.8.1. Pattern of Obtaining marks for Essay Question ........................ 40 4.8.2. WeaknessesIdentifiedinEssayQuestion.................................. 41
5. Performance of candidates by school ....................................................................... 42

- 1 -
1.1 Objectives of the Examination
1. Admission of bright students to popular schools.
2. Provision of bursaries to bright but economically disadvantaged students.
1.2 History of the Examination The examination was introduced in 1948 as Central Colleges Scholarship Examination for admission of bright students to Central Colleges. Number of students who sat the examination from 1952 to 1969 is given below.
Year Number Sat
1952 238061953 26180 1954 261801955 276261956 378201957 238061958 434841959 539291960 590291961 438551962 448861963 684391964 755621965 758751966 748421967 784011968 786041969 92030 (Jathika Navodaya Scholarships)
1. General Information

- 2 -
1.3 Structure of the Examination Papers
Ú Examination Consists of Two Question Papers:
Ú Before 1995, they were,
(i) First Language (ii) Mathematics
whichmeasured‘ProficiencyinLiteracy’and‘ProficiencyinNumeracy’.
Ú From 1995, the two question papers were restructured as, (i) Paper I (ii) Paper II
which measure the following learning abilities & potentials.
÷ Substitution÷ Interpretation÷ Prediction÷ Translation÷ Problem Solving÷ Seeing Relationships÷ IdentificationofCauseandEffect÷ Organization of Information÷ Perception÷ Observation÷ Inter-relations÷ Reasoning÷ Seeing Spatial Relationships÷ Following Instructions

- 3 -
2.1 Performance of Candidates from 2011 - 2015
Table 1 :
Figure 1 :
Grade 5 Scholarship Examinations 2011 - 2015Distribution of Candidates Sat the examination, obtained marks Above Cut Off, Mean Values and Standard Deviations by Year
2. Performance of Candidates
2011 2012 2013 2014 2015
312569 310329 322455 327648 333672
No. 203514 199809 223908 258700 254690
% 65.11 64.39 69.44 78.96 76.33
No. 32433 33383 32617 32735 31853
% 10.38 10.76 10.12 9.99 9.55
105.06 101.36 110.71 113.89 109.50
36.51 35.69 36.38 36.98 36.63S.D.
Above cut off
(Qualified to
receive bursaries
and apply for
schools)
Obtained marks 70
and Above (35 and
above for each
paper)
Number Sat
Year
Mean Value
291186
31704
Grade 5 Scholarship Examinations 2011 - 2015
Percentage of candidates who Obtained marks 70 and
Above (35 and above for each paper)
65.11 64.39 69.44
78.96 76.33
0
10
20
30
40
50
60
70
80
90
100
2011 2012 2013 2014 2015
Year
Per
cen
tage


- 6 -
2.3 Performance of Candidates by Province from 2011 - 2015
Table 2 :
Grade 5 Scholarship Examinations 2011 - 2015Distribution of Number of Candidates who obtained marks above
District Cut Off by Province & Year
2.4 Performance of Candidates by Province - 2015
Table 3 :Grade 5 Scholarship Examination - 2015
Distribution of Candidates who sat the examination, Above Cut Off, Obtained marks above 100 and above 70 by Province
* Percentage is calculated based on the number sat of each Province
Province
Number % Number % Number % Number % Number %
Western 8711 10.89 8869 11.21 8133 9.97 8425 10.18 8251 9.86
Central 3050 7.34 3228 7.75 2947 6.82 3014 6.91 2834 6.59
Southern 4309 11.03 4585 11.76 4702 11.67 4649 11.36 4337 10.42
Northern 1772 9.62 1651 9.46 1938 11.02 2064 11.00 2148 11.38
Eastern 2716 10.32 2762 10.41 2687 9.66 2380 8.52 2500 7.99
North Western 4267 11.62 4406 12.15 4262 11.30 4389 11.37 4149 10.51
North Central 2162 10.24 2282 11.05 2213 10.18 2134 9.72 2197 9.69
Uva 2147 10.30 2201 10.54 2229 10.05 2050 9.14 2172 9.72
Sabaragamuwa 3299 11.57 3399 11.81 3506 11.55 3630 11.84 3265 10.64
Island 32433 10.38 33383 10.76 32617 10.12 32735 9.99 31853 9.55
2015201320122011 2014
No. % No. % No. %
Western 83678 8251 9.86 65917 78.77 48131 57.52
Central 43002 2834 6.59 31462 73.16 21119 49.11
Southern 41638 4337 10.42 33960 81.56 25227 60.59
Northern 18871 2148 11.38 12999 68.88 8593 45.54
Eastern 31303 2500 7.99 19723 63.01 12773 40.80
North western 39464 4149 10.51 32083 81.30 23655 59.94
North Central 22672 2197 9.69 17592 77.59 12537 55.30
Uva 22353 2172 9.72 16648 74.48 11409 51.04
Sabaragamuwa 30691 3265 10.64 24306 79.20 18041 58.78
Island 333672 31853 9.55 254690 76.33 181485 54.39
Obtained marks
100 and above
(above 50 for each
paper)
Obtained marks 70
and above (above 35
for each paper) Province
Number
Sat
Above cut off

- 7 -
2.5 Performance of Candidates by Province arranged in Descending Order - 2015
Grade 5 Scholarship Examination - 2015
* Percentage is calculated based on the number sat of each Province
Province Above cut off
%
Northern 11.38
Sabaragamuwa 10.64
North western 10.51
Southern 10.42
Western 9.86
Uva 9.72
North Central 9.69
Eastern 7.99
Central 6.59
Island 9.55
Percentage distribution of candidates who obtained
marks above cut off by province *
Table 4.1
Percentage distribution of candidates who obtained
marks 100 and above by province *
Table 4.2
Percentage distribution of candidates who obtained
marks 70 and above by province *
Table 4.3
Province
Obtained marks
70 and above
(above 35 for
each paper) %
Southern 81.56
North western 81.30
Sabaragamuwa 79.20
Western 78.77
North Central 77.59
Uva 74.48
Central 73.16
Northern 68.88
Eastern 63.01
Island 76.33
Province
Obtained marks
100 and above
(above 50 for
each paper) %
Southern 60.59
North western 59.94
Sabaragamuwa 58.78
Western 57.52
North Central 55.30
Uva 51.04
Central 49.11
Northern 45.54
Eastern 40.80
Island 54.39

- 8 -
2.6 Performance of Candidates by District from 2011 to 2015
Table 5 :
Grade 5 Scholarship Examinations 2011 - 2015Distribution of Number of Candidates who obtained marks
above District Cut Off by District and Year
* Percentage is calculated based on the number sat of each district
No. % No. % No. % No. % No. %
Colombo 3175 10.06 3052 9.86 2944 9.12 3051 9.22 3049 9.17
Gampaha 3436 11.41 3571 11.88 3335 10.90 3388 11.00 3309 10.63
Kalutara 2100 11.46 2246 12.37 1854 9.92 1986 10.52 1893 9.82
Kandy 1663 7.71 1748 8.01 1637 7.38 1655 7.32 1519 6.86
Matale 584 7.48 667 8.62 545 6.73 616 7.44 528 6.63
Nuwara Eliya 803 6.61 813 6.73 765 5.92 743 5.84 787 6.11
Galle 1715 10.21 1840 11.08 1837 10.69 1876 10.73 1666 9.55
Matara 1308 10.38 1414 11.19 1438 11.20 1422 11.06 1402 10.40
Hambantota 1286 13.29 1331 13.68 1427 13.89 1351 12.78 1269 11.84
Jaffna 1090 11.44 1027 11.50 1120 12.39 1196 12.69 1261 13.41
Kilinochchi 131 5.38 110 4.93 159 6.84 167 6.70 194 8.05
Mannar 140 7.34 124 6.81 171 9.42 182 8.55 160 7.57
Vavuniya 332 11.30 297 10.49 357 13.10 332 11.78 331 11.69
Mullativu 79 4.91 93 5.69 131 7.79 187 9.86 202 9.57
Batticaloa 931 10.85 943 10.63 887 9.73 887 9.43 879 8.25
Ampara 1265 11.45 1311 11.93 1267 10.93 1042 9.04 1058 8.17
Trincomalee 520 7.75 508 7.62 533 7.50 451 6.43 563 7.32
Kurunegala 3191 12.72 3291 13.36 3211 12.43 3324 12.62 3057 11.34
Puttalam 1076 9.24 1115 9.59 1051 8.85 1065 8.68 1092 8.73
Anuradhapura 1429 9.92 1475 10.30 1483 9.86 1502 9.91 1514 9.79
Polonnaruwa 733 10.91 807 12.76 730 10.91 632 9.28 683 9.48
Badulla 1454 10.66 1453 10.69 1565 10.85 1401 9.68 1457 10.07
Monaragala 693 9.62 748 10.28 664 8.54 649 8.16 715 9.06
Ratnapura 1874 11.89 1901 11.93 2116 12.32 2081 12.07 1904 11.07
Kegalle 1425 11.17 1498 11.65 1390 10.56 1549 11.54 1361 10.09
Island 32433 10.38 33383 10.76 32617 10.12 32735 9.99 31853 9.55
2015 District
2012 20132011 2014

- 9 -
2.7 Performance of Candidates by District - 2015
Table 6 :
Grade 5 Scholarship Examination - 2015Distribution of Candidates who sat the examination, Above Cut Off,
Obtained marks above 100 and above 70 by District
* Percentage is calculated based on the number sat of each district
No. % No. % No. %
Colombo 33267 3049 9.17 25985 78.11 18775 56.44
Gampaha 31126 3309 10.63 25011 80.35 18506 59.46
Kalutara 19285 1893 9.82 14921 77.37 10850 56.26
Kandy 22152 1519 6.86 17093 77.16 11893 53.69
Matale 7966 528 6.63 6013 75.48 4182 52.50
Nuwara Eliya 12884 787 6.11 8356 64.86 5044 39.15
Galle 17439 1666 9.55 14111 80.92 10428 59.80
Matara 13479 1402 10.40 11016 81.73 8188 60.75
Hambantota 10720 1269 11.84 8833 82.40 6611 61.67
Jaffna 9405 1261 13.41 6786 72.15 4733 50.32
Kilinochchi 2411 194 8.05 1453 60.27 880 36.50
Mannar 2113 160 7.57 1381 65.36 807 38.19
Vavuniya 2832 331 11.69 2017 71.22 1326 46.82
Mullaitivu 2110 202 9.57 1362 64.55 847 40.14
Batticaloa 10658 879 8.25 6301 59.12 4148 38.92
Ampara 12951 1058 8.17 8991 69.42 5843 45.12
Trincomalee 7694 563 7.32 4431 57.59 2782 36.16
Kurunegala 26961 3057 11.34 23032 85.43 17532 65.03
Puttalam 12503 1092 8.73 9051 72.39 6123 48.97
Anuradhapura 15468 1514 9.79 11973 77.40 8486 54.86
Polonnaruwa 7204 683 9.48 5619 78.00 4051 56.23
Badulla 14464 1457 10.07 10781 74.54 7429 51.36
Monaragala 7889 715 9.06 5867 74.37 3980 50.45
Ratnapura 17200 1904 11.07 13401 77.91 9887 57.48
Kegalle 13491 1361 10.09 10905 80.83 8154 60.44
Island 333672 31853 9.55 254690 76.33 181485 54.39
Obtained marks
100 and above
(above 50 for
each paper)
DistrictNumber
Sat
Above cut off
Obtained marks
70 and above
(above 35 for each
paper)


- 11 -
2.8 Performance of Candidates by District, arranged in Descending Order
Grade 5 Scholarship Examination - 2015
DistrictAbove cut off
%
Jaffna 13.41
Hambantota 11.84
Vavuniya 11.69
Kurunegala 11.34
Ratnapura 11.07
Gampaha 10.63
Matara 10.40
Kegalle 10.09
Badulla 10.07
Kalutara 9.82
Anuradhapura 9.79
Mullaitivu 9.57
Galle 9.55
Polonnaruwa 9.48
Colombo 9.17
Monaragala 9.06
Puttalam 8.73
Batticaloa 8.25
Ampara 8.17
Kilinochchi 8.05
Mannar 7.57
Trincomalee 7.32
Kandy 6.86
Matale 6.63
Nuwara Eliya 6.11
Island 9.55
District
Obtained marks
70 and above
(above 35 for
each paper) %
Kurunegala 85.43
Hambantota 82.40
Matara 81.73
Galle 80.92
Kegalle 80.83
Gampaha 80.35
Colombo 78.11
Polonnaruwa 78.00
Ratnapura 77.91
Anuradhapura 77.40
Kalutara 77.37
Kandy 77.16
Matale 75.48
Badulla 74.54
Monaragala 74.37
Puttalam 72.39
Jaffna 72.15
Vavuniya 71.22
Ampara 69.42
Mannar 65.36
Nuwara Eliya 64.86
Mullaitivu 64.55
Kilinochchi 60.27
Batticaloa 59.12
Trincomalee 57.59
Island 76.33
District
Obtained
marks 100 and
above (above
50 for each
paper) %
Kurunegala 65.03
Hambantota 61.67
Matara 60.75
Kegalle 60.44
Galle 59.80
Gampaha 59.46
Ratnapura 57.48
Colombo 56.44
Kalutara 56.26
Polonnaruwa 56.23
Anuradhapura 54.86
Kandy 53.69
Matale 52.50
Badulla 51.36
Monaragala 50.45
Jaffna 50.32
Puttalam 48.97
Vavuniya 46.82
Ampara 45.12
Mullaitivu 40.14
Nuwara Eliya 39.15
Batticaloa 38.92
Mannar 38.19
Kilinochchi 36.50
Trincomalee 36.16
Island 54.39
Percentage distribution of candidates who obtained
marks above cut off by District *
Table 7.1
Percentage distribution of candidates who obtained
marks 100 and above by District *
Table 7.2
Percentage distribution of candidates who obtained
marks 70 and above by District *
Table 7.3
* Percentage is calculated based on the number sat of each District


- 13 -
2.10 Performance of Candidates by District and Gender Table 9 :
Figure 7 :
No. % No. %
Colombo 16863 1423 8.44 16404 1626 9.91
Gampaha 15619 1524 9.76 15507 1785 11.51
Kalutara 9705 840 8.66 9580 1053 10.99
Kandy 11086 642 5.79 11066 877 7.93
Matale 3979 220 5.53 3987 308 7.73
Nuwara Eliya 6516 356 5.46 6368 431 6.77
Galle 8779 758 8.63 8660 908 10.48
Matara 6845 659 9.63 6634 743 11.20
Hambantota 5361 554 10.33 5359 715 13.34
Jaffna 4810 621 12.91 4595 640 13.93
Kilinochchi 1219 92 7.55 1192 102 8.56
Mannar 1052 75 7.13 1061 85 8.01
Vavuniya 1433 163 11.37 1399 168 12.01
Mullativu 1034 98 9.48 1076 104 9.67
Batticaloa 5305 395 7.45 5353 484 9.04
Ampara 6472 460 7.11 6479 598 9.23
Trincomalee 3774 259 6.86 3920 304 7.76
Kurunegala 13595 1370 10.08 13366 1687 12.62
Puttalam 6176 506 8.19 6327 586 9.26
Anuradhapura 7774 681 8.76 7694 833 10.83
Polonnaruwa 3653 308 8.43 3551 375 10.56
Badulla 7309 642 8.78 7155 815 11.39
Monaragala 3981 328 8.24 3908 387 9.90
Ratnapura 8513 834 9.80 8687 1070 12.32
Kegalle 6864 575 8.38 6627 786 11.86
Island 167717 14383 8.58 165955 17470 10.53
District
No.Sat No.Sat
Male Female
Above cut off Above cut off
Gender
Grade 5 Scholarship Examination - 2015Distribution of number of candidates sat the examination, number of candidates who obtained marks above cut off by District and Gender
* Percentage is calculated based on the number sat of each group in each district
Perc
enta
ge
Grade 5 Scholarship Examination 2015
Percentage of Students who obtained marks above the District Cut Off by
ender
0
2
4
6
8
10
12
14
16
Col
ombo
Gam
paha
Kal
utar
a
Kan
dy
Mat
ale
Nuw
ara
Eli
ya
Gal
le
Mat
ara
Ham
bant
ota
Jaff
na
Kil
inoc
hchi
Man
nar
Vav
uniy
a
Mul
lati
vu
Bat
tica
loa
Am
para
Tri
ncom
alee
Kur
uneg
ala
Put
tala
m
Anu
radh
apur
a
Pol
onna
ruw
a
Bad
ulla
Mon
arag
ala
Rat
napu
ra
Keg
alle
Isla
nd
District
Per
cen
tage
Male
Female
Grade 5 Scholarship Examination 2015
Percentage of Students who obtained marks above the District Cut Off by
ender
0
2
4
6
8
10
12
14
16
Colo
mbo
Gam
pah
a
Kal
uta
ra
Kan
dy
Mat
ale
Nuw
ara
Eli
ya
Gal
le
Mat
ara
Ham
ban
tota
Jaff
na
Kil
inoch
chi
Man
nar
Vav
uniy
a
Mull
ativ
u
Bat
tica
loa
Am
par
a
Tri
nco
mal
ee
Kuru
neg
ala
Putt
alam
Anura
dhap
ura
Polo
nnar
uw
a
Bad
ull
a
Monar
agal
a
Rat
nap
ura
Keg
alle
Isla
nd
District
Per
cen
tage
Male
Female
Grade 5 Scholarship Examination - 2015Percentage distribution of number of candidates who obtained marks
above cut off by District and Gender

- 14 -
2.11 Performance of Candidates by District and Medium
Table 10 :
Figure 8 :
No. % No. %
Colombo 29972 2802 9.35 3295 247 7.50
Gampaha 29700 3211 10.81 1426 98 6.87
Kalutara 16904 1826 10.80 2381 67 2.81
Kandy 16840 1208 7.17 5312 311 5.85
Matale 6433 465 7.23 1533 63 4.11
Nuwara Eliya 5045 400 7.93 7839 387 4.94
Galle 17018 1652 9.71 421 14 3.33
Matara 12886 1380 10.71 593 22 3.71
Hambantota 10500 1265 12.05 220 4 1.82
Jaffna 0 0 0.00 9405 1261 13.41
Kilinochchi 0 0 0.00 2411 194 8.05
Mannar 0 0 0.00 2113 160 7.57
Vavuniya 253 13 5.14 2579 318 12.33
Mullativu 110 2 1.82 2000 200 10.00
Batticaloa 0 0 0.00 10658 879 8.25
Ampara 4541 417 9.18 8410 641 7.62
Trincomalee 1857 127 6.84 5837 436 7.47
Kurunegala 24634 2949 11.97 2327 108 4.64
Puttalam 9359 950 10.15 3144 142 4.52
Anuradhapura 13885 1456 10.49 1583 58 3.66
Polonnaruwa 6424 645 10.04 780 38 4.87
Badulla 10839 1281 11.82 3625 176 4.86
Monaragala 7531 702 9.32 358 13 3.63
Ratnapura 15256 1840 12.06 1944 64 3.29
Kegalle 11350 1246 10.98 2141 115 5.37
Island 251337 25837 10.28 82335 6016 7.31
Tamil
Above cut off Above cut offNo.SatNo.Sat
SinhalaDistrict
Medium
Grade 5 Scholarship Examination - 2015Distribution of number of candidates sat the examination, number of candidates who obtained marks above cut off by District and MediumPe
rcen
tage
Grade 5 Scholarship Examination 2015
Percentage of Students who obtained marks above the District Cut Off
by Medium
0
2
4
6
8
10
12
14
16
18
Col
ombo
Gam
paha
Kal
utar
a
Kan
dy
Mat
ale
Nuw
ara
Eli
ya
Gal
le
Mat
ara
Ham
bant
ota
Jaff
na
Kil
inoc
hchi
Man
nar
Vav
uniy
a
Mul
lati
vu
Bat
tica
loa
Am
para
Tri
ncom
alee
Kur
uneg
ala
Put
tala
m
Anu
radh
apur
a
Pol
onna
ruw
a
Bad
ulla
Mon
arag
ala
Rat
napu
ra
Keg
alle
Isla
nd
District
Per
cen
tage
Sinhala
Tamil
Grade 5 Scholarship Examination - 2015Percentage distribution of number of candidates who obtained marks
above cut off by District and Medium
Grade 5 Scholarship Examination 2015
Percentage of Students who obtained marks above the District Cut Off
by Medium
0
2
4
6
8
10
12
14
16
18
Co
lom
bo
Gam
pah
a
Kal
uta
ra
Kan
dy
Mat
ale
Nu
war
a E
liya
Gal
le
Mat
ara
Ham
ban
tota
Jaff
na
Kil
ino
chch
i
Man
nar
Vav
uniy
a
Mu
llat
ivu
Bat
tica
loa
Am
par
a
Tri
nco
mal
ee
Ku
run
egal
a
Pu
ttal
am
An
ura
dh
apura
Po
lon
nar
uw
a
Bad
ull
a
Mo
nar
agal
a
Rat
nap
ura
Keg
alle
Isla
nd
District
Per
cen
tag
e
Sinhala
Tamil

- 15 -
2.12 Performance of Candidates by Education Zone - 2015
Table 11 :Grade 5 Scholarship Examination - 2015
Distribution of Candidates who sat the examination, Above Cut Off Obtained marks above 100 and above 70 by Education Zone
Number % Number % Number %
1 Colombo 13,217 998 7.55 6,859 51.90 9906 74.95
2 Jayawardanapura 8,306 800 9.63 5,162 62.15 6,859 82.58
3 Homagama 5,414 674 12.45 3,365 62.15 4,373 80.77
4 Piliyandala 6,330 577 9.12 3,389 53.54 4,847 76.57
5 Gampaha 8,417 1,375 16.34 5,742 68.22 7,205 85.60
6 Kelaniya 8,596 746 8.68 4,823 56.11 6,680 77.71
7 Minuwangoda 6,319 714 11.30 3,864 61.15 5,173 81.86
8 Negombo 7,794 474 6.08 4,077 52.31 5,953 76.38
9 Kalutara 9,520 786 8.26 4,946 51.95 7,053 74.09
10 Matugama 3,571 372 10.42 2,179 61.02 2,906 81.38
11 Horana 6,194 735 11.87 3,725 60.14 4,962 80.11
12 Kandy 6,636 639 9.63 4,137 62.34 5,513 83.08
13 Denuwara 2,669 134 5.02 1,336 50.06 2,060 77.18
14 Gampola 3,988 208 5.22 1,837 46.06 2,804 70.31
15 Teldeniya 2,175 120 5.52 1,088 50.02 1,638 75.31
16 Wattegama 3,062 198 6.47 1,608 52.51 2,343 76.52
17 Katugastota 3,622 220 6.07 1,887 52.10 2,735 75.51
18 Matale 3,779 240 6.35 1,938 51.28 2,808 74.31
19 Galewela 2,852 208 7.29 1,563 54.80 2,203 77.24
20 Naula 703 31 4.41 336 47.80 510 72.55
21 Wilgamuwa 632 49 7.75 345 54.59 492 77.85
22 Nuwara Eliya 4,034 182 4.51 1,302 32.28 2,357 58.43
23 Kotmale 1,805 122 6.76 775 42.94 1,235 68.42
24 Hatton 3,682 247 6.71 1,410 38.29 2,350 63.82
25 Walapane 1,698 115 6.77 743 43.76 1,195 70.38
26 Hanguranketha 1,665 121 7.27 814 48.89 1,219 73.21
27 Galle 7,512 771 10.26 4,673 62.21 6,173 82.18
28 Elpitiya 3,945 372 9.43 2,318 58.76 3,171 80.38
29 Ambalangoda 3,729 316 8.47 2,135 57.25 2,994 80.29
30 Udugama 2,253 207 9.19 1,302 57.79 1,773 78.70
31 Matara 5,447 603 11.07 3,372 61.91 4,504 82.69
32 Akuressa 2,477 286 11.55 1,527 61.65 2,064 83.33
33 Mulatiyana 2,757 325 11.79 1,858 67.39 2,385 86.51
34 Morawaka 2,798 188 6.72 1,431 51.14 2,063 73.73
35 Tangalle 3,142 469 14.93 2,024 64.42 2,667 84.88
36 Hambantota 4,811 447 9.29 2,768 57.53 3,801 79.01
37 Walasmulla 2,767 353 12.76 1,819 65.74 2,365 85.47
38 Jaffna 2,941 535 18.19 1,694 57.60 2,285 77.69
39 Islands 786 41 5.22 289 36.77 483 61.45
40 Thenmarachchi 963 115 11.94 523 54.31 725 75.29
41 Valikamam 2,922 277 9.48 1,275 43.63 1,952 66.80
42 Vadamarachchy 1,793 293 16.34 952 53.10 1,341 74.79
43 Kilinochchi 2,411 194 8.05 880 36.50 1,453 60.27
44 Mannar 1,733 151 8.71 702 40.51 1,173 67.69
45 Madhu 380 9 2.37 105 27.63 208 54.74
46 Vavuniya South 2,337 285 12.20 1,122 48.01 1,693 72.44
47 Vavuniya north 495 46 9.29 204 41.21 324 65.45
Obtained marks 70
and above (above 35
for each paper)
Obtained marks 100
and above (above 50
for each paper) Education ZoneNumber
Sat
Above Cut off

- 16 -
Grade 5 Scholarship Examination - 2015Distribution of Candidates who sat the examination, Above Cut OffObtained marks above 100 and above 70 by Education Zone - cont.
Number % Number % Number %
48 Mullaitivu 1,499 175 11.67 654 43.63 1,014 67.65
49 Thunukkai 611 27 4.42 193 31.59 348 56.96
50 Batticaloa 2,048 229 11.18 1,012 49.41 1,454 71.00
51 Kalkudah 2,321 111 4.78 570 24.56 998 43.00
52 Paddirippu 1,885 147 7.80 747 39.63 1,158 61.43
53 Batticaloa Central 3,154 341 10.81 1,463 46.39 2,096 66.46
54 Batticaloa West 1,250 51 4.08 356 28.48 595 47.60
55 Ampara 2,789 286 10.25 1,539 55.18 2,163 77.55
56 Kalmunai 3,092 218 7.05 1,241 40.14 2,055 66.46
57 Sammanthurai 1,841 112 6.08 644 34.98 1,142 62.03
58 Mahaoya 661 36 5.45 283 42.81 423 63.99
59 Dehiattakandiya 1,067 93 8.72 596 55.86 869 81.44
60 Akkaraipattu 2,455 226 9.21 1092 44.48 1660 67.62
61 Thirukkovil 1,046 87 8.32 448 42.83 679 64.91
62 Trincomalee 2,557 317 12.40 1,198 46.85 1,731 67.70
63 Muthur 1,719 78 4.54 492 28.62 835 48.57
64 Kantale 1,199 82 6.84 539 44.95 838 69.89
65 Kinniya 1,801 64 3.55 403 22.38 766 42.53
66 Trincomalee North 418 22 5.26 150 35.89 261 62.44
67 Kurunegala 6,150 710 11.54 4,117 66.94 5,290 86.02
68 Kuliyapitiya 4,709 583 12.38 3,143 66.74 4,106 87.19
69 Nikaweratiya 3,711 485 13.07 2,606 70.22 3,297 88.84
70 Maho 4,485 486 10.84 2,771 61.78 3,720 82.94
71 Giriullla 4,476 555 12.40 2,955 66.02 3,858 86.19
72 Ibbagamuwa 3,430 238 6.94 1,940 56.56 2,761 80.50
73 Puttalam 6,434 459 7.13 2,682 41.68 4,267 66.32
74 Chilaw 6,069 633 10.43 3,441 56.70 4,784 78.83
75 Anuradhapura 4,962 494 9.96 2,682 54.05 3,788 76.34
76 Thambuttegama 2,991 387 12.94 1,893 63.29 2,477 82.82
77 Kekirawa 3,037 336 11.06 1,700 55.98 2,346 77.25
78 Galenbindunuwewa 1,903 122 6.41 866 45.51 1,390 73.04
79 Kebithigollewa 2,575 175 6.80 1,345 52.23 1,972 76.58
80 Polonnaruwa 2,182 329 15.08 1359 62.28 1,763 80.80
81 Hingurakgoda 3,025 198 6.55 1675 55.37 2,376 78.55
82 Dimbulagala 1,997 156 7.81 1017 50.93 1,480 74.11
83 Badulla 4,218 480 11.38 2,354 55.81 3,326 78.85
84 Bandarawela 3,572 394 11.03 1991 55.74 2,771 77.58
85 Mahiyanganaya 2,351 237 10.08 1,094 46.53 1,635 69.54
86 Welimada 2,867 235 8.20 1,364 47.58 2,081 72.58
87 Passara 1,388 107 7.71 582 41.93 911 65.63
88 Viyaluwa 68 4 5.88 44 64.71 57 83.82
89 Monaragala 3,191 324 10.15 1,629 51.05 2,361 73.99
90 Wellawaya 2,766 237 8.57 1,431 51.74 2,118 76.57
91 Bibile 1,932 154 7.97 920 47.62 1,388 71.84
92 Ratnapura 6,681 791 11.84 3,864 57.84 5,197 77.79
93 Balangoda 3,182 376 11.82 1898 59.65 2,541 79.86
94 Nivitigala 2,873 238 8.28 1,472 51.24 2,089 72.71
95 Embilipitiya 4,464 499 11.18 2653 59.43 3,574 80.06
96 Kegalle 5,155 648 12.57 3492 67.74 4,426 85.86
97 Mawanella 4,164 364 8.74 2490 59.80 3,384 81.27
98 Dehiowita 4,172 349 8.37 2,172 52.06 3,095 74.19
333,672 31,853 9.55 181,485 54.39 254,690 76.33
Education ZoneNumber
Sat
Above Cut off Obtained marks 100
and above (above 50
for each paper)
Obtained marks 70
and above (above 35
for each paper)
Island

- 17 -
2.13 Performance of Candidates by Education Zone arranged in Descending Order - 2015
Grade 5 Scholarship Examination - 2015
Percentage Distribution of Candidates who obtained marks above cut off by Education Zone *
Table 12.1
Above Cut off
%
1 Jaffna 18.19
2 Vadamarachchy 16.34
3 Gampaha 16.34
4 Polonnaruwa 15.08
5 Tangalle 14.93
6 Nikaweratiya 13.07
7 Thambuttegama 12.94
8 Walasmulla 12.76
9 Kegalle 12.57
10 Homagama 12.45
11 Giriullla 12.40
12 Trincomalee 12.40
13 Kuliyapitiya 12.38
14 Vavuniya South 12.20
15 Thenmarachchi 11.94
16 Horana 11.87
17 Ratnapura 11.84
18 Balangoda 11.82
19 Mulatiyana 11.79
20 Mullaitivu 11.67
21 Akuressa 11.55
22 Kurunegala 11.54
23 Badulla 11.38
24 Minuwangoda 11.30
25 Batticaloa 11.18
26 Embilipitiya 11.18
27 Matara 11.07
28 Kekirawa 11.06
29 Bandarawela 11.03
30 Maho 10.84
31 Batticaloa Central 10.81
32 Chilaw 10.43
33 Matugama 10.42
34 Galle 10.26
35 Ampara 10.25
36 Monaragala 10.15
37 Mahiyanganaya 10.08
38 Anuradhapura 9.96
39 Jayawardanapura 9.63
40 Kandy 9.63
41 Valikamam 9.48
42 Elpitiya 9.43
43 Vavuniya north 9.29
44 Hambantota 9.29
45 Akkaraipattu 9.21
46 Udugama 9.19
47 Piliyandala 9.12
48 Mawanella 8.74
49 Dehiattakandiya 8.72
50 Mannar 8.71
Education Zone
* Percentage is calculated based on the number sat of each Education Zone
Above Cut off
%
51 Kelaniya 8.68
52 Wellawaya 8.57
53 Ambalangoda 8.47
54 Dehiowita 8.37
55 Thirukkovil 8.32
56 Nivitigala 8.28
57 Kalutara 8.26
58 Welimada 8.20
59 Kilinochchi 8.05
60 Bibile 7.97
61 Dimbulagala 7.81
62 Paddirippu 7.80
63 Wilgamuwa 7.75
64 Passara 7.71
65 Colombo 7.55
66 Galewela 7.29
67 Hanguranketha 7.27
68 Puttalam 7.13
69 Kalmunai 7.05
70 Ibbagamuwa 6.94
71 Kantale 6.84
72 Kebithigollewa 6.80
73 Walapane 6.77
74 Kotmale 6.76
75 Morawaka 6.72
76 Hatton 6.71
77 Hingurakgoda 6.55
78 Wattegama 6.47
79 Galenbindunuwewa 6.41
80 Matale 6.35
81 Sammanthurai 6.08
82 Negombo 6.08
83 Katugastota 6.07
84 Viyaluwa 5.88
85 Teldeniya 5.52
86 Mahaoya 5.45
87 Trincomalee North 5.26
88 Islands 5.22
89 Gampola 5.22
90 Denuwara 5.02
91 Kalkudah 4.78
92 Muthur 4.54
93 Nuwara Eliya 4.51
94 Thunukkai 4.42
95 Naula 4.41
96 Batticaloa West 4.08
97 Kinniya 3.55
98 Madhu 2.37
9.55
Education Zone
Island

- 18 -
Percentage Distribution of Candidates who obtained marks 100 and above by Education Zone *
Table 12.2
* Percentage is calculated based on the number sat of each Education Zone
Obtained marks
100 and above
(above 50 for
each paper) %
1 Nikaweratiya 70.22
2 Gampaha 68.22
3 Kegalle 67.74
4 Mulatiyana 67.39
5 Kurunegala 66.94
6 Kuliyapitiya 66.74
7 Giriullla 66.02
8 Walasmulla 65.74
9 Viyaluwa 64.71
10 Tangalle 64.42
11 Thambuttegama 63.29
12 Kandy 62.34
13 Polonnaruwa 62.28
14 Galle 62.21
15 Homagama 62.15
16 Jayawardanapura 62.15
17 Matara 61.91
18 Maho 61.78
19 Akuressa 61.65
20 Minuwangoda 61.15
21 Matugama 61.02
22 Horana 60.14
23 Mawanella 59.80
24 Balangoda 59.65
25 Embilipitiya 59.43
26 Elpitiya 58.76
27 Ratnapura 57.84
28 Udugama 57.79
29 Jaffna 57.60
30 Hambantota 57.53
31 Ambalangoda 57.25
32 Chilaw 56.70
33 Ibbagamuwa 56.56
34 Kelaniya 56.11
35 Kekirawa 55.98
36 Dehiattakandiya 55.86
37 Badulla 55.81
38 Bandarawela 55.74
39 Hingurakgoda 55.37
40 Ampara 55.18
41 Galewela 54.80
42 Wilgamuwa 54.59
43 Thenmarachchi 54.31
44 Anuradhapura 54.05
45 Piliyandala 53.54
46 Vadamarachchy 53.10
47 Wattegama 52.51
48 Negombo 52.31
49 Kebithigollewa 52.23
50 Katugastota 52.10
Education Zone
Obtained marks
100 and above
(above 50 for
each paper) %
51 Dehiowita 52.06
52 Kalutara 51.95
53 Colombo 51.90
54 Wellawaya 51.74
55 Matale 51.28
56 Nivitigala 51.24
57 Morawaka 51.14
58 Monaragala 51.05
59 Dimbulagala 50.93
60 Denuwara 50.06
61 Teldeniya 50.02
62 Batticaloa 49.41
63 Hanguranketha 48.89
64 Vavuniya South 48.01
65 Naula 47.80
66 Bibile 47.62
67 Welimada 47.58
68 Trincomalee 46.85
69 Mahiyanganaya 46.53
70 Batticaloa Central 46.39
71 Gampola 46.06
72 Galenbindunuwewa 45.51
73 Kantale 44.95
74 Akkaraipattu 44.48
75 Walapane 43.76
76 Valikamam 43.63
77 Mullaitivu 43.63
78 Kotmale 42.94
79 Thirukkovil 42.83
80 Mahaoya 42.81
81 Passara 41.93
82 Puttalam 41.68
83 Vavuniya north 41.21
84 Mannar 40.51
85 Kalmunai 40.14
86 Paddirippu 39.63
87 Hatton 38.29
88 Islands 36.77
89 Kilinochchi 36.50
90 Trincomalee North 35.89
91 Sammanthurai 34.98
92 Nuwara Eliya 32.28
93 Thunukkai 31.59
94 Muthur 28.62
95 Batticaloa West 28.48
96 Madhu 27.63
97 Kalkudah 24.56
98 Kinniya 22.38
54.39
Education Zone
Island

- 19 -
Percentage Distribution of Candidates who obtained marks 70 and above by Education Zone *
Table 12.3
* Percentage is calculated based on the number sat of each Education Zone
Obtained marks
70 and above
(above 35 for each
paper) %
1 Nikaweratiya 88.84
2 Kuliyapitiya 87.19
3 Mulatiyana 86.51
4 Giriullla 86.19
5 Kurunegala 86.02
6 Kegalle 85.86
7 Gampaha 85.60
8 Walasmulla 85.47
9 Tangalle 84.88
10 Viyaluwa 83.82
11 Akuressa 83.33
12 Kandy 83.08
13 Maho 82.94
14 Thambuttegama 82.82
15 Matara 82.69
16 Jayawardanapura 82.58
17 Galle 82.18
18 Minuwangoda 81.86
19 Dehiattakandiya 81.44
20 Matugama 81.38
21 Mawanella 81.27
22 Polonnaruwa 80.80
23 Homagama 80.77
24 Ibbagamuwa 80.50
25 Elpitiya 80.38
26 Ambalangoda 80.29
27 Horana 80.11
28 Embilipitiya 80.06
29 Balangoda 79.86
30 Hambantota 79.01
31 Badulla 78.85
32 Chilaw 78.83
33 Udugama 78.70
34 Hingurakgoda 78.55
35 Wilgamuwa 77.85
36 Ratnapura 77.79
37 Kelaniya 77.71
38 Jaffna 77.69
39 Bandarawela 77.58
40 Ampara 77.55
41 Kekirawa 77.25
42 Galewela 77.24
43 Denuwara 77.18
44 Kebithigollewa 76.58
45 Wellawaya 76.57
46 Piliyandala 76.57
47 Wattegama 76.52
48 Negombo 76.38
49 Anuradhapura 76.34
50 Katugastota 75.51
Education Zone
Obtained marks
70 and above
(above 35 for each
paper) %
51 Teldeniya 75.31
52 Thenmarachchi 75.29
53 Colombo 74.95
54 Vadamarachchy 74.79
55 Matale 74.31
56 Dehiowita 74.19
57 Dimbulagala 74.11
58 Kalutara 74.09
59 Monaragala 73.99
60 Morawaka 73.73
61 Hanguranketha 73.21
62 Galenbindunuwewa 73.04
63 Nivitigala 72.71
64 Welimada 72.58
65 Naula 72.55
66 Vavuniya South 72.44
67 Bibile 71.84
68 Batticaloa 71.00
69 Walapane 70.38
70 Gampola 70.31
71 Kantale 69.89
72 Mahiyanganaya 69.54
73 Kotmale 68.42
74 Trincomalee 67.70
75 Mannar 67.69
76 Mullaitivu 67.65
77 Akkaraipattu 67.62
78 Valikamam 66.80
79 Kalmunai 66.46
80 Batticaloa Central 66.46
81 Puttalam 66.32
82 Passara 65.63
83 Vavuniya north 65.45
84 Thirukkovil 64.91
85 Mahaoya 63.99
86 Hatton 63.82
87 Trincomalee North 62.44
88 Sammanthurai 62.03
89 Islands 61.45
90 Paddirippu 61.43
91 Kilinochchi 60.27
92 Nuwara Eliya 58.43
93 Thunukkai 56.96
94 Madhu 54.74
95 Muthur 48.57
96 Batticaloa West 47.60
97 Kalkudah 43.00
98 Kinniya 42.53
76.33
Education Zone
Island


- 23 -
3.1 Comparison of Distribution of Total Marks - 2014 & 2015
Table 13 :Grade 5 Scholarship Examination - 2014 & 2015
Distribution of Frequencies of Total Marks by Year
Figure 18 :
F % CF % F % CF %
191 - 200 115 0.04 327648 100.00 97 0.03 333672 100.00
181 - 190 2545 0.78 327533 99.95 1358 0.41 333575 99.95
171 - 180 10767 3.29 324988 99.17 7082 2.12 332217 99.55
161 - 170 20586 6.28 314221 95.88 16223 4.86 325135 97.42
151 - 160 27089 8.27 293635 89.60 24119 7.23 308912 92.56
141 - 150 30585 9.33 266546 81.33 29251 8.77 284793 85.33
131 - 140 31075 9.48 235961 72.00 31366 9.40 255542 76.57
121 - 130 30601 9.34 204886 62.51 31511 9.44 224176 67.17
111 - 120 29451 8.99 174285 53.17 30638 9.18 192665 57.72
101 - 110 27681 8.45 144834 44.19 28986 8.69 162027 48.54
91 - 100 25303 7.72 117153 35.74 27096 8.12 133041 39.86
81 - 90 22292 6.80 91850 28.02 25170 7.54 105945 31.73
71 - 80 19901 6.07 69558 21.21 22770 6.82 80775 24.19
61 - 70 17753 5.42 49657 15.14 19704 5.91 58005 17.37
51 - 60 15107 4.61 31904 9.72 16597 4.97 38301 11.46
41 - 50 10226 3.12 16797 5.11 12458 3.73 21704 6.49
31 - 40 4442 1.36 6571 1.99 6644 1.99 9246 2.75
21 - 30 1307 0.40 2129 0.63 1859 0.56 2602 0.76
11 - 20 462 0.14 822 0.23 459 0.14 743 0.21
01 - 10 301 0.09 360 0.09 228 0.07 284 0.07
00 - 00 59 0.02 59 0.00 56 0.02 56 0.00
Mean 109.50113.89
2014 2015Class
Interval
F : Frequency CF : Cumulative Frequency
F % CF % F % CF % F % CF %
90 - 100 894 0.91 98291 100.00 384 0.18 212036 100.00 1278 0.41 310327 100.00
80 - 89 7553 7.68 97397 99.09 5177 2.44 211652 99.82 12730 4.10 309049 99.59
70 - 79 14358 14.61 89844 91.41 14271 6.73 206475 97.38 28629 9.23 296319 95.49
60 - 69 16242 16.52 75486 76.80 21971 10.36 192204 90.65 38213 12.31 267690 86.26
50 - 59 15857 16.13 59244 60.27 27751 13.09 170233 80.28 43608 14.05 229477 73.95
40 - 49 15396 15.66 43387 44.14 33957 16.01 142482 67.20 49353 15.90 185869 59.89
30 - 39 13727 13.97 27991 28.48 39202 18.49 108525 51.18 52929 17.06 136516 43.99
20 - 29 9051 9.21 14264 14.51 36398 17.17 69323 32.69 45449 14.65 83587 26.94
10 - 19 4164 4.24 5213 5.30 24756 11.68 32925 15.53 28920 9.32 38138 12.29
01 - 09 1025 1.04 1049 1.07 7902 3.73 8169 3.85 8927 2.88 9218 2.97
00 - 00 24 0.02 24 0.02 267 0.13 267 0.13 291 0.09 291 0.09
Class
Interval
Higher Income group Lower Income Group All Candidates
3. Analyses of Question Papers
0
1
2
3
4
5
6
7
8
9
10
00 - 0
0
01 - 1
0
11 - 2
0
21 - 3
0
31 - 4
0
41 - 5
0
51 - 6
0
61 - 7
0
71 - 8
0
81 - 9
0
91 - 1
00
101
- 11
0
111
- 12
0
121
- 13
0
131
- 14
0
141
- 15
0
151
- 16
0
161
- 1
70
171
- 18
0
181
- 19
0
191
- 20
0
Class Interval of Marks
Fre
qu
ency
Per
cen
tage
2014
2015
Grade 5 Scholarship Examination - 2014 & 2015Percentage Distribution of Frequencies of Total Marks by Year
Per
cent
age
of fr
eque
ncie
s of m
arks

- 24 -
3.2 Distribution of Frequencies of Marks for Paper I by Income Level
Table 14 :
Grade 5 Scholarship Examination - 2015Distribution of Frequencies of Marks for the Paper I by Income Level
Figure 19 :
F % CF % F % CF % F % CF %
90 - 100 1445 1.46 99183 100.00 803 0.34 234479 100.00 2248 0.67 333662 100.00
80 - 89 10404 10.49 97738 98.54 9144 3.90 233676 99.66 19548 5.86 331414 99.33
70 - 79 21566 21.74 87334 88.05 28008 11.94 224532 95.76 49574 14.86 311866 93.47
60 - 69 24816 25.02 65768 66.31 46569 19.86 196524 83.81 71385 21.39 262292 78.61
50 - 59 20512 20.68 40952 41.29 54450 23.22 149955 63.95 74962 22.47 190907 57.22
40 - 49 12805 12.91 20440 20.61 49565 21.14 95505 40.73 62370 18.69 115945 34.75
30 - 39 5867 5.92 7635 7.70 32711 13.95 45940 19.59 38578 11.56 53575 16.06
20 - 29 1595 1.61 1768 1.78 11459 4.89 13229 5.64 13054 3.91 14997 4.49
10 - 19 149 0.15 173 0.17 1437 0.61 1770 0.75 1586 0.48 1943 0.58
01 - 09 18 0.02 24 0.02 243 0.10 333 0.14 261 0.08 357 0.11
00 - 00 6 0.01 6 0.01 90 0.04 90 0.04 96 0.03 96 0.03
Class
Interval
Higher Income group Lower Income Group All Candidates
F : Frequency CF : Cumulative Frequency
Grade 5 Scholarship Examination - 2015
Percentage Distribution of Frequencies of Marks for paper I by Income Level
0
5
10
15
20
25
30
00 - 00 01 - 09 10 - 19 20 - 29 30 - 39 40 - 49 50 - 59 60 - 69 70 - 79 80 - 89 90 - 100
Class Interval
Per
cen
tage
of
Fre
qu
enci
es o
f m
ark
s
Higher
Lower
All
Grade 5 Scholarship Examination - 2015Percentage Distribution of Frequencies of Marks for Paper I by Income Level
Per
cent
age
of fr
eque
ncie
s of m
arks

- 25 -
3.3 Distribution of Frequencies of Marks for Paper II by Income Level
Table 15 : Grade 5 Scholarship Examination - 2015
Distribution of Frequencies of Marks for Paper II by Income Level
Figure 20 :
F % CF % F % CF % F % CF %
90 - 100 4411 4.45 99183 100.00 2823 1.20 234485 100.00 7234 2.17 333668 100.00
80 - 89 19030 19.19 94772 95.55 19404 8.28 231662 98.80 38434 11.52 326434 97.83
70 - 79 21945 22.13 75742 76.37 32431 13.83 212258 90.52 54376 16.30 288000 86.31
60 - 69 17287 17.43 53797 54.24 35231 15.02 179827 76.69 52518 15.74 233624 70.02
50 - 59 12710 12.81 36510 36.81 33388 14.24 144596 61.67 46098 13.82 181106 54.28
40 - 49 9226 9.30 23800 24.00 31289 13.34 111208 47.43 40515 12.14 135008 40.46
30 - 39 6761 6.82 14574 14.69 28946 12.34 79919 34.08 35707 10.70 94493 28.32
20 - 29 4597 4.63 7813 7.88 25769 10.99 50973 21.74 30366 9.10 58786 17.62
10 - 19 2568 2.59 3216 3.24 18967 8.09 25204 10.75 21535 6.45 28420 8.52
01 - 09 635 0.64 648 0.65 5989 2.55 6237 2.66 6624 1.99 6885 2.06
00 - 00 13 0.01 13 0.01 248 0.11 248 0.11 261 0.08 261 0.08
Lower Income Group All CandidatesClass
Interval
Higher Income group
F : Frequency CF : Cumulative Frequency
Grade 5 Scholarship Examination - 2015
Percentage Distribution of Frequencies of Marks for paper II by Income Level
0
5
10
15
20
25
00 - 00 01 - 09 10 - 19 20 - 29 30 - 39 40 - 49 50 - 59 60 - 69 70 - 79 80 - 89 90 - 100
Class Interval
Per
cen
tag
e o
f F
req
uen
cies
of
mark
s
Higher
Lower
All
Grade 5 Scholarship Examination - 2015Percentage Distribution of Frequencies of Marks for Paper II by Income Level
Per
cent
age
of fr
eque
ncie
s of m
arks

- 26 -
3.4 Distribution of Frequencies of Total Marks by Income Level
Table 16 :
Grade 5 Scholarship Examination - 2015Distribution of Frequencies of Total Marks by Income Level
Figure 21 :
F : Frequency CF : Cumulative Frequency
F % CF % F % CF % F % CF %
180 - 200 1226 1.24 99184 100.00 615 0.26 234488 100.00 1841 0.55 333672 100.00
160 - 179 13657 13.77 97958 98.76 11390 4.86 233873 99.74 25047 7.51 331831 99.45
140 - 159 28034 28.26 84301 84.99 26266 11.20 222483 94.88 54300 16.27 306784 91.94
120 - 139 17140 17.28 56267 56.73 45795 19.53 196217 83.68 62935 18.86 252484 75.67
100 - 119 16504 16.64 39127 39.45 42886 18.29 150422 64.15 59390 17.80 189549 56.81
80 - 99 11282 11.37 22623 22.81 40490 17.27 107536 45.86 51772 15.52 130159 39.01
60 - 79 7080 7.14 11341 11.43 34915 14.89 67046 28.59 41995 12.59 78387 23.49
40 - 59 3459 3.49 4261 4.30 24651 10.51 32131 13.70 28110 8.42 36392 10.91
20 - 39 751 0.76 802 0.81 6843 2.92 7480 3.19 7594 2.28 8282 2.48
01 - 19 49 0.05 51 0.05 583 0.25 637 0.27 632 0.19 688 0.21
00 - 00 2 0.00 2 0.00 54 0.02 54 0.02 56 0.02 56 0.02
CIHigher Income group All CandidatesLower Income Group
F % CF % F % CF % F % CF %
90 - 100 894 0.91 98291 100.00 384 0.18 212036 100.00 1278 0.41 310327 100.00
80 - 89 7553 7.68 97397 99.09 5177 2.44 211652 99.82 12730 4.10 309049 99.59
70 - 79 14358 14.61 89844 91.41 14271 6.73 206475 97.38 28629 9.23 296319 95.49
60 - 69 16242 16.52 75486 76.80 21971 10.36 192204 90.65 38213 12.31 267690 86.26
50 - 59 15857 16.13 59244 60.27 27751 13.09 170233 80.28 43608 14.05 229477 73.95
40 - 49 15396 15.66 43387 44.14 33957 16.01 142482 67.20 49353 15.90 185869 59.89
30 - 39 13727 13.97 27991 28.48 39202 18.49 108525 51.18 52929 17.06 136516 43.99
20 - 29 9051 9.21 14264 14.51 36398 17.17 69323 32.69 45449 14.65 83587 26.94
10 - 19 4164 4.24 5213 5.30 24756 11.68 32925 15.53 28920 9.32 38138 12.29
01 - 09 1025 1.04 1049 1.07 7902 3.73 8169 3.85 8927 2.88 9218 2.97
00 - 00 24 0.02 24 0.02 267 0.13 267 0.13 291 0.09 291 0.09
Class
Interval
Higher Income group Lower Income Group All Candidates
Per
cent
age
of fr
eque
ncie
s of m
arks
Total Marks
0
5
10
15
20
25
30
00
- 0
0
01
- 1
9
20
- 3
9
40
- 5
9
60
- 7
9
80
- 9
9
10
0 -
11
9
12
0 -
13
9
14
0 -
15
9
16
0 -
17
9
18
0 -
20
0
Class Interval
Fre
qu
ency
Per
cen
tage
Higher
Lower
All
Grade 5 Scholarship Examination - 2015Percentage Distribution of Frequencies of Total Marks by Income Level

- 27 -
3.5 Distribution of Frequencies of Marks for Paper I by Medium
Table 17 :
Grade 5 Scholarship Examination - 2015Distribution of Frequencies of Marks for Paper I by Medium
Figure 22 :
F % CF % F % CF % F % CF %
90 - 100 1929 0.77 251336 100.00 319 0.39 82326 100.00 2248 0.67 333662 100.00
80 - 89 16619 6.61 249407 99.23 2929 3.56 82007 99.61 19548 5.86 331414 99.33
70 - 79 41419 16.48 232788 92.62 8155 9.91 79078 96.05 49574 14.86 311866 93.47
60 - 69 58876 23.43 191369 76.14 12509 15.19 70923 86.15 71385 21.39 262292 78.61
50 - 59 58910 23.44 132493 52.72 16052 19.50 58414 70.95 74962 22.47 190907 57.22
40 - 49 43877 17.46 73583 29.28 18493 22.46 42362 51.46 62370 18.69 115945 34.75
30 - 39 22668 9.02 29706 11.82 15910 19.33 23869 28.99 38578 11.56 53575 16.06
20 - 29 6158 2.45 7038 2.80 6896 8.38 7959 9.67 13054 3.91 14997 4.49
10 - 19 666 0.26 880 0.35 920 1.12 1063 1.29 1586 0.48 1943 0.58
01 - 09 157 0.06 214 0.09 104 0.13 143 0.17 261 0.08 357 0.11
00 - 00 57 0.02 57 0.02 39 0.05 39 0.05 96 0.03 96 0.03
Class
Interval
Sinhala Medium Tamil Medium All Candidates
F : Frequency CF : Cumulative Frequency
Grade 5 Scholarship Examination - 2015
Percentage Distribution of Frequencies of Marks for paper I by Medium
0
5
10
15
20
25
00 - 00 01 - 09 10 - 19 20 - 29 30 - 39 40 - 49 50 - 59 60 - 69 70 - 79 80 - 89 90 - 100
Class Interval
Per
cen
tage
of
Fre
qu
enci
es o
f m
ark
s
Sinhala
Tamil
All
Grade 5 Scholarship Examination - 2015Percentage Distribution of Frequencies of Marks for Paper I by Medium
Per
cent
age
of fr
eque
ncie
s of m
arks
Grade 5 Scholarship Examination - 2015
Percentage Distribution of Frequencies of Marks for paper I by Medium
0
5
10
15
20
25
00 - 00 01 - 09 10 - 19 20 - 29 30 - 39 40 - 49 50 - 59 60 - 69 70 - 79 80 - 89 90 - 100
Class Interval
Per
cen
tag
e o
f F
req
uen
cies
of
ma
rks
Sinhala
Tamil
All
- 28 -
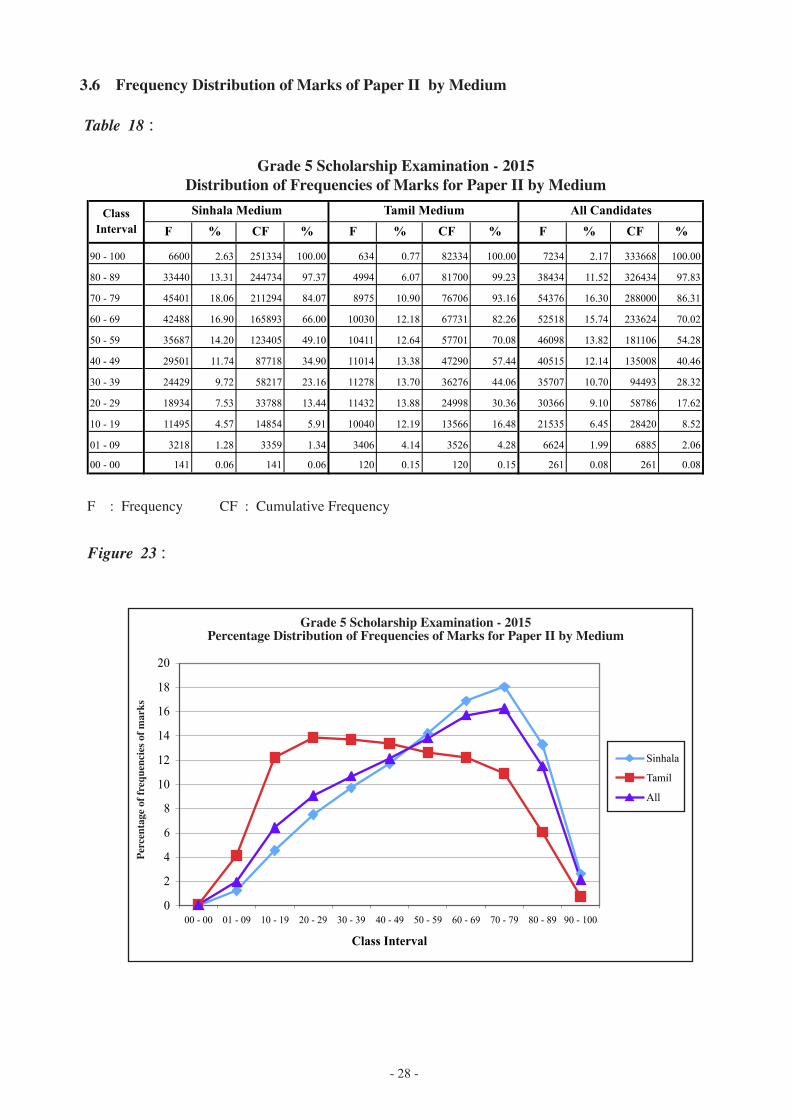
3.6 Frequency Distribution of Marks of Paper II by Medium
Table 18 :
Grade 5 Scholarship Examination - 2015Distribution of Frequencies of Marks for Paper II by Medium
Figure 23 :
F % CF % F % CF % F % CF %
90 - 100 6600 2.63 251334 100.00 634 0.77 82334 100.00 7234 2.17 333668 100.00
80 - 89 33440 13.31 244734 97.37 4994 6.07 81700 99.23 38434 11.52 326434 97.83
70 - 79 45401 18.06 211294 84.07 8975 10.90 76706 93.16 54376 16.30 288000 86.31
60 - 69 42488 16.90 165893 66.00 10030 12.18 67731 82.26 52518 15.74 233624 70.02
50 - 59 35687 14.20 123405 49.10 10411 12.64 57701 70.08 46098 13.82 181106 54.28
40 - 49 29501 11.74 87718 34.90 11014 13.38 47290 57.44 40515 12.14 135008 40.46
30 - 39 24429 9.72 58217 23.16 11278 13.70 36276 44.06 35707 10.70 94493 28.32
20 - 29 18934 7.53 33788 13.44 11432 13.88 24998 30.36 30366 9.10 58786 17.62
10 - 19 11495 4.57 14854 5.91 10040 12.19 13566 16.48 21535 6.45 28420 8.52
01 - 09 3218 1.28 3359 1.34 3406 4.14 3526 4.28 6624 1.99 6885 2.06
00 - 00 141 0.06 141 0.06 120 0.15 120 0.15 261 0.08 261 0.08
Class
Interval
Sinhala Medium Tamil Medium All Candidates
F : Frequency CF : Cumulative Frequency
Grade 5 Scholarship Examination - 2015
Percentage Distribution of Frequencies of Marks for paper II by Medium
0
2
4
6
8
10
12
14
16
18
20
00 - 00 01 - 09 10 - 19 20 - 29 30 - 39 40 - 49 50 - 59 60 - 69 70 - 79 80 - 89 90 - 100
Class Interval
Perc
en
tage o
f F
req
uen
cie
s of
mark
s
Sinhala
Tamil
All
Grade 5 Scholarship Examination - 2015Percentage Distribution of Frequencies of Marks for Paper II by Medium
Per
cent
age
of fr
eque
ncie
s of m
arks
Grade 5 Scholarship Examination - 2015
Percentage Distribution of Frequencies of Marks for paper I by Medium
0
5
10
15
20
25
00 - 00 01 - 09 10 - 19 20 - 29 30 - 39 40 - 49 50 - 59 60 - 69 70 - 79 80 - 89 90 - 100
Class Interval
Per
cen
tag
e o
f F
req
uen
cies
of
ma
rks
Sinhala
Tamil
All

- 29 -
3.7 Distribution of Frequencies of Total Marks by Medium
Table 19 :
Grade 5 Scholarship Examination - 2015Distribution of Frequencies of Total Marks by Medium
Figure 24 :
F % CF % F % CF % F % CF %
180 - 200 1669 0.66 251337 100.00 172 0.21 82335 100.00 1841 0.55 333672 100.00
160 - 179 21929 8.72 249668 99.34 3206 3.89 82163 99.79 25135 7.53 331831 99.45
140 - 159 45589 18.14 227739 90.61 8627 10.48 78957 95.90 54216 16.25 306696 91.92
120 - 139 51768 20.60 182150 72.47 11164 13.56 70330 85.42 62932 18.86 252480 75.67
100 - 119 46694 18.58 130382 51.88 12696 15.42 59166 71.86 59390 17.80 189548 56.81
80 - 99 37597 14.96 83688 33.30 14174 17.22 46470 56.44 51771 15.52 130158 39.01
60 - 79 27260 10.85 46091 18.34 14735 17.90 32296 39.23 41995 12.59 78387 23.49
40 - 59 15107 6.01 18831 7.49 13003 15.79 17561 21.33 28110 8.42 36392 10.91
20 - 39 3347 1.33 3724 1.48 4247 5.16 4558 5.54 7594 2.28 8282 2.48
01 - 19 341 0.14 377 0.15 291 0.35 311 0.38 632 0.19 688 0.21
00 - 00 36 0.01 36 0.01 20 0.02 20 0.02 56 0.02 56 0.02
CISinhala Medium All CandidatesTamil Medium
F % CF % F % CF % F % CF %
90 - 100 894 0.91 98291 100.00 384 0.18 212036 100.00 1278 0.41 310327 100.00
80 - 89 7553 7.68 97397 99.09 5177 2.44 211652 99.82 12730 4.10 309049 99.59
70 - 79 14358 14.61 89844 91.41 14271 6.73 206475 97.38 28629 9.23 296319 95.49
60 - 69 16242 16.52 75486 76.80 21971 10.36 192204 90.65 38213 12.31 267690 86.26
50 - 59 15857 16.13 59244 60.27 27751 13.09 170233 80.28 43608 14.05 229477 73.95
40 - 49 15396 15.66 43387 44.14 33957 16.01 142482 67.20 49353 15.90 185869 59.89
30 - 39 13727 13.97 27991 28.48 39202 18.49 108525 51.18 52929 17.06 136516 43.99
20 - 29 9051 9.21 14264 14.51 36398 17.17 69323 32.69 45449 14.65 83587 26.94
10 - 19 4164 4.24 5213 5.30 24756 11.68 32925 15.53 28920 9.32 38138 12.29
01 - 09 1025 1.04 1049 1.07 7902 3.73 8169 3.85 8927 2.88 9218 2.97
00 - 00 24 0.02 24 0.02 267 0.13 267 0.13 291 0.09 291 0.09
Class
Interval
Higher Income group Lower Income Group All Candidates
F : Frequency CF : Cumulative Frequency
Per
cent
age
of fr
eque
ncie
s of m
arks
Total Marks
0
5
10
15
20
25
00
- 0
0
01
- 1
9
20
- 3
9
40
- 5
9
60
- 7
9
80
- 9
9
10
0 -
11
9
12
0 -
13
9
14
0 -
15
9
16
0 -
17
9
18
0 -
20
0
Class Interval
Fre
qu
ency
Per
cen
tag
e
Sinhala
Tamil
All
Grade 5 Scholarship Examination - 2015Percentage Distribution of Frequencies of Total Marks by Medium

- 30 -
3.8 Distribution of Frequencies of Marks for Paper I by Gender
Table 20 :
Grade 5 Scholarship Examination - 2015Distribution of Frequencies of Marks for Paper I by Gender
Figure 25 :
F % CF % F % CF % F % CF %
90 - 100 1313 0.78 167711 100.00 935 0.56 165951 100.00 2248 0.67 333662 100.00
80 - 89 9671 5.77 166398 99.22 9877 5.95 165016 99.44 19548 5.86 331414 99.33
70 - 79 23131 13.79 156727 93.45 26443 15.93 155139 93.48 49574 14.86 311866 93.47
60 - 69 33413 19.92 133596 79.66 37972 22.88 128696 77.55 71385 21.39 262292 78.61
50 - 59 36661 21.86 100183 59.74 38301 23.08 90724 54.67 74962 22.47 190907 57.22
40 - 49 32513 19.39 63522 37.88 29857 17.99 52423 31.59 62370 18.69 115945 34.75
30 - 39 21874 13.04 31009 18.49 16704 10.07 22566 13.60 38578 11.56 53575 16.06
20 - 29 7851 4.68 9135 5.45 5203 3.14 5862 3.53 13054 3.91 14997 4.49
10 - 19 1024 0.61 1284 0.77 562 0.34 659 0.40 1586 0.48 1943 0.58
01 - 09 190 0.11 260 0.16 71 0.04 97 0.06 261 0.08 357 0.11
00 - 00 70 0.04 70 0.04 26 0.02 26 0.02 96 0.03 96 0.03
Male Female All CandidatesClass
Interval
F : Frequency CF : Cumulative Frequency
Grade 5 Scholarship Examination - 2015
Percentage Distribution of Frequencies of Marks for paper I by Gender
0
5
10
15
20
25
00 - 00 01 - 09 10 - 19 20 - 29 30 - 39 40 - 49 50 - 59 60 - 69 70 - 79 80 - 89 90 - 100
Class Interval
Perc
en
tage o
f F
req
uen
cie
s of
mark
s
Male
Femal
e All
Grade 5 Scholarship Examination - 2015Percentage Distribution of Frequencies of Marks for Paper I by Gender
Per
cent
age
of fr
eque
ncie
s of m
arks
Grade 5 Scholarship Examination - 2015
Percentage Distribution of Frequencies of Marks for paper I by Medium
0
5
10
15
20
25
00 - 00 01 - 09 10 - 19 20 - 29 30 - 39 40 - 49 50 - 59 60 - 69 70 - 79 80 - 89 90 - 100
Class Interval
Per
cen
tag
e o
f F
req
uen
cies
of
ma
rks
Sinhala
Tamil
All
Male FemaleAll

- 31 -
3.9 Distribution of Frequencies of Marks for Paper II by Gender
Table 21 :
Grade 5 Scholarship Examination - 2015Distribution of Frequencies of Marks for Paper II by Gender
Figure 26 :
F % CF % F % CF % F % CF %
90 - 100 2867 1.71 167716 100.00 4367 2.63 165952 100.00 7234 2.17 333668 100.00
80 - 89 15936 9.50 164849 98.29 22498 13.56 161585 97.37 38434 11.52 326434 97.83
70 - 79 23829 14.21 148913 88.79 30547 18.41 139087 83.81 54376 16.30 288000 86.31
60 - 69 24779 14.77 125084 74.58 27739 16.72 108540 65.40 52518 15.74 233624 70.02
50 - 59 22620 13.49 100305 59.81 23478 14.15 80801 48.69 46098 13.82 181106 54.28
40 - 49 20824 12.42 77685 46.32 19691 11.87 57323 34.54 40515 12.14 135008 40.46
30 - 39 19421 11.58 56861 33.90 16286 9.81 37632 22.68 35707 10.70 94493 28.32
20 - 29 18198 10.85 37440 22.32 12168 7.33 21346 12.86 30366 9.10 58786 17.62
10 - 19 14269 8.51 19242 11.47 7266 4.38 9178 5.53 21535 6.45 28420 8.52
01 - 09 4785 2.85 4973 2.97 1839 1.11 1912 1.15 6624 1.99 6885 2.06
00 - 00 188 0.11 188 0.11 73 0.04 73 0.04 261 0.08 261 0.08
Class
Interval
Male Female All Candidates
F : Frequency CF : Cumulative Frequency
Grade 5 Scholarship Examination - 2015
Percentage Distribution of Frequencies of Marks for paper II by Gender
0
2
4
6
8
10
12
14
16
18
20
00 - 00 01 - 09 10 - 19 20 - 29 30 - 39 40 - 49 50 - 59 60 - 69 70 - 79 80 - 89 90 - 100
Class Interval
Perc
en
tage o
f F
req
uen
cie
s of
mark
s
Male
Female
All
Grade 5 Scholarship Examination - 2015Percentage Distribution of Frequencies of Marks for Paper II by Gender
Per
cent
age
of fr
eque
ncie
s of m
arks
Grade 5 Scholarship Examination - 2015
Percentage Distribution of Frequencies of Marks for paper I by Medium
0
5
10
15
20
25
00 - 00 01 - 09 10 - 19 20 - 29 30 - 39 40 - 49 50 - 59 60 - 69 70 - 79 80 - 89 90 - 100
Class Interval
Per
cen
tag
e o
f F
req
uen
cies
of
ma
rks
Sinhala
Tamil
All
Male FemaleAll

- 32 -
3.10 Distribution of Frequencies of Total Marks by Gender
Table 22 :
Grade 5 Scholarship Examination - 2015Distribution of Frequencies of Total Marks by Gender
Figure 27 :
F % CF % F % CF % F % CF %
180 - 200 922 0.55 167717 100.00 919 0.55 165955 100.00 1841 0.55 333672 100.00
160 - 179 11267 6.72 166795 99.45 13780 8.30 165036 99.45 25047 7.51 331831 99.45
140 - 159 23965 14.29 155528 92.73 30335 18.28 151256 91.14 54300 16.27 306784 91.94
120 - 139 28903 17.23 131563 78.44 34032 20.51 120921 72.86 62935 18.86 252484 75.67
100 - 119 28700 17.11 102660 61.21 30690 18.49 86889 52.36 59390 17.80 189549 56.81
80 - 99 26837 16.00 73960 44.10 24935 15.03 56199 33.86 51772 15.52 130159 39.01
60 - 79 23834 14.21 47123 28.10 18161 10.94 31264 18.84 41995 12.59 78387 23.49
40 - 59 17618 10.50 23289 13.89 10492 6.32 13103 7.90 28110 8.42 36392 10.91
20 - 39 5161 3.08 5671 3.38 2433 1.47 2611 1.57 7594 2.28 8282 2.48
01 - 19 469 0.28 510 0.30 163 0.10 178 0.11 632 0.19 688 0.21
00 - 00 41 0.02 41 0.02 15 0.01 15 0.01 56 0.02 56 0.02
Male All CandidatesFemaleCI
F % CF % F % CF % F % CF %
90 - 100 894 0.91 98291 100.00 384 0.18 212036 100.00 1278 0.41 310327 100.00
80 - 89 7553 7.68 97397 99.09 5177 2.44 211652 99.82 12730 4.10 309049 99.59
70 - 79 14358 14.61 89844 91.41 14271 6.73 206475 97.38 28629 9.23 296319 95.49
60 - 69 16242 16.52 75486 76.80 21971 10.36 192204 90.65 38213 12.31 267690 86.26
50 - 59 15857 16.13 59244 60.27 27751 13.09 170233 80.28 43608 14.05 229477 73.95
40 - 49 15396 15.66 43387 44.14 33957 16.01 142482 67.20 49353 15.90 185869 59.89
30 - 39 13727 13.97 27991 28.48 39202 18.49 108525 51.18 52929 17.06 136516 43.99
20 - 29 9051 9.21 14264 14.51 36398 17.17 69323 32.69 45449 14.65 83587 26.94
10 - 19 4164 4.24 5213 5.30 24756 11.68 32925 15.53 28920 9.32 38138 12.29
01 - 09 1025 1.04 1049 1.07 7902 3.73 8169 3.85 8927 2.88 9218 2.97
00 - 00 24 0.02 24 0.02 267 0.13 267 0.13 291 0.09 291 0.09
Class
Interval
Higher Income group Lower Income Group All Candidates
F : Frequency CF : Cumulative Frequency
Grade 5 Scholarship Examination - 2015Percentage Distribution of Frequencies of Total Marks by Gender
Per
cent
age
of fr
eque
ncie
s of m
arks
Total Marks
0
5
10
15
20
25
00 -
00
01 -
19
20 -
39
40 -
59
60 -
79
80 -
99
100 -
119
120 -
139
140 -
159
160 -
179
180 -
200
Class Interval
Fre
qu
ency
Per
cen
tage
Male
Female
All

- 33 -
4.1 Item Person Map for Paper I
Figure 28 :
4. Item Analyses of Question Papers
================================================================================ ConQuest: Generalised Item Response Modelling Software Wed Jan 01 11:03 2014 MAP OF WLE ESTIMATES AND RESPONSE MODEL PARAMETER ESTIMATES ================================================================================ Terms in the Model (excl Step terms) +item --------------------------------------------------------------------------------------- X| | 3 | | | | | | X| | | | | | XX| | | | | | XXXX| | |36 | 2 XXXXXXX| | | | XXXXXXXXXXXX|2 | |30 32 33 | XXXXXXXXXXXXXXXX| | XXXXXXXXXXXXXXXXXXXX| | | | XXXXXXXXXXXXXXXXXXXXX| | XXXXXXXXXXXXXXXXXXXXXXXXX|21 37 | | | 1 XXXXXXXXXXXXXXXXXXXXXXXXXXXXXX| | XXXXXXXXXXXXXXXXXXXXXXXXXXXXXXXXX| | |29 | XXXXXXXXXXXXXXXXXXXXXXXXXXXXXXXXX|40 | XXXXXXXXXXXXXXXXXXXXXXXXXXXXXXXXXXXXXX|34 | XXXXXXXXXXXXXXXXXXXXXXXXXXXXXXXXXXXXX|26 | XXXXXXXXXXXXXXXXXXXXXXXXXXXXXXXXXXXXXXXX|31 | |18 25 38 | XXXXXXXXXXXXXXXXXXXXXXXXXXXXXXXXXXXXXX| | XXXXXXXXXXXXXXXXXXXXXXXXXXXXXXXXXXXXXX|5 19 23 | 0 XXXXXXXXXXXXXXXXXXXXXXXXXXXXXXXXXXXXXX|11 17 | XXXXXXXXXXXXXXXXXXXXXXXXXXXXXXXXXXXX|9 39 | XXXXXXXXXXXXXXXXXXXXXXXXXXXXXXXX|22 | |28 | XXXXXXXXXXXXXXXXXXXXXXXXXXXXXXX|1 6 35 | XXXXXXXXXXXXXXXXXXXXXXXXXXXXXX| | XXXXXXXXXXXXXXXXXXXXXXXXXXXX|15 16 27 | XXXXXXXXXXXXXXXXXXXXXX|14 20 | | | XXXXXXXXXXXXXXXXX|8 | -1 XXXXXXXXXXXXXXX|3 13 | XXXXXXXXXXXX|7 | |4 24 | XXXXXXXXX| | XXXXX| | |12 | XXXX| | | | XX| | |10 | -2 X| | | | X| | | | X| | | | | | | | ======================================================================================= Each 'X' represents 8.8 cases =======================================================================================
Most difficult item
Items
Easiest Item
More difficult
Items
Lessdifficult
Items
Students with High ability
Students with low ability
Students
Student abilities are higher than the most
dufficult item
Student abilities are lower than the
easiest item

- 34 -
4.2 Facility Indices of Questions in Paper I
Figure 29 :G
rad
e 5
Sch
ola
rsh
ip E
xam
inati
on
- 2
01
5P
erfo
rm
an
ce i
n P
ap
er I
0
10
20
30
40
50
60
70
80
90
100
12
34
56
78
910111213141516171819202122232425262728293031323334353637383940
Qu
esti
on
Percentage
Gra
de 5
Sch
olar
ship
Exa
min
atio
n - 2
015
Faci
lity
Indi
ces o
f Que
stio
ns -
Pape
r I
Facility Index
0.00.1
0.2
0.3
0.4
0.50.6
0.7
0.8
0.9
1.0
Que
stio
n N
umbe
r

- 35 -
4.3 Distractor Analysis for Paper I (Multiple Choice Questions)
Table 23 : Grade 5 Scholarship Examination 2015 - Paper I
Percentage of students who responded for each Option
Option 1 Option 2 Option 3 Missing
1 2 5.3 64.0 30.3 0.5
2 1 20.1 29.1 50.2 0.7
3 3 17.0 7.5 75.0 0.5
4 1 78.7 9.7 10.8 0.8
5 3 32.5 12.4 54.3 0.8
6 1 63.7 20.4 14.1 1.9
7 2 9.0 77.1 12.9 1.1
8 3 12.1 14.1 73.1 0.7
9 2 27.3 56.6 14.6 1.5
10 1 87.7 7.0 3.9 1.3
11 3 25.3 18.4 54.4 1.9
12 2 7.0 82.9 9.6 0.6
13 3 9.7 15.0 74.6 0.7
14 2 14.2 69.4 15.8 0.7
15 1 68.5 13.1 17.2 1.2
16 3 24.1 8.0 67.5 0.5
17 3 15.6 27.9 54.8 1.6
18 1 48.5 13.9 36.1 1.5
19 2 22.4 52.3 22.8 2.4
20 2 18.1 69.2 11.0 1.7
21 1 30.8 18.0 50.3 0.9
22 1 60.0 18.2 20.5 1.3
23 3 39.1 7.0 53.0 0.9
24 2 13.5 78.3 7.5 0.8
25 3 27.9 22.0 49.0 1.1
26 2 22.6 43.9 32.3 1.2
27 3 15.6 16.2 67.2 1.0
28 3 10.5 26.2 62.0 1.3
29 2 46.2 38.7 14.1 1.0
30 1 21.7 61.2 15.4 1.7
31 1 47.3 34.2 17.2 1.3
32 1 21.4 33.3 41.6 3.7
33 1 20.9 16.2 61.0 1.9
34 1 42.2 29.8 25.3 2.7
35 3 5.4 27.7 64.5 2.4
36 2 45.3 16.5 34.9 3.3
37 1 29.7 35.3 32.5 2.6
38 1 49.5 28.2 19.2 3.1
39 2 24.5 57.0 15.1 3.5
40 3 21.0 34.5 41.0 3.4
Percentage of responses for each option Question
Number
Correct
Answer

- 36 -
4.4 Item Person Map for Paper II
Figure 30 :================================================================================ ConQuest: Generalised Item Response Modelling Software Wed Jan 01 14:18 2014 MAP OF WLE ESTIMATES AND RESPONSE MODEL PARAMETER ESTIMATES ================================================================================ Terms in the Model (excl Step terms) +item --------------------------------------------------------------------------------------- | | | | | | 5 | | | | | | | | | | | | 4 | | X| | | | XX| | XX| | 3 | | XXX|10 | XXXXX| | XXXXXXXXXXXXXXX| | XXXXXXXX|13 | XXXXXXXXX|12.1 60 | 2 XXXXXXXXXXXXXXXXXXXXXXXXXX|15 42 55 | XXXXXXXXXXXXXXXXXXXXXXXXXX|22 | XXXXXXXXXXXXXXX| | XXXXXXXXXXXXXXXXXXXXXXXXXXX|1.2 45 58 | XXXXXXXXXXXXXXXXXXXXXXXXXXX|1.6 | XXXXXXXXXXXXXXXXXXXXXXXXX|1.4 14 24 29.1 36 51 | 1 XXXXXXXXXXXXXXXXXXXXXXXXXXXXXXXXXXXXXXXX|28.2 56 | XXXXXXXXXXXXXXXXXXXXXXXXXXXX| | XXXXXXXXXXXXXXXXXXXXXXX|1.1 5 9 25 26 | XXXXXXXXXXXXXXXXXXXXXXXXXXXXXXXXXXXX| | XXXXXXXXXXXXXXXXXXXXXXX|12.2 27.1 | XXXXXXXXXXXXXXXXXXXXXXXXXXXXXXXXX|7 17 23.2 27.2 35 | 0 XXXXXXXXXXXXXXXXXXXXXX|6 29.2 34 54 | XXXXXXXXXXXXXXXXXXXXXXXXXXXXXX|1.5 19 28.1 48 49 | XXXXXXXXXXXXXXXXXXXXXXXXXXXXXX|8 11.2 30.1 30.3 46 53 59 | XXXXXXXXXXXXXXXXXXXX|3.2 11.1 33 37 39 40 41 43 | XXXXXXXXXXXXXXXXXXXXXXXXXX|1.3 47 50 57 | -1 XXXXXXXXXXXXX|23.1 44 | XXXXXXXXXXXXXXX|2.2 3.3 4.2 21 | XXXXXXXXXXXXXXX|2.1 4.1 20 | XXXXXXXXXXXXX| | XXXXXXXXXXX|31 38 52 | XXXXXXXXXXX|32 | -2 XXXXXXXXX| | XXX| | XXX|30.2 | XXXXXX|18 | XXX| | X|3.1 | -3 X| | | | X| | X| | | | | | -4 X| | | | | | X| | | | ======================================================================================= Each 'X' represents 9.8 cases =======================================================================================
Most difficult item
Items
Easiest Item
More difficult
Items
Lessdifficult
Items
Students with more ability
Students with low ability
Students
Student abilities are higher than the most
dufficult item
Student abilities are lower than the
easiest item


- 38 -
4.6 Category Analysis for Paper II
4.6.1 Distractor Analysis for Maltiple Choice Questions
Table 24 : Grade 5 Scholarship Examination 2015 - Paper II Percentage of students who responded for each Option
Option 1 Option 2 Option 3 Option 4 Missing
(Item31) 1 81.5 5.22 5.82 6.25 1.22
(Item32) 2 8.38 84.55 4.37 1.8 0.9
(Item33) 1 67.13 10.45 14.52 5.88 2.02
(Item34) 4 10 11.33 16.28 59.98 2.4
(Item35) 3 26.98 10.53 55.73 4.25 2.5
(Item36) 4 42.77 9.28 7.23 36.48 4.23
(Item37) 4 11.55 8.78 9.4 68.02 2.25
(Item38) 2 8.77 81.7 5.12 3.2 1.22
(Item39) 2 14.58 66.43 8 9.05 1.93
(Item40) 3 7.95 14.25 66.67 9.17 1.97
(Item41) 4 12.1 6.72 9.92 69.03 2.23
(Item42) 1 21.43 28.18 35.6 9.15 5.63
(Item43) 1 68.85 13.72 8.65 6.2 2.58
(Item44) 3 12.02 4.2 72.57 9.28 1.93
(Item45) 4 16.5 33.68 16.38 29.68 3.75
(Item46) 2 11.3 65.17 8.48 12.75 2.3
(Item47) 4 9.43 7.85 9.73 70.75 2.23
(Item48) 3 10.18 7.33 63.12 16.92 2.45
(Item49) 1 61.9 13.97 6.77 14.37 3
(Item50) 3 13.27 6.62 69.5 8.47 2.15
(Item51) 3 16.98 17.72 35.02 25.73 4.55
(Item52) 1 82.93 3.43 6.13 5.98 1.52
(Item53) 4 11.13 10.33 11.35 64.3 2.88
(Item54) 3 21.88 9.48 58.35 7.23 3.05
(Item55) 3 22.65 17.45 23.23 30.65 6.02
(Item56) 2 18.23 37.95 21.38 17.53 4.9
(Item57) 2 11.63 71.22 5.75 8.83 2.57
(Item58) 3 35.93 10 31.28 17.28 5.5
(Item59) 2 13.72 64.28 12.35 6.72 2.93
(Item60) 4 11.25 18.23 43.88 20.5 6.13
Percentage of responses for each optionCorrect
Answer for
MCQ
Question
Number

- 39 -
4.6.2. Category Analysis for short Answer Type Questions
Table 25 : Grade 5 Scholarship Examination 2015 - Paper II
Percentage of students who obtained marks 0, 1, 2 and 3
0 1 2 3 Missing
(Item1.1) 54.33 44.6 1.07
(Item1.2) 67.08 31.38 1.53
(Item1.3) 27.87 71.28 0.85
(Item1.4) 62.37 35.95 1.68
(Item1.5) 37.15 61.32 1.53
(Item1.6) 64.93 32.88 2.18
(Item2.1) 20.52 79.07 0.42
(Item2.2) 24.22 75.23 0.55
(Item3.1) 7.43 92.32 0.25
(Item3.2) 33.18 66.2 0.62
(Item3.3) 24.5 75.13 0.37
(Item4.1) 22.38 77.25 0.37
(Item4.2) 23.07 76.45 0.48
(Item5) 50.7 44.87 4.43
(Item6) 41.9 57 1.1
(Item7) 41.38 54.97 3.65
(Item8) 33.02 64.77 2.22
(Item9) 52.2 45.92 1.88
(Item10) 42.27 27.78 14.7 12.18 3.07
(Item11.1) 32.12 66.68 1.2
(Item11.2) 34.05 64.72 1.23
(Item12.1) 70.35 20.77 8.88
(Item12.2) 41.93 52.05 6.02
(Item13) 74.73 16.92 8.35
(Item14) 57.45 37.35 5.2
(Item15) 65.48 23.15 11.37
(Item17) 44.43 0.2 53.98 1.38
(Item18) 8.67 0.58 90.03 0.72
(Item19) 35.42 0.23 62.38 1.97
(Item20) 21.52 0.35 77.2 0.93
(Item21) 23.88 0.45 74.82 0.85
(Item22) 71.85 0.47 25.55 2.13
(Item23.1) 25.93 72.52 1.55
(Item23.2) 44 54.25 1.75
(Item24) 62.68 0.43 34.73 2.15
(Item25) 51 0.92 46.25 1.83
(Item26) 52.75 0.42 44.63 2.2
(Item27.1) 47.43 50.92 1.65
(Item27.2) 43.03 54.95 2.02
(Item28.1) 37 0.87 60.63 1.5
(Item28.2) 59.57 0.55 38.07 1.82
(Item29.1) 28.82 25.82 8.52 36.78
(Item29.2) 37.17 59.47 3.37
(Item30.1) 31.42 2.03 64.42 2.13
(Item30.2) 9.42 89.35 1.23
(Item30.3) 34.87 63.33 1.8
Question
Number
Marks for Short Answer Type Question


- 41 -
4.8.2 Weaknesses Identified in the Essay Question
Figure 34 :
Grade 5 Examination - 2015
Essay Analysis
20.2
8.6
14.9
13.4
5.4
9.2
16.4
7.0
4.1
1.0
0
5
10
15
20
25
1 2 3 4 5 6 7 8 9 10
Per
cen
tage
Weaknesses
Grade 5 Scholarship Examination - 2015 Essay Analysis
Key 1. Complete idea is not included in the sentences written
2. Sentences do not contain at least six words
3. Subject - verb (predicate) relationship is incorrect
4. Incorrect spelling
5. Repetition of the same ideas
6. Use of colloquial language in writing
7. No relationship between the theme of the incident given and the sentences written
8. Not attempted
9. Repetition of writing of isolated letters or groups of letters meaninglessly
10. Others

- 42 -
Table 26 :Performance Indices of Paper I, Paper II & Overall
Prepared according to stanine scale
One Hundred and Seven high performing schools in the Island(Out of the schools where 20 or more candidates have appeared for the exam)
5. Performance of Candidates by School
NO PROVINCE ZONE NAME SCHOOL NAME
1 NORTH WESTERN KULIYAPITIYA KP/VISHAKA GIRLS COLLEGE 124 69 76 73 1
2 WESTERN GAMPAHA GM/SRI SUMEDHA M. VIDYALAYA 244 68 74 71 2
3 WESTERN KALUTARA KL/ST. JOHN'S BALIKA VIDYALAYA 227 67 73 70 3
4 SOUTHERN MULATIYANA MR/RANSEGODA NORTH KANISHTA VIDYALAYA 28 71 69 70 3
5 NORTH WESTERN MAHO NK/SIRIMAVO BANDARANAYAKE P. VIDYALAYA 79 66 74 70 3
6 NORTHERN JAFFNA J /ST. JOHN BOSCO'S VIDYALAYA 227 65 73 69 6
7 WESTERN HORANA KL/THAKSHILA KANISHTA VIDYALAYA 273 67 71 69 6
8 NORTH WESTERN KULIYAPITIYA KP/ASSEDDUMA SUBHARATHI KANISHTA V. 297 67 71 69 6
9 NORTH WESTERN MAHO NK/DALADAGAMA PRIMARY SCHOOL 89 65 71 68 9
10 NORTH WESTERN MAHO NK/EHETUWEWA PRIMARY VIDYALAYA 131 64 71 68 9
11 NORTHERN JAFFNA J /JAFFNA HINDU PRIMARY SCHOOL, 289 65 69 67 11
12 NORTHERN VADAMARACHCHI J /VADAMARACHCHY HINDU PRIMARY SCHOOL 23 66 67 67 11
13 NORTH CENTRAL POLONNARUWA PL/RAJAKEEYA KANISHTA VIDYALAYA 289 64 69 67 11
14 NORTHERN VAVUNIYA SOUTH V /RAMBAIKULAM G.M.V. 166 65 68 67 11
15 UVA BADULLA BD/VIHARA MAHADEVI BALIKA MAHA V. 206 64 68 66 15
16 WESTERN GAMPAHA GM/HIRIPITIYA PRIMARY SCHOOL 125 63 69 66 15
17 SOUTHERN TANGALLE H /BELIATTA RUHUNU VIJAYABA PRIMARY V. 254 64 68 66 15
18 WESTERN HORANA KL/HORANA RAJAKEEYA VIDYALAYA 284 65 67 66 15
19 NORTH WESTERN GIRIULLA KP/RATHNALANKARA M.V. 267 62 69 66 15
20 NORTH WESTERN KURUNEGALA KU/PRESIDENT GIRLS COLLEGE 135 62 69 66 15
21 CENTRAL GALEWELA MT/BULAGALA VIDYALAYA 38 63 68 66 15
22 NORTH WESTERN NIKAWERATIYA NK/NELUMGALA PRIMARY V. 21 64 67 66 15
23 WESTERN GAMPAHA GM/GOTHAMIE KANISHTA VIDYALAYA 267 62 67 65 23
24 WESTERN GAMPAHA GM/IMBULGODA SUNETHRADEVI KANISHTA V. 86 63 66 65 23
25 WESTERN GAMPAHA GM/SRIBODHI VIDYALAYA 228 63 67 65 23
26 WESTERN GAMPAHA GM/YASODHARA DEVI BALIKA MAHA V. 134 62 67 65 23
27 WESTERN PILIYANDALA HO/PILIYANDALA NO. 1. K.V. 313 63 67 65 23
28 SABARAGAMUWA DEHIOVITA KG/DEHIOWITA BAUDDHA PRIMARY VIDYALAYA 154 62 67 65 23
29 WESTERN MATHUGAMA KL/C.W.W.KANNANGARA MADHYA MAHA V. 208 63 67 65 23
30 WESTERN HORANA KL/TAXILA KALUPANA PRIMARY VIDYALAYA 181 64 66 65 23
31 NORTH WESTERN KURUNEGALA KU/MALIYADEVA BALIKA MAHA VIDYALAYA 255 62 67 65 23
32 WESTERN MINUWANGODA MI/HORAGASMULLA PRIMARY SCHOOL 179 62 67 65 23
33 SOUTHERN MATARA MR/WEHERAGAMPITA OLCOTT ADARSHA V. 253 62 67 65 23
34 SABARAGAMUWA BALANGODA R /KARAGASTALAWA VIDYALAYA 85 63 66 65 23
35 NORTH CENTRAL ANURADHAPURA A /SRI RAHULA VIDYALAYA 68 61 67 64 35
36 EASTERN AMPARA AM/DUDLEY SENANAYAKE VIDYALAYA 78 60 68 64 35
37 NORTH WESTERN CHILAW CH/BUDDHIST BALIKA M. VIDYALAYA 123 62 66 64 35
38 SOUTHERN GALLE G /CHRIST CHURCH BALIKA M.V. 192 60 67 64 35
39 SOUTHERN GALLE G /SANGAMITTA BALIKA M.V. 361 62 66 64 35
40 WESTERN GAMPAHA GM/PATTALAGEDARA VIDYALOKA MAHA V. 127 60 67 64 35
41 SOUTHERN TANGALLE H /TANGALLE MODEL PRIMARY SCHOOL 301 62 66 64 35
42 WESTERN HOMAGAMA HO/GODAGAMA SUBHARATHI MAHAMATHYA M. V. 180 62 65 64 35
43 NORTHERN JAFFNA J /KOKUVIL HINDU PRIMARY SCHOOL 151 62 65 64 35
44 WESTERN MATHUGAMA KL/ANANDA SASTHRALAYA 92 60 68 64 35
45 WESTERN HORANA KL/PRAJAPATHI BALIKA V. 91 63 65 64 35
46 NORTH WESTERN KURUNEGALA KU/MAWATHAGAMA R.C.VIDYALAYA 186 61 67 64 35
47 WESTERN MINUWANGODA MI/HANGAWATTA RAJAGIRI KANISHTA V. 42 61 67 64 35
48 SOUTHERN MATARA MR/UYANWATTA ADHARSHA KANISHTA V. 84 60 68 64 35
49 CENTRAL GALEWELA MT/DIVULGASKOTUWA PRIMARY SCHOOL 71 63 65 64 35
50 NORTH WESTERN MAHO NK/EMBULGIRIYA V. 24 59 69 64 35
51 NORTH WESTERN NIKAWERATIYA NK/RAJABIMA VIDYALAYA 77 63 64 64 35
52 SABARAGAMUWA RATNAPURA R /FERGUSON GIRLS' HIGH SCHOOL 317 62 66 64 35
53 NORTHERN VAVUNIYA NORTH V /PUTHUKULAM JUNIOR SCHOOL 45 63 65 64 35
SUBJECT 1
NUMBER OF
CANDIDATESSUBJECT
2SCHOOL
INDEXISLANDRANK

- 43 -
Cont ...........
NO PROVINCE ZONE NAME SCHOOL NAME
54 WESTERN PILIYANDALA HO/SOMAWEERA CHANDRASIRI V., 356 62 64 63 54
55 WESTERN GAMPAHA GM/ALUTHGAMA ANURA MODEL KANISHTA V, 210 60 65 63 54
56 WESTERN MINUWANGODA MI/CLAYTON V, 76 60 66 63 54
57 WESTERN KALUTARA KL/KALUTARA BALIKA M.V., 221 61 65 63 54
58 SOUTHERN MATARA MR/SUJATHA V, 296 59 67 63 54
59 SOUTHERN AKURESSA MR/PORAMBA KANISHTA V, 76 59 67 63 54
60 NORTHERN VADAMARACHCHI J /NELLIYADY M.M.T.M. SCHOOL, 91 62 64 63 54
61 NORTHERN VADAMARACHCHI J /THUNNALAI KASINATHA V., 28 62 63 63 54
62 EASTERN BATTICALOA BT/VINCENT GIRL'S HIGH SCHOOL, 144 62 63 63 54
63 EASTERN TRINCOMALEE T /R.K.M. SRI KONESWARA HINDU COLLEGE, 161 63 63 63 54
64 EASTERN TRINCOMALEE T /SRI SHANMUGA HINDU LADIES' COLLEGE, 160 61 65 63 54
65 NORTH WESTERN KURUNEGALA KU/DEFENCE SERVICES COLLEGE, 68 60 65 63 54
66 NORTH WESTERN NIKAWERATIYA NK/SRI SUMANGALA M.M.V., 256 61 64 63 54
67 NORTH WESTERN GIRIULLA KP/GANEGODA PRIMARY V., 59 58 67 63 54
68 NORTH WESTERN GIRIULLA KP/MEDAGAMPOLA GUNARATHANA M.V., 91 61 65 63 54
69 NORTH WESTERN GIRIULLA KP/NARAMMALA MAYURAPADA KANISHTA V., 181 60 65 63 54
70 NORTH CENTRAL DIMBULAGALA PL/SIRIPURA PRIMARY V, 94 61 64 63 54
71 SABARAGAMUWA KEGALLE KG/WARAKAPOLA BAUDDHA V., 81 59 67 63 54
72 SABARAGAMUWA KEGALLE KG/RUWANWELLA PRIMARY V, 193 59 67 63 54
73 SABARAGAMUWA KEGALLE KG/DUDLEY SENANAYAKA MADHYA MAHA V, 145 62 64 63 54
74 SABARAGAMUWA KEGALLE KG/ST. JOSEPH'S BALIKA MAHA V, 234 59 67 63 54
75 WESTERN COLOMBO CS/MUSAEUS COLLEGE, 365 60 63 62 75
76 WESTERN SRI JAYA,PURA CS/KOTTAWA DHARMAPALA M.V., 220 60 64 62 75
77 WESTERN HOMAGAMA HO/SIRI PIYARATHNA K.V., 185 60 63 62 75
78 WESTERN GAMPAHA GM/ST. MARY'S MAHA V, 168 59 64 62 75
79 WESTERN GAMPAHA GM/RANPOKUNAGAMA MAHA V, 223 61 63 62 75
80 WESTERN GAMPAHA GM/SANGHAMITTHA BALIKA V., 125 59 65 62 75
81 WESTERN KELANIYA GM/AL. MAHMOOD V, 49 61 63 62 75
82 WESTERN MATHUGAMA KL/DAPILIGODA KANISHTA V, 126 59 64 62 75
83 CENTRAL KANDY K /GIRLS' HIGH SCHOOL, 256 60 64 62 75
84 SOUTHERN GALLE G /MAHINDA V, 239 61 62 62 75
85 SOUTHERN GALLE G /JANADHIPATHI BALIKA VID., 185 58 65 62 75
86 SOUTHERN GALLE G /SOUTHLANDS V, 254 60 63 62 75
87 SOUTHERN ELPITIYA G /ST. TERESA KANISHTA V, 166 58 65 62 75
88 SOUTHERN AMBALANGODA G /DHARMASOKA M.V., 269 61 62 62 75
89 SOUTHERN MATARA MR/RAHULA V, 328 59 64 62 75
90 SOUTHERN AKURESSA MR/GODAPITIYA KANISHTA V, 214 58 65 62 75
91 SOUTHERN MULATIYANA MR/GANGODAGAMA JAYAWARDENA MAHA V, 25 62 62 62 75
92 NORTH WESTERN KURUNEGALA KU/WAYAMBA RAJAKEEYA PRIMARY V., 202 60 63 62 75
93 NORTH WESTERN NIKAWERATIYA NK/THIMBIRIYAWA K.V., 22 60 63 62 75
94 NORTH WESTERN NIKAWERATIYA NK/KATUPOTHA PRIMARY V., 167 61 63 62 75
95 NORTH WESTERN NIKAWERATIYA NK/JAYANTHI MADHYA MAHA V, 208 60 63 62 75
96 NORTH WESTERN MAHO NK/GUNAPALA MALALASEKERA MODEL SCHOOL, 79 61 62 62 75
97 NORTH WESTERN PUTTALAM PU/MAHAUSWEWA PARAKRAMA PRIMARY V, 80 58 65 62 75
98 NORTH WESTERN PUTTALAM PU/DHARMAPALA PRIMARY SCHOOL, 61 61 63 62 75
99 NORTH WESTERN CHILAW CH/WENNAPPUWA HOLY FAMILY BALIKA MAHA V., 217 58 65 62 75
100 NORTH CENTRAL POLONNARUWA PL/SEWAMUKTHAKANDAVURA M.V.SEVAGAMA, 141 60 63 62 75
101 UVA BADULLA BD/DHARMADUTHA MAHA V, 198 61 63 62 75
102 UVA BANDARAWELA BD/BANDARAWELA MADHYA MAHA V, 189 60 63 62 75
103 UVA BANDARAWELA BD/KUDA KUSUM BALIKA MAHA V, 134 59 64 62 75
104 SABARAGAMUWA EMBILIPITIYA R /EMBILIPITIYA KANISHTA SECONDARY SCHOOL, 264 60 64 62 75
105 SABARAGAMUWA EMBILIPITIYA R /PANAMURA MAHA V, 60 60 63 62 75
106 SABARAGAMUWA MAWANELLA KG/KADIGAMUWA VIDYATHILAKA V, 20 59 65 62 75
107 SABARAGAMUWA DEHIOVITA KG/WENDALA PRIMARY SCHOOL, 96 60 64 62 75
SUBJECT 1
NUMBER OF
CANDIDATESSUBJECT
2SCHOOL
INDEXISLANDRANK

- 44 -
Presentation of the Research and Development BranchDepartment of Examinations