Reviewers' comments: Reviewer #1 (Remarks to the … · should describe each one in succession. In...
23
Reviewers' comments: Reviewer #1 (Remarks to the Author): The manuscript entitled “Altered expression of maize KLUH enhances biomass and seed yield by extending cell division” describes the development genetically modified maize that extend the expression of the KLUH gene using the GA2ox promoter. This significantly increases leaf growth and some yield components. The results show that this is due to a slightly higher and longer duration of cell division in the leaf. This is an outstanding study demonstrating that GM technology can have a positive impact on important crop productivity components. Of note in this paper is a nice demonstration showing the impact of trait gene expression control on physiological readout. First, they demonstrate that use of a strong constitutive promoter, Ubi1, which is common practice in many academic labs produces infertile plants that make large leaves. They solve this problem by limiting transgene expression to a slightly wider range of the leaf cell division zone using the GA2ox promoter. This is an important result that shows the impact of transgene expression control. They also report plant characterization work that took place in both controlled and field environments. In this case, they show that observations in controlled environments extend to the field. However, the field studies do not reflect production environments because planting density is too low. In addition the authors evaluated the trait effect in both the transformed inbred, B104, and up to 5 hybrid backgrounds. The weaknesses in this paper are mainly in the detail in several figure legends, a lack of detail in the Methods and accounting for the statistical analysis in some of the comparisons. Also, the number of transgenic events produced for this study is on the low end. Typically for GM yield traits, more than 5 and ideally 10 independent events are required to clearly demonstrate GM trait efficacy. Finally, the language in the text and several figures need to be reviewed and edited for flow and agreement. The Figure 2 legend suggests that white arrows should also be in 2b. in addition, the description includes results of a ‘linear spline mixed model’ in two places that has nothing to do with the data in the figure since the indicators of statistical significance are the result of a separate test described at the end of the legend. What’s confusing is why the different tests were done, which should be clarified. This also applies to Figure 4. In Figure 3, the language is difficult to follow since it describes results from three different experiments, each with different materials. The sample sizes are not indicated and it’s also not clear if any of the contrasts are significant. Figures 5 and 6 would also benefit from a more detailed accounting of the statistical tests. My suggestion is to add a Statistics section to the Methods. The Methods section lacks detail in several places. The PCR steps used to produce the KLUH gene could be more detailed since not all readers of this journal are going to be skilled molecular biologists. In line 330, the use of ‘cloned’ to describe a ligation step can be confusing to some. The primer orientation should be indicated. In line 333-334, the scope of
Transcript of Reviewers' comments: Reviewer #1 (Remarks to the … · should describe each one in succession. In...

Reviewers' comments:
Reviewer #1 (Remarks to the Author):
The manuscript entitled “Altered expression of maize KLUH enhances biomass and seed
yield by extending cell division” describes the development genetically modified maize that
extend the expression of the KLUH gene using the GA2ox promoter. This significantly
increases leaf growth and some yield components. The results show that this is due to a
slightly higher and longer duration of cell division in the leaf. This is an outstanding study
demonstrating that GM technology can have a positive impact on important crop
productivity components.
Of note in this paper is a nice demonstration showing the impact of trait gene expression
control on physiological readout. First, they demonstrate that use of a strong constitutive
promoter, Ubi1, which is common practice in many academic labs produces infertile plants
that make large leaves. They solve this problem by limiting transgene expression to a
slightly wider range of the leaf cell division zone using the GA2ox promoter. This is an
important result that shows the impact of transgene expression control. They also report
plant characterization work that took place in both controlled and field environments. In this
case, they show that observations in controlled environments extend to the field. However,
the field studies do not reflect production environments because planting density is too low.
In addition the authors evaluated the trait effect in both the transformed inbred, B104, and
up to 5 hybrid backgrounds.
The weaknesses in this paper are mainly in the detail in several figure legends, a lack of
detail in the Methods and accounting for the statistical analysis in some of the comparisons.
Also, the number of transgenic events produced for this study is on the low end. Typically
for GM yield traits, more than 5 and ideally 10 independent events are required to clearly
demonstrate GM trait efficacy. Finally, the language in the text and several figures need to
be reviewed and edited for flow and agreement.
The Figure 2 legend suggests that white arrows should also be in 2b. in addition, the
description includes results of a ‘linear spline mixed model’ in two places that has nothing to
do with the data in the figure since the indicators of statistical significance are the result of
a separate test described at the end of the legend. What’s confusing is why the different
tests were done, which should be clarified. This also applies to Figure 4. In Figure 3, the
language is difficult to follow since it describes results from three different experiments,
each with different materials. The sample sizes are not indicated and it’s also not clear if
any of the contrasts are significant. Figures 5 and 6 would also benefit from a more detailed
accounting of the statistical tests. My suggestion is to add a Statistics
section to the Methods.
The Methods section lacks detail in several places. The PCR steps used to produce the KLUH
gene could be more detailed since not all readers of this journal are going to be skilled
molecular biologists. In line 330, the use of ‘cloned’ to describe a ligation step can be
confusing to some. The primer orientation should be indicated. In line 333-334, the scope of
the GA2ox promoter is not described properly. The last sentence of the first section, lines
340-42, lists primers to determine the KLUH expression level. How was this actually
measured? In lines 347-350, PCR is not a method used to assay protein levels. In the last
part of this section, the details of the thermal cycling protocol are given, but there are no
details regarding the PCR reactants. In the ‘RNA sequencing analysis’ section, it’s not clear
what ‘bayes’ means.
In the ‘Growth conditions in growth chamber and greenhouse’ section, the growth conditions
between night and day should be consistently detailed. Also, the units for light intensity
should be micromole per m2 per sec. The imposed drought conditions are also not described
well. What do the kPa terms refer to? In the next section, line 387, visible seems to be a
better term that visualized.
The ‘Field trial design and plant trait analysis section’ needs the most improvement. How
were the seed used in these studies produced? Since the paper includes studies using
several different materials it’s important to document their relationship to each other. What
are the dimensions of the rows? Are there alleys in between rows? Particularly with corn,
plant density is known to influence productivity, something the paper tries to address. What
is meant by the term ‘segregating’? How were the 12 representative plants in each row
selected? The trait characterization measurements should be more detailed, including a
description of the logic for the different replication strategies.
Specific Comments on the text:
In Results, line 74 the transformed maize are referred to as ‘plants’ which is too generic.
Lines or events are a better term.
In Results, line 78 the ‘control transformant’ is a little confusing. Is it an escape that lacks a
T-DNA insert or has a partial T-DNA insert?
The paragraph beginning with ‘The enhanced leaf phenotypes persisted in hybrids…’ is very
difficult to follow. Rather than describe aspects of several different experiment, the authors
should describe each one in succession. In addition hybrids are often referred to as the F1
generation.
In the second paragraph of the ‘KLUH stimulated growth by extending the duration of cell
division’ section, the referenced figure should be Supplementary Fig. 9.
In the second paragraph of the ‘KLUH-mediated growth stimulation involves auxin
metabolism’ section, FC and FDR should be spelled out. Also, I am not sure what is meant
by ‘the division zone becomes consumed’ in the last sentence in paragraph 2.
In the Discussion section, line 256, the reference is probably 24 not 25.
In the Discussion section, line 259, the term stacked may be better than doubled.

In the Discussion section, line 270, the reference is not clear.
In the Discussion section, line 276, the word catalyzes seems misplaced.
In the Discussion section, lines 284-286, a better way to write this sentence is ‘Constitutive
overexpression of KLUH results in very small mature cells which might be due to over-
proliferation, producing cells that fail to expand.’
In the Discussion section, lines 290-293, it’s not clear what DP-alpha is or why it’s relevant.
In Supplementary Figure 1a what are the expression data relative to?
In Supplementary Figure 3, it’s difficult to believe that many of the significant differences
indicated are real given the size of the standard error bars. It’s likely that the control data
were also variable.
In Supplementary Figure 4 could be more detailed since this study included several hybrids
which many investigators would consider to be different entries.
In Supplementary Figure 6 it would be good to indicate the statistical test used.
In Supplementary Figure 8 it would be nice to understand the rationale for the statistical
tests, as in Figures 2 & 4.
Supplementary Table 1 shares data the Supplementary Figure 4 and only 4 plants were
used to produce the data. In Sup. Fig. 4 sample sizes range from 16-23. Why the
difference? More detail will help the table stand alone, such as which leaf is being
compared.
In Supplementary Table 3 it would be useful to add a column indicating source of each
comparison.
In Supplementary Table 4 the statistical tests are potentially confusing. The comparison
appears to be between the two treatments and not between transgenic and non-transgenic
plants.
In Supplementary Table 5 the use of W6 and W2 and K2 and K6 to designate the entries
makes the information a little difficult to follow.
Reviewer #2 (Remarks to the Author):
In this study, Sun et al., characterize the effects of ZmKLUH/CYP78A1 expression on plant
growth and yield. The authors observed that overexpressing KLUH with a GA2ox promoter,
known to be expressed specifically in expanding cells, produced plants with an overall

increase in size and yield, overcoming infertility derived from ubiquitous overexpression of
this gene. The effects of this specific overexpression were stable in various genetic
backgrounds and growing locations/seasons. The authors show that KLUH is involved in the
temporal regulation of maize leaf growth by influencing the duration of the cell division
period, also known as leaf elongation duration (LED). The authors suggest that this
expansion of the LED might be connected with auxin regulation and independent of GA.
Additionally, they suggest that KLUH overexpression might be used to overcome the growth
inhibition caused by abiotic stresses like cold or drought.
Although these observations are interesting and deserve attention, in my opinion, the study
does not provide enough novel insight on the mechanisms behind KLUH function to merit
publication in Nature Communications. The observation that KLUH regulates organ size in a
way that positively correlates with its expression level is not novel and has been described
in multiple species, as mentioned by the authors. It is also known that Cytochrome p450
proteins can affect cell size by regulating the duration of the cell division period. The more
general aspects of the data that show a connection between auxin and duration of LED, and
that LER and LED are independent are also not novel, as referenced in the manuscript.
Furthermore, the study fails to provide insight on the connection between KLUH and auxin
metabolism, and for the compensatory effects of KLUH overexpression under stress
conditions.
Specific comments:
The description of the effects of KLUH overexpression on plant growth is extensive and the
results appear consistent through multiple experiments. Nevertheless, the way the data is
presented often appear redundant or was confusing. For example, Fig3, SuppFig3, SuppFig4
and SuppTable1 all have related data but is presented in various formats and is partially
redundant. I had a really hard time understanding the figures and getting a good overview
of the differences between experiments, and of the different transgenic lines.
There are also several small inconsistencies in the data presented, that make it harder to
interpret. For example, regarding Fig1 and SuppFig1, in the text, it is said the increase in
leaf size correlates with the expression level of KLUH. Nevertheless, P1 is expressed at
higher levels than P2, but makes smaller leaves. In the same figures, error bars and
statistical tests are missing (also absent in other figures like SuppFig2b). Are the differences
between P1 and P2 significant? Furthermore, there is an inconsistency between the leaf
analyzed in each experiment, which adds to the confusion: expression of kluh was analyzed
in leaf 8, leaf area determined in leaf 9 and cell length measured in leaf 4, for which there is
no leaf size data.
I think it would be interesting to see how the stress conditions actually affect the
phenotypes that were measured extensively before, regarding plant size, biomass, yield...
That way it would be possible to address if KLUH overexpression can actually be useful to
overcame negative effects of stress on plant growth.
The authors don’t provide enough information about the kluh mutant. Mutant plants should
be molecularly characterized and a reference or more information about their origin should
be provided. I also think it would be interesting to do a more detailed analysis of the mutant
plants. SuppFigure9 is another example of the lack of statistical analysis.
The role of auxin in KLUH function is not discussed conveniently. The data showing changes
in auxin-related genes and analysis of auxin levels is presented but no real conclusion is
made regarding KLUH function.
Although GA2ox::KLUH-P3 is expressed much higher than the other transgenes, the impact
on plant size is not more pronounced. Neverthless, both LER and size of division zone
seemed higher on GA2ox::KLUH-P3 but the description in the text is very vague and the
difference between the transgenic lines is not properly discussed. This also makes it harder
to understand the choice of P3 to perform the detailed analysis of the division zone over
time.
Overexpression if KLUH seems to have a negative impact on leaf number but that is not
really explained.
In some experiments, the size of the samples analyzed was small. For example, in
SuppTable1 n=4.
Line 147: there is a wrong reference to Fig4a,b. The steady state analysis referenced is in
Supptable2 (only for P1 and P2).
Line 151: there is a reference to Supptable2 has having data for GA2ox::KLUH-P3, but that
table only has values for the other two lines. P3 is only analyzed in Fig4a,b. Where are the
values of LED for P3?
Line 170: wrong reference to SuppFig8. It should be SuppFigure9.

1 | P a g e
Reviewer #1 (Remarks to the Author):
The manuscript entitled “Altered expression of maize KLUH enhances biomass and seed yield by
extending cell division” describes the development genetically modified maize that extend the
expression of the KLUH gene using the GA2ox promoter. This significantly increases leaf growth
and some yield components. The results show that this is due to a slightly higher and longer
duration of cell division in the leaf. This is an outstanding study demonstrating that GM technology
can have a positive impact on important crop productivity components.
Of note in this paper is a nice demonstration showing the impact of trait gene expression control
on physiological readout. First, they demonstrate that use of a strong constitutive promoter, Ubi1,
which is common practice in many academic labs produces infertile plants that make large leaves.
They solve this problem by limiting transgene expression to a slightly wider range of the leaf cell
division zone using the GA2ox promoter. This is an important result that shows the impact of
transgene expression control. They also report plant characterization work that took place in both
controlled and field environments. In this case, they show that observations in controlled
environments extend to the field. However, the field studies do not reflect production
environments because planting density is too low.
We realize that our field trials might not reflect actual production sites in the USA, but we took, as
many agronomical characteristics as possible into account. For the field trial in Belgium, we sew with
a density of approximately 89.000 seeds per hectare and given the very high germination rate, the
planting density was higher than 85.000 plants per hectare. In Belgium, the planting density varies
for commercial varieties depending on variety and sowing date, between 80.000 and 100.000 plants
per hectare, indicating that our planting density is within the range of what is commonly used in
agriculture. The planting density was added to the Methods section.
In addition the authors evaluated the trait effect in both the transformed inbred, B104, and up to 5
hybrid backgrounds. The weaknesses in this paper are mainly in the detail in several figure legends,
a lack of detail in the Methods and accounting for the statistical analysis in some of the
comparisons.
We removed the explanation of the statistical analyses from the figure legends and we added a topic
covering all statistical analyses in the Methods sections. As a result, the figure legends now read
more fluently and the reasoning behind the statistical analyses is better explained.
Also, the number of transgenic events produced for this study is on the low end. Typically for GM
yield traits, more than 5 and ideally 10 independent events are required to clearly demonstrate
GM trait efficacy.
We agree with the reviewer that more independent event are better for field evaluations. We
obtained ten independent events from transformation, of which the progeny of one event had a low
germination rate. From the nine other lines, six were single locus lines for which only in three
independent events the expression of the transgene could be shown (GA2ox::PLA1-P1, GA2ox::PLA1-
P2 and GA2ox::PLA1-P3). Remarkably, the lines with an observable ‘over’-expression of PLA1 were
also the lines that displayed the growth phenotypes (Figure 1). We used these three independent
events for phenotyping in the growth chamber and the greenhouse, but the Belgian legislation did
not allow for cultivating lines that contained backbone vector DNA. Therefore, we were only able to

2 | P a g e
perform the field trials on two independent events. This information was added to the Methods
section.
Figure 1. KLUH expression relative to 18s ribosomal RNA for at the basal 0.5 cm region of the fourth
leaf of four GA2ox::KLUH/PLA1 transgenic (T) lines and their non-transgenic (NT) siblings. Error bars
indicate standard errors (n=3). Asterisks indicate statistically significant difference in the transgenic
plants versus the non-transgenic plants according to a Student’s t-test (* and ** correspond to P-
value of 0.05>P>0.01 and 0.01>P>0.001, respectively).
Finally, the language in the text and several figures need to be reviewed and edited for flow and
agreement.
We improved the language throughout the text and the figure legends were simplified by describing
the statistics in a designated section of the Methods.
The Figure 2 legend suggests that white arrows should also be in 2b.
We adjusted the figure legend accordingly so the text explaining the white arrows is only mentioned for
Figure 2a.
in addition, the description includes results of a ‘linear spline mixed model’ in two places that has
nothing to do with the data in the figure since the indicators of statistical significance are the result
of a separate test described at the end of the legend. What’s confusing is why the different tests
were done, which should be clarified. This also applies to Figure 4. In Figure 3, the language is
difficult to follow since it describes results from three different experiments, each with different
materials. The sample sizes are not indicated and it’s also not clear if any of the contrasts are
significant. Figures 5 and 6 would also benefit from a more detailed accounting of the statistical
tests. My suggestion is to add a Statistics section to the Methods.
We followed the suggestion of the reviewer and provided a statistics section in the Methods. The
different tests were performed because the nature of the collected data differed. A Student’s t-test
was used to compare quantitative end-point measurements (e.g. final leaf length, plant height,
number of kernels, etc.) between transgenic and non-transgenic plants. Different methods were used
when parameters were followed over time, depending on the sampling strategy. The size of the

3 | P a g e
division zone over time was determined by a destructive method (fixing and staining the basal part of
the leaf for microscopical analysis), meaning that different plants were used on the different time
points. To determine the difference between the transgenic and non-transgenic plants at each time
point, the data were modeled using a general linear model. The measurements of leaf length over
time, were non-destructive and were therefore performed on the same plants over time. Since these
data were longitudinal in nature, a mixed model was used to fit the data. The data in the figures
don’t change, but the legends no longer contain the information on the statistical analyses.
The Methods section lacks detail in several places. The PCR steps used to produce the KLUH gene
could be more detailed since not all readers of this journal are going to be skilled molecular
biologists. In line 330, the use of ‘cloned’ to describe a ligation step can be confusing to some. The
primer orientation should be indicated. In line 333-334, the scope of the GA2ox promoter is not
described properly. The last sentence of the first section, lines 340-42, lists primers to determine
the KLUH expression level. How was this actually measured? In lines 347-350, PCR is not a method
used to assay protein levels. In the last part of this section, the details of the thermal cycling
protocol are given, but there are no details regarding the PCR reactants. In the ‘RNA sequencing
analysis’ section, it’s not clear what ‘bayes’ means.
We adjusted the Methods section according to the reviewer’s comments and we added a
supplemental table listing all primers, with the orientation.
In the ‘Growth conditions in growth chamber and greenhouse’ section, the growth conditions
between night and day should be consistently detailed. Also, the units for light intensity should be
micromole per m2 per sec. The imposed drought conditions are also not described well. What do
the kPa terms refer to? In the next section, line 387, visible seems to be a better term that
visualized.
This Methods sections was more detailed and the spelling errors were corrected.
The ‘Field trial design and plant trait analysis section’ needs the most improvement. How were the
seed used in these studies produced? Since the paper includes studies using several different
materials it’s important to document their relationship to each other. What are the dimensions of
the rows? Are there alleys in between rows? Particularly with corn, plant density is known to
influence productivity, something the paper tries to address. What is meant by the term
‘segregating’? How were the 12 representative plants in each row selected? The trait
characterization measurements should be more detailed, including a description of the logic for
the different replication strategies.
We adjusted the methods section to address these issues raised by the reviewer. Our transformation
pipeline typically transforms B104 plants and the transformed events are backcrossed to B104,
resulting in a progeny that consists of 50% transgenics and 50% non-transgenics, when the T-DNA is
inserted in a single locus. We prefer to work with these seed stocks, that we refer to as segregating,
for the phenotypic analysis in the growth chamber and the greenhouse, as the non-trangenics have
gone through the same tissue culture steps as the transgenics and the seeds originated from the
same cob, eliminating seed batch effects. However, to proceed to field trials we are not allowed to
genotype (e.g. by leaf painting) the plants but we are obliged to know the genotype in advance. For
this reason, we selfed transgenic and non-transgenic plants from a segregating population until we
obtained homozygous plants in the T3 generation. We experienced that B104 was not a suitable
genetic background for field trials in the temperate climate in Belgium (Voorend et al., 2016, Plant
Biotech J.), so we evaluated the performance in Belgium field trials of different hybrids between
B104 and early flowering inbreds (2013-2015). Because the hybrid between B104 and CML91 grew

4 | P a g e
well, resulted in proper seed yield and was not prone to lodging in three consecutive field trials in
Belgium, we crossed the homozygous transgenic and non-transgenic plants to CML91, resulting in
transgenic (hemizygous) and non-transgenic hybrids, that were evaluated in the field trials
mentioned in the manuscript. Because event P3 showed the presence of some vector backbone,
beyond the T-DNA to be transferred to the plant DNA, this line was not allowed for field trial. The
crossing scheme described above was performed for events P1 and P2.
In Belgium, the field trial was designed to have three plots per genotype that were randomly
organized (so twelve in total; Figure 2). Each plot consisted of four rows of six meter each. Because
the plants needed to be emasculated, B104xCML91 hybrids were sown in between the plots to
assure pollination. No paths were made between the rows, but some small paths were formed
between each block of three plots, to allow accessibility of the plots.
In the USA, three rows (each row is 14.6 feet and 35 inches apart) per genotype were (one kernel
every 9 inch) sown and the twelve plants were selected by disregarding border plants and off-looking
plants.
Figure 2. Field trial design of the of the field trial in 2015 in Belgium. T = transgenic, NT = non-
transgenic.
Specific Comments on the text: In Results, line 74 the transformed maize are referred to as ‘plants’
which is too generic. Lines or events are a better term.
We replaced the word ‘plants’ by events.
5 | P a g e
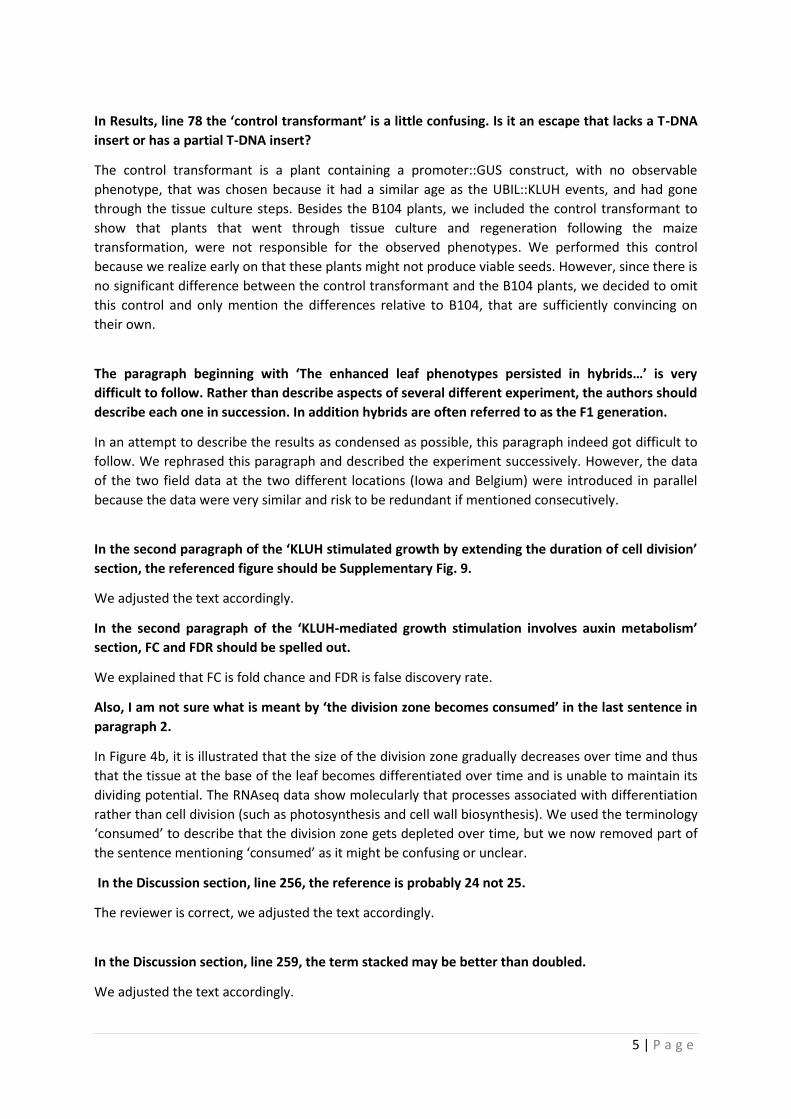
In Results, line 78 the ‘control transformant’ is a little confusing. Is it an escape that lacks a T-DNA
insert or has a partial T-DNA insert?
The control transformant is a plant containing a promoter::GUS construct, with no observable
phenotype, that was chosen because it had a similar age as the UBIL::KLUH events, and had gone
through the tissue culture steps. Besides the B104 plants, we included the control transformant to
show that plants that went through tissue culture and regeneration following the maize
transformation, were not responsible for the observed phenotypes. We performed this control
because we realize early on that these plants might not produce viable seeds. However, since there is
no significant difference between the control transformant and the B104 plants, we decided to omit
this control and only mention the differences relative to B104, that are sufficiently convincing on
their own.
The paragraph beginning with ‘The enhanced leaf phenotypes persisted in hybrids…’ is very
difficult to follow. Rather than describe aspects of several different experiment, the authors should
describe each one in succession. In addition hybrids are often referred to as the F1 generation.
In an attempt to describe the results as condensed as possible, this paragraph indeed got difficult to
follow. We rephrased this paragraph and described the experiment successively. However, the data
of the two field data at the two different locations (Iowa and Belgium) were introduced in parallel
because the data were very similar and risk to be redundant if mentioned consecutively.
In the second paragraph of the ‘KLUH stimulated growth by extending the duration of cell division’
section, the referenced figure should be Supplementary Fig. 9.
We adjusted the text accordingly.
In the second paragraph of the ‘KLUH-mediated growth stimulation involves auxin metabolism’
section, FC and FDR should be spelled out.
We explained that FC is fold chance and FDR is false discovery rate.
Also, I am not sure what is meant by ‘the division zone becomes consumed’ in the last sentence in
paragraph 2.
In Figure 4b, it is illustrated that the size of the division zone gradually decreases over time and thus
that the tissue at the base of the leaf becomes differentiated over time and is unable to maintain its
dividing potential. The RNAseq data show molecularly that processes associated with differentiation
rather than cell division (such as photosynthesis and cell wall biosynthesis). We used the terminology
‘consumed’ to describe that the division zone gets depleted over time, but we now removed part of
the sentence mentioning ‘consumed’ as it might be confusing or unclear.
In the Discussion section, line 256, the reference is probably 24 not 25.
The reviewer is correct, we adjusted the text accordingly.
In the Discussion section, line 259, the term stacked may be better than doubled.
We adjusted the text accordingly.

6 | P a g e
In the Discussion section, line 270, the reference is not clear.
This refers to a manuscript from our team that was recently submitted to Plant Biotechnology
Journal. A copy of the manuscript will be made available to the reviewers. According to the policy of
the journal, papers that are not yet accepted can not be in the reference list.
In the Discussion section, line 276, the word catalyzes seems misplaced.
We rephrased the sentence to ‘chorismate synthase that catalyzes a reaction resulting in the auxin
precursor chorismate’.
In the Discussion section, lines 284-286, a better way to write this sentence is ‘Constitutive
overexpression of KLUH results in very small mature cells which might be due to over-proliferation,
producing cells that fail to expand.’
We implemented the suggestion of the reviewer.
In the Discussion section, lines 290-293, it’s not clear what DP-alpha is or why it’s relevant.
DP is a transcription factor that heterdimerizes with E2F-α to regulate genes involved in cell cycle
progression. We adjusted the text to make this more clear.
In Supplementary Figure 1a what are the expression data relative to?
The data in Supplementary Figure 1a are represented relative to the position that displayed the
highest expression of a given gene, which is set at ‘1’. The graph is adjusted to show the highest
expression of both genes at ‘1’.
In Supplementary Figure 3, it’s difficult to believe that many of the significant differences indicated
are real given the size of the standard error bars. It’s likely that the control data were also variable.
Supplementary Figure 3 is indeed very complex and we originally added the data for completeness,
but since the data in this figure add no novel data that is not presented in other figures or tables, we
opted to omit this figure.
In Supplementary Figure 4 could be more detailed since this study included several hybrids which
many investigators would consider to be different entries.
Supplementary Figure S4 represents the field trial data of the GA2OX::PLA1_P2 transgenic line in
B104 inbred background in the USA in 2014. At that time we did not yet generate hybrids, so all data
presented are in the same genetic background.
In Supplementary Figure 6 it would be good to indicate the statistical test used.
The statistical test was a Student’s t-test. This information was added in the Figure legend.

7 | P a g e
In Supplementary Figure 8 it would be nice to understand the rationale for the statistical tests, as
in Figures 2 & 4.
In supplemental Figure 8 the Leaf length is followed over time in a non-destructive way, so a mixed
model was used to fit the data (as described above). Depending on the nature of the data
represented in Figure 2 and Figure 4, leaf phenotypes were monitored over time, but depending on
the sampling strategy (destructive or not), the same plants or other plants were measured at
different time points, which dictates the statistical test used (see comment above).
Supplementary Table 1 shares data the Supplementary Figure 4 and only 4 plants were used to
produce the data. In Sup. Fig. 4 sample sizes range from 16-23. Why the difference? More detail
will help the table stand alone, such as which leaf is being compared.
Supplementary Table 1 summarizes the data on the transgenes in different hybrid backgrounds.
From the cross with H99, few plants germinated (both in the combination with the transgenics as the
non-transgenics). Therefore, the minimal number of observations was four so the legend should have
stated n ≥ 4. For the other combinations more individuals were tested, so the text is now adjusted to
n = 4-19. There is no link between Supplementary Table 1 and Supplementary Figure 4: In the table
we list the leaf phenotype of the PLA1 transgenes in the different hybrid backgrounds, showing that
the phenotypes persist in different genetic backgrounds, while the figure illustrates the US field trial
with the GA2OX::PLA1 line in an inbred background. Since this is not clear to the reviewers, we
elaborated this paragraph to make the distinction between the different experiments.
In Supplementary Table 3 it would be useful to add a column indicating source of each comparison.
Supplementary Table 3 only shows the raw data of the stacked transgenes and does not represent
comparisons.
In Supplementary Table 4 the statistical tests are potentially confusing. The comparison appears to
be between the two treatments and not between transgenic and non-transgenic plants.
We changed the format of the table so it now allows for visualization of the differences between the
transgenic and non-transgenic plants.
In Supplementary Table 5 the use of W6 and W2 and K2 and K6 to designate the entries makes the
information a little difficult to follow.
The nomenclature was removed from Supplementary Table 5 and 6 and replaced by the full
description of the samples.
8 | P a g e
Reviewer #2 (Remarks to the Author):
In this study, Sun et al., characterize the effects of ZmKLUH/CYP78A1 expression on plant growth
and yield. The authors observed that overexpressing KLUH with a GA2ox promoter, known to be
expressed specifically in expanding cells, produced plants with an overall increase in size and yield,
overcoming infertility derived from ubiquitous overexpression of this gene. The effects of this
specific overexpression were stable in various genetic backgrounds and growing locations/seasons.
The authors show that KLUH is involved in the temporal regulation of maize leaf growth by
influencing the duration of the cell division period, also known as leaf elongation duration (LED).
The authors suggest that this expansion of the LED might be connected with auxin regulation and
independent of GA. Additionally, they suggest that KLUH overexpression might be used to
overcome the growth inhibition caused by abiotic stresses like cold or drought.
Although these observations are interesting and deserve attention, in my opinion, the study does
not provide enough novel insight on the mechanisms behind KLUH function to merit publication
in Nature Communications. The observation that KLUH regulates organ size in a way that positively
correlates with its expression level is not novel and has been described in multiple species, as
mentioned by the authors. It is also known that Cytochrome p450 proteins can affect cell size by
regulating the duration of the cell division period. The more general aspects of the data that show
a connection between auxin and duration of LED, and that LER and LED are independent are also
not novel, as referenced in the manuscript. Furthermore, the study fails to provide insight on the
connection between KLUH and auxin metabolism, and for the compensatory effects of KLUH
overexpression under stress conditions.
We are convinced that the manuscript offers many novel insights. It was not yet shown that altered
expression of a family member results in both stover and seed yield. Moreover, the choice of the
promoter is based on the prior art information from our research on the maize growth zone.
Previously, our research group indeed showed that LER and LED were two independent processes
driving maize leaf growth by analyzing more than ten leaf and seedling parameter in a panel of
recombinant inbred lines (RILs) (Baute et al., 2015). However, this study did not allow to identify a
molecular player for LED, while in the submitted manuscript, we demonstrate that KLUH/PLA1 is a
key regulator of the process. The additive phenotype of the stacked transgenes GA20OXIDASE and
KLUH/PLA1 now proves genetically that the lack of correlation between LER and LED, observed by
Baute et al., 2015, is indeed biologically relevant and points towards two independent processes. The
method how we can study LED, by following the size of the division zone over time, is for the first
time illustrated in this paper and should in future kinematic analyses be considered as an additional
aspect. The submitted manuscript also shows a biological role for LED since this represents a
compensatory mechanism to maintain growth for a longer period of time when conditions are
suboptimal as was exemplified by both cold nights and mild drought. Finally, we identified that the
KLUH/PLA1 mechanism functions through the elevated auxin levels. We now added additional data
showing that the increased auxin levels are confirmed by elevated DR5rev::mRFPer auxin response in
the transgenes (both at cell biological and transcriptome level).
In summary, the manuscript shows that knowledge driven design of the transgene results in
increased maize yield both in Europe and the USA. In addition, the manuscript provides evidence that
PLA1 is the first identified molecular player to affect LED in maize. The LED mechanism is not only

9 | P a g e
independent of the GA driven LER leaf growth mechanism, but involves another phytohormone,
auxin and plays a role in a compensatory growth mechanism under adverse conditions, that is
different from what was previously described in Arabidopsis.
Specific comments:
The description of the effects of KLUH overexpression on plant growth is extensive and the results
appear consistent through multiple experiments. Nevertheless, the way the data is presented
often appear redundant or was confusing. For example, Fig3, SuppFig3, SuppFig4 and SuppTable1
all have related data but is presented in various formats and is partially redundant. I had a really
hard time understanding the figures and getting a good overview of the differences between
experiments, and of the different transgenic lines.
We realize that in an attempt to show all data, we confused the reader. For simplicity, and because
the other reviewer also had issues with Supplementary Figure 3, we removed this figure from the
manuscript. Supplementary Table 1 shows the confirmation of the leaf phenotypes in the different
hybrids grown in the growth chamber, while Figure 3 and Supplementary Figure 4 represent a
number of phenotypes that were scored in both greenhouse and field trials. The data in Figure 3 all
describe the phenotypes of the transgenes introduced in a hybrid background, while Supplementary
Figure 4 shows the data for the transgene in the B104 inbred background. Because this was not
evident to understand, we adjusted the text to clarify these issues.
There are also several small inconsistencies in the data presented, that make it harder to interpret.
For example, regarding Fig1 and SuppFig1, in the text, it is said the increase in leaf size correlates
with the expression level of KLUH. Nevertheless, P1 is expressed at higher levels than P2, but
makes smaller leaves. In the same figures, error bars and statistical tests are missing (also absent in
other figures like SuppFig2b). Are the differences between P1 and P2 significant? Furthermore,
there is an inconsistency between the leaf analyzed in each experiment, which adds to the
confusion: expression of kluh was analyzed in leaf 8, leaf area determined in leaf 9 and cell length
measured in leaf 4, for which there is no leaf size data.
The fact that we only obtained two independent events for the constitutive overexpression lines
which were not able to result in progeny, impede proper statistical analysis. Indeed, RT-qPCR showed
that the levels of overexpression might seem to be higher in the line with the ‘smaller’ leaf, but since
we can not take several independent samples to obtain standard deviation, we can not be
completely certain that this represents the actual situation. This being said, the phenotype of P1 was
definitely much more pronounced than that of P2, because the plant’s life cycle was more affected.
Supplementary Figure 2 b and c (previously Supplementary Figure 1 b and c) shows that P1 produced
much less leaves than P2. Therefore, the comparison of leaf nine is maybe not correct as the leaves
might represent different developmental stages, but due to the fact that the two events were
infertile we unfortunately could not perform a comparison based on developmental stage rather
than time after sowing. Because the data for the constitutive overexpression lines only rely on two
events, we based our conclusion on the dose-dependent effect of the transgene on the three
independent events that we obtained for the moderate overexpression lines, on which proper

10 | P a g e
statistics could be performed. In addition, the differences between the constitutive and moderate
overexpression of PLA1 also provide evidence for the dose-dependent nature of the gene function.
However, showing the dose-dependency is not a primary aim of this paper, and therefore we
removed the dose-dependent statements in the manuscript.
The lack of statistical power for the constitutive overexpression events also explains the other
observations of the reviewer, namely that we can not conclude if the differences between P1 and P2
are significant. In addition, we realized that the chances to obtain progeny from these lines was
limited already when the plants were growing, so we decided to perform as many analyses as
possible on the two plants, resulting in the fact that the analyses were all performed on different leaf
numbers. We took samples for RT-qPCR from the eighth leaf and we decided to take the unscathed
leaf nine for the picture for publication. On the other hand, we performed a detailed analysis of leaf
4 for the moderate overexpression lines for which we got enough progeny.
I think it would be interesting to see how the stress conditions actually affect the phenotypes that
were measured extensively before, regarding plant size, biomass, yield... That way it would be
possible to address if KLUH overexpression can actually be useful to overcame negative effects of
stress on plant growth.
We fully agree that it would be scientifically interesting to follow all mature phenotypes under
drought stress and this will definitely be a scope of our future research. However, we used leaf 4 to
examine the mechanisms of LER and LED and to unravel if the PLA1 gene is involved in the LED
mechanism. So far, we do not have further insights in the exact reason why plants opt to grow for a
longer period of time under adverse conditions nor what is the correlation, if any, between leaf LED
and more mature phenotypes. This is an active field of research in our team and we hope to resolve
these issues in the near future.
The authors don’t provide enough information about the kluh mutant. Mutant plants should be
molecularly characterized and a reference or more information about their origin should be
provided. I also think it would be interesting to do a more detailed analysis of the mutant plants.
SuppFigure9 is another example of the lack of statistical analysis.
The mutant originates from the Uniform-MU collection and harbors the transposon at the transition
between the acceptor site of the intron and the second exon. We showed with Q-PCR that we were
still able to detect transcript of the 5’ and 3’ part of the gene (so before and after the transposon
insertion), albeit at a lower level as compared to the wild type plants. However, we are unable to
amplify over the transposon insertion site on mutant cDNA. We added this information to the
manuscript.
The role of auxin in KLUH function is not discussed conveniently. The data showing changes in
auxin-related genes and analysis of auxin levels is presented but no real conclusion is made
regarding KLUH function.
We added a paragraph in the discussion, speculating on how KLU/PLA1 can affect auxin levels.
Although GA2ox::KLUH-P3 is expressed much higher than the other transgenes, the impact on
plant size is not more pronounced. Neverthless, both LER and size of division zone seemed higher
on GA2ox::KLUH-P3 but the description in the text is very vague and the difference between the
11 | P a g e
transgenic lines is not properly discussed. This also makes it harder to understand the choice of P3
to perform the detailed analysis of the division zone over time.
Originally, when we obtained the transgenic events, P3 looked like the best candidate for subsequent
in detail analyses, because it had the highest expression level. The effect on LED and the size of the
division zone is clearly and significantly present in P3 (Figure 4). We rephrased this paragraph to
make the description of the phenotype less vague.
Overexpression if KLUH seems to have a negative impact on leaf number but that is not really
explained.
That is a correct observation, however, our data (from greenhouse and different field trials) were not
consistently pointing in that direction, which is why we opted not to focus on leaf number as a
phenotype that would be affected by the transgene.
In some experiments, the size of the samples analyzed was small. For example, in SuppTable1 n=4.
Supplementary Table 1 summarizes the data on the transgenes in different hybrid backgrounds.
From the cross with H99, few plants germinated (both in the combination with the transgenics as the
non-transgenics). Therefore, the minimal number of observations was 4 so the legend should have
stated n ≥ 4. For the other combinations more individuals were tested, so the text is now adjusted to
n = 4-19.
Line 147: there is a wrong reference to Fig4a,b. The steady state analysis referenced is in
Supptable2 (only for P1 and P2).
The differences in steady state LER is represented in different ways throughout the manuscript: the
LER calculated in Supplementary Table 2 of the kinematic analysis (P1 and P2) represents the average
LER during the steady state growth, as described Nelissen et al., 2013. At the same time, the steady
state growth is visualized when the LER is plotted over time as is visualized in Figure 4 (P3). We now
refer to both the table as the graph as these together contain the information on the three
independent events and thus show that the effect on LER and LED was present in the three
independent events.
Line 151: there is a reference to Supptable2 has having data for GA2ox::KLUH-P3, but that table
only has values for the other two lines. P3 is only analyzed in Fig4a,b. Where are the values of LED
for P3?
The LED phenotype is significantly different for the ‘weaker’ overexpression events P1 and P2, as can
be seen from Supplementary Table 2. We opted to visually represent the data for P3 as this is the
event with the highest expression and the most pronounced phenotype. However, the numeric data
of P3 for LED were also significant, which is indicated by the † sign in Figure 4. We just opted to not
complicate Supplemental Table 2 even more by adding redundant information.
Line 170: wrong reference to SuppFig8. It should be SuppFigure9.
We adjusted the text accordingly.
REVIEWERS' COMMENTS:
Reviewer #1 (Remarks to the Author):
The manuscript entitled “Altered expression of maize PLASTOCHRON1 (ZmPLA1) enhances
biomass and seed yield by extending the duration of cell division” describes the
characterization of the maize ZmPLA1 gene (formerly (KLUH) primarily through the analysis
of transgenic plants. The ZmPLA1 gene is over expressed using either a constitutive (Ubi1)
or developmentally regulated (GA2ox) promoter. They also examine a pla1 mutant. Plant
characteristics were evaluated in both controlled growth and field environments. A major
discovery reported here is that extending ZmPLA1 expression using the GA2ox promoter
significantly increases leaf growth and some yield components. The results show that this is
primarily due to a longer duration of cell division in the leaf. The paper provides a detailed
mechanistic analysis of the GA2ox::ZmPLA1 gene in maize. This is an outstanding study
demonstrating that GM technology can have a positive impact on important crop
productivity components. This report is distinct because (1) It focuses on how the transgene
effect manifests at the cellular level. Many papers like this tend to focus on the productivity
results which are often weak. (2) It connects a fundamental developmental process to
maize productivity. (3) It demonstrates that ZmPLA1 exerts significant control on leaf cell
division, however the biological mechanism was not fully worked out.
The present draft is much improved and resolves most of my concerns. The overall flow is
excellent. The Methods, particularly their statistic al analysis is much easier to follow
(although I am not a statistician). My only major concern is their interpretation of the
transcript profiling data. They use this evidence to connect ZmPLA1 with some aspects of
auxin and cytokinin metabolism. I am not completely satisfied with their Gene Ontology
analysis in Supplementary Table 5. In particular I do not see evidence for downregulation of
‘cytokinin biosynthetic process’ (line 228) in both genotypes. It only appears in 5a. Also I
don’t see evidence for upregulation of ‘secondary cell wall biogenesis’ (line 230) in either
genotype. The evidence suggests that other GO terms like ‘regulation of cellular biosynthetic
process’ for downregulation and ‘carboxylic acid transport’ for upregulation are affected in
both genotypes. However these aren’t mentioned in the text. This could be further clarified.
Minor comments:
Line 78-79: (first 0.5 cm) need only be mentioned once
Lines 83 and 90, indicate that B104 is wildtype when first mentioned
Line 120, Figure 3 represents one growing season, Supplementary Figure 4 represents 2
growing seasons
Line 123, replace B104 background with CML91 with B104xCML91 hybrid background
Line 153, remove ‘size’
Line 169, It would be nice if this paragraph started with an explanation for the comparison
to the pla1 mutant.
Lines 173-74, change ‘when assays with RT-qPCR’ to ‘by RT-qPCR assays’
Lines 200 & 203, remove ‘reduction’
Line 224, I could not find data mentioned
Line 325, It should be Fig, 4b
Line 249, Supplementary Figure 9 appears to be a subset of Figure 6. It’s not clear why this
is necessary.
Line 307, change statue to stature
Line 339, insert comma after mays
Line 349, change ‘in 5’ UTR’ to ‘upstream’
Line 350, add ‘and was ligated into’ after ‘GA2ox)’
Lines 377 & 388, I am still not convinced that the stated light intensities are correct. For
example full sunlight on a cloudless, clear day at high noon in the midwestern US is about
2000 µmol/m2/s PAR
Line 418, change ‘replicates’ to ‘replicate’
Supplementary Table 6, column 4 the name is missing a P
Supplementary Figure 10, what is the difference between the two images in (c)?
Reviewer #2 (Remarks to the Author):
Thank you for addressing my comments regarding the manuscript. I believe the revised
version is greatly improved in quality. I think the greatest improvements are in the
simplification of the presented data and expansion of the material and methods section.
I do agree with the authors that the work presented is interesting and provides novel
insights. Most importantly, it provides one more valid example of how biotechnology can be
used to improve crop performance. This work is definitely relevant and deserves an
audience.
I appreciate the limitations inherent to field trials and propagation of materials described by

the authors, but I still think the manuscript lacks the consistency in the data and novelty
required for publication in Nature communications.

REVIEWERS' COMMENTS:
Reviewer #1 (Remarks to the Author):
The manuscript entitled “Altered expression of maize PLASTOCHRON1 (ZmPLA1) enhances biomass
and seed yield by extending the duration of cell division” describes the characterization of the maize
ZmPLA1 gene (formerly (KLUH) primarily through the analysis of transgenic plants. The ZmPLA1 gene
is over expressed using either a constitutive (Ubi1) or developmentally regulated (GA2ox) promoter.
They also examine a pla1 mutant. Plant characteristics were evaluated in both controlled growth and
field environments. A major discovery reported here is that extending ZmPLA1 expression using the
GA2ox promoter significantly increases leaf growth and some yield components. The resu lts show
that this is primarily due to a longer duration of cell division in the leaf. The paper provides a detailed
mechanistic analysis of the GA2ox::ZmPLA1 gene in maize. This is an outstanding study
demonstrating that GM technology can have a positive impact on important crop productivity
components.
This report is distinct because (1) It focuses on how the transgene effect manifests at the cellular
level. Many papers like this tend to focus on the productivity results which are often weak. (2) It
connects a fundamental developmental process to maize productivity. (3) It demonstrates that
ZmPLA1 exerts significant control on leaf cell division, however the biological mechanism was not fully worked out.
The present draft is much improved and resolves most of my concerns. The overall flow is excellent.
The Methods, particularly their statistical analysis is much easier to follow (although I am not a
statistician). My only major concern is their interpretation of the transcript profiling data. They use
this evidence to connect ZmPLA1 with some aspects of auxin and cytokinin metabolism. I am not
completely satisfied with their Gene Ontology analysis in Supplementary Table 5. In particular I do
not see evidence for downregulation of ‘cytokinin biosynthetic process’ (line 228) in both genotypes.
It only appears in 5a. Also I don’t see evidence for upregulation of ‘secondary cell wall biogenesis’
(line 230) in either genotype. The evidence suggests that other GO terms like ‘regulation of cellular
biosynthetic process’ for downregulation and ‘carboxylic acid transport’ for upregulation are affected in both genotypes.
However these aren’t mentioned in the text. This could be further clarified.
Originally, the data were processed using version 2 of the B73 genome and were incorporated in the
PhD thesis of Xiaohuan Sun, first author of the manuscript. For the publication of the data, we re-
analyzed the data using version 3 of the B73 genome. This resulted in a slight difference in the
significance of the GO-categories and, as the referee correctly pointed out, we indeed overlooked that
the text and the table were not entirely aligned. The discrepancy between the text and the table is resolved in the new version of the manuscript.
Minor comments:
Line 78-79: (first 0.5 cm) need only be mentioned once
The text was adjusted accordingly.
Lines 83 and 90, indicate that B104 is wildtype when first mentioned
The changes were implemented.
Line 120, Figure 3 represents one growing season, Supplementary Figure 4 represents 2 growing
seasons
Supplementary Fig 4 was added to the statement of the different growing seasons.
Line 123, replace B104 background with CML91 with B104xCML91 hybrid background
The suggested changes were made.
Line 153, remove ‘size’
The word ‘size’ was removed.
Line 169, It would be nice if this paragraph started with an explanation for the comparison to the pla1 mutant.
The text was adjusted to explain the comparison to the pla1 mutant.
Lines 173-74, change ‘when assays with RT-qPCR’ to ‘by RT-qPCR assays’
The text was adjusted accordingly.
Lines 200 & 203, remove ‘reduction’
The word ‘reduction’ was removed twice.
Line 224, I could not find data mentioned
The data in paragraph starting with ‘The transcriptomic changes’ were only presented textually and not in any of the figures.

Line 325, It should be Fig, 4b
The reference to Fig.4b was made.
Line 249, Supplementary Figure 9 appears to be a subset of Figure 6. It’s not clear why this is necessary.
The two figures represent data for two completely independent experiments and serve as a
confirmation of the data. Originally we preformed the metabolite measurements on six half
centimeter samples along the growth zone and for the confirmation experiment we only used two cm
pieces. Therefore, it looks like the supplementary figure represents a subset of the actual figure, but in
reality the two pictures depict independent datasets. We added a sentence to clarify this in the
manuscript.
Line 307, change statue to stature
The typo was corrected.
Line 339, insert comma after mays
The comma was inserted.
Line 349, change ‘in 5’ UTR’ to ‘upstream’
We changed ‘in the 5’UTR’ to ‘upstream’.
Line 350, add ‘and was ligated into’ after ‘GA2ox)’
The text was added.
Lines 377 & 388, I am still not convinced that the stated light intensities are correct. For example full sunlight on a cloudless, clear day at high noon in the midwestern US is about 2000 µmol/m2/s PAR
We checked the light intensities and they are around 180-200 µmol/m2/s PAR instead of 170 mmol/ m2/s PAR. The values were adjusted in the manuscript.
Line 418, change ‘replicates’ to ‘replicate’
The text was adjusted accordingly.
Supplementary Table 6, column 4 the name is missing a P
The Table was adjusted accordingly.
Supplementary Figure 10, what is the difference between the two images in (c)?
The two images in what is now called supplementary figure 11C are exactly the same, just the
transmitted light channel is added in the second image to illustrate that the mRFP signal is present in
the phloem around the xylem because the xylem cells are only visible in the transmitted light channel.
This information is added to the legend.
Reviewer #2 (Remarks to the Author):
Thank you for addressing my comments regarding the manuscript. I believe the revised version is
greatly improved in quality. I think the greatest improvements are in the simplification of the
presented data and expansion of the material and methods section.
I do agree with the authors that the work presented is interesting and provides novel insights. Most
importantly, it provides one more valid example of how biotechnology can be used to improve crop performance. This work is definitely relevant and deserves an audience.
I appreciate the limitations inherent to field trials and propagation of materials described by the
authors, but I still think the manuscript lacks the consistency in the data and novelty required for publication in Nature communications.
We thank the reviewer for the constructive suggestions to improve the manuscript.