REVIEW PLAN ACT ANNUAL REPORT 2014 15
112
REVIEW PLAN ACT ANNUAL REPORT 2014 / 15
Transcript of REVIEW PLAN ACT ANNUAL REPORT 2014 15

REVIEW PLAN ACT
ANNUAL REPORT2014/15

LETTER TO THE MINISTER
22 October 2015
The Hon. Dominic Perrottet, MP Minister for Finance, Services and Property Parliament House Macquarie Street SYDNEY NSW 2000
Dear Minister
In accordance with the Annual Reports (Statutory Bodies) Act 1984, I have pleasure in submitting for your information and presentation to Parliament, the Annual Report of the Workers Compensation (Dust Diseases ) Board NSW (DDB) for the financial year ended 30 June 2015.
In 2014/15 the DDB continued to provide ongoing support to NSW workers with a dust disease. This year saw 345 new cases of occupational exposure to a dust disease.
During it’s 88th year, the DDB provided person-centred care and support for workers and their families living with the effects of dust diseases. We administered compensation benefits to 4,013 customers, improved accessibility to the Scheme, and shortened our payment processing times. We also improved services and access to services to ensure our customers receive the best support possible.
We are proud to say that for the second consecutive year, every new applicant was offered a medical examination within 30 days of their application.
The DDB provides the nation’s only mobile respiratory screening service through its Lung Bus that travels to towns across the State. This year the service screened more than 4,000 people in 38 locations, including two in Queensland.
The Board of the DDB was pleased to continue its work with stakeholders. As well as being a key sponsor of National Asbestos Awareness Week, the DDB was involved in raising community awareness of the risks associated with asbestos.
Four research grants were awarded to continue critical studies into the prevention, diagnosis and treatment of occupational dust disease.
The DDB also participated in the first Parliamentary Review of the exercise of the functions of the Workers’ Compensation (Dust Diseases) Board which determined the Scheme meets the needs of workers with a dust disease and their dependants. The Board was commended by the Parliamentary Review Committee for undertaking its work in an exemplary manner and we will ensure that we continue to deliver the best services and support possible to our customers into the future.
Yours Sincerely
Vivek Bhatia Chief Executive Dust Diseases Authority
WORKERS’ COMPENSATION (DUST DISEASES) BOARD 2014/15 ANNUAL REPORT 3
2014/15 CONTENTS
NSW Government publication Department of Finance, Services and Innovation October 2015 ISBN 978 1 74341 632 7
Workers’ Compensation (Dust Diseases) Board 2014/15 Annual Report has been prepared in accordance with the Annual Reports (Statutory Bodies) Act 1984 for the Hon. Dominic Francis Perrottet MP
Workers Compensation Dust Diseases Authority (DDA) Level 2, 82 Elizabeth Street, Sydney, NSW 2000
Postal address GPO Box 5323, Sydney, NSW 2001
Hours of operation: 9:00am – 5:00pm Monday to Friday (except public holidays)
Ph: (02) 8223 6600 or toll free on 1800 550 027
ddb.nsw.gov.au
A copy of this report is available at ddb.nsw.gov.au
Letter to the Minister 2
Our Focus 4
Our Purpose 6
CEO Review 10
Dust Diseases Board and Senior Management 12
Safety, Return to Work and Support Executive 16
Insure 20
Care 22
Protect 28
Our People 30
Internal Audit and Risk Management Statement 38
Digital Information Security Attestation Statement 39
Financial Statements for the year ended 30 June 2015 40
Budget and Estimates for 2015/16 82
Appendices 85
Index 109

4
OUR FOCUS
OUR FOCUS
345
210
110
672 total number of applications7 applications did not proceed
APPLICATIONS TO DDB IN 2014/15
people who had been exposed to dust as a worker
dependants of a deceased worker
medical screenings
75the average age of workers applying for compensation
57,000In the last 14 years more than
respiritory health monitoring examshave been conducted in the Lung Bus
67% of industrial history reports completed in 45 days
4,013 customers1,088workers
2,925dependants
COMPENSATION BENEFITS PAID TO:
100%*Customers attending our Sydney medical centre
of customers o�ered a medical examinationwithin 30 days of their application*
1,255people received a
medical examination
50The Lung Bus
can screen up to
workers per day
WORKERS’ COMPENSATION (DUST DISEASES) BOARD 2014/15 ANNUAL REPORT 5
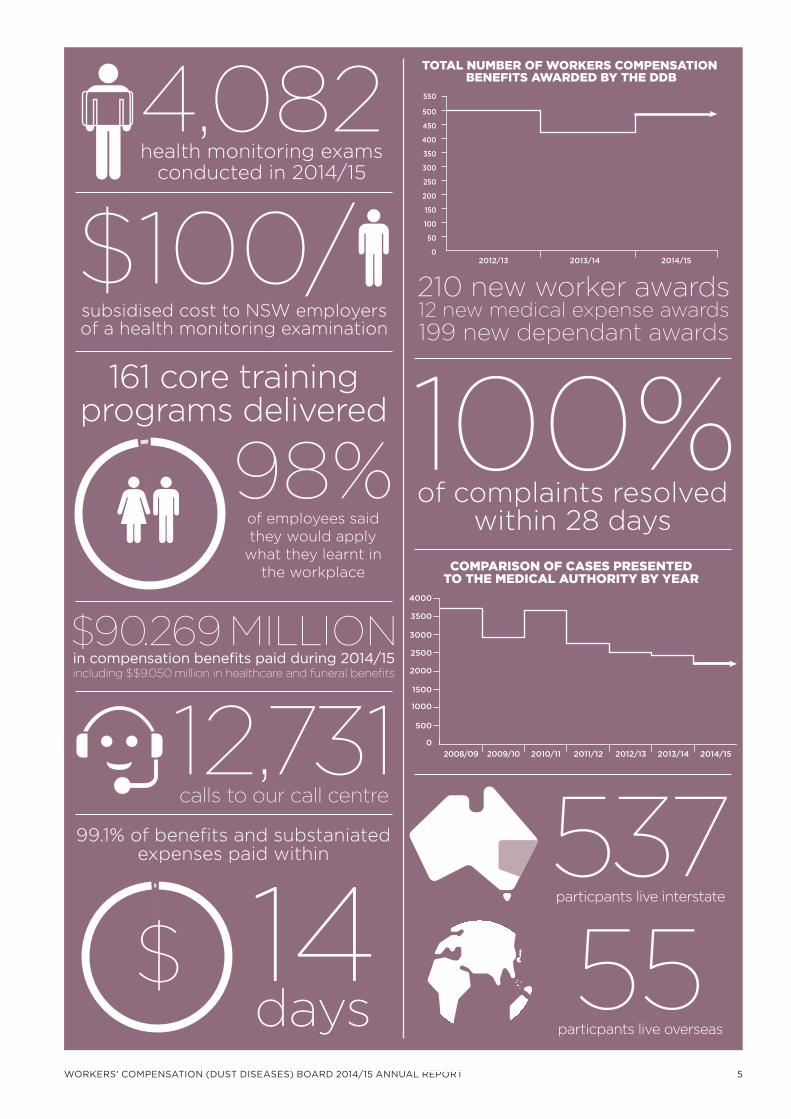
4,082health monitoring exams
conducted in 2014/15
$100/subsidised cost to NSW employers of a health monitoring examination
98%of employees said they would apply
what they learnt in the workplace
161 core training programs delivered
$90.269 MILLIONin compensation benefits paid during 2014/15including $$9.050 million in healthcare and funeral benefits
12,731calls to our call centre
14days
99.1% of benefits and substaniated expenses paid within
$
0
50
100
150
200
250
300
350
400
450
500
550
2012/13 2013/14 2014/15
TOTAL NUMBER OF WORKERS COMPENSATION BENEFITS AWARDED BY THE DDB
210 new worker awards12 new medical expense awards199 new dependant awards
100%of complaints resolved
within 28 days
2012/13 2014/152013/142011/122010/112009/102008/090
500
1000
1500
2000
2500
3000
3500
4000
COMPARISON OF CASES PRESENTEDTO THE MEDICAL AUTHORITY BY YEAR
particpants live interstate
537particpants live overseas
55

6 OUR PURPOSE
OUR PURPOSE
MISSION AND VALUES
The DDB aims to provide every person affected by an occupational dust disease with timely, accurate and effective services delivered with empathy and integrity.
Our values underpin our interactions with each other, our stakeholders and our customers, and as such are an important part of our planning process. As a NSW Government agency, trusted with public money and safety, we employ these values to inform, and perform, our day to day work.
Our key values are integrity, trust, service, accountability and respect.
ROLE
The DDB delivers a sustainable compensation scheme for NSW workers with a dust disease and their dependants.
WHO WE ARE – WHAT WE DO
The DDB provides a no fault workers compensation scheme to past and present workers who have developed a compensable dust disease from occupational exposure to dust as a worker in NSW, and to their families.
The DDB’s services include:
• Undertaking medical examinations of applicants for workers compensation benefits and for health monitoring. Examinations include lung function tests, chest x-rays and examination and interview by a respiratory physician. Examinations are conducted at our Sydney office, on our mobile respiratory screening unit (‘The Lung Bus’) and through a network of health practitioners in NSW and interstate.
• Facilitating the decision making process of the Medical Authority. The Medical Authority has the legislative responsibility for determining whether an applicant for compensation has a dust disease under the Act, the extent of any disability caused by the dust disease and the level of occupational exposure as a worker in NSW.
• Facilitating the decision making process of the members of the Board of the Workers Compensation (Dust Diseases) Board (the Board). The Board has the legislative responsibility for determining whether a person is a worker under the Act (involving a review of the applicant’s industrial history and preparation of detailed reports for the Board’s consideration), and to determine the amount of an award to be made in accordance with the Act.
• Paying compensation benefits to all beneficiaries under the Dust Diseases Scheme (the Scheme) and paying hospital, medical, ambulance and other related expenses incurred as a result of a beneficiary’s compensable disease.
• Administering the Dust Diseases Fund (the Fund). The Fund is raised through a levy on employers to meet the liabilities of the Scheme. The Board recommends levy rates, collects levy revenue and makes payments of compensation benefits and costs of administering the Scheme from the Fund.
• Managing the Dust Diseases Board Research and Community Grants Scheme. This research scheme was established to encourage research into dust diseases and to provide funding to community organisations that provide support to sufferers of dust diseases and their families.
• Providing advice and information to applicants about the benefits available under the Scheme and the method of application. The Board also provides ongoing advice and assistance to customers and their families on a range of matters including the benefit entitlements of dependants on the death of a worker.
• Collating and maintaining all statistical and related data to facilitate actuarial valuations of the liabilities of the Scheme and research into dust diseases.
The Board is subject to the direction and control of the Minister for Finance and Services and reports on its performance to the Minister. The Board is responsible to the Minister through the Chair of the Board.
WORKERS’ COMPENSATION (DUST DISEASES) BOARD 2014/15 ANNUAL REPORT 7
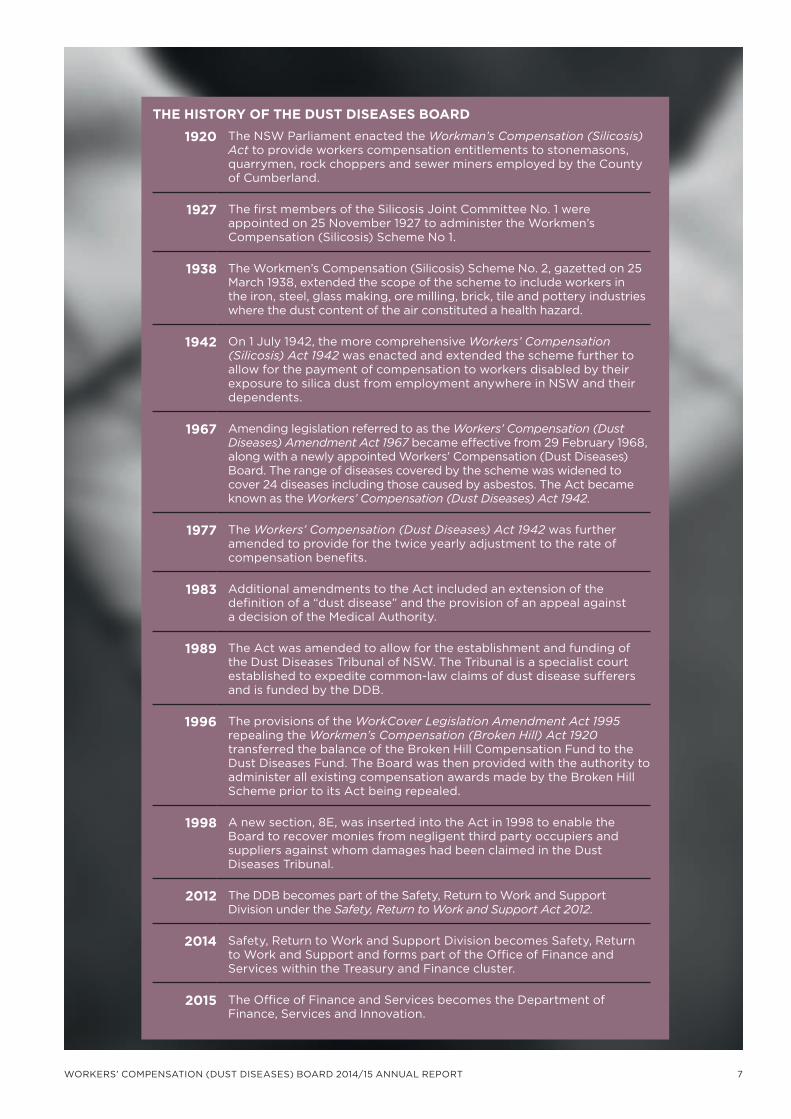
THE HISTORY OF THE DUST DISEASES BOARD
1920 The NSW Parliament enacted the Workman’s Compensation (Silicosis) Act to provide workers compensation entitlements to stonemasons, quarrymen, rock choppers and sewer miners employed by the County of Cumberland.
1927 The first members of the Silicosis Joint Committee No. 1 were appointed on 25 November 1927 to administer the Workmen’s Compensation (Silicosis) Scheme No 1.
1938 The Workmen’s Compensation (Silicosis) Scheme No. 2, gazetted on 25 March 1938, extended the scope of the scheme to include workers in the iron, steel, glass making, ore milling, brick, tile and pottery industries where the dust content of the air constituted a health hazard.
1942 On 1 July 1942, the more comprehensive Workers’ Compensation (Silicosis) Act 1942 was enacted and extended the scheme further to allow for the payment of compensation to workers disabled by their exposure to silica dust from employment anywhere in NSW and their dependents.
1967 Amending legislation referred to as the Workers’ Compensation (Dust Diseases) Amendment Act 1967 became effective from 29 February 1968, along with a newly appointed Workers’ Compensation (Dust Diseases) Board. The range of diseases covered by the scheme was widened to cover 24 diseases including those caused by asbestos. The Act became known as the Workers’ Compensation (Dust Diseases) Act 1942.
1977 The Workers’ Compensation (Dust Diseases) Act 1942 was further amended to provide for the twice yearly adjustment to the rate of compensation benefits.
1983 Additional amendments to the Act included an extension of the definition of a “dust disease” and the provision of an appeal against a decision of the Medical Authority.
1989 The Act was amended to allow for the establishment and funding of the Dust Diseases Tribunal of NSW. The Tribunal is a specialist court established to expedite common-law claims of dust disease sufferers and is funded by the DDB.
1996 The provisions of the WorkCover Legislation Amendment Act 1995 repealing the Workmen’s Compensation (Broken Hill) Act 1920 transferred the balance of the Broken Hill Compensation Fund to the Dust Diseases Fund. The Board was then provided with the authority to administer all existing compensation awards made by the Broken Hill Scheme prior to its Act being repealed.
1998 A new section, 8E, was inserted into the Act in 1998 to enable the Board to recover monies from negligent third party occupiers and suppliers against whom damages had been claimed in the Dust Diseases Tribunal.
2012 The DDB becomes part of the Safety, Return to Work and Support Division under the Safety, Return to Work and Support Act 2012.
2014 Safety, Return to Work and Support Division becomes Safety, Return to Work and Support and forms part of the Office of Finance and Services within the Treasury and Finance cluster.
2015 The Office of Finance and Services becomes the Department of Finance, Services and Innovation.

8 OUR PURPOSE
LEGISLATION
The Dust Diseases Board’s operations are regulated by:
• Workers Compensation (Dust Diseases) Act 1942
• Workers Compensation (Dust Diseases) Regulation 2013
• Workers Compensation Act 1987
• Workers Compensation Regulation 2010
• Workplace Injury Management and Workers Compensation Act 1998
• Safety, Return to Work and Support Board Act 2012.
DUST DISEASES COVERED BY THE WORKERS COMPENSATION (DUST DISEASES) ACT 1942
The following diseases are listed under Schedule 1 of the Workers Compensation (Dust Diseases) Act 1942:
• Aluminosis
• Asbestosis
• Asbestos induced carcinoma
• Asbestos related pleural disease
• Bagassossis
• Berylliosis
• Byssinosis
• Coal dust pneumoconiosis
• Farmer’s lung
• Hard metal pneumoconiosis
• Mesothelioma
• Silicosis
• Silico-tuberculosis
• Talcosis.
OUR CUSTOMERS/PARTICIPANTS
The DDB customers are injured workers and their families, including the dependant spouse and children of deceased workers, employers and the general community.
Our services include:
• payment of compensation benefits to eligible workers and their dependants
• coordination and payment of medical and related expenses for affected workers
• free medical examinations to workers exposed to dust in the workplace
• health monitoring screening for employers, including our mobile screening vehicle the ‘Lung Bus’
• information and education.
Both past and present NSW workers can apply to the DDB for workers compensation, even if they have passed retirement age.
The DDB provides workers with financial assistance in the form of fortnightly workers compensation benefits, and health care support in the form of provision and payment of medical treatment and expenses related to the treatment of their dust disease. The DDB pays compensation payments to an injured worker for the remainder of their life, including funeral expenses.
The dependants of a deceased worker who were dependent for support on the worker may also apply to the DDB to receive compensation benefits following the worker’s death.
The dependant spouses and partners of deceased workers receive an initial lump sum payment of compensation together with a fortnightly compensation benefit payment.
The DDB also provides respiratory health monitoring services to past and present workers whose employment exposed them to hazardous dusts.
OUR PURPOSE

WORKERS’ COMPENSATION (DUST DISEASES) BOARD 2014/15 ANNUAL REPORT 9
WORKERS’ COMPENSATION (DUST DISEASES) BOARD
General Manager WORKERS COMPENSATION (DUST DISEASES)
BOARDAnita Anderson
Chief Executive Officer SAFETY, RETURN TO WORK
AND SUPPORTVivek Bhatia
Client ServicesCompensation Services
Executive Services
Medical Services
10 CEO REVIEW
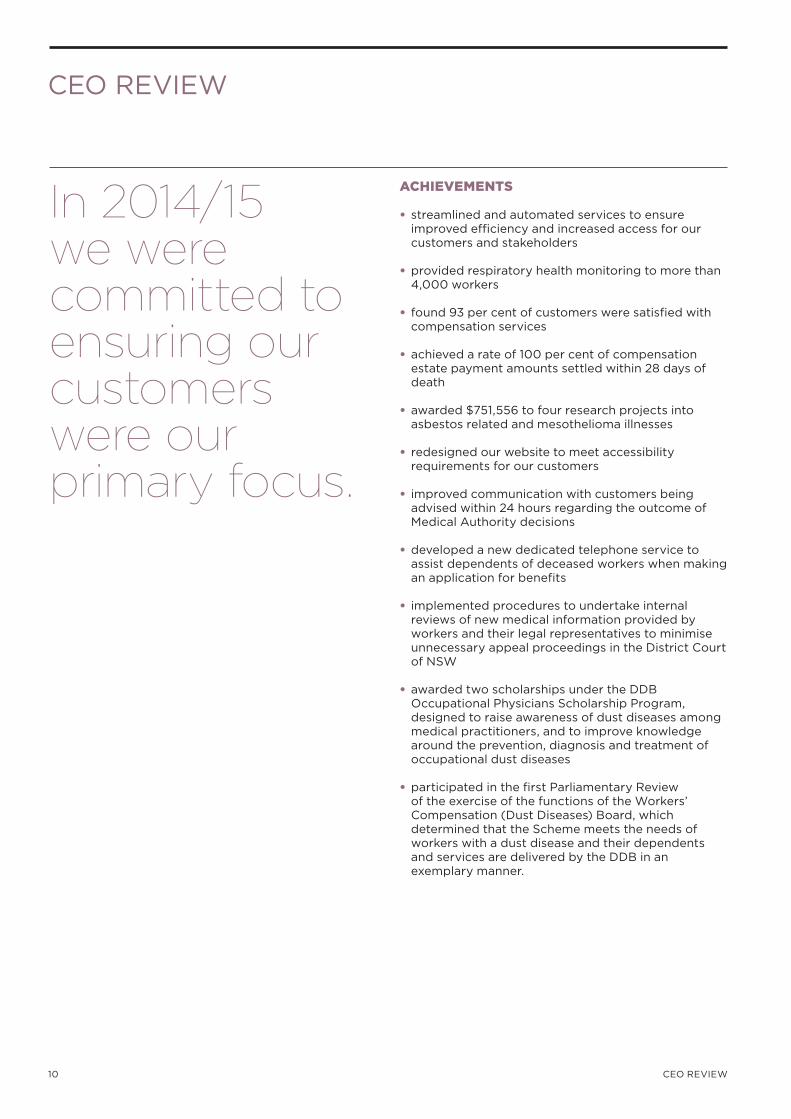
In 2014/15 we were committed to ensuring our customers were our primary focus.
ACHIEVEMENTS
• streamlined and automated services to ensure improved efficiency and increased access for our customers and stakeholders
• provided respiratory health monitoring to more than 4,000 workers
• found 93 per cent of customers were satisfied with compensation services
• achieved a rate of 100 per cent of compensation estate payment amounts settled within 28 days of death
• awarded $751,556 to four research projects into asbestos related and mesothelioma illnesses
• redesigned our website to meet accessibility requirements for our customers
• improved communication with customers being advised within 24 hours regarding the outcome of Medical Authority decisions
• developed a new dedicated telephone service to assist dependents of deceased workers when making an application for benefits
• implemented procedures to undertake internal reviews of new medical information provided by workers and their legal representatives to minimise unnecessary appeal proceedings in the District Court of NSW
• awarded two scholarships under the DDB Occupational Physicians Scholarship Program, designed to raise awareness of dust diseases among medical practitioners, and to improve knowledge around the prevention, diagnosis and treatment of occupational dust diseases
• participated in the first Parliamentary Review of the exercise of the functions of the Workers’ Compensation (Dust Diseases) Board, which determined that the Scheme meets the needs of workers with a dust disease and their dependents and services are delivered by the DDB in an exemplary manner.
CEO REVIEW

WORKERS’ COMPENSATION (DUST DISEASES) BOARD 2014/15 ANNUAL REPORT 11
THE YEAR AHEAD
On September 1 the Workers Compensation (Dust Diseases) Board became the NSW Dust Diseases Authority (DDA). The DDA now forms part of a new organisation, Insurance and Care NSW (icare).
icare will deliver the State’s insurance and care schemes. It will be a centre of excellence for providing person-centric insurance services, return to work solutions, and care for people who have been severely injured in the workplace or on the road.
icare’s distinct service lines will include builders warranty, dust diseases care, lifetime care, and workers insurance.
The compensation payments and services we currently provide to workers with a dust disease and their dependants will not stop and will not be reduced. Our customers will continue to receive the same high level of service, care and support we currently provide.
CHALLENGES
• continued implementation of the new case management system within extended timeframes
• ongoing review of internal processes to improve time standards for the finalisation of compensation applications
• realigning business support roles to underpin a new operational environment following implementation of new systems and structure
• improving our business reporting and analysis to better understand cost drivers and future demand for services.
OUR TEAM…OUR COMMUNITY
We would like to thank our employees, management team, customers and stakeholders for their continued support throughout the year.
We look forward to building on our achievements, achieving new successes and delivering positive outcomes for the NSW community.
Vivek Bhatia
Former Chief Executive Officer Safety, Return to Work and Support
Chief Executive Dust Diseases Authority

12 DUST DISEASES BOARD AND SENIOR MANAGEMENT
ABOUT THE DUST DISEASES BOARD
The Board is constituted under the Workers’ Compensation (Dust Diseases) Act 1942 (the Act). The Board has seven members; an independent chair; three representatives of employers and three representatives of employees. All Board members are appointed by the Minister for Finance, Services and Innovation for a period of up to three years.
Members have a wide range of experience including engineering, workers compensation, work health and safety, shop floor and employee relations.
The Board has the exclusive jurisdiction to determine all matters in respect of a claim for compensation under the Act, including questions of identity, dependency, fact of disablement and whether an award of compensation should be made.
The Board has the exclusive jurisdiction to:
• determine claims for compensation made under the Act (s5(2)).
• make determinations as to the classes of employment where there is a risk of contracting a dust disease (s6(3)).
• administer the Workers Compensation Dust Diseases Fund (the Fund) (s6(2)).
• estimate the amount to be expended from the Fund for each year (s6(4)).
• make payments from the Fund for compensation payments, fees payable to members of the Board and the Medical Authority and for remuneration of the Board’s staff (s6(2)).
• make grants from the Fund for research and to victims support groups (s6(2A)).
• pay the costs involved in the operation of the Dust Diseases Tribunal of NSW including the remuneration of its staff from the Fund.
MEMBERS OF THE BOARD OF THE DUST DISEASES BOARD
1. Vivek Bhatia, MBA, B.Engg, CFA — Chair, Dust Diseases Board (DDB) and CEO, Safety, Return to Work and Support (SRWS) (From 1 January 2015)
Mr Bhatia was appointed as CEO of SRWS and became a member of the Safety, Return to Work and Support Board in August 2014. He was appointed Chair of the DDB Board on 1 January 2015 and is Chair of the Heads of Asbestos Coordination Authority. Mr Bhatia joined SRWS following his role as CEO at Wesfarmers Insurance, where he led the multi-brand, multi-channel insurer through a significant transformation journey.
Mr Bhatia has also held several other prominent leadership roles in strategy, operations and technology over the past 15 years both domestically and abroad at McKinsey & Company, Wesfarmers Insurance and QBE. Prior to joining SRWS, Mr Bhatia co-led the business restructuring and transformation practice at McKinsey & Company across Asia Pacific, where he worked across resources, industrials, telecommunications, financial services, and oil and gas.
Mr Bhatia has an undergraduate degree in Engineering and has completed his MBA in strategy. He is a qualified Chartered Financial Analyst.
2. Sylvia Kidziak, AM FAICD FAIM FISA FSIA (Hon) OFIEAust MICOH MRMIA MNELA MNSA JP
Ms Kidziak is Managing Director of SL Engineering, a Councillor on the NSW Business Chamber, Sydney North Regional Council, and held the position of Principal Consultant, Occupational Health, Safety and Environment Policy at Australian Business Ltd for 26 years. Ms Kidziak has chaired the ARPANSA Radiation Health and Safety Advisory Council for 12 years. She was formerly a Commissioner on the Australian Safety and Compensation Council and the National Occupational Health and Safety Commission, Chair of the Occupational Health, Safety and Rehabilitation Council of NSW, Board
DUST DISEASES BOARD AND SENIOR MANAGEMENT
321

WORKERS’ COMPENSATION (DUST DISEASES) BOARD 2014/15 ANNUAL REPORT 13
Member of the NSW Cancer Council, Director on the NICNAS Industry Government Consultative Committee and Chair or member of various other Councils and Committees at the state and federal level concerned with occupational health and safety, workers compensation, radiation protection and nuclear safety. In addition Ms Kidziak is Deputy Chair of the Board of the Asbestos Diseases Research Foundation and Chair of the Executive Committee. Ms Kidziak chairs the Board’s Research Grants and Corporate Governance Committees. She was also a member of the recent Australian Government Asbestos Management Review Expert Advisory Panel. Ms Kidziak has received a number of awards for her work.
3. Brian Eichhorn
Mr Eichhorn is the representative of Australian Federation of Employers and Industries. He has worked in manufacturing industries all his working life. For the past 35 years Mr Eichhorn has held senior positions in Human Resources Management. He has qualifications in Human Resources and Occupational Health and Safety and is a trustee of his company’s superannuation fund and a member of the Board’s Research Grants.
4. Ray Petty, FCPA FCIS AICD AAIM CPIM JP
Mr Petty was first appointed Board Member of the Dust Diseases Board in 1999, representing the Australian Industry Group. He is also an Independent Member of the Safety Return to Work and Support Division and Independent Chair of Health Care Complaints Commission Audit and Risk Committees. Presently he is Director FIFO Capital. He has a career in Finance, Administration and Business Management spanning some 40 years. Ray holds professional affiliations in finance and administration, for Accounting, Company Secretarial, Company Directors and Management, and is a practising Justice of the Peace. In 2010 Mr Petty was registered to the NSW Prequalification Scheme: Audit and Risk Committee Independent Chairs and Members.
Mr Petty holds professional affiliations in finance and administration, for accounting, company secretarial, company directors and management and is a practising Justice of the Peace. In 2010, he was registered to the NSW Prequalification Scheme: Audit and Risk Committee Independent Chairs and Members.
5. Rita Mallia, LLB/BEc (Hons).
Ms Mallia is the President of the Construction Forestry Mining and Energy Union (NSW Branch) Construction and General Division, having been the Senior Legal Officer for the Construction, Forestry, Mining and Energy Union NSW, Construction and General Division, since February 2000. From 1996 to February 2000 Rita was the Union’s Workers Compensation Officer. Ms Malia is a qualified solicitor, she represents the CFMEU on the Vocational Training Appeal Panel and the Dust Diseases Board on the Asbestos Diseases Research Foundation. She is also a director on the Board of the Schizophrenia Research Institute and director of United Super Pty Ltd (CBUS), Uplus Pty Ltd and the Australian Construction Industry Redundancy Trust (ACIRT). In addition, Ms Malia is a member of the Board’s Research Grants Committee.
6. Dave Henry
Mr Henry is the Work Health and Safety Officer for the NSW Branch of the Australian Manufacturing Workers’ Union (AMWU). He has occupied this position since early 2003. In this position Mr Henry represents workers in relation to both work, health and safety and workers compensation matters. He is responsible for developing and implementing AMWU policy and representing the union at all levels of industry and government within his role. He is the current Chairman of the Industrial Health and Research Foundation (t/a Workers Health Centre). Mr Henry is also a member of the Board’s Corporate Governance and Research Grants Committees.
7. Paul Noack
Mr Noack is a Branch Organiser for the Australian Workers Union, Greater NSW Branch. Mr Noack has been active in the trade union movement for 40 years and is currently AWU delegate to Unions NSW and ACTU Congress and a State and National Executive Officer of the Union. Mr Noack’s areas of responsibility include the States National Parks, State Forests, Roads and Maritime Service and the Chemical Industry.
Mr Noack is a member of the NSW Mining and Extractives Industry Health Management Advisory Committee.
754 6

14 DUST DISEASES BOARD AND SENIOR MANAGEMENT
DUST DISEASES BOARD AND SENIOR MANAGEMENT
Mr Noack has held previous appointments on company health and safety committees in the automotive industry, and has been actively involved in health and safety and workers compensation issues for over the past 40 years.
8. Julie Newman PSM, FCPA BHSMgt, MAICD — Chair (until December 2014)
Ms Newman was appointed as the Chair of the DDB Board and Chief Executive Officer of SRWS in 2012, having acted in the role since late 2011. Prior to this appointment Julie was the Chief Financial Officer for SRWS.
In 2013, Ms Newman was awarded the Public Service Medal in the Australia Day Honors. Ms Newman has a Bachelor in Health Science Management from Charles Sturt University and is a qualified CPA.
On 1 August 2014, Ms Newman retired as CEO of SRWS, but continues as Chair of DDB. Ms Newman has more than 40 years’ service in the public service, including 26 years in senior management and leadership roles, in NSW Health.
8
DUST DISEASES BOARD SENIOR MANAGEMENT
General Manager
Ms Anita Anderson, Dip of Government (Policy Development)
Director, Medical Services
Dr Giles Yates, PhD
Director, Client Services
Ms Michele Daley, BA/BsocSc, MTD
WORKERS’ COMPENSATION (DUST DISEASES) BOARD 2014/15 ANNUAL REPORT 15

16 SAFETY, RETURN TO WORK AND SUPPORT EXECUTIVE
SAFETY, RETURN TO WORK AND SUPPORT EXECUTIVE
The SRWS Executive team has 15 members, six general managers leading regulatory, care and insurance lines, eight functional leads providing shared services across SRWS, and a CEO. The team is responsible for operational management of the organisation and the
implementation of policies and strategic priorities determined by the SRWS Board. The Executive also makes recommendations on matters of strategic direction and policy to the CEO.
Vivek Bhatia CEO Safety Return to Work and Support
Don Ferguson MA, BA General Manager Lifetime Care and Support
Anita Anderson, PSM Dip-Gov-Policy General Manager Dust Diseases
John Nagle Executive Director WorkCover Insurance
Caroline Walsh BA (Government), LLB(Hons) Executive Director Workers Compensation Regulation
Peter Dunphy, PSM BS, MA (Hons) Executive Director Work Health and Safety Division
Andrew Nicholls BA (Hons), MMgt, EMPA, JP General Manager Motor Accidents Authority
Megan Hancock CA, Grad Dip, AFI, GAICD Chief Financial Officer
Steve McKenna MA, CIMA General Manager Investment
Stuart Bremner MBA, CPA, ACIS Chief Information Officer
Michael Saad BEc Director Corporate Governance
Catherine Morgan BA (Hons), LLB (Hons), LLM Director Legal Services

WORKERS’ COMPENSATION (DUST DISEASES) BOARD 2014/15 ANNUAL REPORT 17
Greg Barnier MBusCoach (Dist), AdvDipGovt, (Mgmt), DipFinServ (FinPlan), Chief Human Resources Officer
Carmel Donnelly BA (Hons), MBA (Exec), MPH, GAICD General Manager Strategy and Performance
Samantha Lawrence BA (Hons), MBA Director and Company Secretary Office of the CEO
LIFETIME CARE AND SUPPORT
General Manager Don Ferguson
WORKCOVER WORKERS
COMPENSATION REGULATION
Executive DirectorCaroline Walsh
DUST DISEASES BOARD
General ManagerAnita Anderson
WORKCOVER WORK HEALTH AND SAFETY
Executive DirectorPeter Dunphy
WORKCOVER INSURANCE
Executive DirectorJohn Nagle
MOTOR ACCIDENTS AUTHORITY
General ManagerAndrew Nicholls
SHARED SERVICES
CARE & INSURANCE REGULATION
FINANCE AND SERVICES
Chief Financial O�cerMegan Hancock
CORPORATE GOVERNANCE
DirectorMichael Saad
INVESTMENT
General ManagerSteve McKenna
INFORMATION SERVICES
Stuart Bremner
PEOPLE AND CULTURE
Greg Barnier
LEGAL SERVICES
DirectorCatherine Morgan
STRATEGY AND PERFORMANCE
General ManagerCarmel Donnelly
OFFICE OF CEO
Director and Company SecretarySamantha Lawrence
SAFETY, RETURN TO WORK AND SUPPORTChief Executive O�cer – Vivek Bhatia
Chief Human Resources O�cer
Chief Information O�cer

18 WORKERS’ COMPENSATION (DUST DISEASES) BOARD 2014/15 ANNUAL REPORT
OUR VISION Every person affected by an occupational dust disease receives timely, accurate and effective services delivered with empathy and integrity.
OUR MISSION We protect, insure, care
Protect from harm
Insure for when things go wrong
Care for people when they are injured
OUR VALUES Accountability
Service
Trust
Integrity
Respect
WORKERS’ COMPENSATION (DUST DISEASES) BOARD

WORKERS’ COMPENSATION (DUST DISEASES) BOARD 2014/15 ANNUAL REPORT 19
OUR STRATEGY
Our customers are at the centre of everything we do.We invest in the strengths of our people.
We build great partnerships.We create new ways of doing things.
OUR OBJECTIVES
COMMERCIAL MIND SOCIAL HEART
mutual respect
focusing onservice
takingaccountability
acting withintegrity
developingtrust
A sustainable compensation scheme for NSW workers with a dust disease and their dependantsE�cient and accessible compensation services | Sound fund management and scheme viability
Exemplar organisations | Cost and e�ciency | Customer-focused approach

20 INSURE
The DDB undertook a number of key activities throughout the year to strengthen the sustainability of the Scheme, including:
• working with DDB actuaries to continue refining the Scheme’s actuarial assessments
• strengthening risk management with the implementation of an enterprise risk management
and risk appetite policy, and establishing both strategic and high level operation risk registers for the DDB
• achieving an overall investment performance of 15 per cent for fund monies under investment.
KEY PERFORMANCE INDICATORS
Key result area Key performance indicators Target2014/15 Results
Sound fund management and Scheme viability
• Effective governance, audit and risk management
• Accurate actuarial assessments
• Proactive assessment of key cost drivers and trends
Accurate levy setting 98% 100%
Levies collected by due date 90% 89%
Funding ratio - Actuarial target ratio based on net assets adjusted for future claims and contributions receivable over total known claim liabilities
(90 – 110%) 135%
Cost and Efficiency
• Evidence used to direct and prioritise our services
• Operate within budget
• Benchmark the cost of service delivery
• Measure our outcomes
• Manage our risks
Actual operating expenditure (excluding finance and compensation costs) varies less than 5% from budget
100% 94%
INVESTMENT PERFORMANCE
The SRWS investment portfolios are managed to achieve return and risk outcomes that are appropriate to the schemes they support. Performance for all SRWS investment portfolios was strong over the 2014/15 financial years with the majority of funds comfortably exceeding their asset-weighted market benchmark and liability-related measures. A range of structural changes have been implemented to target lower volatility of investment returns and stability of scheme funding ratios.
GOVERNANCE ARRANGEMENTS
The Board is responsible for administering the Fund and for authorising all payments from the fund.
The Board’s responsibilities include:
• setting the strategic direction of the agency in conjunction with management
• ensuring the DDB’s operations accord with its stated vision and purpose
• monitoring risk, financial and operational performance.
The work of the Board is supported by the following committees:
• Corporate Governance Committee
• Research and Community Grants Committee
• SRWS Audit and Risk Committee.
The SRWS Board is responsible for setting investment
INSURE

WORKERS’ COMPENSATION (DUST DISEASES) BOARD 2014/15 ANNUAL REPORT 21
objectives, risk management, strategic asset allocation and for reporting to the Minister on performance of the Fund. In June 2015 the amalgamation of the funds management activities of SRWS, SAS Trustee Corporation and New South Wales Treasury Corporation (TCorp) within TCorp was completed. This initiative allows SRWS to pool investment management expertise and streamline the delivery of long-term financial and non-financial benefits to government agencies. An assessment process to improve overall cost efficiency and risk management is ongoing.
STRATEGIC ASSET ALLOCATIONS AND INVESTMENT RETURNS
The following table lists the strategic asset allocations and investment returns for the statutory funds that the Board oversees.
Dust Diseases Board Fund Strategic Asset Allocation 30 June 2015
Australian equities 18.0%
International equities 20.0%
International equities – emerging markets 4.0%
Australian unlisted property 10.0%
Listed property 5.0%
Australian fixed interest 15.0%
Australian inflation-linked bonds 27.0%
Cash 1.0%
Total fund 100.0%
Diversified growth assets 57.0%
Defensive assets 43.0%
Total fund 100.0%
Dust Diseases Board Fund 2014/15 Returns
Performance 1 Year (%) 3 Year
(% p.a.) 5 Year
(% p.a.)
Since Inception*
(% p.a.)
Fund 10.83 14.36 10.41 5.06
Benchmark** 9.70 12.58 10.10 5.16
Excess 1.13 1.78 0.31 -0.10
* Performance data for the fund commence on 30 June 2007.** Benchmark is a composite benchmark based on the fund’s
strategic asset allocation.
POLICIES, GUIDELINES AND PROCEDURES
The DDB reviews its policies on a bi-annual basis to ensure that all corporate policies remain relevant to the work of the DDB and comply with current government policy and directions.
A list of our corporate policies and guidelines can be found on our website or by contacting the Right to Information Officer at [email protected] or by phone (02) 8223 6600.

22 CARE
CARE
During the year, we simplified our application process to support workers with dust diseases and their dependants and improved the timeliness of our communications by:
• developing a new telephone service to assist dependants of deceased workers when making an application for compensation benefits
• issuing customer notification letters advising the outcome of Medical Authority decisions within 24 hours of the decision
• advising customers of an award of compensation within 48 hours of the decision
• paying medical invoices and other personal services for clients with a dust disease within 14 days; on average, 240 payments were processed each week.
KEY PERFORMANCE INDICATORS
Key result area Key performance indicators Target2014/15
results
Efficient compensation services
• Quality and timely services
• Simple application processes
• Sound decision making
• Clear, communication about our services, processes and decisions
Medical examinations undertaken at DDB within 30 days 75% by 2013
80% by 2015
100%
Compensation applications determined within 60 days 70% by 2013
85% by 2015
49.9%
Benefits and substantiated expenses paid to beneficiaries within 14 days
95% 99.1%
Accurate payment of entitlements paid to beneficiaries within 14 days
100% 100%
COMPENSATION SERVICES
The DDB compensation services team administers the workers compensation benefits awarded to workers and their dependants.
COMPENSATION AWARDS GRANTED
2012/13 2013/14 2014/15
New worker awards 295 220 276
New medical expenses awards
22 26 12
New dependant awards
183 176 199
Total awards granted 500 422 487
A total of 672 applications were received in 2014/15 - 345 applications were made by people who had been exposed as a worker, while 210 applications were made by the dependants of a deceased worker. A further 110 applications were for medical screening, while the remainder of applications did not proceed.
The Board approved 276 new awards of compensation to workers who had been certified by the Medical Authority as having a disability as a result of their dust disease. The award consists of a fortnightly compensation benefit, payment of all medical and related treatment expenses, and payment of funeral expenses. Allowances are paid for a dependent spouse and any dependent children aged up to 16 years, or until 21 years if enrolled as a full time student.
The Board also made 12 new awards for the payment of medical expenses for workers who were in paid employment and ineligible to receive weekly compensation benefits.
An additional 199 awards were made to dependants of deceased workers. Awards to dependants of a deceased worker generally consist of a lump sum payment together with fortnightly compensation benefits.
At 30 June 2015, we provided compensation benefits to 4,013 customers; 1,088 workers and 2,925 dependants. We paid $81.219 million in compensation benefits during 2014/15 and $9.050 million in health care and funeral benefits.

WORKERS’ COMPENSATION (DUST DISEASES) BOARD 2014/15 ANNUAL REPORT 23

24 CARE
CARE
INDUSTRIAL HISTORY SERVICES
DDB industrial history officers conduct interviews to compile an applicant’s employment and dust exposure history to support a claim for benefits. Most interviews are conducted by telephone. Interviews with very ill clients are conducted at the applicant’s home, or in hospital. We are able to respond quickly where an applicant is suffering serious health issues and a report needs to be prepared urgently.
Industrial history reports detail an applicant’s employment history, including details of the location, nature and conditions of each employment, any areas or processes where dust was encountered and the frequency and duration of those exposures.
The Medical Authority uses the industrial history report to assess the extent of an applicant’s exposure to dust in the workplace. The employment details within each industrial history enable the Board to determine if the applicant was exposed to dust as a worker within the meaning of the Workers’ Compensation (Dust Diseases) Act 1942 and has any entitlement to an award of compensation.
During the year, the industrial history team undertook a review of current procedures to identify opportunities to improve the timeliness of its reporting process. The number of completed history reports increased by 12 per cent, to a total of 415 in 2014/15. At 30 June 2015, 67 per cent of industrial history reports were completed in under 45 days. The remaining 26.7 per cent of reports were completed in 56 to 90 days, while 6.3 per cent of reports took more than 90 days to complete.
MEDICAL AUTHORITY SUPPORT TEAM
The Medical Authority support team collects and collates all the necessary medical information required by the Medical Authority to assess an application for compensation. The team records the decisions of the Medical Authority and advises applicants of decisions made by the Medical Authority.
The Medical Authority considered 2,197 cases in the year (10.1 per cent less than the previous year’s 2,420), including:
• 342 new cases of a dust disease
• 754 cases where there was no dust disease or where a dust disease was not reasonably attributable to occupational exposure as a worker under the Act
• 565 reviews of customers who have previously been certified with a dust disease
• 167 deaths certified as resulting from a dust disease in cases where the deceased worker had dependants
• 56 deaths were certified as not being a result of the worker’s dust disease
• 313 cases were deferred by the Medical Authority pending further medical information and reports.
COMPARISON OF CASES PRESENTED TO THE MEDICAL AUTHORITY BY YEAR
2012/13 2014/152013/142011/122010/112009/102008/09
2913
3658
27482516 2421
2197
3705
0
500
1000
1500
2000
2500
3000
3500
4000
HEALTH CARE SERVICES
The DDB pays medical and other treatment expenses related to and reasonably necessary for the treatment of a worker’s dust disease. This includes expenses such as home oxygen, hospital fees, doctor/specialist fees, home nursing, ambulance fees, pharmaceuticals, aids and equipment, domestic assistance, nursing home and respite care and minor home modifications.
In 2014/15, the health care services team provided services to 1,013 workers, a one per cent decrease on the 1,025 workers assisted in the previous year. The health care services team processed 12,622 invoices for medical and related treatments throughout the year. The team continually reviews processes to improve the quality and timeliness of service provision and reimbursements of medical expenses to workers.

WORKERS’ COMPENSATION (DUST DISEASES) BOARD 2014/15 ANNUAL REPORT 25
CALL CENTRE
For DDB customers, the call centre is their first point of contact. Staff are trained to answer all questions an applicant may have in regard to the application process and the DDB’s functions. In 2014/15 the call centre received 12,731 inbound phone calls, a 36.2 per cent decrease on the 19,946 calls received in the previous year. The reduction in the number of incoming calls is attributed to workers and dependants now being able to contact Client Service Officers directly rather than through the main DDB telephone number.
COMPARISON OF INCOMING CALLS BY YEAR
2012/13 2014/152013/142011/122010/110
5000
10000
15000
20000 Total calls recieved
Abandoned calls
25000
30000
Our customers include workers with a dust disease and their families, including the dependent spouse and children of deceased workers, employers, and the general community.
During 2014/15 we:
• resolved 100 per cent of complaints received within 30 days
• redesigned our website
• developed a new research grant application form and guidelines to streamline the application process and reduce red tape
• sponsored two occupational physicians to undertake an education program including a visit the DDB to develop their understanding of the DDB, diagnosis, medical screening and management of dust diseases
• provided respiratory health monitoring to more than 4,000 workers.
Key performance indicators Target2014/15
results
Fair and transparent decisions
<1% decisions varied by internal review or appeal
<1%
Customer satisfaction with compensation services
>85% 93%*
Compliance with service standards
>90% 90%
Complaints resolved within 28 days
100% 100%
Compensation estate payment amounts settled within 28 days of death
100% 100%
* 2013/14 result. The DDB conducts a customer satisfaction survey on a bi-annual basis.
CUSTOMER SERVICE
In 2014/15, we received 345 applications for compensation from past and present workers. The average age of workers applying to the DDB for compensation was 75 years. Forty three per cent of new awards made during the year were for workers with a dependant spouse or partner, and 1.6 per cent of new worker beneficiaries also had dependent children.
The DDB is currently assisting 1,088 workers with financial assistance in the form of fortnightly workers compensation benefits, and health care support in the form of provision and payment of medical treatment and expenses related to the treatment of their dust disease.
The dependent spouses and partners of deceased workers receive an initial lump sum payment of compensation together with a fortnightly compensation benefit payment.
In 2014/15, the DDB received 210 applications for compensation from the dependants of deceased workers. Currently, 2,925 dependants are receiving fortnightly compensation benefits from the DDB.

26 CARE
BENEFICIARIES CATEGORISED BY STATE, TERRITORY AND NSW REGION OF RESIDENCE 2014/15
0
100
200
300
400
500
600
Sout
hern
Sub
urb
s
Hill
s D
istr
ict
Inne
r W
est
No
rthe
rnSu
bur
bs
Inne
r C
ity/
Eas
tern
Sub
urb
s
Nep
ean
Wes
tern
Sub
urbs
NSW
Co
untr
y W
est
No
rth
Co
ast
NSW
Illaw
arra
Hun
ter
Cen
tral
Co
ast
Tasm
ania
No
rthe
rnTe
rrit
ory
Aus
tral
ian
Cap
ital
Ter
rito
ry
Wes
tern
Aus
tral
ia
Sout
h A
ustr
alia
Que
ensl
and
Vic
tori
a
BENEFICIARIES CATEGORISED BY COUNTRY OF RESIDENCE 2014/15 (EXCLUDING AUSTRALIA)
Uni
ted
Kin
gd
om
Turk
ey
Net
herla
nds
Thai
land
Spai
n
Po
rtug
al
No
rthe
rnIr
elan
d
New
Zea
land
Mal
ta
Ital
y
Isre
al
Gre
ece
Ger
man
y
Cro
atia
Arg
enti
na
0
2
8
6
4
10
12
14
MEDICAL SCREENING SERVICE
If a past or present worker thinks they may have a dust disease, the DDB can help them find out by arranging a free medical examination, which includes a chest x-ray, a lung function test and a medical examination by a doctor.
In 2014/15, we provided medical examinations to 1,255 people. Examinations are provided at our Sydney
medical centre for customers residing in the greater Sydney metropolitan region, and through a network of local doctors for our regional and rural customers. During 2014/15, we were able to offer 100 per cent of customers attending our Sydney medical centre a medical examination within 30 days of application.
CARE

WORKERS’ COMPENSATION (DUST DISEASES) BOARD 2014/15 ANNUAL REPORT 27
MEDICAL SCREENING SERVICE EXAMINATIONS (BY FINANCIAL YEAR)
2012/13 2014/152013/142008/09 2011/122010/112009/10
Home Visit
External Mobile Unit
Elizabeth St
25272365
1744
1510 1529
1255
1925
2008/09 2009/10 2010/11
2012/13 2013/142011/12
2014/15
0
500
1000
1500
2000
2500
3000Total number of examinations
Location of examinations
RESPIRATORY HEALTH MONITORING FOR WORKERS
For 14 years the DDB has operated a mobile respiratory health monitoring service to assist NSW employers to meet their statutory obligations and screen workers who are at risk of occupational dust disease. In that time, the DDB has conducted more than 57,074 respiratory health monitoring examinations.
Our mobile unit, the ‘Lung Bus’, is equipped with a chest x-ray room, a lung function laboratory, a doctor’s consulting room and a customer waiting room. A respiratory screening examination takes about 10 minutes and the mobile unit can screen up to 50 workers per day.
HEALTH MONITORING MEDICAL EXAMINATIONS (BY FINANCIAL YEAR)
The DDB provides a health monitoring report to each worker who has been screened. In accordance with the requirements of the Work, Health and Safety Regulation 2011, we also provide a health monitoring report to the employer. The Regulation requires that a health monitoring report contains specific information, including the name and date of birth of the worker, whether or not the worker has been exposed to a hazardous chemical or contracted a disease, injury or illness as a result of their employment, a recommendation to the employer regarding remedial measures, and whether the worker should continue in their normal employment.
In 2014/15, we conducted 4,082 health monitoring examinations. This represents a 15.5 per cent decrease on the number of examinations undertaken in the previous financial year.
The subsidised cost to NSW employers has remained at $100 per worker (plus GST) for several years.

28 PROTECT
PROTECT
RESEARCH AND EDUCATION
The DDB facilitates research to help us identify dust disease, assist sufferers and prevent cases of occupational lung disease in the future. The DDB research and education unit has four primary functions:
1. administering the DDB Research and Community Grants Scheme.
2. maintaining the research database.
3. responding to requests for scientific information.
4. performing asbestos fibre counts on samples of lung tissue.
New cases of dust diseases were added to the research database in the past 12 months.
The unit responded to 26 cases for scientific information, 11 fewer than the previous year. Requests for information ranged in complexity from providing literature or simple statistics, to detailed analysis examples including assisting the WorkCover Authority of NSW with information and data for the loose-fill asbestos investigation. Other requests for information were received from research institutes, industry groups, actuaries, the DDB executive and Medical Authority. The Research Unit assisted with 26 requests for information received under the Government Information (Public Access) Act 2002.
RESEARCH AND COMMUNITY GRANTS SCHEME
The DDB is committed to improving services and access for workers who have contracted dust diseases. Our Research and Community Grants Scheme has been developed to deliver a range of positive outcomes for affected workers. We award funding for research programs in five key areas:
• innovative approaches to preventing occupational lung diseases
• developing/evaluating new treatments and service to improve quality of life for workers suffering from dust diseases
• improving techniques for screening and diagnosing dust diseases when assessing disability
• evaluating existing treatments and services for dust diseases
• researching epidemiology of dust diseases including data mining DDB data sets.
At 30 June 2015, the unit was monitoring two ongoing research grants, with four completed. The unit was also helping to establish grants for a further four research studies approved by the Board. Further information about the research projects funded by the DDB in 2014/15 can be found under Appendix 10.
Research funded by the DDB provides significant support towards developing early detection methods, improved treatments and, ultimately, better outcomes for all dust diseases sufferers.
We also fund a Medical Practitioner Occupational Dust Diseases Scholarship designed to assist medical practitioners to further their knowledge and experience in the prevention, diagnosis and treatment of occupational dust disease. The scholarships provide up to $6000 to meet the costs of travel, accommodation and living expenses associated with visiting the DDB in Sydney for one week.
In March 2015 the Board awarded funding to the following researchers:
Applicant Name Institution Project Short Name Duration Budget
Professor Jenette Creaney
Lung Institute of Western Australia
Establishing the biological activity of malignant effusions in malignant pleural mesothelioma
2 years $239,432.00
Dr Nicholas de Klerk
University of Western Australia
Lung cancer risk and screening guidelines after asbestos exposure
2 years $191,000.00
Professor Richard Lake
University of Western Australia
Exploiting immune checkpoint blockade to generate effective therapy for malignant mesothelioma
2 years $243,147.00
Professor YC Gary Lee
Lung Institute of Western Australia
Phase II of a novel FGF-Receptor Antagonist in mesothelioma
2 years $249,877.40

WORKERS’ COMPENSATION (DUST DISEASES) BOARD 2014/15 ANNUAL REPORT 29
COMPLAINTS AND APPEALS
All members of the public have a right to make a complaint or offer feedback on how the DDB can improve its service standards.
This year no formal complaints were received, however, a person affected by a Board or the Medical Authority decision in relation to a claim for compensation under the Workers Compensation (Dust Diseases) Act 1942 may appeal against the decision to the District Court of NSW. The DDB received five District Court appeals in 2014/15.
STAKEHOLDER INVOLVEMENT
During 2014/15, we sponsored the National Asbestos Awareness Week event hosted by the Asbestos Diseases Foundation of Australia.
In late 2014 we invited stakeholders to attend focus groups to assist in the development and testing of the DDB’s new website. These focus groups were invaluable in helping redesign our website in a way that reflects the needs of customers and the NSW community.
The DDB General Manager is also a member of the following inter-departmental committees:
• Heads of Asbestos Co-ordinating Authorities
• Asbestos Co-Regulators Working Group
• Australian Mesothelioma Register Steering Committee.
NSW GOVERNMENT RED TAPE REDUCTION POLICY
In 2014/15, development continued on our new case management system, due for implementation in 2015/16. The system will cut red tape and provide greater public interaction with the DDB via a web portal. This will mean reduced response times and make our services more accessible to people requiring our assistance. The web portal will allow customers to lodge applications and contact DDB staff electronically, and enable suppliers to lodge and track payment of their invoices. Automating these functions allows staff to devote more time to the delivery of client services.
CASE STUDY – MEDICAL SCHOLARSHIPSIn 2014/15, two medical scholarships were offered to assist occupational physicians to visit the DDB to learn more about occupational dust diseases. The 2015 medical scholars, Dr Ben Uchenna, an occupational medicine trainee from Melbourne, and Dr Peter Jezukaitis, an experienced occupational physician from Adelaide, visited Sydney from 20-24 April 2015.
Scholarship activities included:
• visiting the WorkCover Chemical Analysis Laboratory
• visiting the Electron Microscope and the Department of Anatomical Pathology, Westmead Hospital.
• attending a Medical Authority meeting
• meetings with DDB managers and Board member, Ms Sylvia Kidziak
• visiting the Asbestos Diseases Research Institute
• meeting with the WorkCover work, health and safety team.
Feedback from the two scholars was positive, leading the Research Grants Committee to consider recommending two additional scholarships in 2015/16, for a third year of the scholarship program.

30 OUR PEOPLE
CULTURE OF ACHIEVEMENT AND LEADERSHIP
Culture of Achievement is an initiative that aims to shape the culture of SRWS, encouraging a customer-centric, high-performance operating model. This initiative aims to build a culture that supports and drives the organisation’s vision, mission and values.
Another initiative, the GROW Leadership Development Program, is targeted at three leadership levels and includes a self-leadership program that has continued to build and enhance capabilities related to people management and self- awareness. This tiered approach caters for a progressive development pathway. All programs are highly interactive and centred around real workplace challenges.
In 2014/15, SRWS senior executives initiated the co-design of a clear, responsive, and adaptable action plan for the future direction of its agencies. This culminated in the development of the SRWS Corporate Plan vision, mission and strategy.
The past 12 months also saw a significant shift to CEO and executive visibility and communications, which contributed to increased staff engagement. The CEO established an open Q&A communication channel and a weekly blog, providing updates on key projects and achievements. In addition, the senior executive team led the implementation of four key priorities from the 2014 People Matters employee survey: organisational culture; values based leadership; decision making and empowerment; and organisational direction.
PERFORMANCE MANAGEMENT
SRWS continues to use an online performance management system to support clarity of individual performance expectations for the year. At 30 June 2015, all eligible DDB staff had set performance objectives.
MANDATORY TRAINING PROGRAMS COMPLETED IN 2014/15:
In financial year 2014/15 three e-learning modules were launched:
• Maintaining a positive and respectful workplace
• Information security awareness
• WHS due diligence.
A one day workshop, Manager as a Coach, was also delivered to build and enhance the coaching skills of people leaders by providing them with the tools they need to lead and inspire an effective team.
TRAINING AND DEVELOPMENT
In 2014/15, 161 core training programs were delivered, aligned to the NSW Public Sector Capability Framework. Satisfaction was rated at 96 per cent with 98 per cent of employees indicating they would apply what they had learnt in the workplace.
INTRANET REDEVELOPMENT
To improve internal communications and information accessibility for our employees, a large scale review of the existing intranet was completed and implementation is due to commence in 2015/16.
REWARDS AND RECOGNITION
In 2014/15 the SRWS recognition strategy was enhanced, which helped produce a 30 per cent increase in nominations for the 2015 awards. The awards cover seven focus areas directly aligned to the organisation’s values. The formal SRWS awards ceremony was held at NSW Parliament House this year.
In 2015, SRWS launched the ‘I recognise’ cards. These cards allow SRWS staff to acknowledge one another for demonstrating organisational values of respect; integrity; trust; service; innovation and accountability.
In 2014/15, nine DDB staff members (one individual and three teams) were nominated for awards. Awards are given for: customer experience, values in action, pursuit of excellence, outstanding achievement by a team or individual, commitment to wellness and safety, leadership excellence and the CEO commendation.
OUR PEOPLE
WORKERS’ COMPENSATION (DUST DISEASES) BOARD 2014/15 ANNUAL REPORT 31

32 OUR PEOPLE
OUR PEOPLE
CAPABILITY BASED ROLE DESCRIPTIONS
As part of the Government Sector Employment Act, role descriptions must align with the 2013 Public Sector Capability Framework. The capability framework provides a basis for creating and recruiting roles and helps make sure SRWS gets the right people into the right roles. This year SRWS made progress on the implementation of capability based role descriptions. Role descriptions focussed on the underpinning knowledge, skills and abilities required for a role and have facilitated greater agility and mobility across the organisation.
WORK HEALTH AND SAFETY PERFORMANCE AND EMPLOYEE WELLBEING
SRWS performance in the area of work health safety and employee wellbeing continued to focus on prevention and early intervention. The wellness strategy across SRWS covers four core areas; physical, social, emotional and financial and has included prevention initiatives such as:
• Get Healthy at Work
• early detection
• flu vaccinations
• blood donor
• nutrition seminars
• International Day of People with a Disability seminar
• Dragon Boat Races
• Movember
• RU OK Day.
An overarching SRWS health and safety committee enables consultation on matters of health and safety. This year SRWS focused on improvement across its health and safety management system, including the adoption of revised health and safety policies and procedures, and mandatory work health and safety-related training across the four agencies.
SRWS has 22 workgroups represented by 27 Health and Safety Representatives, a SRWS Health and Safety Committee, and other agreed consultation arrangements consistent with the work health and safety legislation.
In 2014/15, no claims were lodged by DDB staff.
SRWS continues to support staff through non-work related illness and injury concerns, and to work on early intervention, pro-active case management, and timely return to work strategies.
RECRUITMENT
During 2014/15, SRWS transitioned to the new employment practices introduced in the Government Sector Employment (GSE) Act 2013.
During the year SRWS updated its recruitment framework to align with the changes introduced by the GSE Act and with DFSI corporate recruitment policy/practice. A number of new GSE compliant recruitment practices were developed and introduced and a number of key actions were progressed. A robust hiring manager coaching program was developed and implemented incorporating one-on-one support for all hiring managers during their first recruitment action under the GSE provisions.
WORKERS’ COMPENSATION (DUST DISEASES) BOARD 2014/15 ANNUAL REPORT 33
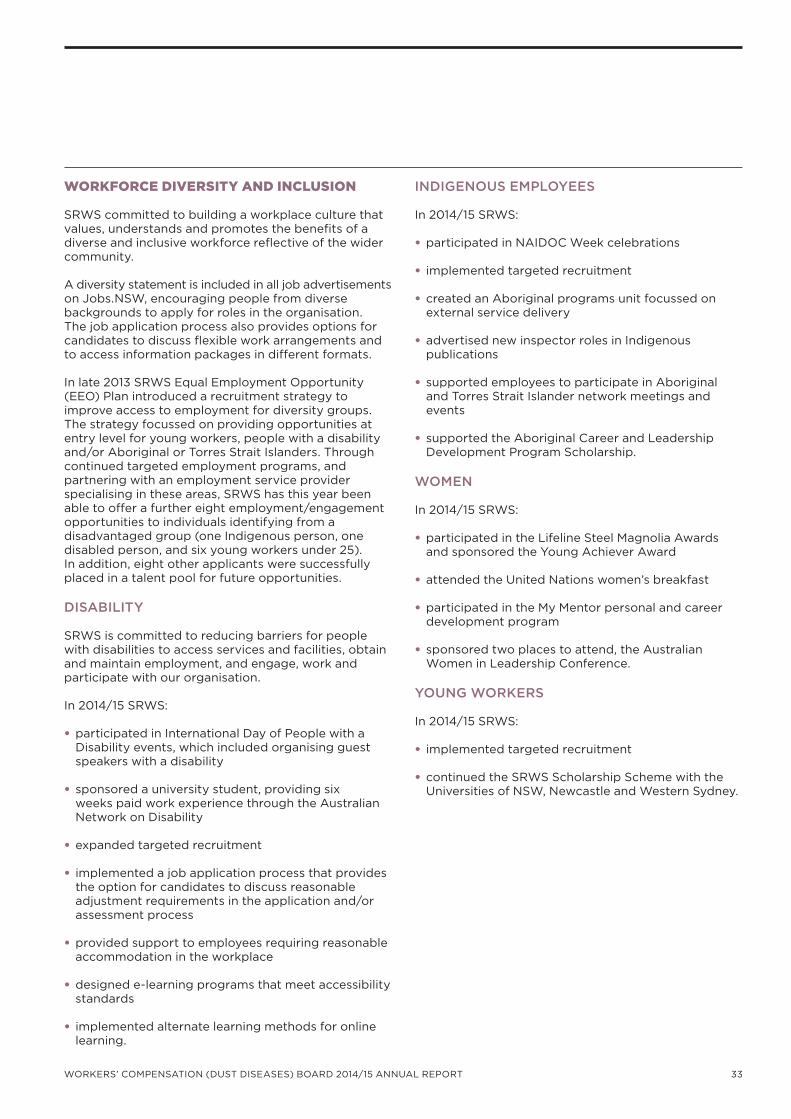
WORKFORCE DIVERSITY AND INCLUSION
SRWS committed to building a workplace culture that values, understands and promotes the benefits of a diverse and inclusive workforce reflective of the wider community.
A diversity statement is included in all job advertisements on Jobs.NSW, encouraging people from diverse backgrounds to apply for roles in the organisation. The job application process also provides options for candidates to discuss flexible work arrangements and to access information packages in different formats.
In late 2013 SRWS Equal Employment Opportunity (EEO) Plan introduced a recruitment strategy to improve access to employment for diversity groups. The strategy focussed on providing opportunities at entry level for young workers, people with a disability and/or Aboriginal or Torres Strait Islanders. Through continued targeted employment programs, and partnering with an employment service provider specialising in these areas, SRWS has this year been able to offer a further eight employment/engagement opportunities to individuals identifying from a disadvantaged group (one Indigenous person, one disabled person, and six young workers under 25). In addition, eight other applicants were successfully placed in a talent pool for future opportunities.
DISABILITY
SRWS is committed to reducing barriers for people with disabilities to access services and facilities, obtain and maintain employment, and engage, work and participate with our organisation.
In 2014/15 SRWS:
• participated in International Day of People with a Disability events, which included organising guest speakers with a disability
• sponsored a university student, providing six weeks paid work experience through the Australian Network on Disability
• expanded targeted recruitment
• implemented a job application process that provides the option for candidates to discuss reasonable adjustment requirements in the application and/or assessment process
• provided support to employees requiring reasonable accommodation in the workplace
• designed e-learning programs that meet accessibility standards
• implemented alternate learning methods for online learning.
INDIGENOUS EMPLOYEES
In 2014/15 SRWS:
• participated in NAIDOC Week celebrations
• implemented targeted recruitment
• created an Aboriginal programs unit focussed on external service delivery
• advertised new inspector roles in Indigenous publications
• supported employees to participate in Aboriginal and Torres Strait Islander network meetings and events
• supported the Aboriginal Career and Leadership Development Program Scholarship.
WOMEN
In 2014/15 SRWS:
• participated in the Lifeline Steel Magnolia Awards and sponsored the Young Achiever Award
• attended the United Nations women’s breakfast
• participated in the My Mentor personal and career development program
• sponsored two places to attend, the Australian Women in Leadership Conference.
YOUNG WORKERS
In 2014/15 SRWS:
• implemented targeted recruitment
• continued the SRWS Scholarship Scheme with the Universities of NSW, Newcastle and Western Sydney.

34 OUR PEOPLE
OUR PEOPLE
MULTICULTURAL POLICIES AND SERVICES PROGRAM
In 2015, the SRWS Multicultural Plan 2015/17 was developed as a fundamental tool for planning and implementing policies and services. As an agency of SRWS, the DDB recognises and supports multiculturalism in NSW. The plan includes strategies aligning with our corporate objectives to ensure that workplaces and services are inclusive and non-discriminatory. Embracing a multicultural focus, the plan was integrated into our business plans for 2014/15.
Initiatives in 2014/15 included:
• maintaining and updating a diversity and inclusion intranet page along with a diversity events calendar
• raising multicultural awareness in recruitment and induction packs
• celebrating Harmony Day in March 2015 by hosting morning teas, wearing orange, decorating workstations and promoting local cultural activities
• celebrating NAIDOC Week in July 2014 including holding morning teas and screening cultural documentaries.
Collaborating with others, the DDB also:
• sponsored three prizes for the Reconciliation 2015 Art Competition and Exhibition award ceremony, in conjunction with NSW Fair Trading
• adopted the DFSI ‘Practical Actions Guide – Building Diversity and Inclusion’ as part of the People Leaders’ Toolkit used within SRWS
• participated in a Bulgandry cultural site trip that included a guided tour of local Aboriginal rock carvings, artefacts and insight into indigenous history on the Central Coast.
WORKFORCE DIVERSITY AND INCLUSION 2015/16
In 2015/16 DDB will participate in a number of activities across all diversity groups as well as young workers including:
• the expansion of targeted recruitment and support for managers to remove unconscious bias
• targeted learning and development programs
• participation in targeted events and celebrations such as NAIDOC, Harmony Day, International Women’s Day and the International Day of People with Disability
• increase regularity of advertising roles through culturally specific media and networks (e.g. ethnic/Aboriginal/LGBTI)
• sponsorship programs
• enhancements to recruitment advertising to include imagery in advertising that reflects employee diversity and work of organisation.
WORKFORCE DIVERSITY STATISTICS
Prior to June 2014, diversity statistics for the DDB were an estimate for the whole of the organisation based on the results for those who provided diversity information. For example, if 50 per cent of the workforce provided diversity information, the result would be double to estimate the results if all employees had responded.
From June 2014, this method for determining diversity group statistics will continue if an organisation has at least 65 per cent of employees providing diversity information. If the response rate is below this, the Public Service Commission will only report actual results as a ratio of the organisation’s total number of ‘non-casual’ employees.
In 2014/15 the DDB’s employee response rate for providing diversity information was below 65 per cent (38.5%). Although providing diversity information is not mandatory, the DDB is continuing to encourage our employees to provide this data. Information about workplace diversity and confidentiality of personal information is included in the induction process and all new employees are encouraged to provide diversity information.
TRENDS IN THE REPRESENTATION OF WORKFORCE DIVERSITY GROUPS*
Workforce diversity group
Benchmark/Target 2014 2015
Women 50% 64.3% 61.5%
Aboriginal People and Torres Strait Islanders
2.6% 2.4% 2.6%
People whose first language spoken as a child was not English
19.0% 4.8% 5.1%
People with a disability N/A 2.4% 2.6%
People with a disability requiring work-related adjustment
1.5% 0.0% 0.0%
* Based on a response rate 38.5%
TRENDS IN THE REPRESENTATION OF WORKFORCE DIVERSITY GROUPS*
Not reported by Public Service Commission as Workforce Diversity group or non-Workforce Diversity group numbers are less than 20.
WORKERS’ COMPENSATION (DUST DISEASES) BOARD 2014/15 ANNUAL REPORT 35
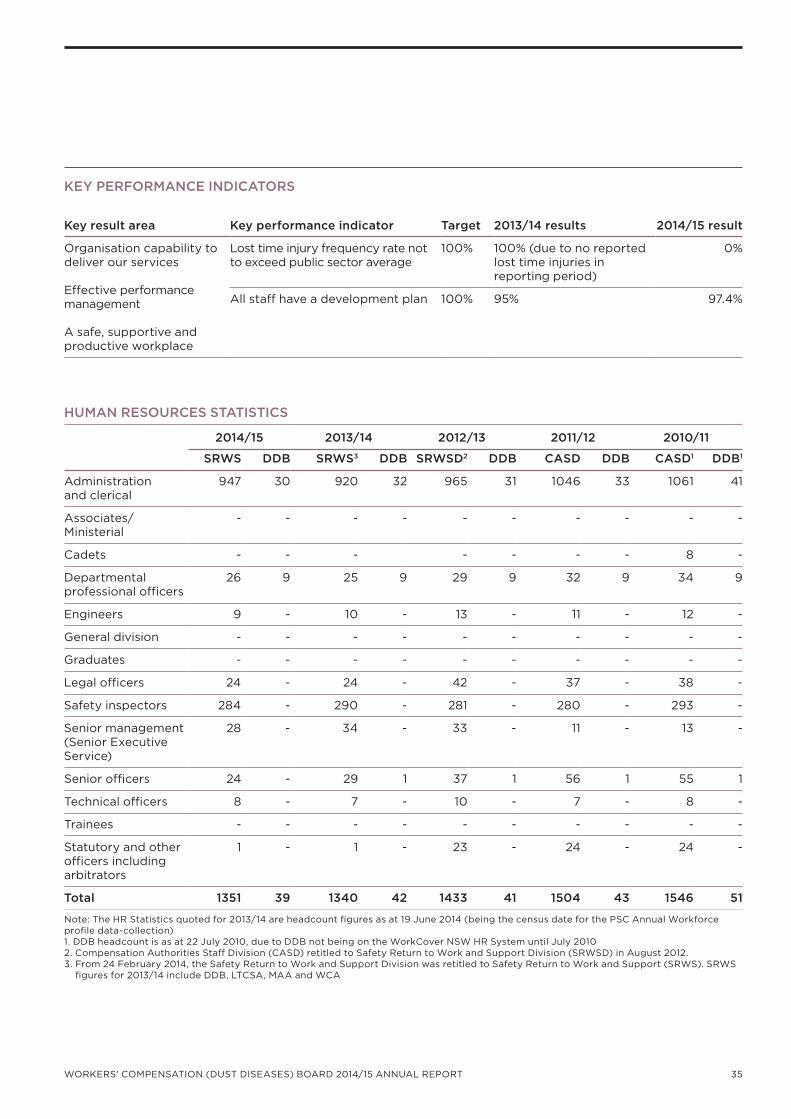
KEY PERFORMANCE INDICATORS
Key result area Key performance indicator Target 2013/14 results 2014/15 result
Organisation capability to deliver our services
Effective performance management
A safe, supportive and productive workplace
Lost time injury frequency rate not to exceed public sector average
100% 100% (due to no reported lost time injuries in reporting period)
0%
All staff have a development plan 100% 95% 97.4%
HUMAN RESOURCES STATISTICS
2014/15 2013/14 2012/13 2011/12 2010/11
SRWS DDB SRWS3 DDB SRWSD2 DDB CASD DDB CASD1 DDB1
Administration and clerical
947 30 920 32 965 31 1046 33 1061 41
Associates/ Ministerial
- - - - - - - - - -
Cadets - - - - - - - 8 -
Departmental professional officers
26 9 25 9 29 9 32 9 34 9
Engineers 9 - 10 - 13 - 11 - 12 -
General division - - - - - - - - - -
Graduates - - - - - - - - - -
Legal officers 24 - 24 - 42 - 37 - 38 -
Safety inspectors 284 - 290 - 281 - 280 - 293 -
Senior management (Senior Executive Service)
28 - 34 - 33 - 11 - 13 -
Senior officers 24 - 29 1 37 1 56 1 55 1
Technical officers 8 - 7 - 10 - 7 - 8 -
Trainees - - - - - - - - - -
Statutory and other officers including arbitrators
1 - 1 - 23 - 24 - 24 -
Total 1351 39 1340 42 1433 41 1504 43 1546 51
Note: The HR Statistics quoted for 2013/14 are headcount figures as at 19 June 2014 (being the census date for the PSC Annual Workforceprofile data-collection)1. DDB headcount is as at 22 July 2010, due to DDB not being on the WorkCover NSW HR System until July 20102. Compensation Authorities Staff Division (CASD) retitled to Safety Return to Work and Support Division (SRWSD) in August 2012.3. From 24 February 2014, the Safety Return to Work and Support Division was retitled to Safety Return to Work and Support (SRWS). SRWS
figures for 2013/14 include DDB, LTCSA, MAA and WCA

36 OUR PEOPLE
OUR PEOPLE
CORPORATE GOVERNANCE
PARLIAMENTARY OVERSIGHT
In September 2014 the NSW Parliament Standing Committee on Law and Justice published its findings from the first ever review of the Workers’ Compensation (Dust Diseases) Board.
The committee observed in their final report published 13 September 2014, “The overwhelming view of review participants is that the Dust Diseases Board and its compensation scheme are performing in an exemplary manner. It is a rare feat for a government agency to receive such uniform praise from stakeholders. The committee commends the board for performing its functions to such a high standard.”
The committee also commented, “The evidence presented during this review demonstrates that the board has a person-centred approach to service delivery that allows it to execute its statutory functions and corporate governance responsibilities in an exemplary manner. The committee acknowledges the excellent overall satisfaction rating the DDB achieved in its 2013 customer satisfaction survey. The Board’s staff have worked diligently to provide empathic and courteous service for their clients and should be commended for their efforts.”
RISK MANAGEMENT
The DDB has an integrated whole-of-SRWS risk management strategy that incorporates the SRWS Enterprise Risk Management (ERM) Framework. The ERM framework is consistent with AS/NZS standards (31000) and the NSW Treasury Internal Audit and Risk Management Policy for the NSW Public Sector (TPP09-05).
The risk strategy informs corporate and business planning, governance and assurance activities. Through good governance, robust business practices and consistent monitoring the ERM framework aids to build an agile, capable and sustainable environment, underpinned by a risk aware culture.
The Board has an established and ongoing process for identifying, evaluating and managing the significant risks faced by SRWS and is assisted by a suite of tools available to staff. The management of each agency level and divisional / business unit is responsible for identifying, evaluating, and rating (in terms of probability of occurrence and likely impact) key risks. Ownership is assigned, which entails taking responsibility for managing and mitigating key risks, including the design and operation of appropriate internal controls and consistent reporting. A key feature of the ERM framework is that everyone takes responsibility for the management of risk. Both strategic and operational risk reviews have continued and the next phase of further enhancing risk maturity across SRWS has begun.
The governance structures for risk management are based on the ‘three lines of defence’ model. Primary responsibility for risk management lies with the business units and specialist operational process functions. A second line of defence is provided by specialist functions that undertake monitoring, challenge and policy setting, such as the independent strategic risk and corporate compliance function. The third line of defence is provided by Internal Audit Unit (IAU) which provides process assurance, supplemented by external audit.
INTERNAL AUDIT UNIT
The SRWS IAU is an independent review function that manages, through two outsourced service providers, an annual plan of risk-based audits across all the SRWS Agencies including the DDB. In 2014/15, six reviews were finalised in DDB (or SRWS-wide including DDB). These reviews raised 25 audit issues and made 44 audit recommendations to strengthen the organisation’s internal controls.
The following internal audit reports were finalised in 2014/15:
• SRWS Complaints Management*
• SRWS Asset Management
• SRWS Accounts Payable
• SRWS Physical Security
• SRWS IT Security
• SRWS Annual Reporting.
In addition to the above, the following internal audit review, from the 2014/15 audit plan, was in progress as at 30 June 2015:
• DDB Case Management System – Segregation of Duties.
During 2014/15 SRWS commissioned an independent quality assessment by the industry peak body, the Institute of Internal Auditors (IIA), of the entire spectrum of assurance and consulting work performed by the IAU. The IAU was assessed as fully conforming with all 51 IIA Standards and the NSW Government Internal Audit Policy. The IIA rated SRWS Internal Audit as ‘beyond conforming’ – the top category in its maturity model – and highlights many examples of good practice in its final quality assessment report.
The IAU also undertakes a range of fraud and corruption prevention activities. IAU staff act as Public Interest Disclosure Officers to whom staff can report allegations of corrupt conduct within the Public Interest Disclosure Act 1994. IAU also manages investigations into alleged corrupt conduct liaising, where appropriate, with the Independent Commission Against Corruption (ICAC).
The Director of Corporate Governance acts as the Chief Audit Executive and reports directly to the SRWS
* Internal audit reviews from the 2013/14 audit plan completed during the 2014/15 year.

WORKERS’ COMPENSATION (DUST DISEASES) BOARD 2014/15 ANNUAL REPORT 37
Audit and Risk Committee for strategic direction and accountability purposes, and reports administratively to the CEO to facilitate day to day operations.
ENERGY PERFORMANCE AND WASTE REDUCTION
SRWS continued to achieve savings in energy usage, sustainable energy management principles and targets set in the Government Resource Efficiency Policy (GREP). During 2014/15, SRWS occupied 23 sites that purchased electricity through State contracts and generated six per cent of their power from renewable energy sources.
SRWS initiatives in 2014/15 included:
• using energy-efficient automated lighting and motion-detection lighting
• installing infra-red security cameras to reduce external lighting
• timed air conditioning
• continued use of UniFLOW print management system to reduce paper and toner usage
• recycling 100 per cent of used toner cartridges
• recycling IT equipment through approved providers
• procuring environmentally friendly vehicles
• increasing publication of online materials
• separating waste into recyclable and general categories.
PUBLIC INTEREST DISCLOSURES (PIDS)
The DDB has an Internal Reporting Policy available to all staff on the intranet.
We make staff aware of their rights and responsibilities under the Public Interest Disclosure Act 1994. Awareness activities within the current PID reporting period (1 July 2014 to 30 June 2015) include induction training, intranet communications, and fact sheets.
STATISTICAL INFORMATION ON PIDS
Made by public officials performing their day to day functions
Under a statutory or other legal obligation All other PIDs
Number of public officials who made PIDs directly
0 0 0
Number of PIDs received 0 0 0
Of PIDs received, number primarily about:
Corrupt conduct 0 0 0
Maladministration 0 0 0
Serious and substantial waste 0 0 0
Government information contravention
0 0 0
Local government pecuniary interest contravention
0 0 0
Number of PIDs finalised 0
INFORMATION SERVICES
SRWS Information Services is responsible for the support and maintenance of existing infrastructure and applications within the SRWS technology system. It is also tasked with planning and implementing the SRWS Information and Communications Technology (ICT) Strategic Plan which sets the direction for use of technology by SRWS between 2013 and 2018. The ICT strategy benefits include consolidation, standardisation, improved connectivity, reliability and availability of business systems and business continuity, value-driven sourcing and overall alignment with the NSW Government direction for information technology.
Information Services works across SRWS to ensure IT planning across all modes of health and safety are fully integrated. This allows the operational agencies to
focus solely on delivering quality service to customers and not on duplicating their efforts in IT planning and purchasing. The strategy enables SRWS to operate as a coordinated set of brands with each brand maintaining some autonomy while utilising cross-agency synergy in information, services and infrastructure.
DELIVERY OF THE ICT STRATEGIC PLAN
The Information Communication Technology (ICT) strategy delivers the objectives of the enterprise architecture and establishes a platform for the future that is responsive to changing business demands. It also balances the functionality and cost effectiveness of ICT infrastructure. The ICT strategy ensures that SRWS progresses data from its raw form to accessible and useable information.

38 INTERNAL AUDIT AND RISK MANAGEMENT STATEMENT
INTERNAL AUDIT AND RISK MANAGEMENT STATEMENT

WORKERS’ COMPENSATION (DUST DISEASES) BOARD 2014/15 ANNUAL REPORT 39
DIGITAL INFORMATION SECURITY ATTESTATION STATEMENT
DIGITAL INFORMATION SECURITY ANNUAL ATTESTATION STATEMENT FOR THE 2014-2015 FINANCIAL YEAR FOR THE WORKERS’ COMPENSATION (DUST DISEASES) BOARD.
I, Vivek Bhatia, Chief Executive Officer of the Workers’ Compensation (Dust Diseases) Board, am of the opinion that the Workers’ Compensation (Dust Diseases) Board had an Information Security Management System in place during the 2014-2015 financial year that is consistent with the Core Requirements set out in the NSW Government Digital Information Security Policy.
The controls in place to mitigate identified risks to the digital information and digital information systems of the Workers’ Compensation (Dust Diseases) Board are adequate.
Risks to the digital information and digital information system of Workers’ Compensation (Dust Diseases) Board been assessed with an independent ISMS being developed in accordance with the NSW Government Digital Information Security Policy.
The Workers’ Compensation (Dust Diseases) Board has maintained compliance with ISO 27001 Information technology – Security techniques – Information security management systems – Requirements and independently reviewed by Shearwater Solutions Pty Ltd during the 2014-2015 financial years.

40 FINANCIAL STATEMENTS FOR THE YEAR ENDED 30 JUNE 2015
FINANCIAL STATEMENTS FOR THE YEAR ENDED 30 JUNE 2015WORKERS’ COMPENSATION (DUST DISEASES) BOARD
Actuarial Certificate 41
Statement by the Chief Executive Officer 43
Independent Auditor’s Report 44
Statement of Comprehensive Income for the year ended 30 June 2015 46
Statement of Financial Position as at 30 June 2015 47
Statement of Changes in Equity for the year ended 30 June 2015 48
Statement of Cash Flows for the year ended 30 June 2015 49
Notes to the Financial Statements 50
1. Summary of significant accounting policies 50
2. Expenses excluding losses 59
3. Revenue 61
4. Loss on Disposal 61
5. Other gains/(losses) 61
6. Current assets – cash and cash equivalents 62
7. Current/non-current assets – receivables 62
8. Current/non-current assets – financial assets at fair value 63
9. Non-current assets – property, plant and equipment 64
10. Intangible assets 65
11. Fair value measurement of non-financial assets 66
12. Current liabilities – payables 66
13. Current liabilities – borrowings 66
14. Current/non-current liabilities – provisions 67
15. Commitments for expenditure 70
16. Contingent liabilities and contingent assets 70
17. Budget review 70
18. Reconciliation of cash flows from operating activities to net result 70
19. Restricted assets 71
20. Financial instruments 72
21. Post balance date events 81

41
FINANCIAL STATEMENTS FOR THE YEAR ENDED 30 JUNE 2015Workers’ Compensation (Dust Diseases) Board
WORKERS’ COMPENSATION (DUST DISEASES) BOARD 2014/15 ANNUAL REPORT
WORKERS COMPENSATION DUST DISEASES BOARD of NSW Actuarial Certificate
Outstanding Claims Liabilities as at 30 June 2015
Taylor Fry Consulting Actuaries has been engaged by the WorkCover Authority of NSW and the Workers’ Compensation Dust Diseases Board of NSW (“the Board”) to estimate the outstanding claims liabilities of the Board under the Workers Compensation (Dust Diseases) Act as at 30 June 2015.
Data
The valuation of outstanding claims liabilities as at 30 June 2015 is based on data provided to us by the Board. We have not independently verified the data provided to us but have reviewed it for reasonableness and internal consistency. We are of the opinion that it is adequate for the purpose of estimating the claims liabilities.
Basis of our estimates
The outstanding claims liabilities below are central estimates in that they contain no deliberate bias towards either over or under estimation. The estimate is inflated and discounted, and includes an allowance for future expenses associated with paying the claims liabilities. Our valuation has separately considered expected payments for claims which have already been reported (“known claims”) and for claims which have not yet been reported but for which the exposure to dust has already occurred and a disease will eventually emerge (“future claims”).
Valuation results
Our central estimate of the outstanding claims liability for known and future claims as at 30 June 2015 is $1,854.4m. The breakdown of the result between known and future claims is as follows:
Component Net central estimate ($m) Known claims 773.2 Future claims 1,072.2
Total liability 1,854.4
There is a significant degree of uncertainty associated with estimation of future claim payments. In the case of estimating dust disease claims, this is further exacerbated by the long latency periods, difficulties in obtaining reliable data relating to timing and exposure of potential claimants, and the general lack of knowledge and understanding as to the most appropriate models to use to project future claims.
In our opinion, we have used models and assumptions which are appropriate, and the conclusions presented in this report are reasonable, given the information currently available and based on the current claims environment. To the extent that these trends vary due to changes in the emergence of dust diseases, advancements in medical technology, changes in legislation and so forth, the claims outcomes can be expected to differ, perhaps materially, from our estimates of claims liability.
ACTUARIAL CERTIFICATE

42 ACTUARIAL CERTIFICATE
FINANCIAL STATEMENTS FOR THE YEAR ENDED 30 JUNE 2015Workers’ Compensation (Dust Diseases) Board
Report
The valuation of outstanding claims as at 30 June 2015 has been documented in our final report dated 31 July 2015. This report contains details on data, methodology, assumptions, results and sensitivities to key assumptions. This report constitutes Actuarial Advice as defined in the Code of Professional Conduct (the Code) issued by the Institute of Actuaries of Australia and our advice complies with the Code in this respect.
Relevant Standards
Our report complies with the Actuaries Institute’s Professional Standard PS300 titled Valuations of General Insurance Claims dated March 2013. The central estimate of the liabilities documented in our report has been prepared in accordance with the requirements of Accounting Standard AASB137 titled Provisions, Contingent Liabilities and Contingent Assets.
Sharanjit Paddam Milton Lim
Fellows of the Institute of Actuaries of Australia
ACTUARIAL CERTIFICATE

43
FINANCIAL STATEMENTS FOR THE YEAR ENDED 30 JUNE 2015Workers’ Compensation (Dust Diseases) Board
WORKERS’ COMPENSATION (DUST DISEASES) BOARD 2014/15 ANNUAL REPORT
Pursuant to Section 41C of the Public Finance and Audit Act 1983 I state that in my opinion:
1. the accompanying financial statements exhibit a true and fair view of the financial position of the Workers’ Compensation Dust Diseases Board as at 30 June 2015 and transactions for the year then ended; and
2. these statements have been prepared in accordance with the provisions of the Public Finance and Audit Act 1983, the Public Finance and Audit Regulation 2015, Australian Accounting Standards and the Treasurer’s Directions.
Further, I am not aware of any circumstances which would render any particulars included in the financial statements to be misleading or inaccurate.
STATEMENT BY THE CHIEF EXECUTIVE OFFICER
Vivek BhatiaChief Executive Officer Dust Diseases Authority14 September 2015

44 INDEPENDENT AUDITOR’S REPORT
FINANCIAL STATEMENTS FOR THE YEAR ENDED 30 JUNE 2015Workers’ Compensation (Dust Diseases) Board
INDEPENDENT AUDITOR’S REPORT

45
FINANCIAL STATEMENTS FOR THE YEAR ENDED 30 JUNE 2015Workers’ Compensation (Dust Diseases) Board
WORKERS’ COMPENSATION (DUST DISEASES) BOARD 2014/15 ANNUAL REPORT
INDEPENDENT AUDITOR’S REPORT

46 STATEMENT OF COMPREHENSIVE INCOME FOR THE YEAR ENDED 30 JUNE 2015
FINANCIAL STATEMENTS FOR THE YEAR ENDED 30 JUNE 2015Workers’ Compensation (Dust Diseases) Board
NotesActual 2015
$’000Budget 2015
$’000Actual 2014
$’000
EXPENSES EXCLUDING LOSSES
Operating expenses
Personnel services 2(a) 4,016 4,586 4,006
Other operating expenses 2(b) 4,675 3,675 3,618
Depreciation and amortisation 2(c) 249 347 302
Grants and subsidies 2(d) 5,332 6,565 5,769
Finance costs 2(e) 40,800 96,521 97,200
Other expenses 2(f),3(d) 301,678 (7,291) 368,824
Total expenses excluding losses 356,750 104,403 479,719
REVENUE
Sale of goods and services 3(a) 496 521 557
Investment revenue 3(b) 99,262 63,417 119,640
Retained taxes, fees and fines 3(c) 105,303 105,227 98,531
Other revenue 2(f),3(d) 154,096 (64,512) 259,920
Total Revenue 359,157 104,653 478,648
Loss on disposal 4 (26) - -
Other gains / (losses) 5 (62) (250) 160
Net result 2,319 - (911)
OTHER COMPREHENSIVE INCOME - - -
Items that will not be reclassified to net result
Net increase / (decrease) in property, plant and equipment revaluation surplus - - (943)
Total other comprehensive income - - (943)
TOTAL COMPREHENSIVE INCOME 2,319 - (1,854)
The accompanying notes form part of these financial statements.
STATEMENT OF COMPREHENSIVE INCOME FOR THE YEAR ENDED 30 JUNE 2015
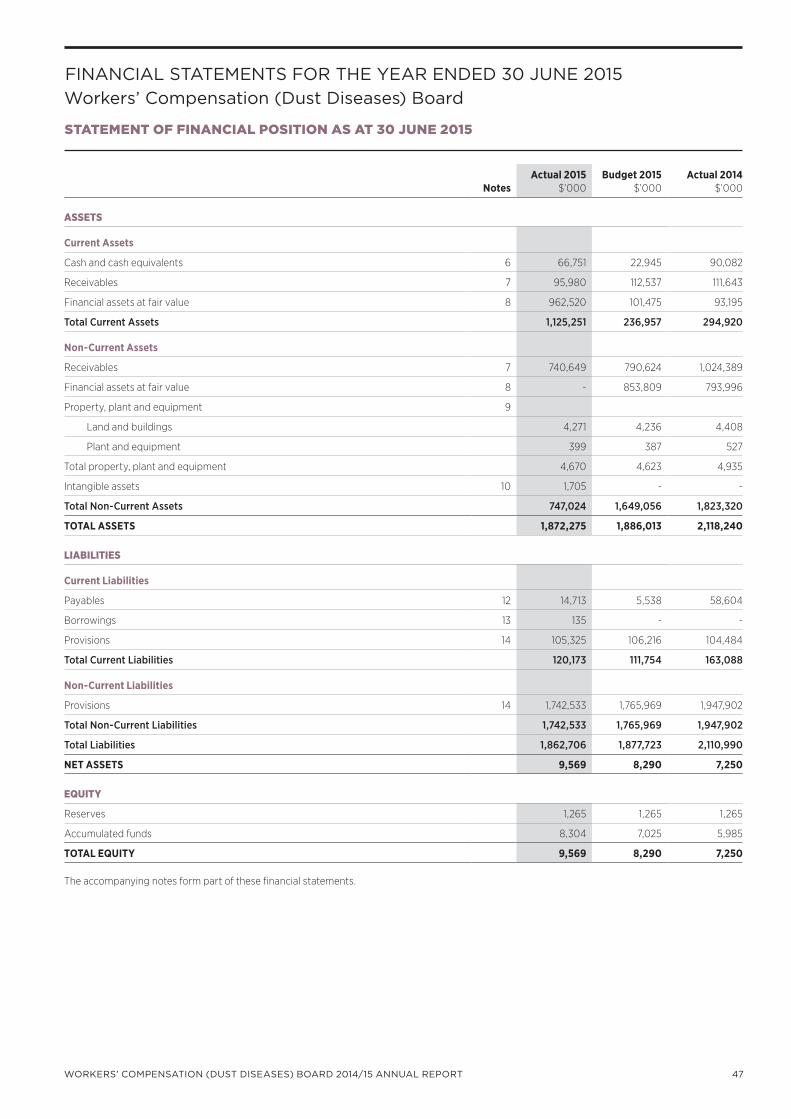
47
FINANCIAL STATEMENTS FOR THE YEAR ENDED 30 JUNE 2015Workers’ Compensation (Dust Diseases) Board
WORKERS’ COMPENSATION (DUST DISEASES) BOARD 2014/15 ANNUAL REPORT
STATEMENT OF FINANCIAL POSITION AS AT 30 JUNE 2015
NotesActual 2015
$’000Budget 2015
$’000Actual 2014
$’000
ASSETS
Current Assets
Cash and cash equivalents 6 66,751 22,945 90,082
Receivables 7 95,980 112,537 111,643
Financial assets at fair value 8 962,520 101,475 93,195
Total Current Assets 1,125,251 236,957 294,920
Non-Current Assets
Receivables 7 740,649 790,624 1,024,389
Financial assets at fair value 8 - 853,809 793,996
Property, plant and equipment 9
Land and buildings 4,271 4,236 4,408
Plant and equipment 399 387 527
Total property, plant and equipment 4,670 4,623 4,935
Intangible assets 10 1,705 - -
Total Non-Current Assets 747,024 1,649,056 1,823,320
TOTAL ASSETS 1,872,275 1,886,013 2,118,240
LIABILITIES
Current Liabilities
Payables 12 14,713 5,538 58,604
Borrowings 13 135 - -
Provisions 14 105,325 106,216 104,484
Total Current Liabilities 120,173 111,754 163,088
Non-Current Liabilities
Provisions 14 1,742,533 1,765,969 1,947,902
Total Non-Current Liabilities 1,742,533 1,765,969 1,947,902
Total Liabilities 1,862,706 1,877,723 2,110,990
NET ASSETS 9,569 8,290 7,250
EQUITY
Reserves 1,265 1,265 1,265
Accumulated funds 8,304 7,025 5,985
TOTAL EQUITY 9,569 8,290 7,250
The accompanying notes form part of these financial statements.

48 STATEMENT OF CHANGES IN EQUITY FOR THE YEAR ENDED 30 JUNE 2015
FINANCIAL STATEMENTS FOR THE YEAR ENDED 30 JUNE 2015Workers’ Compensation (Dust Diseases) Board
STATEMENT OF CHANGES IN EQUITY FOR THE YEAR ENDED 30 JUNE 2015
Accumulated Funds $’000
Asset Revaluation Surplus $’000
Total $’000
Balance at 1 July 2014 5,985 1,265 7,250
Changes in accounting policy - -
Restated total equity at 1 July 2014 5,985 1,265 7,250
Net result for the year 2,319 - 2,319
Other comprehensive income - - -
Total other comprehensive income - - -
Total comprehensive income for the year 2,319 - 2,319
Transactions with owners in their capacity as owners - - -
BALANCE AT 30 JUNE 2015 8,304 1,265 9,569
Balance at 1 July 2013 7,025 2,208 9,233
Changes in accounting policy (129) - (129)
Restated total equity at 1 July 2013 6,896 2,208 9,104
Net result for the year (911) - (911)
Other comprehensive income:
Net (decrease) in property, plant and equipment - (943) (943)
Total other comprehensive income - (943) (943)
Total comprehensive income for the year (911) (943) (1,854)
Transactions with owners in their capacity as owners - - -
BALANCE AT 30 JUNE 2014 5,985 1,265 7,250
The accompanying notes form part of these financial statements.

49
FINANCIAL STATEMENTS FOR THE YEAR ENDED 30 JUNE 2015Workers’ Compensation (Dust Diseases) Board
WORKERS’ COMPENSATION (DUST DISEASES) BOARD 2014/15 ANNUAL REPORT
STATEMENT OF CASH FLOWS FOR THE YEAR ENDED 30 JUNE 2015
NotesActual 2015
$’000Budget 2015
$’000Actual 2014
$’000
CASH FLOWS FROM OPERATING ACTIVITIES
Payments
Personnel services (3,798) (4,586) (3,884)
Grants and subsidies (5,274) (6,565) (5,660)
Other (148,825) (104,129) (105,708)
Total Payments (157,897) (115,280) (115,252)
Receipts
Sale of goods and services 439 521 557
Interest received 11,212 36,422 123,304
Retained taxes, fees and fines 106,178 42,936 99,709
Other (855) 67,840 1,602
Total Receipts 116,974 147,719 225,172
NET CASH FLOWS FROM OPERATING ACTIVITIES 18 (40,923) 32,439 109,920
CASH FLOWS FROM INVESTING ACTIVITIES
Proceeds from sale of investments 393,506 5,932 24,200
Purchases of plant and equipment (10) (40) (94)
Purchases of intangible assets (1,705) - -
Purchases of investments (374,334) (26,994) (120,383)
NET CASH FLOWS FROM INVESTING ACTIVITIES 17,457 (21,102) (96,277)
NET INCREASE/(DECREASE) IN CASH (23,466) 11,337 13,643
Opening cash and cash equivalents 90,082 11,608 76,439
CLOSING CASH AND CASH EQUIVALENTS 6 66,616 22,945 90,082
The accompanying notes form part of these financial statements.

50 NOTES TO THE FINANCIAL STATEMENTS
FINANCIAL STATEMENTS FOR THE YEAR ENDED 30 JUNE 2015Workers’ Compensation (Dust Diseases) Board
50
NOTES TO THE FINANCIAL STATEMENTS
1. SUMMARY OF SIGNIFICANT ACCOUNTING POLICIES
a. Reporting entity
The Workers’ Compensation Dust Diseases Board (the Board) is a NSW government entity. The Board is a not-for-profit entity (as profit is not its principal objective) and it has no cash generating units. The reporting entity is consolidated as part of the NSW Total State Sector Accounts.
These financial statements for the year ended 30 June 2015 have been authorised for issue by the Board on 14 September 2015.
b. Basis of preparation
The Board’s financial statements are general purpose financial statements which have been prepared using the accrual basis of accounting and are in accordance with:
• applicable Australian Accounting Standards (which include Australian Accounting Interpretations)
• the requirements of the Public Finance and Audit Act 1983 and Public Finance and Audit Regulation 2015 and
• the Financial Reporting Directions published in the Financial Reporting Code for NSW General Government Sector Entities or issued by the Treasurer.
Property, plant and equipment and financial assets at ‘fair value through profit or loss’ are measured at fair value. Other financial statement items are prepared in accordance with the historical cost convention unless otherwise stated.
Judgements, key assumptions and estimations management has made are disclosed in the relevant notes to the financial statements.
The preparation of financial statements requires management to make judgments, estimates and assumptions that affect the application of accounting policies and the reported amounts of assets, liabilities, income and expenses. Actual results may differ from these estimates.
Estimates and underlying assumptions are reviewed on an ongoing basis. Revisions to accounting estimates are recognised in the period in which the estimate is revised and in any future periods affected.
In particular, information about significant areas of estimation uncertainty and critical judgements in applying accounting policies that have the most significant effect on the amount recognised in the financial statements are described in the following notes:
• Note 14 – Outstanding claims
• Note 20 – Financial instruments
Where the fair values of financial assets and financial liabilities recorded on the Statement of Financial Position cannot be derived from active markets, they are determined using a variety of valuation techniques that include the use of mathematical models. The input to these models is taken from observable markets where possible, but where this is not feasible a degree of judgment is required in establishing fair values. The judgments include considerations of liquidity and model inputs such as correlation and volatility for longer dated derivatives.
All amounts are rounded to the nearest one thousand dollars and are expressed in Australian currency.
c. Statement of compliance
The financial statements and notes comply with Australian Accounting Standards, which include Australian Accounting Interpretations.
d. Finance costs
Finance costs are recognised as expenses in the period in which they are incurred, in accordance with NSW Treasury’s mandate to not-for-profit general government sector entities. (Refer to Note 2(e) and Note 14 for more details).
e. Insurance
The Board’s insurance activities are conducted through the NSW Treasury Managed Fund Scheme of self insurance for Government entities. The expense (premium) is determined by the Fund Manager based on past claim experience.
f. Accounting for the Goods and Services Tax (GST)
Income, expenses and assets are recognised net of the amount of GST, except that:
• the amount of GST incurred by the Board as a purchaser that is not recoverable from the Australian Taxation Office is recognised as part of the cost of acquisition of the asset or as part of an item of expense and
• receivables and payables are stated with the amount of GST included.
Cash flows are included in the Statement of cash flows on a gross basis. However the GST components of cash flows arising from investing and financing activities which are recoverable from, or payable to, the Australian Taxation Office are classified as operating cash flows.

51
FINANCIAL STATEMENTS FOR THE YEAR ENDED 30 JUNE 2015Workers’ Compensation (Dust Diseases) Board
WORKERS’ COMPENSATION (DUST DISEASES) BOARD 2014/15 ANNUAL REPORT 51
NOTES TO THE FINANCIAL STATEMENTS
1. SUMMARY OF SIGNIFICANT ACCOUNTING POLICIES (CONTINUED)
g. Income/Expense recognition
Income is measured at the fair value of the consideration or contribution received or receivable. Additional comments regarding the accounting policies for the recognition of income are discussed below.
i. Levy contributions
The Board’s funds are generated from dust diseases levies collected from Nominal, Specialised and Self-insurers, under the Workers’ Compensation (Dust Diseases) Act 1942 (the Act). The levy revenue is recognised when it falls due and receivable by the Board.
ii. Rendering of services
Revenue is recognised when the service is provided or by reference to the stage of completion (based on labour hours incurred to date).
iii. Investment revenue is brought to account on an accruals basis. Dividends on quoted shares are deemed to accrue when the relevant shareholding becomes ex-dividend. Differences between the net market values of investments at the end of the reporting period and their net market values at the end of the previous reporting period (or cost of acquisition, if acquired during the reporting period) are recognised as revenue in the Statement of Comprehensive Income. Interest revenue is recognised using the effective interest method as set out in AASB 139 Financial Instruments: Recognition and Measurement.
iv. Other revenue
Solicitor’s production fees revenue is recognised in accordance with AASB 118 Revenue.
v. Other gains/(losses)
Gains represent other items that meet the definition of income and may, or may not, arise in the course of the ordinary activities of the Board. Gains represent increases in economic benefits and as such are no different in nature from revenue. Gains include, for example, those arising on the disposal of non-current assets.
Losses represent decreases in economic benefits and as such are no different in nature from expenses.
vi. Fund manager remuneration includes base fees which are generally paid quarterly.
h. Assets
i. Acquisitions of assets
Assets acquired are initially recognised at cost. Cost is the amount of cash or cash equivalents paid or the fair value of the other consideration given to acquire the asset at the time of its acquisition or construction or, where applicable, the amount attributed to that asset when initially recognised in accordance with the requirements of other Australian Accounting Standards.
Fair value is the price that would be received to sell an asset in an orderly transaction between market participants at measurement date.
ii. Capitalisation thresholds
The capitalisation threshold for property, plant and equipment is $5,000 and above individually (or forming part of a network costing more than $5,000). For intangible assets it is $100,000 and above (including direct allocation of personnel service costs).
iii. Revaluation of property, plant and equipment
Physical non-current assets are valued in accordance with the ‘Valuation of Physical Non-Current Assets at Fair Value’ Policy and Guidelines Paper (TPP 14-01). This policy adopts fair value in accordance with AASB 13 Fair Value Measurement and AASB 116 Property, Plant and Equipment.
Property, plant and equipment is measured at the highest and best use by market participants that is physically possible, legally permissible and financially feasible. The highest and best use must be available at a period that is not remote and take into account the characteristics of the asset being measured, including any socio-political restrictions imposed by government. In most cases, after taking into account these considerations, the highest and best use is the existing use. In limited circumstances, the highest and best use may be a feasible alternative use, where there are no restrictions on use or where there is a feasible higher restricted alternative use.
Fair value of property, plant and equipment is based on a market participants’ perspective, using valuation techniques (market approach, cost approach, income approach) that maximise relevant observable inputs and minimise unobservable inputs. Also refer Note 11 for further information regarding fair value.
The Board revalues each class of property, plant and equipment at least every five years or with sufficient regularity to ensure that the carrying amount of each asset in the class does not differ materially from its fair value at reporting date. The last revaluation of the Board building was completed on 2 April 2014 and Scientific and Medical Equipment on 6 February 2015. Both valuations were based on an independent assessment.
Non-specialised assets with short useful lives are measured at depreciated historical cost, as a surrogate for fair value.
When revaluing non-current assets using the cost approach, the gross amount and the related accumulated depreciation are separately restated.
For other assets valued using other valuation techniques, any balances of accumulated depreciation at the revaluation date in respect of those assets are credited to the asset accounts to which they relate. The net asset accounts are then increased or decreased by the revaluation increments or decrements.

52 NOTES TO THE FINANCIAL STATEMENTS
FINANCIAL STATEMENTS FOR THE YEAR ENDED 30 JUNE 2015Workers’ Compensation (Dust Diseases) Board
52
NOTES TO THE FINANCIAL STATEMENTS
1. SUMMARY OF SIGNIFICANT ACCOUNTING POLICIES (CONTINUED)
h. Assets (continued)
iii. Revaluation of property, plant and equipment (continued)
Revaluation increments are credited directly to revaluation surplus, except that, to the extent that an increment reverses a revaluation decrement in respect of that class of asset previously recognised as an expense in the net result, the increment is recognised immediately as revenue in the net result.
Revaluation decrements are recognised immediately as expenses in the net result, except that, to the extent that a credit balance exists in the revaluation surplus in respect of the same class of assets, they are debited directly to the revaluation surplus.
As a not-for-profit entity, revaluation increments and decrements are offset against one another within a class of non-current assets, but not otherwise.
Where an asset that has previously been revalued is disposed of, any balance remaining in the revaluation surplus in respect of that asset is transferred to accumulated funds.
iv. Impairment of property, plant and equipment
As a not-for-profit entity with no cash generating units, impairment under AASB 136 Impairment of Assets is unlikely to arise. As property, plant and equipment is carried at fair value, or an amount that approximates fair value, impairment can only arise in the rare circumstances such as where the costs of disposal are material. Specifically, impairment is unlikely for not-for-profit entities given that AASB 136 modifies the recoverable amount test for non-cash generating assets of not-for-profit entities to the higher of fair value less costs of disposal and depreciated replacement cost, where depreciated replacement cost is also fair value.
v. Depreciation of property plant and equipment
Depreciation is provided for on a straight-line basis for all depreciable assets so as to write off the depreciable amount of each asset as it is consumed over its useful life to the Board. All material separately identifiable components of assets are depreciated over their useful lives.
The following depreciation rates were used:
Categories %
Buildings 3
Motor vehicles: passenger cars 20
Motor vehicles: mobile respiratory unit 10
Office equipment 20
Science and medical equipment 5-12.5%
vi. Restoration costs
The estimated cost of dismantling and removing an asset and restoring the office sites is included in the cost of an asset, to the extent it is recognised as a liability.
vii. Maintenance
Day-to-day servicing costs or maintenance are charged as expenses as incurred, except where they relate to the replacement of a part or component of an asset, in which case the costs are capitalised and depreciated.
viii. Leased assets
A distinction is made between finance leases which effectively transfer from the lessor to the lessee substantially all the risks and rewards incidental to ownership of the leased assets, and operating leases under which the lessor does not transfer substantially all the risks and rewards.
Where a non-current asset is acquired by means of a finance lease, at the commencement of the lease term, the asset is recognised at its fair value, or, if lower the present value of the minimum lease payments at the inception of the lease. The corresponding liability is established at the same amount. Lease payments are allocated between principal component and the interest expense.
Operating lease payments are recognised as an expense on a straight line basis over the lease term.
ix. Intangible assets
The Board recognises intangible assets only if it is probable that future economic benefits will flow to the Board and the cost of the asset can be measured reliably. Intangible assets are measured initially at cost. Where an asset is acquired at no or nominal cost, the cost is its fair value at the date of acquisition.
All research costs are expensed. Development costs are only capitalised when certain criteria are met.
The useful lives of intangible assets are assessed to be finite. The Board charges amortisation on intangible assets using the straight-line method over a period of 4 years.

53
FINANCIAL STATEMENTS FOR THE YEAR ENDED 30 JUNE 2015Workers’ Compensation (Dust Diseases) Board
WORKERS’ COMPENSATION (DUST DISEASES) BOARD 2014/15 ANNUAL REPORT 53
NOTES TO THE FINANCIAL STATEMENTS
1. SUMMARY OF SIGNIFICANT ACCOUNTING POLICIES (CONTINUED)
h. Assets (continued)
ix. Intangible assets (contiunued)
Intangible assets are subsequently measured at fair value only if there is an active market. As there is no active market for the Board’s intangible assets, the assets are carried at cost less any accumulated amortisation and impairment losses.
Intangible assets are tested for impairment where an indicator of impairment exists. If the recoverable amount is less than its carrying amount, the carrying amount is reduced to recoverable amount and the reduction is recognised as an impairment loss.
x. Receivables
Receivables are non-derivative financial assets with fixed or determinable payments that are not quoted in an active market. These financial assets are recognised initially at fair value, usually based on the transaction cost or face value. Subsequent measurement is at amortised cost using the effective interest method, less an allowance for any impairment of receivables. Any changes are recognised in the net result for the year when impaired, derecognised or through the amortisation process.
The Outstanding contributions receivable asset represents the future contributions receivable to pay total costs relating to outstanding claims. Reimbursements receivable are recognised as a separate asset when it is virtually certain that the reimbursement will be received if the Board settles the obligation and shall not exceed the amount of the related provision.
The cost of compensation claims and other costs of the Board are recovered from insurers who pass this cost on to employers through a levy included in their workers’ compensation insurance premiums in accordance with sections 6(6) and 6(7D) of the Workers’ Compensation (Dust Diseases) Act 1942. The levies are assessed each year to ensure that the Board has sufficient funding for the coming year. This assessment gives the Board certainty that Outstanding contributions receivable will be recovered through future levies.
Short-term receivables with no stated interest rate are measured at the original invoice amount where the effect of discounting is immaterial.
xi. Investments
In mid-2014 the investment approach of the Board changed to adopt a more active trading approach to better match the liabilities of the Board with its investments. As part of this the types of investments used was expanded.
As a result of this change the investment portfolio is viewed as held for trading. Accordingly all investments are now viewed as current assets whereas in the prior year the assets were classified into current or non-current based on the maturity profile of the investment and when it was likely to be converted into cash. This change is viewed as a change in investment strategy rather than a change in accounting policy. Accordingly prior year comparatives have not been adjusted.
The change in the nature of the investments has also meant that disclosures are now based on the investment type rather than the entity that the funds are invested in. Prior year’s comparatives which outlined the particular entity that funds were invested in have been adjusted to better reflect the type of investment which is considered to better meet the needs of users of the financial statements.
Investments are initially recognised at fair value. Investments are subsequently measured “at fair value through profit or loss”. Gains or losses on these assets are recognised in the Statement of Comprehensive Income.
This treatment is adopted as investments and other financial assets are held primarily for the purpose of being traded and accordingly are classified as current assets. All of the Board’s financial assets and financial liabilities are at fair value through profit or loss – classified as held for trading.
Purchases and sales of investments are recognised on trade date – the date on which the Board commits to purchase or sell the asset.
The fair values of quoted investments are based on current bid prices. If the market for a financial asset is not active (and for unlisted securities), the Board establishes fair value by using various valuation techniques. These include the use of recent arm’s length transactions, reference to other instruments that are substantially the same, discounted cash flow analysis, and option pricing models: making maximum use of market inputs and relying as little as possible on entity-specific inputs.
The fair value of financial instruments traded in active markets (such as publicly traded derivatives, and trading and available-for-sale securities) is based on quoted market prices at the Statement of Financial Position date. The quoted market price used for financial assets held by the Board is the current bid price; the appropriate quoted market price for financial liabilities is the current ask price without any deduction for transaction costs.
The fair value of financial instruments that are not traded in an active market (for example, over-the-counter derivatives) is determined using valuation techniques. The Board uses a variety of methods and makes assumptions that are based on market conditions existing at each balance date. Quoted market prices or dealer quotes for similar instruments are used for long-term debt instruments held. Other techniques, such as estimated discounted cash flows, are used to determine fair value for the remaining financial instruments. The fair value of interest-rate swaps is calculated as the present value of the estimated future cash flows. The fair value of forward exchange contracts is determined using forward exchange market rates at the Statement of Financial Position date.
The nominal value less estimated credit adjustments of trade receivables and payables are assumed to approximate their fair values. The fair value of financial liabilities for disclosure purposes is estimated by discounting the future contractual cash flows at the current market interest rate that is available to the Board for similar financial instruments.

54 NOTES TO THE FINANCIAL STATEMENTS
FINANCIAL STATEMENTS FOR THE YEAR ENDED 30 JUNE 2015Workers’ Compensation (Dust Diseases) Board
54
NOTES TO THE FINANCIAL STATEMENTS
1. SUMMARY OF SIGNIFICANT ACCOUNTING POLICIES (CONTINUED)
h. Assets (continued)
xi. Investments (continued)
Fair value of financial instruments
Where the fair values of financial assets and financial liabilities recorded on the Statement of Financial Position cannot be derived from active markets, they are determined using a variety of valuation techniques that include the use of mathematical models. The input to these models is taken from observable markets where possible, but where this is not feasible a degree of judgment is required in establishing fair values. The judgments include considerations of liquidity and model inputs such as correlation and volatility for longer dated derivatives.
Derivatives recorded at fair value through profit or loss
Derivatives include interest rate swaps and futures, credit default swaps, cross currency swaps and forward foreign currency contracts, and options on interest rates, foreign currencies and equities. Derivatives are recorded at fair value and carried as assets when their fair value is positive and as liabilities when their fair value is negative. Derivative financial instruments are subsequently re-measured at fair value.
Financial assets or financial liabilities designated at fair value through profit and loss
Financial assets and financial liabilities classified in this category are designated by management on initial recognition when the following criteria are met:
• The designation eliminates or significantly reduces the inconsistent treatment that would otherwise arise from measuring the assets or liabilities or recognising gains or losses on them on a different basis;
or,
• The asset and liabilities are part of a group of financial assets, financial liabilities or both which are managed and their performance evaluated on a fair value basis, in accordance with a documented risk management or investment strategy;
or,
• The financial instrument contains an embedded derivative that would otherwise need to be separately recorded.
Derivatives
Derivatives are initially recognised at fair value on the date a derivative contract is entered into and are subsequently marked to their fair value at each reporting date. The accounting for subsequent changes in fair value depends on whether the derivative is designated as a hedging instrument, and if so, the nature of the item being hedged. The Board designates certain derivatives as either; (1) hedges of the fair value of recognised assets or liabilities or a firm commitment (fair value hedge); or (2) hedges of the cash flows of recognised assets and liabilities and highly probable forecast transactions (cash flow hedges).
Hedging strategies are determined by the Investment Committee, within the investment strategy for the Board. The Board documents at the inception of the hedging transaction the relationship between hedging instruments and hedged items, as well as its risk management objective and strategy for undertaking various hedge transactions. The Board also documents its assessment, both at hedge inception and on an ongoing basis, of whether the derivatives that are used in hedging transactions have been and will continue to be highly effective in offsetting changes in fair values or cash flows of hedged items.
The fair values of any derivative financial instruments used for hedging purposes, if any, are disclosed in Note 20.
Investments in unlisted property trusts
The fair value of units in unlisted property trusts is the price at which the unit could be exchanged between knowledgeable, willing parties in an arms length transaction. A “willing seller” is not a forced seller prepared to sell at any price.
The fair values of investments in unlisted property trusts are based on valuations of the underlying properties in each Trust. The properties are valued in accordance with the valuation policies of the relevant managers.
These financial statements set out the fair value as at the end of the reporting period.
The Board seeks to manage exposure to investment risk so that it can generate sufficient returns to meet the scheme’s current and future liabilities and mitigate the risk that the assets will be insufficient to meet their liabilities. Designation of investments at fair value through profit or loss is consistent with this risk management strategy as it allows for these investments to be recorded at fair value and for any gains or losses in the movement in their fair value to be recognised in the net result for the year.
The movement in the fair value of the investments incorporates distributions received as well as unrealised movements in fair value and is reported in the line item ‘investment revenue’.
xii. Impairment of financial assets
All financial assets, except those measured at fair value through profit or loss, are subject to an annual review for impairment. An allowance for impairment is established when there is objective evidence that the Board will not be able to collect all amounts due.

55
FINANCIAL STATEMENTS FOR THE YEAR ENDED 30 JUNE 2015Workers’ Compensation (Dust Diseases) Board
WORKERS’ COMPENSATION (DUST DISEASES) BOARD 2014/15 ANNUAL REPORT 55
NOTES TO THE FINANCIAL STATEMENTS
1. SUMMARY OF SIGNIFICANT ACCOUNTING POLICIES (CONTINUED)
h. Assets (continued)
xiii. Derecognition of financial assets and financial liabilities
A financial asset is derecognised when the contractual rights to the cash flows from the financial assets expire, or if the Board transfers the financial asset:
• where substantially all the risks and rewards have been transferred or
• where the Board has not transferred substantially all the risks and rewards, if the Board has not retained control.
Where the Board has neither transferred nor retained substantially all the risks and rewards or transferred control, the asset is recognised to the extent of the Board’s continuing involvement in the asset.
A financial liability is derecognised when the obligation specified in the contract is discharged or cancelled or expires.
xiv. Other assets
Other assets are recognised on a historic cost basis.
i. Liabilities
i. Payables
These amounts represent liabilities for goods and services provided to the Board and other amounts. Payables are recognised initially at fair value, usually based on the transaction cost or face value. Subsequent measurement is at amortised cost using the effective interest method. Short-term payables with no stated interest rate are measured at the original invoice amount where the effect of discounting is immaterial.
ii. Personnel services and other provisions
The Board receives personnel services from the Office of Finance and Services (OFS)
a. Salaries and wages, annual leave, sick leave and on-costs
Salaries and wages (including non-monetary benefits) and paid sick leave that are expected to be settled wholly within 12 months after the end of the period in which the employees render the service are recognised and measured at the undiscounted amounts of the benefits.
Annual leave is not expected to be settled wholly before twelve months after the end of the annual reporting period in which the employees render the related service. As such it is required to be measured at present value in accordance with AASB 119 Employee Benefits (although short-cut methods are permitted). Actuarial advice obtained by NSW Treasury has confirmed that the use of an approach using nominal annual leave plus annual leave on the nominal liability (using 7.9% of the nominal value of annual leave) can be used to approximate the present value of the annual leave liability. The Board has assessed the actuarial advice based on its circumstances and has determined that the effect of discounting is immaterial on its annual leave liability.
Unused non-vesting sick leave does not give rise to a liability as it is not considered probable that sick leave taken in the future will be greater than the benefits accrued in the future.
b. Long service leave and superannuation
The Board’s liability for long service leave is recognised in the provision for personnel services and measured as the present value of expected future payments to be made in respect of personnel services received up to the reporting date. Consideration is given to salary levels, long service leave balance, assumed rates of taking leave in service, rates of death, disablement, retirement, and resignation, and rates of salary escalation.
Expected future payments (over twelve months) are discounted using markets yields at the reporting date on national government bonds with terms to maturity and currency that match, as closely as possible, the estimated future cash outflows. The calculation is performed by a qualified actuary. The discount rate used is 3.0% (2014: 3.50%).
Superannuation is actuarially assessed prior to each reporting date and is measured at the present value of the estimated future payments. The amount recognised is the net total of the present value of the defined benefit obligation at the reporting date, minus the fair value at that date of any plan assets out of which the obligation is to be settled directly.
The actuarial assessment of superannuation uses the Projected Unit Credit Method and reflects estimated future salary increases and the benefits set out in the terms of the plan. The liabilities are discounted using the market yield rate on government bonds of similar maturity to those obligations. Actuarial assumptions are unbiased and mutually compatible and financial assumptions are based on market experience for the period over which the obligations are to be settled.
c. Consequential on-costs
Consequential costs to employment are recognised as liabilities and expenses where the employee benefits to which they relate have been recognised. This includes outstanding amounts of payroll tax, workers’ compensation insurance premiums and fringe benefits tax.
iii. Restoration provision (building leases)
Restoration provision is recognised for the estimate of future payments for restoration upon the termination of the lease of its office premises in Broken Hill.

56 NOTES TO THE FINANCIAL STATEMENTS
FINANCIAL STATEMENTS FOR THE YEAR ENDED 30 JUNE 2015Workers’ Compensation (Dust Diseases) Board
56
NOTES TO THE FINANCIAL STATEMENTS
1. SUMMARY OF SIGNIFICANT ACCOUNTING POLICIES (CONTINUED)
i. Liabilities (continued)
iv. Provision for compensation payable
Provision for compensation payable includes actuarially assessed costs of claims made and an actuarially assessed estimate for claims yet to be made.
The outstanding amounts on known claims are calculated using a combination of actuarial functions called annuity and assurance functions.
The estimate for claims yet to be made uses an extension of the methodology used for known claims. However assumptions are required regarding both the number of future claims and the characteristics of the claims to enable annuity and assurance functions to be used.
The actuarial valuation of the Outstanding claims liability consists of current and future costs relating to administering the Act as stated under section 6(2), which specifically include:
• compensation payable
• fees payable to the members of the Board
• cost of personnel services obtained by the Board from Office of Financial Services
• fees payable to the Medical Board
• costs involved in reimbursing workers under section 9A - travel expenses associated with medical examinations
• costs of operation of the District Court relating to appeals under section 8I
• costs of administering the Act and any other money that the Board is required to pay under the Act
• costs relating to medical or related treatment or hospital treatment or occupational rehabilitation service or ambulance service as under section 8.2(d) and reasonable funeral expenses under section 8(2A)
• compensation recoveries under section 8E
The total actual costs incurred on the above payments net of section 8E recoveries during each year is offset against the provision for compensation payable. The resulting movement in provision is taken to the Statement of Comprehensive Income. Refer to Note 2(f) and Note 3(d) for more details.
j. Fair value hierarchy
A number of the Board’s accounting policies and disclosures require the measurement of fair values, for both financial and non-financial assets and liabilities. When measuring fair value, the valuation technique used maximises the use of relevant observable inputs and minimises the use of unobservable inputs. Under AASB 13, the Board categorises, for disclosure purposes, the valuation techniques based on the inputs used in the valuation techniques as follows:
• Level 1 – quoted prices in active markets for identical assets / liabilities that the entity can access at the measurement date.
• Level 2 – inputs other than quoted prices included within Level 1 that are observable, either directly or indirectly.
• Level 3 – inputs that are not based on observable market data (unobservable inputs).
The Board recognises transfers between levels of the fair value hierarchy at the end of the reporting period during which the change has occurred. Refer Note 11 and Note 20 for further disclosures regarding fair value measurements of financial and non-financial assets.
k. Equity and reserves
Asset Revaluation surplus
The revaluation surplus is used to record increments and decrements on the revaluation of non-current assets. This accords with the Board’s policy on the revaluation of property, plant and equipment as discussed in note 1(h)(iii).
Accumulated funds
The category ‘Accumulated Funds’ includes all current and prior period retained funds.
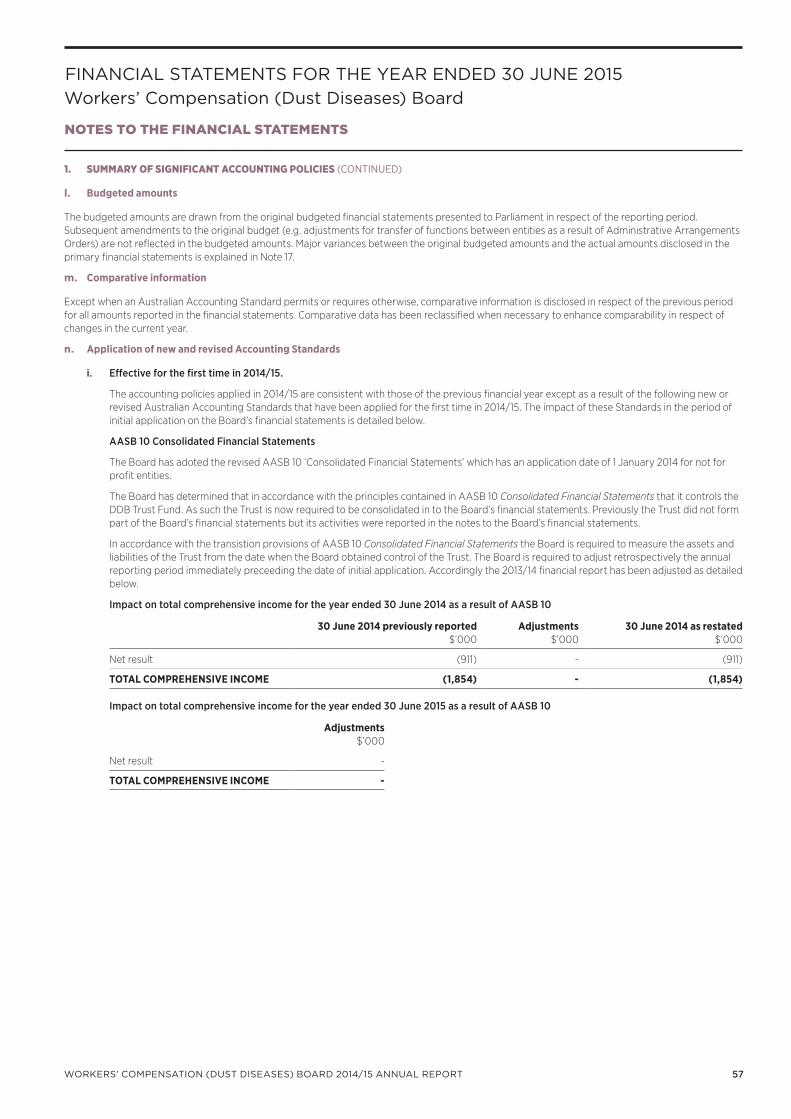
57
FINANCIAL STATEMENTS FOR THE YEAR ENDED 30 JUNE 2015Workers’ Compensation (Dust Diseases) Board
WORKERS’ COMPENSATION (DUST DISEASES) BOARD 2014/15 ANNUAL REPORT 57
NOTES TO THE FINANCIAL STATEMENTS
1. SUMMARY OF SIGNIFICANT ACCOUNTING POLICIES (CONTINUED)
l. Budgeted amounts
The budgeted amounts are drawn from the original budgeted financial statements presented to Parliament in respect of the reporting period. Subsequent amendments to the original budget (e.g. adjustments for transfer of functions between entities as a result of Administrative Arrangements Orders) are not reflected in the budgeted amounts. Major variances between the original budgeted amounts and the actual amounts disclosed in the primary financial statements is explained in Note 17.
m. Comparative information
Except when an Australian Accounting Standard permits or requires otherwise, comparative information is disclosed in respect of the previous period for all amounts reported in the financial statements. Comparative data has been reclassified when necessary to enhance comparability in respect of changes in the current year.
n. Application of new and revised Accounting Standards
i. Effective for the first time in 2014/15.
The accounting policies applied in 2014/15 are consistent with those of the previous financial year except as a result of the following new or revised Australian Accounting Standards that have been applied for the first time in 2014/15. The impact of these Standards in the period of initial application on the Board’s financial statements is detailed below.
AASB 10 Consolidated Financial Statements
The Board has adoted the revised AASB 10 ‘Consolidated Financial Statements’ which has an application date of 1 January 2014 for not for profit entities.
The Board has determined that in accordance with the principles contained in AASB 10 Consolidated Financial Statements that it controls the DDB Trust Fund. As such the Trust is now required to be consolidated in to the Board’s financial statements. Previously the Trust did not form part of the Board’s financial statements but its activities were reported in the notes to the Board’s financial statements.
In accordance with the transistion provisions of AASB 10 Consolidated Financial Statements the Board is required to measure the assets and liabilities of the Trust from the date when the Board obtained control of the Trust. The Board is required to adjust retrospectively the annual reporting period immediately preceeding the date of initial application. Accordingly the 2013/14 financial report has been adjusted as detailed below.
Impact on total comprehensive income for the year ended 30 June 2014 as a result of AASB 10
30 June 2014 previously reported $’000
Adjustments $’000
30 June 2014 as restated $’000
Net result (911) - (911)
TOTAL COMPREHENSIVE INCOME (1,854) - (1,854)
Impact on total comprehensive income for the year ended 30 June 2015 as a result of AASB 10
Adjustments $’000
Net result -
TOTAL COMPREHENSIVE INCOME -

58 NOTES TO THE FINANCIAL STATEMENTS
FINANCIAL STATEMENTS FOR THE YEAR ENDED 30 JUNE 2015Workers’ Compensation (Dust Diseases) Board
58
NOTES TO THE FINANCIAL STATEMENTS
1. SUMMARY OF SIGNIFICANT ACCOUNTING POLICIES (CONTINUED)
n. Application of new and revised Accounting Standards (continued)
Impact on assets, liabilities and equity as at 30 June 2014 as a result of AASB 10
As at 30 June 2014 as previously reported
$’000Adjustments
$’000
As at 30 June 2014 as restated
$’000
Current assets
Cash and cash equivalents 38,845 51,237 90,082
Total Current assets 243,683 51,237 294,920
Total assets 2,067,003 51,237 2,118,240
Current liabilities
Payable to beneficiaries - 51,237 51,237
Total Current liabilities 111,851 51,237 163,088
TOTAL LIABILITIES 2,059,753 51,237 2,110,990
NET ASSETS 7,250 - 7,250
EQUITY
Accumulated funds 5,985 - 5,985
TOTAL EQUITY 7,250 - 7,250
Impact on assets, liabilities and equity as at 30 June 2015 as a result of AASB 10
Adjustments $’000
Current assets
Cash and cash equivalents -
Total Current assets -
TOTAL ASSETS -
Current liabilities
Payable to beneficiaries -
Total Current liabilities -
TOTAL LIABILITIES -
NET ASSETS -
EQUITY
Accumulated funds -
TOTAL EQUITY -
The amounts previously held in the Trust were paid in full to the beneficiaries during 2014/15. Accordingly there is no impact on the 30 June 2015 financial statements. Refer note 19.

59
FINANCIAL STATEMENTS FOR THE YEAR ENDED 30 JUNE 2015Workers’ Compensation (Dust Diseases) Board
WORKERS’ COMPENSATION (DUST DISEASES) BOARD 2014/15 ANNUAL REPORT 59
NOTES TO THE FINANCIAL STATEMENTS
1. SUMMARY OF SIGNIFICANT ACCOUNTING POLICIES (CONTINUED)
n. Application of new and revised Accounting Standards (continued)
ii. Application of new and revised Accounting Standards issued but not yet effective
NSW public sector entities are not permitted to early adopt new Australian Accounting Standards, unless Treasury determines otherwise.
The following new Australian Accounting Standards have not been applied and are not yet effective:
• AASB 9, AASB 2010-7, AASB 213-9 (Part C), AASB 2014-1 (Part E), AASB 2014-7 and AASB 2014-8 regarding financial instruments
• AASB 15 and AASB 2014-5 regarding Revenue from Contracts with Customers
• AASB 2015-1 regarding annual improvements to Australian Accounting Standards 2012-2014 cycle
• AASB 2015-2 regarding amendments to AASB 101 disclosure initiatives
• AASB 2015-3 regarding materiality.
These new Standards will not have any direct impact on the financial performance or position of the Board.
AASB 9 Financial Instruments and its associated amending standards specify new recognition and measurement requirements for financial assets and financial liabilities within the scope of AASB 139 Financial Instruments: Recognition and Measurement.
The Board already values its financial assets and financial liabilities at fair value through profit or loss. Therefore when applied, the only material impact of these standards will be on the presentation of the financial statements and disclosures in the notes.
The remaining standards are concerned with disclosures and will have no direct impact on the Boards’s financial results.
2. EXPENSES EXCLUDING LOSSES
2015 $’000
2014 $’000
a. Personnel services
Salaries and wages (including annual leave) 3,176 3,251
Superannuation – defined contribution plans 298 273
Superannuation – defined benefit plans (including actuarial (gains)/losses) 50 (28)
Long service leave 78 265
Workers’ compensation insurance 17 26
Payroll tax and fringe benefits tax 157 156
Agency short-term staff 240 63
4,016 4,006
b. Other operating expenses
i. Administration and office expenses
Auditor’s remuneration – audit of the financial statements 70 84
Auditor’s remuneration – internal audit and reviews 7 38
Bad debts 31 4
Board members’ fees and allowances 90 90
Buildings maintenance, repairs and management 118 153
Consultants – actuarial 153 242
Consultants – other 90 107
Contractors 227 284
Insurance 21 28
Investment management fees 1,578 764
Legal fees 87 37
Operating lease: minimum lease payments 18 18

60 NOTES TO THE FINANCIAL STATEMENTS
FINANCIAL STATEMENTS FOR THE YEAR ENDED 30 JUNE 2015Workers’ Compensation (Dust Diseases) Board
60
NOTES TO THE FINANCIAL STATEMENTS
2. EXPENSES EXCLUDING LOSSES (CONTINUED)
2015 $’000
2014 $’000
b. Other operating expenses (continued)
1. Administration and office expenses (continued)
• Service partnership agreement fees 1,392 1,008
• Other 793 761
4,675 3,618
c. Depreciation and amortisation
Depreciation
• Buildings 137 162
• Motor vehicles 67 66
• Office equipment 1 -
• Science and medical equipment 44 74
249 302
Amortisation
• Computer software - -
249 302
d. Grants and subsidies
Dust Diseases Tribunal funding 5,258 5,356
Research projects and provision of advice 74 413
5,332 5,769
e. Finance costs
Unwinding of discount rate 40,800 97,200
Finance costs relate to movement in the carrying amount of the outstanding liability that reflects the passage of time associated with the use of discount rate determining the value of the outstanding claims liability (Refer Note 14).
f. Other expenses
i. Compensation payments made during the year
• Compensation to workers 18,698 17,867
• Compensation to dependants 34,865 33,738
• Lump sum awards to dependants 27,656 26,988
• Healthcare services and funeral benefits 9,050 9,082
90,269 87,675
ii. Medical examination of workers
• Medical fees and other related supplies 912 1,116
• Workers travelling expenses 23 26
935 1,142
iii. Movement in provision for compensation excluding finance cost (Refer note 14)
• Movement in provision for compensation - known claims (96,600) 109,590
• Movement in provision for compensation - estimated future claims (148,700) 170,417
Total net movement during the year excluding finance cost (245,300) 280,007
TOTAL OTHER EXPENSES/(REVENUE) (154,096) 368,824

61
FINANCIAL STATEMENTS FOR THE YEAR ENDED 30 JUNE 2015Workers’ Compensation (Dust Diseases) Board
WORKERS’ COMPENSATION (DUST DISEASES) BOARD 2014/15 ANNUAL REPORT 61
NOTES TO THE FINANCIAL STATEMENTS
3. REVENUE
2015 $’000
2014 $’000
a. Sale of goods and services
Rendering of services – Occupational respiratory health assessment 496 557
TOTAL SALE OF GOODS AND SERVICES 496 557
b. Investment revenue
Interest revenue from bank interest and TCorp Hour Glass cash facility 977 295
TCorp Hour-Glass investment facilities 43,553 49,021
TCorp Fixed/Variable Interest discrete portfolio 28,189 6,605
Other financial assets designated at fair value through profit or loss 26,543 63,719
TOTAL INVESTMENT REVENUE 99,262 119,640
c. Retained taxes, fees and fines
Levy contributions
Self-insurer – NSW Self Insurance Corporation 11,416 8,944
Specialised insurer and other self insurers 13,142 11,505
Workers Compensation Nominal Insurer 80,745 78,082
Total levy contributions 105,303 98,531
TOTAL RETAINED TAXES, FEES AND FINES 105,303 98,531
d. Other revenue
Compensation recoveries under Section 8E 2,055 2,323
Movement in outstanding contributions (303,763) 257,567
Solicitors’ production fees 30 30
TOTAL OTHER REVENUE/(EXPENSES) (301,678) 259,920
4. LOSS ON DISPOSAL
Loss on disposal of property, plant and equipment (26) -
5. OTHER GAINS/(LOSSES)
Decrease/(Increase) of allowance for impairment of receivables (62) 160

62 NOTES TO THE FINANCIAL STATEMENTS
FINANCIAL STATEMENTS FOR THE YEAR ENDED 30 JUNE 2015Workers’ Compensation (Dust Diseases) Board
62
NOTES TO THE FINANCIAL STATEMENTS
6. CURRENT ASSETS – CASH AND CASH EQUIVALENTS
2015 $’000
2014 $’000
Cash at bank and on hand 2 63,097
Short-term deposits:
TCorp Hour-Glass investment – Cash facility 18,698 7,878
Cash – Other Deposits at TCorp 41,029 -
Cash – Other 7,022 19,107
66,751 90,082
For the purposes of the Statement of cash flows, cash and cash equivalents includes cash at bank, cash on hand, term deposits of less than 12 months duration and bank overdraft.
Cash and cash equivalent assets recognised in the Statement of financial position are reconciled at the end of the financial year to the Statement of cash flows as follows:
Cash and cash equivalent assets (per Statement of financial position) 66,751 90,082
Bank Overdraft (per Statement of financial position) (135) -
66,616 90,082
Closing cash and cash equivalents (per Statement of cash flows) 66,616 90,082
Refer to Note 20 for further information regarding credit risk, liquidity risk and market risk arising from financial instruments.
7. CURRENT/NON-CURRENT ASSETS – RECEIVABLES
Current
Sale of goods and services 114 157
Other receivables 4,309 3,677
less: Allowance for impairment (344) (282)
Retained taxes, fees and fines - 793
Prepayments 213 32
GST receivable 107 61
Interest receivable 336 -
Investments receivable 4,075 -
Debtors – workers and dependants 60 72
Contributions from insurers 87,110 107,133
95,980 111,643
Non-current
Contributions from insurers yet to be levied 740,649 1,024,389
Total Receivables 836,629 1,136,032
Movement in the allowance for impairment
Balance at 1 July 282 442
Increase/(decrease) in allowance recognised in profit or loss 62 (160)
BALANCE AT 30 JUNE 344 282
Details regarding credit risk, liquidity risk and market risk, including financial assets that are either past due or impaired, are disclosed in Note 20.

63
FINANCIAL STATEMENTS FOR THE YEAR ENDED 30 JUNE 2015Workers’ Compensation (Dust Diseases) Board
WORKERS’ COMPENSATION (DUST DISEASES) BOARD 2014/15 ANNUAL REPORT 63
NOTES TO THE FINANCIAL STATEMENTS
8. CURRENT/NON-CURRENT ASSETS – FINANCIAL ASSETS AT FAIR VALUE
2015 $’000
2014 $’000
Current
TCorp Hour-Glass Facilities 278,768 3,981
TCorp Fixed/Variable Interest discrete portfolio 391,188 -
Australian and International Equities 241,861 -
Derivatives 8,198 -
Other Investments 42,505 89,214
962,520 93,195
Non-current
TCorp Fixed/Variable Interest discrete portfolio - 238,971
TCorp Hour-Glass Facilities - 288,591
Other Investments - 266,434
- 793,996
TOTAL FINANCIAL ASSETS AT FAIR VALUE 962,520 887,191
Refer to Note 20 for further information regarding credit risk, liquidity risk and market risk arising from financial instruments.

64 NOTES TO THE FINANCIAL STATEMENTS
FINANCIAL STATEMENTS FOR THE YEAR ENDED 30 JUNE 2015Workers’ Compensation (Dust Diseases) Board
64
NOTES TO THE FINANCIAL STATEMENTS
9. NON-CURRENT ASSETS – PROPERTY, PLANT AND EQUIPMENT
Buildings $’000
Motor Vehicles $’000
Office Equipment $’000
Scientific and Medical Equipment
$’000Total
$’000
At 1 July 2014 – fair value
Gross carrying amount 4,432 661 10 972 6,075
Accumulated depreciation and impairment (24) (297) (10) (809) (1,140)
Net carrying amount 4,408 364 - 163 4,935
At 30 June 2015 – fair value
Gross carrying amount 4,432 661 20 95 5,208
Accumulated depreciation and impairment (161) (364) (11) (2) (538)
Net carrying amount 4,271 297 9 93 4,670
Reconciliation
A reconciliation of the carrying amount of each class of property, plant and equipment at the beginning and end of the current reporting period is set out below:
Year ended 30 June 2015
Net carrying amount at start of financial year 4,408 364 - 163 4,935
Additions - - 10 - 10
Net revaluation decrement - - - (26) (26)
Depreciation expense (137) (67) (1) (44) (249)
Net carrying amount at end of financial year 4,271 297 9 93 4,670
At 1 July 2013 – fair value
Gross carrying amount 5,847 661 10 885 7,403
Accumulated depreciation and impairment (334) (231) (10) (742) (1,317)
Net carrying amount 5,513 430 - 143 6,086
At 30 June 2014 – fair value
Gross carrying amount 4,432 661 10 972 6,075
Accumulated depreciation and impairment (24) (297) (10) (809) (1,140)
Net carrying amount 4,408 364 - 163 4,935
Reconciliation
A reconciliation of the carrying amount of each class of property, plant and equipment at the beginning and end of the prior reporting period is set out below:
Year ended 30 June 2014
Net carrying amount at start of financial year 5,513 430 - 143 6,086
Additions - - - 94 94
Net revaluation decrement (943) - - - (943)
Depreciation expense (162) (66) - (74) (302)
Net carrying amount at end of financial year 4,408 364 - 163 4,935
Further details regarding the fair value measurement of property, plant and equipment are disclosed in Note 11.
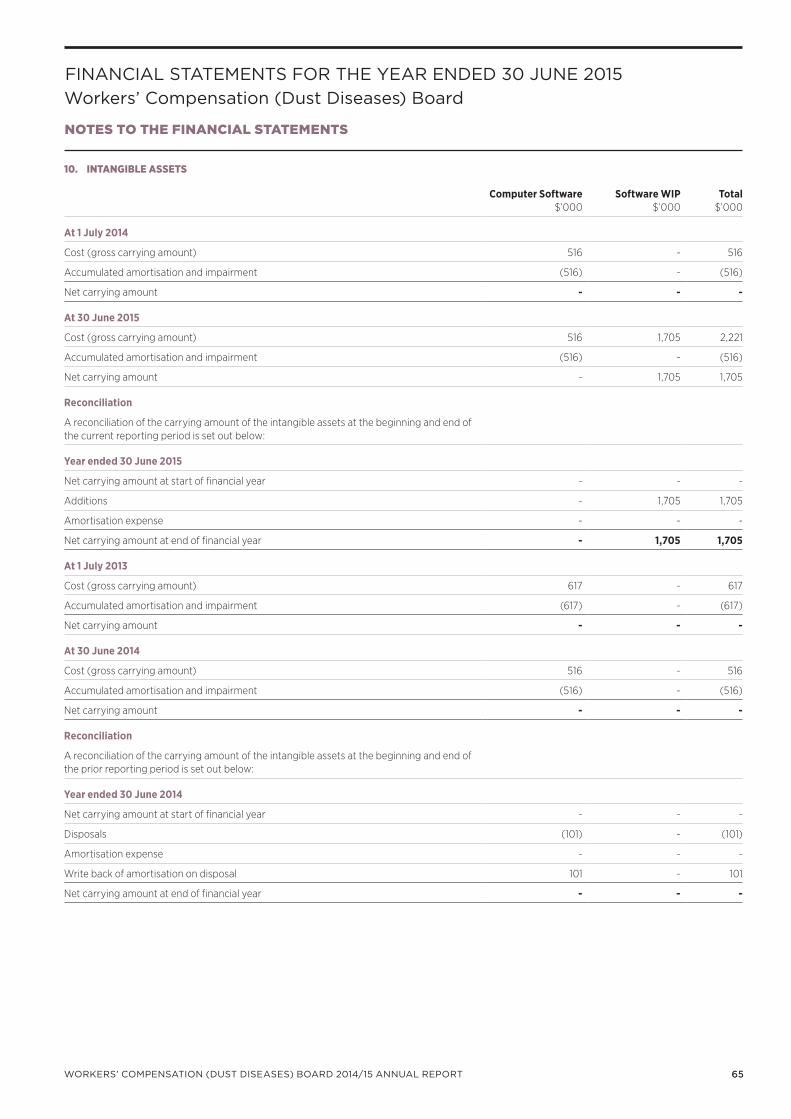
65
FINANCIAL STATEMENTS FOR THE YEAR ENDED 30 JUNE 2015Workers’ Compensation (Dust Diseases) Board
WORKERS’ COMPENSATION (DUST DISEASES) BOARD 2014/15 ANNUAL REPORT 65
NOTES TO THE FINANCIAL STATEMENTS
10. INTANGIBLE ASSETS
Computer Software $’000
Software WIP $’000
Total $’000
At 1 July 2014
Cost (gross carrying amount) 516 - 516
Accumulated amortisation and impairment (516) - (516)
Net carrying amount - - -
At 30 June 2015
Cost (gross carrying amount) 516 1,705 2,221
Accumulated amortisation and impairment (516) - (516)
Net carrying amount - 1,705 1,705
Reconciliation
A reconciliation of the carrying amount of the intangible assets at the beginning and end of the current reporting period is set out below:
Year ended 30 June 2015
Net carrying amount at start of financial year - - -
Additions - 1,705 1,705
Amortisation expense - - -
Net carrying amount at end of financial year - 1,705 1,705
At 1 July 2013
Cost (gross carrying amount) 617 - 617
Accumulated amortisation and impairment (617) - (617)
Net carrying amount - - -
At 30 June 2014
Cost (gross carrying amount) 516 - 516
Accumulated amortisation and impairment (516) - (516)
Net carrying amount - - -
Reconciliation
A reconciliation of the carrying amount of the intangible assets at the beginning and end of the prior reporting period is set out below:
Year ended 30 June 2014
Net carrying amount at start of financial year - - -
Disposals (101) - (101)
Amortisation expense - - -
Write back of amortisation on disposal 101 - 101
Net carrying amount at end of financial year - - -

66 NOTES TO THE FINANCIAL STATEMENTS
FINANCIAL STATEMENTS FOR THE YEAR ENDED 30 JUNE 2015Workers’ Compensation (Dust Diseases) Board
66
NOTES TO THE FINANCIAL STATEMENTS
11. FAIR VALUE MEASUREMENT OF NON-FINANCIAL ASSETS
a. Fair value hierarchy
Level 1 $’000
Level 2 $’000
Level 3 $’000
Total Fair value $’000
2015
Property, plant and equipment (Note 9)
Buildings - 4,271 - 4,271
Scientific and medical equipment - 93 - 93
- 4,364 - 4,364
2014
Property, plant and equipment (Note 9)
Buildings - 4,408 - 4,408
Scientific and medical equipment - 163 - 163
- 4,571 - 4,571
There were no transfers between Level 1 or 2 during the period.
b. Valuation techniques, inputs and processes
Buildings and Scientific and Medical equipment are measured using the market approach. The valuation model is based on market data of similar assets.
All of the Board’s other assets are non specialised and are also measured using the market approach. NSW Treasury Policy paper 14-01 Valuation of Physical Non-Current Assets at Fair Value allows non-specialised assets with short useful lives to be recognised at depreciated historical cost as a surrogate for fair value. Depreciated historical cost is an appropriate surrogate for fair value because any difference between fair value and depreciated historical cost is unlikely to be material and the benefit of ascertaining a more accurate fair value does not justify the additional cost of obtaining it.
NSW Treasury have advised that assets measured using depreciated historical cost as a surrogate for fair value do not require fair value hierachy disclosures under AASB 13 Fair Value Measurement.
12. CURRENT LIABILITIES – PAYABLES
2015 $’000
2014 $’000
Creditors 78 79
Beneficiaries benefits - 51,237
Accrued expenses and other creditors 4,012 7,199
Accrued salaries, wages and on-costs 97 89
Investments payable 10,526 -
14,713 58,604
Refer to Note 20 for further information regarding credit risk, liquidity risk, and market risk, including a maturity analysis of the above payables.
13. CURRENT LIABILITIES – BORROWINGS
Bank Overdraft 135 -
135 -
Refer to Note 20 for further information regarding credit risk, liquidity risk, and market risk, including a maturity analysis of the above payables.

67
FINANCIAL STATEMENTS FOR THE YEAR ENDED 30 JUNE 2015Workers’ Compensation (Dust Diseases) Board
WORKERS’ COMPENSATION (DUST DISEASES) BOARD 2014/15 ANNUAL REPORT 67
NOTES TO THE FINANCIAL STATEMENTS
14. CURRENT/NON-CURRENT LIABILITIES – PROVISIONS
2015 $’000
2014 $’000
CURRENT
Personnel services and related on-costs
Annual leave 257 350
Long service leave 1,268 1,234
1,525 1,584
Other provisions
Provision for compensation – known claims 82,800 81,400
Provision for compensation – estimated future claims 21,000 21,500
103,800 102,900
TOTAL CURRENT PROVISIONS 105,325 104,484
It is expected that the current leave provisions and related on-costs will be settled over the following period:
Expected to be settled no more than twelve months
Annual leave and related on-costs 257 350
Long service leave and related on-costs 60 52
317 402
Expected to be settled after more than twelve months
Long service leave and related on-costs 1,208 1,182
NON-CURRENT
Personnel services and related on-costs
Long service leave 32 47
Superannuation 899 853
931 900
Other provisions
Restoration cost 2 2
Provision for compensation – known claims 690,400 771,300
Provision for compensation – estimated future claims 1,051,200 1,175,700
1,741,602 1,947,002
Total non-current provisions 1,742,533 1,947,902
TOTAL PROVISIONS 1,847,858 2,052,386
Aggregate employee benefits and related on-costs
Provisions - Current 1,525 1,584
Provisions - Non-Current 931 900
Accrued salaries, wages and on-costs (Note 12) 97 89
2,553 2,573
Provision for compensation payments and estimated compensation for future claims
Under the Workers’ Compensation (Dust Diseases) Act 1942, the Board provides a no-fault compensation scheme to people who have developed a dust disease from occupational exposure to dust as a worker in NSW. The scheme covers a variety of workers such as stonemasons, quarrymen, rock choppers, sewer miners as well as those caused by exposure to asbestos. At 30 June 2015, liabilities for compensation payments and estimated compensation for future claims were valued by the actuaries Taylor Fry Proprietary Limited.

68 NOTES TO THE FINANCIAL STATEMENTS
FINANCIAL STATEMENTS FOR THE YEAR ENDED 30 JUNE 2015Workers’ Compensation (Dust Diseases) Board
68
NOTES TO THE FINANCIAL STATEMENTS
14. CURRENT/NON-CURRENT LIABILITIES – PROVISIONS (CONTINUED)
The liability for compensation payments and estimated compensation for future claims are measured as the present value of the expected future payments. The present values after discounting are as follow:
2015 $’000
2014 $’000
Not later than one year 103,800 102,900
Later than one year but not later than five years 381,400 386,800
Later than five years 1,360,200 1,560,200
TOTAL 1,845,400 2,049,900
Compensation will be funded by funds held in investments and by future levies. The financial target for the Board is to be fully funded for known claims, i.e. to have sufficient funds to pay the lifetime entitlements in respect of claims with a Certificate of Disablement issued. The Workers’ Compensation (Dust Diseases) Act 1942 gives the Board authority to impose levies on NSW Workers Compensation insurers each year to meet annual cash outflows.
The Board includes in its provision an estimate for compensation payable for claims yet to be made of $1,072,200 Thousand (2014: $1,197,200 Thousand). This figure is shown in the Statement of Financial Position as a liability with the corresponding Outstanding contributions receivable asset (net of cumulative surplus or deficit to date) representing the right to levy employers for these outstanding claims.
Movements in the provision for compensation during the financial year are set out below:
Carrying amount at start of financial year 2,049,900 1,672,693
Addition/ (Reduction) in provision (178,860) 168,225
Less: Personnel services - refer note 2(a) (4,016) (4,006)
Administration & office expenses - refer note 2(b)(i) (4,675) (3,618)
Compensation payments made during the year - refer note 2(f)(i) (90,269) (87,675)
Medical examination costs of workers - refer note 2(f)(ii) (935) (1,142)
Add: Compensation recoveries - refer note 3(d) 2,055 2,323
Change in discount rate 31,400 205,900
Finance cost (unwinding of discount - refer note 2(e)) 40,800 97,200
CARRYING AMOUNT AT END OF FINANCIAL YEAR 1,845,400 2,049,900
The liability brought to account is the amount recommended by the actuaries being their central estimate. The provision for compensation payable is measured at the present value of the expected future payments to persons who have accepted a claim for compensation or who are estimated by the actuaries to be entitled to compensation in the future.
The actuarial valuation contains numerous assumptions regarding the future numbers of claims and regarding the characteristics of the workers and their dependants particularly in respect to their age at time of report and their life expectancy.
Given the uncertainty of this portfolio a range of assumptions may be plausible which reflect the current environment in which claims are managed and settled. The main assumptions are:
• Inflation and discount rates
• Mortality
• Average disability
• Age distribution
• Dependant - Spouses
The actuaries, Taylor Fry Proprietary Limited, in the valuation of liability report dated 31 July 2015 have used actuarial functions (known as annuity and assurance functions) to estimate the compensation payable for claims yet to be lodged on an inflated and discounted basis, taking account of expected mortality and the known characteristics of each claimant.

69
FINANCIAL STATEMENTS FOR THE YEAR ENDED 30 JUNE 2015Workers’ Compensation (Dust Diseases) Board
WORKERS’ COMPENSATION (DUST DISEASES) BOARD 2014/15 ANNUAL REPORT 69
NOTES TO THE FINANCIAL STATEMENTS
14. CURRENT/NON-CURRENT LIABILITIES – PROVISIONS (CONTINUED)
The following inflation rates and discount rates were used in measuring the provision for compensation payable:
2015 %
2014 %
Compensation expected to be paid
Not later than one year
Wages inflation rate 3.00 3.50
Discount rate 1.96 2.47
Later than one year
Wages inflation rate * 2.80 3.16
Discount rate * 3.45 4.07
Note: * weighted average
Sensitivity analysis for the valuation as at 30 June 2015
The liability represents the best estimate and is based on standard actuarial assessment. The table below shows sensitivities to the valuation. If the Board was required to adopt a risk margin (similar to insurers) to increase the probability of adequacy of the outstanding claims valuation liability to 75% the outstanding claims liability would increase by $428.2m to $2,273.6m.
30 June Liability
$m
Effect on 30 June Liability
$m
Percentage Effect
%
Central estimate of the Board’s liability 1,845.4
All valuation assumptions used
Increase inflation by 1% at each year 2,111.2 265.8 14.4
Decrease discount rate by 1% at each year 2,112.0 266.5 14.4
Decrease discount rate by 1% but with long-term gap of 1.8% 1,904.7 59.3 3.2
Increase discount rate by 1% but with long-term gap of 1.8% 1,711.0 -134.4 -7.3
Increase superimposed inflation on medical benefits by 1% 1,863.7 18.3 1.0
Reduce superimposed inflation on medical benefits by 1% 1,830.1 -15.3 -0.8
Increase expected average lifetime disability by 5% 1,854.2 8.8 0.5
Decrease expected average lifetime disability by 5% 1,827.6 -17.9 -1.0
Increase the proportion of married workers by 5% 1,909.4 64.0 3.5
Decrease the proportion of married workers by 5% 1,781.4 -64.0 -3.5
Change expected lifetime improvements to be based on rate of improvement over last 125 years 1,810.8 -34.6 -1.9
Change Spouse mortality & withdrawn rate to be based on experience only 1,803.0 -42.5 -2.3
Remove marriage and children decrements 1,858.0 12.6 0.7
Increase number of future asbestosis claims by 20% 1,863.5 18.1 1.0
Increase number of future mesothelioma claims by 20% 2,032.2 186.8 10.1
Increase number of future other dust diseases claims by 20% 1,848.5 3.1 0.2

70 NOTES TO THE FINANCIAL STATEMENTS
FINANCIAL STATEMENTS FOR THE YEAR ENDED 30 JUNE 2015Workers’ Compensation (Dust Diseases) Board
70
NOTES TO THE FINANCIAL STATEMENTS
15. COMMITMENTS FOR EXPENDITURE
2015 $’000
2014 $’000
Operating lease commitments
Future non-cancellable operating lease rentals not provided for and payable:
Not later than one year - 25
Later than one year and not later than five years - -
Later than five years - -
TOTAL (INCLUDING GST) - 25
The Board leases office accommodation and motor vehicles under non-cancellable operating leases expiring within two years. The leases have varying terms, escalation clauses and renewal rights.
Expenditure commitments for the Board include input tax credits of $Nil (2014: $2,000) which are expected to be recoverable from the Australian Taxation Office.
16. CONTINGENT LIABILITIES AND CONTINGENT ASSETS
The Board has no contingent assets or liabilities.
17. BUDGET REVIEW
Net result
The net result is $2.3m favourable because other operating costs and scheme payments were slightly lower than the levy collections and recoveries.
Assets and liabilities
Net assets are comparable to budget
Cash flows
Total cash flows are $43.7m favourable to budget due to the reallocation of cash and investments under the strategic asset allocation
18. RECONCILIATION OF CASH FLOWS FROM OPERATING ACTIVITIES TO NET RESULT
2015 $’000
2014 $’000
Net cash used on operating activities (40,923) 109,920
Depreciation and amortisation (249) (302)
Loss on disposal (26) -
Investment income – market movements 88,050 (1,810)
Change in assets and liabilities
Increase/(Decrease) in receivables: Current (19,738) 5,087
Increase/(Decrease) in receivables: Non-current (283,740) 252,140
Decrease/(Increase) in payables: Current 54,417 11,439
Decrease/(Increase) in provisions: Current (841) 2,141
Decrease/(Increase) in provisions: Non-current 205,369 (379,526)
Net result 2,319 (911)

71
FINANCIAL STATEMENTS FOR THE YEAR ENDED 30 JUNE 2015Workers’ Compensation (Dust Diseases) Board
WORKERS’ COMPENSATION (DUST DISEASES) BOARD 2014/15 ANNUAL REPORT 71
NOTES TO THE FINANCIAL STATEMENTS
19. RESTRICTED ASSETS
Previously, the Board held cash at Westpac Banking Corporation which consists of lump sum awards made to beneficiaries of deceased workers. These assets and the corresponding payable to beneficiaries could not be used to meet the Board’s operational requirements.
In May 2015 the Board determined that the risk free earnings on funds in the beneficiaries bank account was below the Commonwealth Governments deemings rate or social security benefits and to ensure that beneficiaries were not adversly impacted paid the remaining balances in the bank account to the beneficiaries. This was completed prior to the end of June 2015.
The following is a summary of the transactions in the beneficiaries bank account:
2015 $’000
2014 $’000
Expenses excluding losses
Withdrawals 52,339 15,124
52,339 15,124
Revenue
Investment revenue and bank interest 1,102 1,856
1,102 1,856
REDUCTION IN BENEFICIARY AWARDS TO BE PAID (51,237) (13,268)
Assets
Cash at bank - 51,237
TOTAL ASSETS - 51,237
Liabilities
Payable to beneficiaries - 51,091
Undistributed investment revenue - 146
TOTAL LIABILITIES - 51,237
Reconciliation
Opening balance 51,237 64,505
Reduction in beneficiary awards to be paid (51,237) (13,268)
CLOSING BALANCE - 51,237
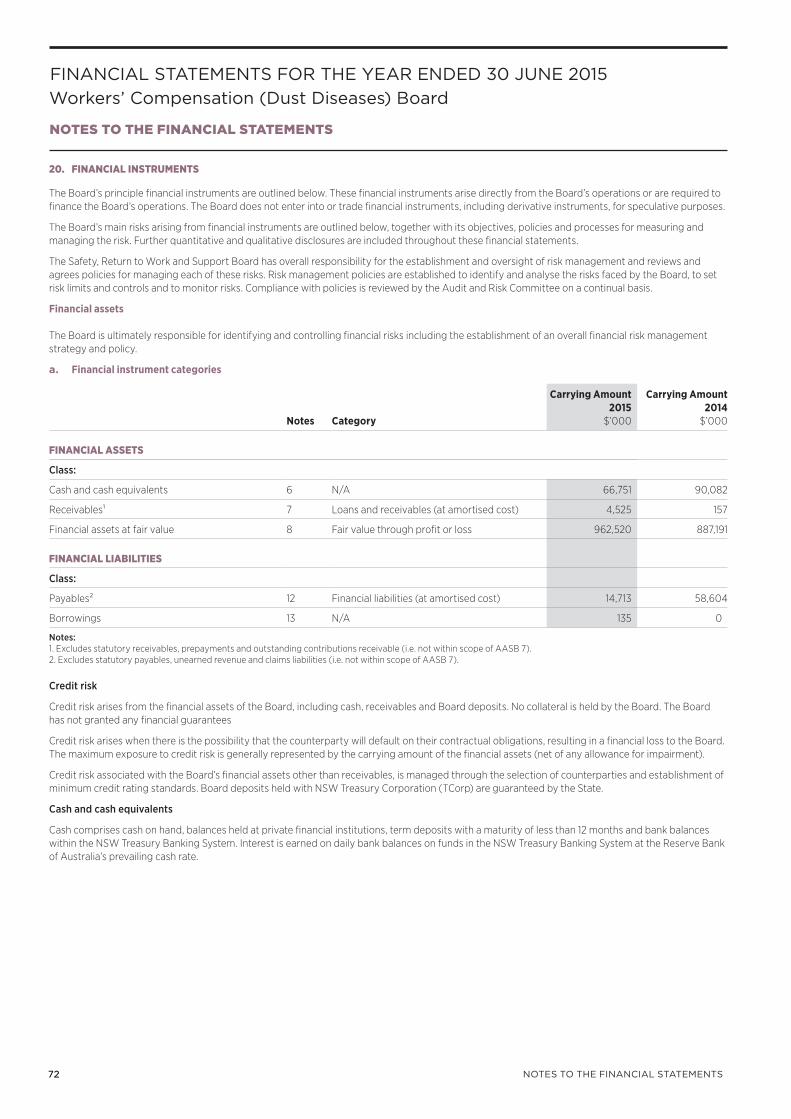
72 NOTES TO THE FINANCIAL STATEMENTS
FINANCIAL STATEMENTS FOR THE YEAR ENDED 30 JUNE 2015Workers’ Compensation (Dust Diseases) Board
72
NOTES TO THE FINANCIAL STATEMENTS
20. FINANCIAL INSTRUMENTS
The Board’s principle financial instruments are outlined below. These financial instruments arise directly from the Board’s operations or are required to finance the Board’s operations. The Board does not enter into or trade financial instruments, including derivative instruments, for speculative purposes.
The Board’s main risks arising from financial instruments are outlined below, together with its objectives, policies and processes for measuring and managing the risk. Further quantitative and qualitative disclosures are included throughout these financial statements.
The Safety, Return to Work and Support Board has overall responsibility for the establishment and oversight of risk management and reviews and agrees policies for managing each of these risks. Risk management policies are established to identify and analyse the risks faced by the Board, to set risk limits and controls and to monitor risks. Compliance with policies is reviewed by the Audit and Risk Committee on a continual basis.
Financial assets
The Board is ultimately responsible for identifying and controlling financial risks including the establishment of an overall financial risk management strategy and policy.
a. Financial instrument categories
Notes Category
Carrying Amount 2015
$’000
Carrying Amount 2014
$’000
FINANCIAL ASSETS
Class:
Cash and cash equivalents 6 N/A 66,751 90,082
Receivables¹ 7 Loans and receivables (at amortised cost) 4,525 157
Financial assets at fair value 8 Fair value through profit or loss 962,520 887,191
FINANCIAL LIABILITIES
Class:
Payables² 12 Financial liabilities (at amortised cost) 14,713 58,604
Borrowings 13 N/A 135 0
Notes:1. Excludes statutory receivables, prepayments and outstanding contributions receivable (i.e. not within scope of AASB 7).2. Excludes statutory payables, unearned revenue and claims liabilities (i.e. not within scope of AASB 7).
Credit risk
Credit risk arises from the financial assets of the Board, including cash, receivables and Board deposits. No collateral is held by the Board. The Board has not granted any financial guarantees
Credit risk arises when there is the possibility that the counterparty will default on their contractual obligations, resulting in a financial loss to the Board. The maximum exposure to credit risk is generally represented by the carrying amount of the financial assets (net of any allowance for impairment).
Credit risk associated with the Board’s financial assets other than receivables, is managed through the selection of counterparties and establishment of minimum credit rating standards. Board deposits held with NSW Treasury Corporation (TCorp) are guaranteed by the State.
Cash and cash equivalents
Cash comprises cash on hand, balances held at private financial institutions, term deposits with a maturity of less than 12 months and bank balances within the NSW Treasury Banking System. Interest is earned on daily bank balances on funds in the NSW Treasury Banking System at the Reserve Bank of Australia’s prevailing cash rate.

73
FINANCIAL STATEMENTS FOR THE YEAR ENDED 30 JUNE 2015Workers’ Compensation (Dust Diseases) Board
WORKERS’ COMPENSATION (DUST DISEASES) BOARD 2014/15 ANNUAL REPORT 73
NOTES TO THE FINANCIAL STATEMENTS
20. FINANCIAL INSTRUMENTS (CONTINUED)
a. Financial instrument categories (continued)
Receivable – trade debtors
All trade debtors are recognised as amounts receivable as at balance date. Collectability of trade debtors is reviewed on an ongoing basis. Procedures as established in the Treasurer’s Directions are followed to recover outstanding amounts, including letters of demand. Debts which are known as uncollectible are written off. An allowance for impairment is raised when there is objective evidence that the Board will not be able to collect all amounts due. This evidence includes past experience, and current and expected changes in economic conditions. There is no independently assessed rating of the clients other than past experience and their compliance with credit terms, these credit terms are monitored by management on a monthly basis. No interest is earned on trade debtors. Sales are made on 30 day terms.
The only financial assets that are past due are ‘sale of goods and services’ in the ‘receivables’ category of the Statement of financial position.
Receivables – trade debtorsTotal 1,2
$’000Past Due but not Impaired 1,2
$’000Considered Impaired 1,2
$’000
2015
< 3 months overdue 2 2 -
3 months - 6 months overdue 18 18 -
> 6 months overdue 31 31 -
2014
< 3 months overdue - - -
3 months - 6 months overdue 28 28 -
> 6 months overdue 35 35 -
Notes:1. Each column in the table reports ‘gross receivables’.2. The ageing analysis excludes statutory receivables, as these are not within scope of AASB 7 and excludes receivables that are not past due and not impaired. Therefore,
the ‘total’ will not reconcile to the receivables total recognised in the Statement of financial position.
There are no debtors which are currently not past due or impaired whose terms have been renogotiated.
Liquidity risk
Liquidity risk is the risk that the Board will be unable to meet its payment obligations when they fall due. The Board continuously manages risk through monitoring of future cash flows and maturities planning to ensure adequate holding of high quality liquid assets. The objective is to maintain a balance between continuity of funding and flexibility through the use of overdrafts, loans and other advances, if applicable.
The Board does not have any loans payable and no assets have been pledged as collateral. The Board’s exposure to liquidity risk is deemed insignificant based on prior periods’ data and current assessment of risk.
The liabilities are recognised for amounts due to be paid in the future for goods or services received, whether or not invoiced. Amounts owing to suppliers (which are unsecured) are settled in accordance with the policy set out in NSW Treasury Circular NSWTC 11/12. For small business suppliers, where terms are not specified, payment is made not later than 30 days from date of receipt of a correctly rendered invoice. For other suppliers, if trade terms are not specified, payment is made no later than the end of the month following the month in which an invoice is received. For small business suppliers, where payment is not made within the specified time period, simple interest must be paid, automatically unless an existing contract specifies otherwise. For payments to other suppliers, the Head of the Board (or a person appointed by the Head of the Board) may automatically pay the supplier simple interest. The rate of interest applied during the year was 10.61% (2014: 10.63%).

74 NOTES TO THE FINANCIAL STATEMENTS
FINANCIAL STATEMENTS FOR THE YEAR ENDED 30 JUNE 2015Workers’ Compensation (Dust Diseases) Board
74
NOTES TO THE FINANCIAL STATEMENTS
20. FINANCIAL INSTRUMENTS (CONTINUED)
a. Financial instrument categories (continued)
Maturity analysis and interest rate exposure of financial liabilities
Weighted Average Effective Interest Rate
%
Nominal Amount
$’000
Interest Rate Exposure Maturity Dates
Fixed Interest Rate $’000
Variable Interest Rate $’000
Non-interest Bearing ‘$’000
< 1 year ‘$’000
1–5 years ‘$’000
>5 years ‘$’000
2015
Payables N/A 14,713 - - 14,713 14,713 - -
Borrowings N/A 135 - - 135 135 - -
2014
Payables N/A 58,604 - - 58,604 58,604 - -
Notes:
1. The amounts disclosed are the contractual undiscounted cash flows of each class of financial liabilities based on the earliest date on which the Board can be required to pay. The tables include both interest (if applicable) and principal cash flows and therefore may not reconcile to the Statement of financial position.
b. Market risk
Market risk is the risk that the fair value or future cash flows of a financial instrument will fluctuate because of changes in the market prices, whether those changes are caused by factors specific to the individual financial instrument or its issuer, or factors affecting all similar financial instruments traded in the market.
Market risk arises as a result of the Board holding cash and cash equivalents and trading investments as part of its asset allocation.
The Board seeks to manage exposure to market risk so that it can generate sufficient returns to meet the Board’s current and future liabilities and mitigate the risk that the Board’s investments will be insufficient to meet such liabilities. The Board’s portfolio of investments is invested in accordance with its strategic asset allocation. The goal of the strategic asset allocation is to construct a portfolio that achieves the Board’s investment objectives, including a return in excess of the liability discount rate while limiting the probability of large declines in the Board’s funding ratio.
The actual asset allocations can deviate from the benchmark asset allocation due to:
• Board cash flows
• Fluctuations in market prices; and
• Dynamic asset allocation decisions
Dynamic asset allocation refers to medium term shifts away from the strategic asset allocation which are designed to capture market opportunities or to mitigate risks.
The deviations in actual versus benchmark asset allocation at the end of the reporting period were within the agreed tolerance limits for all asset classes.
Based on the asset allocation the Investment Committee, typically with the advice from the Board’s asset consultant, appoints investment managers in each asset class. Management of the Board’s assets is allocated to the appointed investment manager. Each investment manager is subject to restrictions in relation to the types of assets in which it may invest, and in relation to the composition of investments within certain asset types. These restrictions are expressed in formalised mandates; typically contained in individually negotiated Investment Management Agreements or as described in Information Memoranda (or similar documents) issued by the relevant investment manager when the investment is via a pooled fund. The investment mandates are monitored on a daily basis to ensure that investment managers are compliant with their mandates and relevant agreements.
Each investment manager is responsible for managing security specific risk using its distinct management style. Each investment manager is also responsible for constructing a portfolio that aims to achieve its own investment objectives while complying with restrictions and guidelines contained in the mandate or Information Memorandum.
A risk budgeting framework is used to help determine an appropriate strategic asset allocation for the Board. This framework incorporates the risk and return characteristics of the different asset classes in the portfolio and additional factors such as inflation and interest rates. Within this framework, a number of risk measures are employed including the frequency of negative returns, the volatility of the investment portfolio relative to the value of the liability and Value-at-Risk (VaR) analysis.

75
FINANCIAL STATEMENTS FOR THE YEAR ENDED 30 JUNE 2015Workers’ Compensation (Dust Diseases) Board
WORKERS’ COMPENSATION (DUST DISEASES) BOARD 2014/15 ANNUAL REPORT 75
NOTES TO THE FINANCIAL STATEMENTS
20. FINANCIAL INSTRUMENTS (CONTINUED)
b. Market risk (continued)
The Board’s asset consultant conducts the risk budgeting analysis utilising:
• Assumptions regarding the expected level of return, risk and correlations between price and wage inflation, bond yields and returns from different asset classes (for example equities, bonds, property, alternative assets)
• Assumptions regarding the duration of inflation-linked and other liabilities consistent with those used by the Actuary.
The analysis incorporates scenario analysis to determine the risk and return of different investment strategies relative to the change in the liabilities over a period. The analysis is primarily used to compare different investment strategies, and then to determine the investment strategy that has the appropriate level of risk, given the risk and return objectives of the Board.
The risk budgeting analysis is based on certain simplifying assumptions such as statistical characteristics of investment returns, volatilities and correlations, that may not represent actual outcomes. It is also important to note that the analysis only allows for some economic factors such as inflation and bond yields, which affect the value of the Board liabilities. It does not allow for other factors such as the claim loss ratio, claims incidence and necessary rates, which also affect the value of the Board’s liabilities. As such, the analysis may not be accurate in its assessment of the liability.
The VaR risk measure seeks to estimate the potential investment loss over a given holding period at a specified confidence level. The VaR methodology is a statistically-defined, probability-based approach to risk assessment that takes into account market volatilities as well as risk diversification by identifying offsetting positions and correlations between financial instruments and markets. The VaR methodology allows risks to be measured consistently across all markets and financial instruments and to be aggregated into a single risk number.
The risk budgeting framework assesses the Board’s Var at the 95th percentile confidence level over a 12 month period. This represents the minimum expected reduction in the value of Workcover’s investment portfolio which has a 5 per cent chance of occuring over a one year period.
In addition to a VaR measure, the risk budgeting framework is also used to assess the following risk and return characteristics:
• Expected return on the investment portfolio
• Probability of meeting return targets that incorporate measures of wage inflation and
• The performance of the investment portfolio under different economic scenarios.
The Board uses a Value at Risk (VaR) model to measure the market risk exposures to its invested assets in the balance sheet. VaR is calculated using simulated forward looking expected returns at the 95th percentile confidence level over a 12 month time period.
The most recent VaR analysis performed by asset consultant Mercer Investments (Australia) limited was conducted in July 2015 based on the June 2015 financial instruments and is computed via forward looking similation using a 95% confidence level and a 1 year holding period.
Given Board’s financial instruments at 30 June 2015, the minimum potential loss expected over a one year period is $46.3 million (June 2014: $52.1 million), with a 5 per cent probability that this minimum may be exceeded.
Interest rate risk
Interest rate risk rate is the risk that the (fair) value of a financial instrument will fluctuate because of changes in market interest rates. The value of the Board’s liabilities is also affected by interest rate fluctuations.
i. Exposure:
Interest rate risk arises as a result of the Board holding financial instruments which are subject directly or indirectly to changes in value as a result of interest rate fluctuations. Board liabilities are similarly subject directly or indirectly to changes in value as a result of interest rate fluctuations.
ii. Risk management objective, policies and processes:
The interest rate and inflation risk of the Board is managed primarily through its strategic asset allocation and mandate objective setting. At 30 June 2015 the Board had a 21 per cent (2014: 19 per cent) allocation to Australian Commonwealth and state government bonds to mitigate interest rate risk of Board liabilities.
iii. Quantitative analysis of exposure:
The table below summarises the Board’s exposure to interest rate risks. It includes the Board’s indexed and interest-bearing financial assets and liabilities at fair values, categorised by the earlier of their contractual re pricing or maturity dates.
The table does not show all assets and liabilities of the Board. Assets and liabilities not shown in the table below are NOT indexed and interest bearing and are therefore not directly exposed to interest rate risk.

76 NOTES TO THE FINANCIAL STATEMENTS
FINANCIAL STATEMENTS FOR THE YEAR ENDED 30 JUNE 2015Workers’ Compensation (Dust Diseases) Board
76
NOTES TO THE FINANCIAL STATEMENTS
20. FINANCIAL INSTRUMENTS (CONTINUED)
b. Market risk (continued)
Floating interest rate $’000
2015 Fixed interest rate maturing in
Total $’000
3 months or less $’000
4 to 12 months $’000
1 to 5 years $’000
Over 5 years $’000
Class
Cash 66,751 - - - - 66,751
Indexed and interest bearing securities 252,141 - - - 139,047 391,188
Unit Trusts 335,634 - - - - 335,634
Derivatives 238 819 - - 1,057
Assets 654,526 238 819 - 139,047 794,630
Floating interest rate $’000
2014 Fixed interest rate maturing in
Total $’000
3 months or less $’000
4 to 12 months $’000
1 to 5 years $’000
Over 5 years $’000
Class
Cash 90,082 - - - - 90,082
Unit Trusts - - - - 527,562 527,562
Assets 90,082 - - - 527,562 617,644
The Board’s exposure to interest rate price risk is considered a component of market price risk and is quantified as part of the VaR analysis discussed under Market Price Risk.
c. Liquidity risk
The Board is also exposed to liquidity risk from holding financial assets that may not be readily convertible to cash to meet financial liabilities and claims costs.
i. Exposure:
The financial assets of the Board that may not be readily convertible to cash are largely receivables (refer Note 7) and investments in over-the-counter or thinly traded investments, principally unlisted property trusts.
ii. Risk management objective, policies and processes
The Board maintains adequate liquidity to meet the daily cash requirements for claims payments and other operating costs.
To assist in meeting its liquidity risk management objectives, the Board maintains a cash balance and invests most of its assets in investments that are traded in active markets that can be readily disposed of.
The Board invests a proportion of its assets in less liquid listed investments or investments that are not traded on active markets and this is strictly controlled in accordance with the asset allocation together with a policy which limits exposure to illiquid investments.
Each investment manager is responsible for cashflow management of the assets that have been mandated to them. That is, each investment manager is responsible for managing settlement liquidity risk. The custodian supplies daily reporting to each investment manager to assist them in this process.
iii. Quantitative analysis of exposure:
The financial liabilities of the Board comprise cash, interest and other payables. The types of financial liabilities of the Board were similar at 30 June 2014.
Cash due to brokers is payable on demand. Interest and other payables are typically settled within 30 days. If the derivative positions are closed out prior to maturity by entering into offsetting transactions, the Board settles its derivative obligations in cash rather than physical delivery.

77
FINANCIAL STATEMENTS FOR THE YEAR ENDED 30 JUNE 2015Workers’ Compensation (Dust Diseases) Board
WORKERS’ COMPENSATION (DUST DISEASES) BOARD 2014/15 ANNUAL REPORT 77
NOTES TO THE FINANCIAL STATEMENTS
20. FINANCIAL INSTRUMENTS (CONTINUED)
d. Credit risk
Credit risk is the risk that one party to a financial instrument will cause a financial loss for the other party by failing to discharge an obligation. Credit risk also arises from the Board’s receivables. Disclosures relating to the Board’s receivables are included in Note 7.
i. Exposure:
Credit risk arises from the Board’s investments as a result of the investment manager trading with various counterparties and purchasing the debt of corporate and government borrowers. These activities could result in the Board not being able to receive obligations as a result of a failing counterparty. The Board’s main credit risk concentration is spread between cash, indexed and interest bearing investments and over-the-counter, in-the-money derivatives.
ii. Risk management objective, policies and processes
Credit Guidelines have been determined to ensure the Board has controlled levels of credit concentration. These guidelines are at a total Board level, with further asset class specific restrictions in investment manager’s mandates where applicable. In addition, where possible collateral arrangements may be implemented to reduce the Board’s exposure.
The exposure is reported against set guidelines both from an individual managers’ compliance and at a total Board level. Reporting is provided by the Board’s custodian and delivered to management for monitoring.
Credit risk arising on financial instruments is mitigated by investing primarily in rated instruments as determined by Standard and Poor’s, Moody’s or Fitch. The Board minimises its credit risk by monitoring counterparty creditworthiness.
iii. Quantitative analysis of exposure:
The Board’s maximum credit risk exposure at balance date in relation to each class of recognised financial asset, other than derivative financial instruments, is the carrying amount of those assets as indicated in the Statement of Financial Position.
In relation to over the counter derivative financial instruments, credit risk arises from the potential failure of counterparties to meet their obligations under the contract or arrangement.
Derivatives
The use of derivative financial instruments is governed by the Board’s policies. The Board enters into derivative contracts for the purpose of gaining market and/or duration exposure or offsetting existing risk exposures.
The table below shows the fair value of derivative financial instruments, recorded as assets or liabilities, together with their notional amounts. The notional amount, recorded gross, is the amount of a derivative’s underlying asset, reference rate or index and is the basis upon which changes in the value of a derivative is measured. The notional amounts are indicative of the exposure of the Board to movements in the instrument underlying the derivatives. The notional amounts do not represent the credit risk of the derivative positions that is equal to the fair value.
The fair value amounts reported in the Statement of Financial Position, and the amounts reported in the following tables are the net value of individual swap positions where there is the ability to settle the swaps on a net basis and the Board intends to settle on this basis.
$’000 Assets
$’000 Liabilities
$’000 Notional amount
2015
Options:
Options on Fixed Income 1,055 - 1,055
1,055 - 1,055
2014
Options:
Options on Fixed Income - - -
- - -

78 NOTES TO THE FINANCIAL STATEMENTS
FINANCIAL STATEMENTS FOR THE YEAR ENDED 30 JUNE 2015Workers’ Compensation (Dust Diseases) Board
78
NOTES TO THE FINANCIAL STATEMENTS
20. FINANCIAL INSTRUMENTS (CONTINUED)
d. Credit risk (Continued)
iii. Quantitative analysis of exposure (Continued)
Indexed and interest bearing investments
The majority of the indexed and interest bearing investments held by the Board are held with issuers rated investment grade by Standard and Poor’s, Moody’s or Fitch. The ratings assigned to the Board’s indexed and interest bearing investments at the end of the reporting period were as follows:
2015 %
2014 %
Rating
AAA/aaa 71 85
AA/Aa 27 11
A/A 2 -
No Rating - 4
Total 100 100
e. Foreign Exchange risk
Foreign exchange risk is the risk that the fair value or future cash flows of a financial instrument will fluctuate because of changes in foreign exchange rates.
i. Exposure:
The Board is exposed to foreign exchange risk as a result of the foreign currency denominated investments held as part of its asset allocation.
ii. Risk management objective, policies and processes:
Independent investment managers appointed by the SRWS Board manage foreign exchange risk. The investment grade credit (developed markets) managers fully hedge their exposures. An independent investment manager has been appointed to implement a currency hedge strategy for the developed markets’ equity exposure. No hedging is undertaken on the value of assets invested in emerging markets.
The primary instruments used to achieve the foreign currency overlay are forward foreign exchange contracts.
The positions are reported on an ongoing basis by the Board’s custodian, State Street Bank and Trust Company, under a Service Level Agreement and reporting is provided both daily and monthly by the custodian to management for monitoring.
iii. Quantitative analysis of exposure:
A summary of the Board’s exposure to foreign exchange risk, including of foreign currency derivatives is shown in the table below:
US Dollars AUD
$’000
Euro AUD
$’000
British Pounds AUD
$’000
Other currencies AUD
$’000
Total AUD
$’000
2015
Cash 6,491 - - - 6,491
Indexed and interest bearing securities - - - - -
Unit Trusts 2,027 - - 634 2,661
Equities 85,779 19,974 5,280 38,471 149,504
FOREIGN EXCHANGE EXPOSURE POSITION 94,297 19,974 5,280 39,105 158,656
US Dollars AUD
$’000
Euro AUD
$’000
British Pounds AUD
$’000
Other currencies AUD
$’000
Total AUD
$’000
2014
Unit Trusts 75,595 22,054 - 43,518 141,167
FOREIGN EXCHANGE EXPOSURE POSITION 75,595 22,054 - 43,518 141,167

79
FINANCIAL STATEMENTS FOR THE YEAR ENDED 30 JUNE 2015Workers’ Compensation (Dust Diseases) Board
WORKERS’ COMPENSATION (DUST DISEASES) BOARD 2014/15 ANNUAL REPORT 79
NOTES TO THE FINANCIAL STATEMENTS
20. FINANCIAL INSTRUMENTS (CONTINUED)
f. Fair valuation estimation
The carrying amounts of the Board’s financial assets and liabilities at the end of the reporting period approximated their fair values as all financial assets and liabilities held were either at fair value at the end of the reporting period (‘marked to market’) or were short term in nature.
The financial assets and liabilities are classified in accordance with the following fair value measurement hierarchy:
• Level 1 – quoted prices (unadjusted) in active markets for identical assets or liabilities
• Level 2 – inputs other than quoted prices included in level 1 that are observable for the asset or liability, either directly (as prices) or indirectly (derived from prices), and
• Level 3 – inputs for the assets or liabilities that are not based on observable market data .
The fair value of financial instruments traded in active markets (such as trading and available-for-sale securities) is based on quoted market prices at the end of the reporting period. The quoted market price used for financial assets of the Board is the current bid price. These instruments are included in level 1.
The fair value of financial instruments that are not traded in an active market (for example over-the-counter derivatives) is determined using valuation techniques. A variety of methods are used which include assumptions that are based on market conditions existing at the end of each reporting period. Quoted market prices or dealer quotes for similar instruments are used to estimate fair value for debt securities for disclosure purposes. Evaluations of such securities are based on market data. Vendors utilise evaluated pricing models that vary by asset class and incorporate available trade, bid and other market information and for structured securities, cash flow and when available loan performance data. There were no transfers between levels in 2015 and 2014.
2015
Total $’000
Level 1 $’000
Level 2 $’000
Level 3 $’000
Financial assets at fair value
Indexed and interest bearing securities 280,152 111,036 - 391,188
Unit Trusts 7,220 328,414 - 335,634
Equities 234,641 - - 234,641
Derivatives 2 1,055 - 1,057
522,015 440,505 - 962,520
2014
Total $’000
Level 1 $’000
Level 2 $’000
Level 3 $’000
Financial assets at fair value
Indexed and interest bearing unit trusts 461,079 426,112 - 887,191
461,079 426,112 - 887,191
Other techniques, such as estimated discounted cash flows, are used to determine fair value for the remaining financial instruments. The fair value of interest rate swaps is calculated as the present value of the estimated future cash flows. The fair value of forward exchange contracts is determined using forward exchange market rates at the end of the reporting period. These instruments are included in level 2 and comprise debt instruments and derivative financial instruments.
Transfer between levels
The Authority recognises transfers between levels of the fair value hierarchy at the end of the reporting report during which the transfer has occurred. There were no transfers during the the year ended 30 June 2015 (2014 $nil).

80 NOTES TO THE FINANCIAL STATEMENTS
FINANCIAL STATEMENTS FOR THE YEAR ENDED 30 JUNE 2015Workers’ Compensation (Dust Diseases) Board
80
NOTES TO THE FINANCIAL STATEMENTS
20. FINANCIAL INSTRUMENTS (CONTINUED)
g. Valuation framework
The Board has an established control framework with respect to the measurement of fair values. This framework has been outsourced to an external service provider which has overall responsibility for independently verifying the results of trading and investment operations and all significant fair value measurements. Specific controls conducted by the outsourced service provider include:
• Verification of observable pricing;
• Re-performance of model valuations;
• A review and approval process for new models and changes to models;
• Quarterly calibration and back testing of models against observed market transactions;
• Analysis and investigation of significant daily valuation movements;
• Review of significant unobservable inputs, valuation adjustments and significant changes to the fair value measurement of Level 3 instruments compared to previous month.
Where third-party information, such as broker quotes or pricing services, are used to measure fair value, the outsourced service provider assesses and documents the evidence obtained from the third parties to support the conclusion that such valuations meet the requirements of accounting standards. This includes:
• Verifying that the broker or pricing service is approved by the Master Custodian of the Board for use in pricing the relevant type of financial instrument;
• Understanding how the fair value has been arrived at and the extent to which it represents actual market transactions;
• When prices for similar instruments are used to measure fair value, how these prices have been adjusted to reflect the characteristics of the instrument subject to measurement;
• Where a number of quotes for the same financial instrument have been obtained, how fair value has been determined using those quotes.
Significant valuation issues are reported to the Safety, Return to Work and Support Board’s Audit and Risk Committee.
Involvement with unconsolidated structured entities
The Board has concluded that unlisted investment funds in which it invests, but that it does not consolidate, meet the definition of structured entities because:
• The voting rights in the funds are not dominant rights in deciding who controls them as they relate to administrative tasks only;
• Each fund’s activities are restricted by its prospectus; and
• The funds have narrow and well-defined objectives to provide investment opportunities to investors.
The table below describes the types of structured entities that the Fund does not consolidate but in which it holds an interest, set out by investment strategy.
Investment Strategy
Net Market Value as at 30 June 2015 $’000
Exposure As at 30 June 2015
Net Market Value as at 30 June 2014 $’000
Exposure As at 30 June 2014
Property 95,440 29% 70,398 24%
Shares 179,233 55% 218,193 76%
Strategic 4,094 1% - -
Other 49,646 15% - -
Total 328,413 100% 288,591 100%
The above table lists the net market value and the Board’s percentage exposure to each investment strategy as at 30 June. These unconsolidated structured entities are included under unit trusts. The maximum exposure or loss is limited to the net market value of the investment strategy as at 30 June 2015. The net market value of the exposure will change on a daily basis throughout the period and in the subsequent periods will cease once the investments are disposed.
The investments of the Board are managed in accordance with the investment mandates with respective underlying investment managers. The investment decisions of the mandate are based on the analysis conducted by the investment manager. The return of the portfolio is exposed to the variability of the performance of the underlying management of these investments.

81
FINANCIAL STATEMENTS FOR THE YEAR ENDED 30 JUNE 2015Workers’ Compensation (Dust Diseases) Board
WORKERS’ COMPENSATION (DUST DISEASES) BOARD 2014/15 ANNUAL REPORT 81
NOTES TO THE FINANCIAL STATEMENTS
21. POST BALANCE DATE EVENTS
Defined Benefit Superannuation Liability
The Department of Finance, Services and Innovation (DFSI) have advised the Board during the 2015/16 budget setting process that the defined benefit superannuation liability for the Board will be assumed by the NSW Treasury in 2015/16. As a result the Board has budgeted for an equity injection in 2015/16 that will eliminate its defined benefit superation liability in 2015/16. The impact of this on the Board’s 2014/15 balance sheet would be to eliminate the defined benefit superannuation liability of $0.9m (refer note 14) and turn accumulated funds from $9.5m to $10.4m.
The Board is awaiting advice from NSW Treasury as to whether this will occur in 2015/16.
State Insurance & Care Governance Act 2015
This Act was proclaimed effective 1 September 2015 to implement structural changes to the NSW workers compensation system and related compensation agencies. The Act establishes four discrete agencies:
• Insurance & Care NSW: a single insurance and care service provider
• State Insurance Regulatory Authority (SIRA): an independent insurance regulator
• SafeWork NSW: an independent workplace safety regulator
• Sporting Injuries Compensation Authority - an entity to manage the Sporting Injuries Compensation Scheme
In addition the Board was changed to a corporation titled the Workers Compensation (Dust Diseases) Authority.
These changes have no financial impact on the financial statements of the Board. The Authority will receive services from Insurance & Care NSW in the future.
– END OF AUDITED FINANCIAL STATEMENTS –

82
BUDGET AND ESTIMATES FOR 2015/16 Workers’ Compensation (Dust Diseases) Board 2014/15
BUDGET AND ESTIMATES FOR 2015/16
Financial Statements
Operating Statement________ 2014-15 ________ 2015-16Budget $000
Revised $000
Budget $000
Expenses Excluding LossesOperating Expenses -
Employee related 107 271 110Other operating expenses 863 8,051 9,846
Depreciation and amortisation 347 302 327Grants and subsidies 6,565 5,866 7,058Other expenses 96,521 49,300 50,900
Total Expenses Excluding Losses 104,403 63,790 68,241
RevenueSales of goods and services 521 541 480Investment revenue 63,417 179,980 67,824Retained taxes, fees and fines 39,189 (123,673) (1,340)Other revenue 1,526 2,077 1,527
Total Revenue 104,653 58,925 68,491
Other gains/(losses) (250) (250) (250)
Net Result ... (5,115) ...

83
BUDGET AND ESTIMATES FOR 2015/16 Workers’ Compensation (Dust Diseases) Board 2014/15
WORKERS’ COMPENSATION (DUST DISEASES) BOARD 2014/15 ANNUAL REPORT
Balance Sheet________ 2014-15 ________ 2015-16Budget $000
Revised $000
Budget $000
AssetsCurrent Assets
Cash assets 22,945 64,249 66,867Receivables 112,537 112,228 109,686Other financial assets 101,475 4,286 4,500
Total Current Assets 236,957 180,763 181,053
Non Current AssetsReceivables 790,624 794,523 690,581Other financial assets 853,809 1,037,642 1,089,524Property, plant and equipment -
Land and building 4,236 4,258 4,091Plant and equipment 387 359 239
Total Non Current Assets 1,649,056 1,836,782 1,784,435
Total Assets 1,886,013 2,017,545 1,965,488
LiabilitiesCurrent Liabilities
Payables 5,538 7,367 7,367Provisions 106,216 104,583 103,873
Total Current Liabilities 111,754 111,950 111,240
Non Current LiabilitiesProvisions 1,765,183 1,902,586 1,850,386Other 786 900 900
Total Non Current Liabilities 1,765,969 1,903,486 1,851,286
Total Liabilities 1,877,723 2,015,436 1,962,526
Net Assets 8,290 2,109 2,962
EquityReserves 1,265 1,239 1,239Accumulated funds 7,025 870 1,723
Total Equity 8,290 2,109 2,962

84
BUDGET AND ESTIMATES FOR 2015/16 Workers’ Compensation (Dust Diseases) Board 2014/15
BUDGET AND ESTIMATES FOR 2015/16
Cash Flows Statement________ 2014-15 ________ 2015-16Budget $000
Revised $000
Budget $000
Cash Flows From Operating ActivitiesPayments
Employee related 107 271 (743)Grants and subsidies 6,565 5,866 7,058Other 108,608 101,668 114,182
Total Payments 115,280 107,805 120,497
ReceiptsSale of goods and services 521 540 480Interest received 36,422 48,531 18,559Retained taxes, fees and fines 108,974 105,609 105,144Other 1,802 1,827 1,803
Total Receipts 147,719 156,507 125,986
Net Cash Flows From Operating Activities 32,439 48,702 5,489
Cash Flows From Investing ActivitiesProceeds from sale of investments 5,932 24,421 15,049Purchases of property, plant and equipment (40) (10) (40)Purchases of investments (26,994) (47,709) (17,880)
Net Cash Flows From Investing Activities (21,102) (23,298) (2,871)
Net Increase/(Decrease) in Cash 11,337 25,404 2,618
Opening Cash and Cash Equivalents 11,608 38,845 64,249
Closing Cash and Cash Equivalents 22,945 64,249 66,867
Cash Flow ReconciliationNet result ... (5,115) ...Non cash items added back (26,648) (131,147) (48,938)Change in operating assets and liabilities 59,087 184,964 54,427
Net Cash Flows From Operating Activities 32,439 48,702 5,489

85WORKERS’ COMPENSATION (DUST DISEASES) BOARD 2014/15 ANNUAL REPORT
APPENDICES
Appendix 1: Legislation 86
Appendix 2: Performance and numbers of senior executives 86
Appendix 3: Government Information (Public Access) applications 87
Appendix 4: Credit card certification 90
Appendix 5: Response to significant matters raised in the outgoing audit report 91
Appendix 6: Accounts payable performance 91
Appendix 7: Insurance activities 92
Appendix 8: Overseas travel 2014/15 92
Appendix 9: Consultants 92
Appendix 10: Grants 93
Appendix 11: Land disposal 94
Appendix 12: Liability management performance 94
Appendix 13: Awards made since the inception of the original scheme of 1927 94
Appendix 14: Cases certified by the Medical Authority 95
Appendix 15: Medical Authority Certificates – new dust diseases cases certified 96
Appendix 16: Workers’ Compensation (Dust Diseases) Act 1942 Contributions under section 6 for 2015/16 financial year 96
Appendix 17: Corporate plan objectives and results 2014/15 106
Appendix 18: Board and committee meetings 107
Appendix 19: Publication notes 108

86
APPENDICES
APPENDIX 1: LEGISLATION
The Dust Diseases Board is responsible for administering entitlements available under the Workers’ Compensation (Dust Diseases) Act 1942 and Workers’ Compensation (Dust Diseases) Regulation 2013. Services provided by the Dust Diseases Board include:
• Health monitoring screening services for employers including our mobile screening vehicle the “Lung Bus”
• Payment of compensation benefits
• Payment of medical and related treatment expenses for workers in receipt of an award of compensation
• Information and Education
• Provision of grants for research into the diagnosis, treatment and prevention of dust diseases
• Grants for organisations providing assistance to victims of dust diseases or their families
LEGAL CHANGE
There were no changes to during the year to the Workers’ Compensation (Dust Diseases) Act 1942.
APPENDIX 2: PERFORMANCE AND NUMBERS OF SENIOR EXECUTIVES
The DDB does not employ any officers under Division 4 of the Government Sector Employment Act 2013.
Workers’ Compensation (Dust Diseases) Board*
Lifetime Care & Support Authority of NSW
Motor Accidents Authority of NSW WorkCover Authority
BAND 1
Male 0 1 3 27Female 0 1 6 32
Total 0 2 9 59Average Remuneration 0 175,342 151,051 157,644
BAND 2
Male 0 1 2 6Female 0 0 0 4
Total 0 1 2 10Average Remuneration 0 245,968 234,993 230,603
BAND 3
Male 0 0 0 2Female 0 0 0 0
Total 0 0 0 2Average Remuneration 0 0 0 305,518
Senior Executives Total
Male 0 2 5 35Female 0 1 6 36
Total 0 3 11 71
Employee Related Costs
Exec 4483 732,245 1,890,072 15,181,978Non-Execs 3,160,702 6,919,306 7,053,757 94,917,807
Total 3,165,186 7,651,550 8,943,828 110,099,785% 0.14% 9.57% 21.13% 13.79%
* The General Manager Workers Compensation Dust Diseases Board was acting in another role at Census date in 2014/15

87WORKERS’ COMPENSATION (DUST DISEASES) BOARD 2014/15 ANNUAL REPORT
APPENDIX 3: GOVERNMENT INFORMATION (PUBLIC ACCESS) APPLICATIONS
GOVERNMENT INFORMATION (PUBLIC ACCESS) ACT 2009
The DDB administers and fulfils its obligations under the Government Information (Public Access) Act 2009 (GIPA Act) which focusses on making Government information more readily available.
Formal access applications received
In the 2014-15 year, the DDB received 40 formal access applications. The majority of these applications received related to requests made by legal practitioners requesting information on behalf of their clients. This includes withdrawn applications.
Mandatory release of government information
As per Section 6 of the GIPA Act, open access made publically available on our website, free of charge. This includes publication guides and programs. The DDB provides copies of these documents to members of the public upon request.
Informal release of government information
As per Section 7 of the GIPA Act, the DDB adheres to releasing specific information where it is determined that a formal access application is not required.
Proactive release of government information
Section 7 of the GIPA Act details that agencies must review their programs for the release of government information to identify the kinds of information that can be made publically available. This review must be undertaken at least once every 12 months. Our agency’s program for the proactive release of information involves a review of information available for our participants and publication of information on our internet site, including guidelines, policies and forms.
In addition to the information contained on our website, we will release as much information as possible and as governed by the GIPA Act.
TABLE A: NUMBER OF APPLICATIONS BY TYPE OF APPLICANT AND OUTCOME*Access
granted in full
Access granted
in part
Access refused
in fullInformation
not held
Information already
available
Refuse to deal with
application
Refuse to confirm/deny whether
information is heldApplication withdrawn Total
Media 0 0 0 0 0 0 0 0 0Members of Parliament 0 0 0 0 0 0 0 0 0Private sector business 2 1 0 0 0 0 0 0 3Not for profit organisations or community groups
0 0 0 0 0 0 0 0 0
Members of the public (application by legal representative)
16 9 1 9 0 0 0 0 35
Members of the public (other)
1 0 0 1 0 0 0 0 2
Total 19 10 1 10 0 0 0 0 40
* More than one decision can be made in respect of a particular access application. If so, a recording must be made in relation to each such decision.
TABLE B: NUMBER OF APPLICATIONS BY TYPE OF APPLICATION AND OUTCOMEAccess
granted in full
Access granted
in part
Access refused
in fullInformation
not held
Information already
available
Refuse to deal with
application
Refuse to confirm/deny whether
information is heldApplication withdrawn Total
Personal information applications*
1 0 0 1 0 0 0 0 2
Access applications (other than personal information applications)
16 0 0 7 0 0 0 0 23
Access applications that are partly personal information applications and partly other
1 10 1 3 0 0 0 0 15
Total 18 10 1 11 0 0 0 0 40* A personal information application is an access application for personal information (as defined in clause 4 of Schedule 4 to the Act) about the applicant (the
applicant being an individual).

88 APPENDIX 3: GOVERNMENT INFORMATION (PUBLIC ACCESS) APPLICATIONS
APPENDICES
TABLE C: INVALID APPLICATIONSReason for invalidity No of applications
Application does not comply with formal requirements (section 41 of the Act) 1Application is for excluded information of the agency (section 43 of the Act) 0Application contravenes restraint order (section 110 of the Act) 0Total of invalid applications received 1Invalid applications that subsequently became valid applications 0
TABLE D: CONCLUSIVE PRESUMPTION OF OVERRIDING PUBLIC INTEREST AGAINST DISCLOSURE: MATTERS LISTED IN SCHEDULE 1 OF THE ACT
Number of times consideration used*
Overriding secrecy laws 0Cabinet information 0Executive Council information 0Contempt 0Legal professional privilege 0Excluded information 0Documents affecting law enforcement and public safety 0Transport safety 0Adoption 0Care and protection of children 0Ministerial code of conduct 0Aboriginal and environmental heritage 0
Total 0* More than one public interest consideration may apply in relation to a particular access application and, if so, each such consideration is to be recorded (but only
once per application). This also applies in relation to Table E.
TABLE E: OTHER PUBLIC INTEREST CONSIDERATIONS AGAINST DISCLOSURE: MATTERS LISTED IN TABLE TO SECTION 14 OF THE ACT
Number of occasions when application not successful
Responsible and effective government 0Law enforcement and security 0Individual rights, judicial processes and natural justice 11Business interests of agencies and other persons 0Environment, culture, economy and general matters 0Secrecy provisions 0Exempt documents under interstate Freedom of Information legislation 0
Total 11Note: More than one public interest consideration may apply in relation to a particular access application and, if so, each such consideration is to be recorded (but
only once per application). This also applies to Table D.
TABLE F: TIMELINES
Number of applications
Decided within the statutory timeframe (20 days plus any extensions) 40Decided after 35 days (by agreement with applicant) 0Not decided within time (deemed refusal) 0
Total 40

89WORKERS’ COMPENSATION (DUST DISEASES) BOARD 2014/15 ANNUAL REPORT
TABLE G: NUMBER OF APPLICATIONS REVIEWED UNDER PART 5 OF THE ACT (BY TYPE OF REVIEW AND OUTCOME)
Decision varied Decision upheld Total
Internal review 0 0 0 Review by Information Commissioner* 0 0 0Internal review following recommendation under section 93 of Act 0 0 0 Review by ADT 0 0 0
Total 0 0 0
TABLE H: APPLICATIONS FOR REVIEW UNDER PART 5 OF THE ACT (BY TYPE OF APPLICANT)
Number of applications
Applications by access applicants 0Applications by persons to whom information the subject of access application relates (see section 54 of the Act) 0
Total 0
PRIVACY AND PERSONAL INFORMATION
Privacy and Personal Information Protection Act 1998 (PPIP Act) and Health Records and Information Privacy Act 2002 (HRIP Act)
The PPIP Act and HRIP Act deal with how all NSW public sector agencies, including the DDB, must manage personal and health information.
All personal information held by the DDB is managed in accordance with NSW legislation. This includes all types of records in any format such as documents (paper and electronic), data in business information systems and verbal decisions and objects (e.g. Photographs, maps, evidence, samples).
Examples of personal details of individuals with whom the DDB has contact includes names, dates of birth, residential address, drivers licence details, financial details, bank account details, wage records, work history, medical certificates and health details.
During the 2014-15 financial year the DDB received nil applications under Privacy legislation.
File access requests
The DDB receives requests from law firms for copies of files held in relation to individual workers who are pursuing common law action in the Dust Diseases Tribunal. These requests are made in accordance with the Dust Diseases Tribunal Act 1989. Requests in relation to claims subject to claims resolution processes may also be received under the Dust Diseases Tribunal Regulation 2013.
A total of 632 requests for production of files were received in the financial year ending 30 June 2014, a slight increase from the previous yea’s figure of 622.
Requests for files are subject to a $55 production fee and radiology results provided on CD incur a fee of $16.50.
The total value of production fees received in 2013/14 represented $27,644.

90 APPENDIX 4: CREDIT CARD CERTIFICATION
APPENDICES
APPENDIX 4: CREDIT CARD CERTIFICATION
Credit card use within DDB is certified in accordance with Premier’s Memorandum and Treasurer’s directions. DDB has a rigorous process in place to ensure full accountability for the use of credit cards.

91WORKERS’ COMPENSATION (DUST DISEASES) BOARD 2014/15 ANNUAL REPORT
APPENDIX 5: RESPONSE TO SIGNIFICANT MATTERS RAISED IN THE OUTGOING AUDIT REPORT
There were no significant matters raised in the outgoing audit report.
APPENDIX 6: ACCOUNTS PAYABLE PERFORMANCE
PAYMENTS OF ACCOUNTS – ALL SUPPLIERS
Amounts outstanding to suppliers at the end of each quarter of the year were:
2014/15 June Quarter March Quarter December Quarter September Quarter
Current $0 $337 $0 $0<30 days overdue $0 $30 $301 $0>30 and <60 days overdue $0 $0 1,084 $0>60 days and <90 days $0 $0 $120 $090 days and over $0 $50 $341 $50
Amounts paid to suppliers at the end of each quarter of the year were:
2014/152014/15
TotalJune
Quarter*March
QuarterDecember
QuarterSeptember
Quarter
Number of accounts due for payment 13,176 3,601 2,955 3,299 3,321Number of accounts paid on-time 12,604 3,357 2,801 3,188 3,258% accounts paid on-time (based on number of accounts) 96% 93% 95% 97% 98%Dollar amount of accounts due for payment $13,613,909 $6,264,930 $2,595,714 $2,404,684 $2,348,581Dollar amount of accounts paid on-time $12,715,734 $5,879,201 $2,271,223 $2,308,417 $2,256,893% of accounts paid on-time (based on $) 93% 94% 87% 96% 96%Number of payments for interest on overdue accounts 1 0 1 0 0Interest paid on overdue accounts $516 $0 $516 $0 $0
PAYMENTS OF ACCOUNTS - SMALL BUSINESS SUPPLIERS
Amounts paid to identified small business suppliers at the end of each quarter of the year were:
2014/152014/15
TotalJune
Quarter*March
QuarterDecember
QuarterSeptember
Quarter
Number of accounts due for payment 283 67 69 68 79Number of accounts paid on-time 274 63 65 67 79% accounts paid on-time (based on number of accounts) 97% 94% 94% 99% 100%
Dollar amount of accounts due for payment $59,886 $13,913 $14,990 $14,313 $16,670Dollar amount of accounts paid on-time $55,396 $10,641 $14,072 $14,013 $16,670% of accounts paid on-time (based on $) 93% 76.48% 93.88% 97.90% 100%
Number of payments for interest on overdue accounts 0 0 0 0 0Interest paid on overdue accounts $0 $0 $0 $0 $0
The Dust Diseases Board has a target of 95 per cent of invoices paid on-time. This target is not able to be met at times mainly due to delays in medical payments to suppliers as medical investigations need to take place prior to release of payments. A daily payment run takes place for DDB to improve payment performance.
Interest on late payments:
The Dust Diseases Board paid $516 in interest to one small business in 2014/15.

92 APPENDIX 7: INSURANCE ACTIVITIES
APPENDICES
APPENDIX 7: INSURANCE ACTIVITIES
2014/15 2013/14 2012/13 2011/12 2010/11
Workers Compensation:
No. of employees 39 42 41 68 61No. of claims 0 0 1 1 3No. of claims per employee 0 0 0.02 0.01 0.05Total cost of claims 0 0 $19,925 $5,008 $3,768Average claim cost 0 0 $19,925 $5,008 $1,256Note: Information about workers compensation claims is current at reporting date 30 June 2015. For 2011 to 2014, data has changed accordingly.
Motor vehicles: (Total claims)
Vehicles 2 2Number of claims 1 1 0 0 0No. of claims per vehicle 0.5Total cost of claims $5226 $1,486Average cost per claim $5226 $1,486Average cost per vehicle $2613 $743
Property:
Number of claims 0 0 0 0 0No. of claims per employee Total cost of claims Average cost per claim Average cost per employee
Liability:
Number of claims 0 0 0 0 0Total cost of claims Average claim
Miscellaneous:
Number of claims 0 0 0 0 0Total cost of claims Average claim
APPENDIX 8: OVERSEAS TRAVEL 2014/15
No overseas travel by a staff member was undertaken during the reporting year.
APPENDIX 9: CONSULTANTS
Vendor Description Vendor total
Taylor Fry Consulting Services Actuarial services 152,818Mercer Investments (Australia) Limited Investment retainer services 90,251
Total Greater than $50,000 243,069
Plus Nil Consultants $50,000 and under 0
Total consultants 243,069
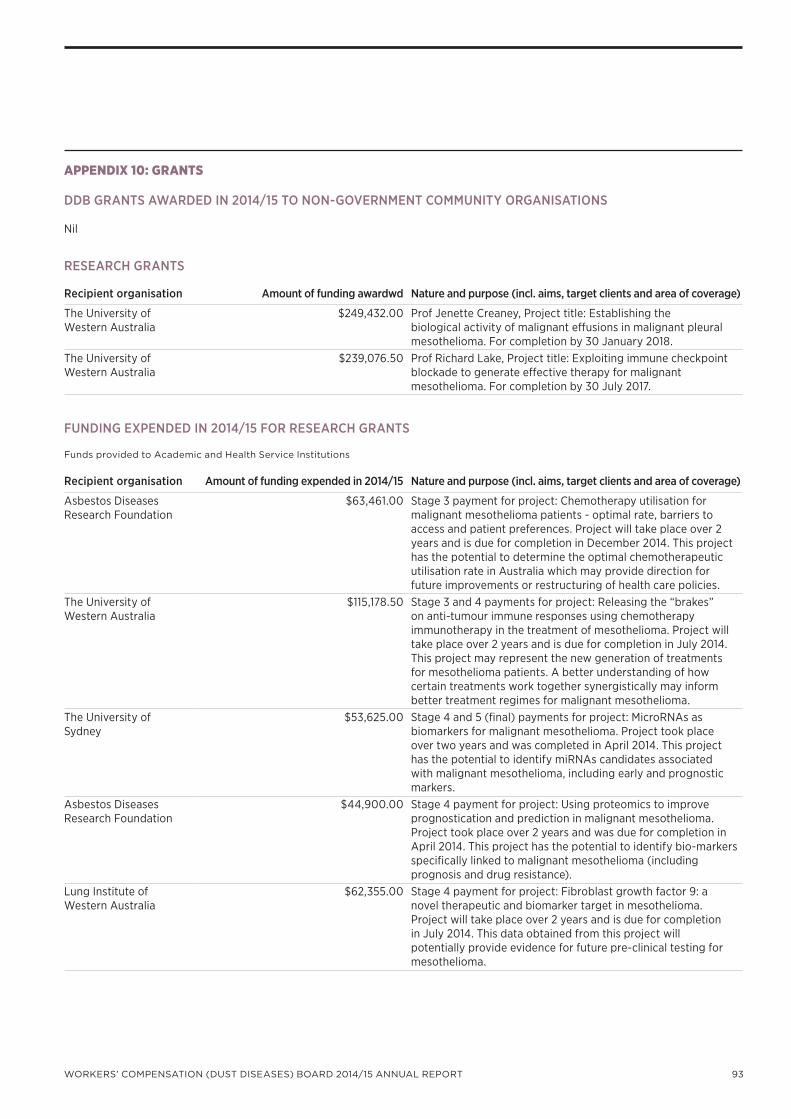
93WORKERS’ COMPENSATION (DUST DISEASES) BOARD 2014/15 ANNUAL REPORT
APPENDIX 10: GRANTS
DDB GRANTS AWARDED IN 2014/15 TO NON-GOVERNMENT COMMUNITY ORGANISATIONS
Nil
RESEARCH GRANTS
Recipient organisation Amount of funding awardwd Nature and purpose (incl. aims, target clients and area of coverage)
The University of Western Australia
$249,432.00 Prof Jenette Creaney, Project title: Establishing the biological activity of malignant effusions in malignant pleural mesothelioma. For completion by 30 January 2018.
The University of Western Australia
$239,076.50 Prof Richard Lake, Project title: Exploiting immune checkpoint blockade to generate effective therapy for malignant mesothelioma. For completion by 30 July 2017.
FUNDING EXPENDED IN 2014/15 FOR RESEARCH GRANTS
Funds provided to Academic and Health Service Institutions
Recipient organisation Amount of funding expended in 2014/15 Nature and purpose (incl. aims, target clients and area of coverage)
Asbestos Diseases Research Foundation
$63,461.00 Stage 3 payment for project: Chemotherapy utilisation for malignant mesothelioma patients - optimal rate, barriers to access and patient preferences. Project will take place over 2 years and is due for completion in December 2014. This project has the potential to determine the optimal chemotherapeutic utilisation rate in Australia which may provide direction for future improvements or restructuring of health care policies.
The University of Western Australia
$115,178.50 Stage 3 and 4 payments for project: Releasing the “brakes” on anti-tumour immune responses using chemotherapy immunotherapy in the treatment of mesothelioma. Project will take place over 2 years and is due for completion in July 2014. This project may represent the new generation of treatments for mesothelioma patients. A better understanding of how certain treatments work together synergistically may inform better treatment regimes for malignant mesothelioma.
The University of Sydney
$53,625.00 Stage 4 and 5 (final) payments for project: MicroRNAs as biomarkers for malignant mesothelioma. Project took place over two years and was completed in April 2014. This project has the potential to identify miRNAs candidates associated with malignant mesothelioma, including early and prognostic markers.
Asbestos Diseases Research Foundation
$44,900.00 Stage 4 payment for project: Using proteomics to improve prognostication and prediction in malignant mesothelioma. Project took place over 2 years and was due for completion in April 2014. This project has the potential to identify bio-markers specifically linked to malignant mesothelioma (including prognosis and drug resistance).
Lung Institute of Western Australia
$62,355.00 Stage 4 payment for project: Fibroblast growth factor 9: a novel therapeutic and biomarker target in mesothelioma. Project will take place over 2 years and is due for completion in July 2014. This data obtained from this project will potentially provide evidence for future pre-clinical testing for mesothelioma.
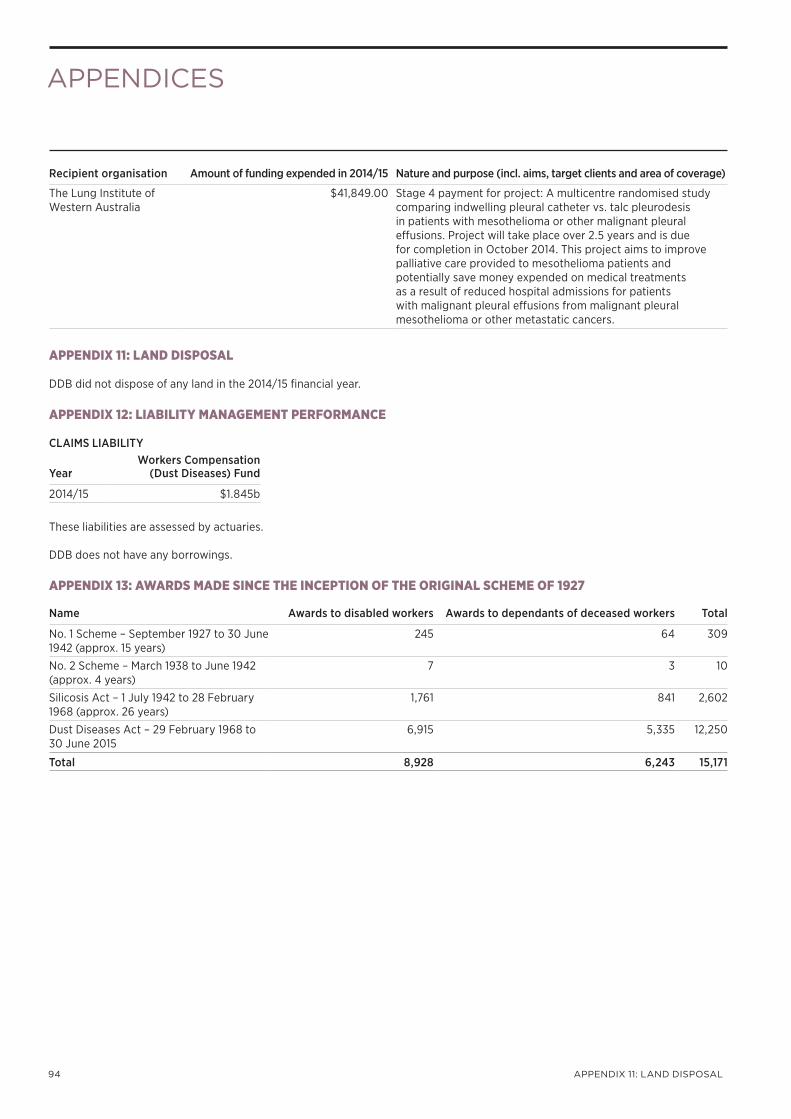
94 APPENDIX 11: LAND DISPOSAL
APPENDICES
Recipient organisation Amount of funding expended in 2014/15 Nature and purpose (incl. aims, target clients and area of coverage)
The Lung Institute of Western Australia
$41,849.00 Stage 4 payment for project: A multicentre randomised study comparing indwelling pleural catheter vs. talc pleurodesis in patients with mesothelioma or other malignant pleural effusions. Project will take place over 2.5 years and is due for completion in October 2014. This project aims to improve palliative care provided to mesothelioma patients and potentially save money expended on medical treatments as a result of reduced hospital admissions for patients with malignant pleural effusions from malignant pleural mesothelioma or other metastatic cancers.
APPENDIX 11: LAND DISPOSAL
DDB did not dispose of any land in the 2014/15 financial year.
APPENDIX 12: LIABILITY MANAGEMENT PERFORMANCE
CLAIMS LIABILITY
YearWorkers Compensation
(Dust Diseases) Fund
2014/15 $1.845b
These liabilities are assessed by actuaries.
DDB does not have any borrowings.
APPENDIX 13: AWARDS MADE SINCE THE INCEPTION OF THE ORIGINAL SCHEME OF 1927
Name Awards to disabled workers Awards to dependants of deceased workers Total
No. 1 Scheme – September 1927 to 30 June 1942 (approx. 15 years)
245 64 309
No. 2 Scheme – March 1938 to June 1942 (approx. 4 years)
7 3 10
Silicosis Act – 1 July 1942 to 28 February 1968 (approx. 26 years)
1,761 841 2,602
Dust Diseases Act – 29 February 1968 to 30 June 2015
6,915 5,335 12,250
Total 8,928 6,243 15,171

95WORKERS’ COMPENSATION (DUST DISEASES) BOARD 2014/15 ANNUAL REPORT
APPENDIX 14: CASES CERTIFIED BY THE MEDICAL AUTHORITY
Death due
Deferred Existingdust disease
Death not due
No dust disease/not attributable New dust disease
2008/09 2009/10 2010/11
2012/13 2013/142011/12
2014/15
Medical Authority Outcomes Total number of cases to the Medical Authority
2012/13 2014/152013/142008/09 2011/122010/112009/10
3705 3658
2748
2514 2422
2197
2913
0
1500
2000
2500
3000
3500
4000
500
1000
Existing Dust Disease
New Dust Disease
No Dust Disease/Not Attributable Death Due Death not Due Deferred
2006/07 796 334 1854 202 122 465
2007/08 585 301 2304 226 84 522
2008/09 715 336 1808 233 122 491
2009/10 430 303 1484 213 97 386
2010/11 706 348 1787 220 115 482
2011/12 546 303 1270 185 63 381
2012/13 604 325 930 175 73 407
2013/14 524 273 1000 182 84 359
2014/15 565 342 754 167 56 313

96 APPENDIX 11: LAND DISPOSAL
APPENDICES
APPENDIX 15: MEDICAL AUTHORITY CERTIFICATES – NEW DUST DISEASES CASES CERTIFIED
0
20
40
60
80
100100
CA
SES
120
140
160
180
200
2012/13 2014/152013/142008/09 2011/122010/112009/10
Mesothelioma
Asbestosis
ARPD
Asbestosis/ARPD
Lung Cancer/Asbestos Silicosis
Other
APPENDIX 16: WORKERS’ COMPENSATION (DUST DISEASES) ACT 1942 CONTRIBUTIONS UNDER SECTION 6 FOR 2015/16 FINANCIAL YEAR
Notice is given that the WorkCover Authority, in pursuance of section 6 of the Workers’ Compensation (Dust Diseases) Act 1942 (“the Dust Diseases Act”), has
a. in respect of policies issued or renewed to take effect in the year commencing 30 June 2015, determined the contribution to be paid under section 6 of the Dust Diseases Act by an insurer insuring or indemnifying an employer in respect of a class of employment specified in Column 1 of Table 1 to be an amount equal to the percentage of wages (being the total wages payable by the employer to workers in respect of the period of the policy) specified in Column 2 of the Table opposite that class; and
b. determined that the 2015/16 financial year interim contribution to be paid by an insurer to the Workers’ Compensation (Dust Diseases) Fund in twelve equal instalments by the fifteenth day of each month commencing 15 July 2015 will be as follows:
Insurer Amount ContributionCatholic Church Insurances Limited $800,000Guild Insurance Limited $150,000Hotel Employers Mutual Limited $510,000Racing NSW $20,000StateCover Mutual Limited $630,000
and
c. determined that the 2015/16 financial year interim contributions to be paid by the workers compensation nominal insurer to the Workers’ Compensation (Dust Diseases) Fund in amounts and at times requested by the Workers’ Compensation (Dust Diseases) Fund will be $85,000,000; and
d. determined that upon notification of an employer’s actual wages paid for the financial year an insurer’s 2015/16 financial year contribution is to be calculated in accordance with clause (a) and paid to the Workers’ Compensation (Dust Diseases) Fund less previous contributions for the financial year 2015/16 by 31 October each year; and
e. In respect of the year commencing 1 July 2015, determined the contribution to be paid under section 6 of the Dust Diseases Act by each self-insurer is to be an amount equal to the percentage of wages (being the wages payable by the self-insurer to workers in respect of that year) specified in Column 2 of Table 1 (opposite) –
i. the class of employment specified in item 1 of Column 1 of Table 1 if, and to the extent that, wages are payable by the self-insurer to workers in respect of employment during that year and of that class; or

97WORKERS’ COMPENSATION (DUST DISEASES) BOARD 2014/15 ANNUAL REPORT
ii. the class of employment specified in Column 1 of Table 1 which corresponds to the business activity classification (or classifications) adopted by the WorkCover Authority for the purpose of determining the contribution payable by the self-insurer to the WorkCover Authority Fund for the financial year commencing 1 July 2015;
and
f. determined that the 2015/16 interim contribution to be paid by each self-insurer to the Workers’ Compensation (Dust Diseases) Fund is to be based on a reasonable estimate by the self-insurer of the wages to be paid during the financial year and calculated in accordance with clause (d) and paid in two equal instalments on 31 October 2015 and 31 March 2016;
and
g. determined that the 2015/16 final contribution to be paid by each self-insurer to the Workers’ Compensation (Dust Diseases) Fund is to be based on the actual wages paid by the self-insurer during the 2015/16 financial year and calculated in accordance with clause (d) and is to be paid by 31 October 2016 less the interim contribution paid under clause (e),
as the case may require (see note 1 below).
TABLE 1Item no. Column 1 – Class of Employment Column 2 – Contribution (percentage of wages)
1. The class of employment in paragraph D(12) of the determination made by the Workers’ Compensation (Dust Diseases) Board under section 6(3) of the Dust Diseases Act and published in Gazette No. 64 of 11 May 1979.
4%
2. Any other class of employment determined by the Workers’ Compensation (Dust Diseases) Board under section 6(3) of the Dust Diseases Act.
The percentage specified in this Column opposite the class of employment in Column 1 corresponding to the business classification that applies to the employer concerned in calculating the relevant premium under the Insurance Premiums Order 2015/16.
3. Employment in respect of which, for the purpose of calculating the relevant premium under the Insurance Premiums Order 2015/16, a business classification listed in SCHEDULE 1 applies to the employer concerned.
1.25%
4. Employment in respect of which, for the purpose of calculating the relevant premium under the Insurance Premiums Order 2015/16, a business classification listed in SCHEDULE 2 applies to the employer concerned.
0.50%
5. Employment in respect of which, for the purpose of calculating the relevant premium under the Insurance Premiums Order 2015/16, a business classification listed in SCHEDULE 3 applies to the employer concerned.
0.28%
6. Employment in respect of which, for the purpose of calculating the relevant premium under the Insurance Premiums Order 2015/16, a business classification listed in SCHEDULE 4 applies to the employer concerned.
0.165%
7. Employment in respect of which, for the purpose of calculating the relevant premium under the Insurance Premiums Order 2015/16, a business classification listed in SCHEDULE 5 applies to the employer concerned.
0.11%
8. Employment in respect of which, for the purpose of calculating the relevant premium under the Insurance Premiums Order 2015/16, a business classification listed in SCHEDULE 6 applies to the employer concerned.
0.075%
9. Employment in respect of which, for the purpose of calculating the relevant premium under the Insurance Premiums Order 2015/16, a business classification listed in SCHEDULE 7 applies to the employer concerned.
0.05%
10. Employment in respect of which, for the purpose of calculating the relevant premium under the Insurance Premiums Order 2015/16, a business classification listed in SCHEDULE 8 applies to the employer concerned.
0.025%

98 APPENDIX 11: LAND DISPOSAL
APPENDICES
Note:
1. If wages are payable by an employer (including a self-insurer) to workers in respect of employment during the relevant period, being employment of the class specified in item 1 of Column 1 of the above Table, the percentage of wages specified in Column 2 for that item applies to such part of the total wages payable to the employer’s workers as relates to employment of that class, and items 2-10 of the Table (as the case may require) apply to the remainder of the wages.
2. If, in the calculation of an employer’s premium under the Insurance Premiums Order 2015/16, business classifications mentioned in two or more of Schedules 1-8 below properly apply to the employer, the dust diseases contribution rates in Column 2 of the Table are to apply to such part of the total wages payable by the employer as relates to the relevant classification. The same applies to calculation of a self-insurer’s dust diseases contribution by reference to its WorkCover Authority Fund contribution.
3. If the Insurance Premiums Order 2015/16 does not apply to an employer’s policy, the contribution to be paid by the insurer concerned under section 6 of the Dust Diseases Act is to be calculated as if that Order did apply to the policy.
4. See Table B to the Insurance Premiums Order 2015/16 for full descriptions of relevant business classifications below.
5. The expressions “policy”, and “workers” used above have the same meanings as in the Workers Compensation Act 1987 and the Workplace Injury Management and Workers Compensation Act 1998 and references to wages “payable” include references to wages paid.
6. The expression “wages” used above has the same meaning as in the Insurance Premiums Order 2015/16.
Class No. in Insurance Premiums Order Business classification
Contribution (% of wages)
Schedule 1 1.25%263210 Fibro-Cement Sheeting
Manufacturing282100 Shipbuilding
Schedule 2 0.50%255100 Rubber Tyre Manufacturing424200 Carpentry Services425940 Construction Services nec
Schedule 3 0.28%041100 Rock Lobster Fishing041200 Prawn Fishing041300 Finfish Trawling041400 Squid Jigging041500 Line Fishing041900 Marine Fishing nec142010 Other Mining nec -
Underground142020 Other Mining nec - Surface221300 Cotton Textile Manufacturing221400 Wool Textile Manufacturing221500 Textile Finishing255900 Other Rubber Product
Manufacturing nec262100 Clay Brick Manufacturing262300 Ceramic Tile and Pipe
Manufacturing262900 Other Ceramic Product
Manufacturing nec263100 Cement and Lime
Manufacturing263400 Concrete Pipe and Box
Culvert Manufacturing263510 Terrazzo Manufacturing271200 Iron and Steel Casting and
Forging272300 Copper, Silver, Lead and Zinc
Smelting, Refining281100 Motor Vehicle Manufacturing282900 Transport Equipment
Manufacturing nec294900 Manufacturing nec421010 Demolition422200 Bricklaying Services422300 Roofing Services423100 Plumbing Services424110 Cement Rendering and
Plastering424300 Tiling and Carpeting Services425930 Building Exterior Cleaning
and Maintenance Services

99WORKERS’ COMPENSATION (DUST DISEASES) BOARD 2014/15 ANNUAL REPORT
Class No. in Insurance Premiums Order Business classification
Contribution (% of wages)
650100 Pipeline Transport650900 Transport nec662100 Stevedoring662920 Services to Water
Transport nec
Schedule 4 0.165%131610 Nickel Ore Mining -
Underground131620 Nickel Ore Mining - Surface131720 Silver-Lead-Zinc Ore Mining -
Surface131910 Other Metal Ore Mining nec -
Underground131920 Other Metal Ore Mining nec -
Surface141100 Gravel and Sand Quarrying211130 Meat Processing218200 Beer and Malt Manufacturing221100 Wool Scouring221200 Synthetic Fibre Textile
Manufacturing222200 Textile Floor Covering
Manufacturing222300 Rope, Cordage and Twine
Manufacturing222900 Other Textile Product
Manufacturing nec224100 Men’s and Women’s Clothing
Manufacturing224200 Tailoring and Dress-making224300 Sleepwear, Underwear and
Baby Clothing Mfg224900 Other Clothing Manufacturing
nec251000 Petroleum Refining253500 Inorganic Industrial Chemical
Manufacturing nec254200 Paint Manufacturing254500 Soap and Other Detergent
Manufacturing254900 Other Chemical Product
Manufacturing nec261000 Glass and Glass Product
Manufacturing262100 Clay Brick Manufacturing262200 Ceramic Product
Manufacturing262900 Other Ceramic Product
Manufacturing nec263220 Plaster Product
Manufacturing
Class No. in Insurance Premiums Order Business classification
Contribution (% of wages)
263400 Concrete Pipe and Box Culvert Manufacturing
263520 Concrete Product Manufacturing nec
264010 Fibreglass Insulation Products Manufacturing
264020 Non-Metallic Mineral Product Manufacturing nec
271100 Basic Iron and Steel Manufacturing
271300 Steel Pipe and Tube Manufacturing
272100 Alumina Production272200 Aluminium Smelting272900 Basic Non-Ferrous Metal
Manufacturing nec273100 Aluminium Rolling, Drawing,
Extruding273200 Non-Ferrous Metal Rolling,
Drawing, Extruding nec273300 Non-Ferrous Metal Casting274100 Structural Steel Fabricating274900 Structural Metal Product
Manufacturing nec275100 Metal Container
Manufacturing275900 Sheet Metal Product
Manufacturing nec276100 Hand Tool and General
Hardware Manufacturing276300 Nut, Bolt, Screw and Rivet
Manufacturing276900 Fabricated Metal Product
Manufacturing nec282210 Boatbuilding282220 Boat repairing285100 Household Appliance
Manufacturing285200 Electrical Cable and Wire
Manufacturing291900 Prefabricated Building
Manufacturing nec294200 Toy and Sporting Good
Manufacturing361000 Electricity Supply362000 Gas Supply370100 Water Supply370200 Sewerage and Drainage
Services411100 House Construction

100 APPENDIX 11: LAND DISPOSAL
APPENDICES
Class No. in Insurance Premiums Order Business classification
Contribution (% of wages)
411200 Residential Building Construction nec
422300 Roofing Services423100 Plumbing Services423200 Electrical Services423300 Air Conditioning and Heating
Services424120 Plasterboard and Decorative
Plaster Fixing424400 Painting and Decorating
Services424510 Aluminium Door and Window
Installation424520 Glazing Services425910 Scaffolding Services425920 Exterior/Interior Blind and
Awning Installation Services462400 Motor Vehicle Dismantling525900 Retailing nec620000 Rail Transport630100 International Sea Transport630200 Coastal Water Transport662200 Water Transport Terminals662300 Port Operators662910 Water Transport Agency
Services952110 Laundry and Dry Cleaning
Operations952120 Self-service Laundries and
Dry Cleaning Agencies963300 Fire Brigade and Civil
Emergency Services
Schedule 5 0.110%012300 Sheep-Beef Cattle Farming120000 Oil and Gas Extraction131100 Iron Ore Mining131200 Copper Ore Mining -
Underground131300 Copper Ore Mining - Surface131500 Mineral Sand Mining131710 Silver-Lead-Zinc Ore Mining -
Underground152000 Other Mining Services211110 Abattoirs211120 Meat Packing and Freezing211140 Animal By-product
Processing nec216100 Bread Manufacturing217300 Seafood Processing218400 Spirit Manufacturing219000 Tobacco Product
Manufacturing
Class No. in Insurance Premiums Order Business classification
Contribution (% of wages)
222110 Made-up Textile Product Manufacturing
231200 Wood Chipping231300 Timber Resawing and
Dressing232100 Plywood and Veneer
Manufacturing233400 Paper Bag and Sack
Manufacturing252000 Petroleum & Coal Product
Manufacturing nec253100 Fertiliser Manufacturing253400 Organic Industrial Chemical
Manufacturing nec254100 Explosive Manufacturing254400 Pesticide Manufacturing254700 Ink Manufacturing276400 Metal Coating and Finishing276500 Non-Ferrous Pipe Fitting
Manufacturing281300 Automotive Electrical and
Instrument Manufacturing281900 Automotive Component
Manufacturing nec282300 Railway Equipment
Manufacturing282400 Aircraft Manufacturing286410 Machine Tool and Part
Manufacturing286420 Metal Dies, Cutting, Sinking,
Manufacturing and Repairing286700 Commercial Space Heating
and Cooling Equipment Manufacturing
286900 Industrial Machinery and Equipment Manufacturing nec
294100 Jewellery and Silverware Manufacturing
422110 Concrete Construction Services
422400 Structural Steel Erection Services
452300 Chemical Wholesaling453900 Building Supplies Wholesaling
nec472200 Clothing Wholesaling523300 Domestic Hardware and
Houseware Retailing532900 Automotive Repair and
Services nec661900 Services to Road Transport nec663000 Services to Air Transport963400 Waste Disposal Services

101WORKERS’ COMPENSATION (DUST DISEASES) BOARD 2014/15 ANNUAL REPORT
Class No. in Insurance Premiums Order Business classification
Contribution (% of wages)
Schedule 6 0.075 012400 Sheep Farming013000 Dairy Cattle Farming021100 Cotton Ginning021300 Aerial Agricultural Services021910 Services to Livestock Farming
nec021920 Services to Crop Farming nec 021930 Services to Fruit & Vegetable
Growing nec021960 Pet Boarding and Kennels nec030100 Forestry110100 Coal Mining - Underground110200 Coal Mining - Surface131410 Gold Ore Mining -
Underground131420 Gold Ore Mining - Surface211210 Poultry Abattoirs211300 Bacon, Ham and Smallgood
Manufacturing212100 Milk and Cream Processing212900 Dairy Product Manufacturing
nec214000 Oil and Fat Manufacturing216200 Cake and Pastry
Manufacturing216300 Biscuit Manufacturing217400 Prepared Animal and Bird
Feed Manufacturing218100 Soft Drink, Cordial and Syrup
Manufacturing218300 Wine Manufacturing222120 Furniture Upholstery and
Covers Mfg222130 Non-canvas Textile Blind and
Awning Manufacturing226100 Leather Tanning and Fur
Dressing226200 Leather and Leather
Substitute Product Mfg232200 Fabricated Wood
Manufacturing233100 Pulp, Paper and Paperboard
Manufacturing241100 Paper Stationery
Manufacturing241210 Printing241220 Newspaper Printing254300 Medicinal and Pharmaceutical
Product Manufacturing254600 Cosmetic and Toiletry
Preparation Manufacturing
Class No. in Insurance Premiums Order Business classification
Contribution (% of wages)
263300 Concrete Slurry Manufacturing
276200 Spring and Wire Product Manufacturing
285300 Battery Manufacturing285400 Electric Light and Sign
Manufacturing286100 Agricultural Machinery
Manufacturing286300 Food Processing Machinery
Manufacturing286500 Lifting and Material Handling
Equipment Manufacturing291100 Prefabricated Metal Building
Manufacturing292200 Sheet Metal Furniture
Manufacturing421020 Site Preparation Services451900 Farm Produce and Supplies
Wholesaling nec452100 Petroleum Product
Wholesaling453100 Timber Wholesaling532400 Tyre Retailing661100 Parking Services664900 Services to Transport nec712000 Telecommunication Services786610 Cleaning Services : Non
Government Contractors786620 Cleaning Services :
Government Contractors820000 Defence861200 Psychiatric Hospitals923900 Recreational Parks and
Gardens
Schedule 7 0.05 per cent 012100 Grain Growing012510 Beef Cattle Farming021200 Shearing Services021940 Agricultural Land Clearing &
Fencing 021950 Other Services to Agriculture
nec030210 Softwood Timber Plantation
Logging030220 Hardwood and Other Timber
Logging 030300 Services to Forestry211220 Poultry Meat Processing212200 Ice Cream Manufacturing231100 Log Sawmilling232910 Wooden Blind Manufacturing

102 APPENDIX 11: LAND DISPOSAL
APPENDICES
Class No. in Insurance Premiums Order Business classification
Contribution (% of wages)
233200 Solid Paperboard Container Manufacturing
233300 Corrugated Paperboard Container Manufacturing
233900 Other Paper Product Manufacturing nec
241310 Printing Trade Services241320 Services to Printing and
Publishing nec256100 Plastic Blow Moulded Product
Manufacturing256200 Plastic Extruded Product
Manufacturing256400 Plastic Product, Rigid Fibre
Reinforced, Mfg281200 Motor Vehicle Body
Manufacturing286200 Mining and Construction
Machinery Manufacturing286600 Pump and Compressor
Manufacturing292300 Mattress Manufacturing
(Except Rubber)292900 Furniture Manufacturing nec412100 Road and Bridge Construction451100 Wool Wholesaling451200 Cereal Grain Wholesaling452200 Metal and Mineral
Wholesaling461500 Electrical and Electronic
Equipment Wholesaling nec461900 Machinery & Equipment
Wholesaling nec523500 Recorded Music Retailing525400 Flower Retailing532200 Automotive Electrical
Services532300 Smash Repairing611010 Road Freight Transport - Bulk
Freight611020 Road Freight Transport -
Short Distance 611030 Road Freight Transport -
Long Distance630300 Inland Water Transport664100 Travel Agency Services664310 Freight Forwarding (Other
Than Road) - Goods Handling664420 Customs Agencies - No
Goods Handling782300 Consulting Engineering Services782920 Technical Services nec786420 Building Caretaking Services
Class No. in Insurance Premiums Order Business classification
Contribution (% of wages)
843200 Technical and Further Education
844010 Driving Schools844020 Other Education and Training
nec861100 Hospitals (Except Psychiatric
Hospitals)911100 Film and Video Production970000 Private Households
Employing Staff
Schedule 8 0.025% 011100 Plant Nurseries011200 Cut Flower and Flower Seed
Growing011300 Vegetable Growing011400 Grape Growing011500 Apple and Pear Growing011600 Stone Fruit Growing011700 Kiwi Fruit Growing011900 Fruit Growing nec012200 Combined Grain Growing,
Sheep Farming and Beef Cattle Farming
012520 Beef Cattle Feedlots 014100 Poultry Farming (Meat)014200 Poultry Farming (Eggs)015100 Pig Farming015200 Horse Farming015300 Deer Farming015900 Other Livestock Farming nec016100 Sugar Cane Growing016200 Cotton Growing016900 Other Crop and Plant Growing
nec022000 Hunting and Trapping042000 Aquaculture141900 Construction Material Mining
nec151100 Petroleum Exploration (Own
Account)151200 Petroleum Exploration151300 Mineral Exploration (Own
Account)151400 Mineral Exploration Services213000 Fruit and Vegetable
Processing215100 Flour Mill Product
Manufacturing215200 Cereal Food and Baking Mix
Manufacturing223100 Hosiery Manufacturing

103WORKERS’ COMPENSATION (DUST DISEASES) BOARD 2014/15 ANNUAL REPORT
Class No. in Insurance Premiums Order Business classification
Contribution (% of wages)
223200 Cardigan and Pullover Manufacturing
223900 Knitting Mill Product Manufacturing nec
225000 Footwear Manufacturing232300 Wooden Structural
Component Manufacturing232920 Other Wood Product
Manufacturing nec242100 Newspaper Publishing242200 Other Periodical Publishing242300 Book and Other Publishing243000 Recorded Media
Manufacturing and Publishing253200 Industrial Gas Manufacturing253300 Synthetic Resin
Manufacturing256300 Plastic Bag and Film
Manufacturing256500 Plastic Foam Product
Manufacturing256600 Plastic Injection Moulded
Product Manufacturing274200 Architectural Aluminium
Product Manufacturing283100 Photographic and Optical
Good Manufacturing283200 Medical and Surgical
Equipment Manufacturing283900 Professional and Scientific
Equipment Manufacturing nec284100 Computer and Business
Machine Manufacturing284200 Telecommunication, Broadcasting
and Transceiving Equipment Manufacturing
284900 Other Electronic Equipment Manufacturing nec
285900 Other Electrical Equipment Manufacturing nec
292100 Wooden Furniture and Upholstered Seat Manufacturing
411300 Non-Residential Building Construction
412200 Non-Building Construction nec
422120 Concrete Paving Services
423400 Telecommunication, Alarm and Security System Installation Services
425100 Landscaping Services
Class No. in Insurance Premiums Order Business classification
Contribution (% of wages)
461100 Farm and Construction Machinery Wholesaling
461200 Professional Equipment Wholesaling
461300 Computer Wholesaling461400 Business Machine
Wholesaling nec462100 Car Wholesaling462200 Commercial Vehicle
Wholesaling462300 Motor Vehicle New or Used
Part Dealing471100 Meat Wholesaling471200 Poultry and Smallgood
Wholesaling471300 Dairy Produce Wholesaling471400 Fish Wholesaling471500 Fruit and Vegetable
Wholesaling471600 Confectionery and Soft Drink
Wholesaling471700 Liquor Wholesaling471800 Tobacco Product Wholesaling471900 Grocery Wholesaling nec472100 Textile Product Wholesaling472300 Footwear Wholesaling473100 Household Appliance
Wholesaling473200 Furniture Wholesaling473300 Floor Covering Wholesaling473900 Household Good Wholesaling
nec479100 Photographic Equipment
Wholesaling479200 Jewellery and Watch
Wholesaling479300 Toy and Sporting Good
Wholesaling479400 Book and Magazine
Wholesaling479500 Paper Product Wholesaling479600 Pharmaceutical and Toiletry
Wholesaling479910 Wholesaling nec479920 Wholesaling Trade Agent - No
Goods Handling511000 Supermarket and Grocery
Stores512100 Fresh Meat, Fish and Poultry
Retailing512200 Fruit and Vegetable Retailing512300 Liquor Retailing

104 APPENDIX 11: LAND DISPOSAL
APPENDICES
Class No. in Insurance Premiums Order Business classification
Contribution (% of wages)
512400 Bread and Cake Retailing512500 Takeaway Food Retailing512600 Milk Vending512900 Specialised Food Retailing
nec521000 Department Stores522100 Clothing Retailing522200 Footwear Retailing522300 Fabric and Other Soft Good
Retailing523100 Furniture Retailing523200 Floor Covering Retailing523400 Domestic Appliance Retailing524100 Sport and Camping
Equipment Retailing524200 Toy and Game Retailing524300 Newspaper, Book and
Stationery Retailing524400 Photographic Equipment
Retailing524500 Marine Equipment Retailing525100 Pharmaceutical, Cosmetic and
Toiletry Retailing525200 Antique and Used Good
Retailing525300 Garden Equipment Retailing525500 Watch, Spectacles and
Jewellery Retailing526110 Household Equipment Repair
Services (Electrical)526120 Household Equipment Repair
Services (Electronics)526900 Household Equipment Repair
Services nec531100 Car Retailing531200 Motor Cycle Dealing531300 Trailer and Caravan Dealing532100 Automotive Fuel Retailing571000 Accommodation572000 Pubs, Taverns and Bars573000 Cafes and Restaurants574000 Clubs (Hospitality)611040 Furniture Delivery and
Removal Service612100 Long Distance Bus Transport612200 Short Distance Bus Transport
(Including Tramway)612340 Other Road Passenger
Transport nec640100 Scheduled International Air
Transport
Class No. in Insurance Premiums Order Business classification
Contribution (% of wages)
640200 Scheduled Domestic Air Transport
640300 Non-Scheduled Air and Space Transport
664210 Freight Forwarding (Road) - Goods Handling
664220 Freight Forwarding (Road) - No Goods Handling
664320 Freight Forwarding (Other than Road) - No Goods Handling
664410 Customs Agencies - Goods Handling
670100 Grain Storage670900 Storage nec711110 Postal Delivery Services711120 Postal Agency Services711200 Courier Services731000 Central Bank732100 Banks732200 Building Societies732300 Credit Unions732400 Money Market Dealers732900 Deposit Taking Financiers nec733000 Other Financiers734000 Financial Asset Investors741100 Life Insurance741200 Superannuation Funds742100 Health Insurance742200 General Insurance751100 Financial Asset Broking
Services751900 Services to Finance and
Investment nec752000 Services to Insurance771110 Residential Strata Schemes771120 Residential Property
Operators771210 Commercial Property Strata
Schemes771220 Commercial Property
Operators and Developers772000 Real Estate Agents773000 Non-Financial Asset Investors774100 Motor Vehicle Hiring774210 Boat and Ferry Hiring774220 Other Transport Equipment
Leasing nec774310 Plant and Machinery Hiring
and Leasing Without Operator
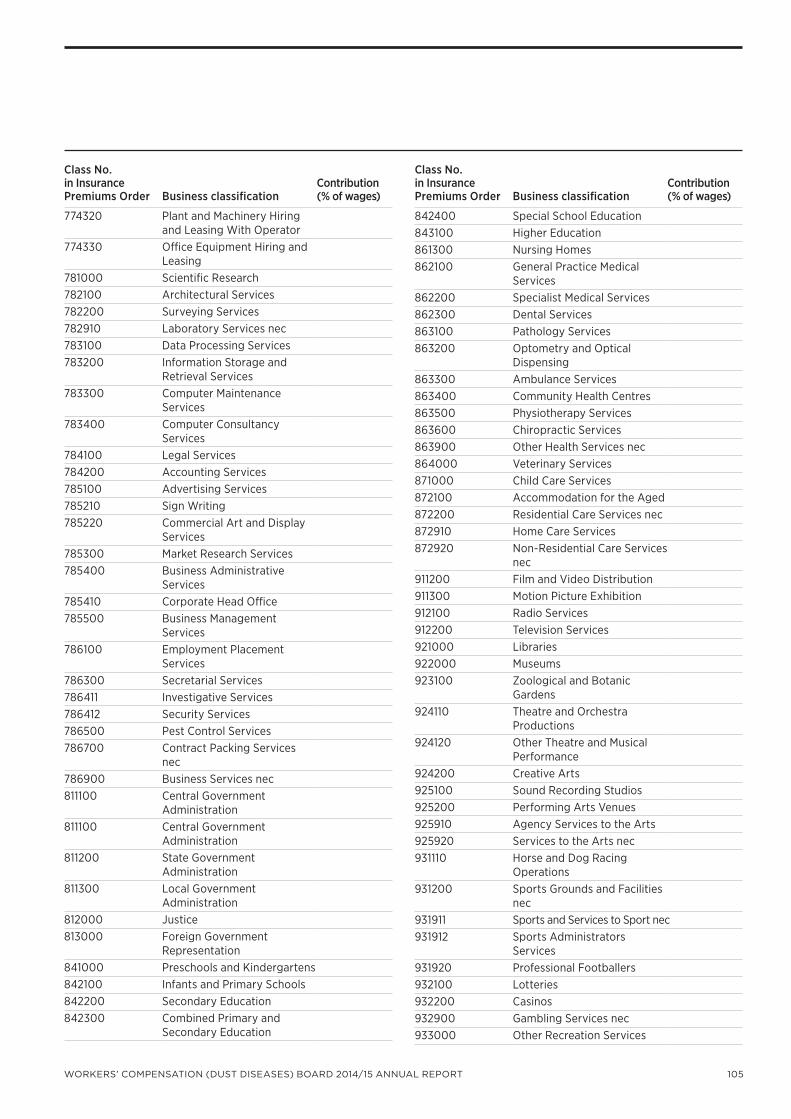
105WORKERS’ COMPENSATION (DUST DISEASES) BOARD 2014/15 ANNUAL REPORT
Class No. in Insurance Premiums Order Business classification
Contribution (% of wages)
774320 Plant and Machinery Hiring and Leasing With Operator
774330 Office Equipment Hiring and Leasing
781000 Scientific Research782100 Architectural Services782200 Surveying Services782910 Laboratory Services nec783100 Data Processing Services783200 Information Storage and
Retrieval Services783300 Computer Maintenance
Services783400 Computer Consultancy
Services784100 Legal Services784200 Accounting Services785100 Advertising Services785210 Sign Writing785220 Commercial Art and Display
Services785300 Market Research Services785400 Business Administrative
Services785410 Corporate Head Office785500 Business Management
Services786100 Employment Placement
Services786300 Secretarial Services786411 Investigative Services786412 Security Services786500 Pest Control Services786700 Contract Packing Services
nec786900 Business Services nec811100 Central Government
Administration811100 Central Government
Administration811200 State Government
Administration811300 Local Government
Administration812000 Justice813000 Foreign Government
Representation841000 Preschools and Kindergartens842100 Infants and Primary Schools842200 Secondary Education842300 Combined Primary and
Secondary Education
Class No. in Insurance Premiums Order Business classification
Contribution (% of wages)
842400 Special School Education843100 Higher Education861300 Nursing Homes862100 General Practice Medical
Services862200 Specialist Medical Services862300 Dental Services863100 Pathology Services863200 Optometry and Optical
Dispensing863300 Ambulance Services863400 Community Health Centres863500 Physiotherapy Services863600 Chiropractic Services863900 Other Health Services nec864000 Veterinary Services871000 Child Care Services872100 Accommodation for the Aged872200 Residential Care Services nec872910 Home Care Services872920 Non-Residential Care Services
nec911200 Film and Video Distribution911300 Motion Picture Exhibition912100 Radio Services912200 Television Services921000 Libraries922000 Museums923100 Zoological and Botanic
Gardens924110 Theatre and Orchestra
Productions924120 Other Theatre and Musical
Performance924200 Creative Arts925100 Sound Recording Studios925200 Performing Arts Venues925910 Agency Services to the Arts925920 Services to the Arts nec931110 Horse and Dog Racing
Operations931200 Sports Grounds and Facilities
nec931911 Sports and Services to Sport nec931912 Sports Administrators
Services931920 Professional Footballers932100 Lotteries932200 Casinos932900 Gambling Services nec933000 Other Recreation Services

106 APPENDIX 11: LAND DISPOSAL
APPENDICES
Class No. in Insurance Premiums Order Business classification
Contribution (% of wages)
951100 Video Hire Outlets951900 Personal and Household
Goods Hiring nec952130 Carpet Cleaners952200 Photographic Film Processing952300 Photographic Studios952400 Funeral Directors, Crematoria
and Cemeteries952510 Gardening Services952520 Amenity Tree Services952600 Hairdressing and Beauty
Salons952910 Adult Personal Services952920 Personal Services nec961000 Religious Organisations962100 Business and Professional
Associations962200 Labour Associations962900 Interest Groups nec963100 Police Services963200 Corrective Centres
APPENDIX 17: CORPORATE PLAN OBJECTIVES AND RESULTS 2014/15
Key Result Area Key Performance Indicators Target 2014/15 Results
Efficient compensation services
• Quality and timely services
• Simple application processes
• Sound decision making
• Clear, communication about our services, processes and decisions
1. Medical examinations undertaken at DDB within 30 days
75% by 2013 80% by 2015
100%
2. Compensation applications determined within 60 days
70% by 2013 85% by 2015
50%
3. Benefits and substantiated expenses paid to beneficiaries within 30 days
95% 99%
4. Accurate payment of entitlements paid to beneficiaries within 14 days
100% 100%
Sound fund management and scheme viability
• Effective governance, audit and risk management
• Accurate actuarial assessments
• Proactive assessment of key cost drivers and trends
5. Accurate levy setting 98% 100%
6. Levies collected by due date 90% 82%
7. Funding ratio 90–110% 135%
Exemplar Organisation
• Organisation capability to deliver our services
• Effective performance management
• A safe, supportive and productive workplace
8. Lost time injury frequency rate not to exceed public sector average
100%
9. All staff have a Development Plan 100% 97%

107WORKERS’ COMPENSATION (DUST DISEASES) BOARD 2014/15 ANNUAL REPORT
Key Result Area Key Performance Indicators Target 2014/15 Results
Cost and Efficiency
• Evidence used to direct and prioritise our services
• Operate within budget
• Benchmark the cost of service delivery
• Measure our outcomes
• Manage our risks
10. Actual operating expenditure (excluding finance and compensation costs) varies less than 5% from budget
100% 94%
11. Close out of action items raised in audit reports by due date
>80% 57%1
Customer Focus Approach
• Customer Service Charter and service standards are linked to our values
• A consistent and seamless customer experience
• Accessible, timely and accurate information
• Effective applicant referral pathways
12. Fair and transparent decisions <1% decisions varied by
internal review or appeal
<1%
13. Customer satisfaction with compensation services
>85% by 2014 93%*
14. Compliance with service standards >90% 90%
15. Complaints resolved within 28 days 100% 100%
16. Compensation estate payment amounts settled within 28 days of death
100% 100%
* 2013/14 result. The DDB conducts a customer satisfaction survey on a bi-annual basis.
1. The DDB Compensation Entitlements Report was issued in June 2014 with all recommendations due for completion during 2014/15. The report raised seven recommendations and there have been four of those completed by the due date with three recommendations still past due. Therefore, DDB’s “Close out of action items raised in audit reports by due date” is 57%. There were no reviews for DDB completed during 2014/15, as the current CMS review is yet to be completed.
APPENDIX 18: BOARD AND COMMITTEE MEETINGS
MEETINGS OF THE BOARD
Meetings of the members of the Board are generally held monthly. Eleven meetings were held during the year. Member attendances are listed below:
Meetings attended
ChairJ. Newman 7V. Bhatia 5
Employer representativesS.W.S Kidziak (Member) 9B Eichhorn (Member 11R Petty (Member) 11B Seidler ( Alternate Member) 0G Choice (Alternate Member) 0G Patterson (Alternate Member) 0
Employee representativesR Mallia (Member) 9D Henry (Member) 9P Noack (Member) 8S Robinson (Alternate Member) 6A Sawtschuk (Alternate Member) 0M Morey (Alternate Member) 1
MEETINGS OF THE MEDICAL AUTHORITY
A total of 30 meetings were held during the year. Member attendances are listed below:
Meetings attended
ChairsProfessor D Bryant (Chair) MBBS (Syd), MRACP, FRACP
17
Dr IT Gardiner (Alternate Chair) MBBS (NSW), FRACP
12
Employer RepresentativesDr G Kauffman (Member) M.B.B.S (Hons) BSc(MED) (Hons) FRACP
9
Dr JS Mann (Alternate Member) MBBS (Syd), MD (Syd), FRACP
11
Dr E Clark (Alternate Member) MBBS, MRCP (Lond)
10
Employee RepresentativesDr C Clarke (Member) MB, PhD (Lond), LLM, FRACP
12
Dr G Hart (Alternate Member) MBBS, MRCP (Lond), FRACP
10
Dr G Tyler (Alternate Member) Bachelor of Medicine, FRACP, ANZRS
8

108 APPENDIX 19: PUBLICATION NOTES
APPENDICES
SRWS AUDIT AND RISK COMMITTEE
The role of the audit and risk committee is to provide independent assistance to the board and the Workers’ Compensation (Dust Diseases) Board of the administration and operation of governance, risk management and control frameworks.
The committee provides an integral role in supporting the Board to fulfil its corporate governance and oversight responsibilities, and to make decisions in relation to areas such as financial reporting, internal control and associated risk management systems, and internal and external audit functions.
SRWS AUDIT AND RISK COMMITTEE ATTENDANCE
SRWS audit and risk committeeNumber eligible
to attendNumber
attended
Raymond Whitten (Chair) 6 6Elizabeth Carr 6 6Mark Lennon 6 4Ray Petty 6 5Vivek Bhatia (CEO)* 5 5Julie Newman (former CEO) 1 1
* The CEO is a standing invitee. Mr Vivek Bhatia was appointed as CEO of SRWS in August 2014
SRWS INVESTMENT COMMITTEE
The role of the investment committee is to determine the policies, practices and strategies for investments of the relevant SRWS funds. This includes monitoring the investment performance of the funds and reviewing investment compliance.
The investment committee provides an integral role in supporting the Board to fulfil its investment responsibilities and to make decisions in relation to investment policies, investment objectives, strategic asset allocations and the risk profiles of the funds.
INVESTMENT COMMITTEE ATTENDANCE
Investment committeeNumber eligible
to attendNumber
attended
Peeyush Gupta (Chair) 10 9Michael Carapiet 10 10Gavin Bell 10 7Raymond Whitten 10 9Vivek Bhatia (CEO)* 9 9Julie Newman (former CEO) 1 1
* The CEO is a standing invitee. Mr Vivek Bhatia was appointed as CEO of SRWS in August 2014
SRWS HUMAN RESOURCES COMMITTEE
The role of the human resources committee is to support the Board by reviewing and monitoring the development and implementation of relevant human resource strategies and initiatives to ensure as far as practicable, that the activities of the SRWS are carried out properly and efficiently.
HUMAN RESOURCES COMMITTEE ATTENDANCE
Human resources committeeNumber eligible
to attendNumber
attended
Gavin Bell (Chair) 4 4Elizabeth Carr 4 4Michael Carapiet 4 4Vivek Bhatia 4 4
ABOLISHED ENTITIES
There were no abolished entities during the reporting year
APPENDIX 19: PUBLICATION NOTES
A copy of the Workers’ Compensation (Dust Diseases) Board Annual Report 2014/15 can be downloaded from the Workers Compensation (Dust Diseases) Board website, at www.ddb.nsw.gov.au. The cost of the 2014/15 Annual Report was $7805.00.

T
Training and development 30
W
Women 33
Workers’ Compensation (Dust Diseases) Act 1942 Contributions under section 6 for
2015/16 financial year 96
Workforce diversity and inclusion 33
Work health and safety performance
and employee wellbeing 32
Y
Young workers 33
L
Land disposal 94
Legislation 8, 86
M
Medical Authority Certificates –
new dust diseases cases certified 96
Medical authority support team 24
Medical screening service 27
Meetings of the Board 107
Meetings of the Medical Authority 107
Mission and values 6
Multicultural policies and services program 34
N
Notes to the Financial Statements 50
O
Overseas travel 2014/15 92
P
Performance management 30
Public interest disclosures 37
R
Research and community grants scheme 28
Research and education 28
S
Safety, Return to Work and Support Executive 16
SRWS audit and risk committee 108
SRWS Human resources committee 108
SRWS Investment committee 108
Statement by the Chief Executive Officer 43
Statement of Cash Flows for the
year ended 30 June 2015 49
Statement of Changes in Equity for the
year ended 30 June 2015 48
Statement of Comprehensive Income for the
year ended 30 June 2015 46
Statement of Financial Position as at
30 June 2015 47
A
About the Dust Diseases Board 12
Accounts payable performance 91
Actuarial Certificate 41
Appendices 85
Awards made since the inception
of the original scheme of 1927 94
B
Board and committee meetings 107
Budget and Estimates for 2015/16 82
C
Cases certified by the Medical Authority 95
CEO Review 10
Compensation services 22
Consultants 92
Corporate governance 36
Credit card certification 90
Culture of achievement and leadership 30
D
Digital Information Security Attestation
Statement 39
Disability 33
Dust Diseases Board and Senior Management 12
E
Energy performance and waste reduction 37
F
Financial Statements 40
G
Government Information
(Public Access) applications 87
Grants 93
I
Independent Auditor’s Report 44
Indigenous employees 33
Industrial history services 24
Internal Audit and Risk Management Statement 38
Investment performance 20
INDEX
109

This page has been left blank intentionally.
110

This page has been left blank intentionally.
111