Review Of The Transitional Stabilisation Programme (TSP ...
18
Review Of The Transitional Stabilisation Programme (TSP) August 2020 1 Review Of The Transitional Stabilisation Programme (TSP) August 2020
Transcript of Review Of The Transitional Stabilisation Programme (TSP ...

Review Of The Transitional Stabilisation Programme (TSP) August 2020
1
Review Of The Transitional
Stabilisation Programme (TSP)
August 2020

Review Of The Transitional Stabilisation Programme (TSP) August 20202
Contents List of Acronyms 4Introduction 5Review of the Transitional Stabilisation Programme (TSP) 5Table 1: Macroeconomic Performance 7Overall Economic Performance 7Table 2: Industry (including construction),value added per worker (constant 2010 US$), 2010-2018 7Table 3: GDP per person employed(constant 2011 PPP $), 2010-2019 8 Table 4: Sectoral spending targets and performance based on the 2019 and 2020 estimates 8Table 5: Unemployment rate 10Table 6: Household and Individual Prevalence of Poverty-1995, 2001, 2011 and 2017 (%) 11Table 7: Poverty Prevalence (Percent) for people, Males and Females,Rural and Urban Areas 11Table 8: Poverty Prevalence (Percent)for People Males and FemalesYouths (15-35 Years) 12Table 9: Zimbabwe’s HDI Trends, 1990-2018 13Conclusion and Recommendations 13List of References 16

Review Of The Transitional Stabilisation Programme (TSP) August 2020
3

Review Of The Transitional Stabilisation Programme (TSP) August 20204
List of Acronyms
AfDB African Development Bank
COVID-19 Corona virus disease
CZI Confederation of Zimbabwe Industries
DRC Democratic Republic of Congo
ESAP Economic Structural Adjustment Programme
FDI Foreign Direct Investment
GDI Gender Development Index
GDP Gross Domestic Product
GNI Gross National Income
HDI Human Development Index
IPRSP Interim Poverty Reduction Strategy Paper
LFCLS Labour Force and Child Labour Survey
MERP Millennium Economic Recovery Programme
MSMEs Micro, Small and Medium Enterprises
NEDPP National Economic Development Priority Programme
NEET Not in Employment, Education or Training
NERP National Economic Revival Programme
RBZ Reserve Bank of Zimbabwe
SSA Sub Saharan Africa
TSP Transitional Stabilisation Programme
TVEs Township and Village Enterprises
ZEDS Zimbabwe Economic Development Strategy
ZIMASSET Zimbabwe Agenda for Sustainable Socio-Economic Transformation
ZIMPREST Zimbabwe Programme for Economic and Social Transformation
ZIMSTAT Zimbabwe National Statistics Agency
Review Of The Transitional Stabilisation Programme (TSP) August 2020
5
IntroductionSince independence, the government has come up with so many economic blueprints including: Growth with Equity (1981); Transitional National Development Plan (1982-85); 1st Five Year National Development Plan (1986-90); Economic Structural Adjustment Programme - ESAP (1991-1995); Zimbabwe Programme for Economic and Social Transformation - ZIMPREST (1996-2000); Millennium Economic Recovery Programme - MERP (2000); Ten Point Plan, with an emphasis on agriculture (2002); National Economic Revival Programme - NERP (2003); Macroeconomic Policy Framework (2005–2006): ‘Towards Sustained Economic Growth’; Expansionary Monetary Policies (2003–2008); National Economic Development Priority Programme - NEDPP (2007); the Zimbabwe Economic Development Strategy (ZEDS) which was supposed to run from 2008-2013; the Short-term Emergency Recovery Program-me(STERP) (2009); the Zimbabwe Agenda for Sustainable Socio-Economic Transformation – ZIMASSET (2013-2018); the Interim Poverty Reduction Strategy Paper – IPRSP (2016-2018).
The Transitional Stabilisation Programme (TSP) was launched on 5 October 2018, and is running from October 2018 – December 2020. The focal areas of the TSP include: stabilising the macro-economy, and the financial sector; introducing necessary policy, and institutional reforms, to transform to a private sector led economy; and launching quick-wins to stimulate growth. The TSP is underpinned by the Vision 2030, ‘Towards an Upper Middle-Income Country.’
The Zimbabwean economy has been adversely affected by the COVID-19 pandemic through a number of channels which include: disruptions in trade which have affected the capacity of the country to import raw materials, decline in tourist arrivals, decline in commodity prices, and diversion of government resources to fight the outbreak would reduce funds available for key development priorities. Zimbabwe has a huge contingent of the diaspora population, and remittances are going to be affected. Foreign direct investment inflows are also going to be affected. The World Bank projects that the Zimbabwean economy will shrink by -10 percent in 2020 (World Bank, 2020).
Review of the Transitional Stabilisation Programme (TSP)A major critique of the TSP is that there were no effective consultations and dialogue with key stakeholders to reach a consensus and to achieve buy-in and support. A major reason for policy stillbirth and failure is the lack of effective participation by key stakeholders and the citizens in policy formulation. Development is not a top down approach but rather a bottom up approach. This is key to ensure that no one is left behind. The TSP is also based on shock therapy (a big bang structural adjustment approach). Such an approach may however not be desirable for a country like Zimbabwe that has serious capacity constraints in a number of areas. Developmental welfare states adopt a sequential and gradualist approach that focus on attacking the most binding constraints to development incrementally rather than trying to address many constraints simultaneously. In the words of Rodrik (2007), ‘Development success requires not a ‘big bang’ approach but, rather, a selective, sequential, and often unorthodox approach that accounts for country-specific circumstances.
Review Of The Transitional Stabilisation Programme (TSP) August 20206
The TSP is underpinned by the vision ‘Towards an Upper Middle-Income Country’ by 2030. According to the World Bank, upper middle-income economies are those economies with a Gross National Income (GNI) per capita between $3,956 and $12,235. However, attaining upper middle-income status and attaining pro-poor, decent-work rich and sustainable development are not the same thing. In other words, attaining upper middle-income country status is necessary but not sufficient to ensure the attainment of pro-poor, decent-work rich and sustainable development.’ Indeed, the country can attain upper middle-income status by 2030 without necessarily reducing poverty and creating full and productive employment opportunities. The growth experiences of a number of countries have shown that countries can actually attain stellar economic growth without creating jobs, a phenomenon known as ‘jobless’ growth and/or without reducing poverty. Full and productive employment creation and poverty eradication must be strategically, proactively and directly promoted and not rely on ‘trickle-down.’ For instance, despite Africa’s robust economic growth from 2000 to 2015, the absolute number of poor has increased on the continent. In their 2016 seminal publication, ‘Poverty in a Rising Africa’, Kathleen et al (2016) estimate that Africa had at least 50 million more poor people in 2013 compared to 1990, and Kharas and Fengler (2017) estimate that at least 2.4 million of new poor were added in 2017 alone. Therefore, the attainment of upper middle-income status must not be an end in itself but rather a means to an end. The end must be pro-poor, decent-work rich and sustainable development which eradicates poverty.
The TSP envisaged overall real GDP growth (%) of 6.3% (in 2018); 9.0% (in 2019); and 9.7% (in 2020) as shown in Table 1. While the TSP has clear economic growth targets there are no explicit targets on employment creation and poverty reduction. The TSP is therefore not based on a holistic approach to sustainable development that integrates economic, social and environmental imperatives and considerations. It is rather predicated on the underlying conventional macroeconomics assumption of ‘trickle down’ that once economic growth is attained that will automatically result in employment creation and poverty reduction. Also given that future economic growth is projected to be underpinned by the natural resource sectors (in particular mining) it is highly unlikely that a lot of employment opportunities would be created owing to high capital intensity. Such a projected growth pattern will also likely result in many people being left behind and left out of the growth dynamic.
As shown in Table 1, the overall real GDP growth (%) targets for 2018 and 2019 were missed. In 2018, the economy only grew by 3.4 percent against a TSP target of 6.3 percent, while in 2019, the economy declined by -6.5 percent against a TSP target of 9 percent. The target for 2020 will also be missed with the World Bank projecting economic decline of -10 percent for 2020 against the TSP target of 9.7 percent owing to the COVID-19 pandemic among other factors. Likewise, the inflation targets for 2018 and 2019 were missed with the target for 2020 also likely to be missed with the IMF projecting an average annual inflation of 221 percent for 2020 as shown in Table 1 (IMF, 2020). Revenues (% of GDP) fared below targeted performance in both 2018 and 2019 on account of the economic slowdown. However, the expenditures (% of GDP) targets for both 2018 and 2019 were achieved. This resulted in the country attaining a budget deficit (% of GDP) of -5.3 percent in 2018 against a target of -9 percent and a budget surplus (% of GDP) of 0.6 percent in 2019 against a target of -5.2 percent. The country also attained a positive current account balance (% of GDP) of 0.41 percent in 2018.

Review Of The Transitional Stabilisation Programme (TSP) August 2020
7
Table 2 shows the industry value added per worker for Zimbabwe, Zambia, South Africa, Malawi, Mozambique, Botswana, SSA and the World over the period 2010 to 2018. Value added per worker is an important measure of worker productivity in an economy. As at 2018, Botswana has the highest value added per worker, followed by South Africa. Zimbabwe lags behind Botswana, South Africa and Zambia with an industry value added of US$7,438.50.
Table 2: Industry (including construction), value added per worker (constant 2010 US$), 2010-2018
Source: Word Bank, World Development Indicators, April 2020.
Source: ZIMSTAT, IMF World Economic Outlook (WEO) database.
2018 2019 2020
TSP Target Actual TSP Target Actual TSP Target Projected
Overall Economic Performance
Real GDP growth (%) 6.3 3.4 9 -6.5 9.7 -10
Average Annual Inflation (%) 4 10.6 5 255 5 221
Per Capita Income (US$) 1,720.10 2,147 1,883.40 - 2,081.30 -
Government Accounts
Revenues (% of GDP) 22.3 21.0 22.2 17.8 22.2 -
Expenditures (% of GDP) 31.3 26.3 27.4 17.2 25.6 -
Recurrent Expenditures (% of GDP)
20.2 16.3 20.1 10.1 19 -
Employment Costs (% of GDP) 14.6 12.0 13.5 11 12.1 -
Capital Expenditures (% of GDP)
11.1 10.0 7.2 7.2 6.6 -
Overall Balance (% of GDP) -9 -5.3 -5.2 0.6 -3.5 -
Balance of Payments
Exports (% of GDP) 19.7 22.92 19.5 - 19.6 -
Imports (% of GDP) 28.5 22.51 29 - 28.6 -
Current Account Balance (% of GDP)
-2.9 0.41 -2.9 - -3.3 -
Table 1: Macroeconomic Performance
Zimbabwe Zambia South Africa Malawi Mozambique Botswana SSA World
2010 4,977.94 15,516.35 29,652.03 2,327.18 3,378.35 35,073.56 12,314.14 27,253.58
2011 5,495.75 14,265.61 29,884.57 2,276.29 3,287.36 32,602.56 12,266.64 27,370.43
2012 6,037.16 12,925.32 30,252.45 2,285.43 3,157.55 30,799.86 12,198.88 27,198.75
2013 6,649.58 12,880.95 29,897.06 2,185.86 3,068.73 33,922.37 12,072.71 27,653.99
2014 6,991.42 12,581.06 29,540.60 2,192.43 2,990.47 33,364.31 12,009.63 28,189.24
2015 6,937.32 12,754.40 28,261.80 2,188.87 2,999.04 29,739.64 11,582.72 28,820.50
2016 6,979.84 12,760.41 28,685.55 2,173.71 3,100.55 29,409.62 11,283.80 29,591.30
2017 6,976.14 12,889.17 28,457.48 2,132.14 3,262.86 27,803.22 11,098.50 30,424.19
2018 7,438.50 12,897.55 27,965.49 - 3,238.57 28,631.37 10,120.43 25,391.60
Review Of The Transitional Stabilisation Programme (TSP) August 20208
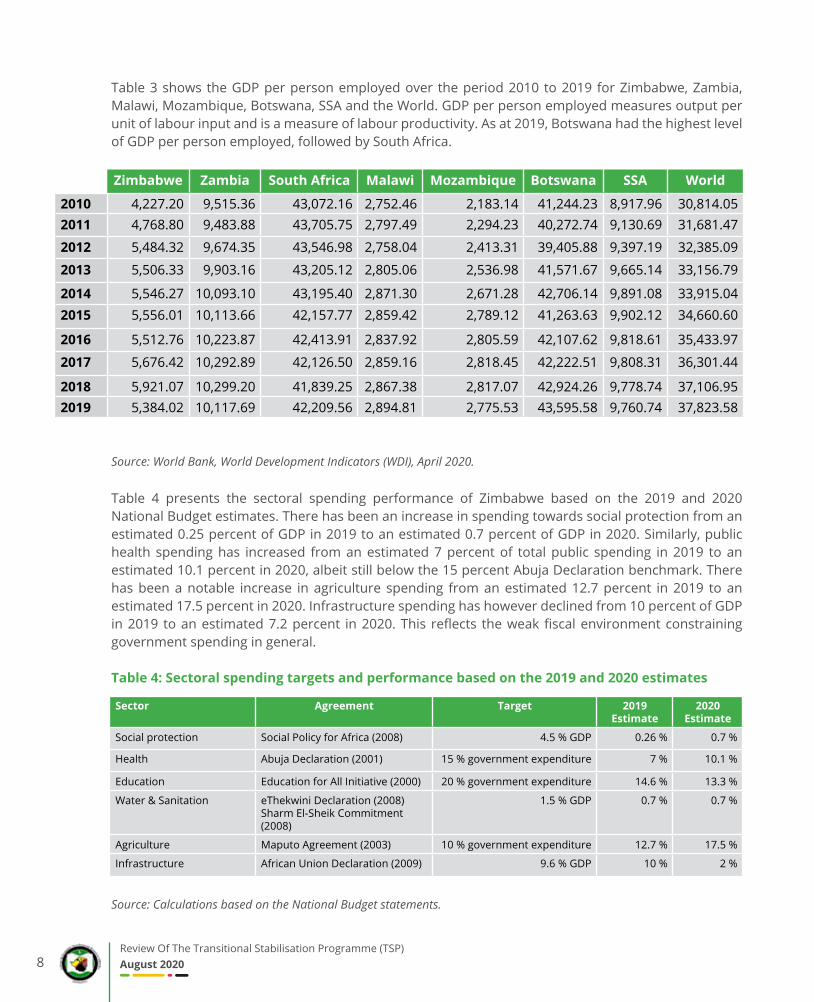
Table 3 shows the GDP per person employed over the period 2010 to 2019 for Zimbabwe, Zambia, Malawi, Mozambique, Botswana, SSA and the World. GDP per person employed measures output per unit of labour input and is a measure of labour productivity. As at 2019, Botswana had the highest level of GDP per person employed, followed by South Africa.
Table 3: GDP per person employed (constant 2011 PPP $), 2010-2019
Source: World Bank, World Development Indicators (WDI), April 2020.
Table 4 presents the sectoral spending performance of Zimbabwe based on the 2019 and 2020 National Budget estimates. There has been an increase in spending towards social protection from an estimated 0.25 percent of GDP in 2019 to an estimated 0.7 percent of GDP in 2020. Similarly, public health spending has increased from an estimated 7 percent of total public spending in 2019 to an estimated 10.1 percent in 2020, albeit still below the 15 percent Abuja Declaration benchmark. There has been a notable increase in agriculture spending from an estimated 12.7 percent in 2019 to an estimated 17.5 percent in 2020. Infrastructure spending has however declined from 10 percent of GDP in 2019 to an estimated 7.2 percent in 2020. This reflects the weak fiscal environment constraining government spending in general.
Table 4: Sectoral spending targets and performance based on the 2019 and 2020 estimates
Source: Calculations based on the National Budget statements.
Zimbabwe Zambia South Africa Malawi Mozambique Botswana SSA World
2010 4,227.20 9,515.36 43,072.16 2,752.46 2,183.14 41,244.23 8,917.96 30,814.052011 4,768.80 9,483.88 43,705.75 2,797.49 2,294.23 40,272.74 9,130.69 31,681.47
2012 5,484.32 9,674.35 43,546.98 2,758.04 2,413.31 39,405.88 9,397.19 32,385.09
2013 5,506.33 9,903.16 43,205.12 2,805.06 2,536.98 41,571.67 9,665.14 33,156.79
2014 5,546.27 10,093.10 43,195.40 2,871.30 2,671.28 42,706.14 9,891.08 33,915.042015 5,556.01 10,113.66 42,157.77 2,859.42 2,789.12 41,263.63 9,902.12 34,660.60
2016 5,512.76 10,223.87 42,413.91 2,837.92 2,805.59 42,107.62 9,818.61 35,433.97
2017 5,676.42 10,292.89 42,126.50 2,859.16 2,818.45 42,222.51 9,808.31 36,301.44
2018 5,921.07 10,299.20 41,839.25 2,867.38 2,817.07 42,924.26 9,778.74 37,106.952019 5,384.02 10,117.69 42,209.56 2,894.81 2,775.53 43,595.58 9,760.74 37,823.58
Sector Agreement Target 2019 Estimate
2020 Estimate
Social protection Social Policy for Africa (2008) 4.5 % GDP 0.26 % 0.7 %
Health Abuja Declaration (2001) 15 % government expenditure 7 % 10.1 %
Education Education for All Initiative (2000) 20 % government expenditure 14.6 % 13.3 %
Water & Sanitation eThekwini Declaration (2008)Sharm El-Sheik Commitment (2008)
1.5 % GDP 0.7 % 0.7 %
Agriculture Maputo Agreement (2003) 10 % government expenditure 12.7 % 17.5 %
Infrastructure African Union Declaration (2009) 9.6 % GDP 10 % 2 %

Review Of The Transitional Stabilisation Programme (TSP) August 2020
9
According to the CZI’s 2019 CZI Manufacturing Sector Survey, industry’s capacity utilisation fell by 11.8 percentage points to 36.4 percent in 2019 from 48.2 recorded in 2018. The projected capacity utilisation for 2020 is set at 27 percent, which is a 9.4 percentage points decrease from the 2019 figure. Statistics from the Reserve Bank of Zimbabwe (RBZ) reveal that foreign direct investment (FDI) of the country slumped from USD717.1 million registered in 2018 to USD259 million in 2019.
The Zimbabwe is open for business mantra has shown an obvious bias in favour of attracting Foreign Direct Investment (FDI). Empirical evidence and case studies from both developed and developing countries have however shown that micro, small and medium enterprises (MSMEs) have the greatest potential of creating employment and contributing to gross domestic output (GDP) if well harnessed and supported by a conducive policy, regulatory and institutional framework. MSMEs also have great potential of being successfully linked with local, regional and global value chains. In China, for instance the Township and Village Enterprises (TVEs) have underpinned the Chinese growth success story. The Government must therefore adopt an active bias towards supporting and facilitating local businesses/investments. For foreign investments to thrive they must be anchored by a strong and thriving local business sector. In fact, foreign investment must complement and not supplement local investment.
The economy continues to be characterised by macroeconomic instability reflected by the continued depreciation of the local currency. Subsequently, there has been a widening of the black-market premium. The black-market premium is a major driver of inflationary developments in the country. Consequently, prices of most goods and services have been on an upward trend. The widening of the black-market premium points to a government that seems to be losing control of the economy. The Zimbabwean economy is now predominantly informal characterised by underground (black market) activities of a speculative and rent-seeking nature. This makes it extremely difficult for the government to effectively regulate and control the economy.
Underemployment and informal employment are widespread in the country, with large numbers of people involved in precarious and vulnerable employment. Most of the employment opportunities in Zimbabwe are in the informal economy, which is characterized by low productivity and poor working conditions. According to the 2019 Labour Force and Child Labour Survey, 75.6 percent of total employment is informal. The high level of informality also presents challenges for domestic resources mobilization as it has eroded the tax base. One reason for the high levels of informality is the onerous and distortionary tax regime (there are so many taxes, levies, statutory fees and other unofficial charges through corruption which increase the overall cost of doing business). This has discouraged formalization while seriously eroding competitiveness. It has been demonstrated in empirical literature and country case studies that having so many taxes and levies encourages tax evasion and forces small businesses to go/remain, informal. It has also been shown that tax compliance rises as tax rates fall.
A major challenge for creating decent employment opportunities is the challenging doing business environment and regulatory framework. Estimates from Enterprise Surveys for the African continent reveal that about 1.3–3.0 million jobs are lost every year owing to administrative hurdles, corruption, inadequate infrastructure, poor tax administration, and other red tape. This figure is close to 20 percent of the new entrants to the labour force every year . Doing business reforms aimed at simplifying and streamlining the investment environment are vital to realising the full potential of the private sector to create decent job opportunities.
Poor and ineffective institutions are a major driver of corruption in Zimbabwe. The pace of implementation

Review Of The Transitional Stabilisation Programme (TSP) August 202010
Source: 2019 LFCLS
According to the Zimbabwe Poverty Report 2017 by the Zimbabwe National Statistics Agency (ZIM-STAT), the proportion of the population that was deemed poor dropped to 70.5 percent in 2017 from 72.3 percent in 2011/12 (see Table 6). There are however regional disparities. For instance, the prev-alence of poverty is more widespread in rural areas, with the rural individual poverty increasing from 84.3 percent in 2011/12 to 86.0 percent in 2017. Extreme poverty among the population increased from 22.5 percent in 2011/12 to 29.3 percent in 2017 on account of the economic slowdown over the past few years. Extreme poverty levels among the rural population rose from 30.4 to 40.9 percent be-tween 2011/12 and 2017 while extreme poverty rates among the urban population actually dropped from 5.6 percent to 4.4 percent.
Indicator 2014 2019
Unemployment rate 15+ years 4.8 16.4
Male unemployment rate15+ years 4.4 15.7
Female unemployment rate 15+ years 5.2 17.2
Youth (15-24 years) unemployment rate 6.8 26.8
Male youth (15-24 years) unemployment rate 5.9 24.6
Female youth (15-24 years) unemployment rate 7.8 30.3
Youth (15-35 years) unemployment rate 12 20.8
Male youth (15-35 years) unemployment rate 10.2 19.7
Female youth (15-35 years) unemployment rate 13.0 22.3
of key institutional reforms to deal with the issue of corruption also remains worryingly slow. Corruption has contributed to significant increase in the levels of informalisation and underground economic activities in the country. Moreover, corruption has discouraged production and provided strong incentives for rent-seeking and conspicuous consumption. This has had the effect of undermining economic growth as well as the ability of government to mobilise resources domestically.
As presented in Table 5, the national unemployment rate stands at 16.4 percent in 2019. The female unemployment rate was higher at 17.2 percent as compared to 15.7 percent for males. There are regional disparities in terms of unemployment, Matabeleland North registering the highest unemployment rate at 30.0 percent while Harare had the lowest at nine percent. Youth (15-24) years had a national unemployment rate of 27.0 percent, higher for females at 30 percent than males at 25.0 percent. The national unemployment rate for youth (15-35) years was 21.0 percent again higher for females at 22.0 percent than males at nearly 20 percent.
Table 5: Unemployment rate

Review Of The Transitional Stabilisation Programme (TSP) August 2020
11
Table 6: Household and Individual Prevalence of Poverty-1995, 2001, 2011 and 2017 (%)
Source: PICES 2017, PICES 2011, ICES 2001 and ICES 1995.
As presented in Table 7, the individual national poverty rate for females stood at 70.3 percent, slightly lower than the individual national poverty rate for males at 70.7 percent. The females living in the rural areas have the highest individual poverty rate of 86.3 percent, while their female counterparts in the urban areas have the lowest individual poverty rate of 36.5 percent.
Table 7: Poverty Prevalence (Percent) for people, Males and Females, Rural and Urban Areas
Source: PICES 2017
Household IndividualPoverty Extreme Poverty Poverty Extreme Poverty
PICES 2017
Rural 76.9 31.9 86.0 40.9
Urban 30.4 3.3 37.0 4.4
Zimbabwe 60.6 21.9 70.5 29.3
PICES 2011/12Rural 76.0 22.9 84.3 30.4
Urban 38.2 4.0 46.5 5.6
Zimbabwe 62.6 16.2 72.3 22.5
ICES 2001Rural 73.0 42.3 82.4 52.4
Urban 33.8 10.5 42.3 14.5
Zimbabwe 60.6 32.2 70.9 41.5
ICES 1995Rural 76.2 50.4 86.4 62.8
Urban 41.1 10.2 53.4 15.0
Zimbabwe 63.3 35.7 75.6 47.2
Area Male Female Total
Rural 85.6 86.3 86.0
Urban 37.7 36.5 37.1
Total 70.7 70.3 70.5

Review Of The Transitional Stabilisation Programme (TSP) August 202012
The prevalence of poverty among the youths aged 15-35 years is much lower than prevalence of poverty at the national level as shown in Table 8.
Table 8: Poverty Prevalence (Percent) for People Males and Females Youths (15-35 Years)
Source: PICES 2017
The prevalence of poverty for people with disabilities is higher at 74.1 percent when compared with a prevalence of 69.5 percent for people without disabilities. Male-headed households are poorer than female-headed households. The prevalence of poverty among male-headed households is 61.6 percent when compared with 58.9 percent for female-headed households. Extreme poverty is also higher among male-headed households at 25.2 percent when compared to the prevalence of extreme poverty in the female-headed households of 21.2 percent.
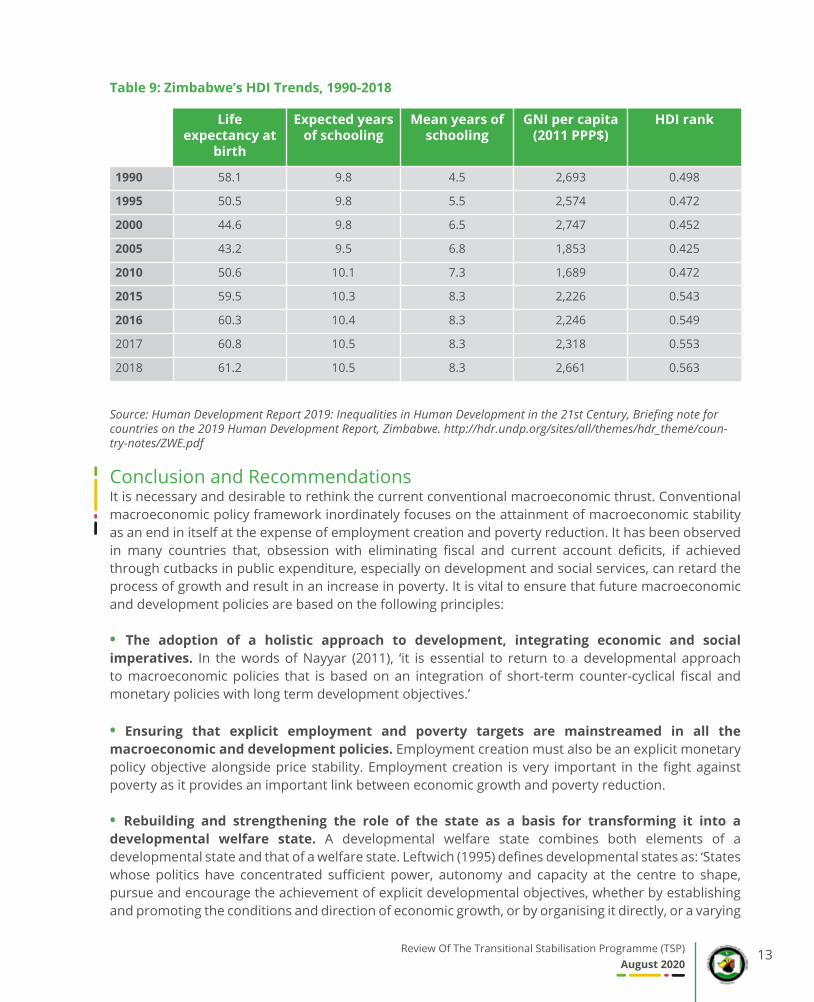
Table 9 traces Zimbabwe’s Human Development Index (HDI) trends for the period 1990-2018. During this period, the country’s HDI value initially decreased from 0.498 to 0.425 in 2005, before increasing to 0.563 in 2018. While the improvements in all the components of the HDI are observed since 2010, it is the spectacular increase in life expectancy from a low of 43.2 years in 2005 to 61.2 years by 2018 that is noteworthy. Zimbabwe’s HDI value of 0.563 in 2018 lifts the country into the medium human development category, ranked at 150 out of 189 countries, which is an improvement from the rank of 153 in 2017. The 2018 female HDI value for Zimbabwe is 0.540 compared to 0.584 for males, which results in a Gender Development Index (GDI) value of 0.925. However, when the HDI value is adjusted for inequality, Zimbabwe losses 22.8 percent of its value to stand at 0.435. Table 9: Zimbabwe’s HDI Trends, 1990-2018
Area Male Female Total
Rural 82.5 85.7 84.1
Urban 35.0 35.3 35.2
Total 66.2 65.9 66.0
Review Of The Transitional Stabilisation Programme (TSP) August 2020
13
Source: Human Development Report 2019: Inequalities in Human Development in the 21st Century, Briefing note for countries on the 2019 Human Development Report, Zimbabwe. http://hdr.undp.org/sites/all/themes/hdr_theme/coun-try-notes/ZWE.pdf
Conclusion and RecommendationsIt is necessary and desirable to rethink the current conventional macroeconomic thrust. Conventional macroeconomic policy framework inordinately focuses on the attainment of macroeconomic stability as an end in itself at the expense of employment creation and poverty reduction. It has been observed in many countries that, obsession with eliminating fiscal and current account deficits, if achieved through cutbacks in public expenditure, especially on development and social services, can retard the process of growth and result in an increase in poverty. It is vital to ensure that future macroeconomic and development policies are based on the following principles:
• The adoption of a holistic approach to development, integrating economic and social imperatives. In the words of Nayyar (2011), ‘it is essential to return to a developmental approach to macroeconomic policies that is based on an integration of short-term counter-cyclical fiscal and monetary policies with long term development objectives.’
• Ensuring that explicit employment and poverty targets are mainstreamed in all the macroeconomic and development policies. Employment creation must also be an explicit monetary policy objective alongside price stability. Employment creation is very important in the fight against poverty as it provides an important link between economic growth and poverty reduction.
• Rebuilding and strengthening the role of the state as a basis for transforming it into a developmental welfare state. A developmental welfare state combines both elements of a developmental state and that of a welfare state. Leftwich (1995) defines developmental states as: ‘States whose politics have concentrated sufficient power, autonomy and capacity at the centre to shape, pursue and encourage the achievement of explicit developmental objectives, whether by establishing and promoting the conditions and direction of economic growth, or by organising it directly, or a varying
Table 9: Zimbabwe’s HDI Trends, 1990-2018
Life expectancy at
birth
Expected years of schooling
Mean years of schooling
GNI per capita (2011 PPP$)
HDI rank
1990 58.1 9.8 4.5 2,693 0.498
1995 50.5 9.8 5.5 2,574 0.472
2000 44.6 9.8 6.5 2,747 0.452
2005 43.2 9.5 6.8 1,853 0.425
2010 50.6 10.1 7.3 1,689 0.472
2015 59.5 10.3 8.3 2,226 0.543
2016 60.3 10.4 8.3 2,246 0.549
2017 60.8 10.5 8.3 2,318 0.553
2018 61.2 10.5 8.3 2,661 0.563
Review Of The Transitional Stabilisation Programme (TSP) August 202014
combination of both.’ An important feature that characterizes a developmental state is relatively low levels of corruption, state capture, patronage and rent seeking tendencies.
On the other hand, a welfare State is a State that actively protects and promotes the welfare/well-being of its citizens. It offers and guarantees social protection by assuring (at the very least) a basic income; provides access to food security, health care, education, housing, employment and social welfare services to all of its citizens. A developmental welfare state therefore is a state which actively invests in the well-being of its citizens as well as boosting the capacity of its economy. It prioritizes investments in both social and physical capital. The developmental welfare State puts its people and their welfare first in the development process.
• Expanding and strengthening the national institutional framework for broad-based stakeholder participation in decision-making, implementation, monitoring and evaluation. The global consensus is that broad-based stakeholder participation in policy development is critical as it engenders national ownership, accountability and transparency.
• Broadening the tax base by migrating beyond broad-based taxes to alternative revenue sources such as corrective taxes. Corrective taxes, or sin taxes are levied on goods and services that are considered to be bad for the individual or society at large. Examples include taxes on alcohol, cigarettes and products and activities with negative environmental consequences. Corrective taxes can improve fiscal revenues while at the same time reducing socially and environmentally undesirable activities thereby promoting good public health. The World Health Organisation (WHO) has also been advocating for a sugar tax on sugar-sweetened beverages to fight the scourge of non-communicable diseases. The sugar tax apart from reducing consumption of sugary drinks also raises additional revenues for the treasury. On 1 April 2017, South Africa introduced a 20 percent sugar tax on sugary beverages. This is part of the South African Government’s strategic objective of preventing and controlling non-commu-nicable diseases and obesity.
• Cutting back on non-productive recurrent expenditures to create fiscal space for sustainable development. Two good examples to achieve this cut back relate to the role of medical tourism and military spending in crowding out resources that could be used for development spending. There is an African idiom that ‘if a man does not eat at home, he may never give his wife enough money to cook a good meal.’ This applies to politicians seeking medical help anywhere but home (medical tourism by political elites at the expense of the tax payer). The cost of medical tourism could build a number of health facilities. There is also scope for the country to reduce its military spending and deploy those saved resources to social expenditures and capital investments. Huge military expenditures that are largely recurrent in most African countries including in Zimbabwe are behind the slow pace of development. Collier (2007) shows that military expenditure retards development by diverting government resources that could be put to better development use. He argues that military expenditure is not an effective deterrent of rebellion, and, if it is reduced in a coordinated manner across a country then external security interests would be unaffected. The resources freed by reduced military expenditure can be used to enhance development which in turn would reduce the risk of internal conflict. Hence development, not military deterrence, is the best strategy for a safer society. In Uganda, the Government committed itself to implementing a reduction in expenditure on security, justice and governance from 39 percent of the national budget in 2008 to 36 percent in 2011 to allow for a scaling up of pro-poor expenditure on

Review Of The Transitional Stabilisation Programme (TSP) August 2020
15
rural development, energy, road infrastructure and human development. This has resulted in Uganda scoring significant gains on the development front (Ter-Minassian et al, 2008).
He argues that military expenditure is not an effective deterrent of rebellion, and, if it is reduced in a coordinated manner across a country then external security interests would be unaffected. The resources freed by reduced military expenditure can be used to enhance development which in turn would reduce the risk of internal conflict. Hence development, not military deterrence, is the best strategy for a safer society. In Uganda, the Government committed itself to implementing a reduction in expenditure on security, justice and governance from 39 percent of the national budget in 2008 to 36 percent in 2011 to allow for a scaling up of pro-poor expenditure on rural development, energy, road infrastructure and human development. This has resulted in Uganda scoring significant gains on the development front (Ter-Minassian et al, 2008).
• It is important to create an enabling/supportive policy, institutional and regulatory framework that reduces the cost of doing business and improves the investment climate as well as lowering the barriers and high cost of transition to formality. The plethora of taxes, levies and statutory fees must be reduced and streamlined through the adoption of a uniform and simplified tax regime.
Review Of The Transitional Stabilisation Programme (TSP) August 202016
List of References
AfDB (2019). African Economic Outlook 2019.
Collier, P. (2007). The Bottom Billion: why the Poorest countries Are Failing and What Can Be Done About It. Oxford University Press.
IMF (2020). Zimbabwe: 2019 Article IV Consultation – Press Release; Staff report; and Statement by the Executive Director for Zimbabwe. IMF Country Report No. 20/82.
Kathleen, B., L. Christiaensen, A. Dabalen, and I. Gaddis. (2016). Poverty in a Rising Africa. Washington, DC: World Bank.
Kharas, H. and W. Fengler (2017). Global Poverty is Declining but Not Fast Enough. Available online: https://www.brookings.edu/blog/future-development/2017/11/07/global-poverty-is-declining-but-not-fast-enough/ (Accessed on 1 July 2020).
Leftwich, A. (1995). Bringing politics back in: Towards a model of developmental state. The Journal of Development Studies, 31(3), 400-427.
Nayyar, D. (2011). Rethinking macroeconomic policies for development. Brazilian Journal of Political Economy (Brazil), Volume 31(3), July-Sept.
Rodrik, D. (2007). One Economics, Many Recipes: Globalization, Institutions, and Economic Growth. Princeton, NJ: Princeton University Press.
Ter-Minassian, T., R. Hughes and A. Hajdenberg (2008). Creating Sustainable Fiscal Space for Infrastructure; The Case of Tanzania. IMF Working Papers 08/256, International Monetary Fund.
World Bank (2020). Global Economic Prospects, June 2020. Washington, DC: World Bank. © World Bank. https://openknowledge.worldbank.org/handle/10986/33748 License: CC BY 3.0 IGO.
Zimbabwe (2018). Transitional Stabilisation Programme Reforms Agenda October 2018 – December 2020: Towards a Prosperous & Empowered Upper Middle-Income Society by 2030. 05 October 2018, Harare.
ZIMSTAT (2020). 2019 Labour Force and Child Labour Survey Report. February 2020, Harare.
ZIMSTAT (2019). Zimbabwe Poverty Report 2017. May 2019, Harare.

Review Of The Transitional Stabilisation Programme (TSP) August 2020
17

Review Of The Transitional Stabilisation Programme (TSP) August 202018
Review Of The Transitional
Stabilisation Programme (Tsp)
August 2020