Review of the real-time current monitoring requirement for ... · REVIEW OF THE REAL-TIME CURRENT...
21
NOAA Technical Memorandum, OAR AOML-95 REVIEW OF THE REAL-TIME CURRENT MONITORING REQUIREMENT FOR THE MIAMI OCEAN DREDGED MATERIAL DISPOSAL SITE (1995-2000) C.J. McArthur S.J. Stamates J.R. Proni Atlantic Oceanographic and Meteorological Laboratory Miami, Florida July 2006 noaa Office of Oceanic and Atmospheric Research NATIONAL OCEANIC AND ATMOSPHERIC ADMINISTRATION
Transcript of Review of the real-time current monitoring requirement for ... · REVIEW OF THE REAL-TIME CURRENT...

NOAA Technical Memorandum, OAR AOML-95
REVIEW OF THE REAL-TIME CURRENT MONITORING REQUIREMENT FOR THE MIAMI OCEAN DREDGED MATERIAL DISPOSAL SITE (1995-2000) C.J. McArthur S.J. Stamates J.R. Proni Atlantic Oceanographic and Meteorological Laboratory Miami, Florida
July 2006
noaa Office of Oceanic and Atmospheric Research
NATIONAL OCEANIC AND ATMOSPHERIC ADMINISTRATION

This page is intentionally left blank.
NOAA Technical Memorandum, OAR-AOML-95
REVIEW OF THE REAL-TIME CURRENT MONITORING REQUIREMENT FOR THE MIAMI OCEAN DREDGED MATERIAL DISPOSAL SITE (1995-2000) Christopher J. McArthur U.S. Environmental Protection Agency, Atlanta, GA S. Jack Stamates NOAA Atlantic Oceanographic and Meteorological Laboratory, Miami, FL John R. Proni NOAA Atlantic Oceanographic and Meteorological Laboratory, Miami, FL National Oceanic and Atmospheric Administration Atlantic Oceanographic and Meteorological Laboratory Miami, Florida U.S. Environmental Protection Agency Region 4/Water Management Division Atlanta, Georgia July 2006
UNITED STATES NATIONAL OCEANIC AND Office of Oceanic and DEPARTMENT OF COMMERCE ATMOSPHERIC ADMINISTRATION Atmospheric Research
Carlos M. Gutierrez VADM Conrad C. Lautenbacher, Jr. Dr. Richard W. Spinrad Secretary Undersecretary for Oceans Assistant Administrator and Atmosphere/Administrator
UNITED STATES ENVIRONMENTAL PROTECTION REGION 4 Water Management AGENCY SOUTHEAST OFFICE Division
Steven Johnson J.I. Palmer, Jr. James D. Giattina Administrator Regional Administrator Director

Neither NOAA nor EPA approve, recommend, or endorse any proprietary product or material mentioned in this document. No reference shall be made to NOAA or EPA, or to this document, in any advertising or sales promotion which would indicate or imply that NOAA or EPA approves, recommends, or endorses any proprietary product or proprietary material herein or which has as its purpose any intent to cause directly or indirectly the advertised product to be used or purchased because of this document.
ii

Table of Contents
Abstract .......................................................................................................................................... 1
1.0 Introduction ........................................................................................................................... 1
2.0 Real-Time Current Monitoring Program ............................................................................... 2
3.0 Analysis Methods .................................................................................................................. 3
3.1 Depth-Averaged Currents ............................................................................................ 3
3.2 Advection Analysis...................................................................................................... 4
4.0 Results................................................................................................................................... 5
4.1 Summary of Observations............................................................................................ 5
4.2 Criteria Exceedence ..................................................................................................... 6
4.2.1 Period of Criteria Exceedence ......................................................................... 6
4.2.2 Probability of Onshore Current Event Following Disposal............................. 9
4.3 Evaluation of Disposal Plume Advection and Potential for Transport to Nearshore Reefs....................................................................................................... 9
5.0 Conclusion........................................................................................................................... 12
6.0 References .......................................................................................................................... 13
iii

This page is intentionally left blank.
iv

List of Figures
Figure 1. Project location map ...................................................................................................2
Figure 2. Current rose of surface currents (upper 50 m) at the Miami ODMDS from June 1995 to August 1997 and April 1999 to January 2000..............................6
Figure 3. Current rose for (a) surface currents at the Miami ODMDS (upper 20 m) and (b) at the reef ADCP from June 24, 1999 to October 20, 1999 ...........................7
Figure 4. Miami ODMDS real-time current monitoring east-west of 50 m depth and hourly averaged current velocity distribution. The data period is from June 1995 to August 1997 and April 1999 to January 2000..............................8
Figure 5. Comparison of east-west current velocity distributions at the Miami ODMDS and at the reef site (MOMS) for June-October 1999 using the real-time current monitoring system (RTCMS)....................................................8
Figure 6. Consecutive exceedences of the Miami ODMDS current disposal criteria for June 1995 to August 1997 and April 1999 to January 2000.....................9
Figure 7. Probability of an onshore current event in excess of 12 cm/sec following dredged material disposal.........................................................................10
Figure 8. Probability of a dredged material disposal plume reaching the reef line as a function of travel time based on streakline analysis..........................................10
Figure 9. Miami ODMDS dredged material disposal plume advection estimates for plume travel times of up to five hours based on surface currents (50 m) measured at the Miami ODMDS. Contours represent the frequency that a disposal plume will visit the 0.04 km2 grid cell during the five hour travel time............................................................................................11
Figure 10. Miami ODMDS dredged material disposal plume advection estimates for plume travel times of up to five hours based on currents measured at the Miami ODMDS and at the reef line. Contours represent the frequency that a disposal plume will visit the 0.04 km2 grid cell during the five hour travel time .................................................................................................................12
v

This page is intentionally left blank.
vi

Review of the Real-Time Current Monitoring Requirement for the Miami Ocean Dredged Material Disposal Site (1995-2000)
Abstract The U.S. Environmental Protection Agency (EPA) manages an Ocean Dredged Material Disposal Site (ODMDS) offshore of Miami, Florida. To protect coral reefs west of the ODMDS, use of the disposal site is restricted during periods of reef-directed currents. In 1995, the National Oceanic and Atmospheric Administration (NOAA) developed a real-time current monitoring program for the Corps of Engineers for disposal of material from the Phase II Deepening Project at the Port of Miami. The program consists of a system for measuring and reporting currents at the ODMDS in real-time and a set of evaluation criteria for determining when disposal can occur. The initial system deployments resulted in three years of data from 1995 through 2000. This data is reviewed and analyzed to assess the impacts on dredging operations and the potential for disposal plume interaction with the nearby coral reefs.
1.0 Introduction EPA’s Region 4 office designated the Miami ODMDS on February 26, 1996. As required
by the Water Resource Development Act of 1992, EPA developed a Site Management and Monitoring Plan in August 1995 as part of the designation. A primary concern in designation of the site was the potential for ocean currents to transport disposed dredged material plumes shoreward, resulting in impacts to nearshore coral reefs and other hard-bottom communities. The nature of the currents at and near the Miami ODMDS is complex. Eddies associated with the Florida Current (i.e., the Gulfstream) can generate currents whose westwardly directed component may be both large and of extended duration. These currents are capable of transporting residual disposal plumes to the coral reef area. The frequency of the eddy-generated events was unknown at the time of site designation, but was estimated to occur as frequently as once per week (EPA, 1995).
To ensure protection of nearshore reefs west of the ODMDS from excessive sedimentation or turbidity due to disposal at the ODMDS, restrictions were placed on site use during onshore current events. Specifically, in order to use the site, the Site Management and Monitoring Plan requires an approved real-time current monitoring program be implemented which restricts disposal events during onshore current events.
For the Miami Harbor Deepening project, a real-time current monitoring program was developed with input from the University of Miami, NOAA, the State of Florida, the Army Corps of Engineers, and the EPA (Proni et. al., 1998). Disposal criteria were supplied by the University of Miami and incorporated into the State permit. Disposal operations began in early 1995 under an interim monitoring program. The permanent monitoring program began in June 1995. It was suspended in the summer of 1997 due to cessation of dredging activities and re-initiated in the spring of 1999 until the project was halted in early 2000.
This report reviews the current data collected as part of the real-time current monitoring program through early 2000 and demonstrates how the restrictions have affected dredged material disposal operations. It also reviews how future operations may be affected by the restrictions and utilizes the data to better assess the potential for plume interaction with the nearshore reefs.
1

2.0 Real-Time Current Monitoring Program The real-time current monitoring program consists of two components: (1) the
measurement system; and (2) the evaluation criteria for determining if disposal can occur. The measurement system used for the Miami Harbor Deepening Project from 1995 to 2000 was installed and operated by NOAA’s Atlantic Oceanographic and Meteorological Laboratory (AOML) in Miami, Florida. It consisted of an acoustic Doppler current profiler (ADCP) in close proximity to the ODMDS (see Figure 1).
The ADCP was used in burst-sampling mode with measurements taken every 20 minutes. The ADCP was connected by cable to a radio transmitter located on a range marker tower 4.8 km (3 miles) west of the ODMDS. Current data were radioed to the AOML facility on Virginia Key from the range marker tower. Once the data were received at AOML, the evaluation criteria were applied. If the criteria were not met, a no-discharge decision was communicated to the dredging contractor via telephone. The measurement system was operational from June 26, 1995 to August 9, 1997 and from April 26, 1999 to January 29, 2000. During the second deployment, the measurement system was moored at greater water depths.
ADCP 1995
ADCP 1999
ADCP 2005
Reef ADCP
Port of Miami
Miami
Biscayne Bay
Miami ODMDS
High Relief Hardbottom
Figure 1: Project location map. Circles represent the location of acoustic Doppler current profiler (ADCP) deployments.
2

The evaluation criteria used for the Miami Harbor Deepening Project were developed by Dr. Thomas Lee of the University of Miami’s Rosenstiel School of Marine and Atmospheric Science. These criteria were based on a simple trajectory analysis of the fine-grained portion of the disposed dredged material (see Table 1). Fine-grained dredged material can remain suspended in surface waters (top 15 m) for approximately five hours where it can potentially impact reefs. For fine-grained dredged material to reach the reefs within this five-hour period, the currents must have a shoreward or westerly component in excess of 12 cm/sec. Therefore, the criteria established for an acceptable discharge condition were that the westerly component of the current, determined by averaging the current over the top 50 m of the water column, not exceed 12 cm/sec.
Table 1: Trajectory analysis for fine-grained dredged material.
Settling Depth (meters)
Settling Time1 (hours)
Minimum Western Velocity Component for Transport to Reef
(cm/sec)
5 2 34 10 4 17 15 5 12 20 7 9 25 9 7 30 11 6
1average fall velocity of 0.078 cm/sec.
Currents are measured every 20 minutes, and the three most recent 20-minute ensembles are averaged to give a one-hour running temporal average. The running average is compared against the 12 cm/sec threshold. Once the threshold has been exceeded, the dredging contractor is allowed a five-hour window to cease disposal operations. At the end of the window, a “no discharge” advisory exists until the current changes to an acceptable level.
3.0 Analysis Methods
3.1 Depth-Averaged Currents Data analysis conducted as part of this review differs from that conducted in real-time as
part of the implementation of the real-time current monitoring system. The nature of the real-time current monitoring system does not allow for some of the additional methods implemented here in review of the data, such as removal of isolated bad data bins, determination of average surface distance, and extrapolation of data for bad data bins.
For the initial deployment period (1995-1997), current data were available as ASCII text files with a separate file corresponding to each day of the record. Each file contained the north and east current components for bins 1-26 at 20-minute intervals. The bin size was 4 m. A FORTRAN program was written to extract the data for bins 16-26 (top 50 m) for each 20-minute
3

record from each file. Data from the upper two bins were dropped from the average due to corruption by the acoustic surface reflection (RDI, 1996). Depth averaged values were produced for each 20-minute interval, and the hourly depth averages were then calculated. This process is represented by equation 3.1-1:
113
26
162∑∑
=−= •=
bin
binbb
T
)T(tavg
uU
(3.1-1)
For the second deployment period (1999-2000), raw binary data files were provided. An RDI utility program, “surface.exe,” was used to estimate the distance of the water surface from the ADCP based on acoustic backscatter. The surface was estimated to be between 152-155 m from the instrument for most ensembles. This corresponds to bins 36-38. Therefore, the top 50 m corresponds to bins 24-37. Again, the bin size was set at 4 m. Echo intensity and percent good values for bins 24-37 were examined for their percent good percentages. Percent good values report percentages of (1) three-beam transformations, (2) transformations rejected, (3) more than one bad beam, and (4) four-beam transformations for each bin and ensemble. After examination, it was found that there was a consistently high percentage of four-beam transformations in bins 24-34, with intermittent problems with bin 34. Therefore, bins 24-34 were used in the depth averaging. The bad ensembles in bin 34 were replaced with values from bin 33, and the hourly depth averages were then calculated. This process is represented by equation 3.1-2:
113
34
24)2(∑∑=−= •=
bin
binbb
T
Ttavg
uU (3.1-2)
The calculated depth averages and hourly averaged velocities were then evaluated against the criteria (-12 cm/sec). The duration of the criteria exceedences and the number of criteria exceedences for varying durations were then recorded.
3.2 Advection Analysis
Dredged material disposal plumes are transported and dispersed by ocean currents in and near the ODMDS. A simple one-dimensional method for determining the likelihood that disposal plumes will reach an amenity of concern is the streakline. As described by Fischer et al. (1979), this concept assumes that an ocean current is spatially homogeneous but temporally variable. Using the 50-m depth averaged current velocity, the location of the center of the suspended dredged material plume during advective transport can be shown to be:
∫τ+
τ=τ
Tdt)t(u)T,(x (3.2-1)
where u(t) is the measured east-west current velocity, T is the time of travel, and τ is the release time.
4
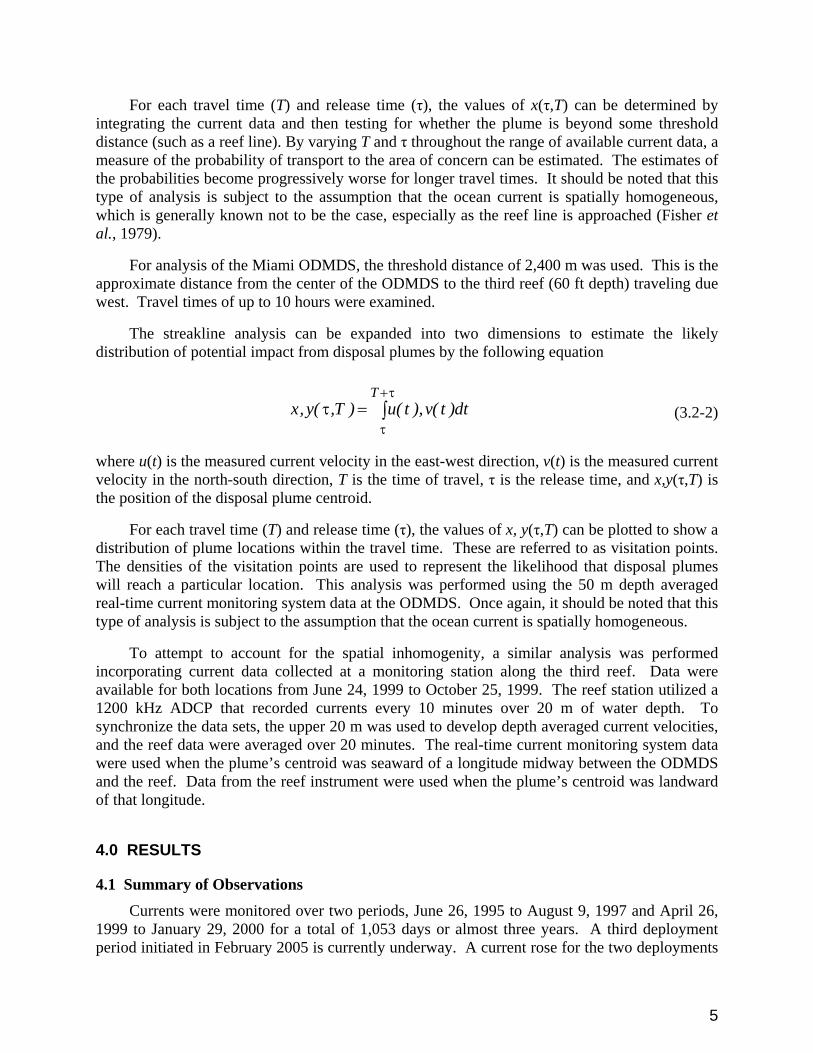
For each travel time (T) and release time (τ), the values of x(τ,T) can be determined by integrating the current data and then testing for whether the plume is beyond some threshold distance (such as a reef line). By varying T and τ throughout the range of available current data, a measure of the probability of transport to the area of concern can be estimated. The estimates of the probabilities become progressively worse for longer travel times. It should be noted that this type of analysis is subject to the assumption that the ocean current is spatially homogeneous, which is generally known not to be the case, especially as the reef line is approached (Fisher et al., 1979).
For analysis of the Miami ODMDS, the threshold distance of 2,400 m was used. This is the approximate distance from the center of the ODMDS to the third reef (60 ft depth) traveling due west. Travel times of up to 10 hours were examined.
The streakline analysis can be expanded into two dimensions to estimate the likely distribution of potential impact from disposal plumes by the following equation
∫τ+
τ=τ
Tdt)t(v),t(u)T,(y,x (3.2-2)
where u(t) is the measured current velocity in the east-west direction, v(t) is the measured current velocity in the north-south direction, T is the time of travel, τ is the release time, and x,y(τ,T) is the position of the disposal plume centroid.
For each travel time (T) and release time (τ), the values of x, y(τ,T) can be plotted to show a distribution of plume locations within the travel time. These are referred to as visitation points. The densities of the visitation points are used to represent the likelihood that disposal plumes will reach a particular location. This analysis was performed using the 50 m depth averaged real-time current monitoring system data at the ODMDS. Once again, it should be noted that this type of analysis is subject to the assumption that the ocean current is spatially homogeneous.
To attempt to account for the spatial inhomogenity, a similar analysis was performed incorporating current data collected at a monitoring station along the third reef. Data were available for both locations from June 24, 1999 to October 25, 1999. The reef station utilized a 1200 kHz ADCP that recorded currents every 10 minutes over 20 m of water depth. To synchronize the data sets, the upper 20 m was used to develop depth averaged current velocities, and the reef data were averaged over 20 minutes. The real-time current monitoring system data were used when the plume’s centroid was seaward of a longitude midway between the ODMDS and the reef. Data from the reef instrument were used when the plume’s centroid was landward of that longitude.
4.0 RESULTS
4.1 Summary of Observations
Currents were monitored over two periods, June 26, 1995 to August 9, 1997 and April 26, 1999 to January 29, 2000 for a total of 1,053 days or almost three years. A third deployment period initiated in February 2005 is currently underway. A current rose for the two deployments
5

at the Miami ODMDS is shown in Figure 2. It is apparent from this figure that currents are dominated by the Florida Current with strong north-northeasterly flows. Figure 3 compares the currents at the ODMDS with those at the 60-ft depth reef for concurrent measurement periods. Northerly currents dominate, but to a lesser degree. As westerly-directed currents are the main concern, the east-west current component has been evaluated further. Figure 4 is a histogram of the east-west current component at the ODMDS. The cumulative frequency is also plotted in Figure 4. Figure 4 shows that less than 2% of the data records had average westerly current components that exceeded the criteria (-12 cm/sec). Figure 5 compares the east-west current component at the ODMDS with those at the 60-ft depth reef for concurrent periods. 0
45
90
135
180
225
270
315
0% 5% 10% 15% 20% 25%
<=50>50 - 100>100 - 125>125 - 150>150 - 200>200
Magnitude (cm/s)
Figure 2: Current rose of surface currents (upper 50 m) at the Miami ODMDS from June 1995 to August 1997 and April 1999 to January 2000.
4.2 Criteria Exceedence
4.2.1 Period of Criteria Exceedence During the first two deployments, periods of criteria exceedence had durations of one to 62
records (20 minutes to 20 hours, 40 minutes). There were 123 occasions where exceedences lasted 20 minutes or longer. The number of consecutive records exceeding the criteria is shown in Figure 6. Nineteen events had average current magnitudes in exceedence of the criteria for periods greater than or equal to five hours. Events with durations less than five hours do not affect disposal operations, as the dredging contractor has a five-hour window to cease operations from the first threshold exceedence.
6

0
45
90
135
180
225
270
315
N
0% 10% 20% 30%
<=50>50 - 100>100 - 125>125 - 150>150 - 200>200
Magnitude (cm/s)
(a)
0
45
90
135
180
225
270
315
N
0% 2% 4% 6% 8% 10%
<=10>10 - 20>20 - 30>30 - 40>40
Magnitude (cm/s)
(b)
Figure 3: Current rose for (a) surface currents at the Miami ODMDS (upper 20 m) and (b) at the reef ADCP from June 24, 1999 to October 20, 1999.
7

East(+)/West(-) Velocity Component (cm/sec)-30 -25 -20 -15 -10 -5 0 5 10 15 20 25 30 35 40 45 50 55 60 65 70
Freq
uenc
y of
Occ
uren
ce (%
)
0
4
8
12
16
20
-12c
m/s
Cum
ulat
ive
Freq
uenc
y (%
)
0
20
40
60
80
100
1.73%
Figure 4: Miami ODMDS real-time current monitoring east-west of 50 m depth and hourly averaged current velocity distribution. The data period is from June 1995 to August 1997 and April 1999 to January 2000.
0
7
14
21
28
35
0
20
40
60
80
100
East(+)/West(-) Velocity Component (cm/sec)
Freq
uenc
y of
Occ
uren
ce (%
)
RTCMSMOMS Site 1
Cum
ulat
ive
Freq
uenc
y RTCMS
MOMS
-40 -20 0 20 40 60 80
Figure 5: Comparison of the east-west current velocity distributions at the Miami ODMDS and at the reef site (MOMS) for June-October 1999 using the real-time current measurement system (RTCMS).
8

9
Duration of Exceedence (Hours)0 3 6 9 12 15 18 21 24
Num
ber o
f Occ
urre
nces
0
5
10
15
20
25
30
35
40
No
Dis
posa
l Con
ditio
n
Consecutive Number of Exceedences0 9 18 27 36 45 54 63 72
Figure 6: Consecutive exceedences of the Miami ODMDS current disposal criteria for June 1995 to August 1997 and April 1999 to January 2000.
4.2.2 Probability of Onshore Current Event Following Disposal The concern at the Miami ODMDS is the potential for dredged material disposal plumes to
be transported by onshore current events. Longer onshore current events are more likely capable of transporting the plumes shoreward. Figure 7 shows the frequency and cumulative frequency of onshore current events immediately following a potential discharge. This differs from the previous analysis in that a greater number of short delays can be encountered due to the possibility of disposal occurring within the duration of a longer onshore current event, thereby increasing the possible number of shorter duration events. The probability of an onshore current event of any duration immediately following a disposal event is 1.7%. The probability of onshore currents lasting for five or more hours immediately following a disposal event is 0.37%.
4.3 Evaluation of Disposal Plume Advection and Potential for Transport to Nearshore Reefs The potential for transport to the third reef track approximately 2,400 m to the west of the
center of the Miami ODMDS is represented by the streakline in Figure 8. Based on the assumption of spatial homogeneity of surface currents, Figure 8 shows that dredged material must remain in suspension for at least two hours for any probability of reaching the reef line. For travel times up to five hours, the probability of dredged material reaching the reef line remains below 1% and below 3.5% for travel times up to ten hours.

10
Duration of Event (hours)
0 2 4 6 8 10 12 14 16 18 20 22
Freq
uenc
y of
Eve
nt (%
)
0.00
0.02
0.04
0.06
0.08
0.10
0.12
0.14
0.16
0.18
0.20
0.22
0.24
0.26
Cum
ulat
ive
Freq
uenc
y of
Eve
nt (%
)
0.2
0.4
0.6
0.8
1.0
1.2
1.4
1.6
1.8
2.0
2.2
2.4
2.6
FrequencyCumulative Frequency
Figure 7: Probability of an onshore current event in excess of 12 cm/sec following dredged material disposal.
(minutes)0 60 120 180 240 300 360 420 480 540 600
Pro
babi
lity
of T
rans
port
to T
hird
Ree
f (1.
3 nm
i)
0.0%
0.5%
1.0%
1.5%
2.0%
2.5%
3.0%
3.5%
Travel Time (hours)0 1 2 3 4 5 6 7 8 9 10
Figure 8: Probability of a dredged material disposal plume reaching the reef line as a function of travel time based on streakline analysis.
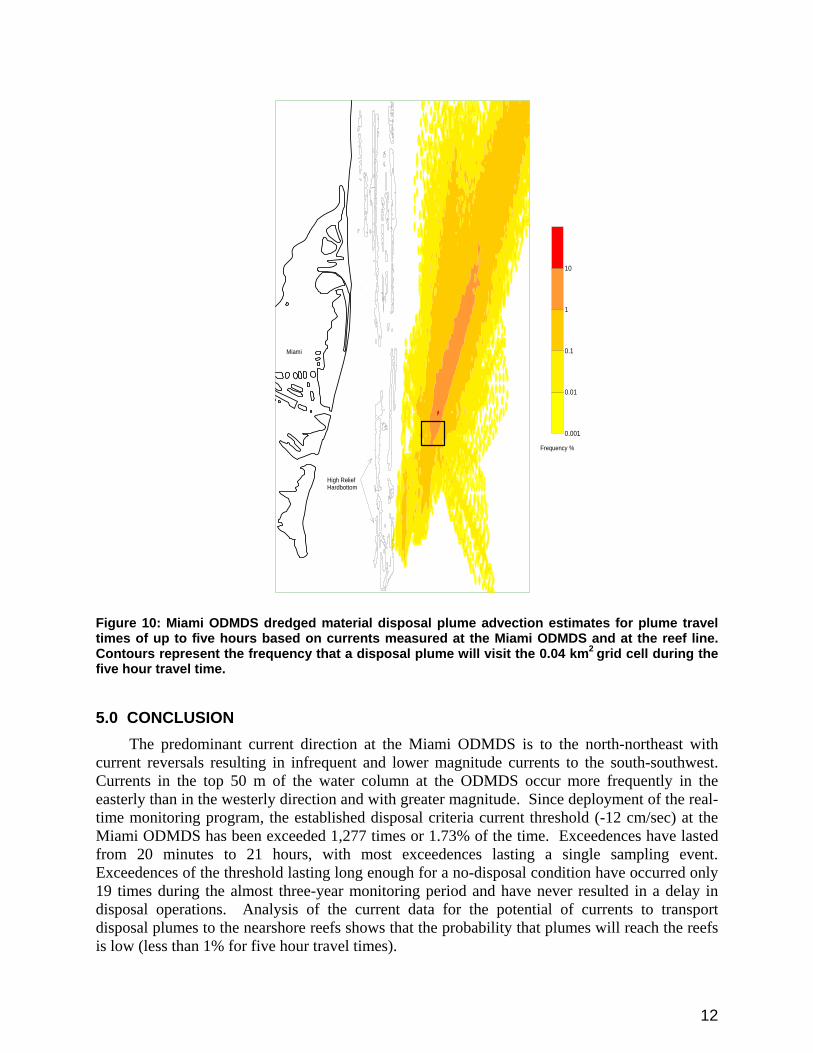
The location for potential intersection of the disposal plumes with the reefs is depicted in Figures 9 and 10. Figure 9 shows the spatial visitation frequency of the disposal plumes for travel times (or suspension periods) of five hours, assuming current magnitude and direction homogeneity with respect to the ADCP at the ODMDS. Figure 10 shows the same information incorporating some spatial variation of currents through utilization of data collected from the ADCP located at the reef. Both Figures 9 and 10 show that the predominant location for plume transport is to the north-northeast and that plume interaction with the reef north of the ODMDS is very unlikely. Interaction with the reef south of the ODMDS has a small frequency of occurrence. However, when the reef currents are incorporated into the analysis, this frequency decreases even further.
Miami
Frequency %
0.001
0.01
0.1
1
10
High ReliefHardbottom
Figure 9: Miami ODMDS dredged material disposal plume advection estimates for plume travel times of up to five hours based on surface currents (50 m) measured at the Miami ODMDS. Contours represent the frequency that a disposal plume will visit the 0.04 km2 grid cell during the five hour travel time.
11
Miami
Frequency %
0.001
0.01
0.1
1
10
High ReliefHardbottom
Figure 10: Miami ODMDS dredged material disposal plume advection estimates for plume travel times of up to five hours based on currents measured at the Miami ODMDS and at the reef line. Contours represent the frequency that a disposal plume will visit the 0.04 km2 grid cell during the five hour travel time.
5.0 CONCLUSION The predominant current direction at the Miami ODMDS is to the north-northeast with
current reversals resulting in infrequent and lower magnitude currents to the south-southwest. Currents in the top 50 m of the water column at the ODMDS occur more frequently in the easterly than in the westerly direction and with greater magnitude. Since deployment of the real-time monitoring program, the established disposal criteria current threshold (-12 cm/sec) at the Miami ODMDS has been exceeded 1,277 times or 1.73% of the time. Exceedences have lasted from 20 minutes to 21 hours, with most exceedences lasting a single sampling event. Exceedences of the threshold lasting long enough for a no-disposal condition have occurred only 19 times during the almost three-year monitoring period and have never resulted in a delay in disposal operations. Analysis of the current data for the potential of currents to transport disposal plumes to the nearshore reefs shows that the probability that plumes will reach the reefs is low (less than 1% for five hour travel times).
12

6.0 REFERENCES EPA, 1995: Final environmental impact statement for the designation of an Ocean Dredged
Material Disposal Site located offshore of Miami, Florida. U.S. Environmental Protection Agency, Region 4 (August 1995).
Fischer, H.B., J.E. List, C.R. Koh, J. Imberger, and N.H. Brooks, 1979: Mixing in Inland and Coastal Waters. Academic Press, San Diego, CA, 302 pp.
Proni, J.R., C.J. McArthur, and G. Schuster, 1998: Adaptive dredged material discharge for the Port of Miami. Proceedings, Ports ’98 Conference, Long Beach, CA, March 8-11, 1998. American Society of Civil Engineers, pp. 1249-1257.
RD Instruments, 1996: Acoustic Doppler Current Profiler: Principles of Operation, A Practical Primer (January 1996), San Diego, CA.
13