Review of the Ancillary Facilities Proposed by Applicants for the...
44
Review of the Ancillary Facilities Proposed by Applicants for the Prince George’s County, Maryland Gaming Facility License Presented to: Maryland Lottery Commission, Video Lottery Facility Location Commission Presented by: Macomber International, Inc. Date: December 6, 2013 v.1.4.
Transcript of Review of the Ancillary Facilities Proposed by Applicants for the...
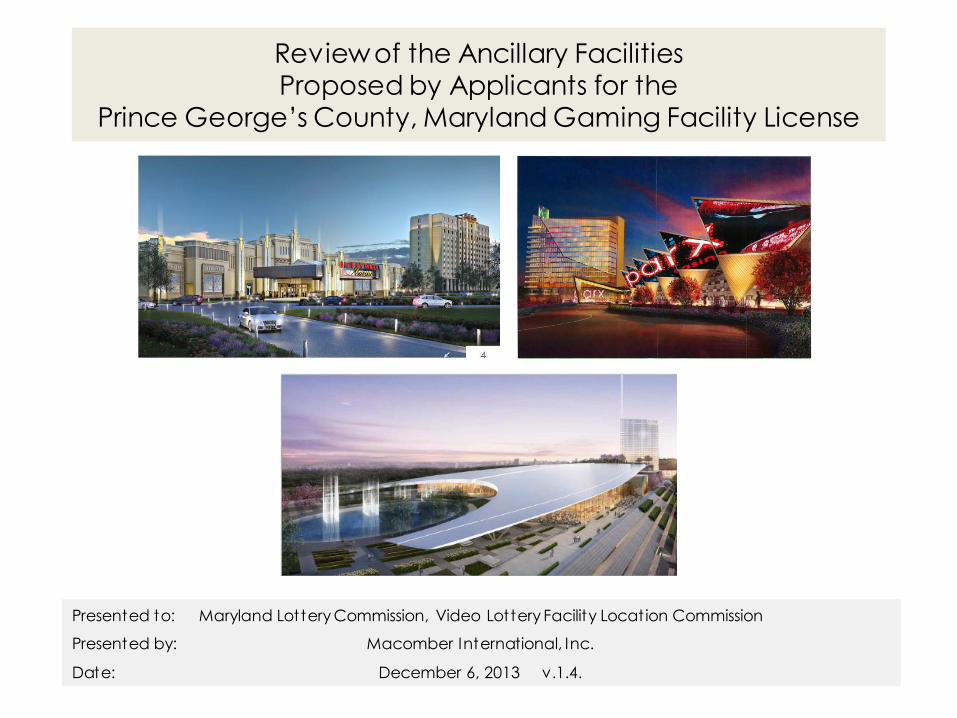
Review of the Ancillary Facilities Proposed by Applicants for the
Prince George’s County, Maryland Gaming Facility License
Presented to: Maryland Lottery Commission, Video Lottery Facility Location Commission
Presented by: Macomber International, Inc.
Date: December 6, 2013 v.1.4.
Assignment
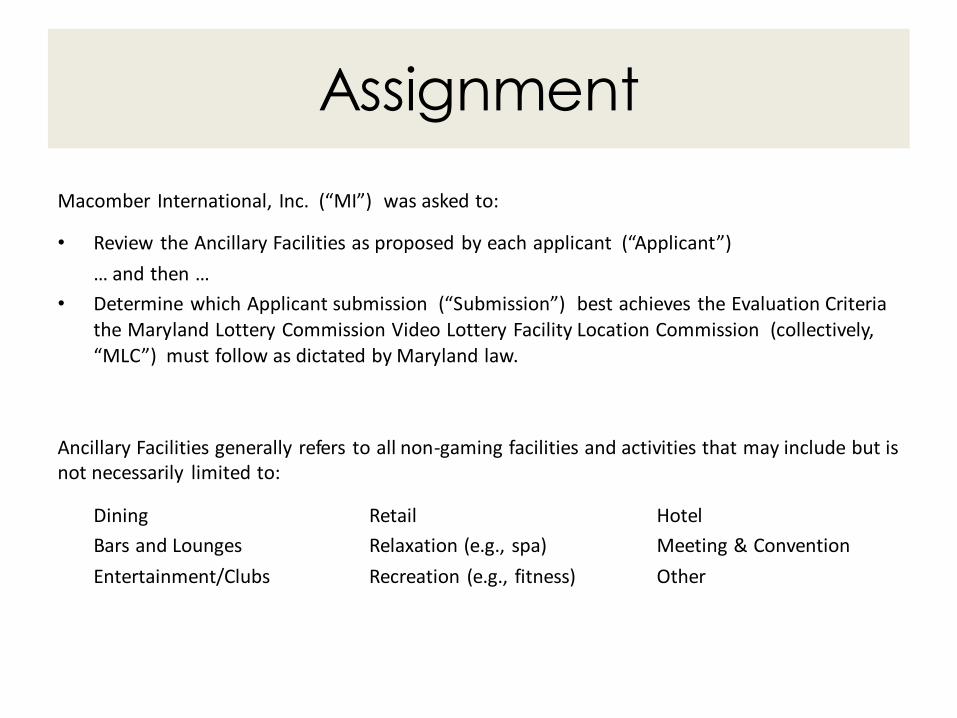
Macomber International, Inc. (“MI”) was asked to:
• Review the Ancillary Facilities as proposed by each applicant (“Applicant”)
… and then …
• Determine which Applicant submission (“Submission”) best achieves the Evaluation Criteria the Maryland Lottery Commission Video Lottery Facility Location Commission (collectively, “MLC”) must follow as dictated by Maryland law.
Ancillary Facilities generally refers to all non-gaming facilities and activities that may include but is not necessarily limited to:
Dining Retail Hotel
Bars and Lounges Relaxation (e.g., spa) Meeting & Convention
Entertainment/Clubs Recreation (e.g., fitness) Other
Qualifications
This review and evaluation was conducted solely by Dean M. Macomber, President, Macomber International, Inc.
• 38 years in the gaming industry.
• Held operation positions ranging from Dealer to CEO.
• Worked as a consultant for a public accounting firm as well as my own company, MI.
• Involved in the opening of 7 casinos and 2 takeovers.
• Projects have included:
o Scope: 400 unit slot operation to >$2B mega Casino-Resorts.
o Positioning:
• Locals, Regional, Domestic/International to …
• Value driven slot to …
• VVIP table game operations to …
• Virtually everything in between.
o Location:
• Operations: Nevada (Las Vegas, Lake Tahoe, Laughlin), New Jersey, Canada, Macau, Philippines.
• Consulting: U.S., Canada, Caribbean, Latin America, Europe, Russia, Asia, Australia, Internet gaming, and technology.
o Similar work: Town of Plainville, MA. Kansas Gaming and Lottery Commission. Other venues as bidder.
• 65 domestic/international presentations, university casino gaming courses, 23 articles.
• Masters Hotel School of Administration, Cornell University plus undergraduate Marketing.
Approach
MI took a linear sequential approach to its review. MI initially began with a top down review following the work plan outlined below but, as findings so dictated, iterated this sequential approach up, down, and across between and among steps until a holistic overall conclusion was reached:
1. Review and understand the driving goals and parameters established by Maryland gaming related laws, statutes, legislative imperatives, and regulations.
2. Evaluate external factors that influence or have the potential to influence the proposed gaming facilities.
3. Evaluate internal factors that influenced or could influence the applicant’s Submission.
4. Evaluate the specifics of each applicant’s proposal.
5. Evaluate and Compare each Applicant’s Submission.
MI’s assessed each Submission project as an independent business activity but also in the context of other existing and possible future gaming and non-gaming competition.
Ancillary Facility Evaluation Criteria
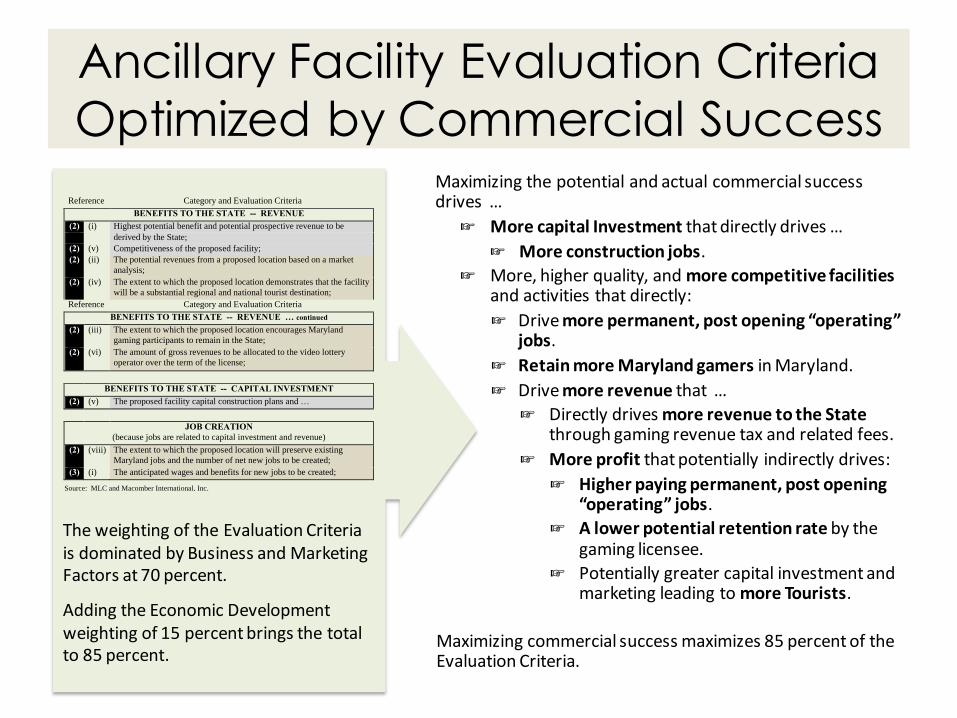
Optimized by Commercial SuccessMaximizing the potential and actual commercial success drives …
☞ More capital Investment that directly drives …
☞ More construction jobs.
☞ More, higher quality, and more competitive facilities and activities that directly:
☞ Drive more permanent, post opening “operating” jobs.
☞ Retain more Maryland gamers in Maryland.
☞ Drive more revenue that …
☞ Directly drives more revenue to the State through gaming revenue tax and related fees.
☞ More profit that potentially indirectly drives:
☞ Higher paying permanent, post opening “operating” jobs.
☞ A lower potential retention rate by the gaming licensee.
☞ Potentially greater capital investment and marketing leading to more Tourists.
Maximizing commercial success maximizes 85 percent of the Evaluation Criteria.
The weighting of the Evaluation Criteria is dominated by Business and Marketing Factors at 70 percent.
Adding the Economic Development weighting of 15 percent brings the total to 85 percent.
Reference Category and Evaluation Criteria
BENEFITS TO THE STATE -- REVENUE
(2) (i) Highest potential benefit and potential prospective revenue to be
derived by the State;
(2) (v) Competitiveness of the proposed facility;
(2) (ii) The potential revenues from a proposed location based on a market
analysis;
(2) (iv) The extent to which the proposed location demonstrates that the facility
will be a substantial regional and national tourist destination;
Reference Category and Evaluation Criteria
BENEFITS TO THE STATE -- REVENUE … continued
(2) (iii) The extent to which the proposed location encourages Maryland
gaming participants to remain in the State;
(2) (vi) The amount of gross revenues to be allocated to the video lottery
operator over the term of the license;
BENEFITS TO THE STATE -- CAPITAL INVESTMENT
(2) (v) The proposed facility capital construction plans and …
JOB CREATION
(because jobs are related to capital investment and revenue)
(2) (viii) The extent to which the proposed location will preserve existing
Maryland jobs and the number of net new jobs to be created;
(3) (i) The anticipated wages and benefits for new jobs to be created;
Source: MLC and Macomber International, Inc.
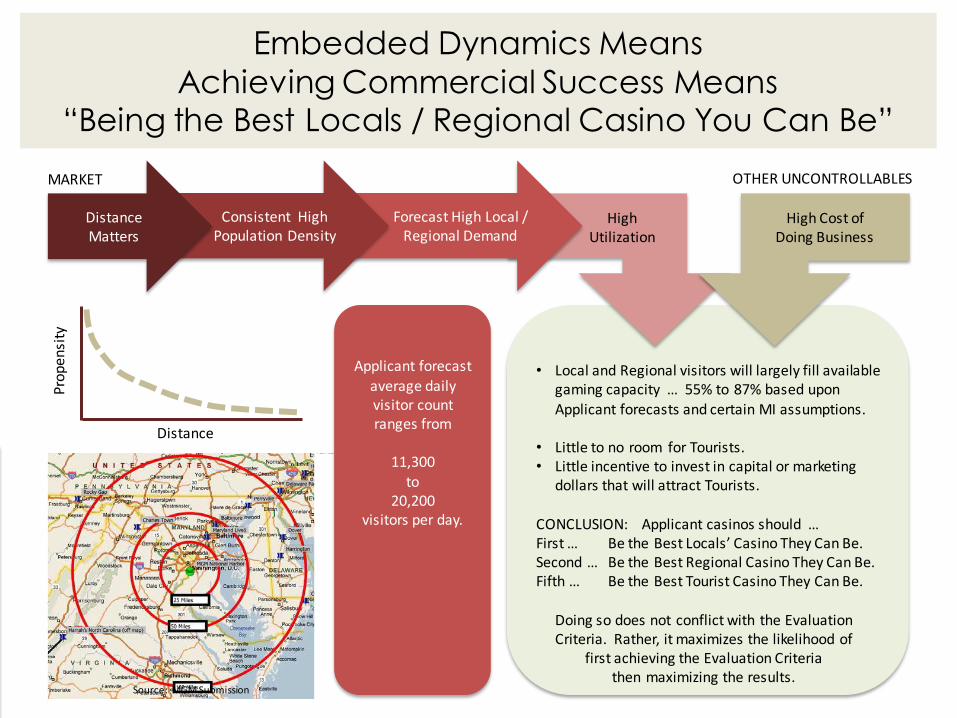
• Local and Regional visitors will largely fill available gaming capacity … 55% to 87% based upon Applicant forecasts and certain MI assumptions.
• Little to no room for Tourists.• Little incentive to invest in capital or marketing
dollars that will attract Tourists.
CONCLUSION: Applicant casinos should … First … Be the Best Locals’ Casino They Can Be.Second … Be the Best Regional Casino They Can Be.Fifth … Be the Best Tourist Casino They Can Be.
Doing so does not conflict with the EvaluationCriteria. Rather, it maximizes the likelihood of
first achieving the Evaluation Criteria then maximizing the results.
Embedded Dynamics Means
Achieving Commercial Success Means “Being the Best Locals / Regional Casino You Can Be”
Forecast High Local / Regional Demand
Consistent High Population Density
Distance Matters
High Utilization
High Cost of Doing Business
Pro
pe
nsi
ty
Distance
Source: MGM Submission
MARKET OTHER UNCONTROLLABLES
Applicant forecast
average daily visitor count ranges from
11,300
to 20,200
visitors per day.
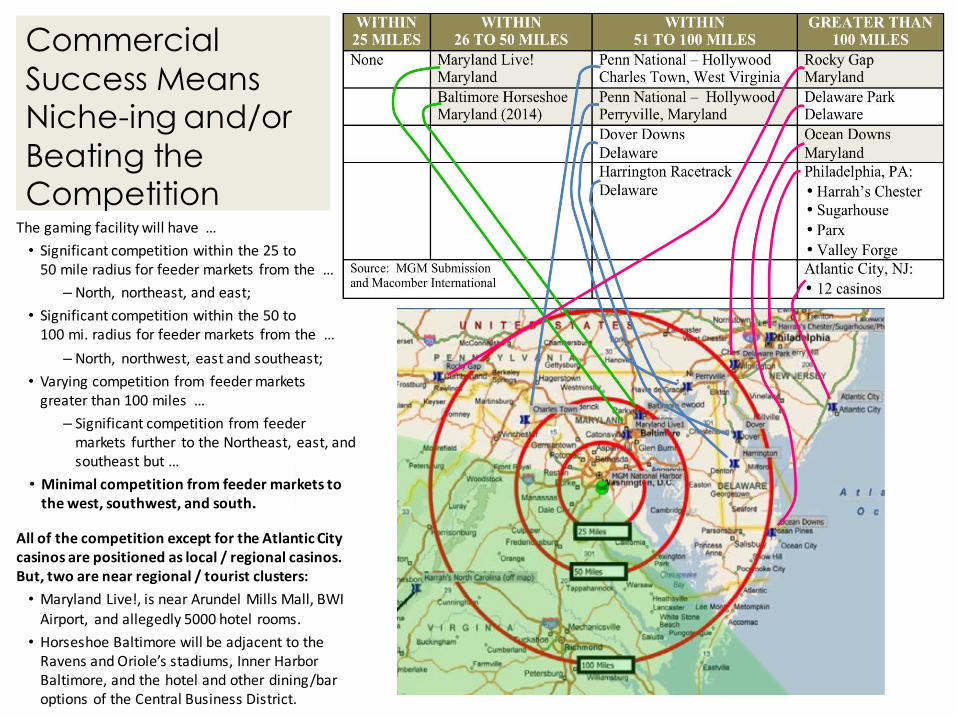
Commercial
Success Means Niche-ing and/or
Beating the Competition
The gaming facility will have …
• Significant competition within the 25 to 50 mile radius for feeder markets from the …
–North, northeast, and east;
• Significant competition within the 50 to 100 mi. radius for feeder markets from the …
– North, northwest, east and southeast;
• Varying competition from feeder markets greater than 100 miles …
– Significant competition from feeder markets further to the Northeast, east, and southeast but …
• Minimal competition from feeder markets to the west, southwest, and south.
All of the competition except for the Atlantic City casinos are positioned as local / regional casinos. But, two are near regional / tourist clusters:
• Maryland Live!, is near Arundel Mills Mall, BWI Airport, and allegedly 5000 hotel rooms.
• Horseshoe Baltimore will be adjacent to the Ravens and Oriole’s stadiums, Inner Harbor Baltimore, and the hotel and other dining/bar options of the Central Business District.
Achieve Evaluation Criteria and
Maximize performance by …
Being the Best Locals’ / Regional Casino You Can Be
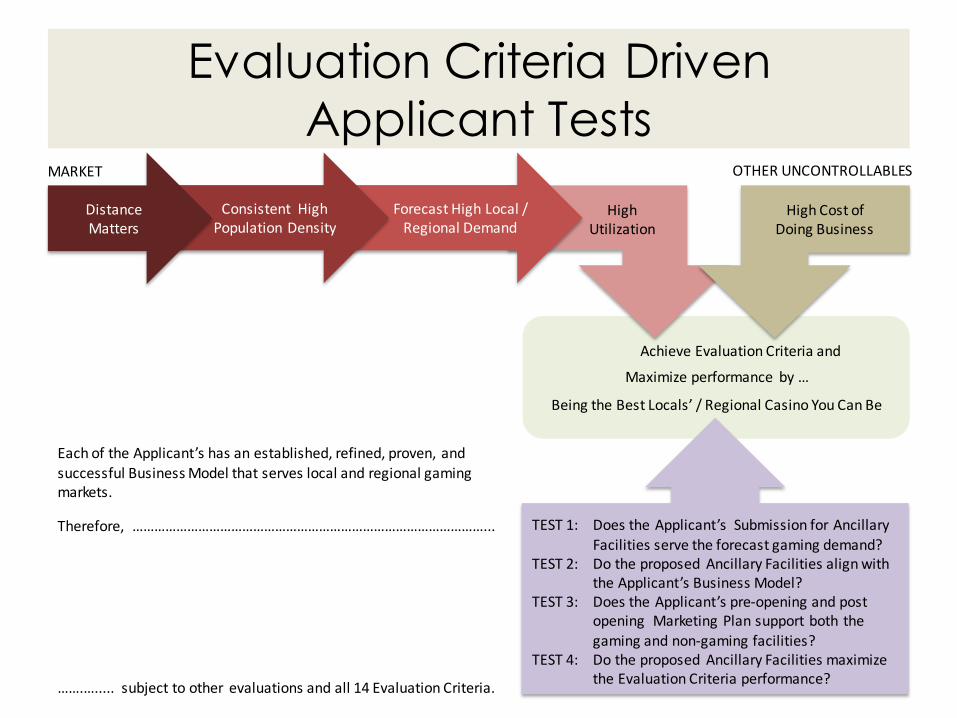
Evaluation Criteria Driven
Applicant Tests
Each of the Applicant’s has an established, refined, proven, and successful Business Model that serves local and regional gaming markets.
Therefore, ……………………………………………………………………………………...
…….…..... subject to other evaluations and all 14 Evaluation Criteria.
TEST 1: Does the Applicant’s Submission for Ancillary
Facilities serve the forecast gaming demand?TEST 2: Do the proposed Ancillary Facilities align with
the Applicant’s Business Model?TEST 3: Does the Applicant’s pre-opening and post
opening Marketing Plan support both the
gaming and non-gaming facilities?TEST 4: Do the proposed Ancillary Facilities maximize
the Evaluation Criteria performance?
Forecast High Local / Regional Demand
Consistent High Population Density
Distance Matters
High Utilization
High Cost of Doing Business
MARKET OTHER UNCONTROLLABLES
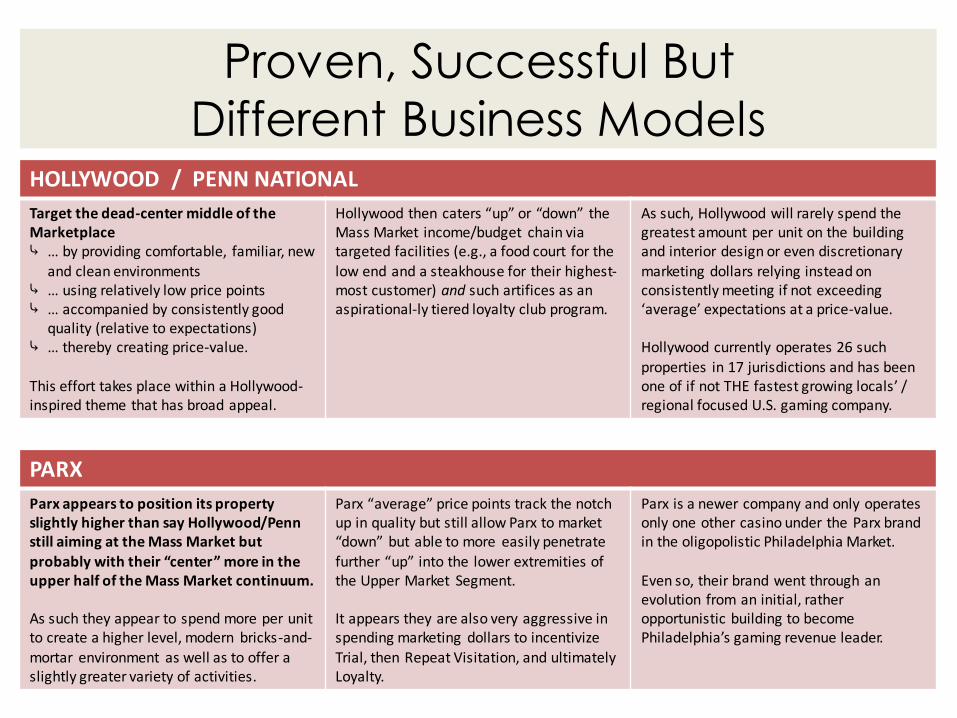
Proven, Successful But
Different Business Models
PARX:
HOLLYWOOD / PENN NATIONAL
Target the dead-center middle of the Marketplace ⤷ … by providing comfortable, familiar, new
and clean environments ⤷ … using relatively low price points ⤷ … accompanied by consistently good
quality (relative to expectations)⤷ … thereby creating price-value.
This effort takes place within a Hollywood-inspired theme that has broad appeal.
Hollywood then caters “up” or “down” the Mass Market income/budget chain viatargeted facilities (e.g., a food court for the low end and a steakhouse for their highest-most customer) and such artifices as an aspirational-ly tiered loyalty club program.
As such, Hollywood will rarely spend the greatest amount per unit on the building and interior design or even discretionary marketing dollars relying instead on consistently meeting if not exceeding ‘average’ expectations at a price-value.
Hollywood currently operates 26 such properties in 17 jurisdictions and has been one of if not THE fastest growing locals’ / regional focused U.S. gaming company.
PARX
Parx appears to position its property slightly higher than say Hollywood/Penn still aiming at the Mass Market but probably with their “center” more in the upper half of the Mass Market continuum.
As such they appear to spend more per unit to create a higher level, modern bricks-and-mortar environment as well as to offer a slightly greater variety of activities.
Parx “average” price points track the notch up in quality but still allow Parx to market “down” but able to more easily penetrate further “up” into the lower extremities of the Upper Market Segment.
It appears they are also very aggressive in spending marketing dollars to incentivize Trial, then Repeat Visitation, and ultimatelyLoyalty.
Parx is a newer company and only operates only one other casino under the Parx brand in the oligopolistic Philadelphia Market.
Even so, their brand went through an evolution from an initial, rather opportunistic building to become Philadelphia’s gaming revenue leader.
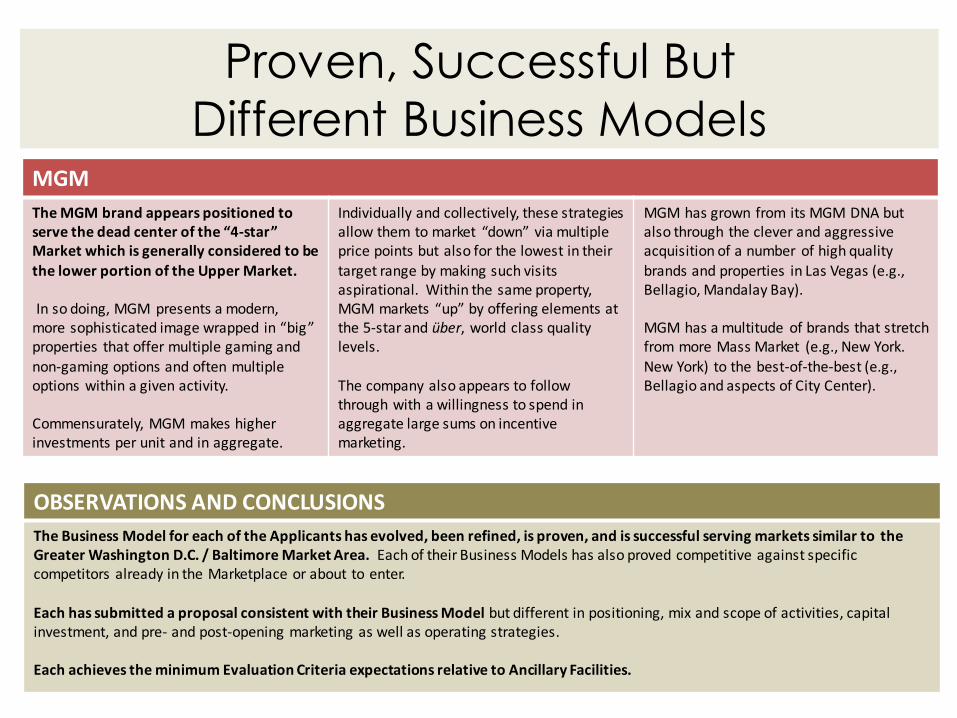
Proven, Successful But
Different Business ModelsMGM
The MGM brand appears positioned to serve the dead center of the “4-star” Market which is generally considered to be
the lower portion of the Upper Market.
In so doing, MGM presents a modern, more sophisticated image wrapped in “big” properties that offer multiple gaming and non-gaming options and often multiple options within a given activity.
Commensurately, MGM makes higher investments per unit and in aggregate.
Individually and collectively, these strategies allow them to market “down” via multiple price points but also for the lowest in their
target range by making such visits aspirational. Within the same property, MGM markets “up” by offering elements at the 5-star and über, world class quality levels.
The company also appears to follow through with a willingness to spend in aggregate large sums on incentive marketing.
MGM has grown from its MGM DNA but also through the clever and aggressive acquisition of a number of high quality
brands and properties in Las Vegas (e.g., Bellagio, Mandalay Bay).
MGM has a multitude of brands that stretch from more Mass Market (e.g., New York. New York) to the best-of-the-best (e.g., Bellagio and aspects of City Center).
OBSERVATIONS AND CONCLUSIONS
The Business Model for each of the Applicants has evolved, been refined, is proven, and is successful serving markets similar to the Greater Washington D.C. / Baltimore Market Area. Each of their Business Models has also proved competitive against specific competitors already in the Marketplace or about to enter.
Each has submitted a proposal consistent with their Business Model but different in positioning, mix and scope of activities, capital investment, and pre- and post-opening marketing as well as operating strategies.
Each achieves the minimum Evaluation Criteria expectations relative to Ancillary Facilities.
Big PictureInvestment, Capacity, Revenue
HOLLYWOOD (Penn)
PARX MGM
Investment: Building, Equipment, & Supplies only
$458M
$379M Phase 1* $589M Full build out*
$735M
Gaming Positions 3,980 positions
4,190 positions 5,940 positions
4,481 positions
“Investment” (defined
above) per Gaming Position
$115,000
$90,000 Phase 1
$99,000 Full build out
$164,000
Forecast Gross Gaming
Revenue
$334M 2016
$413M 2019
$660M 2016
$809M 2019
$599M 2016
$688M 2019
Forecast Non-gaming
Revenue
$ 38M 2016
$ 47M 2019
$ 81M 2016
$122M 2019
$107M 2016
$123M 2019 * Parx has proposed opening in 2016 Phase 1 with 3000 VLTs but by 2019 adding an additional 1750 VLTs
(4750 VLTs total if the MLC is able and willing to allow additional units) and their 250 room hotel.
Source: Applicant submissions and Macomber International, Inc.
2019 dollars HOLLYWOOD
(Penn)
PARX MGM
CCA Forecast Gross Gaming
Revenue
$560M
136% Applicant
$682M
84% Applicant
$713M
104% Applicant
Custom Gaming Forecast
Gross Gaming Revenue
$551M
133% Applicant
$617M
76% Applicant
$719M
105% Applicant
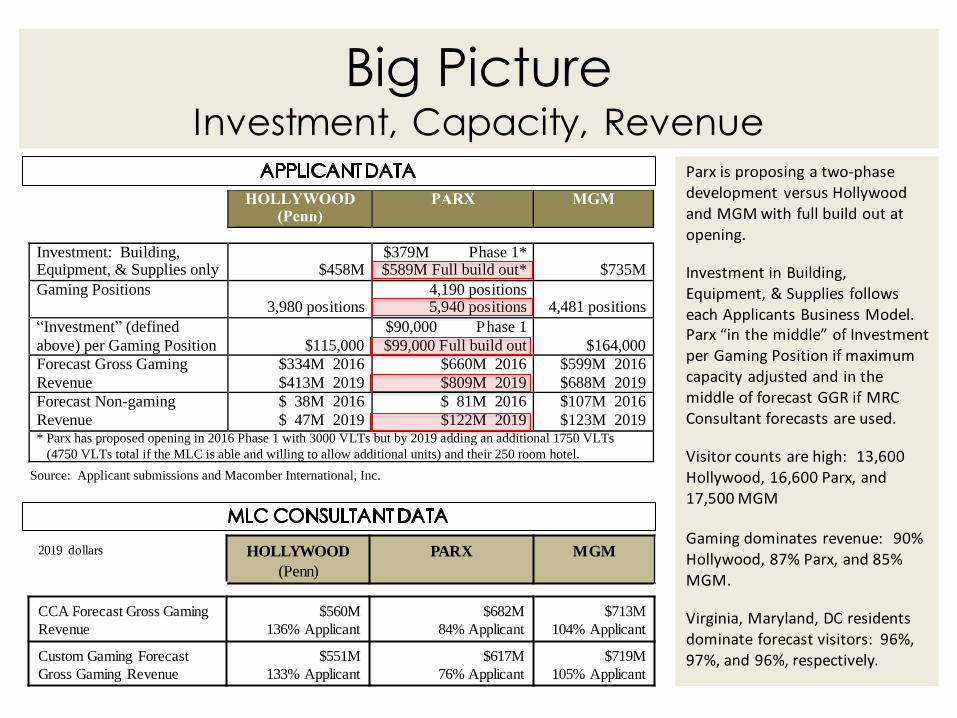
Parx is proposing a two-phase development versus Hollywood and MGM with full build out at opening.
Investment in Building, Equipment, & Supplies follows each Applicants Business Model. Parx “in the middle” of Investment per Gaming Position if maximum capacity adjusted and in the middle of forecast GGR if MRC Consultant forecasts are used.
Visitor counts are high: 13,600 Hollywood, 16,600 Parx, and 17,500 MGM
Gaming dominates revenue: 90% Hollywood, 87% Parx, and 85% MGM.
Virginia, Maryland, DC residents dominate forecast visitors: 96%, 97%, and 96%, respectively.
Gaming Facilities
HOLLYWOOD (Penn)
PARX MGM
VLTs / Slot Machines
3,000 units 3,000 units (Opening) 4,750 units (Phase 2)
3,600 units
Table Games 100 units 120 units (Opening) 110 units
Poker 40 units 50 units (Opening) 30 units
Total Positions (calculated)
3,980 positions 4,190 positions
5,940 positions
4,580 positions
Specialty
Areas
High Limit/VIP Areas:
55 VLTs. 12 Tables.
High Limit/VIP Areas:
80 VLTs. 15 Tables.
Premium/VIP Areas:
64 VLTs. 15 Tables.
Lottery Sales Yes. Yes. Yes.
Other Gaming Hollywood/Penn only: Rosecroft Raceway to continue seasonal live
harness racing and year around simulcast.
Forecast
visitors per day
11,300 2016
13,500 2019
16,000 2016
20,000 2019
18,600 2016
20,200 2019
Source: Applicant submissions, website, articles, and Macomber International, Inc.
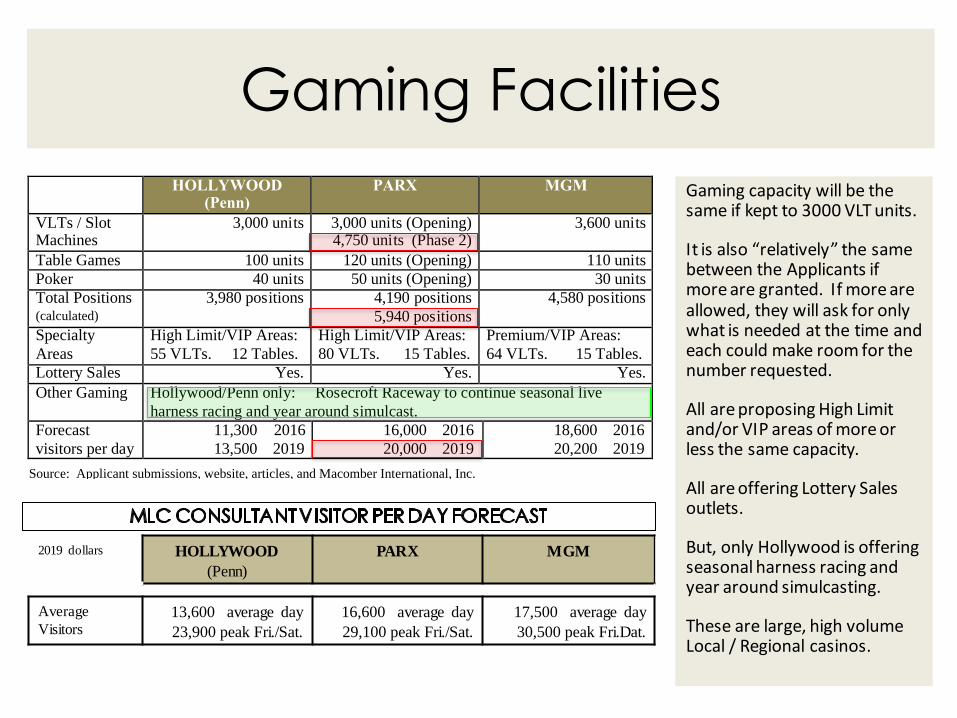
Gaming capacity will be the same if kept to 3000 VLT units.
It is also “relatively” the same between the Applicants if more are granted. If more are allowed, they will ask for only what is needed at the time and each could make room for the number requested.
All are proposing High Limit and/or VIP areas of more or less the same capacity.
All are offering Lottery Sales outlets.
But, only Hollywood is offering seasonal harness racing and year around simulcasting.
These are large, high volume Local / Regional casinos.
2019 dollars HOLLYWOOD
(Penn)
PARX MGM
Average
Visitors13,600 average day
23,900 peak Fri./Sat.
16,600 average day
29,100 peak Fri./Sat.
17,500 average day
30,500 peak Fri.Dat.
Ranking Importance of Gamer
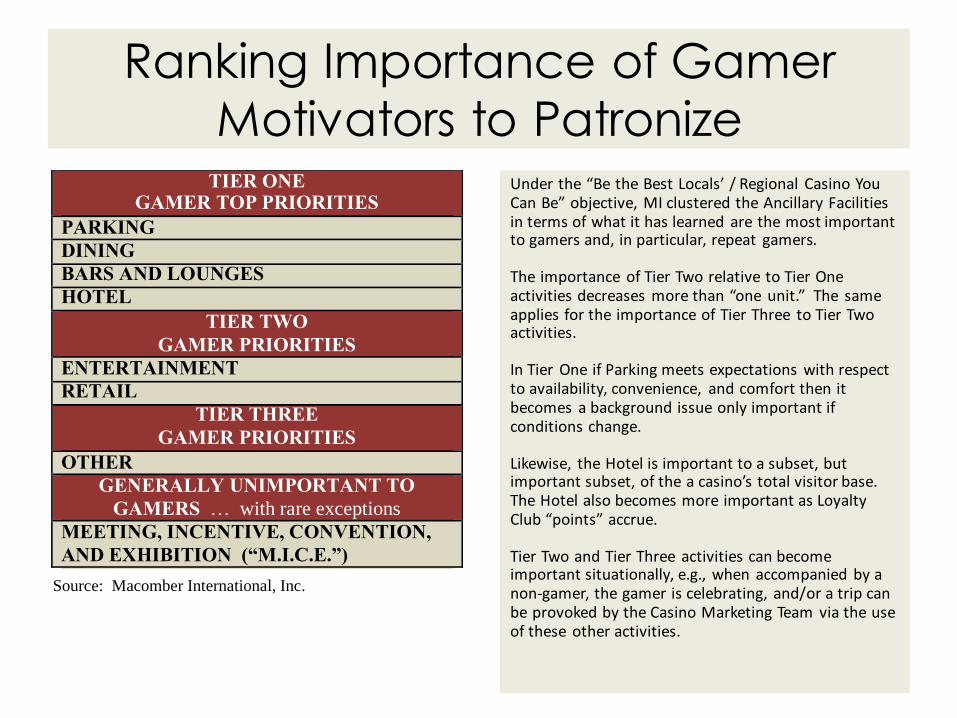
Motivators to PatronizeUnder the “Be the Best Locals’ / Regional Casino You Can Be” objective, MI clustered the Ancillary Facilities in terms of what it has learned are the most important to gamers and, in particular, repeat gamers.
The importance of Tier Two relative to Tier One activities decreases more than “one unit.” The same applies for the importance of Tier Three to Tier Two activities.
In Tier One if Parking meets expectations with respect to availability, convenience, and comfort then it becomes a background issue only important if conditions change.
Likewise, the Hotel is important to a subset, but important subset, of the a casino’s total visitor base. The Hotel also becomes more important as Loyalty Club “points” accrue.
Tier Two and Tier Three activities can become important situationally, e.g., when accompanied by a non-gamer, the gamer is celebrating, and/or a trip can be provoked by the Casino Marketing Team via the use of these other activities.
TIER ONE GAMER TOP PRIORITIES
PARKING
DINING
BARS AND LOUNGES
HOTEL
TIER TWO
GAMER PRIORITIES
ENTERTAINMENT
RETAIL
TIER THREE
GAMER PRIORITIES
OTHER
GENERALLY UNIMPORTANT TO
GAMERS … with rare exceptions
MEETING, INCENTIVE, CONVENTION,
AND EXHIBITION (“M.I.C.E.”)
Source: Macomber International, Inc.
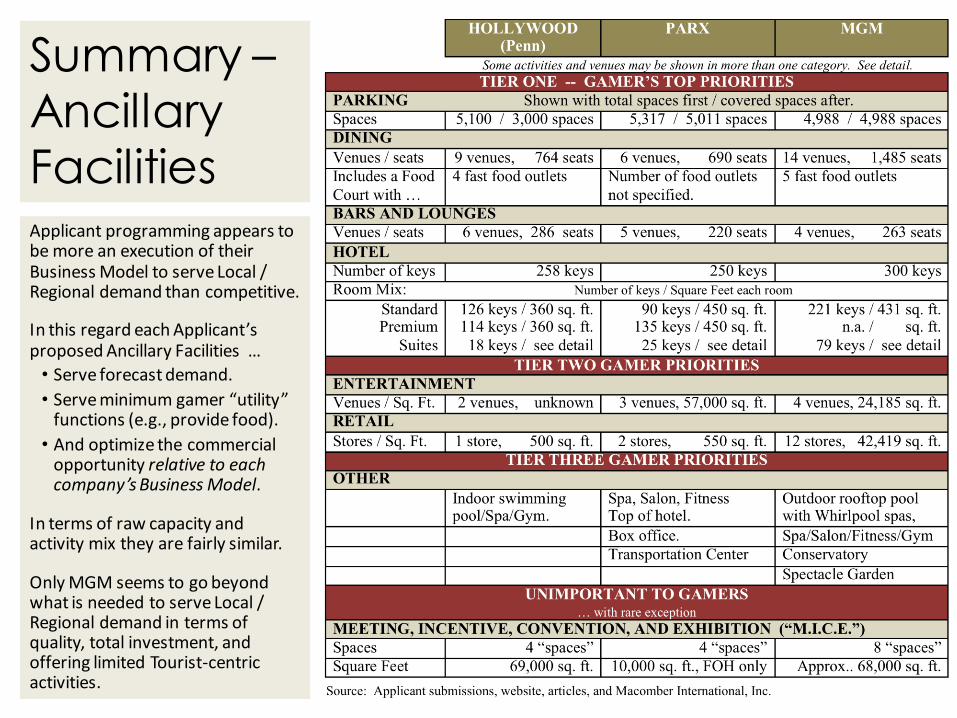
Summary –Ancillary FacilitiesApplicant programming appears to be more an execution of their Business Model to serve Local / Regional demand than competitive.
In this regard each Applicant’s proposed Ancillary Facilities …
• Serve forecast demand.
• Serve minimum gamer “utility” functions (e.g., provide food).
• And optimize the commercial opportunity relative to each company’s Business Model.
In terms of raw capacity and activity mix they are fairly similar.
Only MGM seems to go beyond what is needed to serve Local / Regional demand in terms of quality, total investment, and offering limited Tourist-centric activities.
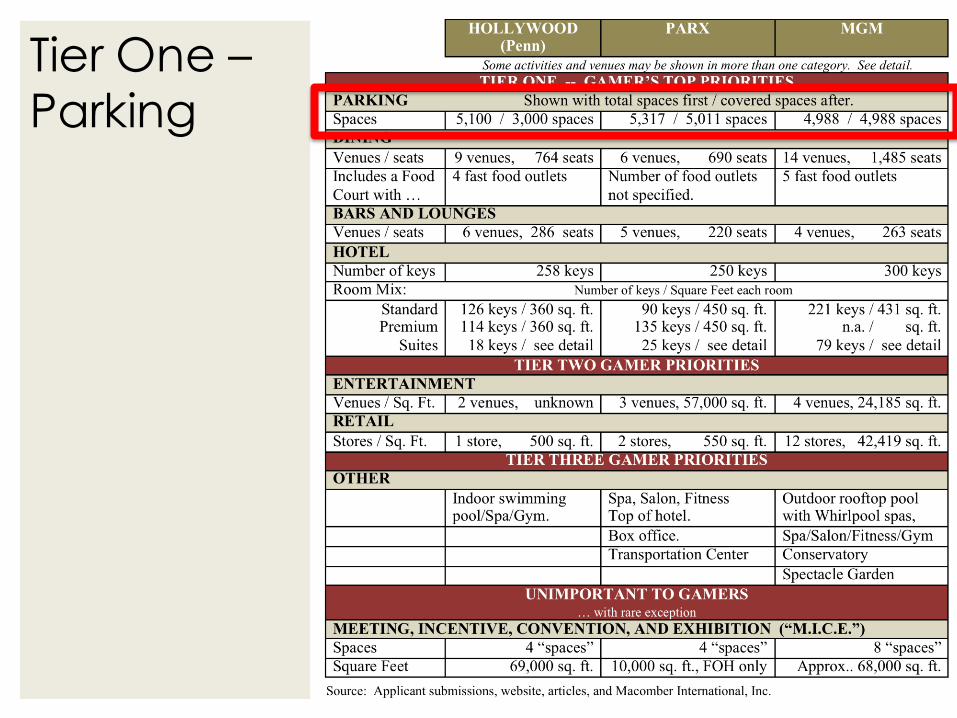
Tier One –Parking
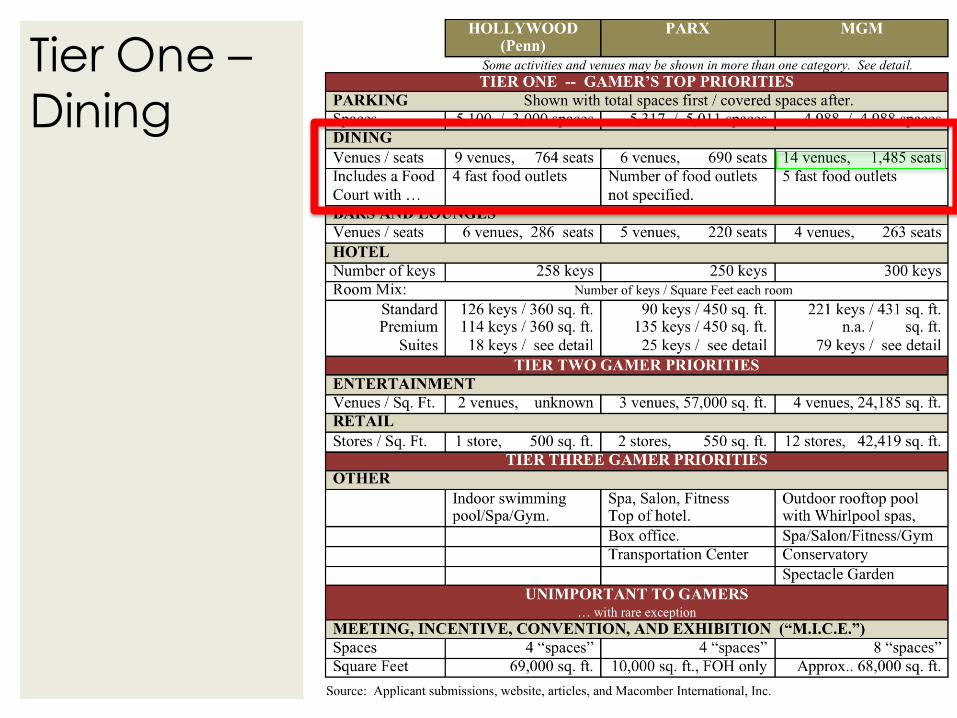
Tier One –Dining
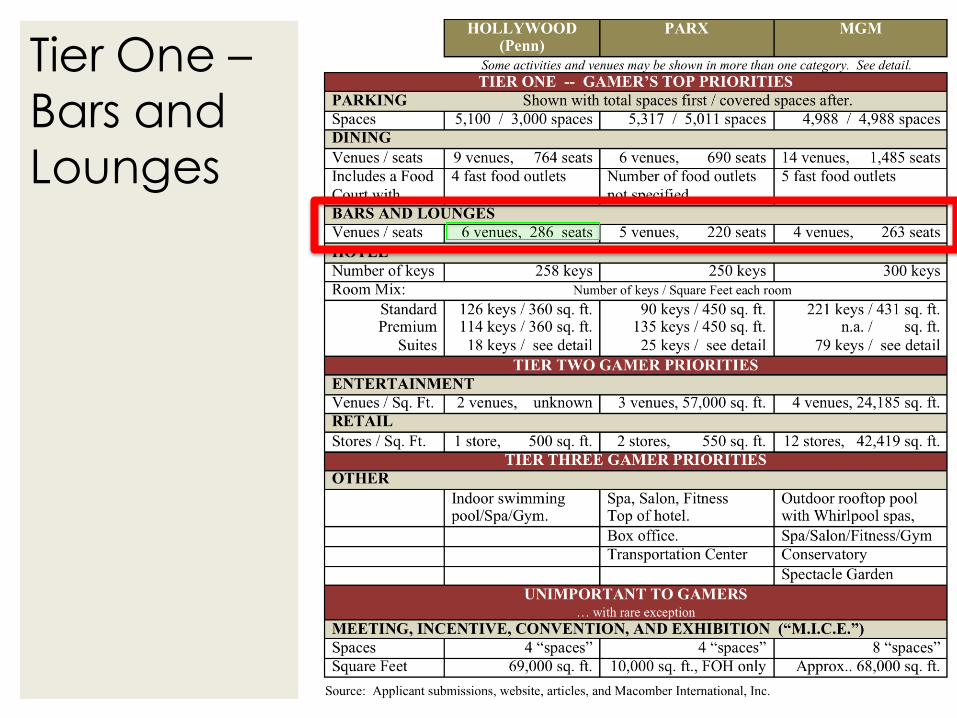
Tier One –Bars and Lounges
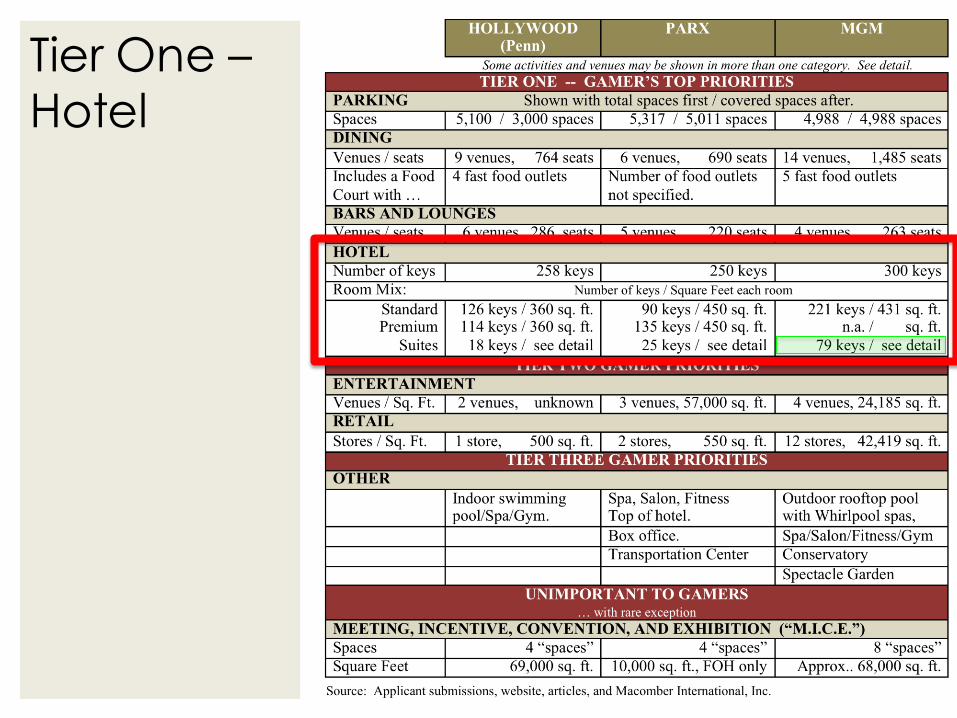
Tier One –Hotel
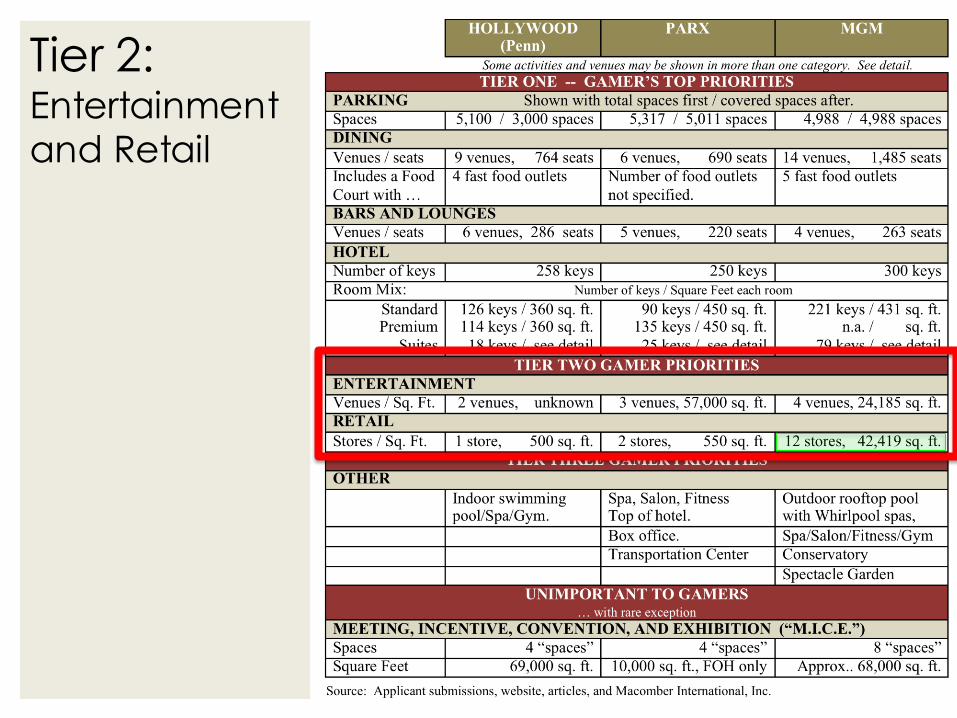
Tier 2: Entertainment and Retail
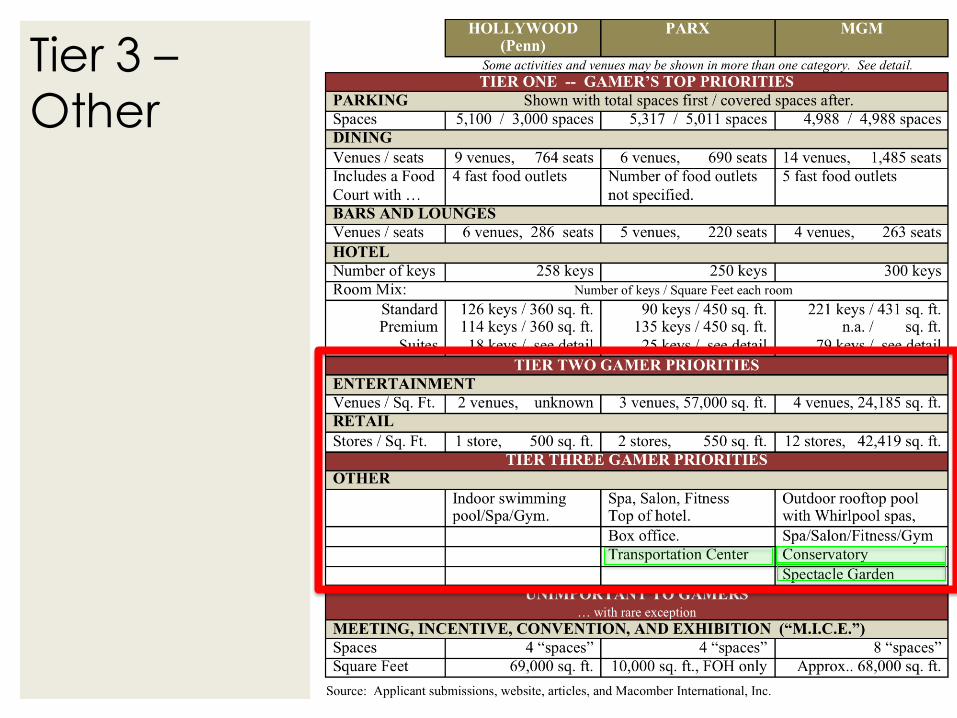
Tier 3 –Other
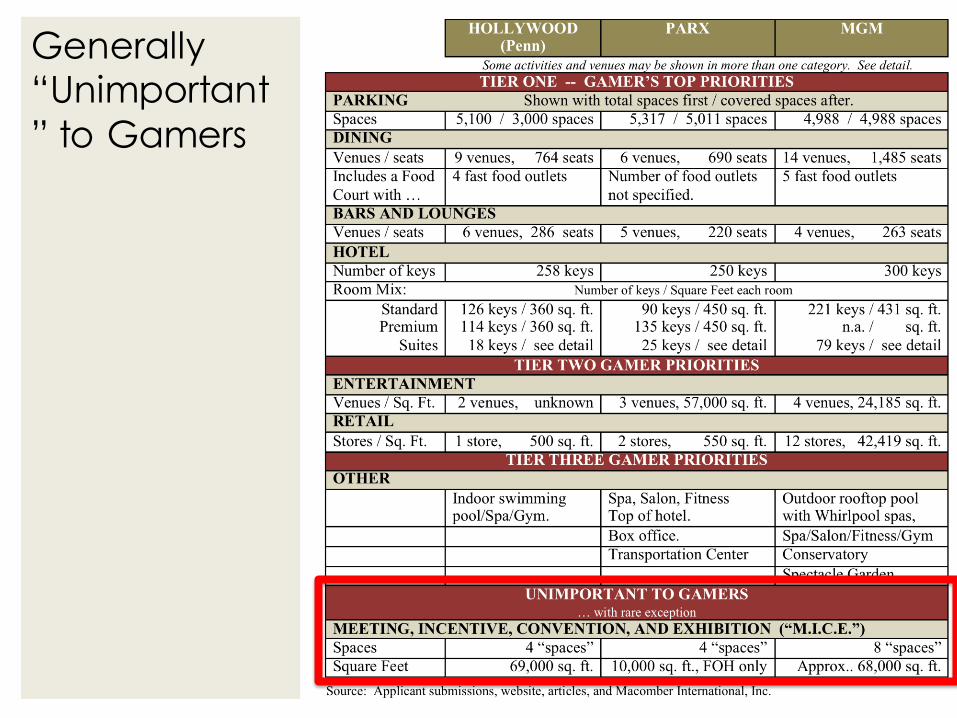
Generally “Unimportant
” to Gamers
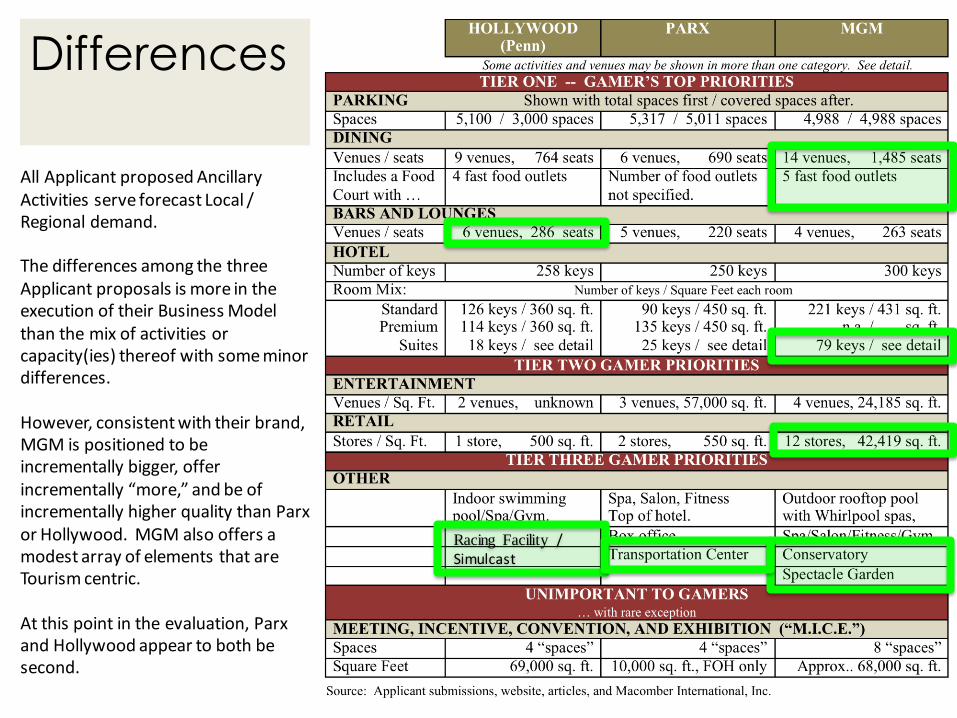
Differences
All Applicant proposed Ancillary Activities serve forecast Local / Regional demand.
The differences among the three Applicant proposals is more in the execution of their Business Model than the mix of activities or capacity(ies) thereof with some minor differences.
However, consistent with their brand, MGM is positioned to be incrementally bigger, offer incrementally “more,” and be of incrementally higher quality than Parxor Hollywood. MGM also offers a modest array of elements that are Tourism centric.
At this point in the evaluation, Parxand Hollywood appear to both be second.
Racing Facility / Simulcast
HOLLYWOOD PARX MGM
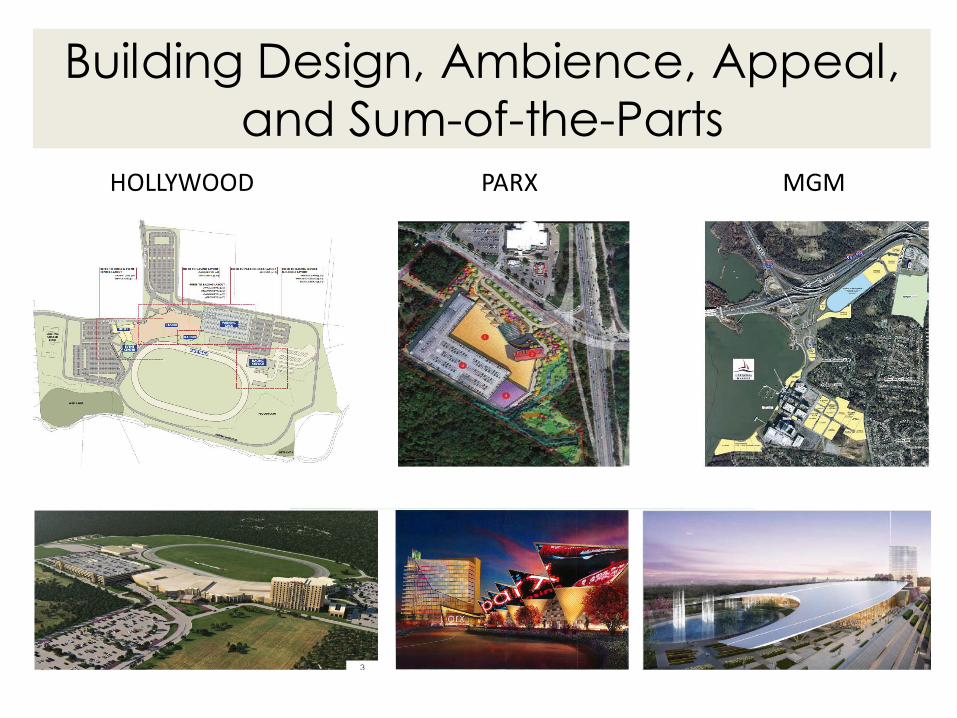
Building Design, Ambience, Appeal,
and Sum-of-the-Parts
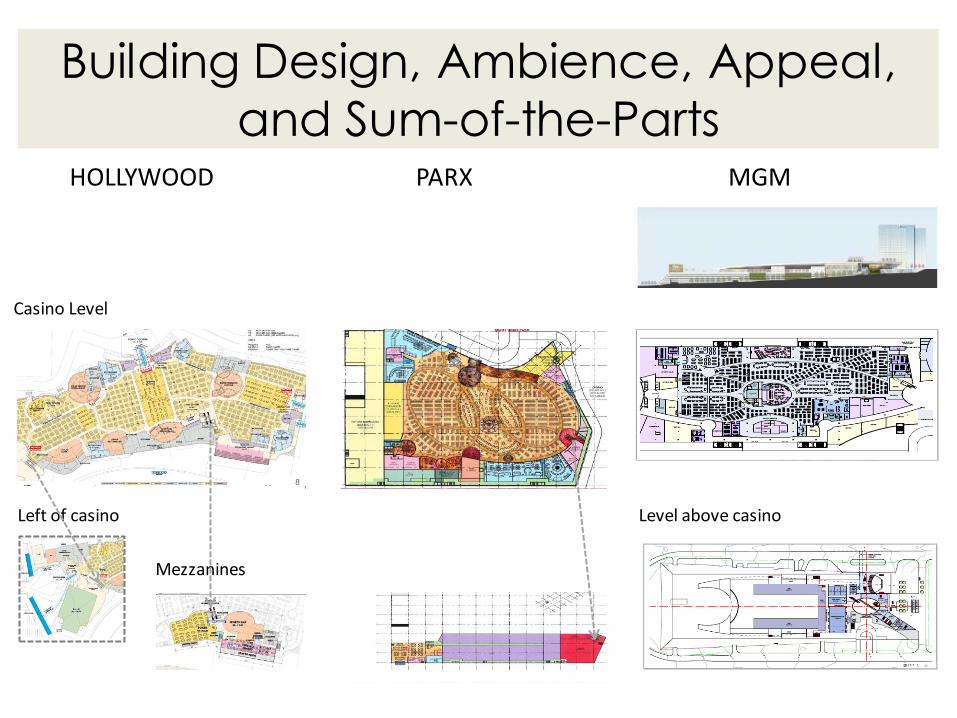
Building Design, Ambience, Appeal,
and Sum-of-the-PartsHOLLYWOOD PARX MGM
Casino Level
Left of casino Level above casino
Mezzanines
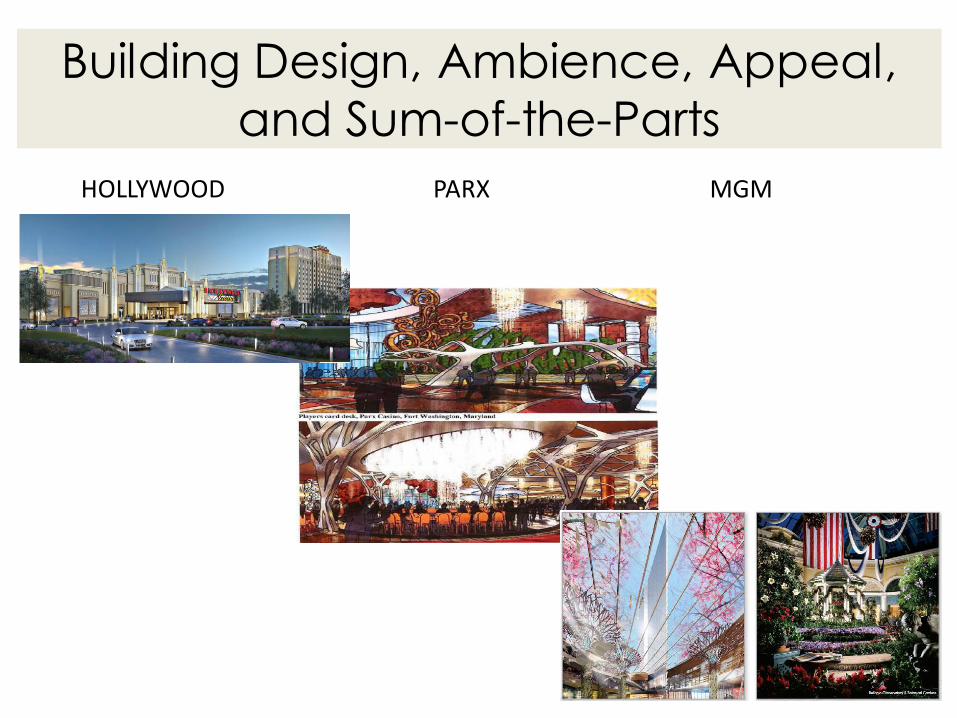
Building Design, Ambience, Appeal,
and Sum-of-the-Parts
HOLLYWOOD PARX MGM
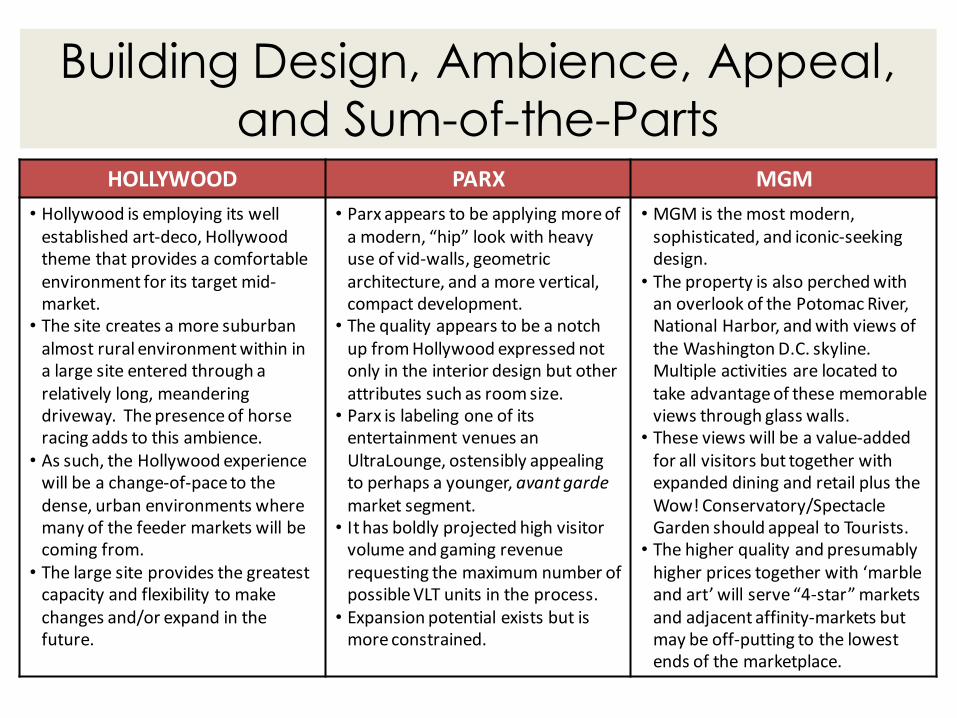
Building Design, Ambience, Appeal,
and Sum-of-the-PartsHOLLYWOOD PARX MGM
• Hollywood is employing its well established art-deco, Hollywood theme that provides a comfortable environment for its target mid-market.
• The site creates a more suburban almost rural environment within in a large site entered through a relatively long, meandering driveway. The presence of horse racing adds to this ambience.
• As such, the Hollywood experiencewill be a change-of-pace to the dense, urban environments where many of the feeder markets will be coming from.
• The large site provides the greatest capacity and flexibility to make changes and/or expand in the future.
• Parx appears to be applying more of a modern, “hip” look with heavy use of vid-walls, geometric architecture, and a more vertical, compact development.
• The quality appears to be a notch up from Hollywood expressed not only in the interior design but other attributes such as room size.
• Parx is labeling one of its entertainment venues an UltraLounge, ostensibly appealing to perhaps a younger, avant gardemarket segment.
• It has boldly projected high visitor volume and gaming revenue requesting the maximum number of possible VLT units in the process.
• Expansion potential exists but is more constrained.
• MGM is the most modern, sophisticated, and iconic-seekingdesign.
• The property is also perched with an overlook of the Potomac River, National Harbor, and with views of the Washington D.C. skyline. Multiple activities are located to take advantage of these memorable views through glass walls.
• These views will be a value-added for all visitors but together with expanded dining and retail plus the Wow! Conservatory/Spectacle Garden should appeal to Tourists.
• The higher quality and presumably higher prices together with ‘marble and art’ will serve “4-star” markets and adjacent affinity-markets but may be off-putting to the lowest ends of the marketplace.
Marketing Expenditure HOLLYWOOD
(Penn) PARX MGM
2016 / 2019 followed by % of gaming revenue for that year.
GAMING REVENUE: $334M / $413M $660M / $809M $599M / $688M
MARKETING:
Promotional Allowances $ 13M / $ 16M
3.9% / 3.9%
$ 31M / $ 43M
4.7% / 5.3%
$ 27M / $ 32M
4.5% / 4.7%
Marketing - General & Administrative
$ 11M / $ 14M 3.3% / 3.3%
$ 34M / $ 47M 5.1% / 5.9%
$ 10M / $ 10M 1.6% / 1.4%
Subtotal $ 24M / $ 30M 7.2% / 7.2%
$ 65M / $ 90M 9.8% / 11.2%
$ 37M / $ 42M 6.1% / 6.1%
Entertainment Expenses n.a. / n.a.
$ 9 M / $ 9M
1.4% / 1.2%
$ 6M / $ 6M
0.8% / 0.9%
Total Marketing n.a. / n.a.
$ 74M / $ 100M
11.2% / 12.3%
$ 43M / $ 48M
7.1% / 7.0%
Source: Applicant “Workbooks” and Macomber International, Inc.
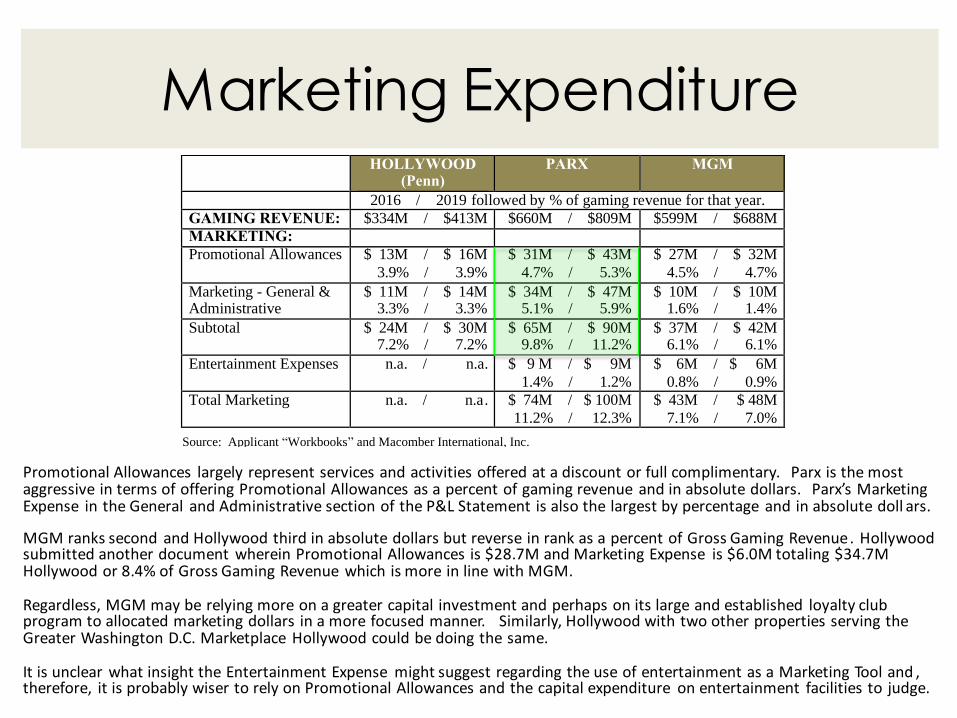
Promotional Allowances largely represent services and activities offered at a discount or full complimentary. Parx is the most aggressive in terms of offering Promotional Allowances as a percent of gaming revenue and in absolute dollars. Parx’s Marketing Expense in the General and Administrative section of the P&L Statement is also the largest by percentage and in absolute doll ars.
MGM ranks second and Hollywood third in absolute dollars but reverse in rank as a percent of Gross Gaming Revenue. Hollywood submitted another document wherein Promotional Allowances is $28.7M and Marketing Expense is $6.0M totaling $34.7M Hollywood or 8.4% of Gross Gaming Revenue which is more in line with MGM.
Regardless, MGM may be relying more on a greater capital investment and perhaps on its large and established loyalty club program to allocated marketing dollars in a more focused manner. Similarly, Hollywood with two other properties serving theGreater Washington D.C. Marketplace Hollywood could be doing the same.
It is unclear what insight the Entertainment Expense might suggest regarding the use of entertainment as a Marketing Tool and , therefore, it is probably wiser to rely on Promotional Allowances and the capital expenditure on entertainment facilities to judge.
Evaluation –Quantitative
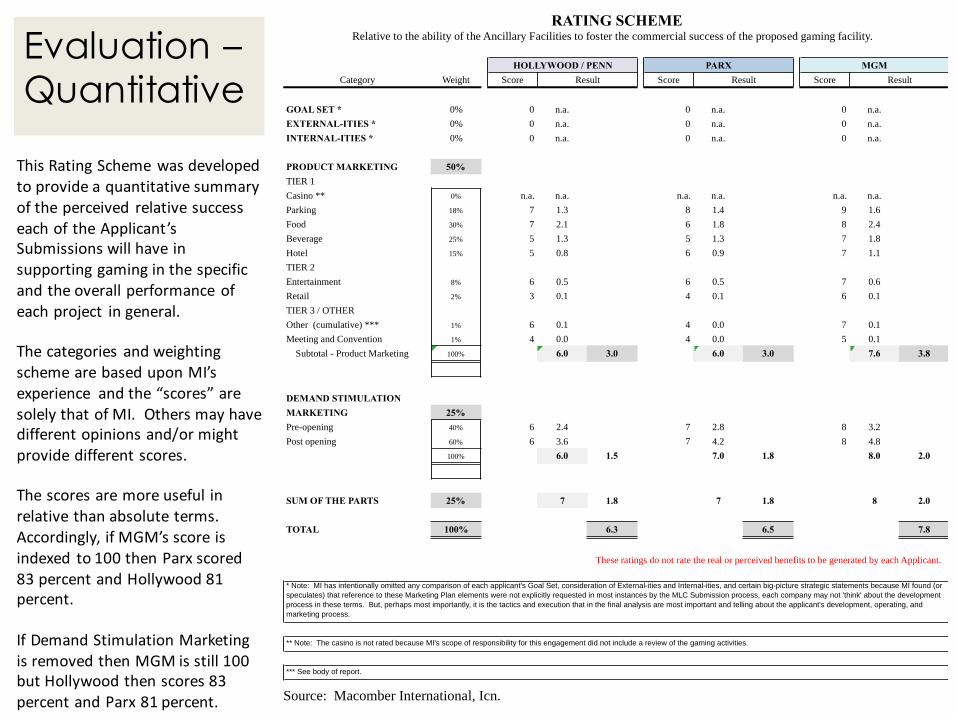
This Rating Scheme was developed to provide a quantitative summary of the perceived relative success each of the Applicant’s Submissions will have in supporting gaming in the specific and the overall performance of each project in general.
The categories and weighting scheme are based upon MI’s experience and the “scores” are solely that of MI. Others may have different opinions and/or might provide different scores.
The scores are more useful in relative than absolute terms. Accordingly, if MGM’s score is indexed to 100 then Parx scored 83 percent and Hollywood 81 percent.
If Demand Stimulation Marketing is removed then MGM is still 100 but Hollywood then scores 83 percent and Parx 81 percent.
Source: Macomber International, Icn.
Relative to the ability of the Ancillary Facilities to foster the commercial success of the proposed gaming facility.
Category Weight Score Score Score
GOAL SET * 0% 0 n.a. 0 n.a. 0 n.a.
EXTERNAL-ITIES * 0% 0 n.a. 0 n.a. 0 n.a.
INTERNAL-ITIES * 0% 0 n.a. 0 n.a. 0 n.a.
PRODUCT MARKETING 50%
TIER 1
Casino ** 0% n.a. n.a. n.a. n.a. n.a. n.a.
Parking 18% 7 1.3 8 1.4 9 1.6
Food 30% 7 2.1 6 1.8 8 2.4
Beverage 25% 5 1.3 5 1.3 7 1.8
Hotel 15% 5 0.8 6 0.9 7 1.1
TIER 2
Entertainment 8% 6 0.5 6 0.5 7 0.6
Retail 2% 3 0.1 4 0.1 6 0.1
TIER 3 / OTHER
Other (cumulative) *** 1% 6 0.1 4 0.0 7 0.1
Meeting and Convention 1% 4 0.0 4 0.0 5 0.1
Subtotal - Product Marketing 100% 6.0 3.0 6.0 3.0 7.6 3.8
DEMAND STIMULATION
MARKETING 25%
Pre-opening 40% 6 2.4 7 2.8 8 3.2
Post opening 60% 6 3.6 7 4.2 8 4.8
100% 6.0 1.5 7.0 1.8 8.0 2.0
SUM OF THE PARTS 25% 7 1.8 7 1.8 8 2.0
TOTAL 100% 6.3 6.5 7.8
*** See body of report.
These ratings do not rate the real or perceived benefits to be generated by each Applicant.
PARXHOLLYWOOD / PENN
ResultResult
MGM
Result
RATING SCHEME
* Note: MI has intentionally omitted any comparison of each applicant's Goal Set, consideration of External-ities and Internal-ities, and certain big-picture strategic statements because MI found (or
speculates) that reference to these Marketing Plan elements were not explicitly requested in most instances by the MLC Submission process, each company may not 'think' about the development
process in these terms. But, perhaps most importantly, it is the tactics and execution that in the final analysis are most important and telling about the applicant's development, operating, and
marketing process.
** Note: The casino is not rated because MI's scope of responsibility for this engagement did not include a review of the gaming activities.
Evaluation – Subjective
MGM PARX HOLLYWOOD
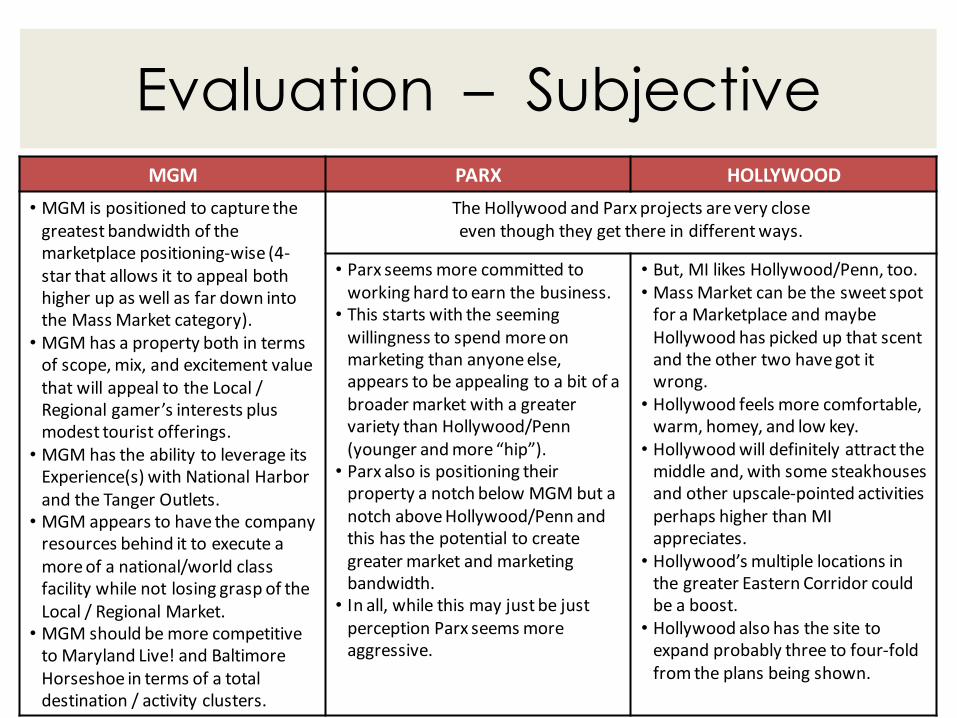
• MGM is positioned to capture the greatest bandwidth of the marketplace positioning-wise (4-star that allows it to appeal both higher up as well as far down into the Mass Market category).
• MGM has a property both in terms of scope, mix, and excitement value that will appeal to the Local / Regional gamer’s interests plus modest tourist offerings.
• MGM has the ability to leverage its Experience(s) with National Harbor and the Tanger Outlets.
• MGM appears to have the company resources behind it to execute a more of a national/world class facility while not losing grasp of the Local / Regional Market.
• MGM should be more competitive to Maryland Live! and Baltimore Horseshoe in terms of a total destination / activity clusters.
The Hollywood and Parx projects are very close even though they get there in different ways.
• Parx seems more committed to working hard to earn the business.
• This starts with the seeming willingness to spend more on marketing than anyone else, appears to be appealing to a bit of a broader market with a greater variety than Hollywood/Penn (younger and more “hip”).
• Parx also is positioning their property a notch below MGM but a notch above Hollywood/Penn and this has the potential to create greater market and marketing bandwidth.
• In all, while this may just be just perception Parx seems more aggressive.
• But, MI likes Hollywood/Penn, too.• Mass Market can be the sweet spot
for a Marketplace and maybe Hollywood has picked up that scent and the other two have got it wrong.
• Hollywood feels more comfortable, warm, homey, and low key.
• Hollywood will definitely attract the middle and, with some steakhouses and other upscale-pointed activities perhaps higher than MI appreciates.
• Hollywood’s multiple locations in the greater Eastern Corridor could be a boost.
• Hollywood also has the site to expand probably three to four-fold from the plans being shown.
Conclusion
Three good established, proven, andsuccessful casino operators.
Three good projects with a mix andprogramming of Ancillary Facilities that willserve Local and Regional gamers as well assome fair share of Tourists.
MI rejected none and believes all could workif the consideration for the sum of allfourteen Evaluation Criteria and thesubjective assessment of the MLC so dictate.
Thank you.Macomber International, Inc.
SUPPORT SLIDES TO MAIN PRESENTATION AND TO RESPOND TO
POTENTIAL POST PRESENTATION QUESTION-AND-ANSWER PERIOD.
APPENDIX
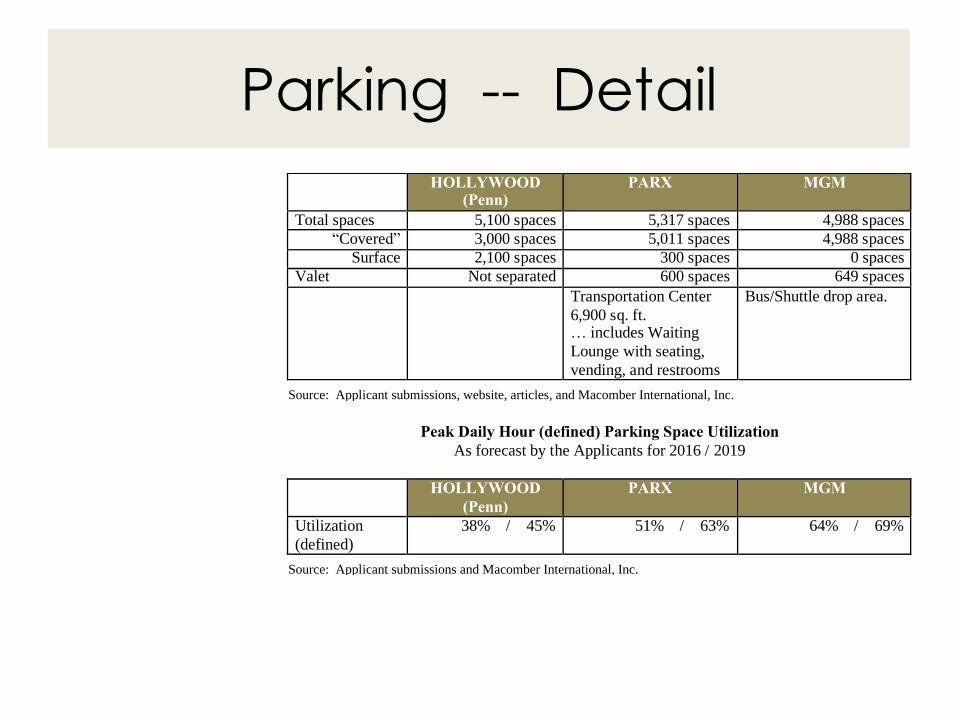
Parking -- Detail
HOLLYWOOD (Penn)
PARX MGM
Total spaces 5,100 spaces 5,317 spaces 4,988 spaces
“Covered” 3,000 spaces 5,011 spaces 4,988 spaces
Surface 2,100 spaces 300 spaces 0 spaces
Valet Not separated 600 spaces 649 spaces
Transportation Center
6,900 sq. ft. … includes Waiting
Lounge with seating,
vending, and restrooms
Bus/Shuttle drop area.
Source: Applicant submissions, website, articles, and Macomber International, Inc.
Peak Daily Hour (defined) Parking Space Utilization
As forecast by the Applicants for 2016 / 2019
HOLLYWOOD
(Penn)
PARX MGM
Utilization
(defined)
38% / 45% 51% / 63% 64% / 69%
Source: Applicant submissions and Macomber International, Inc.
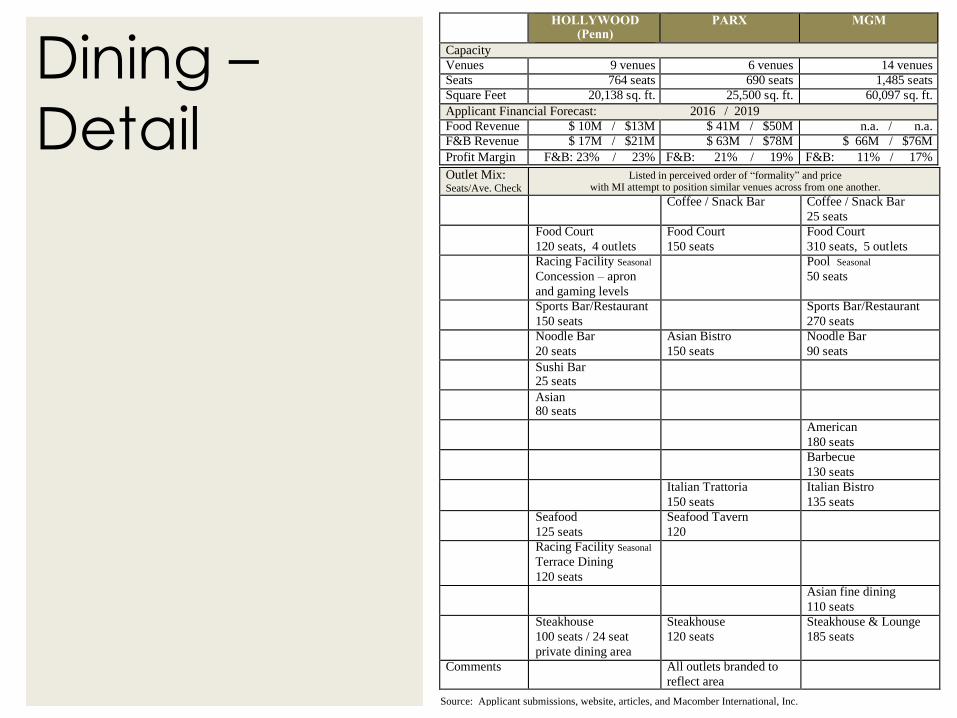
Dining –
Detail
HOLLYWOOD (Penn)
PARX MGM
Capacity
Venues 9 venues 6 venues 14 venues
Seats 764 seats 690 seats 1,485 seats
Square Feet 20,138 sq. ft. 25,500 sq. ft. 60,097 sq. ft.
Applicant Financial Forecast: 2016 / 2019
Food Revenue $ 10M / $13M $ 41M / $50M n.a. / n.a.
F&B Revenue $ 17M / $21M $ 63M / $78M $ 66M / $76M
Profit Margin F&B: 23% / 23% F&B: 21% / 19% F&B: 11% / 17%
Outlet Mix: Seats/Ave. Check
Listed in perceived order of “formality” and price with MI attempt to position similar venues across from one another.
Coffee / Snack Bar
Coffee / Snack Bar
25 seats
Food Court
120 seats, 4 outlets
Food Court
150 seats
Food Court
310 seats, 5 outlets
Racing Facility Seasonal
Concession – apron
and gaming levels
Pool Seasonal
50 seats
Sports Bar/Restaurant
150 seats
Sports Bar/Restaurant
270 seats
Noodle Bar
20 seats
Asian Bistro
150 seats
Noodle Bar
90 seats
Sushi Bar 25 seats
Asian 80 seats
American
180 seats
Barbecue
130 seats
Italian Trattoria
150 seats
Italian Bistro
135 seats
Seafood
125 seats
Seafood Tavern
120
Racing Facility Seasonal
Terrace Dining
120 seats
Asian fine dining
110 seats
Steakhouse
100 seats / 24 seat
private dining area
Steakhouse
120 seats
Steakhouse & Lounge
185 seats
Comments All outlets branded to
reflect area
Source: Applicant submissions, website, articles, and Macomber International, Inc.
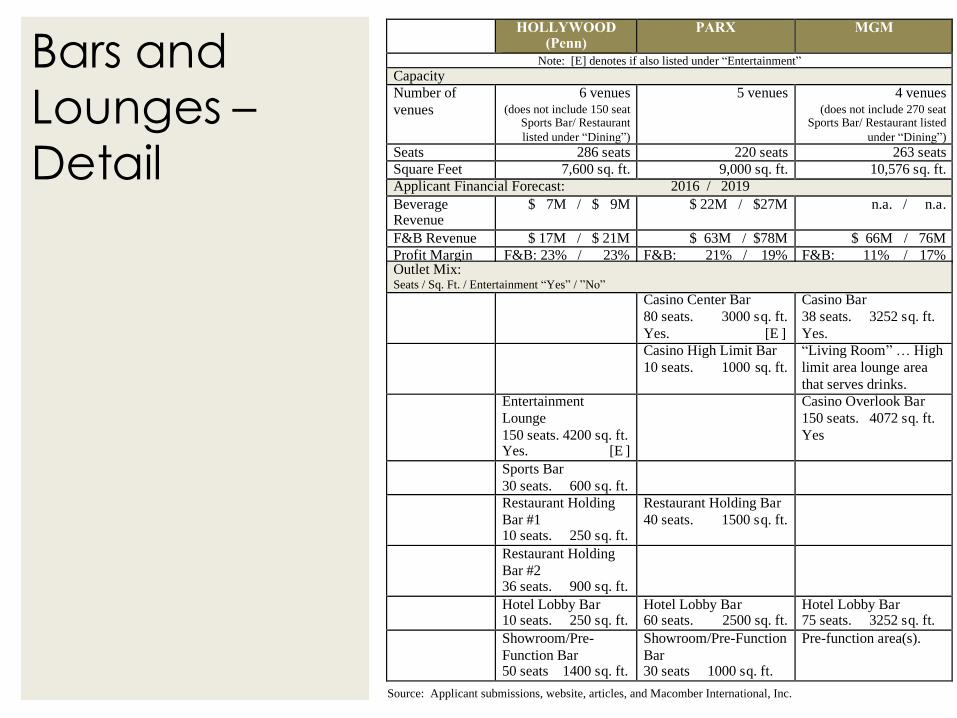
Bars and Lounges –Detail
HOLLYWOOD (Penn)
PARX MGM
Note: [E] denotes if also listed under “Entertainment”
Capacity
Number of
venues
6 venues (does not include 150 seat
Sports Bar/ Restaurant
listed under “Dining”)
5 venues 4 venues (does not include 270 seat
Sports Bar/ Restaurant listed
under “Dining”) Seats 286 seats 220 seats 263 seats
Square Feet 7,600 sq. ft. 9,000 sq. ft. 10,576 sq. ft.
Applicant Financial Forecast: 2016 / 2019
Beverage Revenue
$ 7M / $ 9M $ 22M / $27M n.a. / n.a.
F&B Revenue $ 17M / $ 21M $ 63M / $78M $ 66M / 76M
Profit Margin F&B: 23% / 23% F&B: 21% / 19% F&B: 11% / 17%
Outlet Mix: Seats / Sq. Ft. / Entertainment “Yes” / ”No” Casino Center Bar
80 seats. 3000 sq. ft.
Yes. [E ]
Casino Bar
38 seats. 3252 sq. ft.
Yes.
Casino High Limit Bar
10 seats. 1000 sq. ft.
“Living Room” … High
limit area lounge area
that serves drinks.
Entertainment
Lounge
150 seats. 4200 sq. ft. Yes. [E ]
Casino Overlook Bar
150 seats. 4072 sq. ft.
Yes
Sports Bar
30 seats. 600 sq. ft.
Restaurant Holding
Bar #1 10 seats. 250 sq. ft.
Restaurant Holding Bar
40 seats. 1500 sq. ft.
Restaurant Holding
Bar #2 36 seats. 900 sq. ft.
Hotel Lobby Bar 10 seats. 250 sq. ft.
Hotel Lobby Bar 60 seats. 2500 sq. ft.
Hotel Lobby Bar 75 seats. 3252 sq. ft.
Showroom/Pre-
Function Bar 50 seats 1400 sq. ft.
Showroom/Pre-Function
Bar 30 seats 1000 sq. ft.
Pre-function area(s).
Source: Applicant submissions, website, articles, and Macomber International, Inc.
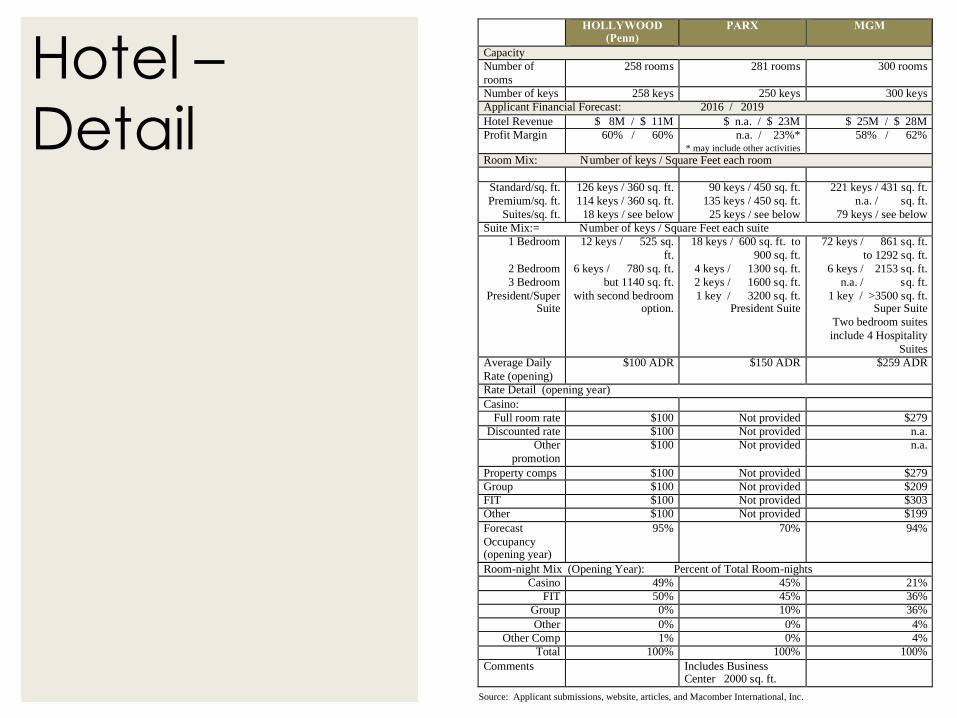
Hotel –
Detail
HOLLYWOOD (Penn)
PARX MGM
Capacity
Number of
rooms
258 rooms 281 rooms 300 rooms
Number of keys 258 keys 250 keys 300 keys
Applicant Financial Forecast: 2016 / 2019
Hotel Revenue $ 8M / $ 11M $ n.a. / $ 23M $ 25M / $ 28M
Profit Margin 60% / 60% n.a. / 23%* * may include other activities
58% / 62%
Room Mix: Number of keys / Square Feet each room
Standard/sq. ft.
Premium/sq. ft.
Suites/sq. ft.
126 keys / 360 sq. ft.
114 keys / 360 sq. ft.
18 keys / see below
90 keys / 450 sq. ft.
135 keys / 450 sq. ft.
25 keys / see below
221 keys / 431 sq. ft.
n.a. / sq. ft.
79 keys / see below
Suite Mix:= Number of keys / Square Feet each suite
1 Bedroom
2 Bedroom
3 Bedroom
President/Super Suite
12 keys / 525 sq.
ft.
6 keys / 780 sq. ft.
but 1140 sq. ft.
with second bedroom option.
18 keys / 600 sq. ft. to
900 sq. ft.
4 keys / 1300 sq. ft.
2 keys / 1600 sq. ft.
1 key / 3200 sq. ft. President Suite
72 keys / 861 sq. ft.
to 1292 sq. ft.
6 keys / 2153 sq. ft.
n.a. / sq. ft.
1 key / >3500 sq. ft. Super Suite
Two bedroom suites
include 4 Hospitality
Suites
Average Daily
Rate (opening)
$100 ADR $150 ADR $259 ADR
Rate Detail (opening year)
Casino:
Full room rate $100 Not provided $279
Discounted rate $100 Not provided n.a.
Other
promotion
$100 Not provided n.a.
Property comps $100 Not provided $279
Group $100 Not provided $209
FIT $100 Not provided $303
Other $100 Not provided $199
Forecast
Occupancy (opening year)
95% 70% 94%
Room-night Mix (Opening Year): Percent of Total Room-nights
Casino 49% 45% 21%
FIT 50% 45% 36%
Group 0% 10% 36%
Other 0% 0% 4%
Other Comp 1% 0% 4%
Total 100% 100% 100%
Comments Includes Business Center 2000 sq. ft.
Source: Applicant submissions, website, articles, and Macomber International, Inc.
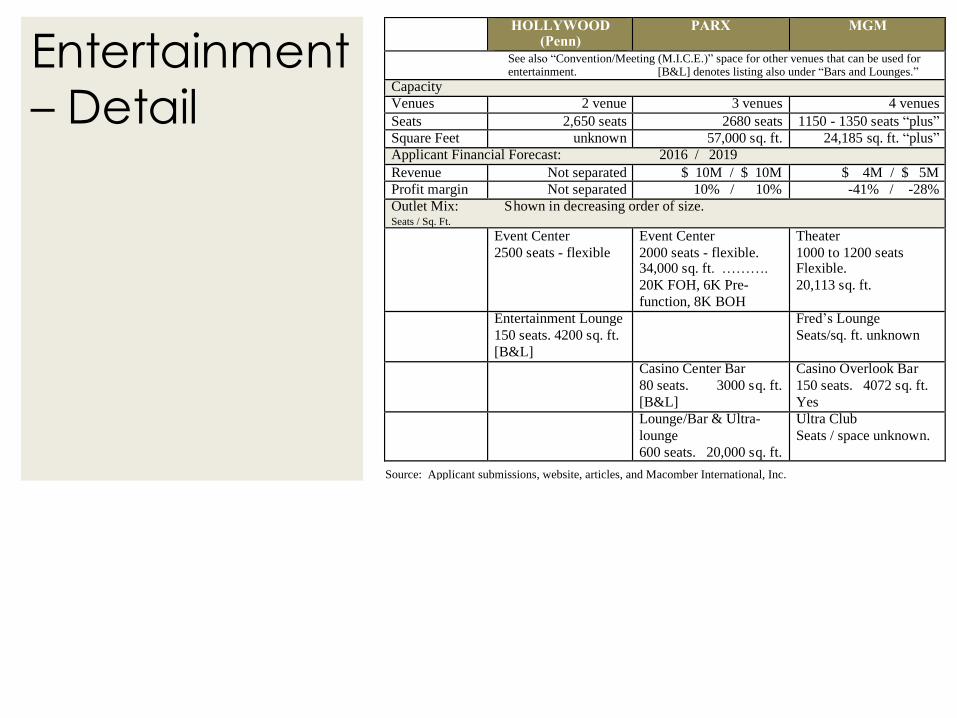
Entertainment – Detail
HOLLYWOOD (Penn)
PARX MGM
See also “Convention/Meeting (M.I.C.E.)” space for other venues that can be used for entertainment. [B&L] denotes listing also under “Bars and Lounges.”
Capacity
Venues 2 venue 3 venues 4 venues
Seats 2,650 seats 2680 seats 1150 - 1350 seats “plus”
Square Feet unknown 57,000 sq. ft. 24,185 sq. ft. “plus”
Applicant Financial Forecast: 2016 / 2019
Revenue Not separated $ 10M / $ 10M $ 4M / $ 5M
Profit margin Not separated 10% / 10% -41% / -28%
Outlet Mix: Shown in decreasing order of size. Seats / Sq. Ft. Event Center
2500 seats - flexible
Event Center
2000 seats - flexible. 34,000 sq. ft. ……….
20K FOH, 6K Pre-
function, 8K BOH
Theater
1000 to 1200 seats Flexible.
20,113 sq. ft.
Entertainment Lounge
150 seats. 4200 sq. ft.
[B&L]
Fred’s Lounge
Seats/sq. ft. unknown
Casino Center Bar
80 seats. 3000 sq. ft.
[B&L]
Casino Overlook Bar
150 seats. 4072 sq. ft.
Yes
Lounge/Bar & Ultra-
lounge
600 seats. 20,000 sq. ft.
Ultra Club
Seats / space unknown.
Source: Applicant submissions, website, articles, and Macomber International, Inc.
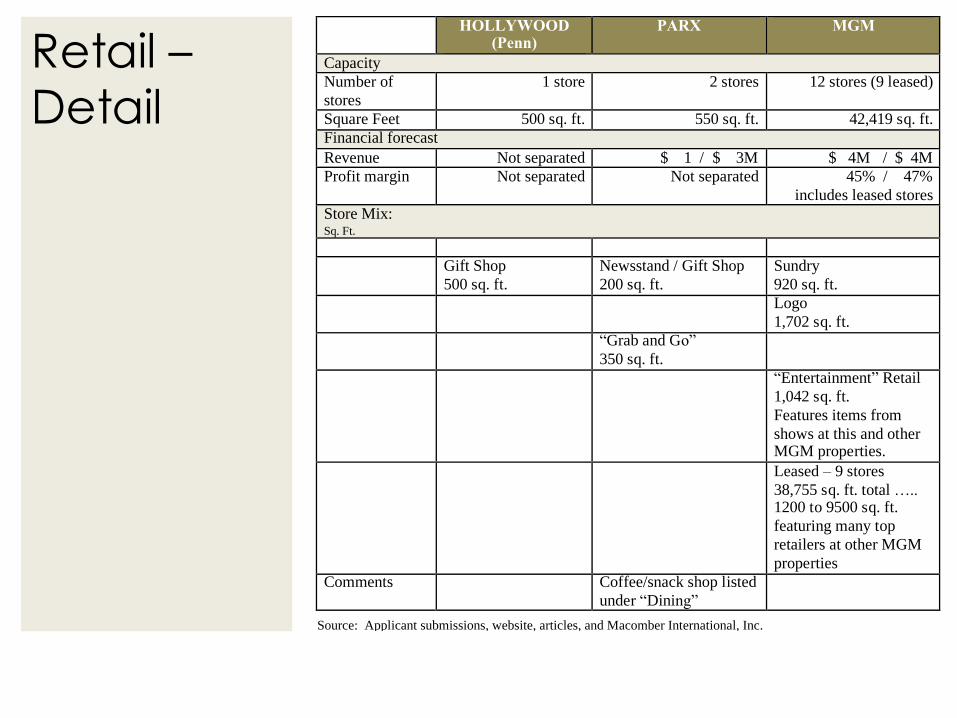
Retail –Detail
HOLLYWOOD (Penn)
PARX MGM
Capacity
Number of
stores
1 store 2 stores 12 stores (9 leased)
Square Feet 500 sq. ft. 550 sq. ft. 42,419 sq. ft.
Financial forecast
Revenue Not separated $ 1 / $ 3M $ 4M / $ 4M
Profit margin Not separated Not separated 45% / 47%
includes leased stores
Store Mix: Sq. Ft.
Gift Shop
500 sq. ft.
Newsstand / Gift Shop
200 sq. ft.
Sundry
920 sq. ft.
Logo
1,702 sq. ft.
“Grab and Go”
350 sq. ft.
“Entertainment” Retail
1,042 sq. ft.
Features items from
shows at this and other MGM properties.
Leased – 9 stores
38,755 sq. ft. total ….. 1200 to 9500 sq. ft.
featuring many top
retailers at other MGM
properties
Comments Coffee/snack shop listed
under “Dining”
Source: Applicant submissions, website, articles, and Macomber International, Inc.
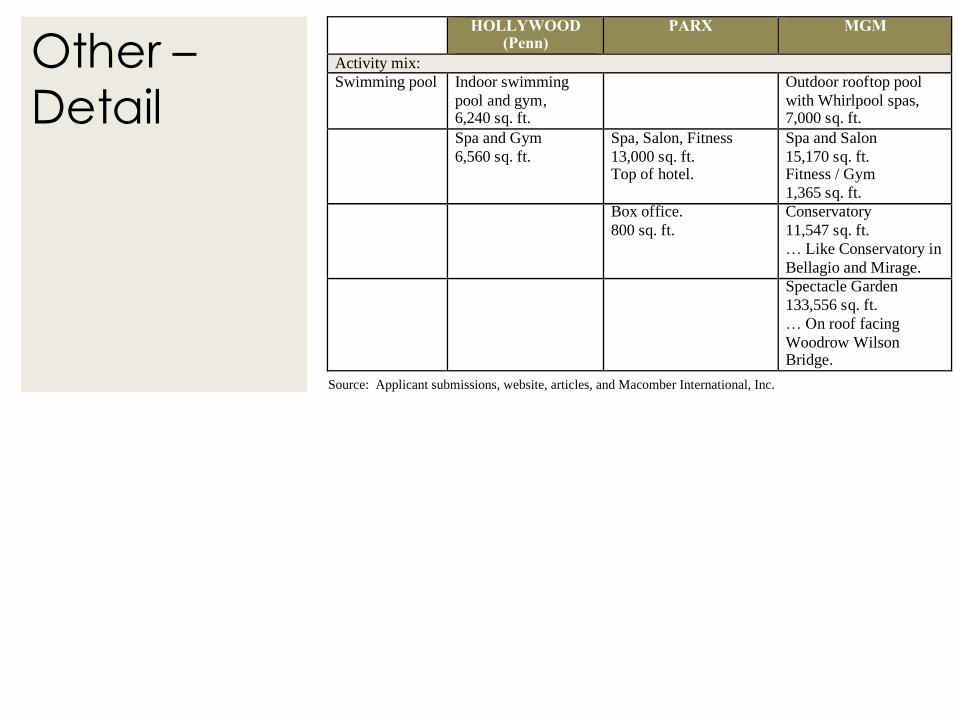
Other –Detail
HOLLYWOOD (Penn)
PARX MGM
Activity mix:
Swimming pool Indoor swimming
pool and gym, 6,240 sq. ft.
Outdoor rooftop pool
with Whirlpool spas, 7,000 sq. ft.
Spa and Gym
6,560 sq. ft.
Spa, Salon, Fitness
13,000 sq. ft. Top of hotel.
Spa and Salon
15,170 sq. ft. Fitness / Gym
1,365 sq. ft.
Box office.
800 sq. ft.
Conservatory
11,547 sq. ft.
… Like Conservatory in
Bellagio and Mirage.
Spectacle Garden
133,556 sq. ft.
… On roof facing
Woodrow Wilson Bridge.
Source: Applicant submissions, website, articles, and Macomber International, Inc.
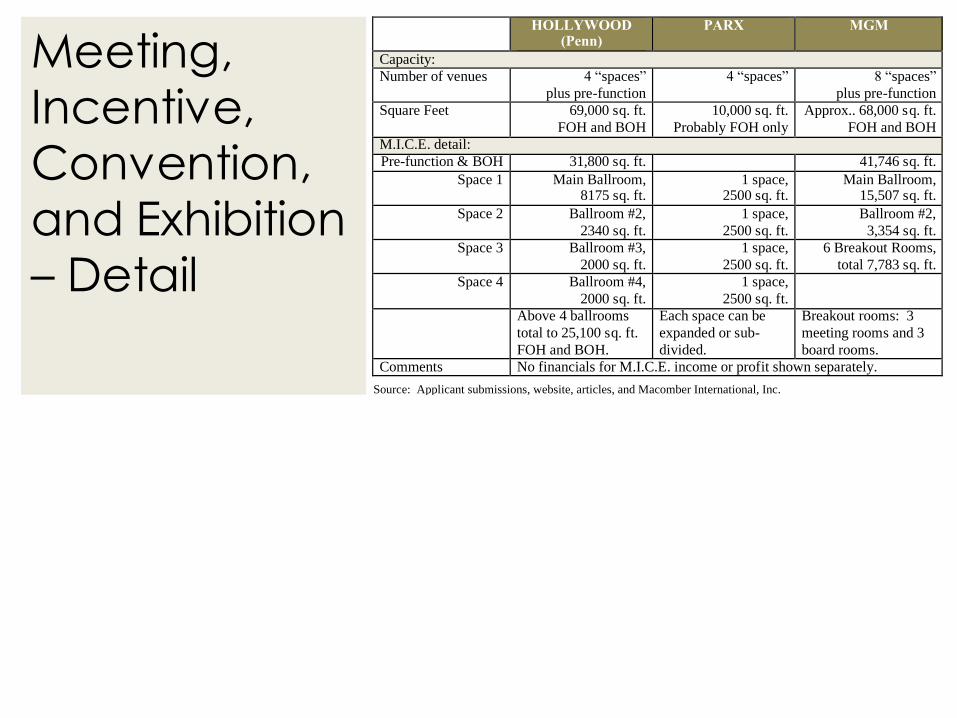
Meeting, Incentive, Convention, and Exhibition – Detail
HOLLYWOOD (Penn)
PARX MGM
Capacity:
Number of venues 4 “spaces”
plus pre-function
4 “spaces” 8 “spaces”
plus pre-function
Square Feet 69,000 sq. ft.
FOH and BOH
10,000 sq. ft.
Probably FOH only
Approx.. 68,000 sq. ft.
FOH and BOH
M.I.C.E. detail:
Pre-function & BOH 31,800 sq. ft. 41,746 sq. ft.
Space 1 Main Ballroom, 8175 sq. ft.
1 space, 2500 sq. ft.
Main Ballroom, 15,507 sq. ft.
Space 2 Ballroom #2,
2340 sq. ft.
1 space,
2500 sq. ft.
Ballroom #2,
3,354 sq. ft.
Space 3 Ballroom #3,
2000 sq. ft.
1 space,
2500 sq. ft.
6 Breakout Rooms,
total 7,783 sq. ft.
Space 4 Ballroom #4,
2000 sq. ft.
1 space,
2500 sq. ft.
Above 4 ballrooms
total to 25,100 sq. ft.
FOH and BOH.
Each space can be
expanded or sub-
divided.
Breakout rooms: 3
meeting rooms and 3
board rooms.
Comments No financials for M.I.C.E. income or profit shown separately.
Source: Applicant submissions, website, articles, and Macomber International, Inc.
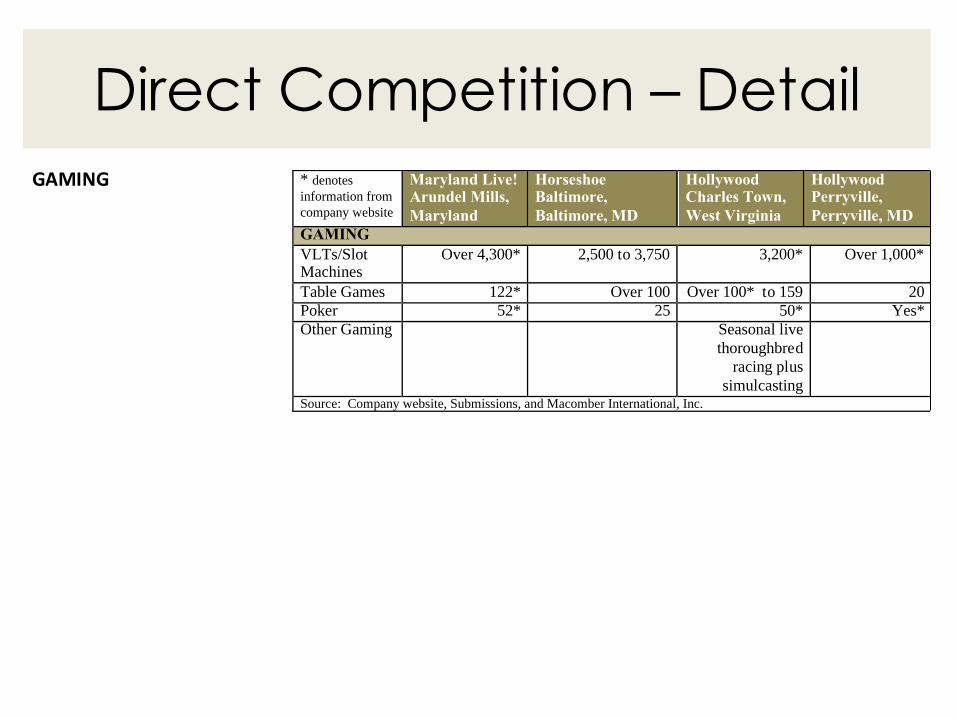
Direct Competition – Detail
GAMING * denotes
information from
company website
Maryland Live! Arundel Mills,
Maryland
Horseshoe Baltimore,
Baltimore, MD
Hollywood Charles Town,
West Virginia
Hollywood Perryville,
Perryville, MD
GAMING
VLTs/Slot Machines
Over 4,300* 2,500 to 3,750 3,200* Over 1,000*
Table Games 122* Over 100 Over 100* to 159 20
Poker 52* 25 50* Yes*
Other Gaming Seasonal live
thoroughbred
racing plus
simulcasting
Source: Company website, Submissions, and Macomber International, Inc.
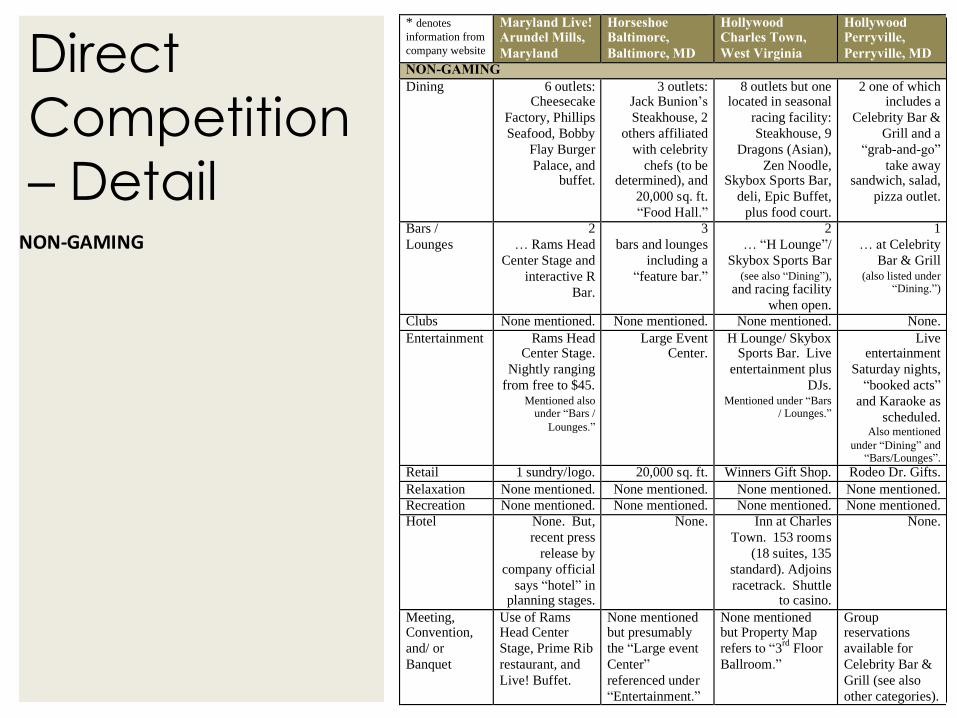
Direct
Competition
– DetailNON-GAMING
* denotes
information from
company website
Maryland Live! Arundel Mills,
Maryland
Horseshoe Baltimore,
Baltimore, MD
Hollywood Charles Town,
West Virginia
Hollywood Perryville,
Perryville, MD
NON-GAMING
Dining 6 outlets: Cheesecake
Factory, Phillips
Seafood, Bobby
Flay Burger
Palace, and buffet.
3 outlets: Jack Bunion’s
Steakhouse, 2
others affiliated
with celebrity
chefs (to be determined), and
20,000 sq. ft.
“Food Hall.”
8 outlets but one located in seasonal
racing facility:
Steakhouse, 9
Dragons (Asian),
Zen Noodle, Skybox Sports Bar,
deli, Epic Buffet,
plus food court.
2 one of which includes a
Celebrity Bar &
Grill and a
“grab-and-go”
take away sandwich, salad,
pizza outlet.
Bars /
Lounges
2
… Rams Head
Center Stage and
interactive R
Bar.
3
bars and lounges
including a
“feature bar.”
2
… “H Lounge”/
Skybox Sports Bar (see also “Dining”),
and racing facility
when open.
1
… at Celebrity
Bar & Grill (also listed under
“Dining.”)
Clubs None mentioned. None mentioned. None mentioned. None.
Entertainment Rams Head Center Stage.
Nightly ranging
from free to $45. Mentioned also
under “Bars /
Lounges.”
Large Event Center.
H Lounge/ Skybox Sports Bar. Live
entertainment plus
DJs. Mentioned under “Bars
/ Lounges.”
Live entertainment
Saturday nights,
“booked acts”
and Karaoke as
scheduled. Also mentioned
under “Dining” and “Bars/Lounges”.
Retail 1 sundry/logo. 20,000 sq. ft. Winners Gift Shop. Rodeo Dr. Gifts.
Relaxation None mentioned. None mentioned. None mentioned. None mentioned.
Recreation None mentioned. None mentioned. None mentioned. None mentioned.
Hotel None. But,
recent press
release by
company official
says “hotel” in planning stages.
None. Inn at Charles
Town. 153 rooms
(18 suites, 135
standard). Adjoins
racetrack. Shuttle to casino.
None.
Meeting, Convention,
and/ or
Banquet
Use of Rams Head Center
Stage, Prime Rib
restaurant, and
Live! Buffet.
None mentioned but presumably
the “Large event
Center”
referenced under
“Entertainment.”
None mentioned but Property Map
refers to “3rd
Floor
Ballroom.”
Group reservations
available for
Celebrity Bar &
Grill (see also
other categories).
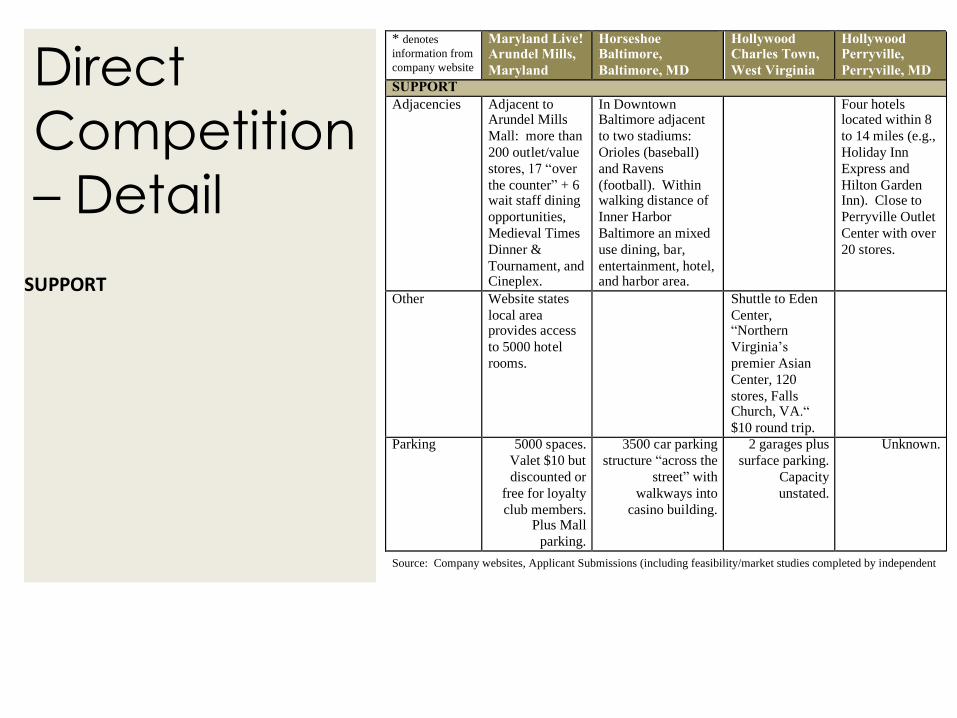
Direct
Competition
– Detail
SUPPORT
* denotes
information from
company website
Maryland Live! Arundel Mills,
Maryland
Horseshoe Baltimore,
Baltimore, MD
Hollywood Charles Town,
West Virginia
Hollywood Perryville,
Perryville, MD
SUPPORT
Adjacencies Adjacent to Arundel Mills
Mall: more than
200 outlet/value
stores, 17 “over
the counter” + 6 wait staff dining
opportunities,
Medieval Times
Dinner &
Tournament, and Cineplex.
In Downtown Baltimore adjacent
to two stadiums:
Orioles (baseball)
and Ravens
(football). Within walking distance of
Inner Harbor
Baltimore an mixed
use dining, bar,
entertainment, hotel, and harbor area.
Four hotels located within 8
to 14 miles (e.g.,
Holiday Inn
Express and
Hilton Garden Inn). Close to
Perryville Outlet
Center with over
20 stores.
Other Website states
local area provides access
to 5000 hotel
rooms.
Shuttle to Eden
Center, “Northern
Virginia’s
premier Asian
Center, 120
stores, Falls Church, VA.“
$10 round trip.
Parking 5000 spaces.
Valet $10 but
discounted or
free for loyalty
club members. Plus Mall
parking.
3500 car parking
structure “across the
street” with
walkways into
casino building.
2 garages plus
surface parking.
Capacity
unstated.
Unknown.
Source: Company websites, Applicant Submissions (including feasibility/market studies completed by independent
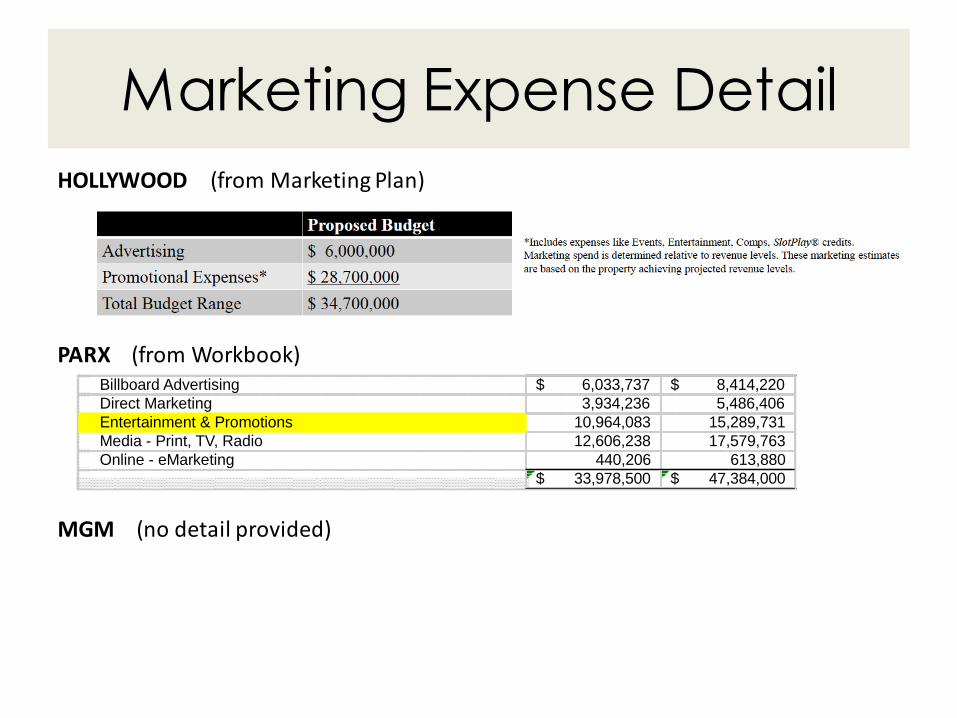
Marketing Expense Detail
Billboard Advertising 6,033,737$ 8,414,220$
Direct Marketing 3,934,236 5,486,406
Entertainment & Promotions 10,964,083 15,289,731
Media - Print, TV, Radio 12,606,238 17,579,763
Online - eMarketing 440,206 613,880
33,978,500$ 47,384,000$
HOLLYWOOD (from Marketing Plan)
PARX (from Workbook)
MGM (no detail provided)