Review of Sulphur Limits in Petrol - Department of the ... · Review of Sulphur Limits in Petrol...
144
Orbital Australia Pty Ltd Page 1 Issue 1 Review of Sulphur Limits in Petrol Produced for Fuel Policy Section Department of Sustainability, Environment, Water, Population and Communities By Orbital Australia Pty Ltd June 10 th 2013
Transcript of Review of Sulphur Limits in Petrol - Department of the ... · Review of Sulphur Limits in Petrol...
Orbital Australia Pty Ltd Page 1 Issue 1
Review of Sulphur Limits in Petrol
Produced for
Fuel Policy Section Department of Sustainability,
Environment, Water, Population and Communities
By
Orbital Australia Pty Ltd
June 10th 2013

Orbital Australia Pty Ltd Page 2 Issue 1
Orbital Australia Pty Ltd Page 3 Issue 1
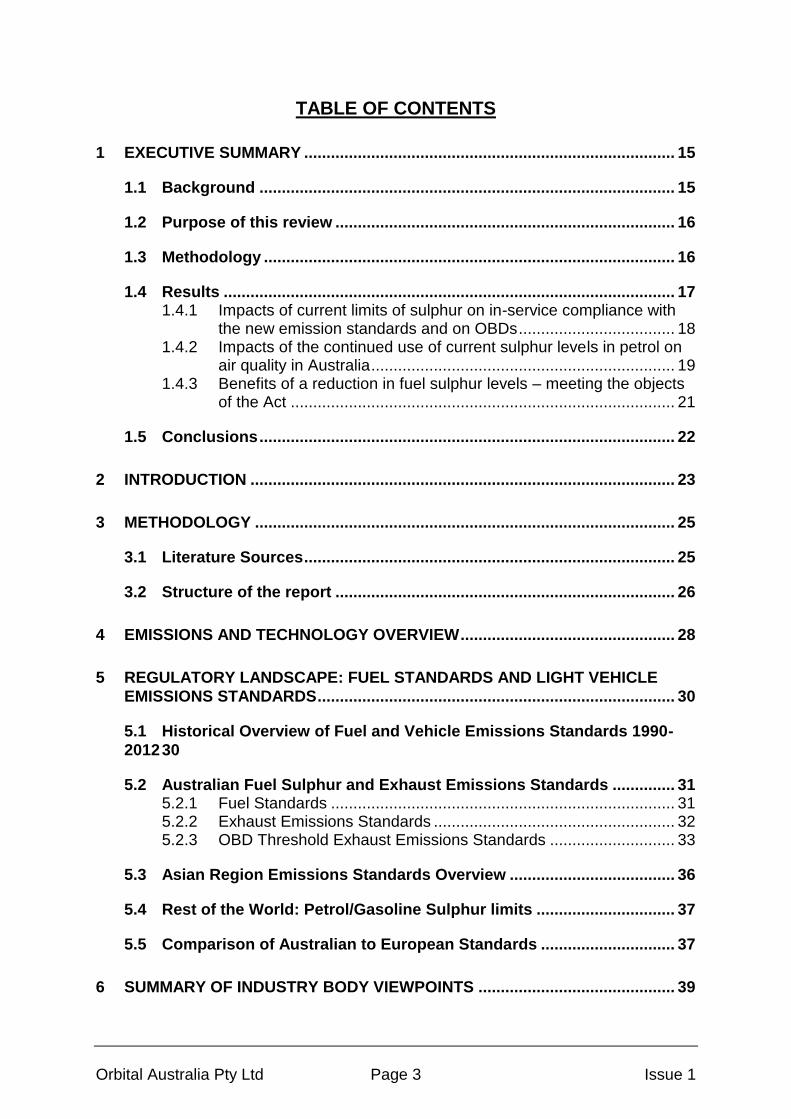
TABLE OF CONTENTS
1 EXECUTIVE SUMMARY ................................................................................... 15
1.1 Background ............................................................................................. 15
1.2 Purpose of this review ............................................................................ 16
1.3 Methodology ............................................................................................ 16
1.4 Results ..................................................................................................... 17
1.4.1 Impacts of current limits of sulphur on in-service compliance with the new emission standards and on OBDs ................................... 18
1.4.2 Impacts of the continued use of current sulphur levels in petrol on air quality in Australia .................................................................... 19
1.4.3 Benefits of a reduction in fuel sulphur levels – meeting the objects of the Act ...................................................................................... 21
1.5 Conclusions ............................................................................................. 22
2 INTRODUCTION ............................................................................................... 23
3 METHODOLOGY .............................................................................................. 25
3.1 Literature Sources ................................................................................... 25
3.2 Structure of the report ............................................................................ 26
4 EMISSIONS AND TECHNOLOGY OVERVIEW ................................................ 28
5 REGULATORY LANDSCAPE: FUEL STANDARDS AND LIGHT VEHICLE
EMISSIONS STANDARDS ................................................................................ 30
5.1 Historical Overview of Fuel and Vehicle Emissions Standards 1990-
2012 30
5.2 Australian Fuel Sulphur and Exhaust Emissions Standards .............. 31
5.2.1 Fuel Standards ............................................................................. 31 5.2.2 Exhaust Emissions Standards ...................................................... 32 5.2.3 OBD Threshold Exhaust Emissions Standards ............................ 33
5.3 Asian Region Emissions Standards Overview ..................................... 36
5.4 Rest of the World: Petrol/Gasoline Sulphur limits ............................... 37
5.5 Comparison of Australian to European Standards .............................. 37
6 SUMMARY OF INDUSTRY BODY VIEWPOINTS ............................................ 39

Orbital Australia Pty Ltd Page 4 Issue 1
6.1 Automotive Sector ................................................................................... 39
6.1.1 World-Wide Fuel Charter .............................................................. 39 6.1.2 Other Automotive OEM Viewpoints .............................................. 40
6.2 Fuels Sector ............................................................................................. 41 6.2.1 Martec Study ................................................................................. 41 6.2.2 Other Fuel Sector Viewpoints ....................................................... 42
6.3 Comparison of Industry Sector Views ................................................... 43
7 LITERATURE REVIEW – IMPACTS OF FUEL SULPHUR ............................... 44
7.1 Regulated Tailpipe Emissions ................................................................ 44 7.1.1 SAE 912323: Effects of Gasoline Sulphur Level on Mass Exhaust
Emissions ..................................................................................... 44
7.1.2 SAE 920558: Fuel Sulphur Effects on Automotive Catalyst Performance ................................................................................. 47
7.1.3 SAE 952421: An Evaluation of the Long Term Effects of Gasoline Sulphur Level on Three-Way Catalyst Activity .............................. 49
7.1.4 SAE 982726: Effect of Fuel Sulphur on Emissions in California Low Emissions Vehicles ....................................................................... 53
7.1.5 CRC E-60 2003: The effect of fuel sulphur on NH3 and other emissions from 2000-2001 MY vehicles ....................................... 56
7.1.6 SAE 2005-01-1113: The Impact of Sulphur Poisoning on NOx-Storage Catalysts in Gasoline Applications .................................. 59
7.1.7 Concawe 5/03 2003: Fuel effects on Emissions from Modern Gasoline Vehicles part 1 Sulphur Effects ..................................... 60
7.1.8 SAE 2006-01-3370: Impact of Fuel Sulphur on Gasoline and Diesel Vehicle Emissions ......................................................................... 65
7.1.9 CRC Report E84: Review of Prior Studies of Fuel Effects of Vehicle Emissions ..................................................................................... 65
7.1.10 SAE 2011-01-0300: Effects of fuel sulphur on FTP NOx emissions from a PZEV 4 cylinder application ............................................... 65
7.1.11 Environ 2010: Literature Review to Examine the Effect of Selected Fuel Quality Parameters on Vehicle Emissions ............................ 66
7.1.12 US EPA Mobile6: Modelling of Sulphur Effects on Emissions ...... 66 7.1.13 Literature Summary – Regulated Tailpipe Emissions ................... 68
7.2 Catalyst Performance and Reversibility of Fuel Sulphur Effects ........ 70
7.2.1 Catalyst Ageing on High Sulphur Fuel verses Accelerated Ageing ...................................................................................................... 70
7.2.2 TWC Wash Coat Formulation....................................................... 71 7.2.3 Reversibility of Fuel Sulphur Effects ............................................. 73
7.2.3.1 Reversibility Due to a Reduction in Fuel Sulphur Level . 73
7.2.3.2 Reversibility Due to Temperature, Richness and Drive Cycle .............................................................................. 74
7.2.4 Summary – Catalyst Performance and Reversibility ..................... 80
7.3 Particulate Matter Emissions ................................................................. 81
7.4 Fuel Consumption and Greenhouse Gas Emissions ........................... 84
Orbital Australia Pty Ltd Page 5 Issue 1
7.5 On-Board Diagnostics (Catalyst Monitoring) ........................................ 85
7.5.1 Available Literature ....................................................................... 85 7.5.2 Literature Summary – Catalyst Monitoring .................................... 88
7.6 Exhaust Oxygen Sensor ......................................................................... 88
8 ASSESSMENT OF THE AUSTRALIAN SITUATION ........................................ 90
8.1 Regulated Tailpipe Emissions ................................................................ 90
8.2 On-Board Diagnostic Systems ............................................................... 97
8.3 Look Ahead for Alternative Engine Technology ................................. 101 8.3.1 Lean Burn GDI Systems ............................................................. 103 8.3.2 Homogeneous GDI+TWC with/without Downsizing and Boosting
.................................................................................................... 104 8.3.3 Homogeneous Charge Compression Ignition (HCCI) ................. 104
8.4 Impacts of Fuel Sulphur on In-service Compliance with Euro 3 ....... 105
8.5 Impacts of Fuel Sulphur on In-service Compliance to Euro 5/6 ........ 106
8.6 Impacts of Fuel Sulphur on Real World Air Quality ............................ 106
8.7 Operability of Vehicles Imported into Australia .................................. 107
9 SATISFYING THE OBJECTS OF THE FUEL QUALITY STANDARDS ACT
2000 (THE ACT) .............................................................................................. 109
10 KNOWLEDGE GAPS ...................................................................................... 112
11 RECOMMENDATIONS FOR FUTURE TEST PROGRAMS ........................... 114
12 CONCLUSIONS .............................................................................................. 115
13 REFERENCES ................................................................................................ 118
APPENDIX A - EMISSIONS AND TECHNOLOGY OVERVIEW ........................... 123
1 VEHICLE EMISSIONS CONTROL .................................................................. 123
2 EXHAUST AFTERTREATMENT SYSTEMS ................................................... 124
2.1 Three-Way Catalysts ............................................................................. 125
2.2 NOx Storage Reduction Catalysts (Lean NOx Traps)......................... 126
2.3 Control of Exhaust Gas Air-Fuel Ratio ................................................ 127
Orbital Australia Pty Ltd Page 6 Issue 1
2.4 Fuel Sulphur Effect on Catalysts ......................................................... 128
3 ADVANCED ENGINE TECHNOLOGIES ........................................................ 130
3.1 Lean Burn GDI Systems ........................................................................ 131
3.2 Homogeneous GDI +TWC with/without Downsizing and Boosting .. 132
3.3 Homogeneous Charge Compression Ignition (HCCI) ........................ 132
4 LIGHT-DUTY VEHICLE DRIVE CYCLES ....................................................... 133
APPENDIX B – EUROPEAN AND US FUEL AND EMISSIONS STANDARDS .... 137
1 EUROPEAN FUEL (SULPHUR) AND EXHAUST EMISSIONS STANDARDS 137
1.1 Fuel Standards ...................................................................................... 137
1.2 Euro 4 Exhaust Emissions Standards ................................................. 137
1.3 Euro 5 Exhaust Emissions Standards ................................................. 138
1.4 Euro 6 Exhaust Emissions Standards ................................................. 139
2 UNITED STATES FUEL (SULPHUR) AND EXHAUST EMISSIONS
STANDARDS ................................................................................................... 139
2.1 Federal Fuel Standards ......................................................................... 139
2.2 Californian Fuel Standards ................................................................... 140
2.3 Tier II Federal US EPA Exhaust Emissions Standards ...................... 140
APPENDIX C - CERTIFICATION FUEL SPECIFICATION .................................... 142
ADR 79/02 Certification Fuel Specification .................................................. 142
ADRs 79/03 and 79/04 Certification Fuel Specification .............................. 143
Orbital Australia Pty Ltd Page 7 Issue 1
ACRONYMS
AAMA American Automobile Manufacturers Association
ACEA European Automobile Manufacturing Association
ADR Australian Design Rule
ADR79/xx Either ADR79/04 or ADR79/05 or ADR79/06
AFR Air-Fuel Ratio
AIMA Association of International Automobile Manufacturers
API American Petroleum Institute
AQIRP Auto/Oil Air Quality Improvement Research Program
CAI-Asia Clean Air Initiative for Asian Cities
CARB California Air Resources Board
CaRFG Californian Reformulated Gasoline
CATARC China Automotive Technology and Research Centre
CFR Code of Federal Regulations
CH4 methane
CO carbon monoxide
COS carbonyl sulphide
CPC Condensation Particle Counter
CRC Coordinating Research Council
CUEDC Composite Urban Emissions Drive Cycle
CVS Constant Volume Sampler
DI Direct Injection
DPF Diesel Particulate Filter
EC European Commission
ECD Emissions Chassis Dynamometer
ECE Economic Commission of Europe
ECM Engine Control Module
EGO Exhaust Gas Oxygen [Sensor]
EGR Exhaust Gas Recirculation
ELPI Electrical Low Pressure Impactor
EMS Engine Management System
E-OBD European – On-board Diagnostics
EPA Environmental Protection Agency, generally referring to the US
EPEFE European Programme on Emissions, Fuels and Engine Technologies
EU European Union
Euro 4, 5, 6 European vehicle emissions standard
EUDC Extra Urban Driving Cycle
FC Fuel Consumption
FCAI Federal Chamber of Automotive Industries
FTP Federal Test Procedure, US emissions code
GDI Gasoline Direct Injection
GHG greenhouse gases
GM General Motors
g/mi gram per mile
g/km gram per kilometre
H2S hydrogen sulphide
HC hydrocarbons
Orbital Australia Pty Ltd Page 8 Issue 1
HCCI Homogeneous Charge Compression Ignition
HCHO formaldehyde
HLDT Heavy Light-Duty Truck
ICCT International Council on Clean Transportation
IPCC Intergovernmental Panel on Climate Change
LA4 US EPA city drive cycle test LCV Light Commercial Vehicle (Ute, Van, etc)
LDV Light-Duty Vehicles
LEV Low Emissions Vehicle
LLDT Light Light-Duty Trucks
LNT Lean NOx Trap
MDPV Medium-Duty Passenger Vehicle
MECA Manufacturers of Emissions Controls Association
MIL Malfunction Indicator Lamp MPI Multi-Point fuel Injection MY Model Year N2O nitrous oxide NEDC New European Driving Cycle NH3 ammonia NGK NGK Spark Plug Co Ltd
NISE2 Second National In-Service Emission Study NIMEP Net Indicated Mean Effective Pressure NMHC non methane hydrocarbons NMOG non methane organic gases
NOx oxides of nitrogen (consisting of NO2 and NO)
NSR NOx Storage and Reduction catalyst, also may be called an LNT
O2 oxygen
OBD On-board Diagnostics
OEM Original Equipment Manufacturer
Pd palladium
Petrol CUEDC CUEDC for Light-Duty Petrol fuelled vehicles
PM Particulate Mass
PM1 Particulate Mass with diameter less than 1 micrometer (μm)
PM2.5 Particulate Mass with diameter less than 2.5 micrometer (μm)
PM10 Particulate Mass with diameter less than 10 micrometer (μm)
PN Particle Number
ppm parts per million
Pt platinum
PULP Premium Unleaded Petrol
PZEV Partial Zero Emissions Vehicle
Rh rhodium
RIS Regulation Impact Statement
RFG Reformulated Gasoline
SAE Society of Automotive Engineers
SCR Selective Catalytic Reduction
SEWPaC Department of Sustainability, Environment, Water, Population and Communities
SO2 sulphur dioxide

Orbital Australia Pty Ltd Page 9 Issue 1
SULEV Super Ultra Low Emissions Vehicle
SUV Sport Utility Vehicle
THC Total HydroCarbons (NMHC+CH4)
TLEV Transitional Low Emissions Vehicle
TWC Three-Way Catalyst
ULEV Ultra Low Emissions Vehicle ULP Unleaded Petrol US United States US06 Supplemental Federal Test Procedure (US) VVT Variable Valve Technology
WOT Wide Open Throttle
Orbital Australia Pty Ltd Page 10 Issue 1
DEFINITIONS
AFR FuelAirAFR The air is the actual air drawn into the engine and the fuel
is the actual fuel used by the engine; sometimes referred to as the actual AFR.
Blow-by the leakage of gases from the combustion cylinder of an internal combustion engine between the piston and cylinder wall into the crankcase.
Bagged the sampling technique whereby a proportion of the total dilute exhaust sample is collected in a “bag” for subsequent measurement. Bag sampling usually measures the emissions for a complete phase of the test and represents the ensemble average. The bagging process requires specialised sampling equipment and this makes the process expensive compared to obtaining the result by integration of the second by second (modal) data. The emissions total may be divided by the total distance travelled during the test to produce a g/km result. Bagged sampling is used by certification test procedures such as ADR79/01.
Brake-specific
rate of emissions divided by the power consumption.
Catalyst Monitoring
process by which the oxygen storage capacity of the catalyst is inferred using the signals from the lambda sensor.
Close-coupled
refers to catalysts located close to the exhaust valves.
Closed-Loop describes a control system that adjusts its output to correct for any measured errors. In the case of an engine control system, the term typically refers to the adjustment of fuelling based on feedback from an exhaust oxygen sensor.
Desulphurisation the process of sulphur removal from a catalyst due to operation of the catalyst at elevated temperatures and favourable exhaust air-fuel ratio.
Indolene a US certification reference fuel containing very low sulphur levels.
In-field the operation of a vehicle in the real world.
In-service In-service compliance refers to the ability of a vehicle to demonstrate compliance with the emission standards when tested by the manufacturer on the prescribed test fuel
Knocking an undesirable phenomenon caused by the uncontrolled combustion of a flammable mixture in the engine.
Lambda lRatiotricAirfueStoichiome
uelRatioActualAirfLambda Lambda is the normalised AFR, also shown
by the symbol λ.

Orbital Australia Pty Ltd Page 11 Issue 1
Stoichiometric air-fuel ratio is the chemically correct or theoretical air to fuel ratio which provides the minimum amount of oxygen for the conversion of all the fuel into completely oxidised (combusted) products.
Lambda=1 when the air to fuel ratio is chemically ideal; Lambda>1 is lean (excess air); Lambda<1 is rich (excess fuel).
Lean describes an engine running with a high AFR (lambda greater than unity): less fuel is available than is ideal to burn well in a given quantity of air. Enleanment means “becoming lean".
Light-off the term used to describe the transition of initial catalyst or aftertreatment system activity between the period when the there is no activity to when there is significant conversion of the engine out emissions. The transition is typically related to exceeding 50% conversion efficiency on the catalyst and can be enabled by an exothermic reaction of exhaust gases on the catalyst.
Modal the sampling of pollutants on, typically, a second-by-second basis. Modal data allows for the examination of effects due to individual drive events and drive cycle transients to be examined.
OBD factor the difference between the legislated tailpipe emissions threshold and the OBD emission threshold. OBD refers to on-board diagnostics with respect to catalyst monitoring.
Octane the measure of the ability of fuel to refrain from knocking.
Open Loop describes a “blind” control system that is unable to compensate for any measured errors. In the case of an engine control system, the term typically refers to a system which is unable to adjust fuelling based on feedback from an exhaust oxygen sensor as it is not equipped with such technology.
Phase describes a defined segment of an exhaust emissions test. Usually the results for each phase of a test are bagged individually allowing for examination or weightings for individual phases to be applied. Such is the case with ADR37.
Pre-Conditioning drive
describes the drive cycle undertaken by the vehicle prior to the emissions test and is typically described by the test’s protocol or standard. Typically, the vehicle is tested over the same drive cycle as the actual emissions test but emissions are not sampled; the purpose is to establish a known stabilised condition prior to the actual emissions test. Once the vehicle is pre-conditioned it is left to cool down to ambient conditions for a pre-determined time.
Raw describes where the emissions sample from the exhaust of the vehicle is measured without dilution. The pollutant concentration is based on the instantaneous exhaust flow rate and so mass based emissions can only be made if this flow is known, measured or inferred. The pollutant concentration in a raw sample is higher than that in a dilute sample.
Orbital Australia Pty Ltd Page 12 Issue 1
Rich describes an engine running with a low AFR (lambda less than unity): more fuel is available than is ideal to burn well in a given quantity of air. Enrichment means “becoming rich".
RON rating for the quality of a particular petrol mixture as a fuel for the internal combustion engine. Octane is a measure of petrol’s ability to resist auto-ignition that can cause an engine to knock.
Soak describes the period after a pre-conditioning drive during which a vehicle is left switched off, to acclimatise before the next step of the test sequence.
Stop/start when the engine is switched off automatically when the vehicle comes to a halt in order to gain a fuel economy benefit
Wash coat carrier for the catalytic materials (precious metals) and is used to disperse the materials over a high surface area.
Orbital Australia Pty Ltd Page 13 Issue 1
Acknowledgements
The authors and project staff at the Department of Sustainability, Environment, Water, Population and Communities (SEWPaC) would like to thank the following for their contributions to this report (in alphabetical order):
Australian Institute of Petroleum Ltd BP Australia Department of Infrastructure and Transport Federal Chamber of Automotive Industries Ford Australia GM Holden Ltd Hyundai Motor Company Australia Mitsubishi Motors Australia Limited Mercedes-Benz Australia/Pacific Pty Ltd Mobil Oil Australia Pty Ltd (an ExxonMobil subsidiary) Toyota Australia Members of the Fuel Standards Consultative Committee

Orbital Australia Pty Ltd Page 14 Issue 1

Orbital Australia Pty Ltd Page 15 Issue 1
1 EXECUTIVE SUMMARY
1.1 Background
The quality of fuel supplied in Australia is regulated under the Fuel Quality Standards Act 2000 (the Act)
i. Fuel standards are developed under the Act to
reduce air pollution either directly or through enabling better vehicle engine and emission control technologies. Reduced emissions from fuel and vehicles can reduce adverse impacts on human health and the environment. The Fuel Standard (Petrol) Determination 2001 (the petrol standard) regulates the quality of petrol in Australia.
Fuel standards work in partnership with vehicle emission standards to reduce emissions, however, changes to fuel standards have always been set subject to Australian conditions. Fuel standards are reviewed as required to support vehicle emission standards, which are national standards (known as Australian Design Rules or ADRs) made under the Motor Vehicle Standards Act 1989
ii. ADRs are
typically harmonised with vehicle emission standards developed by the United Nations Economic Commission for Europe; ‘Euro 2’, ‘Euro 3’ and ‘Euro 4’ are common terms used to describe the progressively more stringent versions of the European vehicle emission standards.
Australia will phase in the European Euro 5 and Euro 6 light vehicle emission standards from 1 November 2013 under ADRs 79/03 (Euro 5 - core), 79/04 (Euro 5 - full) and 79/05 (Euro 6). Key emission requirements for new petrol passenger cars include reduced exhaust emission limits for oxides of nitrogen (NOx) (reduced to 0.06 g/km from 0.08 g/km in Euro 4), the introduction of particulate matter (PM) mass limits for vehicles with direct injection engines, progressive enhancements to on-board diagnostic (OBD) requirements, and longer durability requirements for emission control systems (increased to 160,000 km from 100,000 km in Euro 4). The petrol emission limits do not change from Euro 5 to Euro 6 except for the introduction of the PM limits (ADR 79/04) and the OBD enhancements (ADR 79/05). ADR 79/03 commences for new model design vehicles on 1 November 2013 and ADR 79/04 for existing models on 1 November 2016. ADR 79/05 is due to commence for new model design vehicles on 1 July 2017 and for existing models on 1 July 2018, once it has been formally determined pending amendments being made to the European Euro 6 standard.
The reference fuel prescribed for testing vehicles to the Euro 5 and Euro 6 emission limits specifies 10 parts per million (ppm) sulphur
iii. The Australian petrol standard
currently limits the maximum sulphur level to 150 ppm and 50 ppm in regular unleaded (ULP) and premium unleaded (PULP) petrol, respectively. The Regulation Impact Statement
iv which examined the costs and benefits of implementing ADRs
79/03, 79/04 and 79/05 identified sulphur in petrol as the only fuel quality parameter that may impact the adoption of vehicle technology required to meet the new
i Administered by the Australian Government Department of Sustainability, Environment, Water, Population and Communities. ii Administered by the Australian Government Department of Infrastructure and Transport.
iii Sulphur spelling has been aligned with the ADR’s although the element is spelled sulfur.
iv Final Regulation Impact Statement for Review of Euro 5/6 Light Vehicle Emissions Standards.
November 2010. Department of Infrastructure and Transport.

Orbital Australia Pty Ltd Page 16 Issue 1
emission standards, due to its effects on the durability and longevity of emission control systems (such as catalysts) in petrol vehicles.
1.2 Purpose of this review
In considering if there is a requirement to amend the current sulphur limits in the petrol standard to support the new emission standards, this review was commissioned by the Department of Sustainability, Environment, Water, Population and Communities (SEWPaC) to collate currently available technical literature and assess:
the potential impact of 150 ppm and 50 ppm sulphur limits in petrol supplied
in Australia on vehicles’ in-service compliance with the new emission
standards (including the impacts of current sulphur limits on the emission
control technologies used or likely to be used in Australia for meeting the new
emission standards)
air quality impacts from these emission control technologies operating on
petrol containing 150 ppm or 50 ppm sulphur
whether a reduction in sulphur limits in petrol from current limits would best
meet the objects of the Act, namely to:
o reduce the level of pollutants and emissions arising from the use of
fuel that may cause environmental and health problems
o facilitate the adoption of better engine technology and emission control
technology; and
o allow the more effective operation of engines.
This review is intended to be used as part of the information base to assist any review of the petrol standard, with respect to amending (reducing) sulphur limits. Whether the current sulphur limits need to be reduced depends on what level sulphur needs to be to assure proper operation of vehicle systems (‘enablement’), what additional benefits in emissions would accrue if fuel sulphur levels were reduced (‘enhancement’), and whether the assessed outcome is appropriate for the Australian context. An analysis of the costs and benefits of any shift in the current sulphur limits in the petrol standard is outside the scope of this review.
1.3 Methodology
This review has evaluated an extensive amount of technical literature, much of which details studies undertaken more than 10 years ago when both the European and United States (US) regulators were evaluating the policy drivers for lowering fuel sulphur levels. Older literature focused on the performance of conventional three-way catalyst (TWC) equipped vehicles. More recent literature considered challenges associated with the performance of lean-burn gasoline direct injection (GDI) systems that require a lean NOx or NOx storage reduction (NSR) catalyst, and for which there is general consensus that ultra-low (less than 10 ppm) fuel sulphur is necessary. Further literature and information was sourced from technical experts in the fuels and vehicle manufacturing sectors (see Acknowledgements).

Orbital Australia Pty Ltd Page 17 Issue 1
Key issues that were considered necessary for assessing the impacts of sulphur levels on air quality and new emission control technologies were:
sensitivity (short-term response), including emissions of NOx, total hydrocarbons (THC) and carbon monoxide (CO) at low and at high mileage
technology types, including catalysts, OBDs and other factors
ageing of technologies, including the effects of extended exposure to fuel sulphur
reversibility (the ability to undo the effects of fuel sulphur).
In the absence of data from directly relevant trials in both the Australian context and level of sulphur change, available literature data is used to undertake an assessment in the Australian context. The assessment includes analysis to form an estimate of how higher than 10 ppm fuel sulphur levels will firstly affect regulated tailpipe emissions and secondly on-board diagnostic emission systems fitted to Euro 5 and 6 compliant vehicles. The 10 ppm sulphur level is considered the baseline for comparison in this review since it is the level prescribed in Europe for the test fuel for the Euro 5 and 6 emission standards.
Based on these desktop assessments and other review inputs, additional issues such as the look ahead for alternative engine technology, the impact on in-service compliance versus real world air quality, and vehicle operability are examined.
1.4 Results
The following table summarises the issues identified with current levels of sulphur in petrol in meeting the requirements of the new emission standards, and the capabilities of current sulphur levels to support the new requirements. Key outcomes of the assessments are outlined below.
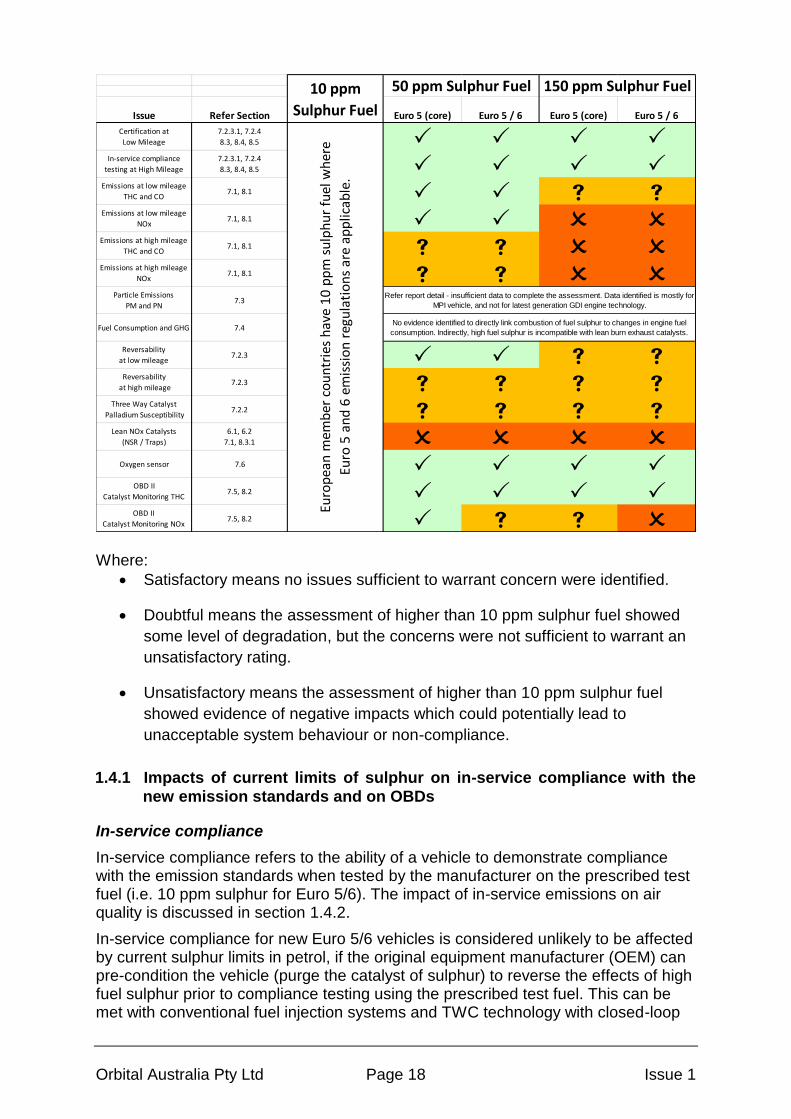
Orbital Australia Pty Ltd Page 18 Issue 1
Issue Refer Section Euro 5 (core) Euro 5 / 6 Euro 5 (core) Euro 5 / 6
Certification at
Low Mileage
7.2.3.1, 7.2.4
8.3, 8.4, 8.5 P P P PIn-service compliance
testing at High Mileage
7.2.3.1, 7.2.4
8.3, 8.4, 8.5 P P P PEmissions at low mileage
THC and CO7.1, 8.1 P P s s
Emissions at low mileage
NOx7.1, 8.1 P P O O
Emissions at high mileage
THC and CO7.1, 8.1 s s O O
Emissions at high mileage
NOx7.1, 8.1 s s O O
Particle Emissions
PM and PN7.3
Fuel Consumption and GHG 7.4
Reversability
at low mileage7.2.3 P P s s
Reversability
at high mileage7.2.3 s s s s
Three Way Catalyst
Palladium Susceptibility7.2.2 s s s s
Lean NOx Catalysts
(NSR / Traps)
6.1, 6.2
7.1, 8.3.1 O O O OOxygen sensor 7.6 P P P P
OBD II
Catalyst Monitoring THC7.5, 8.2 P P P P
OBD II
Catalyst Monitoring NOx7.5, 8.2 P s s O
10 ppm
Sulphur Fuel
Euro
pea
n m
emb
er c
ou
ntr
ies
hav
e 1
0 p
pm
su
lph
ur
fuel
wh
ere
Euro
5 a
nd
6 e
mis
sio
n r
egu
lati
on
s ar
e ap
plic
able
.
50 ppm Sulphur Fuel 150 ppm Sulphur Fuel
Refer report detail - insufficient data to complete the assessment. Data identified is mostly for
MPI vehicle, and not for latest generation GDI engine technology.
No evidence identified to directly link combustion of fuel sulphur to changes in engine fuel
consumption. Indirectly, high fuel sulphur is incompatible with lean burn exhaust catalysts.
Where:
Satisfactory means no issues sufficient to warrant concern were identified.
Doubtful means the assessment of higher than 10 ppm sulphur fuel showed
some level of degradation, but the concerns were not sufficient to warrant an
unsatisfactory rating.
Unsatisfactory means the assessment of higher than 10 ppm sulphur fuel
showed evidence of negative impacts which could potentially lead to
unacceptable system behaviour or non-compliance.
1.4.1 Impacts of current limits of sulphur on in-service compliance with the
new emission standards and on OBDs
In-service compliance
In-service compliance refers to the ability of a vehicle to demonstrate compliance with the emission standards when tested by the manufacturer on the prescribed test fuel (i.e. 10 ppm sulphur for Euro 5/6). The impact of in-service emissions on air quality is discussed in section 1.4.2.
In-service compliance for new Euro 5/6 vehicles is considered unlikely to be affected by current sulphur limits in petrol, if the original equipment manufacturer (OEM) can pre-condition the vehicle (purge the catalyst of sulphur) to reverse the effects of high fuel sulphur prior to compliance testing using the prescribed test fuel. This can be met with conventional fuel injection systems and TWC technology with closed-loop
Orbital Australia Pty Ltd Page 19 Issue 1
control and monitoring. Such a system should also demonstrate a high degree of reversibility of the effects of fuel sulphur levels used in-field (i.e. day to day use of petrol containing 150 ppm or 50 ppm sulphur).
OBDs
Sulphur adsorption on the catalyst inhibits oxygen storage and reduces catalyst surface area, decreasing catalyst efficiency. A key role of OBDs is catalyst monitoring, where the oxygen storage capacity of the catalyst is monitored to provide an indirect measurement of the tailpipe emissions or of catalyst conversion efficiency. One of two methods (dual sensor and time-delay) is typically used to infer the oxygen storage capacity, but both methods rely on an oxygen sensor. The new emission standards require that emissions durability be maintained over 160,000 km, thus the reliability of the catalyst monitoring system needs to be maintained over this mileage.
The new emission standards set OBD exhaust threshold limits for THC and NOx emissions that if exceeded must trigger an OBD fault. Any increase in tailpipe emissions which reduces the OBD factor (i.e. the difference between the legislated tailpipe emission threshold and the OBD exhaust threshold) will increase the likelihood of illuminating the malfunction indicator lamp (MIL) and decrease the statistical ability to differentiate between tailpipe emissions below the OBD exhaust threshold and those at the threshold.
Most of the data reviewed with regard to OBD performance is almost 20 years old, yet despite industry concerns at the time the US Environmental Protection Agency concluded that there was not a proliferation of in-field MIL events. Catalysts and oxygen sensors have become more efficient and more sulphur tolerant since that time. Other improvements (e.g. the use of close-coupled catalysts to reduce sulphur sensitivity; more sophisticated processors in engine control units) would today further reduce the likelihood of sulphur levels triggering false MIL events.
Given the OBD factors calculated in this review for the new emission standards, and considering advancements in technologies, it is considered likely that the current sulphur levels will not significantly compromise the OBD threshold limits for THC emissions. However, the reduction in the calculated OBD factor for NOx emissions at Euro 6 is such that 150 ppm sulphur fuel will compromise the OBD threshold limits. This conclusion is based on Europe’s proposed final Euro 6 OBD threshold limit for NOx, which is lower than that prescribed for the first three years of Euro 6. It is considered that to achieve the final Euro 6 OBD threshold limit for NOx with either 150 ppm or 50 ppm sulphur fuel, it would have to be assumed that fuel sulphur has no effect on tailpipe emissions and that advances in vehicle emissions hardware and the engine control unit would be solely responsible for achieving the Euro 6 OBD thresholds. Europe intends to review the proposed final Euro 6 OBD threshold limit for NOx in 2014.
1.4.2 Impacts of the continued use of current sulphur levels in petrol on air
quality in Australia
Differences in fuel quality between that used by the OEM to demonstrate in-service compliance and that used in the market may give rise to a difference between the emission results set as the objective for regulation and those achievable in the field (real world). However, fuel quality is not the only factor impacting emissions, and
Orbital Australia Pty Ltd Page 20 Issue 1
other factors including catalyst performance, emission control strategies and component ageing may also make a contribution.
The available studies that were reviewed examined the impacts of sulphur on catalyst performance using artificially aged catalysts (e.g. by accelerated methods on test engines) rather than using on-road or on-track vehicles. Most of these studies also used fuels with very low sulphur levels
v for ageing, which do not
necessarily reflect real world performance when real world fuels are not comparable to the test fuel, especially the sulphur levels. In addition to this lack of real world data, especially in the Australian context, the conditions under which vehicles can demonstrate in-service compliance with the new emission standards (e.g. pre-conditioning, use of 10 ppm sulphur fuel) are unlikely to be experienced in the real world (in-field) where air quality is measured with vehicles operating on available pump fuel (150 ppm ULP or 50 ppm PULP) in regular day-to-day activities. Hence while new Euro 5/6 vehicles may demonstrate in-service compliance, increased emissions due to the impacts of real world sulphur levels may occur in-field.
Based on the data analysed in this review, it is considered unavoidable that there will be some increase in real world pollutant levels from Euro 5/6 vehicles entering the fleet with the continued use of either 150 ppm or 50 ppm sulphur fuels compared to what may be achieved with low (10 ppm) sulphur fuels, particularly at higher mileage. The extent of the compromise will be impacted by the degree of in-field reversibility of the effects of sulphur as well as the level of sulphur itself. If in-field catalyst temperatures are sustained at sufficiently high levels, there is a reasonable likelihood that extended mileage effects from vehicle operation on higher fuel sulphur levels could be minimised or eliminated. Reversibility may also be sensitive to vehicle type as larger vehicles operate at a lower percentage duty cycle of engine capacity than smaller vehicles, resulting in differences in exhaust gas and catalyst temperatures.
The continued use of 50 ppmvi fuel sulphur on the incoming Euro 5/6 fleet is
assessed as being unlikely to significantly increase emissions of THC, CO and NOx at low mileage. There is some doubt as to whether this will be the case at high mileage, and much of this depends on the in-field reversibility of the sulphur effects and the specific formulation of mainstream TWCs. However, some doubts are raised as to the low mileage emissions of THC and CO with the continued use of 150 ppm sulphur fuels, while the outcome for air quality is considered unsatisfactory for NOx emissions and high mileage capability of the emission control technologies. Temporary use of 150 ppm ULP in a vehicle designed to use 50 ppm or 10ppm PULP is likely to be reversible.
Whilst the literature data and assessments made indicate that emissions, in particular THC and NOx, may be higher if 10 ppm fuel was not specified for Euro 5/6 compliant vehicles, the increase may not be uniform for all vehicle makes and models and it remains that older ADR37/xx vehicles currently contribute the majority of passenger vehicle NOx
19, 49 to the Australian airshed. A significant reduction in
NOx emissions for these legacy vehicles due to a fuel sulphur change alone is unlikely without significant evidence available to indicate that the high mileage effects of fuel sulphur are indeed reversible.
v The studies reviewed did not provide specific sulphur ppm values. However, for catalyst ageing
industry practice is to use fuels such as Indolene Clear, which has very low sulphur levels. vi Current Australian PULP standard, having a lower fuel sulphur limit that ULP

Orbital Australia Pty Ltd Page 21 Issue 1
Of all the pollutants, PM is currently considered to have the greatest impact on human health, and the adoption of Euro 5 (full) and Euro 6 emission standards will require GDI vehicles to meet a PM and particle number (PN) limit, respectively. Changes to PM emissions have not been assessed due to a general absence of sulphur sensitivity test data. However, the available data does not indicate a significant air quality benefit from the use of a lower sulphur fuel. For example, the introduction of GDI technology is likely to increase PM emissions
vii by more than any
benefit provided by a reduction in PM contributed by lower sulphur fuel.
1.4.3 Benefits of a reduction in fuel sulphur levels – meeting the objects of the
Act
Reducing the level of pollutants and emissions arising from the use of fuel
Without Australian-specific test data to the contrary, there is an expectation that real world exhaust emissions would be higher with the use of 150 ppm or 50 ppm sulphur fuel than they would be if a lower sulphur fuel level was implemented. Much of the literature used to assess this aspect is dated and relates to a period when Europe and the US were evaluating the impacts of fuel sulphur. The robustness of engine and vehicle emission technology has improved since this time, and some of the more recent data suggests a lower sensitivity of tailpipe emissions to different levels of fuel sulphur. Significant absolute reductions in pollutant emissions have been made over successive amendments to the vehicle emission and petrol standards such that the expected increase in emissions associated with the use of higher sulphur fuels on the newer emission technologies is small by comparison (see section 9).
Facilitating the adoption of better engine and emission control technology
A reduction in fuel sulphur levels from the current 150 ppm and 50 ppm levels to 10 ppm is likely to enable the use of some specific technologies, namely lean-burn GDI, as well as indirectly enhance their fuel consumption capability by reducing the frequency of their catalyst regeneration (sulphur removal) cycles. However, the literature reviewed indicates that the predicted uptake of this technology in Europe and the US has not been realised due to economic cost-benefit issues. It is also possible that technologies not yet mature enough to be considered as commercially viable (e.g. on-board reforming of gasoline by fuel cells) would be enabled by lower sulphur fuels. However, other technologies exist, or are being developed, which can deliver a fuel consumption benefit without a specific requirement for ultra-low (10 ppm) sulphur fuels. In this respect, while an ultra-low sulphur fuel would act as an enabler of some specific new emission control technologies, maintaining current sulphur levels would not necessarily prevent reductions in carbon dioxide or pollutants from being achieved, though it may limit technology choice.
Allowing the more effective operation of engines
Reducing fuel sulphur from current levels is unlikely to yield significant improvements in the operability of existing and new Euro 5/6 engines or vehicles.
vii
because the fuel is now delivered in-cylinder like a diesel engine, rather than into the engine intake where it
has time to fully evaporate and mix before being ignited

Orbital Australia Pty Ltd Page 22 Issue 1
The most significant impact of current sulphur levels on introduced Euro 5/6 could be the nuisance factor associated with false or premature detection (i.e. MIL illumination) of OBD-monitored parameters if the vehicle systems were not sufficiently tolerant. Intermittent or premature MIL activation may, however, be a brand quality issue for OEMs. The likelihood of this occurring is considered low for the continued use of 50 ppm sulphur fuel, and higher for the continued use of 150 ppm sulphur fuel, particularly at very high mileage.
1.5 Conclusions
Based on the literature reviewed and desktop assessments undertaken, it is considered that 50 ppm sulphur fuel would offer a sufficient reduction in the risks of sulphur-related issues identified for new Euro 5/6 vehicles meeting the new Euro 5 and Euro 6 emission standards requirements. This 50 ppm sulphur level is not without challenges, but, in combination with some relaxation of the OBD requirements at the Euro 6 stage, may be an acceptable compromise. Some compromise to real world air quality is anticipated if in-field reversibility of the effects of fuel sulphur is not demonstrated, while general operability is expected to be unimpaired.
It is not possible to assess whether the reduction of fuel sulphur levels from their current maximums of 50 ppm in PULP and 150 ppm in ULP would offer an improvement in the emission capability of the existing legacy fleet of pre-Euro 5 vehicles as the question of in-field reversibility has not been conclusively answered due to limited data. Whilst data reviewed indicated that the use of lower sulphur fuels was associated with lower tailpipe emissions, without reversibility of the effects of current fuel sulphur in the existing fleet, the benefit of this may not be evident until the fleet has rolled over.
To facilitate the adoption of a wider choice of emerging emission control technologies, a reduction in fuel sulphur levels to 10 ppm would be required.
Addendum:
The US EPA Draft Regulatory Impact Analysis: Tier 3 Motor Vehicle Emission and Fuel Standards was released subsequent to the literature review and assessments in this study being undertaken. The US EPA is proposing to move to a test fuel (gasoline) with sulphur levels 8-11 ppm and an in-service fuel (gasoline) standard of 10 ppm sulphur on an annual average basis from 1 January 2017. A comprehensive review of this report was not possible within the timeframe of this review, however it would seem that the justification for the reduction to fuel sulphur levels is based on 1) significantly lower tailpipe emission targets than presently regulated, with these being significantly lower than those proposed under Euro 5/6; and 2) a long term forecast model of air quality set once the majority of the fleet has rolled over to meet the new tailpipe standards.

Orbital Australia Pty Ltd Page 23 Issue 1
2 INTRODUCTION
The Department of Sustainability, Environment, Water, Population and Communities administers the Fuel Quality Standards Act 2000 (the Act) which provides the legislative basis for national fuel quality and fuel quality information standards for Australia. Vehicle emission standards are national standards (Australian Design Rules or ADRs) under the Motor Vehicle Standards Act 1989 and are administered by the Department of Infrastructure and Transport.
The Regulation Impact Statement16
(RIS) which examined the costs and benefits of adopting the Euro 5/6 emissions standards did not specifically examine the impact of fuel quality parameters on introducing these standards, but stated that sulphur in petrol was the only fuel quality parameter relevant to the adoption of these standards.
The reference fuel prescribed under the Euro 5/6 emissions standards for testing vehicles to the Euro 5/6 emission limits specifies 10 ppm sulphur. In Australia, the Fuel Standard (Petrol) Determination 2001 (the petrol standard) currently limits the maximum sulphur level to 150 ppm and 50 ppm in regular unleaded (ULP) and premium unleaded (PULP) petrol, respectively.
In the departmental review leading up to this project, it was identified that there was little real world data available to confirm whether or not the current sulphur limits will prevent in-service compliance with the new emissions standards or cause operational problems on the new vehicle emission control technologies likely to be introduced under these standards.
The aim of this project is to collate and review currently available technical information to:
examine the potential impact of current sulphur limits (150 ppm and 50 ppm) in petrol supplied in Australia on vehicles’ in-service compliance with the new Euro 5/6 emissions standards (i.e. impacts of current sulphur limits on the new emission control technologies used for meeting the Euro 5/6 emissions standards);
consider air quality impacts from Euro 5/6 emission control technologies operating on petrol containing the current sulphur limits (150 ppm and 50 ppm); and
to determine what levels of sulphur would meet the objects of the Act, namely to regulate the quality of fuel supplied in Australia in order to:
o reduce the level of pollutants and emissions arising from the use of fuel that may cause environmental and health problems; and
o facilitate the adoption of better engine technology and emission control technology; and
o allow the more effective operation of engines.
This project is limited to reviewing Australian sulphur limits in petrol (gasoline) with respect to supporting the requirements of the Euro 5/6 emissions standards (i.e. it does not consider diesel or other fuels).
Orbital Australia Pty Ltd Page 24 Issue 1
This project will contribute evidence to inform policy decisions on whether the current sulphur limits in petrol need to be amended (reduced) to support vehicle compliance with the Euro 5/6 emissions standards, and what they should be to best meet the objects of the Act.

Orbital Australia Pty Ltd Page 25 Issue 1
3 METHODOLOGY
The project scope and budget is limited to the undertaking of a review of publicly available literature which discusses the effects of sulphur in petrol (gasoline) and forming a balanced view with regard to key potential impacts and the objects of the Act.
3.1 Literature Sources
Literature considered in producing the assessment and report included, but was not limited to:
Australian and international (particularly United States (US), Europe) fuel (petrol) and light vehicle emissions standards.
Final Regulation Impact Statement for Review of Euro 5/6 Light Vehicle Emissions Standards (including public submissions) prepared by the Department of Infrastructure and Transport. November 2010. http://www.infrastructure.gov.au/roads/environment/emission/index.aspx
Any information used by other countries when setting sulphur limits for petrol, including references to data.
Any information on the impacts of sulphur (e.g. on emission control technologies [catalysts] and on-board diagnostic elements) on light vehicle emissions standards requirements, particularly Euro 5/6.
Any information on Euro 5/6 emission control technologies introduced or likely to be introduced in Australia, and their sulphur tolerance.
Any information regarding vehicle manufacturer guidance on which petrol (e.g. ULP, PULP) the Euro 5/6 vehicle should operate on.
Any information on the impacts of sulphur in petrol on air quality in Australia.
Any information on the level of sulphur in petrol that would best meet the objects of the Act.
Only a very limited consultation program was undertaken with industry stakeholders, primarily with an objective of identifying any additional literature which had not already been included. A more extensive consultation which would include independent review of any technical issues raised, but not described in published and referable literature, was not within the project’s scope.
Source material for this report has largely been obtained from the following publicly accessible sources:-
Society of Automotive Engineers (SAE) International (http://www.sae.org/pubs/)
o For SAE papers the first two digits of the paper number provide the year of publishing. It should also be noted that the graphs in some early papers are of poor print quality because, due to their age they are not available in digital format. The print quality cannot be further improved.
Independent consultants and associations such as:-
o Coordinating Research Council (http://www.crcao.com/)

Orbital Australia Pty Ltd Page 26 Issue 1
o Concawe (https://www.concawe.eu/Content/Default.asp)
o European Automobile Manufacturers Association (http://www.acea.be/)
o American Petroleum Institute (http://www.api.org/)
o Australian Institute of Petroleum (http://www.aip.com.au/)
Government bodies such as:-
o US Environmental Protection Agency (http://www.epa.gov/)
o Californian Air Resources Board (http://www.arb.ca.gov/homepage.htm)
o European Commission (http://ec.europa.eu/)
o Australian Government (http://www.environment.gov.au/index.html, http://www.infrastructure.gov.au/infrastructure/).
3.2 Structure of the report
The report has been laid out in the following manner. The first part gathers the available data from literature and other sources and is structured as follows:-
A summary of the relevant sulphur fuel standards and exhaust emissions standards for Australia. Standards for Europe and the US are summarised in Appendix B.
Summary of industry body viewpoints from both fuel and vehicle manufacturing sectors.
Literature review of key papers and reports available publicly, including:
o tailpipe emission performance
o catalyst performance, reversibility and ageing
o particulate matter emissions (PM and PN)
o fuel consumption and greenhouse gas emissions
o on-board diagnostics (OBD) and oxygen sensors.
The second part of the report uses the above data as the basis for subsequent analysis and assessment specific to the context of this report, and is structured as follows:-
Assessment of the Australian situation for 50 ppm and 150 ppm sulphur fuel (compared to 10 ppm sulphur baseline) with respect to the literature, including:
o tailpipe emissions
o OBDs
o look ahead for alternative engine technology
o implications for in-service and real world issues.
Satisfying the objects of the Act.
Orbital Australia Pty Ltd Page 27 Issue 1
Knowledge gaps.

Orbital Australia Pty Ltd Page 28 Issue 1
4 EMISSIONS AND TECHNOLOGY OVERVIEW
A detailed overview of vehicle and emissions technology, testing methods, drive cycles and the impacts of sulphur on emissions technology, which may be useful to the layman reader, is provided in

Orbital Australia Pty Ltd Page 29 Issue 1
Appendix A. The tables of acronyms and definitions at the front of this report also provide a brief explanation of most technical terms.
Fuel sulphur, unlike some other components of fuel, only has an emission implication when it comes to combustion and aftertreatment of combustion products in the exhaust system. The lack of focus in examined literature on the direct combustion aspects of fuel sulphur suggests that these effects are negligible in comparison to the effects on the aftertreatment systems. For this reason, it is only necessary to consider the tailpipe exhaust emission systems and impacts in this study.
Vehicle emissions control technology is always advancing. ADR37/00 introduced the requirement of so-called “active” control emissions where exhaust emissions were controlled primarily by a catalyst in combination with advances in the control of engine fuelling and air-fuel ratio (AFR). These “active” emission controls have continued to be refined and improved such that lower tailpipe emission levels are achievable. Today the default solution adopted has been electronic fuel injection with increasing levels of feedback control. However, a range of new fuel injection and control technologies are being introduced.
Gasoline direct injection (GDI) systems represent the most significant change in the delivery of fuel to the conventional internal combustion engine in the past 25 years. Although GDI systems have existed since the 1940s, it was not until refinements in electronic actuation and control occurred that these systems gained popularity. GDI systems deliver fuel directly in-cylinder rather than to the intake manifold of the engine, allowing for some significant improvements in efficiency.
Exhaust aftertreatment is typically done by a catalyst. The location of the catalyst is driven by the emissions requirements. Catalysts may be located under the vehicle (underbody) or close to the exhaust valves (close-coupled). Some systems utilise both underbody and close-coupled catalysts. More stringent emissions legislation often dictates the use of both close-coupled and underbody catalyst. The placement of the catalyst is a balance between needing high exhaust gas temperatures for good light-off and high conversion efficiency and protecting the catalyst from over-temperature at high load which can cause degradation or failure. Small engine vehicles with lower exhaust gas flow rates and generally lower performance are able to position their catalyst closer to the engine.
The efficiency with which a catalyst converts pollutants is a function of several factors including exhaust feed gas temperature, reactivity of the catalyst surface and mixture (AFR) of the exhaust feed gas. Control of the mixture is governed by the fuelling and/or engine control system. Whether the mixture is rich or lean will bias the performance of the catalyst. Most fuel injection systems are based on closed-loop control (for most of their operating conditions) meaning their operation is governed by feedback from an exhaust oxygen sensor. There may be drift in the fuel metering side or deterioration on the accuracy of the feedback provided.
The three-way catalyst (TWC) is the most common form of automotive catalyst. It is “three-way” because it:
oxidises carbon monoxide (CO)
oxidises hydrocarbons (HC’s)

Orbital Australia Pty Ltd Page 30 Issue 1
reduces oxides of nitrogen (NOx).
The evolution of lean burn GDI technology has necessitated the development of catalysts for lean gasoline operation. Technology solutions have in the most been adapted from solutions for diesel engines.
The NOx Storage and Reduction (NSR) or lean NOx trap (LNT) catalyst has become the dominant aftertreatment method for lean burn GDI engines. During lean burn combustion the NOx emissions are stored temporarily on the substrate surface of an NSR catalyst. By storing the NOx emissions, the engine can be operated leaner for more of the driving time thereby maximising fuel economy. The stored NOx emissions are treated when the NSR catalyst is switched into regeneration mode. Regeneration mode usually involves running the catalyst at, or richer than, lambda (λ) = 1

Orbital Australia Pty Ltd Page 31 Issue 1
5 REGULATORY LANDSCAPE: FUEL STANDARDS AND LIGHT
VEHICLE EMISSIONS STANDARDS
The following section provides a historical overview of emissions and fuel sulphur level legislation for Europe, the US and Australia. It lists the relevant legislation for Australia which is generally derived from European legislation due to harmonisation. The comparable legislation extracts for Europe and the US are located in Appendix B. Emissions standards for Asia, and fuel sulphur levels for the rest of world, are also discussed.
5.1 Historical Overview of Fuel and Vehicle Emissions Standards 1990-2012
Europe
The driver for improved exhaust emissions and fuel quality was accelerated in 1992 when the European Commission invited the European automobile and oil industries to participate in a technical work program
1. The aim of this program was to provide
policy-makers with an objective assessment of the most cost-effective measures for reducing emissions from the road transport sector. The reduction was to be consistent with the attainment of the new air and fuel quality standards which were being developed for adoption across the European Union (EU).
This work program became known as the Auto-Oil Program and was concluded in 1996. A second program, Auto-Oil II, commenced in 1997 and finished in 2000
2. At
this time the European Commission also called for stakeholders’ comments and a summary report was compiled by an independent consultant
3.
The findings of these reports were used by the European Commission to help define the exhaust emissions and fuel standard from approximately 2000-2009, the years for which the greatest reductions in fuel sulphur level occurred, culminating in the current European sulphur limit of 10 ppm.
United States
In early 1999, the US Environmental Protection Agency (US EPA) undertook measures to revise the exhaust emissions and fuel quality standards and released a regulatory impact analysis
4. The US EPA called for stakeholders’ comments to be
provided by late 1999 and compiled these into a response document5.
In 2000, the US EPA published the Tier 2 standards6 which were phased in from
2004 to 2006. These standards are current today with regard to sulphur in fuel. In October 2011, the National Association of Clean Air Agencies was tasked by the US EPA to provide a report
7 to provide input for the Tier 3 standards. In late March
2013viii
the US EPA published a draft Regulatory Impact Analysis Tier 3 Motor Vehicle Emission and Fuel Standards
8 which aimed to reduce the amount of sulphur
viii
Addendum :
The US EPA Draft Regulatory Impact Analysis: Tier 3 Motor Vehicle Emission and Fuel Standards was
released subsequent to the literature review and assessments in this study being undertaken. The US EPA is
proposing to move to a test fuel (gasoline) with sulphur levels 8-11 ppm and an in-service fuel (gasoline)
standard of 10 ppm sulphur on an annual average basis from 1 January 2017. A comprehensive review of this
report was not possible within the timeframe of this review, however it would seem that the justification for the
reduction to fuel sulphur levels is based on 1) significantly lower tailpipe emission targets than presently
regulated, with these being significantly lower than those proposed under Euro 5/6; and 2) a long term forecast
model of air quality set once the majority of the fleet has rolled over to meet the new tailpipe standards.

Orbital Australia Pty Ltd Page 32 Issue 1
in gasoline to 10 ppm by January 2017 and set fleet-wide emission limits on new vehicles.
Australia
In 1999, the Australian Government released a RIS9 which proposed the
requirement for a fuel quality review10
culminating in a fuel quality standard for petrol
11 which was introduced in 2001 to align fuel standards with the proposed
Euro 3 gasoline emissions standards.
In 2004, the Department of Transport released a second RIS12
to address the fuel standards for post-2006. This document referenced many of the key documents associated with the EU’s drive for lower sulphur gasoline and discussed Euro 4 emissions and the possibility of a 10 ppm sulphur limit for gasoline light vehicles.
In 2010, the Department of Infrastructure and Transport released a third draft RIS13
and a final RIS
16 (the Euro 5/6 RIS) which focused on the costs and benefits of
adopting the Euro 5/6 light vehicle emission standards and their ability to deliver significant emissions reductions.
During this period, Euro 4 was adopted (from 1 July 2008 to 1 July 2010). In June 2011, it was announced
ix that Euro 5 and Euro 6 exhaust emissions legislation
would be adopted progressively from 1 November 2013 (see Section 5.2.2).
One purpose of this report is to conduct a literature review and assess the suitability of current sulphur levels in petrol in supporting the Euro 5/6 exhaust emissions legislation for new Euro /6 vehicles.
5.2 Australian Fuel Sulphur and Exhaust Emissions Standards
5.2.1 Fuel Standards
Table 5.1 details the Australian fuel specification as it relates to fuel sulphur and the timetable for the limits coming into effect.
Source: Fuel Standard (Petrol) Determination 2001 made under section 21 of the Fuel Quality Standards Act 2000 LRP refers to lead replacement petrol. Note: mg/kg is equivalent to ppm.
Table 5.1 – Australian Fuel Sulphur Standards
ix Media release by the Minister for Infrastructure and Transport. 11 June 2011. Available at:
http://www.minister.infrastructure.gov.au/aa/releases/2011/June/AA106_2011.aspx
Orbital Australia Pty Ltd Page 33 Issue 1
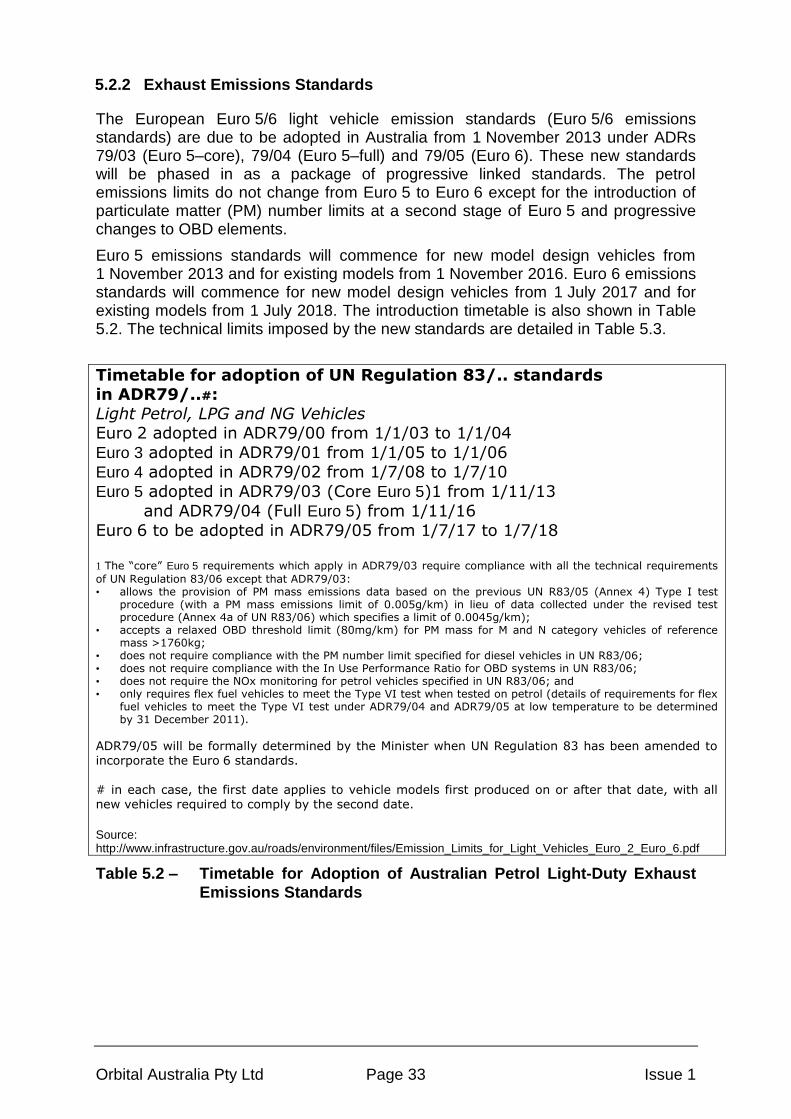
5.2.2 Exhaust Emissions Standards
The European Euro 5/6 light vehicle emission standards (Euro 5/6 emissions standards) are due to be adopted in Australia from 1 November 2013 under ADRs 79/03 (Euro 5–core), 79/04 (Euro 5–full) and 79/05 (Euro 6). These new standards will be phased in as a package of progressive linked standards. The petrol emissions limits do not change from Euro 5 to Euro 6 except for the introduction of particulate matter (PM) number limits at a second stage of Euro 5 and progressive changes to OBD elements.
Euro 5 emissions standards will commence for new model design vehicles from 1 November 2013 and for existing models from 1 November 2016. Euro 6 emissions standards will commence for new model design vehicles from 1 July 2017 and for existing models from 1 July 2018. The introduction timetable is also shown in Table 5.2. The technical limits imposed by the new standards are detailed in Table 5.3.
Timetable for adoption of UN Regulation 83/.. standards in ADR79/..#: Light Petrol, LPG and NG Vehicles Euro 2 adopted in ADR79/00 from 1/1/03 to 1/1/04
Euro 3 adopted in ADR79/01 from 1/1/05 to 1/1/06
Euro 4 adopted in ADR79/02 from 1/7/08 to 1/7/10
Euro 5 adopted in ADR79/03 (Core Euro 5)1 from 1/11/13
and ADR79/04 (Full Euro 5) from 1/11/16
Euro 6 to be adopted in ADR79/05 from 1/7/17 to 1/7/18
1 The “core” Euro 5 requirements which apply in ADR79/03 require compliance with all the technical requirements
of UN Regulation 83/06 except that ADR79/03: • allows the provision of PM mass emissions data based on the previous UN R83/05 (Annex 4) Type I test
procedure (with a PM mass emissions limit of 0.005g/km) in lieu of data collected under the revised test procedure (Annex 4a of UN R83/06) which specifies a limit of 0.0045g/km);
• accepts a relaxed OBD threshold limit (80mg/km) for PM mass for M and N category vehicles of reference mass >1760kg;
• does not require compliance with the PM number limit specified for diesel vehicles in UN R83/06; • does not require compliance with the In Use Performance Ratio for OBD systems in UN R83/06; • does not require the NOx monitoring for petrol vehicles specified in UN R83/06; and • only requires flex fuel vehicles to meet the Type VI test when tested on petrol (details of requirements for flex
fuel vehicles to meet the Type VI test under ADR79/04 and ADR79/05 at low temperature to be determined by 31 December 2011).
ADR79/05 will be formally determined by the Minister when UN Regulation 83 has been amended to incorporate the Euro 6 standards.
# in each case, the first date applies to vehicle models first produced on or after that date, with all new vehicles required to comply by the second date.
Source: http://www.infrastructure.gov.au/roads/environment/files/Emission_Limits_for_Light_Vehicles_Euro_2_Euro_6.pdf
Table 5.2 – Timetable for Adoption of Australian Petrol Light-Duty Exhaust
Emissions Standards

Orbital Australia Pty Ltd Page 34 Issue 1
Source: http://www.infrastructure.gov.au/roads/environment/files/Emission_Limits_for_Light_Vehicles_Euro_2_Euro_6.pdf Note: Diesel limits are not relevant to this study and have been masked so as to focus on petrol data only.
Table 5.3 – Australian Light-Duty Exhaust Emissions Standards
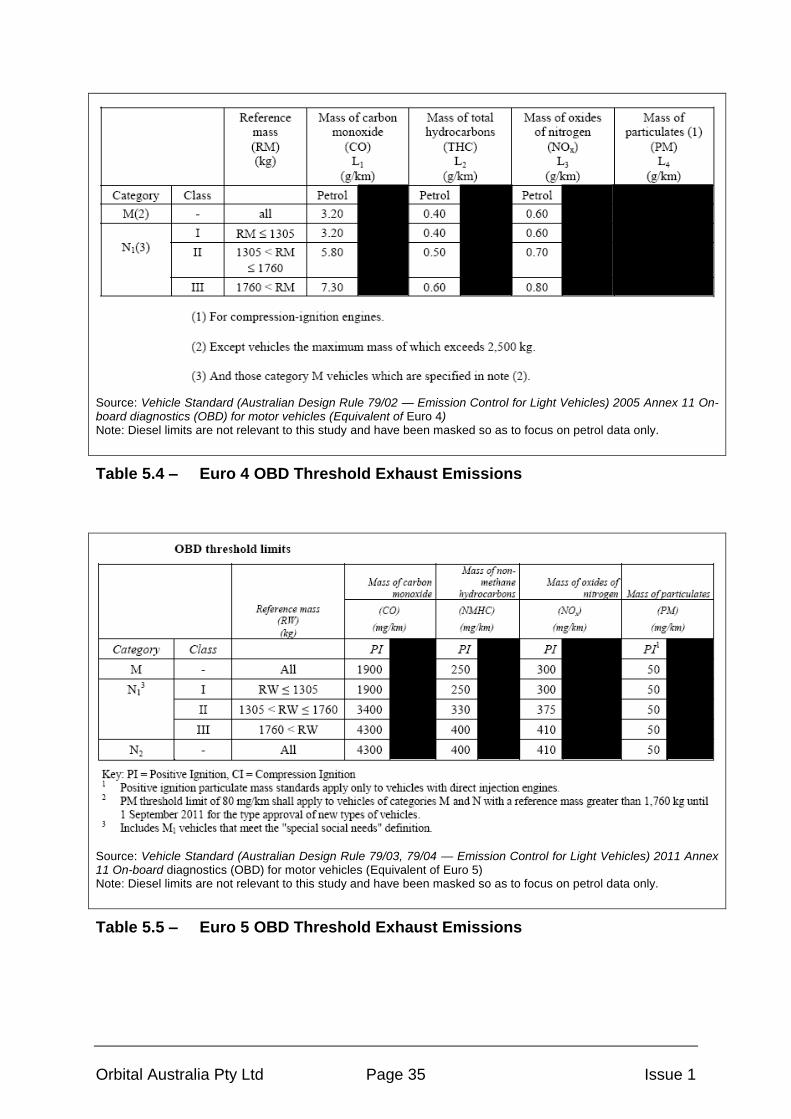
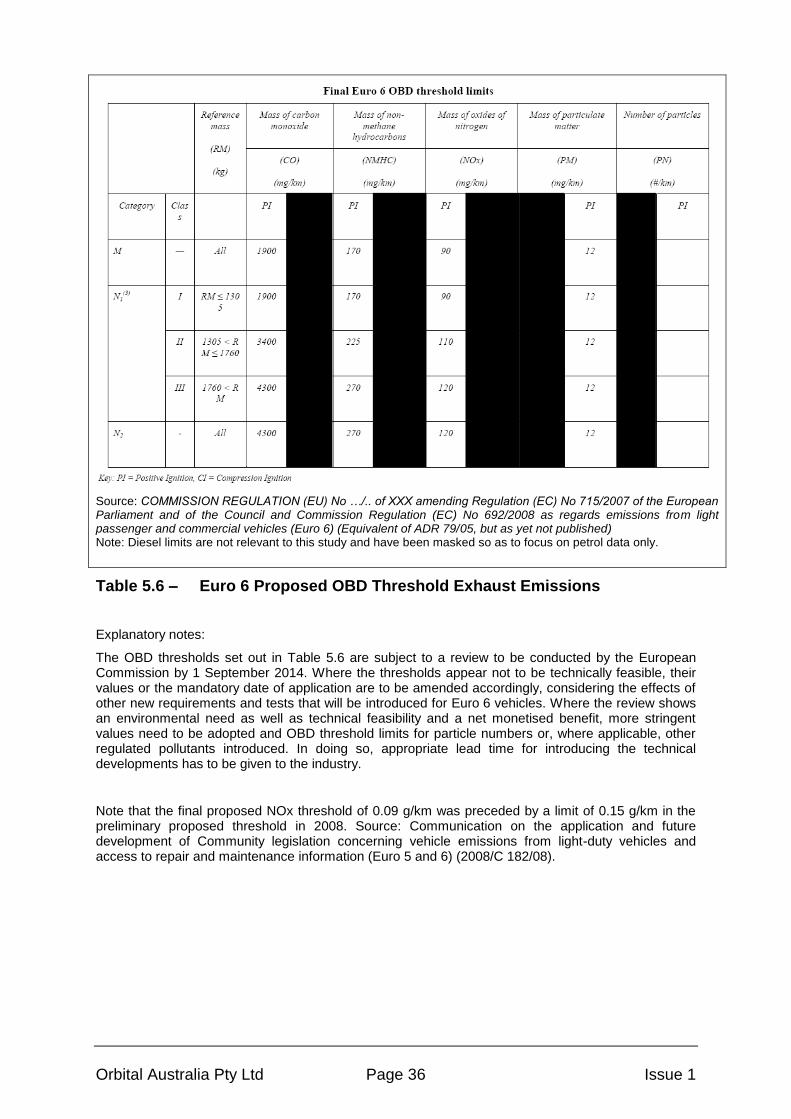
5.2.3 OBD Threshold Exhaust Emissions Standards
Table 5.4 and Table 5.5 show the OBD limits in place for the ADR equivalents of Euro 4 and 5, respectively. It should be noted that because of the staged adoption of Euro 5 over ADR79/03 then ADR79/04, the petrol NOx OBD requirement has a delayed implementation. Table 5.6 shows the proposed OBD limits for ADR79/05 (Euro 6). The tables show the emission limit that needs to be exceeded to warrant triggering of the OBD fault. Legislation in other jurisdictions often refers to an OBD factor (the multiplier between the compliance value and the OBD value). For direct comparison, these factors have been calculated and shown in Table 5.7.
Orbital Australia Pty Ltd Page 35 Issue 1
Source: Vehicle Standard (Australian Design Rule 79/02 — Emission Control for Light Vehicles) 2005 Annex 11 On-board diagnostics (OBD) for motor vehicles (Equivalent of Euro 4) Note: Diesel limits are not relevant to this study and have been masked so as to focus on petrol data only.
Table 5.4 – Euro 4 OBD Threshold Exhaust Emissions
Source: Vehicle Standard (Australian Design Rule 79/03, 79/04 — Emission Control for Light Vehicles) 2011 Annex 11 On-board diagnostics (OBD) for motor vehicles (Equivalent of Euro 5) Note: Diesel limits are not relevant to this study and have been masked so as to focus on petrol data only.
Table 5.5 – Euro 5 OBD Threshold Exhaust Emissions
Orbital Australia Pty Ltd Page 36 Issue 1
Source: COMMISSION REGULATION (EU) No …/.. of XXX amending Regulation (EC) No 715/2007 of the European Parliament and of the Council and Commission Regulation (EC) No 692/2008 as regards emissions from light passenger and commercial vehicles (Euro 6) (Equivalent of ADR 79/05, but as yet not published) Note: Diesel limits are not relevant to this study and have been masked so as to focus on petrol data only.
Table 5.6 – Euro 6 Proposed OBD Threshold Exhaust Emissions
Explanatory notes:
The OBD thresholds set out in Table 5.6 are subject to a review to be conducted by the European Commission by 1 September 2014. Where the thresholds appear not to be technically feasible, their values or the mandatory date of application are to be amended accordingly, considering the effects of other new requirements and tests that will be introduced for Euro 6 vehicles. Where the review shows an environmental need as well as technical feasibility and a net monetised benefit, more stringent values need to be adopted and OBD threshold limits for particle numbers or, where applicable, other regulated pollutants introduced. In doing so, appropriate lead time for introducing the technical developments has to be given to the industry.
Note that the final proposed NOx threshold of 0.09 g/km was preceded by a limit of 0.15 g/km in the preliminary proposed threshold in 2008. Source: Communication on the application and future development of Community legislation concerning vehicle emissions from light-duty vehicles and access to repair and maintenance information (Euro 5 and 6) (2008/C 182/08).
Orbital Australia Pty Ltd Page 37 Issue 1
Tailpipe THC THC OBD NMHC OBD THC OBD equivalent OBD factor
Euro 4 ADR79/02 100,000 km 0.1 0.4 0.40 g/km 4.00
Euro 5 ADR79/03 160,000 km 0.1 0.25 0.28 g/km 2.78
Euro 6 ADR79/05 160,000 km 0.1 0.17 0.19 g/km 1.89
Tailpipe NOx OBD NOx OBD factor
Euro 4 ADR79/02 100,000 km 0.08 0.60 g/km 7.50
Euro 5 ADR79/04 160,000 km 0.06 0.30 g/km 5.00
Euro 6 ADR79/05 160,000 km 0.06 0.09 g/km 1.50
Note: THC OBD equivalent derived from Conversion Factors for Hydrocarbon Emission Components EPA 2005
Tailpipe NOx OBD NOx OBD factor
Euro 6 ADR79/05 160,000 km 0.06 0.15 g/km 2.50
Proposed final EURO OBD threshold limits
Preliminary EURO OBD threshold limits
Table 5.7 – Euro 4, 5 and 6 Calculated OBD Factors
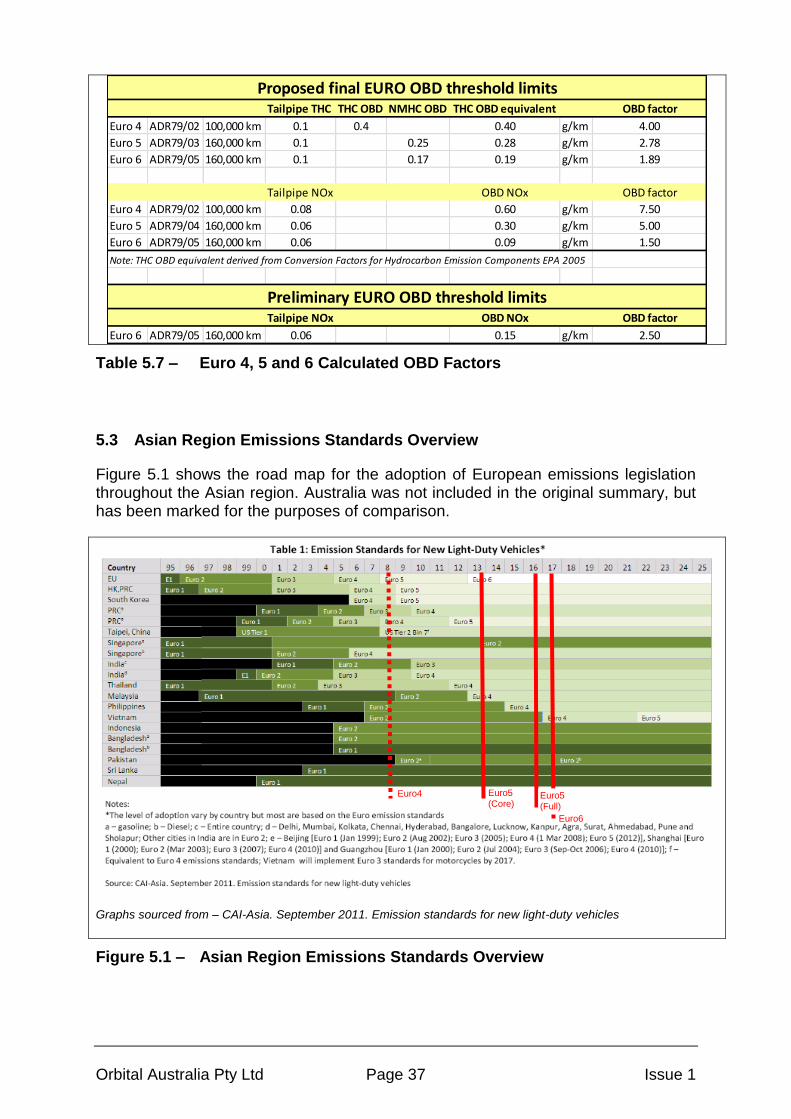
5.3 Asian Region Emissions Standards Overview
Figure 5.1 shows the road map for the adoption of European emissions legislation throughout the Asian region. Australia was not included in the original summary, but has been marked for the purposes of comparison.
Graphs sourced from – CAI-Asia. September 2011. Emission standards for new light-duty vehicles
Figure 5.1 – Asian Region Emissions Standards Overview
Euro5 (Core)
Euro4
Euro5 (Full)
Euro6
Orbital Australia Pty Ltd Page 38 Issue 1
5.4 Rest of the World: Petrol/Gasoline Sulphur limits
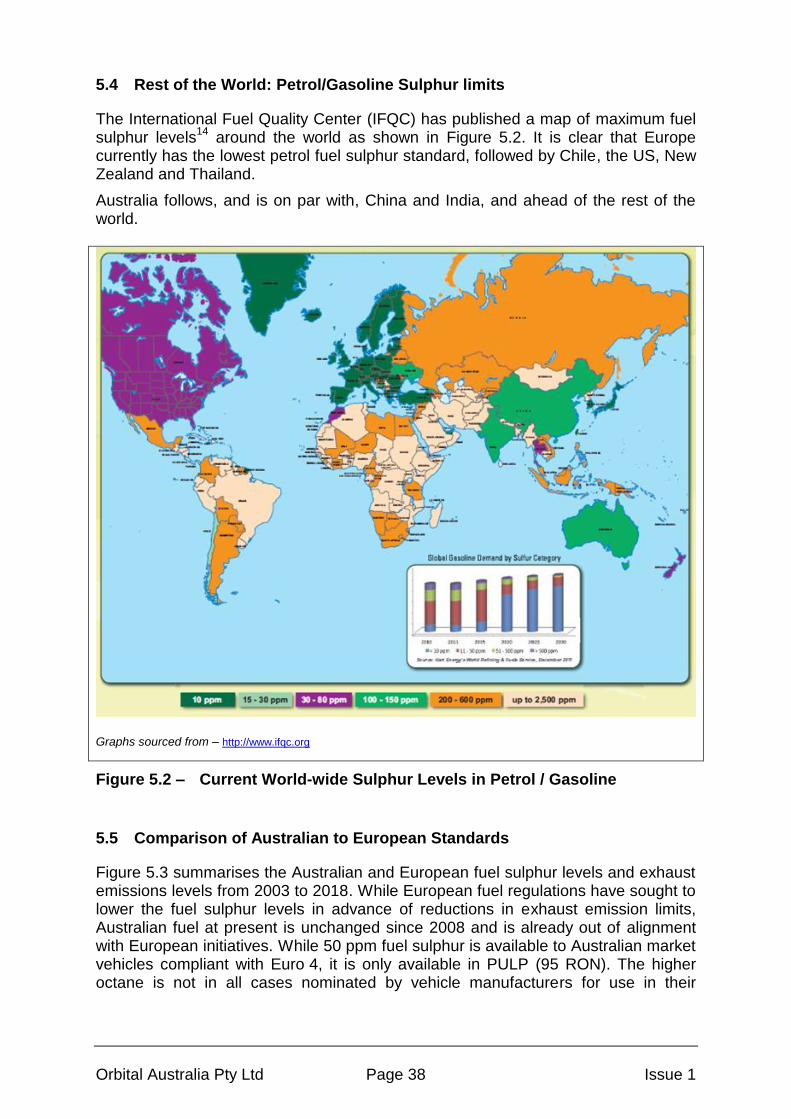
The International Fuel Quality Center (IFQC) has published a map of maximum fuel sulphur levels
14 around the world as shown in Figure 5.2. It is clear that Europe
currently has the lowest petrol fuel sulphur standard, followed by Chile, the US, New Zealand and Thailand.
Australia follows, and is on par with, China and India, and ahead of the rest of the world.
Graphs sourced from – http://www.ifqc.org
Figure 5.2 – Current World-wide Sulphur Levels in Petrol / Gasoline
5.5 Comparison of Australian to European Standards
Figure 5.3 summarises the Australian and European fuel sulphur levels and exhaust emissions levels from 2003 to 2018. While European fuel regulations have sought to lower the fuel sulphur levels in advance of reductions in exhaust emission limits, Australian fuel at present is unchanged since 2008 and is already out of alignment with European initiatives. While 50 ppm fuel sulphur is available to Australian market vehicles compliant with Euro 4, it is only available in PULP (95 RON). The higher octane is not in all cases nominated by vehicle manufacturers for use in their
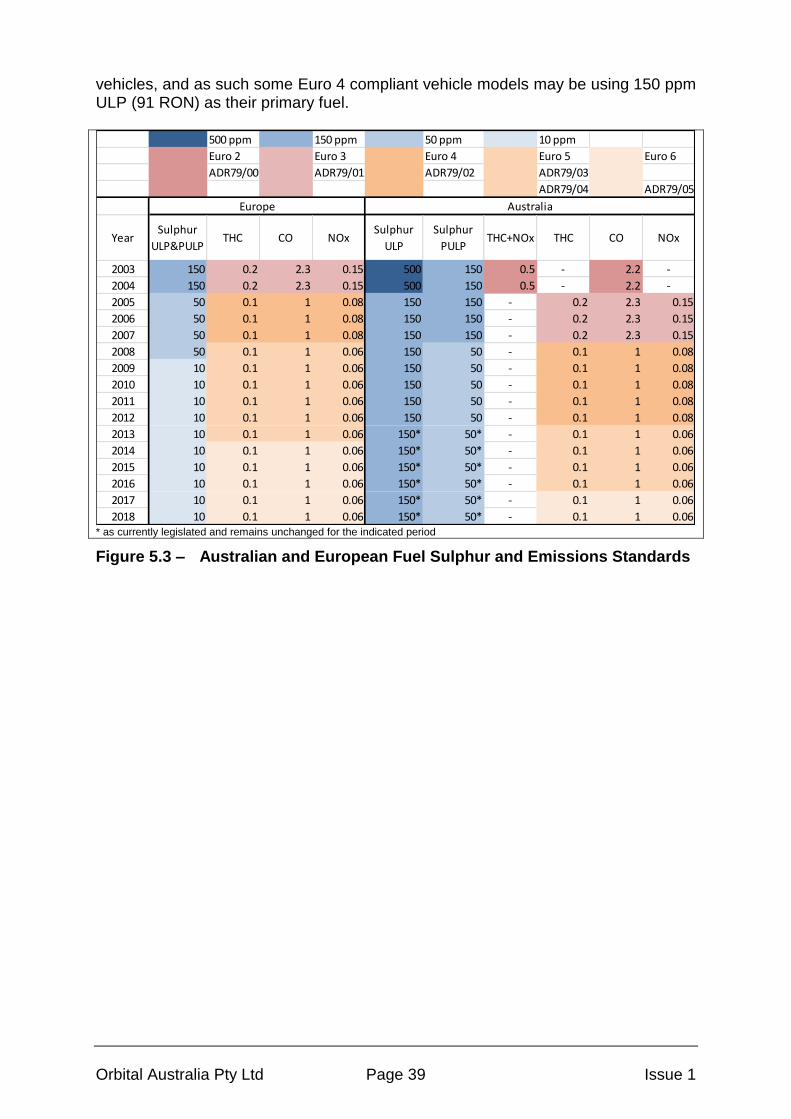
Orbital Australia Pty Ltd Page 39 Issue 1
vehicles, and as such some Euro 4 compliant vehicle models may be using 150 ppm ULP (91 RON) as their primary fuel.
500 ppm 150 ppm 50 ppm 10 ppm
Euro 2 Euro 3 Euro 4 Euro 5 Euro 6
ADR79/00 ADR79/01 ADR79/02 ADR79/03
ADR79/04 ADR79/05
YearSulphur
ULP&PULPTHC CO NOx
Sulphur
ULP
Sulphur
PULPTHC+NOx THC CO NOx
2003 150 0.2 2.3 0.15 500 150 0.5 - 2.2 -
2004 150 0.2 2.3 0.15 500 150 0.5 - 2.2 -
2005 50 0.1 1 0.08 150 150 - 0.2 2.3 0.15
2006 50 0.1 1 0.08 150 150 - 0.2 2.3 0.15
2007 50 0.1 1 0.08 150 150 - 0.2 2.3 0.15
2008 50 0.1 1 0.06 150 50 - 0.1 1 0.08
2009 10 0.1 1 0.06 150 50 - 0.1 1 0.08
2010 10 0.1 1 0.06 150 50 - 0.1 1 0.08
2011 10 0.1 1 0.06 150 50 - 0.1 1 0.08
2012 10 0.1 1 0.06 150 50 - 0.1 1 0.08
2013 10 0.1 1 0.06 150* 50* - 0.1 1 0.06
2014 10 0.1 1 0.06 150* 50* - 0.1 1 0.06
2015 10 0.1 1 0.06 150* 50* - 0.1 1 0.06
2016 10 0.1 1 0.06 150* 50* - 0.1 1 0.06
2017 10 0.1 1 0.06 150* 50* - 0.1 1 0.06
2018 10 0.1 1 0.06 150* 50* - 0.1 1 0.06
Europe Australia
* as currently legislated and remains unchanged for the indicated period
Figure 5.3 – Australian and European Fuel Sulphur and Emissions Standards

Orbital Australia Pty Ltd Page 40 Issue 1
6 SUMMARY OF INDUSTRY BODY VIEWPOINTS
The Fuel Policy Section of the Department of Sustainability, Environment, Water, Population and Communities (SEWPaC) asked the Fuel Standards Consultative Committee (a statutory advisory committee established under the Act) to identify a number of peak industry bodies that could provide information that may assist this study. In addition to references identified by the SEWPaC and Orbital, additional references were provided by members of both the Australian Institute of Petroleum (AIP) and the Federal Chamber of Automotive Industries (FCAI), including oil companies and automotive OEMs.
There were also a number of direct discussions with industry experts whose viewpoints were noted and are discussed below where considered relevant to this review. However, data which was considered proprietary and could not be made available in this study cannot be included in any conclusions drawn in this review.
6.1 Automotive Sector
6.1.1 World-Wide Fuel Charter
The World-Wide Fuel Charter15
(WWFC) provides proposed fuel standards for adoption around the world, and in its 5
th edition adds an additional category for US
2017 proposed Tier 3 standards. The document is proposed by a committee which represents automobile and engine manufacturers around the world. The WWFC proposes that a minimum sulphur level of 10 ppm is required in order to meet the legislative requirements of Euro 4, 5 and 6, and also makes the connection between low fuel sulphur and enablement of low CO2 technologies. The document cites the well-known literature studies and papers which support the view that low sulphur fuel is mandatory to achieve these emissions targets.
Key findings were:
Lower fuel sulphur will produce lower tailpipe emissions (all pollutants).
Ultra-low fuel sulphur will produce even lower tailpipe emissions than low sulphur.
High fuel sulphur levels will result in both a delay in catalyst light-off times and a reduction in efficiency.
High fuel sulphur levels can slow the rich to lean transition (of the oxygen sensor) thereby introducing a rich bias to the emission calibration.
Low and ultra-low fuel sulphur will enable vehicle manufacturers to advance technology offered for lowering CO2 emissions.
Operation on high fuel sulphur will affect OBD-II diagnostics and may lead to failure to properly report a failed catalyst.
Systems which employ NSR-type catalysts require low sulphur fuel to maintain high conversion efficiency. The type of systems which require an NSR-type catalyst are predominantly lean burn GDI and require essentially “sulphur free” fuels.

Orbital Australia Pty Ltd Page 41 Issue 1
6.1.2 Other Automotive OEM Viewpoints
The Euro 5/6 RIS16
details many of the industry viewpoints, the most consistent being that of technology enablement as a result of making petrol available with 10 ppm sulphur to the Australian market. The main reason for new technology is cited to be reduction in CO2 emissions, and without low sulphur fuel these technologies will struggle (or fail) to deliver the CO2 potential. The main technology identified by manufacturers, such as Mercedes-Benz, as requiring low sulphur fuels is lean burn GDI – without low sulphur the argument is fuel consumption and CO2 reductions will effectively be nullified by catalyst regeneration requirements. This view is also adequately covered by the WWFC – the document referenced by most OEMs contacted.
Toyota Australia did provide some summary data and opinion that their in-house testing indicated that with 50 ppm fuel sulphur (compared to 10 ppm) there was a 10-20% increase in 100,000 km aged emissions. When extrapolated to 160,000 km, NOx emissions did not exceed the Euro 5 level, but were not sufficiently under to satisfy legislative requirements due to vehicle-to-vehicle variability. Estimates for 150 ppm fuel sulphur indicated that NOx emissions would exceed regulatory limits.
The Euro 5/6 RIS16
also included a statement made by the FCAI that some manufacturers of Euro 5 vehicles are desensitising their OBD systems due to sulphur levels that are above 10 ppm. Clarification was sought from the FCAI, and the request for details circulated to members. One Australian OEM reported that given their current knowledge of the effects of sulphur on the oxygen storage capacity of a catalyst they did not foresee a reason to desensitise this aspect of their OBD system at this time.
Another concern expressed by one Australian automotive OEM was in relation to PM/PN emissions at Euro 6:
If a particle trap (particulate filter) is required to pass the PM/PN legislation, will the PM associated with high sulphur fuel (50 or 150 ppm) increase the requirement to purge the trap (due to PM build up increasing exhaust back pressure) leading to an increase in fuel consumption?
If such an issue arises will it be worse for vehicles which have operated on high sulphur fuel over a high mileage?
For diesel vehicles, it is widely accepted that low sulphur fuel is required for functional operation of particulate traps, therefore it seems reasonable to assume that the same would be true for petrol vehicles.
Without low sulphur fuel, there may be an issue for fault triggering (malfunction indicator lamp or MIL) events due to the particle trap prematurely clogging, or at best case, increased frequency of trap regeneration.
OEMs may seek for Euro 5 PM/PN legislation limits to be applied at Euro 6 if fuel sulphur level generates difficulty in meeting the Euro 6 legislated PM/PN limits.
This PM/PN aspect will be considered as part of this review, even though no specific technical data was found or provided. It should be noted that this concern only
Orbital Australia Pty Ltd Page 42 Issue 1
relates to the use of GDI technology, where a PM/PN limit is proposed as part of Euro 5/6.
6.2 Fuels Sector
6.2.1 Martec Study
The AIP provided research undertaken by the Martec Group. The Martec Group is a research and consulting company which produced a cost-benefit analysis report for the American Petroleum Institute in 2010 entitled “Technology Cost and Adoption Analysis: Impact of Ultra-Low Sulphur Gasoline Standards.
17” This document largely
represents the oil industry’s viewpoint on low sulphur fuel, with much of the argument centred on whether low sulphur fuel is needed for technology enablement, and whether the automotive industry trends identify which technology will be dominant in the future. The dominant driver for technology is assumed to be CO2 reduction, not other factors such as emission (pollutant) reduction or performance.
Key findings were:
In North America, lean GDI represents approximately 2% of the market and is predicted to be less than 5% in the future.
Countries where 10 ppm fuel is available do not have an increase in lean GDI engines in the market.
Fuel must be 10 ppm or less for lean GDI with passive Selective Catalytic Reduction (SCR) with LNT to work correctly. An increase from 10 ppm to 30 ppm would negate the CO2 benefit.
LNT catalyst technology cost is very variable due to links to global precious metal price.
Legislated fuel consumption improvements will be attained through alternative technologies such as vehicle mass reduction and engine stop/start.
OEM’s are dropping or withdrawing GDI+LNT in favour of other technologies including (and see also Appendix A):
o HCCI, which will provide the required CO2 benefit and become the dominant technology
o downsizing and turbo charging, which also provides the CO2 benefit
o stop/start
o hybrid technology
o six or more speed gearboxes.
High Efficiency Dilute Gasoline Engine (HEDGE) is promoted as an HCCI alternative, although it is currently experimental.
Figure 6.1 shows for the European market the indicative costs for technologies to achieve a unit change in CO2 emissions. The argument made is that there are more cost-effective technologies to achieve the CO2 objective than lean GDI and that is why its uptake has been slow. The lower cost options are all also – in the Martec
17
review – less reliant on fuel sulphur content.
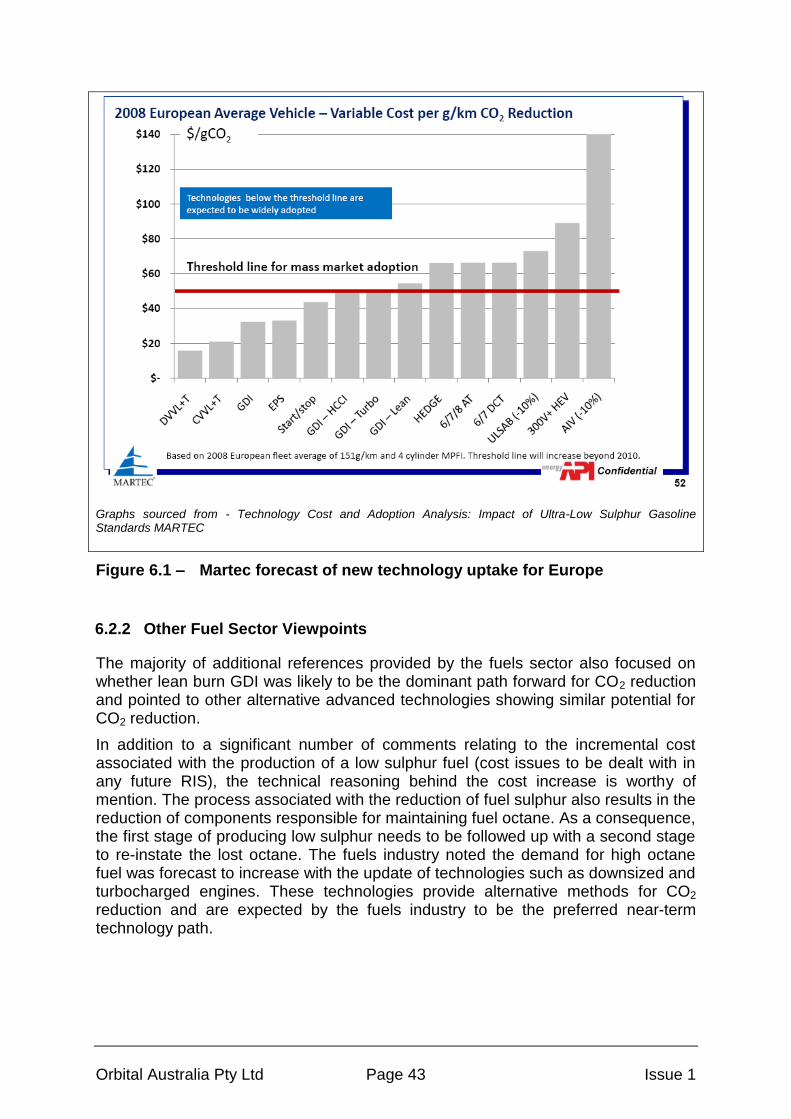
Orbital Australia Pty Ltd Page 43 Issue 1
Graphs sourced from - Technology Cost and Adoption Analysis: Impact of Ultra-Low Sulphur Gasoline Standards MARTEC
Figure 6.1 – Martec forecast of new technology uptake for Europe
6.2.2 Other Fuel Sector Viewpoints
The majority of additional references provided by the fuels sector also focused on whether lean burn GDI was likely to be the dominant path forward for CO2 reduction and pointed to other alternative advanced technologies showing similar potential for CO2 reduction.
In addition to a significant number of comments relating to the incremental cost associated with the production of a low sulphur fuel (cost issues to be dealt with in any future RIS), the technical reasoning behind the cost increase is worthy of mention. The process associated with the reduction of fuel sulphur also results in the reduction of components responsible for maintaining fuel octane. As a consequence, the first stage of producing low sulphur needs to be followed up with a second stage to re-instate the lost octane. The fuels industry noted the demand for high octane fuel was forecast to increase with the update of technologies such as downsized and turbocharged engines. These technologies provide alternative methods for CO2 reduction and are expected by the fuels industry to be the preferred near-term technology path.
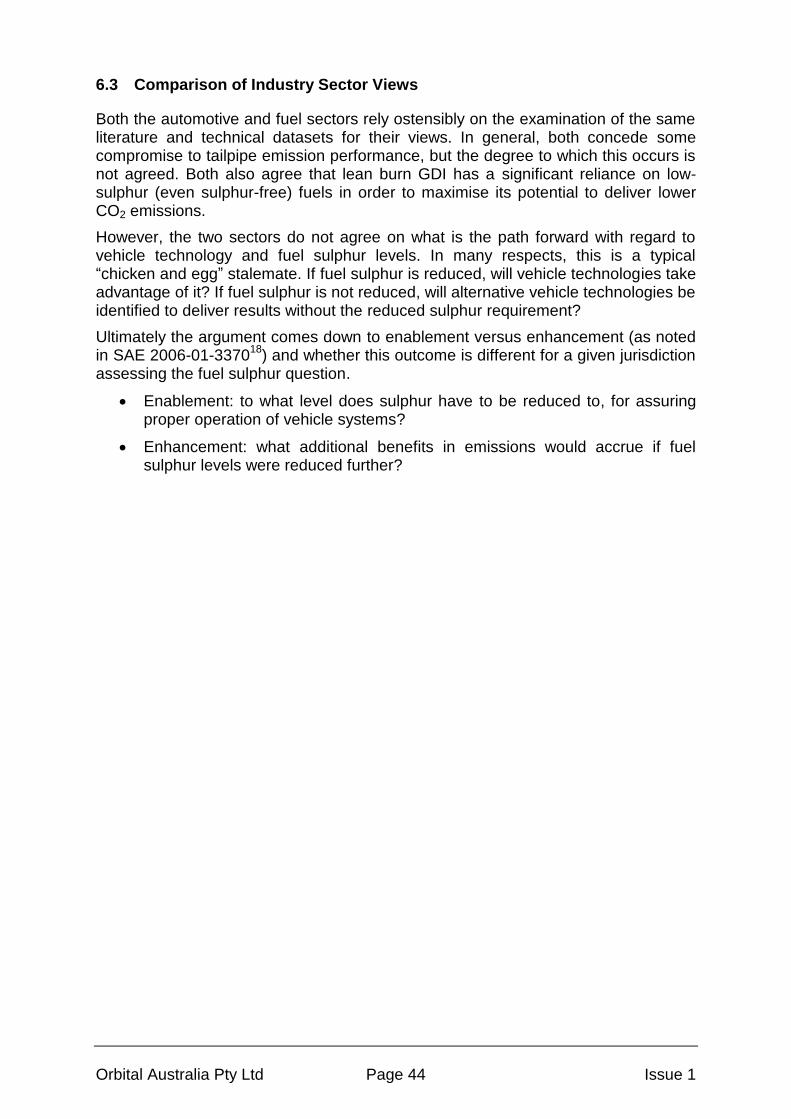
Orbital Australia Pty Ltd Page 44 Issue 1
6.3 Comparison of Industry Sector Views
Both the automotive and fuel sectors rely ostensibly on the examination of the same literature and technical datasets for their views. In general, both concede some compromise to tailpipe emission performance, but the degree to which this occurs is not agreed. Both also agree that lean burn GDI has a significant reliance on low-sulphur (even sulphur-free) fuels in order to maximise its potential to deliver lower CO2 emissions.
However, the two sectors do not agree on what is the path forward with regard to vehicle technology and fuel sulphur levels. In many respects, this is a typical “chicken and egg” stalemate. If fuel sulphur is reduced, will vehicle technologies take advantage of it? If fuel sulphur is not reduced, will alternative vehicle technologies be identified to deliver results without the reduced sulphur requirement?
Ultimately the argument comes down to enablement versus enhancement (as noted in SAE 2006-01-3370
18) and whether this outcome is different for a given jurisdiction
assessing the fuel sulphur question.
Enablement: to what level does sulphur have to be reduced to, for assuring proper operation of vehicle systems?
Enhancement: what additional benefits in emissions would accrue if fuel sulphur levels were reduced further?
Orbital Australia Pty Ltd Page 45 Issue 1
7 LITERATURE REVIEW – IMPACTS OF FUEL SULPHUR
Orbital has undertaken an extensive literature review including the main RISs, and their submissions, industry body viewpoints noted in Section 6 (including the technical papers referenced and additional papers provided by industry individuals contacted by SEWPaC through the FCAI or AIP), and a range of other independently sourced technical papers.
This section summarises the key points from the most relevant literature. For ease of reference, key figures and tables have been replicated in this review and their source acknowledged.
7.1 Regulated Tailpipe Emissions
TWCs have been the dominant technology for reducing tailpipe emissions and indications are that they will continue to play a major role for GDI engines, downsized turbo charged engines and future technologies which may be adopted such as HCCI engines. Lean NOx trap catalysts have had limited market penetration to date, even in Europe despite the availability of low sulphur fuel to support the technology.
The behaviour of catalysts in response to sulphur was investigated in depth during the period from 1991 to 2010. During this period the sulphur content of fuel was being reviewed in Europe and the US and was undergoing the largest legislated reductions. At this time, some of the largest reductions in legislated emissions were also occurring. It is clear that a peak in catalyst development with regard to sulphur response occurred during this time. Precious metals such as palladium (Pd) were introduced to allow close-coupling of the catalyst to achieve the emissions targets. However, Pd showed susceptibility to sulphur poisoning.
Since the introduction of 10 ppm sulphur fuel in Europe and 30 ppm (average) sulphur fuel in the US, very few new papers have examined the response of catalysts to sulphur.
This section provides a summary of the key sulphur studies carried out since one of the first studies conducted in 1991 to the latest one found in 2011. Much of the focus is on vehicle results with TWC systems fitted. It is widely acknowledged and accepted that the update of lean NOx trap catalysts will require low sulphur fuel and as such it is considered unnecessary to detail this in the literature review.
The majority of the studies identified investigate the performance of the catalyst and sensitivity to sulphur to short-term exposure. There are some papers which also examine short-term exposure on high mileage (or aged) systems. Fewer still were found to examine sustained long-term exposure to different sulphur level fuels, including reversibility – in particular whether reversibility will sufficiently occur in real world driving, is considered an important input to whether the effects of fuel sulphur changes on infield emissions can be maintained.
7.1.1 SAE 912323: Effects of Gasoline Sulphur Level on Mass Exhaust
Emissions
In this study (also commonly referred to as the Auto/Oil Air Quality Improvement Research Program (AQIRP)), a fleet of 10 1989 model year (MY) US vehicles were

Orbital Australia Pty Ltd Page 46 Issue 1
tested over the Federal Test Procedure (FTP) cycle on two fuels containing 49 and 466 ppm sulphur. No catalyst ageing studies occurred. Testing used micro-sequences to establish the individual effects of transition from low-to-high-to-low sulphur and conversely from high-to-low-to-high sulphur. This sequencing allowed information about reversibility to be assessed by examining if the results with the low sulphur fuel were repeated after a transition to high sulphur fuel and back to low sulphur fuel.
Fleet average emissions were observed to increase with increasing sulphur by the following amounts: HC 16%, CO 12.9% and NOx 9%. Reversibility from the effects of high sulphur fuel was demonstrated. Figure 7.1 and Figure 7.2 show the sulphur response by vehicle for THC, CO and NOx and also demonstrate reversibility.
In summary:
All pollutant emissions increased with increasing sulphur in the test fuel.
Reversibility was demonstrated after excursions from low to high to low sulphur fuel.
Orbital Australia Pty Ltd Page 47 Issue 1
Graphs sourced from - SAE 912323 Effects of Gasoline Sulphur Level on Mass Exhaust Emissions, figures 4 and 5 Note: due to the age of this paper, its print quality is limited to this SAE provided quality.
Figure 7.1 – SAE 912323: HC and CO Response to Sulphur by Vehicle

Orbital Australia Pty Ltd Page 48 Issue 1
Graphs sourced from - SAE 912323 Effects of Gasoline Sulphur Level on Mass Exhaust Emissions, figure 6 Note: due to the age of this paper, its print quality is limited to this SAE provided quality.
Figure 7.2 – SAE 912323: NOx Response to Sulphur by Vehicle
7.1.2 SAE 920558: Fuel Sulphur Effects on Automotive Catalyst Performance
The study used platinum/rhodium (Pt/Rh), palladium/rhodium (Pd/Rh) and palladium (Pd) catalyst formulations. The different catalyst formulations had different emissions responses. On low sulphur fuel (14 ppm) Pd-containing formulations had better conversion efficiency for HC during rich light-off periods than Pt/Rh, while the Pd CO and NOx responses were similar to Pt/Rh. When stoichiometry is maintained, the Pd catalyst was similar to the Pt/Rh catalyst. However, as sulphur increases the rich performance (ability to reduce NOx) is degraded compared to the Pt/Rh formulation.
The largest increase in emissions was observed between 14 and 500 ppm sulphur with the result levelling off for any further increase in sulphur ppm. For vehicle testing using the 14 ppm sulphur aged catalyst, emissions increased by a small amount for HC and CO but increased by a significant amount for NOx. Oddly, there was no vehicle testing of the catalysts which were aged on 6,000 ppm sulphur fuel. However, vehicle testing was conducted on the catalysts which were aged on 14 ppm sulphur fuel. Figure 7.3 and Figure 7.4 show the sulphur response under steady-state engine dynamometer testing for the three different catalyst formulations for THC, CO and NOx when operating in stoichiometric conditions.
In summary:
Different formulations of Pd, Pt and Rh exhibited different responses to increasing sulphur level which are also dependent on the target lambda.
HC emissions increased by a small amount due to increasing sulphur while CO and NOx exhibited a larger increase.

Orbital Australia Pty Ltd Page 49 Issue 1
The NOx response of the Pd catalyst was worse than that of the Pt/Ph and Pd/Rh catalysts but only at sulphur levels beyond the interest of this review.
Overall the largest change in emissions was observed for sulphur changes between 14 and 500 ppm with the greatest change occurring between 14 and 90 ppm. The data became flat (i.e. no further changes) above 500 ppm.
Graphs sourced from - SAE 920558 Fuel Sulphur Effects on Automotive Catalyst Performance, figures 1 and 2 Note: due to the age of this paper, its print quality is limited to this SAE provided quality.
Figure 7.3 – SAE 920558: HC, CO, NOx Response to Fuel Sulphur for Pt/Rh
and Pd/Rh catalysts
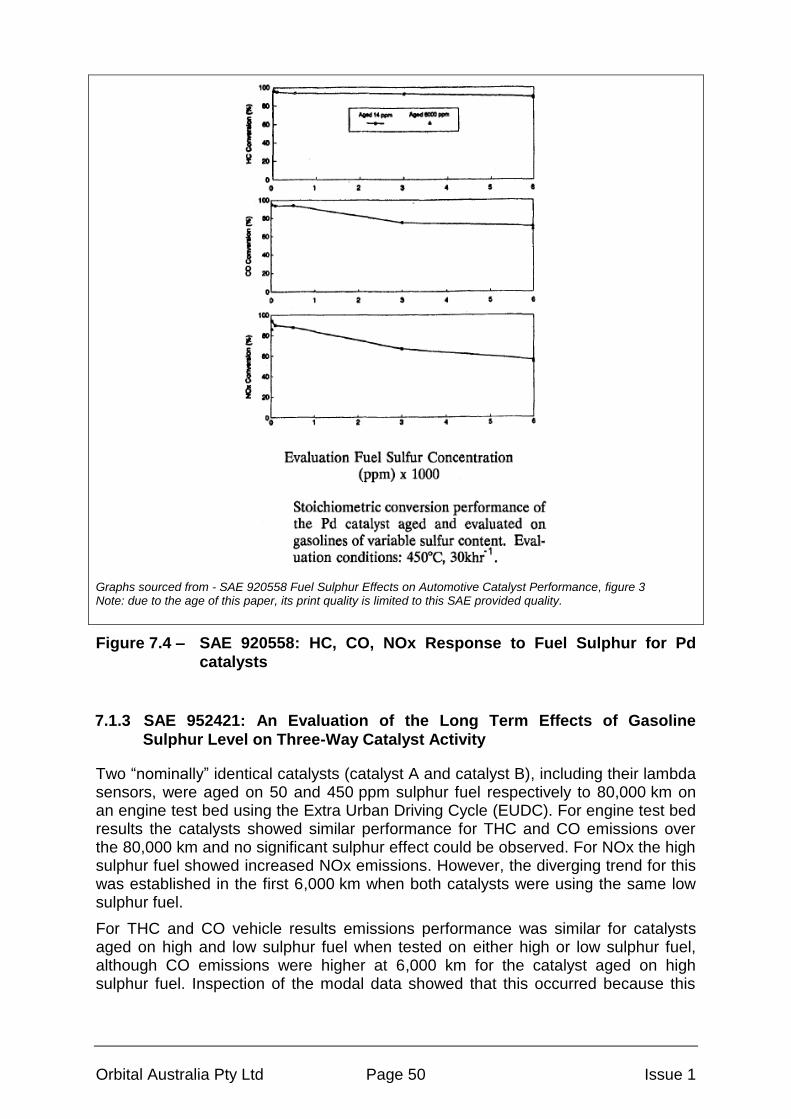
Orbital Australia Pty Ltd Page 50 Issue 1
Graphs sourced from - SAE 920558 Fuel Sulphur Effects on Automotive Catalyst Performance, figure 3 Note: due to the age of this paper, its print quality is limited to this SAE provided quality.
Figure 7.4 – SAE 920558: HC, CO, NOx Response to Fuel Sulphur for Pd
catalysts
7.1.3 SAE 952421: An Evaluation of the Long Term Effects of Gasoline
Sulphur Level on Three-Way Catalyst Activity
Two “nominally” identical catalysts (catalyst A and catalyst B), including their lambda sensors, were aged on 50 and 450 ppm sulphur fuel respectively to 80,000 km on an engine test bed using the Extra Urban Driving Cycle (EUDC). For engine test bed results the catalysts showed similar performance for THC and CO emissions over the 80,000 km and no significant sulphur effect could be observed. For NOx the high sulphur fuel showed increased NOx emissions. However, the diverging trend for this was established in the first 6,000 km when both catalysts were using the same low sulphur fuel.
For THC and CO vehicle results emissions performance was similar for catalysts aged on high and low sulphur fuel when tested on either high or low sulphur fuel, although CO emissions were higher at 6,000 km for the catalyst aged on high sulphur fuel. Inspection of the modal data showed that this occurred because this
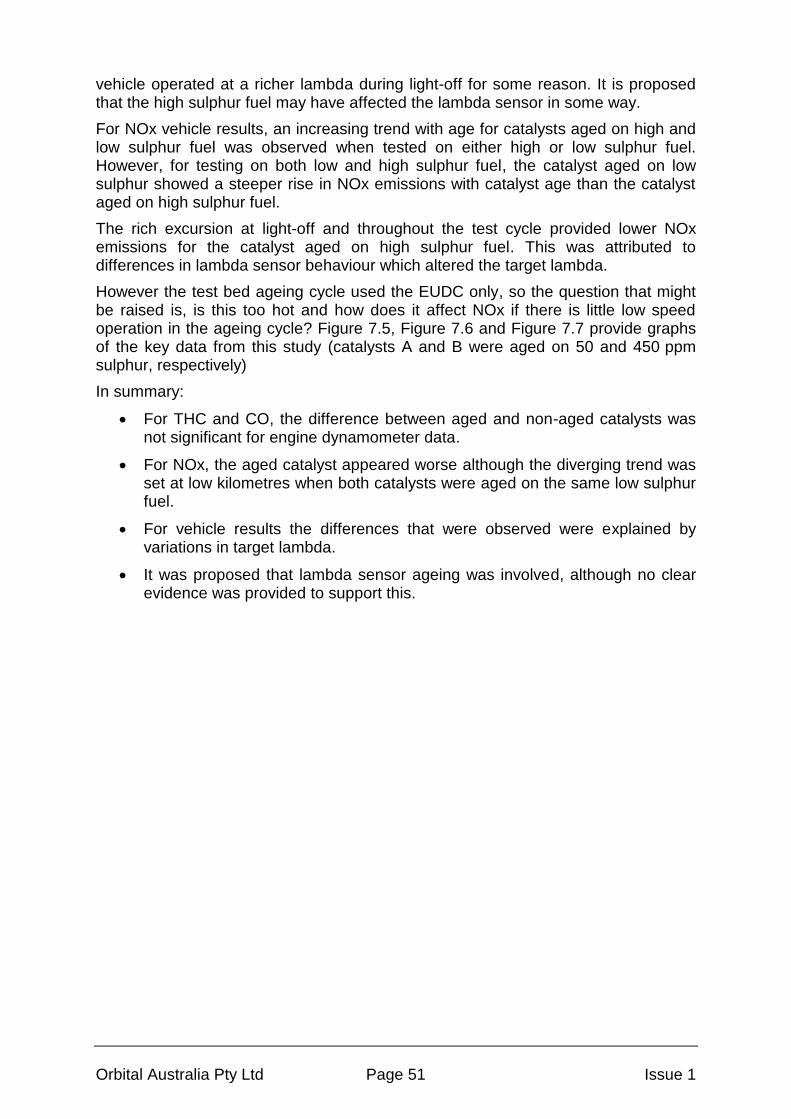
Orbital Australia Pty Ltd Page 51 Issue 1
vehicle operated at a richer lambda during light-off for some reason. It is proposed that the high sulphur fuel may have affected the lambda sensor in some way.
For NOx vehicle results, an increasing trend with age for catalysts aged on high and low sulphur fuel was observed when tested on either high or low sulphur fuel. However, for testing on both low and high sulphur fuel, the catalyst aged on low sulphur showed a steeper rise in NOx emissions with catalyst age than the catalyst aged on high sulphur fuel.
The rich excursion at light-off and throughout the test cycle provided lower NOx emissions for the catalyst aged on high sulphur fuel. This was attributed to differences in lambda sensor behaviour which altered the target lambda.
However the test bed ageing cycle used the EUDC only, so the question that might be raised is, is this too hot and how does it affect NOx if there is little low speed operation in the ageing cycle? Figure 7.5, Figure 7.6 and Figure 7.7 provide graphs of the key data from this study (catalysts A and B were aged on 50 and 450 ppm sulphur, respectively)
In summary:
For THC and CO, the difference between aged and non-aged catalysts was not significant for engine dynamometer data.
For NOx, the aged catalyst appeared worse although the diverging trend was set at low kilometres when both catalysts were aged on the same low sulphur fuel.
For vehicle results the differences that were observed were explained by variations in target lambda.
It was proposed that lambda sensor ageing was involved, although no clear evidence was provided to support this.
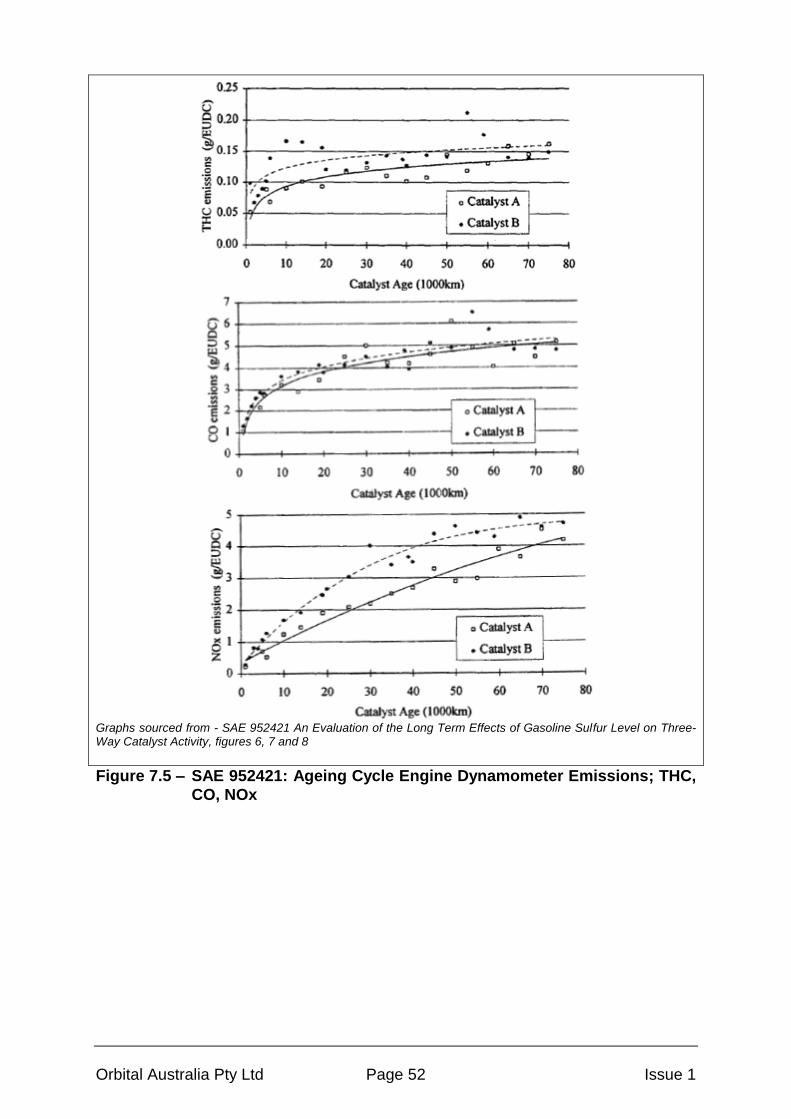
Orbital Australia Pty Ltd Page 52 Issue 1
Graphs sourced from - SAE 952421 An Evaluation of the Long Term Effects of Gasoline Sulfur Level on Three-Way Catalyst Activity, figures 6, 7 and 8
Figure 7.5 – SAE 952421: Ageing Cycle Engine Dynamometer Emissions; THC,
CO, NOx
Orbital Australia Pty Ltd Page 53 Issue 1
Graphs sourced from - SAE 952421 An Evaluation of the Long Term Effects of Gasoline Sulfur Level on Three-Way Catalyst Activity, figures 9, 10, 11 and 12 (top figures 50ppm sulphur fuel, bottom figures 450ppm sulphur fuel)
Figure 7.6 – SAE 952421: Vehicle Emissions; THC and NMHC

Orbital Australia Pty Ltd Page 54 Issue 1
Graphs sourced from - SAE 952421 An Evaluation of the Long Term Effects of Gasoline Sulfur Level on Three-Way Catalyst Activity, figures 13, 14, 15 and 16 (top figures 50ppm S fuel, bottom figures 450ppm S fuel)
Figure 7.7 – SAE 952421: Vehicle Emissions; CO and NOx
7.1.4 SAE 982726: Effect of Fuel Sulphur on Emissions in California Low
Emissions Vehicles
Aged and non-aged catalysts were studied and a rise in emissions occurred for both catalysts as sulphur level was increased from 30 to 630 ppm. The rise was linear for non-aged catalysts and for aged catalysts it was more rapid for increases in sulphur at low sulphur levels and flattened off for sulphur increases at higher sulphur levels. However, significant variability in these trends was observed from vehicle to vehicle. The NOx response to sulphur content was greatest while response curves for HC and CO were flatter. Catalyst ageing was conducted artificially (i.e. through the application of elevated exhaust temperatures using an engine dynamometer or by baking in an oven). There is no statement in the paper regarding the fuel sulphur level used for catalyst ageing.
The sulphur effects observed for Californian Reformulated Gasoline (CaRFG) 27 and 148 ppm sulphur were similar to those observed on regular gasoline at 30 and 150 ppm. Figure 7.8 and Figure 7.9 provide graphs of the key data from this study.
In summary:
Fleet emission response to sulphur showed an increase in emissions with increasing sulphur ppm.
The emission response to sulphur was linear for non-aged catalysts and linear for aged catalysts (greater sensitivity at lower fuel sulphur ppm).
Orbital Australia Pty Ltd Page 55 Issue 1
The emission response was greater at low sulphur ppm than at high sulphur ppm for aged catalysts.
There was significant variation from vehicle to vehicle in the gradient of the response curve for both aged and non-aged catalyst datasets.
The effects observed for CaRFG 27 and 148 ppm sulphur fuels were similar to those observed on regular gasoline at 30 and 150 ppm.
From 30 to 630 ppm, the fleet average increase in emissions was CO 51%, NOx 62% and NMHC 39%.
Data for responses from 30 to 150 ppm fuel sulphur is of interest for this review.

Orbital Australia Pty Ltd Page 56 Issue 1
Graphs sourced from - SAE 982726 Effect of fuel sulfur on emissions in California low emissions vehicles, figure 2 Note: 100K = 100, 000 miles (160, 934 km).
Figure 7.8 – SAE 982726: FTP Fleet Average Emissions Response to Fuel
Sulphur
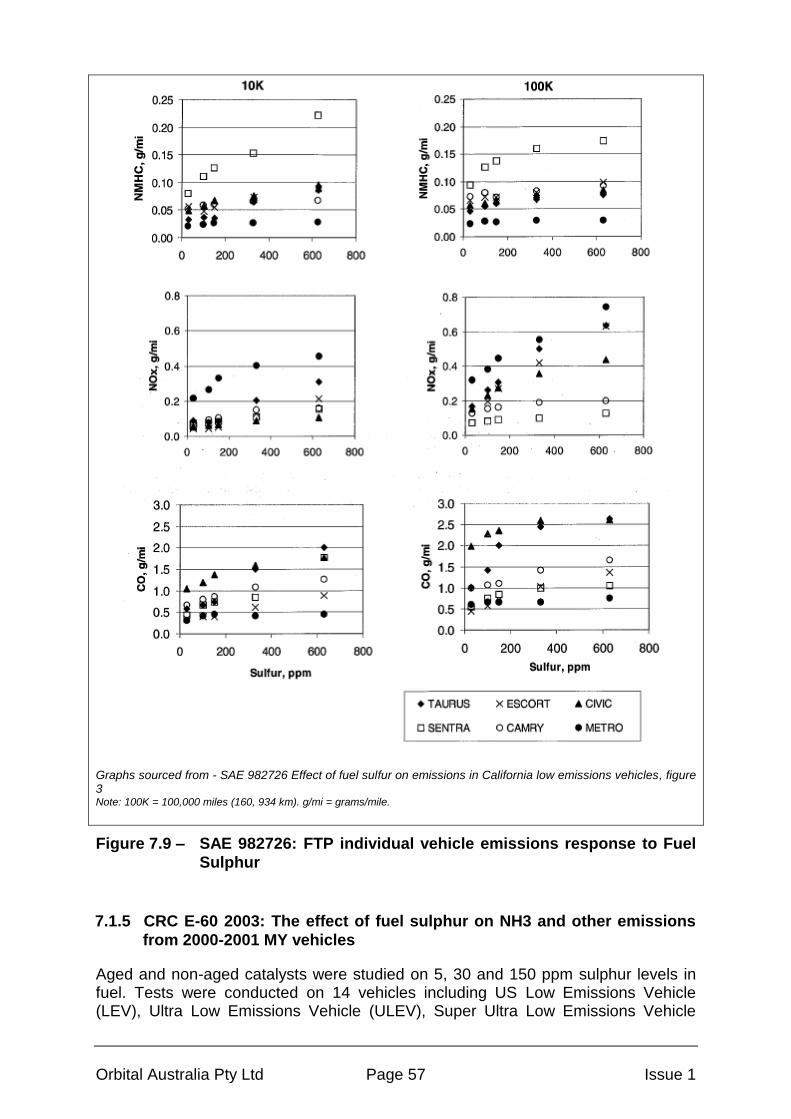
Orbital Australia Pty Ltd Page 57 Issue 1
Graphs sourced from - SAE 982726 Effect of fuel sulfur on emissions in California low emissions vehicles, figure 3 Note: 100K = 100,000 miles (160, 934 km). g/mi = grams/mile.
Figure 7.9 – SAE 982726: FTP individual vehicle emissions response to Fuel
Sulphur
7.1.5 CRC E-60 2003: The effect of fuel sulphur on NH3 and other emissions
from 2000-2001 MY vehicles
Aged and non-aged catalysts were studied on 5, 30 and 150 ppm sulphur levels in fuel. Tests were conducted on 14 vehicles including US Low Emissions Vehicle (LEV), Ultra Low Emissions Vehicle (ULEV), Super Ultra Low Emissions Vehicle

Orbital Australia Pty Ltd Page 58 Issue 1
(SULEV) and EU Euro 3. Catalyst ageing was undertaken by accelerated methods and conducted on 0 ppm sulphur fuel.
Over the FTP cycle (see Figure 7.10) NOx and CO increased with increasing sulphur although the change in CO was minimal. NMHC did not show a significant change. The emission response to sulphur content for aged and non-aged catalysts was similar for NMHC and CO, but the aged catalysts showed an increased level of NOx emissions at 150 ppm. Over the Supplemental Federal Test Procedure (US06) (see Figure 7.11) all of the emissions increased with increasing sulphur, although the change in NMHC was minimal.
The average results for 5 ppm on occasion follow the trend indicated by the 30 to 150 ppm results, but because the vehicle test fleet included a range of LEV, ULEV and SULEV vehicles there is a sensitivity present, often related to vehicle choice rather than fuel sulphur level. Closer examination of individual vehicle results shows for the FTP pre-conditioning cycle most vehicles showed no difference in result between 5 and 30 ppm sulphur fuels, and the average trend line was dominated by select vehicles.
In summary:
Fleet emission response to fuel sulphur over the FTP cycle showed increasing NOx and CO emissions with increasing sulphur concentration, although the gradient was shallow.
Fleet emission response to fuel sulphur over the FTP cycle showed no change in NMHC with increasing sulphur concentration.
This dataset also included N2O emissions separate from NOx emissions. N2O is a greenhouse gas component. The trend followed that of NOx, though at a shallower sensitivity. This is not surprising, although the N2O:NOx ratio for an individual vehicle will be dependent on the catalyst formulation, specifically the ratio of Pt and Pd precious metals
19.
Data for emission responses for fuel sulphur from 30 to 150 ppm is of most interest and considered reliable for consideration in this review. The 5 ppm test data was considered inconsistent.
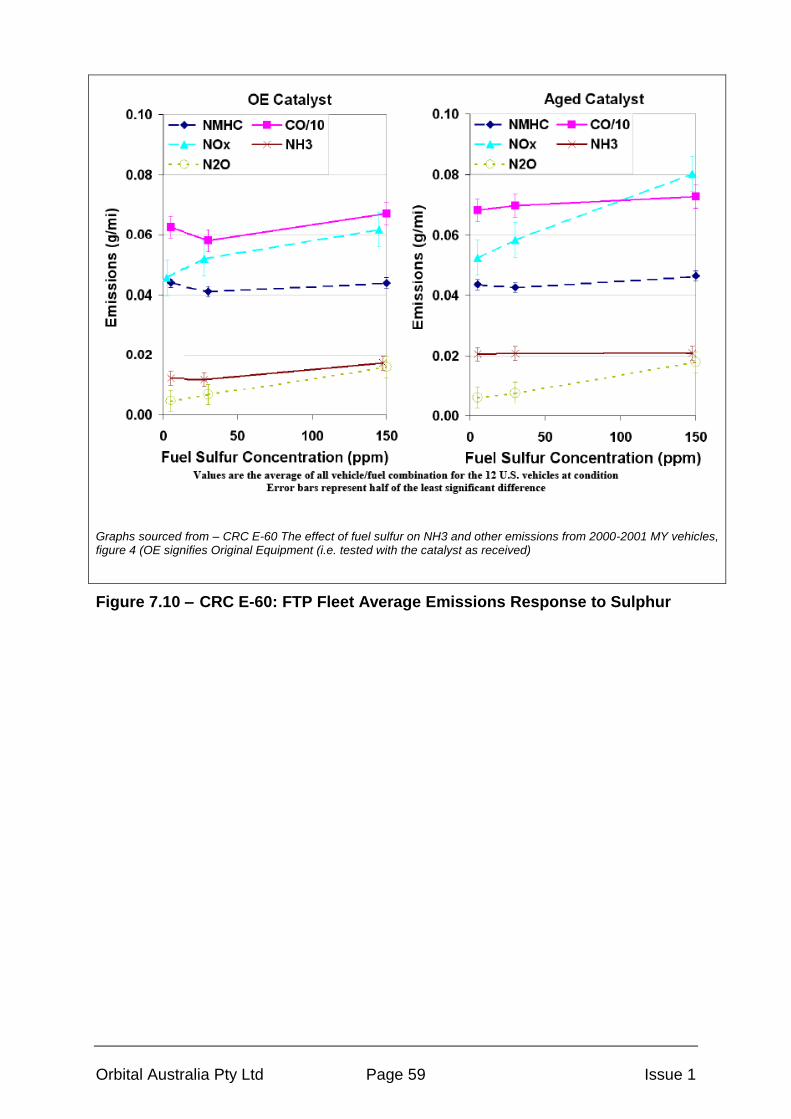
Orbital Australia Pty Ltd Page 59 Issue 1
Graphs sourced from – CRC E-60 The effect of fuel sulfur on NH3 and other emissions from 2000-2001 MY vehicles, figure 4 (OE signifies Original Equipment (i.e. tested with the catalyst as received)
Figure 7.10 – CRC E-60: FTP Fleet Average Emissions Response to Sulphur

Orbital Australia Pty Ltd Page 60 Issue 1
Graphs sourced from – CRC E-60 The effect of fuel sulphur on NH3 and other emissions from 2000-2001 MY vehicles, figure 18 (OE signifies Original Equipment (i.e. tested with the catalyst as received)
Figure 7.11 – CRC E-60: US06 Fleet Average Emissions Response Sulphur
7.1.6 SAE 2005-01-1113: The Impact of Sulphur Poisoning on NOx-Storage
Catalysts in Gasoline Applications
In this study the effects of sulphur poisoning on a lean NOx trap catalyst were examined. The study was conducted by a catalyst manufacturer and focuses on engine bench testing. The catalyst was exposed to fuel with 119 ppm sulphur for defined periods at 390
oC and 510
oC to achieve a loading of 4 g of sulphur under
constant lean conditions (these conditions would not be experienced in a λ=1 application, and even in real world driving some level of λ=1 operation is likely to be incurred). Cores were then taken from the catalyst and desulphated on a synthetic exhaust gas bench which measures the SO2, H2S and COS.
Sulphur was found to be released from the catalyst when sulphur exposure had occurred at 390
oC, but exposure at 510
oC resulted in less than half of the sulphur
being released during desulphurisation. Aged catalysts were used as a control.
In summary:
The study concluded that sulphur poisoning occurs under lean conditions and moderate temperatures, but not at higher temperatures and rich conditions. However, these lean operating conditions are unlikely to occur on stoichiometric applications.
The study concluded that up to 50% reduction in NOx storage occurred but only on substrate located on the inlet side of the first brick of the catalyst as
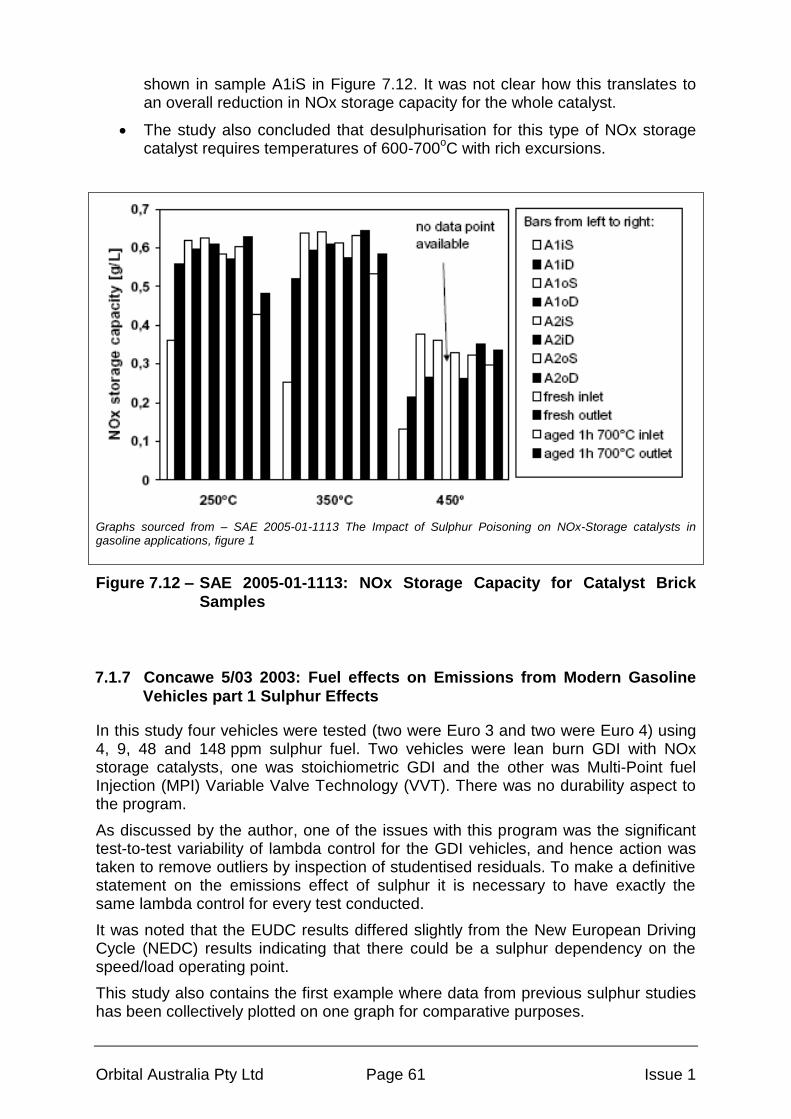
Orbital Australia Pty Ltd Page 61 Issue 1
shown in sample A1iS in Figure 7.12. It was not clear how this translates to an overall reduction in NOx storage capacity for the whole catalyst.
The study also concluded that desulphurisation for this type of NOx storage catalyst requires temperatures of 600-700
oC with rich excursions.
Graphs sourced from – SAE 2005-01-1113 The Impact of Sulphur Poisoning on NOx-Storage catalysts in gasoline applications, figure 1
Figure 7.12 – SAE 2005-01-1113: NOx Storage Capacity for Catalyst Brick
Samples
7.1.7 Concawe 5/03 2003: Fuel effects on Emissions from Modern Gasoline
Vehicles part 1 Sulphur Effects
In this study four vehicles were tested (two were Euro 3 and two were Euro 4) using 4, 9, 48 and 148 ppm sulphur fuel. Two vehicles were lean burn GDI with NOx storage catalysts, one was stoichiometric GDI and the other was Multi-Point fuel Injection (MPI) Variable Valve Technology (VVT). There was no durability aspect to the program.
As discussed by the author, one of the issues with this program was the significant test-to-test variability of lambda control for the GDI vehicles, and hence action was taken to remove outliers by inspection of studentised residuals. To make a definitive statement on the emissions effect of sulphur it is necessary to have exactly the same lambda control for every test conducted.
It was noted that the EUDC results differed slightly from the New European Driving Cycle (NEDC) results indicating that there could be a sulphur dependency on the speed/load operating point.
This study also contains the first example where data from previous sulphur studies has been collectively plotted on one graph for comparative purposes.
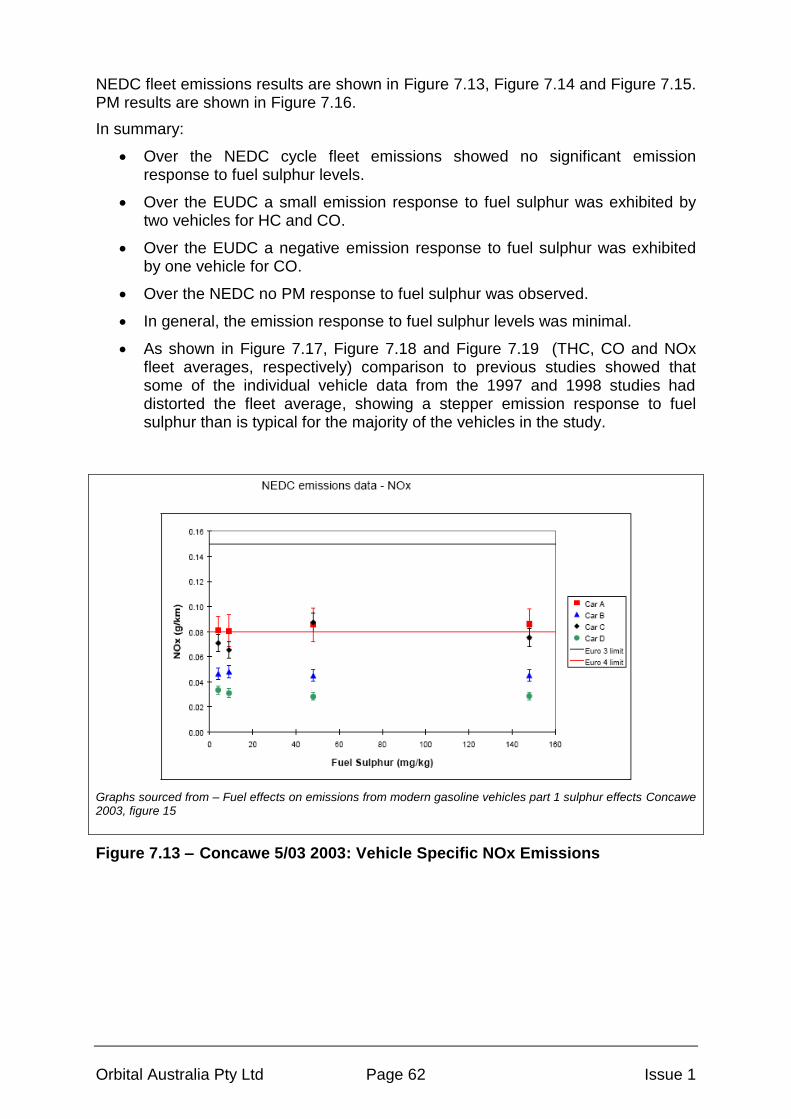
Orbital Australia Pty Ltd Page 62 Issue 1
NEDC fleet emissions results are shown in Figure 7.13, Figure 7.14 and Figure 7.15. PM results are shown in Figure 7.16.
In summary:
Over the NEDC cycle fleet emissions showed no significant emission response to fuel sulphur levels.
Over the EUDC a small emission response to fuel sulphur was exhibited by two vehicles for HC and CO.
Over the EUDC a negative emission response to fuel sulphur was exhibited by one vehicle for CO.
Over the NEDC no PM response to fuel sulphur was observed.
In general, the emission response to fuel sulphur levels was minimal.
As shown in Figure 7.17, Figure 7.18 and Figure 7.19 (THC, CO and NOx fleet averages, respectively) comparison to previous studies showed that some of the individual vehicle data from the 1997 and 1998 studies had distorted the fleet average, showing a stepper emission response to fuel sulphur than is typical for the majority of the vehicles in the study.
Graphs sourced from – Fuel effects on emissions from modern gasoline vehicles part 1 sulphur effects Concawe 2003, figure 15
Figure 7.13 – Concawe 5/03 2003: Vehicle Specific NOx Emissions
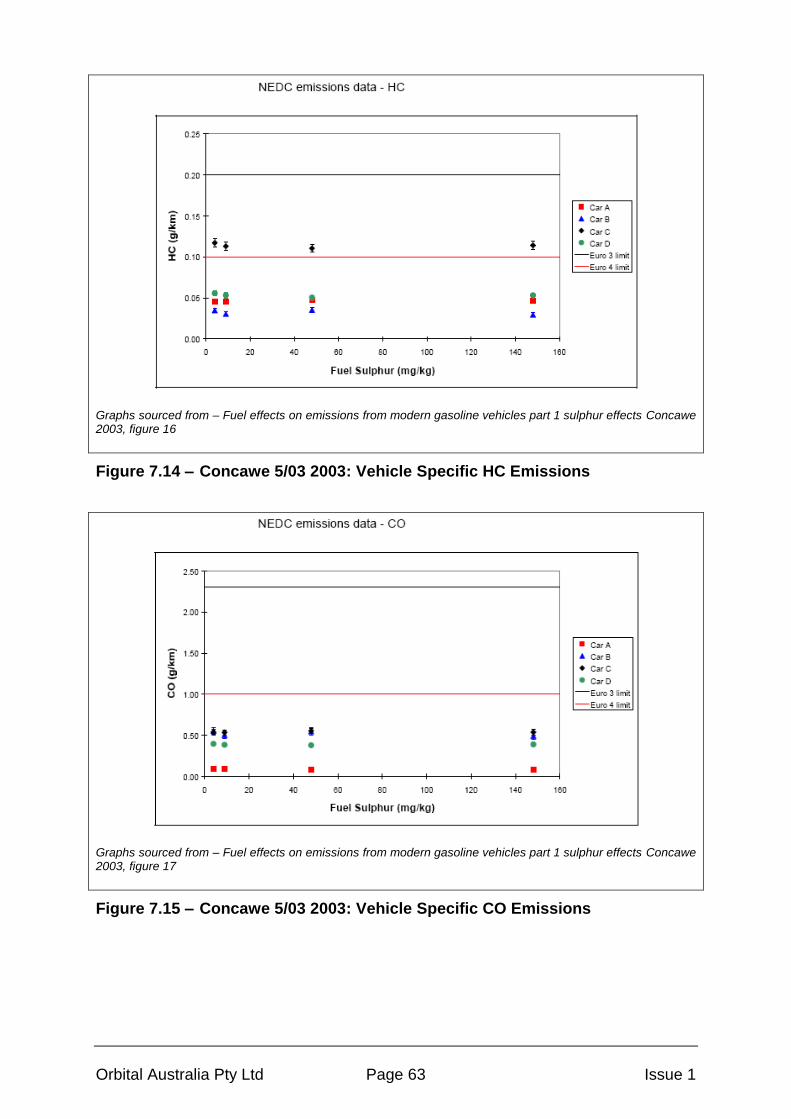
Orbital Australia Pty Ltd Page 63 Issue 1
Graphs sourced from – Fuel effects on emissions from modern gasoline vehicles part 1 sulphur effects Concawe 2003, figure 16
Figure 7.14 – Concawe 5/03 2003: Vehicle Specific HC Emissions
Graphs sourced from – Fuel effects on emissions from modern gasoline vehicles part 1 sulphur effects Concawe 2003, figure 17
Figure 7.15 – Concawe 5/03 2003: Vehicle Specific CO Emissions
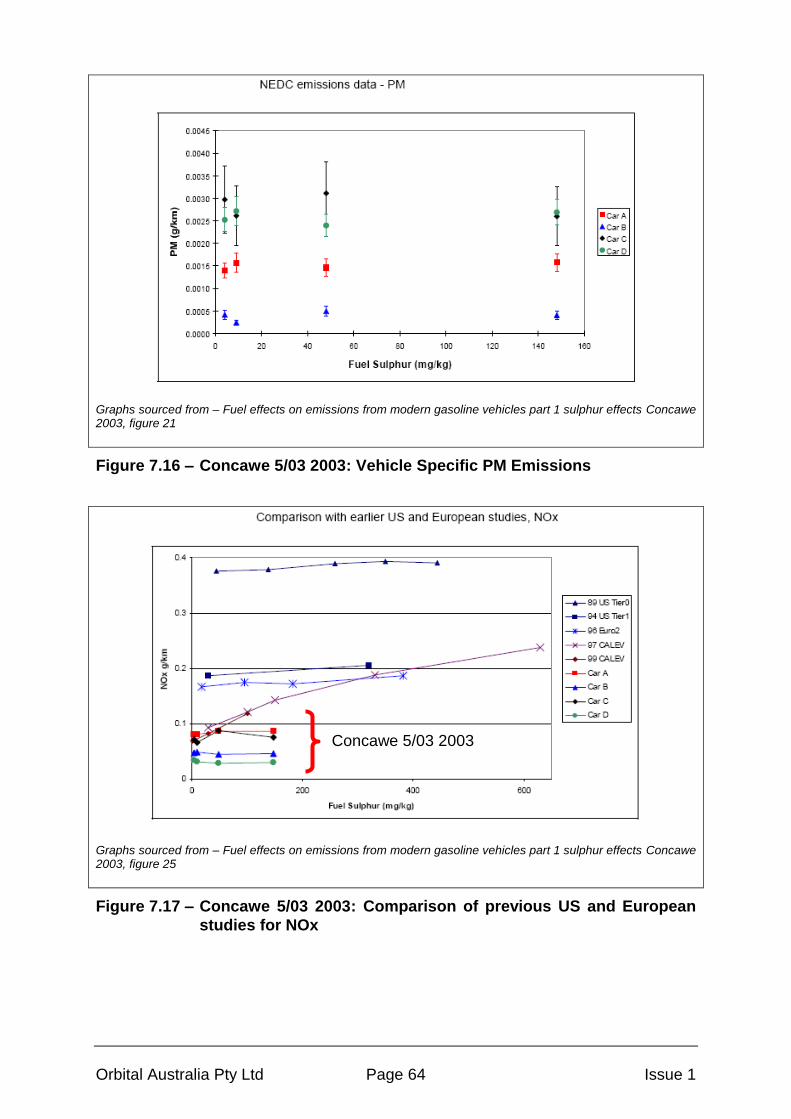
Orbital Australia Pty Ltd Page 64 Issue 1
Graphs sourced from – Fuel effects on emissions from modern gasoline vehicles part 1 sulphur effects Concawe 2003, figure 21
Figure 7.16 – Concawe 5/03 2003: Vehicle Specific PM Emissions
Graphs sourced from – Fuel effects on emissions from modern gasoline vehicles part 1 sulphur effects Concawe 2003, figure 25
Figure 7.17 – Concawe 5/03 2003: Comparison of previous US and European
studies for NOx
Concawe 5/03 2003
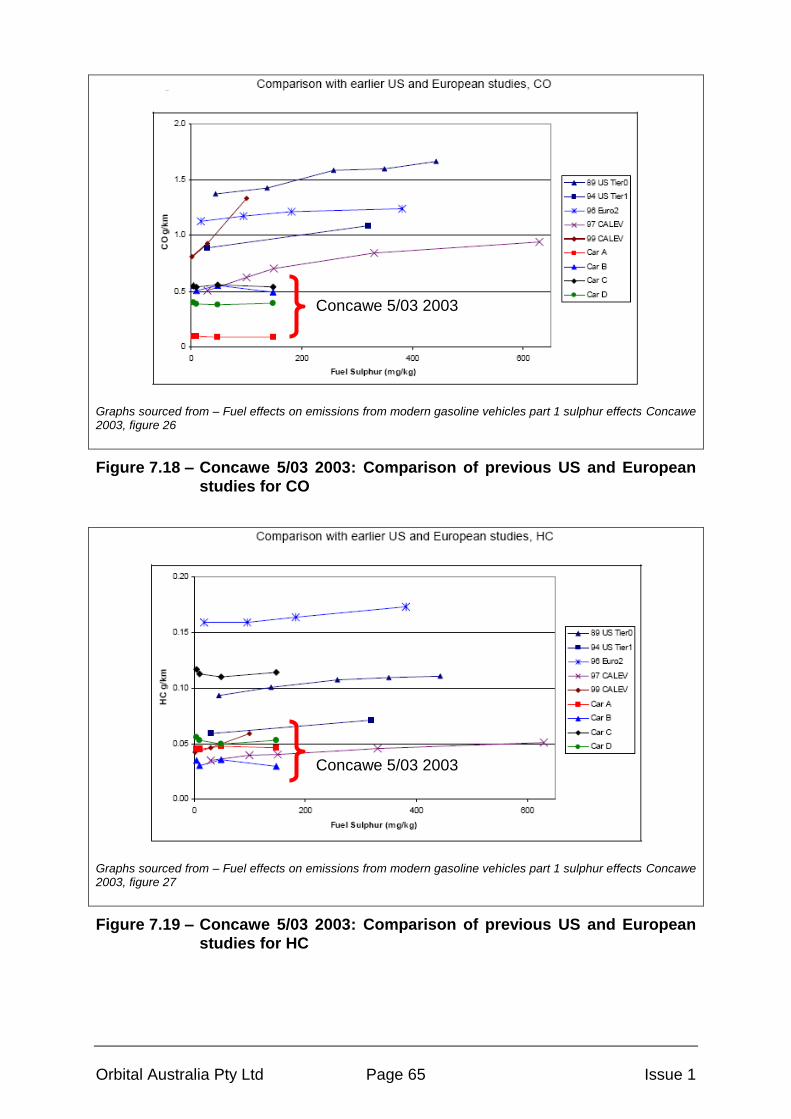
Orbital Australia Pty Ltd Page 65 Issue 1
Graphs sourced from – Fuel effects on emissions from modern gasoline vehicles part 1 sulphur effects Concawe 2003, figure 26
Figure 7.18 – Concawe 5/03 2003: Comparison of previous US and European
studies for CO
Graphs sourced from – Fuel effects on emissions from modern gasoline vehicles part 1 sulphur effects Concawe 2003, figure 27
Figure 7.19 – Concawe 5/03 2003: Comparison of previous US and European
studies for HC
Concawe 5/03 2003
Concawe 5/03 2003

Orbital Australia Pty Ltd Page 66 Issue 1
7.1.8 SAE 2006-01-3370: Impact of Fuel Sulphur on Gasoline and Diesel
Vehicle Emissions
This paper, similar to the Concawe 5/0320
study, makes reference to most of the major preceding studies into fuel sulphur. It also clearly defines the potential benefits to consider regarding the use of low sulphur fuel and groups these as either enabling technology or enhancing emission performance. It also provides a detailed review and comparison of testing methodologies.
The main new reference is to a 2003 study by CATARC18
in China where Euro 3 vehicles were aged to 80,000 km on the track with 130 to 150 ppm sulphur fuel. The NOx response curve for this data was shown to be similar to those from the CRC E-60
21 aged data set and the Concawe 5/03 study. This CATARC study would be of
particular interest to the Australian context as it is effectively one of the few examples of actual vehicle based ageing of modern, but conventional, TWC systems with fuel sulphur levels typical of current Australian ULP. Orbital attempted to track down the source of this CATARC data and made enquiries through our office in China to contact the author. However, the response from the author’s office was that this data was customer specific and not available for publication or circulation.
The SAE paper concludes that a further study of up-to-date vehicles is required to draw final conclusions on the sulphur response.
In summary:
The most interesting and up-to-date data (CATARC) discussed in this paper is unavailable for the purposes of this review.
A comparison for THC, CO and NOx fleet averages from previous studies showed that some of the individual vehicle data from the 1997 and 1998 studies had distorted the fleet average, showing a steeper response sulphur gradient than is typical of individual vehicles.
The remainder of the paper is a well-researched and well-argued literature review of previous studies.
7.1.9 CRC Report E84: Review of Prior Studies of Fuel Effects of Vehicle
Emissions
This paper is authored by one of the main authors of the earlier studies (SAE 2006-01-3370
18) and provides an all-encompassing review of extensive technical
literature, much of which is individually detailed above, but also goes beyond the fuel sulphur topic. One of the main additions to the earlier SAE paper is the inclusion of PM information, detailed in Section 7.3 of this report.
7.1.10 SAE 2011-01-0300: Effects of fuel sulphur on FTP NOx emissions from a
PZEV 4 cylinder application
This paper was the most recent paper identified on the subject, with two fuel sulphur levels (33 ppm and 3 ppm) being tested on a partial zero emissions vehicle (PZEV) over the FTP cycle with various purging drive cycles between the FTP test cycles.
The study was conducted because some previous papers had suggested that a more sensitive response to fuel sulphur might occur for vehicles designed to meet
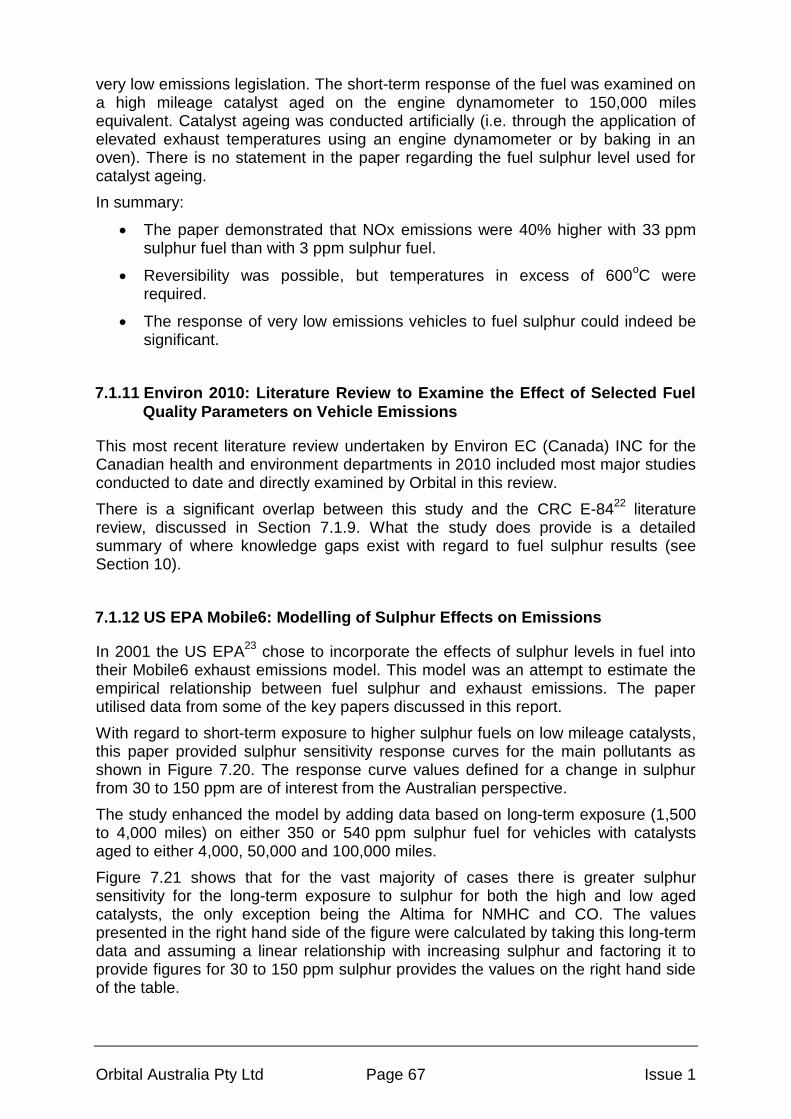
Orbital Australia Pty Ltd Page 67 Issue 1
very low emissions legislation. The short-term response of the fuel was examined on a high mileage catalyst aged on the engine dynamometer to 150,000 miles equivalent. Catalyst ageing was conducted artificially (i.e. through the application of elevated exhaust temperatures using an engine dynamometer or by baking in an oven). There is no statement in the paper regarding the fuel sulphur level used for catalyst ageing.
In summary:
The paper demonstrated that NOx emissions were 40% higher with 33 ppm sulphur fuel than with 3 ppm sulphur fuel.
Reversibility was possible, but temperatures in excess of 600oC were
required.
The response of very low emissions vehicles to fuel sulphur could indeed be significant.
7.1.11 Environ 2010: Literature Review to Examine the Effect of Selected Fuel
Quality Parameters on Vehicle Emissions
This most recent literature review undertaken by Environ EC (Canada) INC for the Canadian health and environment departments in 2010 included most major studies conducted to date and directly examined by Orbital in this review.
There is a significant overlap between this study and the CRC E-8422
literature review, discussed in Section 7.1.9. What the study does provide is a detailed summary of where knowledge gaps exist with regard to fuel sulphur results (see Section 10).
7.1.12 US EPA Mobile6: Modelling of Sulphur Effects on Emissions
In 2001 the US EPA23
chose to incorporate the effects of sulphur levels in fuel into their Mobile6 exhaust emissions model. This model was an attempt to estimate the empirical relationship between fuel sulphur and exhaust emissions. The paper utilised data from some of the key papers discussed in this report.
With regard to short-term exposure to higher sulphur fuels on low mileage catalysts, this paper provided sulphur sensitivity response curves for the main pollutants as shown in Figure 7.20. The response curve values defined for a change in sulphur from 30 to 150 ppm are of interest from the Australian perspective.
The study enhanced the model by adding data based on long-term exposure (1,500 to 4,000 miles) on either 350 or 540 ppm sulphur fuel for vehicles with catalysts aged to either 4,000, 50,000 and 100,000 miles.
Figure 7.21 shows that for the vast majority of cases there is greater sulphur sensitivity for the long-term exposure to sulphur for both the high and low aged catalysts, the only exception being the Altima for NMHC and CO. The values presented in the right hand side of the figure were calculated by taking this long-term data and assuming a linear relationship with increasing sulphur and factoring it to provide figures for 30 to 150 ppm sulphur provides the values on the right hand side of the table.
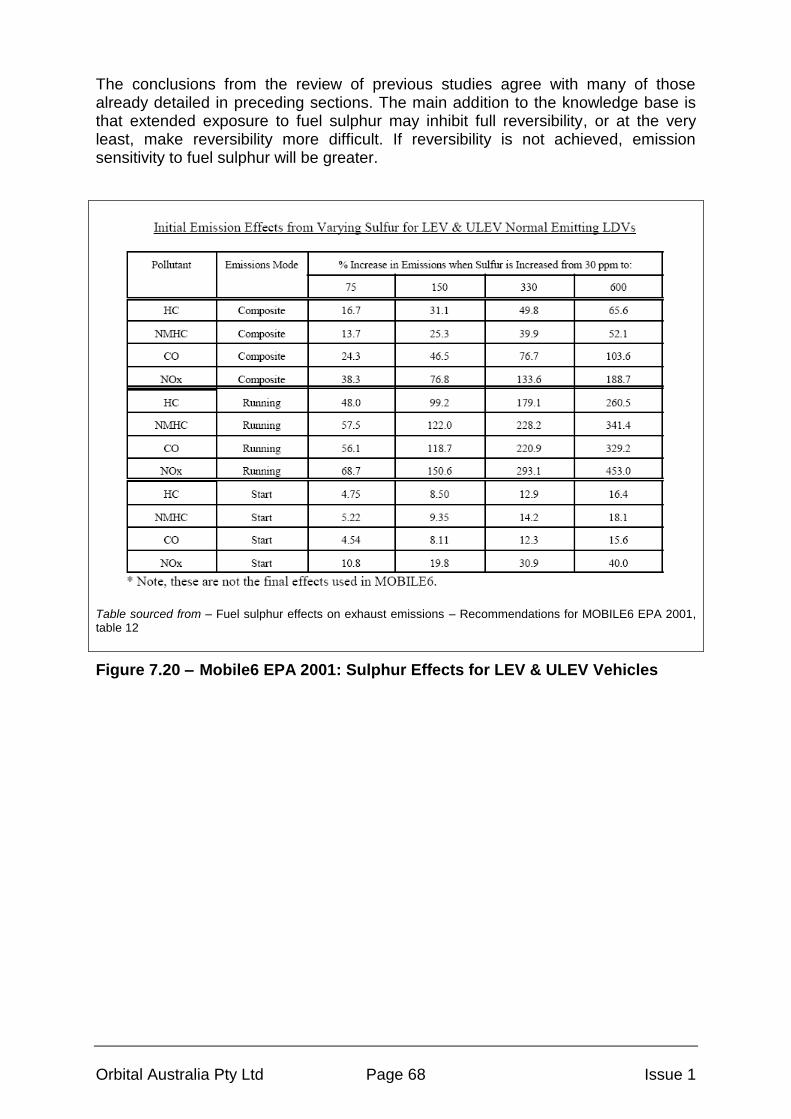
Orbital Australia Pty Ltd Page 68 Issue 1
The conclusions from the review of previous studies agree with many of those already detailed in preceding sections. The main addition to the knowledge base is that extended exposure to fuel sulphur may inhibit full reversibility, or at the very least, make reversibility more difficult. If reversibility is not achieved, emission sensitivity to fuel sulphur will be greater.
Table sourced from – Fuel sulphur effects on exhaust emissions – Recommendations for MOBILE6 EPA 2001, table 12
Figure 7.20 – Mobile6 EPA 2001: Sulphur Effects for LEV & ULEV Vehicles
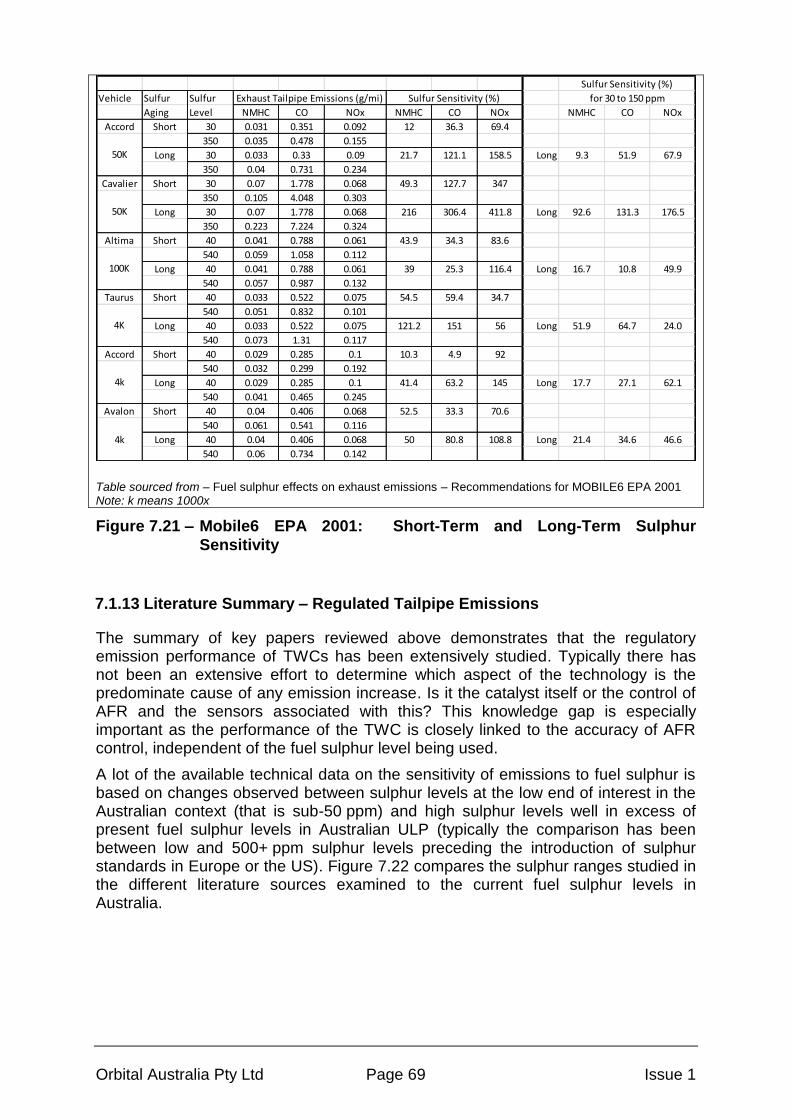
Orbital Australia Pty Ltd Page 69 Issue 1
Vehicle Sulfur Sulfur
Aging Level NMHC CO NOx NMHC CO NOx NMHC CO NOx
Accord Short 30 0.031 0.351 0.092 12 36.3 69.4
350 0.035 0.478 0.155
Long 30 0.033 0.33 0.09 21.7 121.1 158.5 Long 9.3 51.9 67.9
350 0.04 0.731 0.234
Cavalier Short 30 0.07 1.778 0.068 49.3 127.7 347
350 0.105 4.048 0.303
Long 30 0.07 1.778 0.068 216 306.4 411.8 Long 92.6 131.3 176.5
350 0.223 7.224 0.324
Altima Short 40 0.041 0.788 0.061 43.9 34.3 83.6
540 0.059 1.058 0.112
Long 40 0.041 0.788 0.061 39 25.3 116.4 Long 16.7 10.8 49.9
540 0.057 0.987 0.132
Taurus Short 40 0.033 0.522 0.075 54.5 59.4 34.7
540 0.051 0.832 0.101
Long 40 0.033 0.522 0.075 121.2 151 56 Long 51.9 64.7 24.0
540 0.073 1.31 0.117
Accord Short 40 0.029 0.285 0.1 10.3 4.9 92
540 0.032 0.299 0.192
Long 40 0.029 0.285 0.1 41.4 63.2 145 Long 17.7 27.1 62.1
540 0.041 0.465 0.245
Avalon Short 40 0.04 0.406 0.068 52.5 33.3 70.6
540 0.061 0.541 0.116
Long 40 0.04 0.406 0.068 50 80.8 108.8 Long 21.4 34.6 46.6
540 0.06 0.734 0.142
100K
4K
4k
4k
Exhaust Tailpipe Emissions (g/mi) Sulfur Sensitivity (%)
Sulfur Sensitivity (%)
for 30 to 150 ppm
50K
50K
Table sourced from – Fuel sulphur effects on exhaust emissions – Recommendations for MOBILE6 EPA 2001 Note: k means 1000x
Figure 7.21 – Mobile6 EPA 2001: Short-Term and Long-Term Sulphur
Sensitivity
7.1.13 Literature Summary – Regulated Tailpipe Emissions
The summary of key papers reviewed above demonstrates that the regulatory emission performance of TWCs has been extensively studied. Typically there has not been an extensive effort to determine which aspect of the technology is the predominate cause of any emission increase. Is it the catalyst itself or the control of AFR and the sensors associated with this? This knowledge gap is especially important as the performance of the TWC is closely linked to the accuracy of AFR control, independent of the fuel sulphur level being used.
A lot of the available technical data on the sensitivity of emissions to fuel sulphur is based on changes observed between sulphur levels at the low end of interest in the Australian context (that is sub-50 ppm) and high sulphur levels well in excess of present fuel sulphur levels in Australian ULP (typically the comparison has been between low and 500+ ppm sulphur levels preceding the introduction of sulphur standards in Europe or the US). Figure 7.22 compares the sulphur ranges studied in the different literature sources examined to the current fuel sulphur levels in Australia.

Orbital Australia Pty Ltd Page 70 Issue 1
0 100 200 300 400 500 600 700 800 900 1000
Fuel Sulphur (ppm)
Fuel Sulphur Range in Reviewed Studies
SAE912323
SAE920558
SAE952421
SAE982726
CRC E-60 2003
Concawe 5/30 2003
CATARC2003
SAE2005-01-1113
SAE2011-01-0300
Figure 7.22 – Fuel Sulphur Studies Reviewed Tailpipe Emissions and Range of
Sulphur Covered
From the literature, the general conclusion is that at low mileage there is indeed some level of fuel sulphur dependent effect on regulated tailpipe emissions. THC and CO increase least with increases to the fuel sulphur content, while NOx emissions are most sensitive. There are indications that this sensitivity can be vehicle make and model specific, and while early concerns were that this sensitivity was greatest for the cleanest (lowest emitting) vehicles, more recent studies have suggested that as far as vehicles equipped with TWC exhaust aftertreatments are concerned the sensitivity, though present, is not as great as first considered. This may be because of improvements to catalyst formulation and preparation, but may also occur due to the increasingly closer location of the catalyst to the engine (for faster light-off and improved cold start emissions). Exposing the catalyst to higher temperatures through close-coupling is likely to promote reversal in regular operation.
There is evidence that reversibility can be achieved following the loss of catalyst performance incurred as a consequence of operation on higher fuel sulphur levels. The degree and speed with which reversibility is achieved is indicated to be sensitive to the drive cycle used to re-condition the catalyst. The key factors from the drive cycle which can affect this are vehicle speed (and correspondingly engine speed/load) which dictates exhaust feed gas temperature; and duration at the effective speed/load for reversal.
At high mileage, the emission sensitivity to high fuel sulphur (mostly demonstrated with artificially aged catalyst samples, rather than on-road or on-track testing) suggests a similar if not greater overall sensitivity to fuel sulphur, although the results are very non-linear when compared to the low mileage performance. The
PU
LP
@ 5
0 p
pm
UL
P @
150 p
pm

Orbital Australia Pty Ltd Page 71 Issue 1
non-linearity indicates a greater sensitivity at lower sulphur levels, and generally a lesser sensitivity at higher sulphur concentrations, potentially due to the number of catalyst sites which are already deactivated for other degradation reasons. Further detail on the ageing aspect of the catalysts used for the studies is detailed in the next section of this report.
Though there is only limited field trial data, there is the suggestion that extended operation of the vehicle catalyst on high sulphur fuels does further degrade the initial response which has often been used as the basis of results presented in most studies. This extended operation on higher fuel sulphur levels though is generally of comparatively short duration compared to the requirements for in-field compliance. The other challenge associated with extended operation on high sulphur fuel is that the degree of catalyst sulphur contamination will be sensitive to the specific driving characteristics used during the trial and that these will vary between different scenarios.
7.2 Catalyst Performance and Reversibility of Fuel Sulphur Effects
7.2.1 Catalyst Ageing on High Sulphur Fuel verses Accelerated Ageing
Many of the studies on the effects of fuel sulphur on catalyst performance and ageing have included assessment of high sulphur fuel at “high mileage”. To achieve the “high mileage” they have generally used accelerated catalyst ageing cycles which utilise an engine dynamometer or catalyst only test bench. These cycles use elevated heat ageing, lean ageing or lean spike ageing to artificially age the catalyst in a short timeframe, and often this ageing is done with fuel containing low sulphur (less than 50 ppm) and, in many cases, no sulphur (as reported in the literature reviewed). The use of indolene test fuel is common practice within the automotive and catalyst development industry.
The issue with this approach is that the test catalyst has not been aged on high sulphur fuel nor has it been operated in a manner which is representative of in-field use. Differences in drive cycle speeds and loads may result in different thermal effects on the catalyst, either promoting or inhibiting the reversal of any sulphur effects with mileage accumulated.
It is Orbital’s opinion that to truly understand the effect of high sulphur fuel at high mileage it is necessary to expose the catalyst to representative “high” sulphur fuel during mileage accumulation. This is especially relevant if the data is to be used to forecast real world effects of sulphur on catalyst ageing where the effects of fuel sulphur and any representative reversibility during the ageing process need to be considered.
Two studies supported this view, however it was concluded that there was not enough high mileage data to construct a sulphur response for reversibility of the 50 and 150 ppm cases:
1) the CATARC paper18
which operated vehicles for 80,000 km with high sulphur fuel although this occurred on the test track (note that data from this paper was not publicly available despite being referenced by SAE 2006-01-3370
18).
2) the more recent API and EPA data used for the EPA MOBILE 6 paper23
which operated vehicles in the field over urban, rural and highway routes for up to 4,000 miles (6,437 km) (although useful mileage accumulation to

Orbital Australia Pty Ltd Page 72 Issue 1
6,400 km does not provide a clear picture for reversibility behaviour at high mileage e.g. 100,000 to 160,000 km).
7.2.2 TWC Wash Coat Formulation
In 2000 a report commissioned by Environment Australia was written by Coffey Geosciences Pty Ltd
24. This report summarised catalyst technology from various
sources between 1993 and 1999. With regard to sulphur tolerance, the key points were as follows:
Advanced Pd-based formulations are being introduced in order to meet the current emissions legislation (at that time Euro 3 / 4 & US Tier 2 LEV ULEV). Pd is thermally more stable and therefore allows it to be used in close-coupled catalysts which are necessary to achieve reductions in cold start emissions during the light-off period.
However, Pd is sensitive to sulphur poisoning especially with regard to NOx and CO.
Addition of Lanthanum and improved catalytic reaction promoters may reduce Pd sensitivity to sulphur.
The report concluded that overall the literature strongly suggests that catalysts can be formulated to be sulphur tolerant and meet Euro 3 / 4 and LEV/ULEV. There is a gap in up-to-date literature which further discusses sulphur tolerance in current technology catalyst formulations. Because of this, it can be assumed that progress, particularly for TWC development, has been down the path of increased cell densities (to meet faster light-off and lower tailpipe targets) and improved thermal stability (to meet longer in-field durability requirements), while improvement to sulphur tolerance has been less necessary with dominant jurisdictions trending to lower fuel sulphur levels.
The Second National In-Service Emission Study19
(NISE2) undertaken in 2008-2009 included a number of ADR79/01 (Euro 3) vehicles, some of which were Euro 4 and better capable given their recorded results. A component of the testing was an assessment of the N2O emission performance. As identified in the N2O report
25 the
catalyst formulation plays a key role in whether a vehicle was a high or low emitter of N2O emissions. The data in Figure 7.23 indicates which Euro3+ vehicles in the NISE2 fleet are expected to still be utilising Pd in their catalyst formulations. This may have changed as models are upgraded to the Euro 4+ specification. However, given many of these Euro 3+ vehicles are imported and are also well within the regulatory limits, it is expected that some were Euro 4+ capable and still using Pd-based catalysts and targeting at least 100,000+ km durability.

Orbital Australia Pty Ltd Page 73 Issue 1
0.000
0.005
0.010
0.015
0.020
0.025
0.030N
2O
(g/
km),
by
FTIR
NISE2: ADR79/01 (Euro3+) Australian Vehicles
0.000
0.050
0.100
0.150
0.200
0.250
NO
x (g
/km
)
NISE2: ADR79/01 (Euro3+) Australian Vehicles
ADR 79/01 (Euro 3)
ADR 79/02 (Euro 4)
ADR 79/03+ (Euro 5/6)
Figure 7.23 – N2O Results, indicative of which Euro3+ Australian Vehicles
Models were still using Pd in their Catalyst Formulations, and
how low NOx emissions were for many of these vehicles.
Some level of Pd on the catalyst
Potentially no Pd on the catalyst

Orbital Australia Pty Ltd Page 74 Issue 1
7.2.3 Reversibility of Fuel Sulphur Effects
There are two scenarios to examine regarding reversibility:
Reversibility due to a change in sulphur level from low-to-high and back to low again
Reversibility due to operation at increased catalyst temperature and/or increased exhaust air-fuel richness (λ<1).
7.2.3.1 Reversibility Due to a Reduction in Fuel Sulphur Level
Much of the literature interest regarding reversibility stemmed from the situation in the US where California had significantly lower sulphur limits than those required by Federal legislation (the other 49 states). Consequently, vehicles could drive from an area of low sulphur fuel to an area of high sulphur fuel and vice versa. The following AQIRP paper
26 and those discussed
27, 28, 29 in the CRC E-84 literature review
22
provided a reasonable level of evidence to suggest that reversibility of sulphur poisoning occurs when switching to low sulphur fuel when combined with a drive cycle incorporating higher vehicle operating loads and speeds.
The AQIRP paper26
, using 1989 MY vehicles concluded that the fuel sulphur effect was immediately reversible using only the LA4 and FTP drive cycles. Later papers tend not to agree with this finding and conclude that some level of reversibility occurred for certain pollutants when using the LA4 cycle, but that more complete reversibility could only be achieved by using the more aggressive US06 cycle, as discussed below.
SAE 1999-01-1544 Reversibility of Sulphur Effects on Emissions of California Low Emission Vehicles (conclusions re-printed in CRC E-84 literature review):
For the test fleet as a whole most but not all of the sulphur effects were reversible. With the LA4 driving cycle, sulphur effects on CO and NOx were partially irreversible (approximately 79% and 84% recovery, respectively); for NMHC there was no evidence of any irreversibility (approximately 100% recovery). With the US06 driving cycle, sulphur effects on NOx were partially irreversible (approximately 95% recovery); for NMHC and CO there was no evidence of any irreversibility (approximately 100% recovery). Partial irreversibility, where detected, was statistically significant.
SAE 1999-01-3676 Investigation of Sulphur Sensitivity and Reversibility in Late-Model Vehicles (conclusions re-printed in CRC E-84 paper):
In addition, the data showed that the effects of operation on high-sulphur fuel were largely reversible for all pollutants following a return to operation on low-sulphur fuel on the LA4 driving cycle. Use of low-sulphur fuel with the more severe US06 driving cycle generally led to a more complete reversal of sulphur effects in those cases where complete recovery was not achieved on the LA4 cycle. Overall, the results of the study indicated that operation on high-sulphur gasoline did not result in permanent, adverse impacts on the emission performance of late-model vehicles
In Australia, due to uniform (national) fuel standards, a change in sulphur level for a given fuel type, for example ULP, is unlikely to occur due to driving to a different state or from refuelling at a different supplier. There is the possibility that a different sulphur level could be encountered by switching from PULP (50 ppm sulphur) to ULP (150 ppm sulphur) and/or vice versa. Switching from ULP to E10 is unlikely to be a measureable difference. However, switching from ULP to E85 may be significant and consequential, although it is anticipated that the control system of an E85 vehicle has been engineered with this in consideration.
Orbital Australia Pty Ltd Page 75 Issue 1
Engine and vehicle technology determines whether vehicles require to be fuelled on either PULP or ULP, and a manufacturer will indicate this requirement in the vehicle owner manual and on the fuel filler cap. Even so, the use of PULP may only be a recommendation – not a requirement – and as such the possibility of a switching between PULP and ULP may be an economic one. In this case the change is from a low sulphur fuel to a higher sulphur fuel (increase in emissions expected) with reversibility only coming into consideration should the operator transition back to the use of PULP.
Further complications relating to the real world effects are impacted by the way in which vehicle certification is carried out. Manufacturers are required to certify their vehicles using certification fuel which, to date, has had significantly lower sulphur levels than pump grade fuel. ADR 79/02 certification fuel (see Appendix C) specified 10 ppm sulphur in 2008-2010 at a time when the national fuel standard required 50 ppm for PULP and 150 ppm for ULP. ADRs 79/03 and 79/04 certification fuel (see Appendix C,) continue to specify 10 ppm sulphur while no changes have been made to the sulphur limits for PULP and ULP.
From a legislative point of view the vehicle manufacturer is required to demonstrate in-service conformity of tailpipe emissions up to 100,000 km for Euro 4 and 160,000 km for Euro 5 and Euro 6. In addition, they are also required to demonstrate that the OBD system can flag a MIL event when the emissions exceed the OBD emissions thresholds. Vehicle Engine Control Module (ECM) calibration activity which leads to the ability to satisfy the above requirements is generally understood to be conducted using certification fuel. Further, the preconditioning regimes used prior to testing for in-service conformity may provide for additional reversal of in-field sulphur effects.
In real world operation of the vehicle where higher fuel sulphur level exists compared to certification sulphur levels, the following issues may arise:
Tailpipe emissions may exceed the legislated limit, if not at low mileage then potentially at higher mileage.
OBD diagnostics may become less reliable and the MIL lamp may be illuminated too early or too late.
The likelihood of these events occurring is assessed in Section 8 of this report. However, the key point is that a disconnect between the certification fuel standard and the national fuel standard for a key parameter (sulphur), which may lead to a difference in emissions performance, can only lead to uncertainty and an increased workload for the vehicle manufacturer.
7.2.3.2 Reversibility Due to Temperature, Richness and Drive Cycle
In order for real world emissions to be maintained unaffected by fuel sulphur levels, reversal of the fuel sulphur contamination during in-service driving is essential. Whether reversibility occurs due to in-service rich AFR instances will, to some extent, be determined by the catalyst temperature reached during the drive cycle.
For emissions regulations the legislated drive cycle is used. While it is assumed that on average the legislated drive cycle reflects the normal mode of use of the vehicle,

Orbital Australia Pty Ltd Page 76 Issue 1
this is not always representative of in-field use (NISE219
, part 1). During regulated tailpipe emissions testing the vehicle is constrained not to enter a rich operating state in order to keep tailpipe emissions to the minimum so as to pass the emissions requirements over the cycle. Figure 7.24 shows a comparison of the AFR control for a significant Australian market vehicle, the Holden Commodore, for older ADR37/01 (US FTP) emission levels and the more recent ADR79/01 (Euro) standard. It is clearly seen that the new vehicle has dramatically improved control of AFR in order to further optimise the performance of the catalyst to produce lower tailpipe emissions. It can be observed in the results for the vehicle calibrated to the later emissions standard that the AFR is consistently held at λ=1 and there are negligible rich excursions after engine and catalyst warm-up has been achieved (some lean excursions are observed during fuel cut on decelerations). Operating at more consistent AFR is expected to limit the opportunities for in-field (or unforced) reversibility.
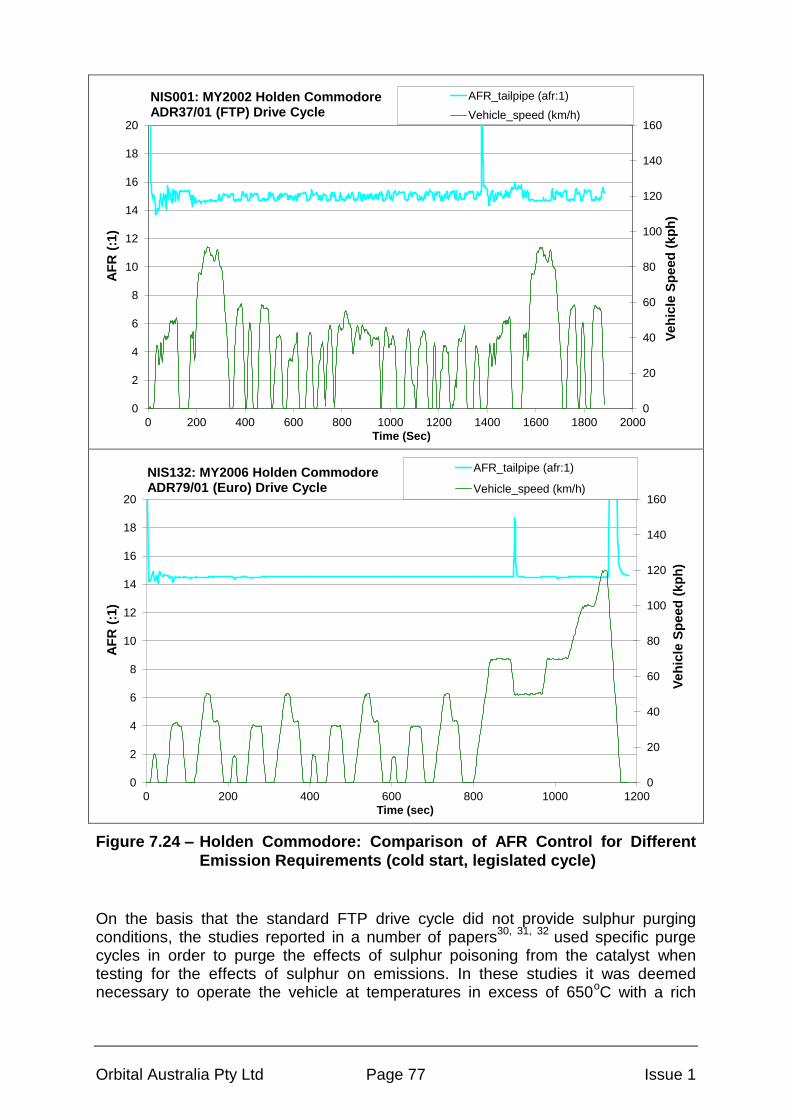
Orbital Australia Pty Ltd Page 77 Issue 1
0
20
40
60
80
100
120
140
160
0
2
4
6
8
10
12
14
16
18
20
0 200 400 600 800 1000 1200 1400 1600 1800 2000
Ve
hic
le S
pe
ed
(k
ph
)
AF
R (
:1)
Time (Sec)
NIS001: MY2002 Holden CommodoreADR37/01 (FTP) Drive Cycle
AFR_tailpipe (afr:1)
Vehicle_speed (km/h)
0
20
40
60
80
100
120
140
160
0
2
4
6
8
10
12
14
16
18
20
0 200 400 600 800 1000 1200
Ve
hic
le S
pe
ed
(k
ph
)
AF
R (
:1)
Time (sec)
NIS132: MY2006 Holden CommodoreADR79/01 (Euro) Drive Cycle
AFR_tailpipe (afr:1)
Vehicle_speed (km/h)
Figure 7.24 – Holden Commodore: Comparison of AFR Control for Different
Emission Requirements (cold start, legislated cycle)
On the basis that the standard FTP drive cycle did not provide sulphur purging conditions, the studies reported in a number of papers
30, 31, 32 used specific purge
cycles in order to purge the effects of sulphur poisoning from the catalyst when testing for the effects of sulphur on emissions. In these studies it was deemed necessary to operate the vehicle at temperatures in excess of 650
oC with a rich
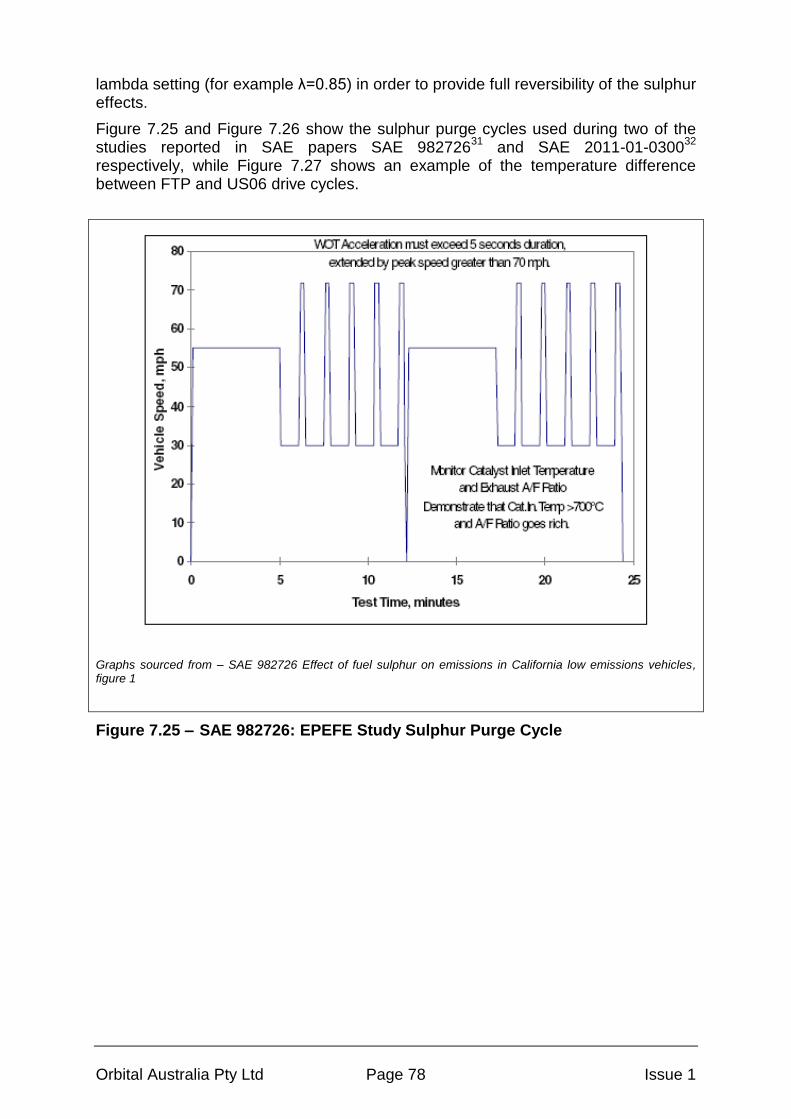
Orbital Australia Pty Ltd Page 78 Issue 1
lambda setting (for example λ=0.85) in order to provide full reversibility of the sulphur effects.
Figure 7.25 and Figure 7.26 show the sulphur purge cycles used during two of the studies reported in SAE papers SAE 982726
31 and SAE 2011-01-0300
32
respectively, while Figure 7.27 shows an example of the temperature difference between FTP and US06 drive cycles.
Graphs sourced from – SAE 982726 Effect of fuel sulphur on emissions in California low emissions vehicles, figure 1
Figure 7.25 – SAE 982726: EPEFE Study Sulphur Purge Cycle
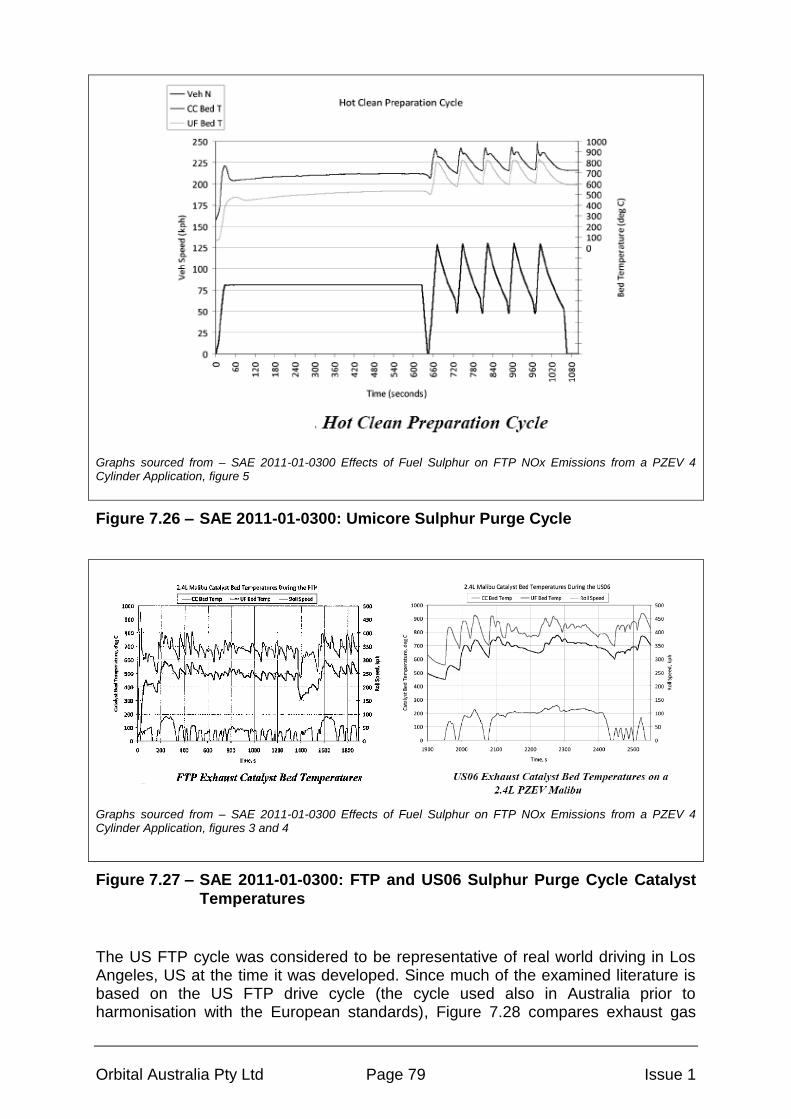
Orbital Australia Pty Ltd Page 79 Issue 1
Graphs sourced from – SAE 2011-01-0300 Effects of Fuel Sulphur on FTP NOx Emissions from a PZEV 4 Cylinder Application, figure 5
Figure 7.26 – SAE 2011-01-0300: Umicore Sulphur Purge Cycle
Graphs sourced from – SAE 2011-01-0300 Effects of Fuel Sulphur on FTP NOx Emissions from a PZEV 4 Cylinder Application, figures 3 and 4
Figure 7.27 – SAE 2011-01-0300: FTP and US06 Sulphur Purge Cycle Catalyst
Temperatures
The US FTP cycle was considered to be representative of real world driving in Los Angeles, US at the time it was developed. Since much of the examined literature is based on the US FTP drive cycle (the cycle used also in Australia prior to harmonisation with the European standards), Figure 7.28 compares exhaust gas
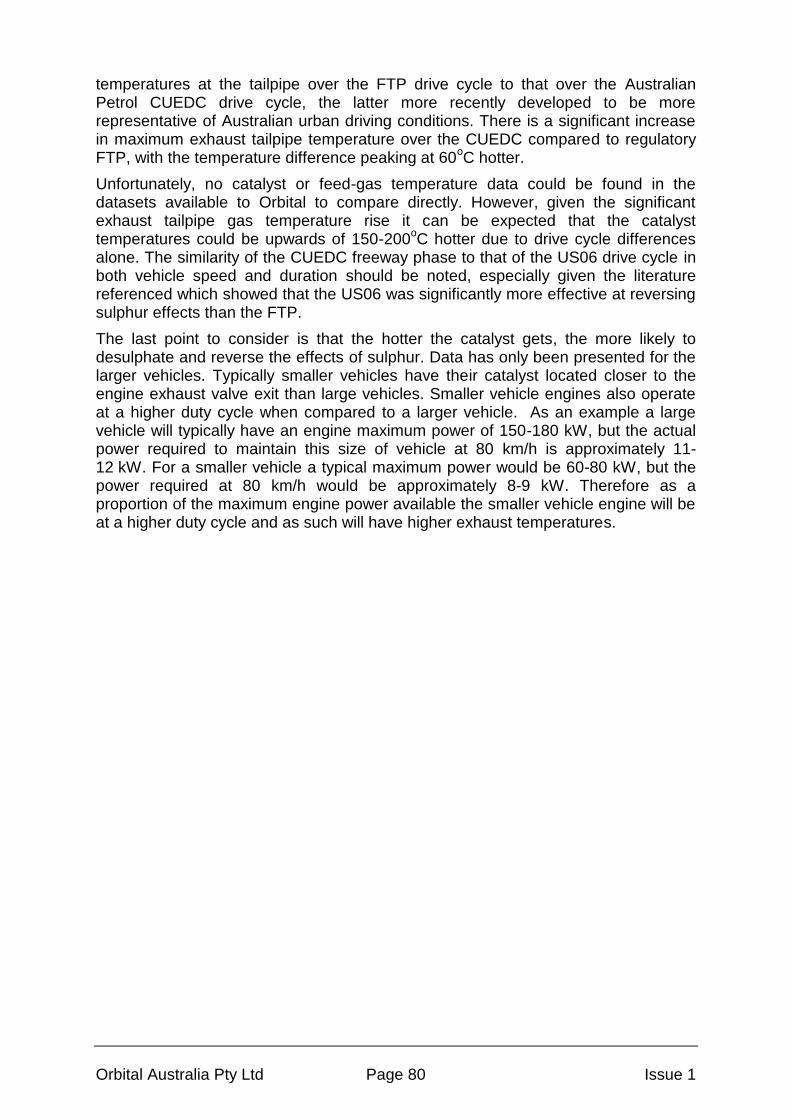
Orbital Australia Pty Ltd Page 80 Issue 1
temperatures at the tailpipe over the FTP drive cycle to that over the Australian Petrol CUEDC drive cycle, the latter more recently developed to be more representative of Australian urban driving conditions. There is a significant increase in maximum exhaust tailpipe temperature over the CUEDC compared to regulatory FTP, with the temperature difference peaking at 60
oC hotter.
Unfortunately, no catalyst or feed-gas temperature data could be found in the datasets available to Orbital to compare directly. However, given the significant exhaust tailpipe gas temperature rise it can be expected that the catalyst temperatures could be upwards of 150-200
oC hotter due to drive cycle differences
alone. The similarity of the CUEDC freeway phase to that of the US06 drive cycle in both vehicle speed and duration should be noted, especially given the literature referenced which showed that the US06 was significantly more effective at reversing sulphur effects than the FTP.
The last point to consider is that the hotter the catalyst gets, the more likely to desulphate and reverse the effects of sulphur. Data has only been presented for the larger vehicles. Typically smaller vehicles have their catalyst located closer to the engine exhaust valve exit than large vehicles. Smaller vehicle engines also operate at a higher duty cycle when compared to a larger vehicle. As an example a large vehicle will typically have an engine maximum power of 150-180 kW, but the actual power required to maintain this size of vehicle at 80 km/h is approximately 11-12 kW. For a smaller vehicle a typical maximum power would be 60-80 kW, but the power required at 80 km/h would be approximately 8-9 kW. Therefore as a proportion of the maximum engine power available the smaller vehicle engine will be at a higher duty cycle and as such will have higher exhaust temperatures.
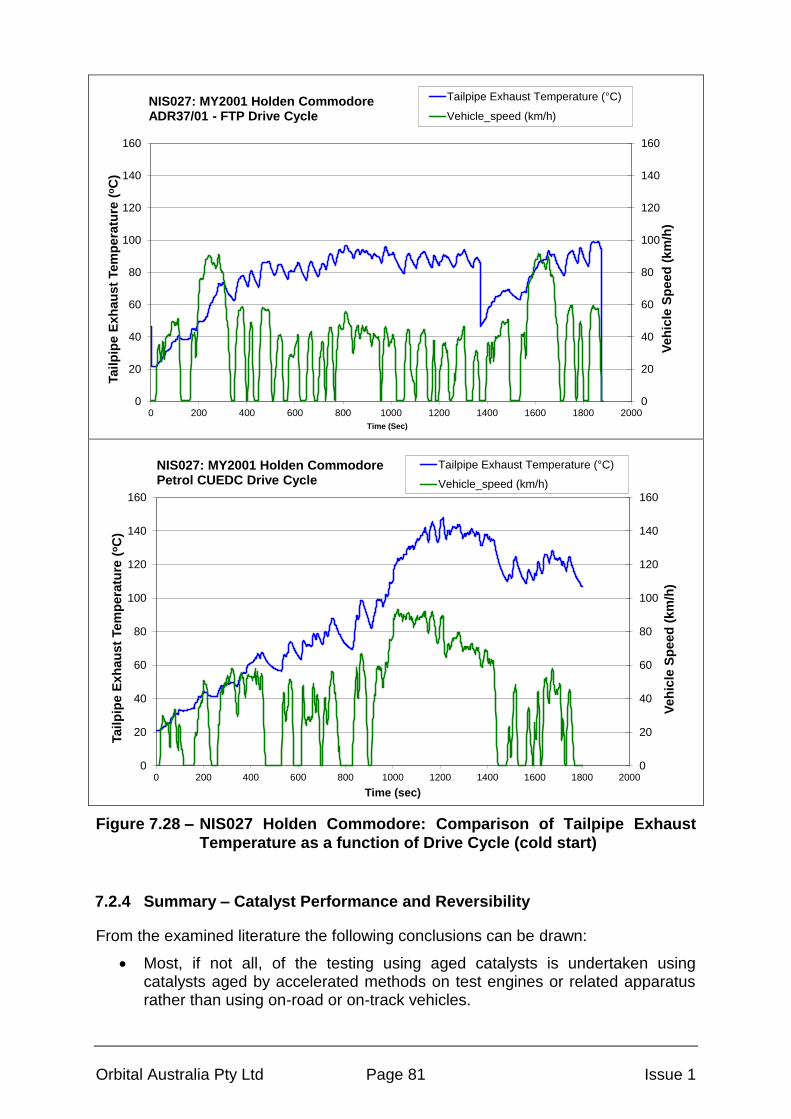
Orbital Australia Pty Ltd Page 81 Issue 1
0
20
40
60
80
100
120
140
160
0
20
40
60
80
100
120
140
160
0 200 400 600 800 1000 1200 1400 1600 1800 2000
Veh
icle
Sp
eed
(km
/h)
Tailp
ipe E
xh
au
st
Tem
pera
ture
(oC
)
Time (Sec)
NIS027: MY2001 Holden CommodoreADR37/01 - FTP Drive Cycle
Tailpipe Exhaust Temperature (°C)
Vehicle_speed (km/h)
0
20
40
60
80
100
120
140
160
0
20
40
60
80
100
120
140
160
0 200 400 600 800 1000 1200 1400 1600 1800 2000
Ve
hic
le S
pe
ed
(k
m/h
)
Ta
ilp
ipe
Ex
ha
us
t Te
mp
era
ture
(oC
)
Time (sec)
NIS027: MY2001 Holden CommodorePetrol CUEDC Drive Cycle
Tailpipe Exhaust Temperature (°C)
Vehicle_speed (km/h)
Figure 7.28 – NIS027 Holden Commodore: Comparison of Tailpipe Exhaust
Temperature as a function of Drive Cycle (cold start)
7.2.4 Summary – Catalyst Performance and Reversibility
From the examined literature the following conclusions can be drawn:
Most, if not all, of the testing using aged catalysts is undertaken using catalysts aged by accelerated methods on test engines or related apparatus rather than using on-road or on-track vehicles.
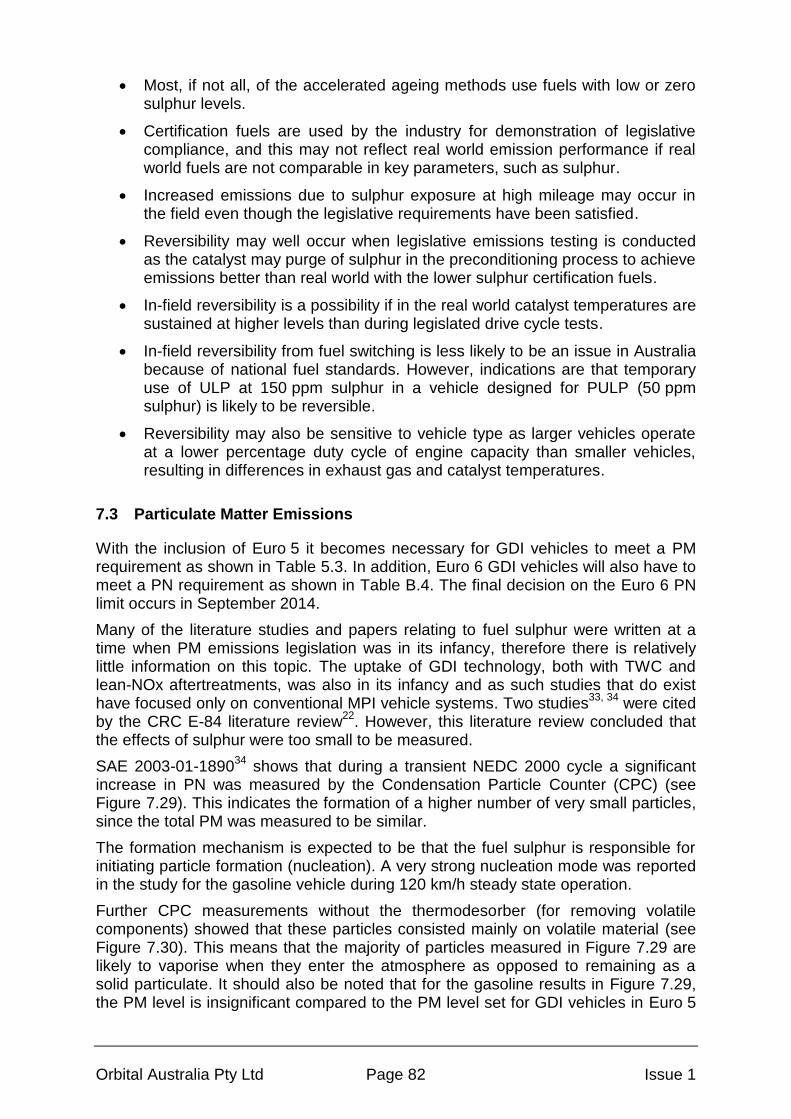
Orbital Australia Pty Ltd Page 82 Issue 1
Most, if not all, of the accelerated ageing methods use fuels with low or zero sulphur levels.
Certification fuels are used by the industry for demonstration of legislative compliance, and this may not reflect real world emission performance if real world fuels are not comparable in key parameters, such as sulphur.
Increased emissions due to sulphur exposure at high mileage may occur in the field even though the legislative requirements have been satisfied.
Reversibility may well occur when legislative emissions testing is conducted as the catalyst may purge of sulphur in the preconditioning process to achieve emissions better than real world with the lower sulphur certification fuels.
In-field reversibility is a possibility if in the real world catalyst temperatures are sustained at higher levels than during legislated drive cycle tests.
In-field reversibility from fuel switching is less likely to be an issue in Australia because of national fuel standards. However, indications are that temporary use of ULP at 150 ppm sulphur in a vehicle designed for PULP (50 ppm sulphur) is likely to be reversible.
Reversibility may also be sensitive to vehicle type as larger vehicles operate at a lower percentage duty cycle of engine capacity than smaller vehicles, resulting in differences in exhaust gas and catalyst temperatures.
7.3 Particulate Matter Emissions
With the inclusion of Euro 5 it becomes necessary for GDI vehicles to meet a PM requirement as shown in Table 5.3. In addition, Euro 6 GDI vehicles will also have to meet a PN requirement as shown in Table B.4. The final decision on the Euro 6 PN limit occurs in September 2014.
Many of the literature studies and papers relating to fuel sulphur were written at a time when PM emissions legislation was in its infancy, therefore there is relatively little information on this topic. The uptake of GDI technology, both with TWC and lean-NOx aftertreatments, was also in its infancy and as such studies that do exist have focused only on conventional MPI vehicle systems. Two studies
33, 34 were cited
by the CRC E-84 literature review22
. However, this literature review concluded that the effects of sulphur were too small to be measured.
SAE 2003-01-189034
shows that during a transient NEDC 2000 cycle a significant increase in PN was measured by the Condensation Particle Counter (CPC) (see Figure 7.29). This indicates the formation of a higher number of very small particles, since the total PM was measured to be similar.
The formation mechanism is expected to be that the fuel sulphur is responsible for initiating particle formation (nucleation). A very strong nucleation mode was reported in the study for the gasoline vehicle during 120 km/h steady state operation.
Further CPC measurements without the thermodesorber (for removing volatile components) showed that these particles consisted mainly on volatile material (see Figure 7.30). This means that the majority of particles measured in Figure 7.29 are likely to vaporise when they enter the atmosphere as opposed to remaining as a solid particulate. It should also be noted that for the gasoline results in Figure 7.29, the PM level is insignificant compared to the PM level set for GDI vehicles in Euro 5

Orbital Australia Pty Ltd Page 83 Issue 1
and Euro 6. This highlights that the PM due to fuel sulphur is typically an order of magnitude lower than the PM to be generated as consequence of the use of GDI technologies. Similar conclusions can be drawn for PN based on the results presented.
Graphs sourced from – SAE 2003-01-1890 ACEA Programme on the emissions of fine particulates from passenger cars (2) Part 2: Effect of sampling conditions and fuel sulphur content on the particle emissions, figure 7 Note: this paper is only available from SAE in black and white, and hence print quality cannot be improved Key to graph, Hashed bars = PM, Black bars = ELPI or CPC
Figure 7.29 – SAE 2003-01-1890: Particle Count (by CPC) over the Transient
NEDC2000 Cycle
Orbital Australia Pty Ltd Page 84 Issue 1
Graphs sourced from – SAE 2003-01-1890 ACEA Programme on the emissions of fine particulates from passenger cars (2) Part 2: Effect of sampling conditions and fuel sulphur content on the particle emissions, figure 9 Note: this paper is only available from SAE in black and white, and hence print quality cannot be improved.
Figure 7.30 – SAE 2003-01-1890: Particle Count (by CPC) without
Thermodesorber
SAE 2004-01-198533
also reported that the fuel effect on PM could not be measured on the gasoline vehicles studied over the NEDC cycle. Over the Artemis
35 motorway
cycle there was some evidence of increased PM but it was not possible to say if this was attributable to enrichment or the higher sulphur fuel (143 ppm). In general, the PM emissions for gasoline vehicles were so low that it was not possible to differentiate between 10 and 143 ppm sulphur fuels. A parallel paper by Concawe
36
provided the same conclusions.
The overall conclusion was that gasoline emissions (with MPI engine technology) were too low compared to the scatter of the results to draw statistically reliable conclusions. However, significantly higher PNs were measured for some test configurations. Chemical analysis of the volatile material showed that a large fraction consisted of sulphates which are derived from the presence of sulphur in the fuel. Nucleation did not occur when low sulphur fuel was used.
The Environ 2010 report37
notes that SOx data is sparse, “but that based on the understanding that most fuel sulphur is converted to SOx upon combustion, it is reasonable to infer that a reduction in fuel sulphur content would also produce a reduction in SOx emissions”. This is consistent with the chemical analysis results reported above.
In summary:
Overall there is not enough data, or the data too variable, to draw a firm conclusion on the PM sensitivity to fuel sulphur.

Orbital Australia Pty Ltd Page 85 Issue 1
Some results indicated that higher PNs occurred with higher sulphur fuel, and that these are largely volatile components anticipated to have been formed as a consequence of the sulphur acting as a nucleating mechanism.
Overall the effects due to fuel sulphur seem to be less in absolute magnitude than the likely PM emissions increase to come from the uptake of GDI technology.
Further testing with current MY vehicles, with emerging technology such as GDI and the most up-to-date measurement methods and equipment may yield whether there is a stronger sensitivity or technology dependence.
7.4 Fuel Consumption and Greenhouse Gas Emissions
Fuel consumption is not affected directly by fuel sulphur levels, but rather indirectly.
Based on the literature examined there is a notable absence of data or research focused on the change in engine efficiency due to fuel sulphur. That is not to say that there is no association, but rather that this effect is either not noteworthy or insignificant.
Degradation of the catalyst alone due to fuel sulphur levels will not adversely affect fuel consumption either – the carbon balance will not be affected, even though the individual quantities of each pollutant may be altered. It is only when this degradation in catalyst performance is coupled with a control system (usually electronic) that monitors for this degradation and then endeavours to rectify or compensate for the degradation that fuel consumption is impacted.
Most problems with an exhaust aftertreatment system (namely with the catalyst and/or sensors) can be resolved by increasing the temperature (within limits) of these and forcing the oxidation of the offending inhibitor (for example sulphur based deposit). In order to generate this increase in exhaust gas temperature, additional fuelling is required and that leads to the degradation in fuel consumption. The quantity and frequency of this additional fuelling determines how significantly fuel consumption is penalised, but in the extreme it can mean that all of the benefits of a fuel reducing technology can be eliminated.
Although concerns were expressed by one OEM (section 6.1.2) that there may be backpressure effects for a diesel particulate filter (DPF) associated with higher PM from higher than 10 ppm sulphur fuels, this effect is more likely to be a result of the implementation of GDI technology (and hence need for the DPF) than the fuel sulphur level. It is likely that a fuel consumption effect due to sulphur effect on back pressure is either not noteworthy or insignificant. Greenhouse gas emissions from a gasoline engine are normally carbon dioxide (CO2), methane (CH4) and nitrous oxide (N2O), in decreasing proportion in the exhaust (respectively), but increasing global warming potential (refer to the N2O study
25). Deterioration in exhaust aftertreatment
efficiency due to fuel sulphur may result in increases in hydrocarbon emissions and consequently CH4 emissions may also increase, especially as CH4 is one of the more difficult components to catalyse. Likewise, an increase in NOx emissions due to degradation in exhaust aftertreatment has been identified
25 to also lead to
increases in N2O emissions.

Orbital Australia Pty Ltd Page 86 Issue 1
7.5 On-Board Diagnostics (Catalyst Monitoring)
A key part of on-board diagnostics (OBD) is catalyst monitoring which is used to infer the oxygen storage capacity of the catalyst and hence provide an indirect measurement of the tailpipe emissions or catalyst conversion efficiency. Two methods are typically used to infer the oxygen storage capacity: the dual sensor method and the time delay method. Different vehicle manufacturers will predominantly choose to use one or other of these methods. Both methods rely on a working exhaust oxygen sensor.
In the dual sensor method, the frequency and amplitude components of the signals from the pre-catalyst and post-catalyst oxygen sensors are compared. A statistically significant difference between the pre- and post-catalyst signals infers a high level of oxygen storage and therefore high conversion efficiency. When the pre- and post- signals are statistically similar this infers a low level of oxygen storage and therefore low conversion efficiency.
In the time delay method a step change in fuelling is commanded and the time delay between observing the response on the pre-catalyst and post-catalyst sensors is interpreted as the oxygen storage capacity of the catalyst. A long time delay infers a high level of oxygen storage and therefore high conversion efficiency. A short time delay infers a low level of oxygen storage and therefore low conversion efficiency.
It is a requirement of Euro 5 and Euro 6 that emissions durability be maintained over 160,000 km, therefore the reliability of the catalyst monitoring system needs to be maintained over this duration.
7.5.1 Available Literature
Literature examined has not revealed any recent studies discussing the effect of fuel sulphur on OBD, in particular catalyst monitoring. This may be because the key markets where OBD is required are now operating on 30 ppm sulphur or less, therefore the fuel sulphur level has become a moot point. SAE papers
38, 39, 40, 41 and
a literature study by the US EPA42
which discussed the effects of sulphur on catalyst monitoring were largely written in the US in the 1990’s. At this time in the US outside California, sulphur levels typically ranged from 250 ppm to 500 ppm
26 and from 1996
onwards were limited to 80 ppm43
inside California.
The US EPA literature review examined the concerns raised by vehicle manufacturers that the MIL lamp might be illuminated for vehicles with catalyst monitoring diagnostics calibrated for Californian gasoline sulphur levels which were subsequently driven outside California where there were much higher sulphur levels available in the fuel. This scenario is not the issue in Australia due to uniform (national) fuel standards. However, the papers also discussed the effect of sulphur on the inferred oxygen storage and the possibility that a MIL event is triggered too early or too late, according to the EPA paper:
Sulphur interferes with ceria’s oxygen storage function by adsorbing onto the catalyst surface under lean and stoichiometric conditions and forming ceria sulfite and ceria sulfate, both of which inhibit oxygen storage. As the catalyst ages (i.e. thermal ageing), precious metal particles agglomerate, regardless of the sulphur content of the fuel. As a result, surface area is reduced, decreasing catalyst efficiency and oxygen storage. Under high concentrations, sulphur worsens this thermal effect by

Orbital Australia Pty Ltd Page 87 Issue 1
covering noble metal and ceria particles, further reducing surface area thereby decreasing conversion efficiency and oxygen storage.
The US EPA paper also discusses that vehicles which are targeting a more stringent emissions requirement will need to have tighter lambda control, resulting in more time spent at stoichiometric conditions. This allows more time for sulphur to form ceria sulfite and ceria sulfate, further inhibiting oxygen storage. In addition, the paper proposes that increased close-coupling of the catalysts will be required to reduce light-off emissions, meaning Pd is required and Pd is more susceptible to sulphur contamination.
The confidential data supplied for the US EPA report by four auto manufacturers supported the view that sulphur has a detrimental effect on oxygen storage. However, the data provided different outcomes regarding the effect on the catalyst monitoring diagnostic strategy as shown by the comments below:
Automobile Manufacturer 1:
The MIL was illuminated for
TLEV vehicle with aged catalyst (100k miles > catalyst km’s < OBD
threshold 1.5xNMHC standard) using 1,000 ppm sulphur fuel
TLEV and LEV with aged catalyst (catalyst km’s = OBD threshold 1.5xNMHC standard) regardless of sulphur content
The MIL was not illuminated for
TLEV vehicle with aged catalyst (100kmiles > catalyst km’s < OBD
threshold 1.5xNMHC standard) using 29 or 100 ppm sulphur fuel
Automobile Manufacturer 2:
The MIL was not illuminated for
Tests where it was expected to have been illuminated (catalyst km’s =
OBD threshold 1.5xNMHC standard) using 30 and 900 ppm sulphur fuel.
Manufacturer stated that this detection failure occurred because the downstream sensor response rate was reduced by such an extent that the diagnostic interpreted the oxygen storage capacity as acceptable.
Automobile Manufacturer 3:
The MIL was not illuminated for
Tests where it was expected to have been illuminated due to sulphur adsorption. The manufacturer stated that the catalyst sulphur adsorption was temporarily reversed by the rich excursion used in the time delay diagnostic method causing the catalyst to return to pre-sulphur exposed level, hence the reduced oxygen storage capacity was not detected, no information on sulphur level was disclosed.
Without further explanation this explanation is dubious, it is hard to believe that a small rich short term excursion could so quickly reverse the sulphur adsorption.
Orbital Australia Pty Ltd Page 88 Issue 1
Automobile Manufacturer 4:
Experienced increased variability in the output of the diagnostic when higher sulphur level fuel was used, no information on sulphur level disclosed.
The US EPA concluded that there will not be a proliferation of MIL events due to sulphur and that those MIL events that do occur due to fuel sulphur are likely to occur on vehicles with severely aged catalysts which are beyond their legislative durability requirements. They were more concerned with the failure of the diagnostic to illuminate the MIL when it should have done.
In the SAE 972855 paper38
it was concluded that as the fuel sulphur level increased the rear oxygen sensor response was degraded, which in turn increased the likelihood of the dual sensor diagnostic providing a false pass, increasing the level of variability to the diagnostic’s decision-making ability. This study used very high fuel sulphur levels of 1,000 ppm.
In the SAE 941054 paper39
it was concluded that a catalyst which passed the emissions standards on low sulphur fuel is diagnosed as failing when operated on high sulphur fuel and that this is an issue. The paper also noted that the response of the downstream sensor was degraded but concluded that this effect was insignificant because the zone in which the diagnostic operated had low frequency sensor switching of 1-2Hz. This study used high fuel sulphur levels of 600 ppm.
In the SAE 952424 paper40
it was concluded that the inferred oxygen storage capacity is decreased with increasing fuel sulphur levels and that this trend was steeper with catalysts that were more thermally aged. In addition it was observed that the diagnostic output was also influenced by the load operating point at which the diagnostic was run. At higher loads there was more variability in the diagnostic results. Despite this the higher sulphur fuels did not cause the diagnostic result to flag a failed catalyst.
Additionally some evidence was provided to show that direct sulphur poisoning of the Pt-sensing element on the downstream oxygen sensor may have been occurring at times when the downstream temperature was lower. However, this only occurred on one vehicle and was only observed at the start of the testing following the switch from low to high sulphur fuel. This study used high fuel sulphur levels of 320 and 470 ppm.
In the SAE 952422 paper41
it was reported that a more sulphur robust catalyst monitoring system could be achieved by locating upstream and downstream oxygen sensors either side of the first brick of a close-coupled catalyst where the system also consisted of an under body catalyst. This view was also expressed by CARB
44.
It is proposed that the increased level of sulphur tolerance is obtained due to the higher exhaust temperatures experienced by a close-coupled catalyst which reverses the effect of sulphur poisoning. In addition the paper cites further work by CARB where they tested 30, 150 and 800 ppm sulphur fuel on a 4,000 mile (6,437 km) catalyst system as described above. In this testing the OBD catalyst monitoring signal showed no significant difference when comparing 30 and 800 ppm sulphur levels and also showed less than 2% catalyst efficiency drop for the close-coupled catalyst for 800 ppm compared to the 15% drop required to trigger a MIL event. This paper also reported that at the time the major catalyst manufacturers

Orbital Australia Pty Ltd Page 89 Issue 1
were working on more sulphur resistant catalysts capable of operating at levels of up to 300 ppm.
7.5.2 Literature Summary – Catalyst Monitoring
Most of the literature available on catalyst monitoring is almost 20 years old and largely originates from the US. At this time the sulphur levels in federal gasoline where very high by today’s standards, even considering Australia’s ULP at 150 ppm sulphur. They generally ranged from 250 ppm to 500 ppm and went as high as 1,000 ppm in some states. In 1996 the California phase 2 reformulated gasoline specifications required that the fuel sulphur content was limited to 80 ppm. The literature largely discusses concerns for catalyst monitoring diagnostics calibrated on vehicles using Californian gasoline that were subsequently operated on fuels with a much higher level of sulphur outside California.
The overall summary from the literature was that:
Increased levels of sulphur reduces the oxygen storage ability of the catalyst.
It was not conclusive that operating on high sulphur fuels would cause increased MIL events to occur but that high sulphur may increase the variability of the diagnostic decision.
There is some evidence to suggest that increased sulphur may reduce the response time of the downstream sensor.
Placement of oxygen sensors in a close-coupled catalyst might improve the tolerance of the diagnostic to increased sulphur levels.
Sulphur poisoning is largely reversible.
Research into improved catalyst composition could yield more sulphur tolerant catalysts.
Research into improved oxygen sensor design could yield a more sulphur tolerant components.
7.6 Exhaust Oxygen Sensor
The ability of the catalyst to control tailpipe emissions is strongly influenced by the behaviour of the exhaust oxygen sensor. The response time of the sensor to a change in exhaust lambda is particularly important because it will affect the proportion of time spent rich or lean of lambda one, which in turn will affect the catalyst emissions.
Exhaust oxygen sensors also undergo a change in response time due to ageing caused by exposure to hot exhaust gases. Typically the oxygen sensor located upstream of the catalyst will exhibit greater signs of ageing than the sensor located downstream of the catalyst. Control strategies utilising the downstream sensor signal are used to correct the response of the upstream sensor in an effort to combat the effects of ageing on the upstream sensor.
Only a small number of studies have been identified which directly discuss the effect of sulphur on lambda sensors
45, 46. However, these papers discuss resistive Titania
lambda sensors. Anecdotal internet evidence suggests that this type of sensor was
Orbital Australia Pty Ltd Page 90 Issue 1
used in less than 1% of vehicles and NGK Spark Plug Co Ltd (NGK)47
states that they are no longer used as original equipment. Another major supplier of lambda sensors (Bosch) does not make Titania sensors.
The main type of sensor in use today is zirconia (zirconium dioxide). No papers could be found that discussed the impact of fuel sulphur on zirconia sensors. Consequently, it remains unclear whether or not fuel sulphur directly affects the signal response of zirconia sensors. However, such sensors are seemingly capable of functioning under 150 ppm fuel sulphur levels to 100,000 km under ADR79/02 and presumably the same technology sensors are in service in the US under the fuel sulphur regime of up to 80 ppm and 160,000 km.
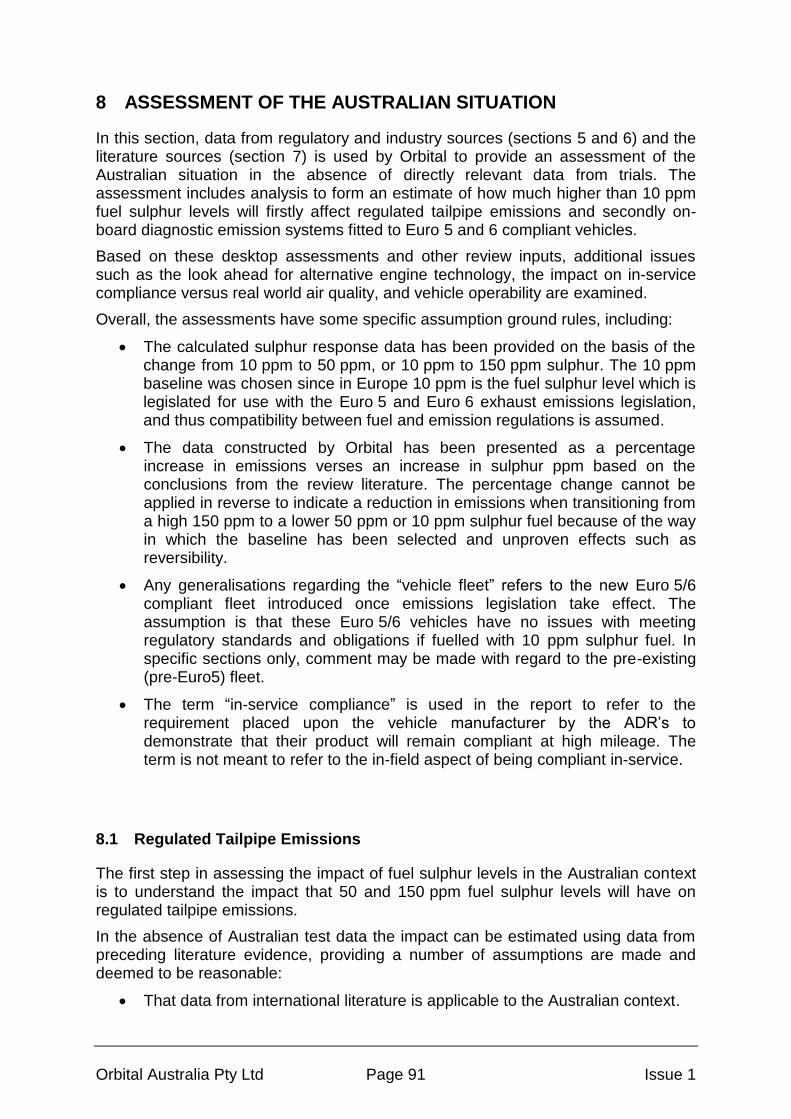
Orbital Australia Pty Ltd Page 91 Issue 1
8 ASSESSMENT OF THE AUSTRALIAN SITUATION
In this section, data from regulatory and industry sources (sections 5 and 6) and the literature sources (section 7) is used by Orbital to provide an assessment of the Australian situation in the absence of directly relevant data from trials. The assessment includes analysis to form an estimate of how much higher than 10 ppm fuel sulphur levels will firstly affect regulated tailpipe emissions and secondly on-board diagnostic emission systems fitted to Euro 5 and 6 compliant vehicles.
Based on these desktop assessments and other review inputs, additional issues such as the look ahead for alternative engine technology, the impact on in-service compliance versus real world air quality, and vehicle operability are examined.
Overall, the assessments have some specific assumption ground rules, including:
The calculated sulphur response data has been provided on the basis of the change from 10 ppm to 50 ppm, or 10 ppm to 150 ppm sulphur. The 10 ppm baseline was chosen since in Europe 10 ppm is the fuel sulphur level which is legislated for use with the Euro 5 and Euro 6 exhaust emissions legislation, and thus compatibility between fuel and emission regulations is assumed.
The data constructed by Orbital has been presented as a percentage increase in emissions verses an increase in sulphur ppm based on the conclusions from the review literature. The percentage change cannot be applied in reverse to indicate a reduction in emissions when transitioning from a high 150 ppm to a lower 50 ppm or 10 ppm sulphur fuel because of the way in which the baseline has been selected and unproven effects such as reversibility.
Any generalisations regarding the “vehicle fleet” refers to the new Euro 5/6 compliant fleet introduced once emissions legislation take effect. The assumption is that these Euro 5/6 vehicles have no issues with meeting regulatory standards and obligations if fuelled with 10 ppm sulphur fuel. In specific sections only, comment may be made with regard to the pre-existing (pre-Euro5) fleet.
The term “in-service compliance” is used in the report to refer to the requirement placed upon the vehicle manufacturer by the ADR’s to demonstrate that their product will remain compliant at high mileage. The term is not meant to refer to the in-field aspect of being compliant in-service.
8.1 Regulated Tailpipe Emissions
The first step in assessing the impact of fuel sulphur levels in the Australian context is to understand the impact that 50 and 150 ppm fuel sulphur levels will have on regulated tailpipe emissions.
In the absence of Australian test data the impact can be estimated using data from preceding literature evidence, providing a number of assumptions are made and deemed to be reasonable:
That data from international literature is applicable to the Australian context.

Orbital Australia Pty Ltd Page 92 Issue 1
That the vehicle emission capability of the vehicles in the study data is commensurate with the standard being assessed against in the Australian context.
That fuel properties, other than the sulphur level, are comparable between Australia and the jurisdictions that the base study data was obtained from and/or that any of the differences are secondary to the effects of the fuel sulphur.
That the Australian vehicle fleet is not unique and that fleet demographics with respect to large versus small and passenger versus light commercial are comparable to both earlier studies and the demographics of other jurisdictions of interest. A decade or so ago this may have been a challenge to agree on parity. However, recent trends are indicating a more typical mix with a reduction in large cars in favour of small to medium models.
That vehicles to be supplied to the Australian market to meet the requirements of Euro 5 and Euro 6 standards will be capable of meeting these emission targets if fuel sulphur was at the European recommended 10 ppm level.
That in-field reversibility, due to in-field drive cycle characteristics, is sufficient to provide stability in the level of sulphur deposited on the catalyst and associated aftertreatment system components over the in-service life of the vehicle. As in-field drive cycle characteristics have been demonstrated in NISE2, part 1
19 to be different for different jurisdictions this is an assumption
that has not been validated. The expectation is that the Australian drive characteristic (as represented by the petrol CUEDC) is more likely to provide this sulphur stability than the US FTP or Euro cycles.
That the results of the assessment are indicative of average fleet performance only and it is important to acknowledge that there will be better and worse examples for individual vehicle make/models which comprise the actual fleet.
Using a similar approach to the US EPA Mobile6 model, Orbital have calculated a fuel sulphur response curve using 10 and 150 ppm data from the Californian LEV study of 1997 MY vehicles (the CALEV study)
31. The CALEV study, though not
recent, used LEV vehicles built to meet an emission standard which is comparable to the tailpipe levels being targeted in Australia at Euro 5 and 6. The base engine and vehicle technology for these LEV vehicles was conventional MPI engines with TWC aftertreatment systems, and is comparable to the mainstream technology today which, despite the recent push for new technologies such as GDI to reduce CO2 emissions, still uses a TWC.
Orbital also considered data from subsequent studies, including the following two papers:
the CRC E-60 (2003) paper21
which provided fleet average data which showed a similar sulphur response especially for NOx as shown in Figure 7.10 and Figure 7.11, and
SAE 2011-01-030032
(2011) paper which studied a PZEV 4 cylinder application which demonstrated a similar sulphur response, but at much lower emissions levels.

Orbital Australia Pty Ltd Page 93 Issue 1
Some studies have also shown a very flat emission response to fuel sulphur, whilst others have shown a more dramatic response than the above. What is clear from the reviewed literature is that there have been response differences reported and that some level of tailpipe emission response to fuel sulphur is likely to be observed across a typical vehicle fleet. Rather than assuming no response, it becomes necessary to consider the implications that this may have regarding exhaust emissions, OBD and engineering margins if such a response was to be observed in the fleet.
The summary reports by Concawe20
and ExxonMobil18
showed that fleet average sulphur responses from the 1997 CALEV study were distorted by some vehicles. However, Orbital felt that a median worst case fleet response could still be calculated between 10 and 150 ppm sulphur. The calculated response curves would provide an appreciation of a possible “average worst case scenario” which could be applied to the very low emissions levels of Euro 5 and Euro 6 to observe the sulphur effects. SAE 2011-01-0300
32 discusses the possibility that a steeper sulphur
response may exist for vehicles meeting very low emissions standards, although this is not as steep as some of the outlier data in the CALEV study.
Using 100,000 mile (approximately 160,000 km) data from Figure 3 of the CALEV study
31 but excluding data from vehicles which have been deemed to be outliers,
Orbital have determined the emission response curves for THC, NOx and CO (note: the THC response is calculated by first adjusting
48 the NMHC raw data to provide a
THC value). The vehicle data sets that were used to generate the emissions response curve for each pollutant are listed above the relevant graphs in Figure 8.1. The list of all vehicle data sets which were available to choose from are shown in the key below the graphs in Figure 8.1. For calculating the THC response Taurus, Escort and Civic data is used, for calculating the NOx response Taurus, Metro and Civic data is used and for calculating the CO response Sentra, Camry and Metro data is used. It should be noted that while the CALEV study covered the 30 to 630 ppm fuel sulphur range, the response of interest is in the sub-150 ppm range only.
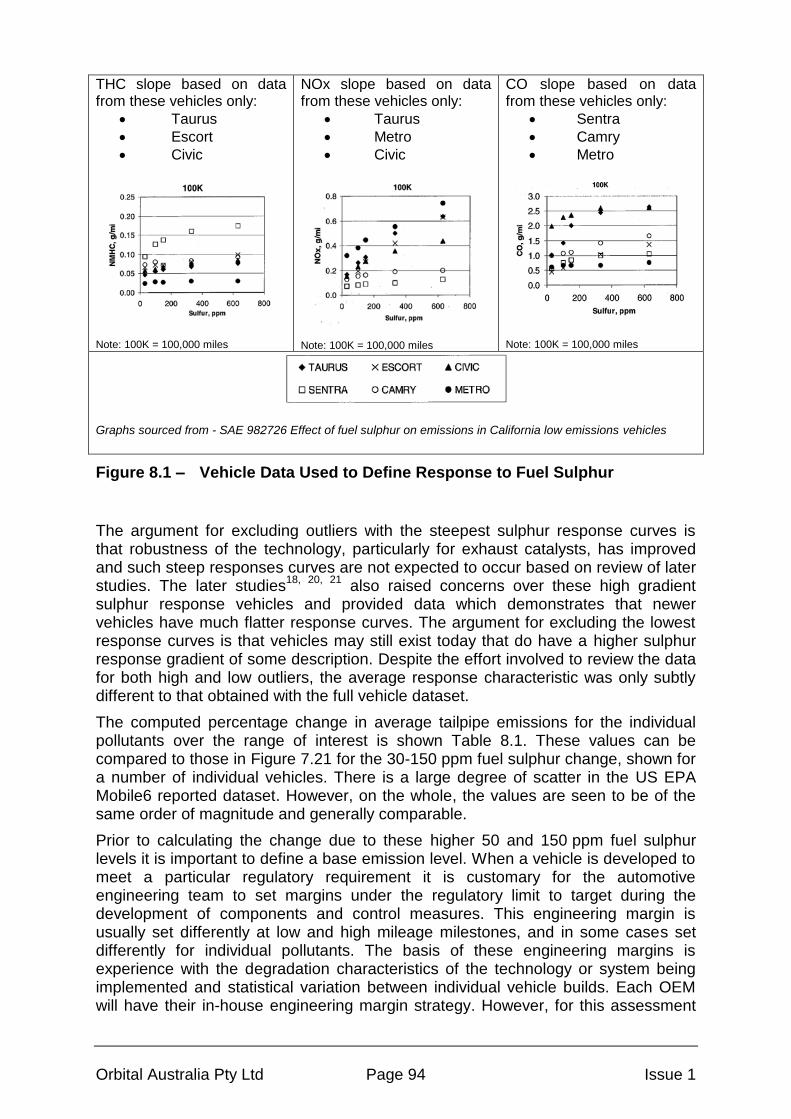
Orbital Australia Pty Ltd Page 94 Issue 1
THC slope based on data from these vehicles only:
Taurus
Escort
Civic
Note: 100K = 100,000 miles
NOx slope based on data from these vehicles only:
Taurus
Metro
Civic
Note: 100K = 100,000 miles
CO slope based on data from these vehicles only:
Sentra
Camry
Metro
Note: 100K = 100,000 miles
Graphs sourced from - SAE 982726 Effect of fuel sulphur on emissions in California low emissions vehicles
Figure 8.1 – Vehicle Data Used to Define Response to Fuel Sulphur
The argument for excluding outliers with the steepest sulphur response curves is that robustness of the technology, particularly for exhaust catalysts, has improved and such steep responses curves are not expected to occur based on review of later studies. The later studies
18, 20, 21 also raised concerns over these high gradient
sulphur response vehicles and provided data which demonstrates that newer vehicles have much flatter response curves. The argument for excluding the lowest response curves is that vehicles may still exist today that do have a higher sulphur response gradient of some description. Despite the effort involved to review the data for both high and low outliers, the average response characteristic was only subtly different to that obtained with the full vehicle dataset.
The computed percentage change in average tailpipe emissions for the individual pollutants over the range of interest is shown Table 8.1. These values can be compared to those in Figure 7.21 for the 30-150 ppm fuel sulphur change, shown for a number of individual vehicles. There is a large degree of scatter in the US EPA Mobile6 reported dataset. However, on the whole, the values are seen to be of the same order of magnitude and generally comparable.
Prior to calculating the change due to these higher 50 and 150 ppm fuel sulphur levels it is important to define a base emission level. When a vehicle is developed to meet a particular regulatory requirement it is customary for the automotive engineering team to set margins under the regulatory limit to target during the development of components and control measures. This engineering margin is usually set differently at low and high mileage milestones, and in some cases set differently for individual pollutants. The basis of these engineering margins is experience with the degradation characteristics of the technology or system being implemented and statistical variation between individual vehicle builds. Each OEM will have their in-house engineering margin strategy. However, for this assessment
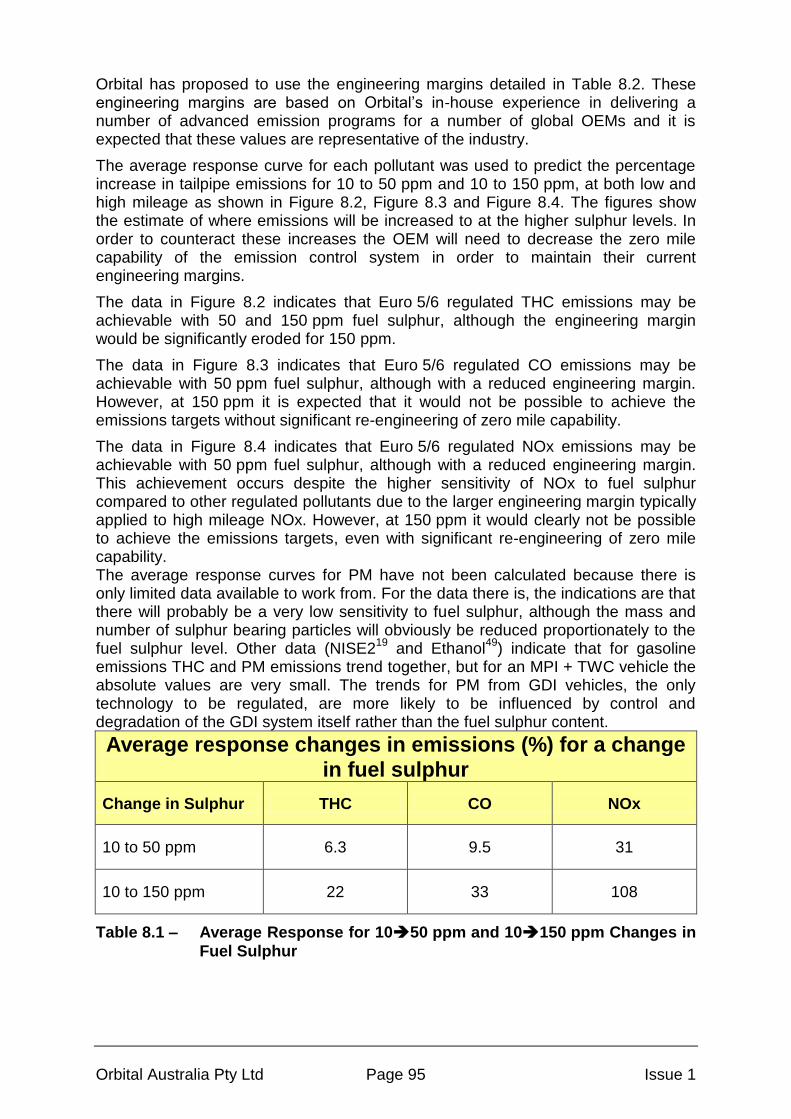
Orbital Australia Pty Ltd Page 95 Issue 1
Orbital has proposed to use the engineering margins detailed in Table 8.2. These engineering margins are based on Orbital’s in-house experience in delivering a number of advanced emission programs for a number of global OEMs and it is expected that these values are representative of the industry.
The average response curve for each pollutant was used to predict the percentage increase in tailpipe emissions for 10 to 50 ppm and 10 to 150 ppm, at both low and high mileage as shown in Figure 8.2, Figure 8.3 and Figure 8.4. The figures show the estimate of where emissions will be increased to at the higher sulphur levels. In order to counteract these increases the OEM will need to decrease the zero mile capability of the emission control system in order to maintain their current engineering margins.
The data in Figure 8.2 indicates that Euro 5/6 regulated THC emissions may be achievable with 50 and 150 ppm fuel sulphur, although the engineering margin would be significantly eroded for 150 ppm.
The data in Figure 8.3 indicates that Euro 5/6 regulated CO emissions may be achievable with 50 ppm fuel sulphur, although with a reduced engineering margin. However, at 150 ppm it is expected that it would not be possible to achieve the emissions targets without significant re-engineering of zero mile capability.
The data in Figure 8.4 indicates that Euro 5/6 regulated NOx emissions may be achievable with 50 ppm fuel sulphur, although with a reduced engineering margin. This achievement occurs despite the higher sensitivity of NOx to fuel sulphur compared to other regulated pollutants due to the larger engineering margin typically applied to high mileage NOx. However, at 150 ppm it would clearly not be possible to achieve the emissions targets, even with significant re-engineering of zero mile capability. The average response curves for PM have not been calculated because there is only limited data available to work from. For the data there is, the indications are that there will probably be a very low sensitivity to fuel sulphur, although the mass and number of sulphur bearing particles will obviously be reduced proportionately to the fuel sulphur level. Other data (NISE2
19 and Ethanol
49) indicate that for gasoline
emissions THC and PM emissions trend together, but for an MPI + TWC vehicle the absolute values are very small. The trends for PM from GDI vehicles, the only technology to be regulated, are more likely to be influenced by control and degradation of the GDI system itself rather than the fuel sulphur content.
Average response changes in emissions (%) for a change
in fuel sulphur
Change in Sulphur THC CO NOx
10 to 50 ppm 6.3 9.5 31
10 to 150 ppm 22 33 108
Table 8.1 – Average Response for 1050 ppm and 10150 ppm Changes in
Fuel Sulphur

Orbital Australia Pty Ltd Page 96 Issue 1
Engineering Margin (%)
Condition THC CO NOx
Low Mileage 60 60 50
High Mileage 20 20 30
Table 8.2 – Engineering Margin Applied to Emission Targets
0
0.02
0.04
0.06
0.08
0.1
0.12
0.14
0.16
0 20000 40000 60000 80000 100000 120000 140000 160000 180000
THC
(g/
km)
Mileage (km)
Sulphur effect on THC legislated tailpipe emissions
Engineering marginat high mileage
Euro
5 /
6
Euro
4
Emissionscomponentsand sulphur induced ageing
Degradation slope is an indicative trend
Increase in emissions that would occurfor an increase in sulphur from 10 to 150ppm
Increase in emissions that would occurfor an increase in sulphur from 10 to 50ppm
Note Engineering marginsare typical example values
Engineering marginat low mileage
Figure 8.2 – Estimated Sulphur Effect on THC Tailpipe Emissions
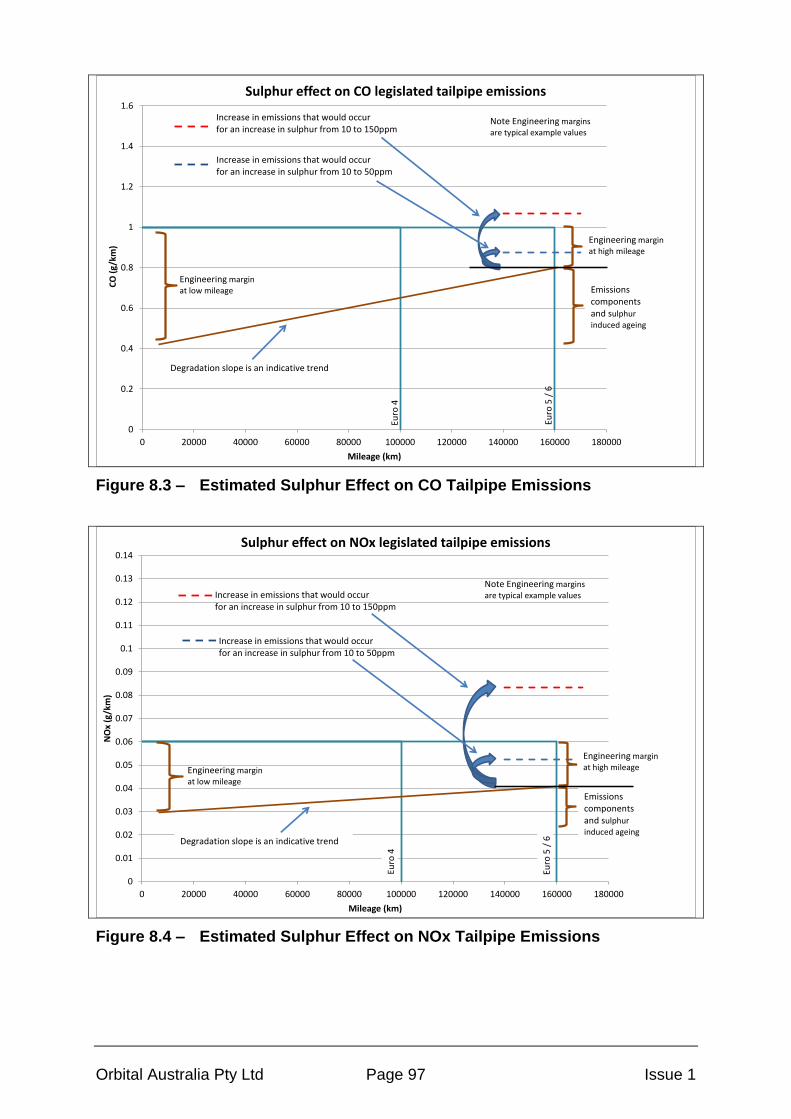
Orbital Australia Pty Ltd Page 97 Issue 1
0
0.2
0.4
0.6
0.8
1
1.2
1.4
1.6
0 20000 40000 60000 80000 100000 120000 140000 160000 180000
CO
(g/
km)
Mileage (km)
Sulphur effect on CO legislated tailpipe emissions
Engineering marginat high mileage
Euro
5 /
6
Euro
4
Emissionscomponentsand sulphur induced ageing
Increase in emissions that would occurfor an increase in sulphur from 10 to 150ppm
Increase in emissions that would occurfor an increase in sulphur from 10 to 50ppm
Engineering marginat low mileage
Degradation slope is an indicative trend
Note Engineering marginsare typical example values
Figure 8.3 – Estimated Sulphur Effect on CO Tailpipe Emissions
0
0.01
0.02
0.03
0.04
0.05
0.06
0.07
0.08
0.09
0.1
0.11
0.12
0.13
0.14
0 20000 40000 60000 80000 100000 120000 140000 160000 180000
NO
x (g
/km
)
Mileage (km)
Sulphur effect on NOx legislated tailpipe emissions
Engineering marginat high mileage
Euro
5 /
6
Euro
4
Emissionscomponentsand sulphur induced ageing
Increase in emissions that would occurfor an increase in sulphur from 10 to 150ppm
Increase in emissions that would occurfor an increase in sulphur from 10 to 50ppm
Engineering marginat low mileage
Degradation slope is an indicative trend
Note Engineering marginsare typical example values
Figure 8.4 – Estimated Sulphur Effect on NOx Tailpipe Emissions
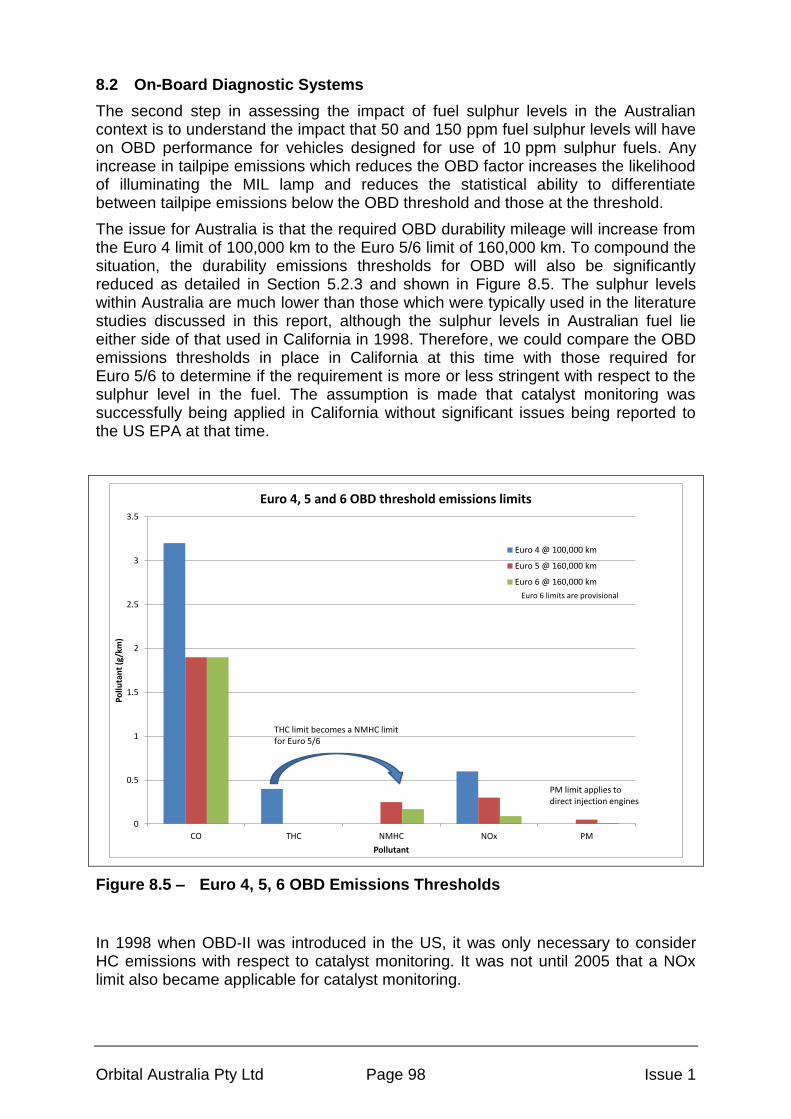
Orbital Australia Pty Ltd Page 98 Issue 1
8.2 On-Board Diagnostic Systems
The second step in assessing the impact of fuel sulphur levels in the Australian context is to understand the impact that 50 and 150 ppm fuel sulphur levels will have on OBD performance for vehicles designed for use of 10 ppm sulphur fuels. Any increase in tailpipe emissions which reduces the OBD factor increases the likelihood of illuminating the MIL lamp and reduces the statistical ability to differentiate between tailpipe emissions below the OBD threshold and those at the threshold.
The issue for Australia is that the required OBD durability mileage will increase from the Euro 4 limit of 100,000 km to the Euro 5/6 limit of 160,000 km. To compound the situation, the durability emissions thresholds for OBD will also be significantly reduced as detailed in Section 5.2.3 and shown in Figure 8.5. The sulphur levels within Australia are much lower than those which were typically used in the literature studies discussed in this report, although the sulphur levels in Australian fuel lie either side of that used in California in 1998. Therefore, we could compare the OBD emissions thresholds in place in California at this time with those required for Euro 5/6 to determine if the requirement is more or less stringent with respect to the sulphur level in the fuel. The assumption is made that catalyst monitoring was successfully being applied in California without significant issues being reported to the US EPA at that time.
0
0.5
1
1.5
2
2.5
3
3.5
CO THC NMHC NOx PM
Po
lluta
nt
(g/k
m)
Pollutant
Euro 4, 5 and 6 OBD threshold emissions limits
Euro 4 @ 100,000 km
Euro 5 @ 160,000 km
Euro 6 @ 160,000 km
PM limit applies todirect injection engines
THC limit becomes a NMHC limitfor Euro 5/6
Euro 6 limits are provisional
Figure 8.5 – Euro 4, 5, 6 OBD Emissions Thresholds
In 1998 when OBD-II was introduced in the US, it was only necessary to consider HC emissions with respect to catalyst monitoring. It was not until 2005 that a NOx limit also became applicable for catalyst monitoring.

Orbital Australia Pty Ltd Page 99 Issue 1
In order to compare the Californian and Euro 4, 5, 6 tailpipe and OBD emissions thresholds it is necessary to convert US NMHC and NMOG thresholds to THC thresholds. It is also necessary for reporting to convert data which is in units of g/mi to g/km for comparison purposes. In 1998 the OBD requirement was for THC emissions to be less than 1.75 times the FTP THC standard or that the average NMHC conversion efficiency falls below 50%
50. Additionally in 2005 the OBD
requirement was for NOx emissions to be less than 3.5 times the FTP NOx standard.
The assessment of fuel sulphur on OBD requirements will be undertaken separately for THC and NOx emissions. As with the assessment of tailpipe emissions in Section 8.1, this assessment requires acknowledgment of a number of assumptions about the inputs and results. The assessment has not been undertaken for PM for similar reasons as given in Section 8.1, namely there being only limited data available to consider and the response indicating relatively low sensitivity. Despite this, the concerns expressed by one OEM (see Section 6.1.2) are noted.
Euro 5/6 OBD Assessment for THC
For THC Orbital does not have access to conversion efficiency data. Therefore only the 1.75 times threshold can be used.
In 1998 the Tier I tailpipe exhaust emissions requirements in California were51
:
for 1995-2003 passenger cars at 100,000 miles 0.31 g/mi NMHC
for LEV I 1992-2003 100,000 miles vehicles TLEV=0.156 g/mi NMOG
for LEV I 1992-2003 100,000 miles vehicles LEV=0.090 g/mi NMOG
Figure 8.6 shows tailpipe and OBD emission thresholds for Californian LEV and Euro 5/6. The THC response to fuel sulphur levels of 50 and 150 ppm was calculated in Section 8.1 (see Figure 8.2) and is also plotted in Figure 8.6. The data shows that the LEV / TLEV vehicles in 1998 were targeting similar tailpipe emissions and OBD emissions thresholds to the proposed Euro 6 THC targets.
Using 150 ppm sulphur as an example as shown in Figure 8.6 it can be observed that there is a reduction in the OBD factor (the difference between the legislated tailpipe emissions threshold and the OBD emission threshold) due to sulphur. Any increase in tailpipe emissions which reduces the factor increases the likelihood of illuminating the MIL lamp and reduces the statistical ability to differentiate between tailpipe emissions below the OBD threshold and those at the threshold.
It seems plausible with regard to THC/NMHC that catalyst monitoring diagnostics designed to target Euro 5/6 OBD emissions thresholds might be achieved with either 150 or 50 ppm sulphur given that:
Californian 80 ppm fuel sulphur was at mid-range to current Australian 50 and 150 ppm levels.
LEV vehicles have a more stringent relationship between HC tailpipe and OBD emissions threshold than Euro 5 and Euro 6, and they managed to operate without significant reported failings.

Orbital Australia Pty Ltd Page 100 Issue 1
Catalysts and oxygen sensors have become more sulphur tolerant and have increased with regard to efficiency over the past 15 years since the 1998 LEV introduction.
The use of close-coupled catalysts may reduce sulphur sensitivity.
Engine control units today have more sophisticated processors than they did in 1998, allowing improved statistical calculations to be made.
More recent studies on fuel sulphur sensitivity suggest that there is less of an issue. According to the US EPA, there was not enough evidence to say that catalyst monitoring was unreliable in the past even when there was a risk due to significant step changes in fuel sulphur levels between jurisdictions.
0.000
0.050
0.100
0.150
0.200
0.250
0.300
0.350
0.400
0.450
0.00 0.05 0.10 0.15 0.20 0.25 0.30 0.35 0.40 0.45
THC
(g/
km)
Tailp
ipe
Em
issi
on
s L
imit
s
THC (g/km) OBD Threshold
Reduction in OBD THC emissions factor due to increase in sulphur
California 1998 LEV I (TLEV vehicle) 100,000 mi
Euro 4 100,000 km
Euro 5 160,000 km
Euro 6 160,000 km
% increase in emisisons from 10 to 150 ppm change in sulphur
% increase in emisisons from 10 to 50 ppm change in sulphur
Euro 5&6 tailpipe legislated limit
NMHC and NMOG limits converted to THCusing conversion factors for hydrocarbonemissions (EPA report EPA420-R-05-015)
California CaRFG2 gasoline = 80ppm in 1998(g/mi limits converted to g/km)
tailp
ipe
legi
slat
ed li
mit
Eu
ro 5
&6
10
to
50
pp
mEu
ro 5
&6
10
to
15
0 p
pm
Euro
5&
6
Original Euro6 OBD margin
Original Euro5 OBD margin
Reduced 150ppm Euro5 OBD margin
Reduced 150ppm Euro6 OBD margin
Figure 8.6 – Comparison of California and Australian THC Emissions Limits
Euro 5/6 OBD Assessment for NOx
An equivalent graph to Figure 8.6 was constructed for NOx emissions using a similar method. As there was no NOx OBD requirement in 1998, data from 2005 when NOx was introduced has been used.
In 2005 the LEV II tailpipe exhaust emissions requirements in California were52
:
for 2005-2006 passenger cars at 120,000 miles, 0.07 g/mi NOx.
Figure 8.7 shows that the LEV II vehicles in 2005 were targeting a more stringent relationship between the tailpipe NOx emissions threshold and the OBD emissions
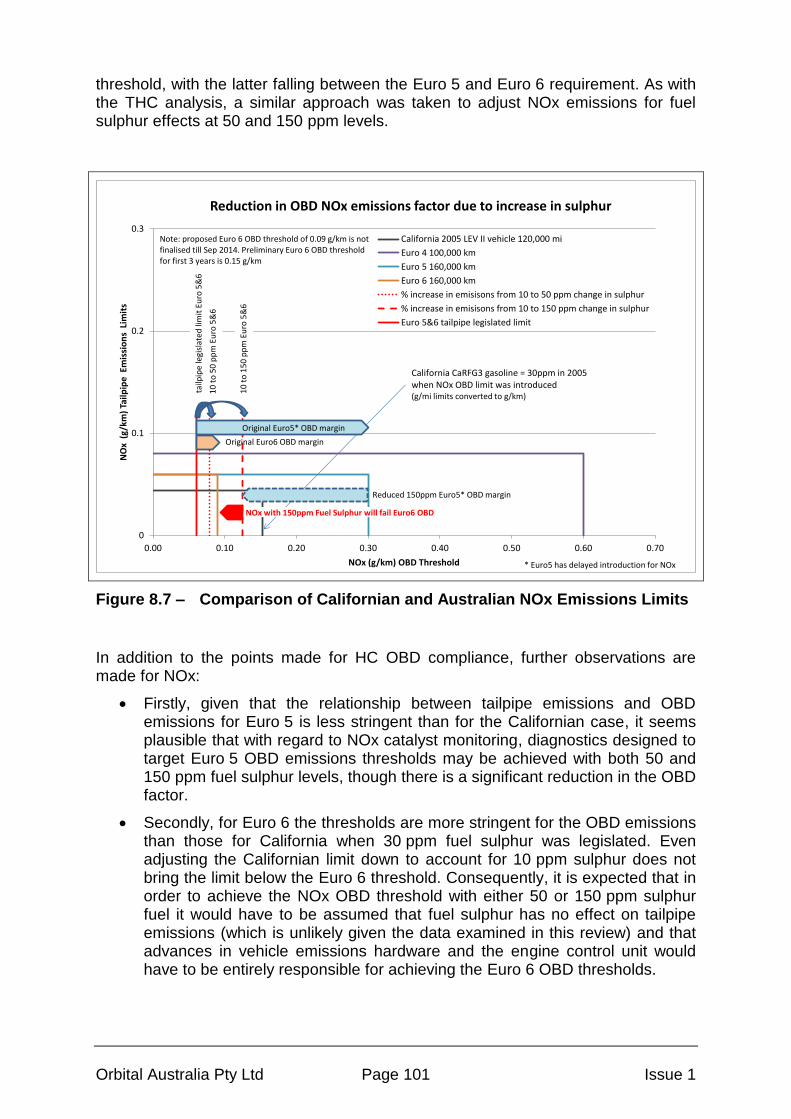
Orbital Australia Pty Ltd Page 101 Issue 1
threshold, with the latter falling between the Euro 5 and Euro 6 requirement. As with the THC analysis, a similar approach was taken to adjust NOx emissions for fuel sulphur effects at 50 and 150 ppm levels.
0
0.1
0.2
0.3
0.00 0.10 0.20 0.30 0.40 0.50 0.60 0.70
NO
x (
g/km
) Ta
ilpip
e E
mis
sio
ns
Lim
its
NOx (g/km) OBD Threshold
Reduction in OBD NOx emissions factor due to increase in sulphur
California 2005 LEV II vehicle 120,000 mi
Euro 4 100,000 km
Euro 5 160,000 km
Euro 6 160,000 km
% increase in emisisons from 10 to 50 ppm change in sulphur
% increase in emisisons from 10 to 150 ppm change in sulphur
Euro 5&6 tailpipe legislated limit
California CaRFG3 gasoline = 30ppm in 2005when NOx OBD limit was introduced(g/mi limits converted to g/km)
Note: proposed Euro 6 OBD threshold of 0.09 g/km is notfinalised till Sep 2014. Preliminary Euro 6 OBD thresholdfor first 3 years is 0.15 g/km
10
to
50
pp
mEu
ro 5
&6
10
to
15
0 p
pm
Euro
5&
6
tailp
ipe
legi
slat
ed li
mit
Eu
ro 5
&6
Original Euro6 OBD margin
Original Euro5* OBD margin
Reduced 150ppm Euro5* OBD margin
NOx with 150ppm Fuel Sulphur will fail Euro6 OBD
* Euro5 has delayed introduction for NOx
Figure 8.7 – Comparison of Californian and Australian NOx Emissions Limits
In addition to the points made for HC OBD compliance, further observations are made for NOx:
Firstly, given that the relationship between tailpipe emissions and OBD emissions for Euro 5 is less stringent than for the Californian case, it seems plausible that with regard to NOx catalyst monitoring, diagnostics designed to target Euro 5 OBD emissions thresholds may be achieved with both 50 and 150 ppm fuel sulphur levels, though there is a significant reduction in the OBD factor.
Secondly, for Euro 6 the thresholds are more stringent for the OBD emissions than those for California when 30 ppm fuel sulphur was legislated. Even adjusting the Californian limit down to account for 10 ppm sulphur does not bring the limit below the Euro 6 threshold. Consequently, it is expected that in order to achieve the NOx OBD threshold with either 50 or 150 ppm sulphur fuel it would have to be assumed that fuel sulphur has no effect on tailpipe emissions (which is unlikely given the data examined in this review) and that advances in vehicle emissions hardware and the engine control unit would have to be entirely responsible for achieving the Euro 6 OBD thresholds.

Orbital Australia Pty Ltd Page 102 Issue 1
The OBD factor is of particular interest when discussing the likelihood of meeting the OBD emissions threshold for NOx with 150 ppm sulphur fuel. In 2012 the EU proposed a final NOx limit of 0.09 g/km
52, with a preliminary limit of 0.15 g/km for the
first three years of Euro 6. In addition the EU proposes to review the 0.09 g/km limit in 2014. The EU also considers that the OBD factors for Europe should reflect those set by CARB in the US.
Figure 8.8 shows a summary of the OBD factors calculated from proposed and preliminary regulations, and the reduction in these estimated with the use of 50 and 150 ppm sulphur fuels. It is possible that on the basis of the data presented above that Australia may need to consider using the preliminary Euro OBD factor for NOx if the fuel sulphur level is not reduced from 150 ppm to at least 50 ppm.
50ppm 150ppmTailpipe THC OBD factor OBD factor OBD factor
Euro 4 ADR79/02 100,000 km 0.1 4.00
Euro 5 ADR79/03 160,000 km 0.1 2.78 2.61 2.27
Euro 6 ADR79/05 160,000 km 0.1 1.89 1.78 1.55
Tailpipe NOx OBD factor OBD factor OBD factor
Euro 4 ADR79/02 100,000 km 0.08 7.50
Euro 5 ADR79/04 160,000 km 0.06 5.00 3.82 2.41
Euro 6 ADR79/05 160,000 km 0.06 1.50 1.15 0.72
Note: THC OBD equivalent derived from Conversion Factors for Hydrocarbon Emission Components EPA 2005
50ppm 150ppmTailpipe NOx OBD factor OBD factor OBD factor
Euro 6 ADR79/05 160,000 km 0.06 2.50 1.91 1.20
Proposed final EURO OBD threshold limits
Preliminary EURO OBD threshold limits
Figure 8.8 – Estimated OBD Factors at 50 and 150 ppm Fuel Sulphur
8.3 Look Ahead for Alternative Engine Technology
Australia is mostly an importer of automotive technology and thus is unlikely to set its own trends which conflict with those of other major markets such as the US or Europe. As part of the introduction of the Light vehicle CO2 emissions standards for Australia (key issues discussions paper 2011)
53 a fleet study
54 has been
commissioned to review and forecast the technology uptake required to meet proposed CO2 emission milestones. At the time of writing this review of fuel sulphur limits, the CO2 fleet study report has not been released and therefore cannot be referenced with respect to Australian-specific predictions.
Figure 8.9 shows a typical fuel economy technology roadmap. As can be seen, there are multiple paths to attaining a CO2 reduction, with larger gains being the result of the combination of individual technologies and some merging of the approaches. One path is the GDI route (shown in yellow), initially as a stoichiometric λ=1 solution, progressing to a lean-burn approach. Another path (shown in orange) is the downsize-boosted approach, ultimately enhanced with the use of GDI. The third route (shown in green) involves a level of hybridisation (energy storage using batteries and traction electric motors).

Orbital Australia Pty Ltd Page 103 Issue 1
Graphs sourced from Orbital Australia (in-house benchmarking)
Figure 8.9 – Typical Fuel Economy Technology Roadmap
Rather than pre-empt the conclusions of the CO2 technology forecast study, reference is made to forecasts for technology trends in Europe (see Figure 8.10). As Australia moves towards mandated light vehicle CO2 emission standards, coupled with shifts in vehicle demographics to a dominant import situation, it can be reasonably presumed that Australia would eventually adopt many of these indicated technologies.
Most probable technology path
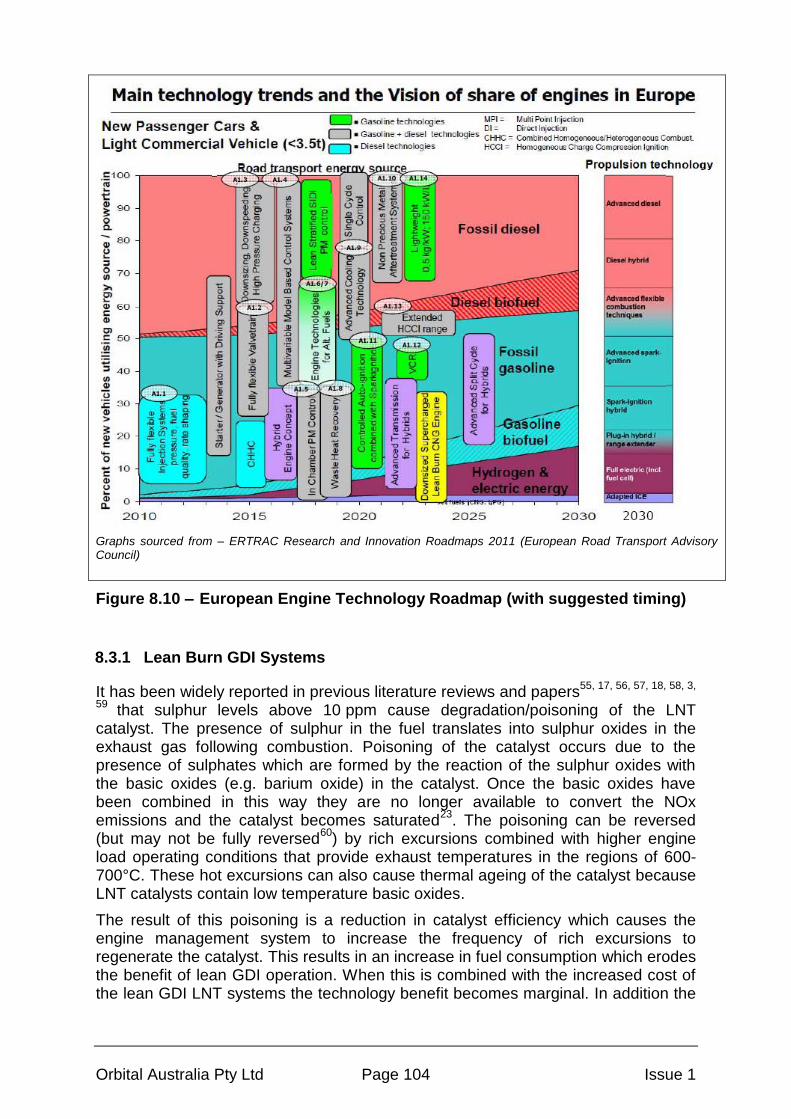
Orbital Australia Pty Ltd Page 104 Issue 1
Graphs sourced from – ERTRAC Research and Innovation Roadmaps 2011 (European Road Transport Advisory Council)
Figure 8.10 – European Engine Technology Roadmap (with suggested timing)
8.3.1 Lean Burn GDI Systems
It has been widely reported in previous literature reviews and papers55, 17, 56, 57, 18, 58, 3,
59 that sulphur levels above 10 ppm cause degradation/poisoning of the LNT
catalyst. The presence of sulphur in the fuel translates into sulphur oxides in the exhaust gas following combustion. Poisoning of the catalyst occurs due to the presence of sulphates which are formed by the reaction of the sulphur oxides with the basic oxides (e.g. barium oxide) in the catalyst. Once the basic oxides have been combined in this way they are no longer available to convert the NOx emissions and the catalyst becomes saturated
23. The poisoning can be reversed
(but may not be fully reversed60
) by rich excursions combined with higher engine load operating conditions that provide exhaust temperatures in the regions of 600-700°C. These hot excursions can also cause thermal ageing of the catalyst because LNT catalysts contain low temperature basic oxides.
The result of this poisoning is a reduction in catalyst efficiency which causes the engine management system to increase the frequency of rich excursions to regenerate the catalyst. This results in an increase in fuel consumption which erodes the benefit of lean GDI operation. When this is combined with the increased cost of the lean GDI LNT systems the technology benefit becomes marginal. In addition the

Orbital Australia Pty Ltd Page 105 Issue 1
combination of an increased requirement for regeneration with typical driving styles may lead to a saturated catalyst and the illumination of the MIL.
Due to the issues discussed above and other difficulties such as durability with LNT technology, the predicted uptake of this technology has not emerged
57, 18, 61. In
recent times technologies such as downsizing and turbocharging and new technologies such as HCCI are predicted to deliver improvements in fuel consumption
21 similar in magnitude to lean GDI LNT technology. It has been
predicted that the uptake of lean GDI LNT is likely to remain at less than 3%57
in the US.
Pending the findings of the Australian CO2 emissions technology roadmap54
the likely uptake of lean GDI LNT technology in the next 10 years may not be sufficient reason to warrant the introduction for 10 ppm sulphur gasoline fuel. It is considered that for lean GDI LNT to deliver better fuel consumption benefits at high mileage than boosted-downsized GDI+TWC systems (see Section 8.3.2), zero sulphur fuel will be needed.
However, it should be noted that in a fuel sulphur environment of 50 to 150 ppm it is unlikely that lean burn GDI will deliver on its potential to reduce CO2 emissions.
8.3.2 Homogeneous GDI+TWC with/without Downsizing and Boosting
Homogeneous GDI+TWC with or without turbocharging is seen as the dominant technology for the near term, while HCCI developments unfold.
Section 7.1.7 discusses one of the few papers which contains data for a homogeneous (not lean burn) GDI engine with a TWC. Even today, such GDI+TWC systems are expected to be the main implementation of GDI in the foreseeable future. The conclusion of this paper was that there was no short term low mileage sulphur response for emissions over the NEDC drive cycle. Over the EUDC drive cycle there was a low emissions response to fuel sulphur levels over short term low mileage tests. HC’s showed a low positive response while a low negative response for CO was seen with increasing fuel sulphur levels. However, the tailpipe emissions were very low relative to the legislated limit.
Since homogenous GDI systems presently rely only on TWC aftertreatment systems it can be concluded that in a fuel sulphur environment of 50 to 150 ppm their performance (emissions and OBD) will be similar to MPI systems for which there is more data.
8.3.3 Homogeneous Charge Compression Ignition (HCCI)
Studies relating to the sulphur response of an HCCI engine do not currently exist; greater issues have to be resolved before such detailed investigations are likely to be made. The fuels sector, in particular through the Martec
17, 57 reports, points to
HCCI as an emerging technology insensitive to fuel sulphur and predicts that HCCI is likely to be one of the main emerging technologies that will parallel stoichiometric GDI development and is likely to occupy approximately 5-10% of the market by 2020.
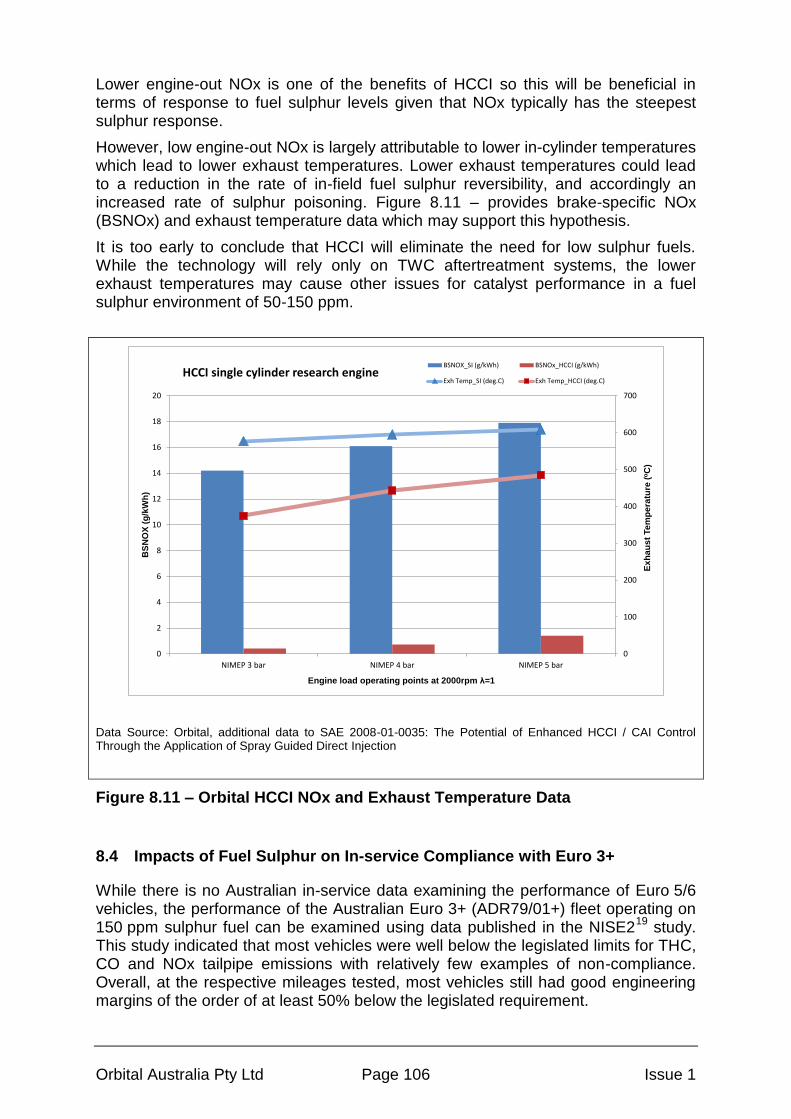
Orbital Australia Pty Ltd Page 106 Issue 1
Lower engine-out NOx is one of the benefits of HCCI so this will be beneficial in terms of response to fuel sulphur levels given that NOx typically has the steepest sulphur response.
However, low engine-out NOx is largely attributable to lower in-cylinder temperatures which lead to lower exhaust temperatures. Lower exhaust temperatures could lead to a reduction in the rate of in-field fuel sulphur reversibility, and accordingly an increased rate of sulphur poisoning. Figure 8.11 – provides brake-specific NOx (BSNOx) and exhaust temperature data which may support this hypothesis.
It is too early to conclude that HCCI will eliminate the need for low sulphur fuels. While the technology will rely only on TWC aftertreatment systems, the lower exhaust temperatures may cause other issues for catalyst performance in a fuel sulphur environment of 50-150 ppm.
0
100
200
300
400
500
600
700
0
2
4
6
8
10
12
14
16
18
20
NIMEP 3 bar NIMEP 4 bar NIMEP 5 bar
Ex
ha
us
t Te
mp
era
ture
(oC
)
BS
NO
X (
g/k
Wh
)
Engine load operating points at 2000rpm λ=1
HCCI single cylinder research engineBSNOX_SI (g/kWh) BSNOx_HCCI (g/kWh)
Exh Temp_SI (deg.C) Exh Temp_HCCI (deg.C)
Data Source: Orbital, additional data to SAE 2008-01-0035: The Potential of Enhanced HCCI / CAI Control Through the Application of Spray Guided Direct Injection
Figure 8.11 – Orbital HCCI NOx and Exhaust Temperature Data
8.4 Impacts of Fuel Sulphur on In-service Compliance with Euro 3+
While there is no Australian in-service data examining the performance of Euro 5/6 vehicles, the performance of the Australian Euro 3+ (ADR79/01+) fleet operating on 150 ppm sulphur fuel can be examined using data published in the NISE2
19 study.
This study indicated that most vehicles were well below the legislated limits for THC, CO and NOx tailpipe emissions with relatively few examples of non-compliance. Overall, at the respective mileages tested, most vehicles still had good engineering margins of the order of at least 50% below the legislated requirement.

Orbital Australia Pty Ltd Page 107 Issue 1
These results confirm that under a regime where market fuel is at the design/certification level, conventional vehicle technology such as TWC catalysts, engine management systems and fuel systems have matured to the point that in-service compliance is readily achievable for Euro 3.
Given the engineering margins observed, there is confidence that most makes/models would not be overly challenged by the need to comply with Euro 4 (ADR79/02) despite many having to achieve this operating on 150 ppm sulphur fuel as opposed to 50 ppm sulphur being specified in Europe at the time.
A lowering of fuel sulphur to 10 ppm would arguably make the in-service compliance objectives for Euro 3 and Euro 4 vehicles easier to attain as the lower fuel sulphur would reduce the burden on the catalyst systems fitted to these vehicles. However, for the reasons outlined at the outset of the assessment section of this report, it does not immediately mean that tailpipe emissions would be lower as a result.
8.5 Impacts of Fuel Sulphur on In-service Compliance with Euro 5/6
Section 8.1 detailed the assessment of fuel sulphur levels of 50 and 150 ppm, compared to 10 ppm, on regulated tailpipe emissions. In that analysis, in-field reversibility was assumed (at high mileage) and it was also assumed that the only effect on results was due to the step change in fuel sulphur levels at the time of testing.
For demonstrating in-service compliance, the vehicle OEM may perform pre-conditioning drives which may also ensure that reversibility of the sulphur effects has occurred prior to drive cycle emissions testing being undertaken. There is also the fact that emissions tests for in-service compliance demonstration are likely to be undertaken using certification grade fuels. For Euro 5/6 the certification test fuel will be at low sulphur, 10 ppm levels.
Under these conditions it is likely that in-service compliance will be satisfactorily demonstrable for vehicles equipped with TWC exhaust aftertreatment systems, even if there are OBD issues identified when operating in the field. As such, it is considered that in-field fuel sulphur levels are a non-issue for the demonstration of in-service compliance by the OEM if testing is indeed undertaken as outlined above.
The use of 10 ppm fuel sulphur would arguably make the in-service compliance objectives for Euro 5 and Euro 6 vehicles achievable since this is what exists in the European context.
8.6 Impacts of Fuel Sulphur on Real World Air Quality
Section 8.1 detailed the assessment of fuel sulphur levels of 50 and 150 ppm, compared to 10 ppm, on regulated tailpipe emissions. Section 8.4 and 8.5 detailed the conditions under which in-service compliance may be demonstrable for automotive OEMs.
However, all of these conditions are unlikely to be incurred in the real world where air quality is measured with vehicles operating on available pump fuel in regular day-to-day duties.
On the basis of analysis of data in Section 8.1 without additional measures by the OEM to make their vehicles be compliant with in-field available fuels, it is

Orbital Australia Pty Ltd Page 108 Issue 1
unavoidable that there would be some increase in real world pollutant levels. The compromise in air quality is as a result of the use of either 50 or 150 ppm sulphur fuels compared to the emission picture which could be achieved with 10 ppm sulphur fuels, the fuel used in Europe for Euro 5/6 vehicles and nominated as the certification fuel standard.
Whether the extent of the compromise is as shown in Section 8.1 depends firstly upon whether emissions response rates are as assumed – according to the spread of results in the literature there is scope that they are indeed lower, just as there is scope that they could be higher. Secondly, the question of in-field reversibility needs to be addressed.
If in-field catalyst temperatures are sufficiently high, and higher than indicated by legislative drive cycle results, then there is a reasonable chance that extended mileage effects from operation on higher fuel sulphur levels could be minimised or eliminated, thus leaving only the step change response to contend with.
If in-field reversibility was not to occur, then catalyst performance would be compromised by both the effects of extended operation on higher fuel sulphur levels and the effects of the higher fuel sulphur level itself. This potential situation is demonstrated by data from the US EPA Mobile6 study (see Section 7.1.12).
The alternate question posed is whether real world air quality would improve as a result of using 10 ppm fuel sulphur fleet-wide, including for legacy pre-Euro 5 vehicles. This assessment is difficult to make in the absence of reliable data on the real-world in-field reversibility of the fuel sulphur effects. As noted in section 8.5, Euro 5 and 6 vehicles are unlikely to be compromised in meeting OEM in-service compliance by running with higher sulphur fuels. However, the question of whether the existing fleet of pre-Euro 5 vehicles or even Euro 5/6 vehicles with a prior history of running on 50 or 150 ppm fuel sulphur would “clean-up” is strongly related to the question of real-world in-field reversibility, and presently remains unanswered.
8.7 Operability of Vehicles Imported into Australia
Another concern regarding fuel sulphur is vehicles which have been designed and calibrated specifically to meet European or US emissions legislation using low sulphur fuel may experience issues when imported to Australia and operated on higher sulphur fuels such as 50 or 150 ppm.
Regarding stratified GDI NOx trap applications (and as discussed in Section 8.3.1) the main issue which is highly likely to arise is an increase in fuel consumption. Over a period of time the lean NOx storage catalyst will be deactivated by the higher sulphur fuel, leading to reduction in NOx storage and a corresponding increase in the frequency of λ=1 or rich catalyst regeneration events to regenerate catalyst performance. From an operability point of view the driver of the vehicle is likely to become aware of a reduction in fuel economy, and depending upon the subtlety of the regeneration mode may also experience more frequent changes in driver feel.
In addition, these vehicles may also be subject to the issues discussed below.
Regarding stoichiometric GDI and MPI applications, issues which may arise are likely to fall into three categories:
In-field exhaust emissions may be higher than expected.

Orbital Australia Pty Ltd Page 109 Issue 1
In-field OBD response may be compromised.
There may be an increase in the production or frequency of production of H2S emissions. The emission of H2S is best known as the odour associated with the smell of rotten eggs.
Regarding in-field exhaust emissions:
If a sulphur response exists then as the literature indicates vehicles calibrated on low sulphur fuel to meet regulated targets which are then operated in the field on high sulphur fuel may produce higher tailpipe emissions, and these may exceed the legislated limit. However, from an operability point of view, the driver of the vehicle is unlikely to experience any observable issues.
Regarding OBDs:
In response to increased emissions or a reduction in catalyst oxygen storage efficiency the on-board catalyst monitoring diagnostic may illuminate the MIL prematurely, especially as the vehicle approaches high mileage conditions. From an operability point of view this will impact the driver if they follow the instructions in the vehicle user’s manual and seek servicing of the vehicle for the indicated fault. Intermittent or premature MIL activation may also be seen as a brand quality issue for OEMs.
Regarding potential increase in emission of H2S:
Anecdotally, H2S emissions are already occasionally being observed in recent model European imports. Sulphur on the catalyst is released upon encountering rich modes, such as heavy acceleration from traffic lights, after extended light load operation. Results from SAE 2005-01-1113
60 clearly conclude that during
desulphurisation testing of lean-NOx catalysts “the sulphur was almost entirely removed as H2S which is in line with the constantly rich condition”. It takes a specific set of circumstances for this release of H2S to occur, and in most cases it may occur in an environment (e.g. on a freeway) whereby individuals may not be specifically affected. However, it could just as easily occur in closed environments such as acceleration after congested traffic or in underground car parks. However, from an operability point of view, the driver of the vehicle is unlikely to experience any observable issues, but it may be a nuisance for inner-city pedestrians.
Orbital Australia Pty Ltd Page 110 Issue 1
9 SATISFYING THE OBJECTS OF THE FUEL QUALITY
STANDARDS ACT 2000 (THE ACT)
The Act provides the legislative basis for national fuel quality and fuel quality information standards for Australia. The Act is in place to:
a. regulate the quality of fuel supplied in Australia in order to:
i. reduce the level of pollutants and emissions arising from the use of fuel that may cause environmental and health problems; and
ii. facilitate the adoption of better engine technology and emission control technology; and
iii. allow the more effective operation of engines; and
b. ensure that, where appropriate, information about fuel is provided when the fuel is supplied.
One of the key questions of this review of fuel sulphur is whether the use of 50 and/or 150 ppm sulphur fuel is sufficient to satisfy the requirements of the Act, or whether lower sulphur fuels might enable the objects of the Act to be more effectively achieved. Only the objects of a) can be assessed by this review.
Considering each object of a) individually:
i. Reduce the level of pollutants and emissions arising from the use of
fuel
Assessments made in Sections 8.1 and 8.2 with data available to the authors of this report, and reviewed in Sections 8.5 and 8.6, would indicate that without Australian specific test data to the contrary there is an expectation that emissions would be higher with the use of 50 or 150 ppm fuel sulphur levels than they would be if a lower sulphur fuel level was adopted. However, much of the data used in the above assessment is old and relates back to the period when the US and Europe were evaluating the impacts of fuel sulphur. The robustness of engine and vehicle emission technology has undoubtedly improved in the intervening time, and a review of some of the more recent data is suggestive of lower sensitivity to tailpipe emissions for different levels of fuel sulphur. It would also be reasonable to argue that significant absolute reductions in pollutant emissions have been made over successive legislative standards
19 (since the introduction of the 3
rd edition of the Australian
Design Rules) that the expected increase associated with the use of higher sulphur fuels is small by comparison.
Whilst the literature data and assessments made indicate that emissions, in particular THC and NOx, may be higher if 10 ppm fuel was not specified for Euro 5/6 compliant vehicles, the increase may not be uniform for all vehicle make and models and it remains that older ADR37/xx vehicles contribute the majority of passenger vehicle NOx
19,49. A significant
reduction in NOx emissions for these legacy vehicles due to a fuel sulphur

Orbital Australia Pty Ltd Page 111 Issue 1
change alone is unlikely without significant evidence to confirm the high mileage effects of fuel sulphur are indeed reversible.
However, of all pollutants the one with the most significant impact on health is PM
49 and this has not been previously regulated for gasoline
vehicles in Australia. Changes to PM emissions have not been assessed due to a general absence of sulphur sensitivity test data, but what data there is suggests that the change is probably small, and in any case approaching insignificance in comparison to the introduction of GDI technology, for example. SOx emissions are expected to be proportional to fuel sulphur, while it is hypothesised that SOx may also act as a nucleating agent for the formation of volatile PM.
The use of a lower sulphur fuel may act as an enabler of technology to reduce CO2 emissions, or lower environmental impact, and this is considered below.
ii. Facilitate the adoption of better engine technology and emission
control technology
The definition of “better engine technology” begs the question “better for what?” While the introduction of GDI technology may be a path to lower CO2 emissions for example, it comes with a consequential increase in PM emissions. This is similar to the long standing situation with diesel fuels, which while generally accepted as being the lower CO2 technology have also been considered to be high emitting in both PM and NOx emissions.
If we accept “better” to mean next generation technology which may reduce both CO2 emissions and enable lower tailpipe emissions the question is whether lower sulphur fuels are a requirement for these technologies to be introduced.
The assessments in Section 8.3 indicate that there are a number of technologies either being or soon to be implemented, but not all of which require low sulphur fuel. As such it is possible that some next generation technology will be adopted without any change to present fuel sulphur levels of 50 and 150 ppm.
However, it is also arguable that the use of a lower fuel sulphur standard will not preclude the use of some technologies which would be challenged by current fuel sulphur levels, namely lean burn GDI. It is also possible that the technologies not yet mature enough to be considered as commercially viable, for example on-board reforming of gasoline by fuel cells, would be enabled under a lower fuel sulphur regime.
In this respect, a lower fuel sulphur level would act as an enabler, while maintaining current levels would not necessarily prevent reductions in CO2 or pollutants being achieved, though it would limit technology choice.
iii. Allow the more effective operation of engines
The assessments in Section 8.7 indicate that there are comparatively minor impacts on operability as a consequence of current fuel sulphur levels. The most significant, if the situation eventuates, would be the
Orbital Australia Pty Ltd Page 112 Issue 1
nuisance factor associated with false or premature detection of OBD monitored parameters. The assessment undertaken in Section 8.2 indicates that the potential for this is real, but low for the continued use of 50 ppm sulphur fuel. However, the continued use of 150 ppm sulphur fuel carries with it greater potential for issues, particularly at very high mileage.

Orbital Australia Pty Ltd Page 113 Issue 1
10 KNOWLEDGE GAPS
The Environ 2010 study37 concluded that despite the availability of some data, there were knowledge gaps in virtually all areas of interest. This study’s summary is included in Figure 10.1 for ease of reference.
Despite an extensive search for additional data, a number of knowledge gaps remain, reducing confidence associated with some assessments and conclusions in this review. However, the literature examined provides some level of confidence allowing the assessments in Section 8 to be undertaken.
The most significant gaps technically are related to in-field, or real world, performance of both emissions and OBD systems under situations of extended exposure periods, including the uncertainty around whether in-field reversibility will occur.
Specifically, additional data in the Australian context for the following areas would be beneficial and equally applicable to 50 and 150 ppm sulphur fuel:
Exhaust emissions (THC/NMHC, CO, NOx and PM/PN)
o short term exposure at low mileage (5,000 km)
o short term exposure at high mileage (160,000 km)
o extended exposure at low mileage (operate the vehicle on 50 and 150 ppm for 5,000 km)
o extended exposure at high mileage (operate the vehicle on 50 and 150 ppm for 160,000 km).
Reversibility (or lack thereof) for the sulphur effect for certification and in-service compliance testing at low and high mileage, and how this compares to real world exhaust emissions.
Knowledge of current MY OBD strategy behaviour with regard to high sulphur fuel, especially at high mileage.
Performance of current technology oxygen sensors to extended exposure beyond 100,000 km, particularly on 150 ppm fuel sulphur levels.
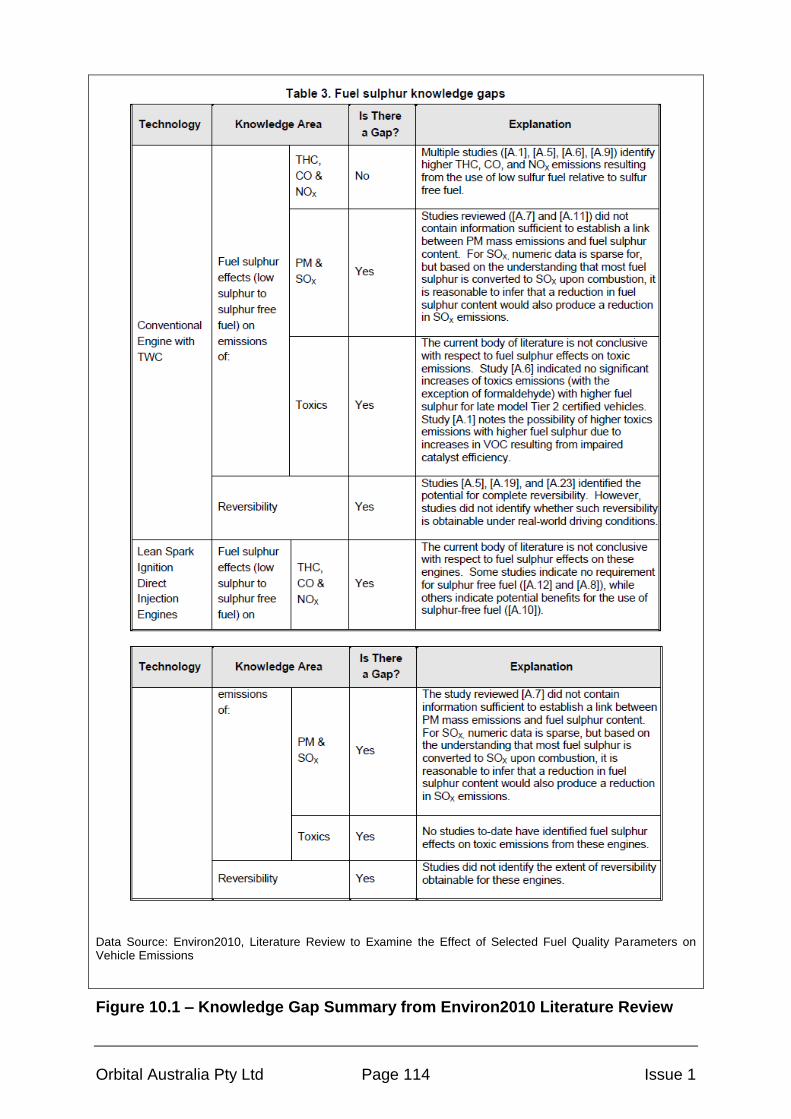
Orbital Australia Pty Ltd Page 114 Issue 1
Data Source: Environ2010, Literature Review to Examine the Effect of Selected Fuel Quality Parameters on Vehicle Emissions
Figure 10.1 – Knowledge Gap Summary from Environ2010 Literature Review
Orbital Australia Pty Ltd Page 115 Issue 1
11 RECOMMENDATIONS FOR FUTURE TEST PROGRAMS
Exhaust emissions measurement has improved over the years especially in the area of particulate measurement. Most of the emissions data referenced in this report is at least five years old and more typically 10-15 years old. Given the difficulty in measuring the small changes in emissions which might be attributed to sulphur, it is considered beneficial that new testing is conducted using the most up-to-date emissions analysers and methods.
The CRC E-84 literature review22
concluded that with regard to test protocols relating to statistical assessment, methods were quite well developed. Despite this conclusion, the Orbital team feel that many of the previous studies – especially the earlier ones – failed to segregate the effects of fuel sulphur on the catalyst from the AFR control aspects of the system. It is Orbital’s view that this interdependence cannot be ignored and may be one of the factors defining why some studies show high sensitivity to fuel sulphur, while others show lower sensitivity levels. Any future study or trials should look to maintain a baseline catalyst and sensor package for cross-reference testing at emission break points so that changes to baseline results can be verified independently, and through cross-testing the root cause of any changes may be isolated.
The other area where future studies can be improved is in the understanding of in-field reversibility effects. In-field reversibility could be the mechanism through which sensitivity to fuel sulphur can be minimised. The hotter a catalyst gets the more likely to desulphate and reverse the effects of sulphur. Typically, smaller vehicles have the catalyst closer to the engine exhaust exit than large vehicles. Smaller vehicle engines also operate at a higher duty cycle when compared to a larger vehicle, thereby producing hotter exhaust gases.
Many of the previous studies examined considered only small to medium vehicles, and generally most only tested over regulated drive cycles. Future studies should consider the evaluation of real world reversibility as this potentially will answer the question as to whether extended operation on higher levels of fuel sulphur is or is not a significant cumulative issue and whether the “snap” tests traditionally done at low and high mileage break points are indeed sufficient.
Related to in-field reversibility is whether the existing in-service fleet would generally benefit from a reduction of fuel sulphur. This can be readily demonstrated as it involves testing a sample of existing fleet vehicles with a known history of operating on 150 ppm sulphur fuels and monitoring emission changes when running on low sulphur 10 ppm fuel over successive real-world drives, for example the Australian Petrol CUEDCs. Care should be taken in the experimental design such that fuel sulphur is the only fuel property which is changed between baseline and comparative assessments as differences in distillation properties and chemical composition may also be factors.
Orbital Australia Pty Ltd Page 116 Issue 1
12 CONCLUSIONS
This project has reviewed and evaluated an extensive amount of technical literature. Much of the literature details studies undertaken more than a decade ago when both the European and US regulators were evaluating the drivers for lowering fuel sulphur levels in their jurisdictions. The focus of the older literature was the performance of conventional TWC equipped vehicles. More recent literature was found to focus on challenges associated with the performance of lean burn GDI systems which have a requirement for a lean NOx or NSR catalyst and for which there is general consensus that low or ultra-low fuel sulphur is perhaps a prerequisite for these systems. Figure 12.1 provides a summary of literature elements identified and the implications that fuel sulphur at levels of 50 and 150 ppm would have on satisfying Euro 5 (core) and Euro 5/6 objectives. Three overall grades are assigned in this summary table:
Unsatisfactory: The assessment of higher than 10 ppm fuel sulphur showed evidence of negative impacts which could potentially result in unacceptable system behaviour or non-compliance.
Doubtful: The assessment of higher than 10 ppm fuel sulphur showed some level of degradation, but the concerns were not sufficient to warrant an unsatisfactory rating.
Satisfactory: No issues sufficient to warrant concern were identified.
Using the information in Figure 12.1, a balanced assessment of the following key topics can be provided:
Demonstration of In-service Compliance with Euro 5/6
This is unlikely to be an issue if the automotive OEM is able to pre-condition the vehicle so as to achieve reversibility of the effects of high fuel sulphur prior to undertaking the regulatory emissions testing using certification grade gasoline. The emission objectives of Euro 5/6 can be met with conventional fuel injection systems and TWC technology with closed-loop control and monitoring. Such a system should also demonstrate a high degree of reversibility of the effects of higher in-field fuel sulphur levels. Such a system though represents the “business as usual” case for fuel consumption unless some refinement is made to other aspects of the vehicle.
Impact of the Continued Use of Current Fuels on Australian Air Quality
Differences in fuel quality between that used by the OEM to demonstrate in-service compliance and that used in the market may give rise to a difference between the emission results set as the objective for regulation and those achievable in the field (real world). However, fuel quality is not the only factor impacting emissions, and other factors including catalyst performance, emission control strategies and component ageing may also make a contribution.

Orbital Australia Pty Ltd Page 117 Issue 1
With regard to the to be introduced Euro 5/6 fleet, there is some suggestion that the use of higher sulphur fuels limits the potential to further improve catalyst light-off performance and therefore cold start emission performance of the vehicle. However, there was no specific focus in the literature on this aspect. Much of the focus was directed to either the signal response of feedback sensors in the exhaust aftertreatment system or degradation in the conversion efficiency of the catalyst system with mileage accumulation. As shown in Figure 12.1 the continued use of 50 ppm sulphur fuel is unlikely to significantly impact low mileage THC, CO and NOx emissions. There is some doubt about whether this will be the case at high mileage, and much of this is dependent upon the in-field reversibility of the sulphur effects and the specific formulation of mainstream TWC catalysts. Some doubts are raised as to the low mileage emissions of THC and CO for the continued use of 150 ppm sulphur fuels and the outcome is considered unsatisfactory for NOx and high mileage capability.
Benefits of a Reduction in Fuel Sulphur Levels
A reduction of fuel sulphur levels from the current 50 and/or 150 ppm levels is indicated to act to enhance the capabilities of current emission technology. The literature clearly indicates that the use of higher fuel sulphur levels has a detrimental effect on all regulated pollutants, though most strongly on NOx emissions. Quality data for the PM emission response to fuel sulphur is limited, despite PM presently being considered to have the greatest impact on human health. However, what data is available does not indicate a significant benefit from the use of a lower sulphur fuel. The update of GDI technology is likely to increase PM emissions by more than the benefit provided by any reduction in fuel sulphur-produced PM.
A reduction in fuel sulphur levels is also likely to enable the use of some specific technologies, namely lean burn GDI, as well as enhance their fuel consumption capability by reducing the frequency of their regeneration/ desulphurisation cycles. However, argument has been made in the literature that the uptake of this technology in Europe has not been as high as forecast because of the cost-benefit economics. Arguably other technologies exist which can deliver a fuel consumption benefit without a specific requirement for low sulphur fuels.
Reducing fuel sulphur is unlikely to yield significant improvements in the operability of engines or vehicles. The use of low sulphur fuels should reduce the likelihood of false triggering of the OBD systems which are a key component of modern emissions control. The use of a low sulphur fuel may also reduce the likelihood or frequency of odour emissions. However, both of these operability factors on their own may not be sufficient to warrant the introduction of low sulphur fuels.
Based on the data evaluated in this project, it is proposed that a reduction in fuel sulphur levels from 150 ppm to 50 ppm for ULP would offer a sufficient reduction in fuel sulphur related risk factors. Figure 12.1 indicates that this fuel sulphur level is not without challenges to investigate, but that in combination with some relaxation of Euro 6 OBD requirements, may be an acceptable compromise. In order to more easily facilitate better technology enablement, a reduction in fuel sulphur levels to 10 ppm would be required and such low sulphur fuel could be offered to the market as a PULP blend.

Orbital Australia Pty Ltd Page 118 Issue 1
Issue Refer Section Euro 5 (core) Euro 5 / 6 Euro 5 (core) Euro 5 / 6
Certification at
Low Mileage
7.2.3.1, 7.2.4
8.3, 8.4, 8.5 P P P PIn-service compliance
testing at High Mileage
7.2.3.1, 7.2.4
8.3, 8.4, 8.5 P P P PEmissions at low mileage
THC and CO7.1, 8.1 P P s s
Emissions at low mileage
NOx7.1, 8.1 P P O O
Emissions at high mileage
THC and CO7.1, 8.1 s s O O
Emissions at high mileage
NOx7.1, 8.1 s s O O
Particle Emissions
PM and PN7.3
Fuel Consumption and GHG 7.4
Reversability
at low mileage7.2.3 P P s s
Reversability
at high mileage7.2.3 s s s s
Three Way Catalyst
Palladium Susceptibility7.2.2 s s s s
Lean NOx Catalysts
(NSR / Traps)
6.1, 6.2
7.1, 8.3.1 O O O OOxygen sensor 7.6 P P P P
OBD II
Catalyst Monitoring THC7.5, 8.2 P P P P
OBD II
Catalyst Monitoring NOx7.5, 8.2 P s s O
P
s
O
Some aspects doubtful
Some aspects unsatisfactory
10 ppm
Sulphur Fuel
Euro
pea
n m
emb
er c
ou
ntr
ies
hav
e 1
0 p
pm
su
lph
ur
fuel
wh
ere
Euro
5 a
nd
6 e
mis
sio
n r
egu
lati
on
s ar
e ap
plic
able
.
50 ppm Sulphur Fuel 150 ppm Sulphur Fuel
Refer report detail - insufficient data to complete the assessment. Data identified is mostly for
MPI vehicle, and not for latest generation GDI engine technology.
No evidence identified to directly link combustion of fuel sulphur to changes in engine fuel
consumption. Indirectly, high fuel sulphur is incompatible with lean burn exhaust catalysts.
Legend
All aspects satisfactory
Figure 12.1 – Summary of Literature Elements and Fuel Sulphur Implications

Orbital Australia Pty Ltd Page 119 Issue 1
13 REFERENCES 1 Directive 98/70/EC of the European Parliament and of the Council of 13 October 1998
relating to the quality of petrol and diesel fuels and amending Council Directive 93/12/EEC. Available at: http://eur-lex.europa.eu/LexUriServ/LexUriServ.do?uri=CELEX:31998L0070:EN:HTML
2 The Auto-Oil II Programme: A report from the services of the European Commission.
Final. 2000. Available at: http://ec.europa.eu/environment/archives/autooil/pdf/auto-oil_en.pdf
3 Consultation on the need to reduce the sulphur content of petrol & diesel fuels below 50
ppm: - a policy maker’s summary. George Marsh, Nikolas Hill, Jessica Sully, AEA Technology, November 2000.Available at
http://ec.europa.eu/environment/archives/sulphur/summary.pdf 4 Regulatory Impact Analysis: Control of air pollution from new motor vehicles: tier 2 motor
vehicle emissions standards and gasoline sulfur control requirements. United States Environmental Protection Agency EPA420-R-99-023. December 1999. Available at: http://www.epa.gov/tier2/documents/r99023.pdf
5 Tier 2 motor vehicle emission standards and gasoline sulfur control requirements:
response to comments. United States Environmental Protection Agency EPA420-R-99-024. December 1999. Available at: http://www.epa.gov/tier2/documents/tr2-rtc.pdf
6 Environmental Protection Agency 40 CFR Parts 80, 85, and 86. Control of air pollution
from new motor vehicles: tier 2 motor vehicle emissions standards and gasoline sulfur control requirements. Final rule. February 2000. Available at: http://www.gpo.gov/fdsys/pkg/FR-2000-02-10/pdf/00-19.pdf
7 Cleaner cars, cleaner fuel, cleaner air: the need for and benefits of tier 3 vehicle and fuel
regulations. National Association of Clean Air Agencies. October 2011. Available at: http://www.4cleanair.org/documents/NACAATier3VehandFuelReport-EMBARGOED-Oct2011.pdf
8 Control of air pollution from motor vehicles: tier 3 motor vehicle emission and fuel
standards. United States Environmental Protection Agency. Available at
http://www.epa.gov/otaq/documents/tier3/420d13002.pdf 9 Regulation Impact Statement: New Australian design rules for control of vehicle emissions.
Australian Government. December 1999. Available at: http://www.infrastructure.gov.au/roads/environment/emission/pdf/ris-maindoc.pdf
10 Review of Fuel Quality Requirements for Australian Transport. Coffey Geosciences Pty
Ltd. Report commissioned by Environment Australia. March 2000. Available at: http://www.environment.gov.au/archive/fuelquality/publications/transport.html
11 Fuel Standard (Petrol) Determination 2001. Available at:
http://www.comlaw.gov.au/Details/F2008C00344
12 Regulation Impact Statement for Vehicle Emissions and Fuel Quality Standards for the
Post 2006 Period. Prepared by the Department of Transport and Regional Services on behalf of the Land Transport Environment Committee. December 2004. Available at: http://www.ephc.gov.au/ltec/pdfs/FinalRISVEFSReviewDec2004.pdf
13 Draft Regulation Impact Statement for Review of Euro 5/6 Light Vehicle Emissions
Standards. Prepared by the Department of Infrastructure and Transport. November 2010. Available at: http://www.infrastructure.gov.au/roads/environment/files/Final_RIS_Euro_5_and_6_Light_Vehicle_Emissions_Review.pdf
Orbital Australia Pty Ltd Page 120 Issue 1
14 International Fuel Quality Center. Available at: http://www.ifqc.org
15 World-Wide Fuel Charter 2012. Available on request from European Automobile
Manufacturers Association
16 Final Regulation Impact Statement for Review of Euro 5/6 Light Vehicle Emissions
Standards. Prepared by the Department of Infrastructure and Transport. November 2010. Available at: http://www.infrastructure.gov.au/roads/environment/files/Final_RIS_Euro_5_and_6_Light_Vehicle_Emissions_Review.pdf
17 Technology Cost and Adoption Analysis: Impact of Ultra-Low Sulfur Gasoline Standards.
Final Report. American Petroleum Institute. Martec. April 2010. Available at: http://www.api.org/~/media/Files/Oil-and-Natural-Gas/Gasoline/Martec_Tech_Cost_Adoption_Analysis_Impact_ULSG_Std_MainlReport.ashx
18 Impact of Fuel Sulfur on Gasoline and Diesel Vehicle Emissions. SAE Technical Paper
2006-01-3370. (2006). Hochhauser A, Schleyer C, Yeh L and Rickeard D.
19 Second national in-service emissions study (NISE2): Light duty petrol vehicle emissions
testing. Orbital Australia Pty Ltd RTA.07.2828.0309 Final Report. Commissioned by the Department of the Environment, Water, Heritage and the Arts. March 2009. Available at: http://www.environment.gov.au/atmosphere/transport/nise2.html
20 Fuel effects on emissions from modern gasoline vehicles part 1 - sulphur effects. Report
No. 5/03(2003). Prepared for Concawe by Rickeard DJ, Bazzani R, Bjordal SD, Kuck K, Martinez PM, Schmelzle P, Scorletti P, Stradling RJ, Wolff G, Zemroch PJ and Thompson ND.
21 The effect of fuel sulfur on NH3 and other emissions from 2000-2001 model year vehicles.
CRC Project No. E-60 (2003). Prepared for Coordinating Research Council and Concawe by Durbin TD, Miller JW, Pisano JT, Younglove, T, Sauer CG, Rhee SH, Huai T and MacKay GI.
22 Review of prior studies of fuel effects on vehicle emissions. CRC Report No. E-84 (2008).
Prepared for Coordinating Research Council by Hochhauser AM.
23 Fuel sulfur effects on exhaust emissions – Recommendations for Mobile 6. United States
Environmental Protection Agency EPA420-P-99-008. March 1999. Available at: http://www.epa.gov/omswww/models/mobile6/m6ful001.pdf
24 Summary report of the review of fuel quality requirements for Australian transport Coffey
Geosciences Pty Ltd 2000 Appendix 1 Critical Vehicle Technologies Available at: http://www.environment.gov.au/archive/fuelquality/publications/transport.html
25 Nitrous Oxide (N2O) Testing of Vehicles from the Australian Fleet - Final report Orbital
Australia Pty Ltd 2009 (see SEWPaC for copy)
26 Effects of Gasoline Sulfur Level on Mass Exhaust Emissions – Auto/Oil Air Quality
Improvement Research Program. SAE Technical Paper 912323. (1991). Benson J, Burns V, Koehl, W, Gorse R, Painter LJ, Hochhauser AM and Reuter RM.
27 Investigation of Sulfur Sensitivity and Reversibility in Late-Model Vehicles. SAE Technical
Paper 1999-01-3676. (1999). Lyons JM, Lax D and Welstand S.
28 Reversibility of Sulfur Effects on Emissions of California Low Emission Vehicles. SAE
Technical Paper 1999-01-1544. (1999). Schleyer CH, Eng KD, Gorse RA, Gunst RF, Eckstrom J, Freel J, Natarajan M and Schlenker AM.
29 Interaction of Sulfur with Automotive Catalysts and the Impact on Vehicle Emissions - A
Review. SAE Technical Paper 1999-01-1543. (1999). Truex TJ.
Orbital Australia Pty Ltd Page 121 Issue 1
30 SAE SP1024 European programme on emissions, fuels and engine technologies EPEFE
(No longer available for download)
31 Effect of fuel sulfur on emissions in California low emission vehicles. SAE Technical
Paper 982726. (1998). Schleyer CH, Gorse RA, Gunst RF, Barnes GJ, Eckstrom J, Eng KD, Freel J, Natarajan M and Schlenker AM.
32 Effects of fuel sulfur on FTP NOx emissions from a PZEV 4 cylinder application. SAE
Technical Paper 2011-01-0300. (2011). Ball D, Clark D and Moser D.
33 Overview of the European “Particulates” project on the characterization of exhaust
particulate emissions from road vehicles: Results for light-duty vehicles. SAE Technical Paper 2004-01-1985. (2004). Ntziachristos L, Mamakos A, Samaras Z, Mathis U, Mohr M, Thompson N, Stradling R, Forti L and de Serves C.
34 ACEA Programme on the emissions of fine particulates from passenger cars(2) Part 2:
Effect of sampling conditions and fuel sulphur content on the particle emission. SAE Technical Paper 2003-01-1890. (2003). Mohr M, Lehmann U and Margaria G.
35 Common Artemis Driving Cycles (CADC) (a range of representative driving conditions
encountered in Europe). (Artemis = Assessment and Reliability of Transport Emission Models and Inventory Systems). Available via: http://www.trl.co.uk/artemis/
36 Fuel effects on the characteristics of particle emissions from the advanced engines and
vehicles Concawe 1/05 2005, R. Carbone, A. Jorgensen, N. Ranchet, D.J. Rickeard, C.J. Rowntree, R.J. Stradling, P.J. Zemroch, D.E. Hall, N.D. Thompson
37 Literature review to examine the effect of selected fuel quality parameters on vehicle
emissions Environ EC Canada inc 2010
38 The effect of Fuel Sulfur on the OBD-II catalyst monitor. SAE Technical Paper 972855.
(1997). Hepburn J, Sweppy M and Zaghati Z.
39 Impact of fuel sulfur on OBD-II catalyst monitoring using the dual oxygen sensor
approach. SAE Technical Paper 941054. (1994). Beck DD, Silvis TW and Mahan S.
40 Vehicle testing of the OBD-II catalyst monitor on a 2.2 L Corsica TLEV. SAE Technical
Paper 952424. (1995). Beck DD and Short WA.
41 Sulfur effects on California OBD-II systems. SAE Technical Paper 952422. (1995).
Browning LH and Moyer CB.
42 OBD & Sulfur status report: Sulfur’s Effect on the OBD Catalyst Monitor on Low Emission
Vehicles. United States Environmental Protection Agency. September 1997.Available at: http://www.epa.gov/orcdizux/regs/im/obd/obdsulf.pdf
43 California Phase 2 Reformulated Gasoline (CaRFG2) Specifications: Volume 1 Proposed
Regulations for California Phase 2 Reformulated Gasoline. Staff Report. California Air Resources Board (CARB). October 1991. Available at: http://www.arb.ca.gov/fuels/gasoline/carfg2/carfg2.pdf
44 Notice of Public Hearing to Consider Technical Status and Proposed revisions to
Malfunction and Diagnostic System Requirements for 1994 Model-Year Passenger Cars, Light-Duty Trucks, and Medium-Duty Vehicles and Engines (OBD II) CARB mail out #94-36 1994. No longer available for download
45 Poisoning of Temperature Independent Resistive Oxygen Sensors by Sulphur Dioxide
Daimler Chrysler, Dornier 2003 Rettig F, Moos R and Plog C. Journal of Electroceramics 13: 733-738.
46 Resistive Oxygen Gas Sensors for Harsh Environments 2011 Bayreuth Engine Research
Center, Advanced Manufacturing Research Institute. Moos R, Izu N, Rettig F, Reiss S, Shin W and Matsubara I. Sensors 11: 3439-3465.

Orbital Australia Pty Ltd Page 122 Issue 1
47 http://www.ngk.de/en/products-technologies/lambda-sensors/lambda-sensor-
technologies/titanium-dioxide-lambda-sensor/
48 Conversion Factors for Hydrocarbon Emission Components (2005). United States
Environmental Protection Agency EPA420-R-05-015. Available at: http://www.epa.gov/otaq/models/nonrdmdl/nonrdmdl2005/420r05015.pdf
49 Evaluating the Health Impacts of Ethanol Blend Petrol (2008). Orbital Australia and
CSIRO. Final Report KW48/17/F3.3F for the Department of the Environment, Water, Heritage and the Arts.
50 CARB Malfunction and Diagnostic System Requirements--1994 and Subsequent Model-
Year Passenger Cars, Light-Duty Trucks, and Medium-Duty Vehicles and Engines Californian Air Resources Board Mail-out #MSC 97-24 November 17, 1997 Available at
http://www.arb.ca.gov/msprog/obdprog/mo97_24.pdf 51
The California low-emission vehicle (LEV) regulations Title 13 California Code of
Regulations § 1960&1961 Exhaust Emission Standards and Test Procedures - 1981 through 2006 Model Passenger Cars, Light-Duty Trucks, and Medium-Duty Vehicles. Californian Air Resources Board Available at
http://www.arb.ca.gov/msprog/levprog/cleandoc/cleancomplete_lev-ghg_regs_3-12.pdf 52
Commission Regulation (EU) No …/.. of XXX amending Regulation (EC) No 715/2007 of
the European Parliament and of the Council and Commission Regulation (EC) No 692/2008 as regards emissions from light passenger and commercial vehicles (Euro 6). Available at
http://www.eumonitor.eu/9353000/1/j9vvik7m1c3gyxp/viw960ztgcy2
53 Light vehicle CO2 emission standards for Australia: Key Issues – Discussion
Paper.(2011). Department of Infrastructure and Transport. Available at: http://www.infrastructure.gov.au/roads/environment/co2_emissions/files/Light_Vehicle_CO2_Standards_Discussion_Paper.pdf
54 Technology and CO2 Data Analysis of Australian Light Vehicle Fleet 2010-2025 DIT RFT
Reference Number 11/7308
55 The impact of gasoline fuel sulfur on catalytic emission control systems. (1998).
Manufacturers of Emission Controls Association.
56 Low--sulfur gasoline & diesel: the key to lower vehicle emissions. (2003). Blumberg KO,
Walsh MP and Pera C. The International Council on Clean Transportation. Available at: http://www.theicct.org/low-sulfur-gasoline-and-diesel-key-lower-vehicle-emissions
57 Lean GDI technology cost and adoption forecast: the impact of ultra-low sulfur gasoline
standards. SAE Technical Paper 2011-01-1226. (2011). McMahon KB, Selecman C, Botzem F and Stablein B (Martec Group).
58 Submission to the Department of Infrastructure, Transport, Regional Development and
Local Government on Draft Regulation Impact Statement For Review of Euro 5/6 Light Vehicle Standards. (2010). Australian Institute of Petroleum. Available at: http://www.infrastructure.gov.au/roads/environment/euro_files/AIP.pdf
59 ACEA data of the sulphur effect on advanced emission control technologies. (2000).
ACEA (Association of European Automobile Manufacturers). Available at:
http://autoenv.org/forum/forum/sulfurreportjuly2000.pdf 60
SAE 2005-01-1113 The impact of sulfur poisoning on NOx-storage catalysts in gasoline
applications. SAE Technical Paper 2005-0101113. (2005). Rohr F, Peter SD, Lox E, Kögel M, Müller W, Sassi A, Rigaudeau C, Juste L, Belot G, Gélin P and Primet M.

Orbital Australia Pty Ltd Page 123 Issue 1
61 Final rulemaking to establish light-duty vehicle greenhouse gas emission standards and
corporate average fuel economy standards regulatory impact analysis. (2010). United States Environmental Protection Agency EPA-420-R-10-009 April 2010 Available at :
http://www.epa.gov/otaq/climate/regulations/420r10009.pdf
Orbital Australia Pty Ltd Page 124 Issue 1
APPENDIX A
Emissions and technology Overview
Fuel sulphur, unlike some other components of fuel, only has an emission implication when it comes to combustion and aftertreatment of combustion products in the exhaust system. The lack of focus in examined literature on the direct combustion aspects of fuel sulphur suggests that these effects are negligible in comparison to the effects on the aftertreatment systems. For this reason, it is only necessary to consider the tailpipe exhaust emission systems and impacts in this review.
1 VEHICLE EMISSIONS CONTROL
Vehicle emissions control technology is always advancing. ADR37/00 introduced the requirement of so-called “active” control emissions where exhaust emissions were controlled primarily by a catalyst in combination with advances in the control of engine fuelling and AFR. These “active” emission controls have continued to be refined and improved such that lower tailpipe emission levels are achievable. Today the default solution adopted has been electronic fuel injection with increasing levels of feedback control, although a range of new fuel injection and control technologies are being introduced.
The current suites of emission control technologies are all controlled and monitored electronically and include:
Electronic fuel injectors, used to control the fuelling to each engine cylinder (see Figure A.1).
Various feedback sensors provide information about the engine condition including driver demand, temperature, airflow (or inputs for the calculation of airflow), and so on to the electronic controller.
An ignition system typically controlled by the electronic controller.
Exhaust Gas Recirculation (EGR) which may also be used to control NOx emissions or improve fuel consumption (see Figure A.2).
Catalysts which are usually of three-way type and utilise one or more exhaust gas oxygen (EGO) sensors to provide feedback to the engine controller about exhaust oxygen content, allowing fuelling adjustments to be made. The catalyst may be located either in the underbody or in a close-coupled position.

Orbital Australia Pty Ltd Page 125 Issue 1
Figure A.1 – Comparison of Throttle Body (left) and Multi-Point Fuel Injection
1 – Air Box
2 – Mass Air Flow Meter
3 – Electronic Throttle Valve
4 – Fuel Injector
5 – Spark Plug
6 – EGR Valve (Electro-mechanical)
5
6
4
2
3
1Exhaust gas
EGR Pipe
Intake Air
Mixture
(Air+Fuel+EGR)
5
6
4
2
3
1Exhaust gas
EGR Pipe
Intake Air
Mixture
(Air+Fuel+EGR)
Figure A.2 – Overview of Exhaust Gas Recirculation System
2 EXHAUST AFTERTREATMENT SYSTEMS
The location of the catalyst is driven by the emissions requirements. Catalysts may be located under the vehicle (underbody) or close to the exhaust valves (close-coupled) (Figure A.3). Some systems utilise both underbody and close-coupled catalysts. More stringent emissions legislation often dictates the use of both close-coupled and underbody catalyst. The placement of the catalyst is a balance between needing high exhaust gas temperatures for good light-off and high conversion efficiency and protecting the catalyst from over-temperature at high load which can cause degradation or failure. Small engine vehicles with lower exhaust gas flow rates and generally lower performance are able to position their catalyst closer to the engine.
The efficiency with which a catalyst converts pollutants is a function of several factors including exhaust feed gas temperature, reactivity of the catalyst surface and mixture (AFR) of the exhaust feed gas. Control of the mixture is governed by the fuelling and/or engine control system. Whether the mixture is rich or lean will bias
Fuel
Fuel
Air Air
Engine
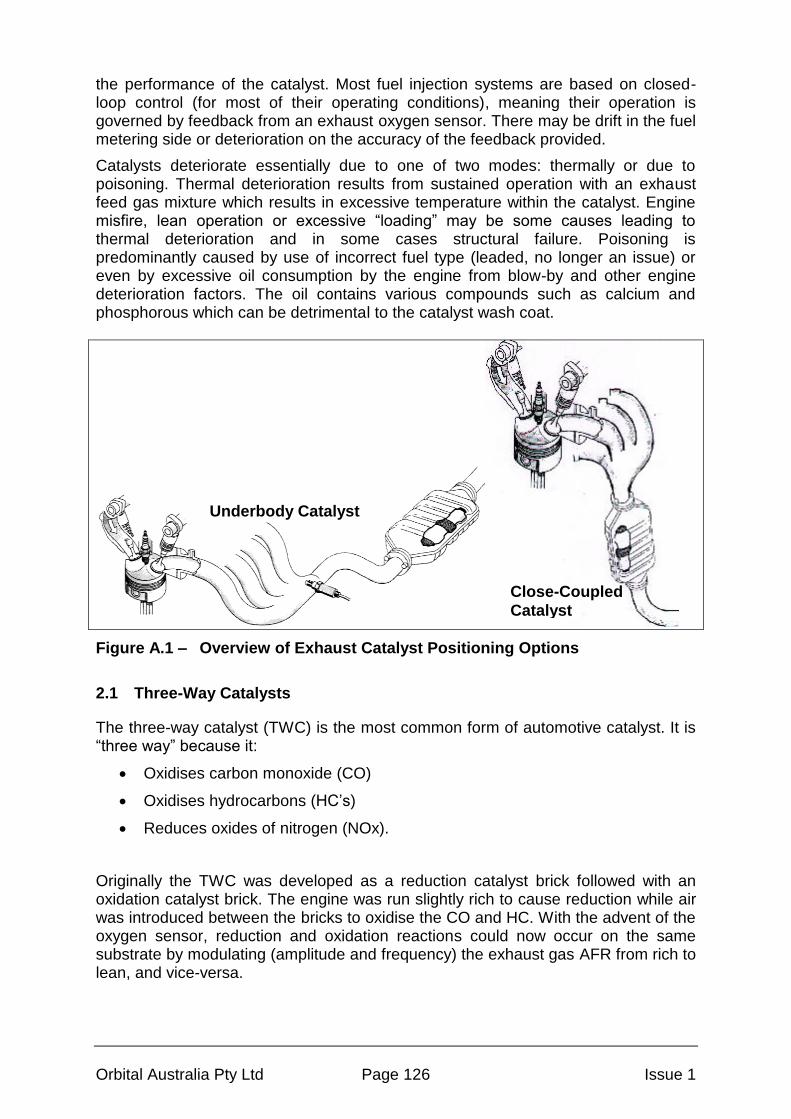
Orbital Australia Pty Ltd Page 126 Issue 1
the performance of the catalyst. Most fuel injection systems are based on closed-loop control (for most of their operating conditions), meaning their operation is governed by feedback from an exhaust oxygen sensor. There may be drift in the fuel metering side or deterioration on the accuracy of the feedback provided.
Catalysts deteriorate essentially due to one of two modes: thermally or due to poisoning. Thermal deterioration results from sustained operation with an exhaust feed gas mixture which results in excessive temperature within the catalyst. Engine misfire, lean operation or excessive “loading” may be some causes leading to thermal deterioration and in some cases structural failure. Poisoning is predominantly caused by use of incorrect fuel type (leaded, no longer an issue) or even by excessive oil consumption by the engine from blow-by and other engine deterioration factors. The oil contains various compounds such as calcium and phosphorous which can be detrimental to the catalyst wash coat.
Figure A.1 – Overview of Exhaust Catalyst Positioning Options
2.1 Three-Way Catalysts
The three-way catalyst (TWC) is the most common form of automotive catalyst. It is “three way” because it:
Oxidises carbon monoxide (CO)
Oxidises hydrocarbons (HC’s)
Reduces oxides of nitrogen (NOx).
Originally the TWC was developed as a reduction catalyst brick followed with an oxidation catalyst brick. The engine was run slightly rich to cause reduction while air was introduced between the bricks to oxidise the CO and HC. With the advent of the oxygen sensor, reduction and oxidation reactions could now occur on the same substrate by modulating (amplitude and frequency) the exhaust gas AFR from rich to lean, and vice-versa.
Underbody Catalyst
Close-Coupled
Catalyst

Orbital Australia Pty Ltd Page 127 Issue 1
Performance of the TWC is closely linked to the accuracy of the AFR control. Figure A.2 shows the typical chemical reactions taking place on the catalyst surface during rich and lean modes. During rich operation all of the oxygen is used and no (or limited) oxidation reactions occur. To overcome this problem a compound (most commonly ceria) is added to the catalyst’s substrate to store oxygen during lean operation and release oxygen during rich operation.
TWC technology became dominant when 500 to 300 ppm sulphur was in the market, but in-service compliance life requirements were not as rigorous as they are today. Advancements in TWC technology improved the in-service compliance life time at a time when sulphur levels were also being reduced to 300 to 150 ppm.
Figure A.2 – Typical Chemical Reactions Occurring on a TWC
2.2 NOx Storage Reduction Catalysts (Lean NOx Traps)
The evolution of lean burn GDI technology has necessitated the development of catalysts for lean gasoline operation. Technology solutions have in the most part been adapted from solutions to diesel engines. As such the range of options investigated includes:
Platinum (Pt) catalyst: Used primarily for diesel vehicles, it requires HC emissions for the NOx reduction chemistry. NOx conversion efficiency is relatively low.
NOx Storage/Reduction (NSR or Trap): Used for various vehicles, it requires HC/CO/H2 emissions for the NOx reduction chemistry. It also requires low sulphur fuel due to sulphur poisoning.
SCR: Used primarily for large vehicles such as trucks or buses, and requires Ammonia (NH3) or urea (NH2)2CO injection for NOx regeneration to occur.
Iridium (Ir) catalyst: Used for light-duty vehicles (namely by MMC, Japan), it requires HC for the NOx reduction chemistry. It is very unstable under high thermal load.
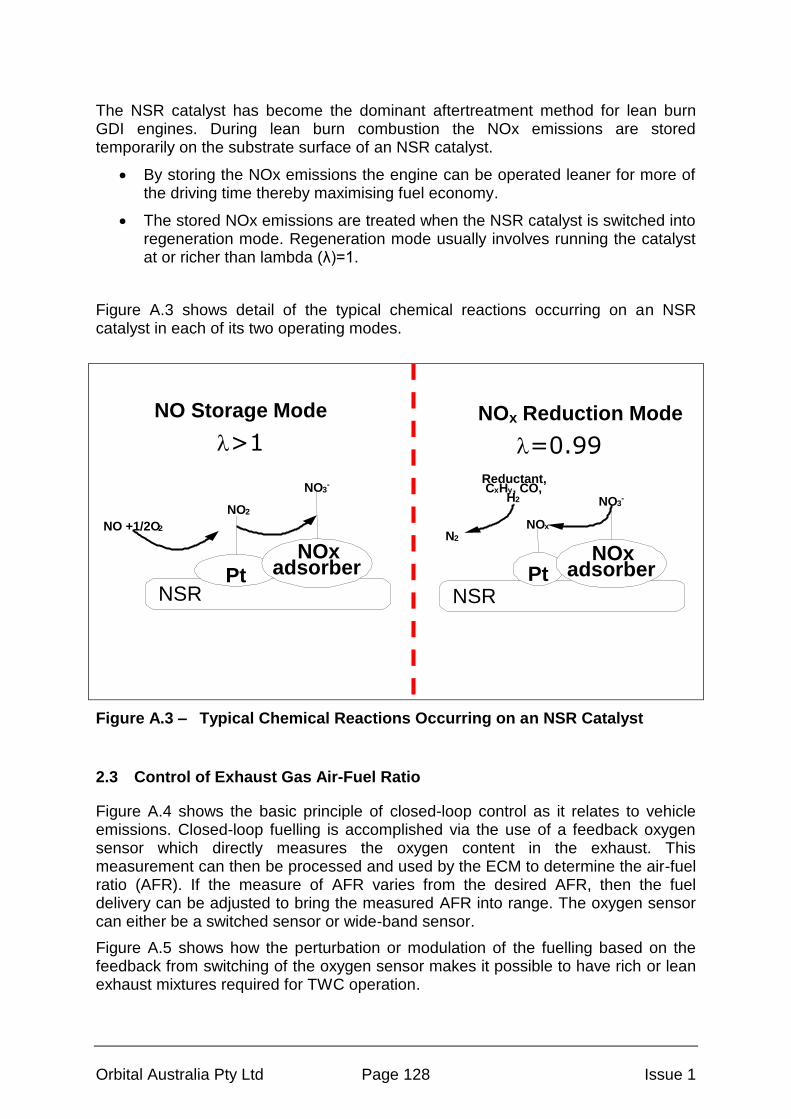
Orbital Australia Pty Ltd Page 128 Issue 1
The NSR catalyst has become the dominant aftertreatment method for lean burn GDI engines. During lean burn combustion the NOx emissions are stored temporarily on the substrate surface of an NSR catalyst.
By storing the NOx emissions the engine can be operated leaner for more of the driving time thereby maximising fuel economy.
The stored NOx emissions are treated when the NSR catalyst is switched into regeneration mode. Regeneration mode usually involves running the catalyst at or richer than lambda (λ)=1.
Figure A.3 shows detail of the typical chemical reactions occurring on an NSR catalyst in each of its two operating modes.
NSRPt
NOx
Reductant,CxHy, CO,
H2
NOx Reduction Mode
l=0.99
NOxadsorber
NO3-
N2
NSRPt
NOxadsorber
NO +1/2O2
NO2
NO Storage Mode
l>1
NO3-
Figure A.3 – Typical Chemical Reactions Occurring on an NSR Catalyst
2.3 Control of Exhaust Gas Air-Fuel Ratio
Figure A.4 shows the basic principle of closed-loop control as it relates to vehicle emissions. Closed-loop fuelling is accomplished via the use of a feedback oxygen sensor which directly measures the oxygen content in the exhaust. This measurement can then be processed and used by the ECM to determine the air-fuel ratio (AFR). If the measure of AFR varies from the desired AFR, then the fuel delivery can be adjusted to bring the measured AFR into range. The oxygen sensor can either be a switched sensor or wide-band sensor.
Figure A.5 shows how the perturbation or modulation of the fuelling based on the feedback from switching of the oxygen sensor makes it possible to have rich or lean exhaust mixtures required for TWC operation.

Orbital Australia Pty Ltd Page 129 Issue 1
Newer emission control systems use a second exhaust oxygen sensor located downstream of the catalyst(s) as a means of monitoring catalyst performance.
PROCESS
INPUT OUTPUT
PROCESS
INPUT OUTPUT+
+
OPEN LOOP
CLOSED LOOP
Oxygen Sensor Feedback of AFR
to ECM
ECM modifies fuelling from AFR
feedback
Figure A.4 – Principle of Closed-Loop Catalyst Control (TWC)
Perturbation and adaptation of fuelling Signal from oxygen sensor
Figure A.5 – Details on how AFR Control is affected
2.4 Fuel Sulphur Effect on Catalysts
Sulphur in fuel impacts on the durability of the conventional TWC. TWCs are the
most common form of aftertreatment system used on light-duty vehicles in Australia.
• Fuel sulphur compounds:
– are oxidised to sulphur dioxide (SO2) during engine combustion.
– SO2 interacts with Pt group metals (Pt, palladium (Pd) and rhodium
(Rh)), see Figure A.6.
– affect catalyst performance and hence tailpipe emissions.

Orbital Australia Pty Ltd Page 130 Issue 1
• SO2 interacts with base metal oxides:
– typically the oxygen storage and stabiliser components, ceria and
alumina.
– the sulphur interactions are partly reversible under high temperatures
and rich/lean conditions.
– Pd-based catalysts are more sensitive to sulphur poisoning than Pt-
based catalysts.
– improvements in TWC formulations have given better performance, but
sulphur inhibition cannot be eliminated.
Fuel sulphur will also affect the performance of NSR catalysts, and because of the
base oxides used on the substrate washcoat, the effects can be greater than that on
the conventional TWC (see Figure A.7). The issues with this type of catalyst are
detailed further in Section 8.3.1.
• SO2 adsorbs onto precious metal and dissociates
• Under Lean conditions• Sulphur poisoning is not severe
• SO2 is oxidised to SO3 which is not strongly adsorbed
• Under Rich conditions• Sulphur poisoning is more severe
• Catalytic activity is inhibited by steric hindrance or blockage
Figure A.6 – Sulphur Interactions with Platinum Group Metals on a catalyst
Orbital Australia Pty Ltd Page 131 Issue 1
• Sulphur interacts with base metal components
– Alumina(Al2O3) and Ceria (CeO2)
• SO2 oxidised to SO3 and stored as sulphates by reaction with Ceria
– SO2 + 1/2O2 ------> SO3
– CeO2 + 2 SO2 ------> Ce(SO4)2
• Ce(SO4)2 decomposes at temperatures greater than 800°C
• Under rich conditions PGM can catalyse decomposition of sulphate
– 6CeO2 + 3SO2 ------> Ce2(SO4)3 + 2Ce2O3 (over Pt)
• Ce2(SO4)3 decomposes at temperatures greater than 600°C
Figure A.7 – Sulphur Interactions with Base Metal Oxides
3 ADVANCED ENGINE TECHNOLOGIES
Gasoline direct injection (GDI) systems represent the most significant change in the delivery of fuel to the conventional internal combustion engine in the past 25 years. Although GDI systems have existed since the 1940s, it was not until refinements in electronic actuation and control that these systems gained popularity. GDI systems deliver fuel directly in-cylinder rather than to the intake manifold of the engine allowing for some significant improvements in efficiency. Figure A.1 shows an example of a GDI system.

Orbital Australia Pty Ltd Page 132 Issue 1
Port Injected (PFI or MPI)
Gasoline Direct Injection (GDI)
Carburettor
0.0
2.0
4.0
6.0
8.0
10.0
12.0
14.0
Stoichiometric Lean
FC
Re
du
cti
on
(%
) Falcon
Territory
Sedan
SUV
Note: FC = fuel consumption
Figure A.1 – Example GDI system and Typical Results
3.1 Lean Burn GDI Systems
With the increased interest in direct injection in the mid-1990’s the possibility to run at controlled lambda’s leaner than stoichiometric became available. This technology was heralded as a solution for reduced fuel consumption and CO2 emissions. The technology can also provide reduced HC and CO emissions which are more easily oxidised in the oxygen rich exhaust in the TWC. However, without significant dilution by EGR an increase in tailpipe NOx emissions may occur without appropriate exhaust aftertreatment.
A TWC alone is unable to reduce these NOx emissions to the required tailpipe emissions levels due to the high exhaust oxygen content associated with lean operation. It is therefore necessary to include a lean NOx storage (trap) catalyst in the exhaust system which in one mode stores NOx and in another mode reduces the stored NOx.
GDI
Orbital Australia Pty Ltd Page 133 Issue 1
In order for the lean NOx catalyst to regenerate and maintain its NOx conversion efficiency, it is necessary to provide short controlled rich AFR excursions during vehicle operation. The rate at which these excursions occur is typically defined either by a model and/or feedback from a NOx sensor located downstream of the LNT.
3.2 Homogeneous GDI +TWC with/without Downsizing and Boosting
Homogenous GDI when combined with a TWC offers a small improvement in both fuel consumption and performance over traditional port-injected engines. The advantage of this technology is that it does not make use of a lean NOx trap and is therefore more tolerant to higher sulphur as it is reliant only on a TWC aftertreatment system. When this technology is combined with VVT, increased EGR can be achieved and improvements (reductions) in CO2 can be made.
Significant gains in CO2 reduction generally require the downsizing and boosting of the base engine in addition to the use of GDI. Downsizing is the reduction of the engine capacity (either swept volume – “litres”, or number of cylinders) for a given vehicle size. Boosting is a process by which engine performance is increased by the forcing of additional air into the engine by either a turbo- or super-charger. The combination of these technologies results in a smaller engine for when reduced fuel consumption is needed for cruising and sufficient power for when performance is required.
3.3 Homogeneous Charge Compression Ignition (HCCI)
HCCI is an emerging technology with many significant challenges to overcome. HCCI may use GDI technology for the delivery of fuel to the combustion chamber, though it may also be done by other means. A typical technology development timeline (based on the progress of General Motors’ HCCI demonstrator vehicle) is shown in Figure A.2. The main touted benefit of HCCI is lower NOx emissions.
Spark ignited engines have a flame front which starts at the spark plug and traverses the combustion chamber igniting the fuel mixture. In an HCCI engine multiple ignition sites form within the combustion chamber in parallel. These sites occur due to the higher initial charge temperature at the start of the compression stroke which is facilitated by trapped burnt residual gas from the previous combustion cycle in the form of exhaust gas recirculation.
Consequently, reduced overall and peak combustion temperatures within the combustion chamber are the result and this leads to the formation of less NOx emissions, since NOx formation is driven by sustained high temperatures at in-cylinder high pressures.
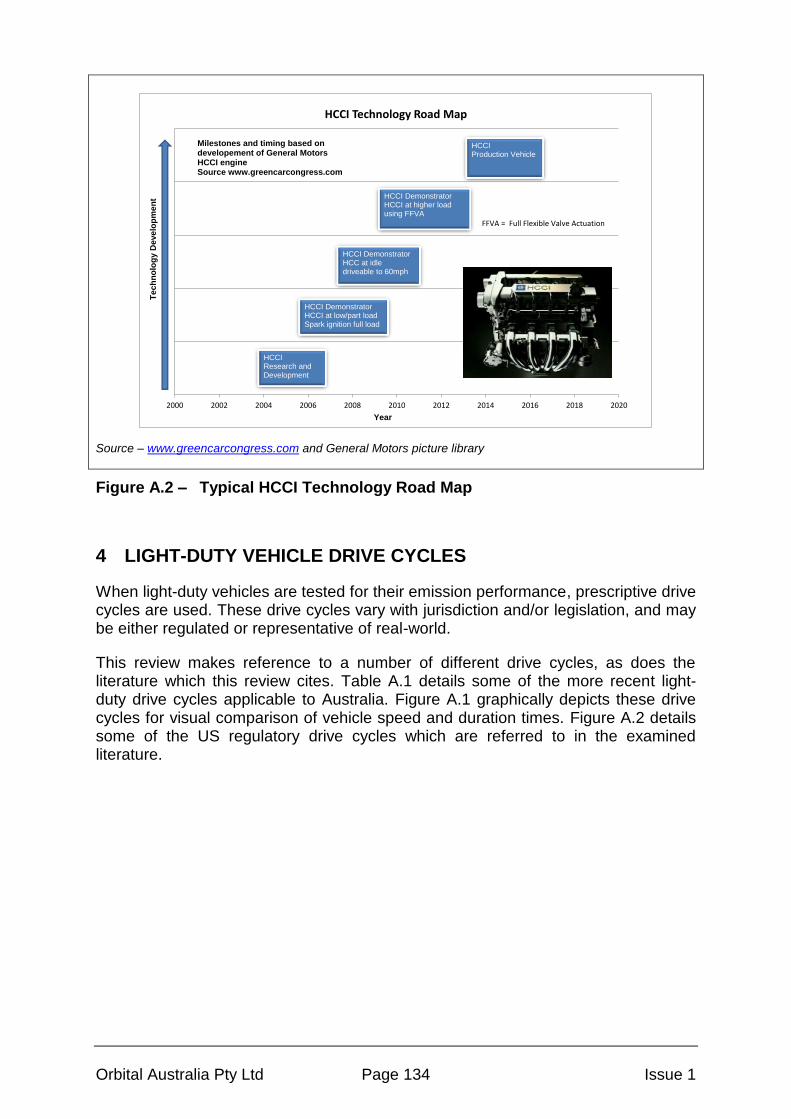
Orbital Australia Pty Ltd Page 134 Issue 1
2000 2002 2004 2006 2008 2010 2012 2014 2016 2018 2020
HCCI Technology Road Map
Te
ch
no
log
y D
eve
lop
me
nt
HCCIResearch and Development
HCCI DemonstratorHCCI at low/part loadSpark ignition full load
HCCI DemonstratorHCC at idledriveable to 60mph
Year
HCCI DemonstratorHCCI at higher loadusing FFVA
HCCIProduction Vehicle
Milestones and timing based ondevelopement of General MotorsHCCI engineSource www.greencarcongress.com
FFVA = Full Flexible Valve Actuation
Source – www.greencarcongress.com and General Motors picture library
Figure A.2 – Typical HCCI Technology Road Map
4 LIGHT-DUTY VEHICLE DRIVE CYCLES
When light-duty vehicles are tested for their emission performance, prescriptive drive cycles are used. These drive cycles vary with jurisdiction and/or legislation, and may be either regulated or representative of real-world.
This review makes reference to a number of different drive cycles, as does the literature which this review cites. Table A.1 details some of the more recent light-duty drive cycles applicable to Australia. Figure A.1 graphically depicts these drive cycles for visual comparison of vehicle speed and duration times. Figure A.2 details some of the US regulatory drive cycles which are referred to in the examined literature.
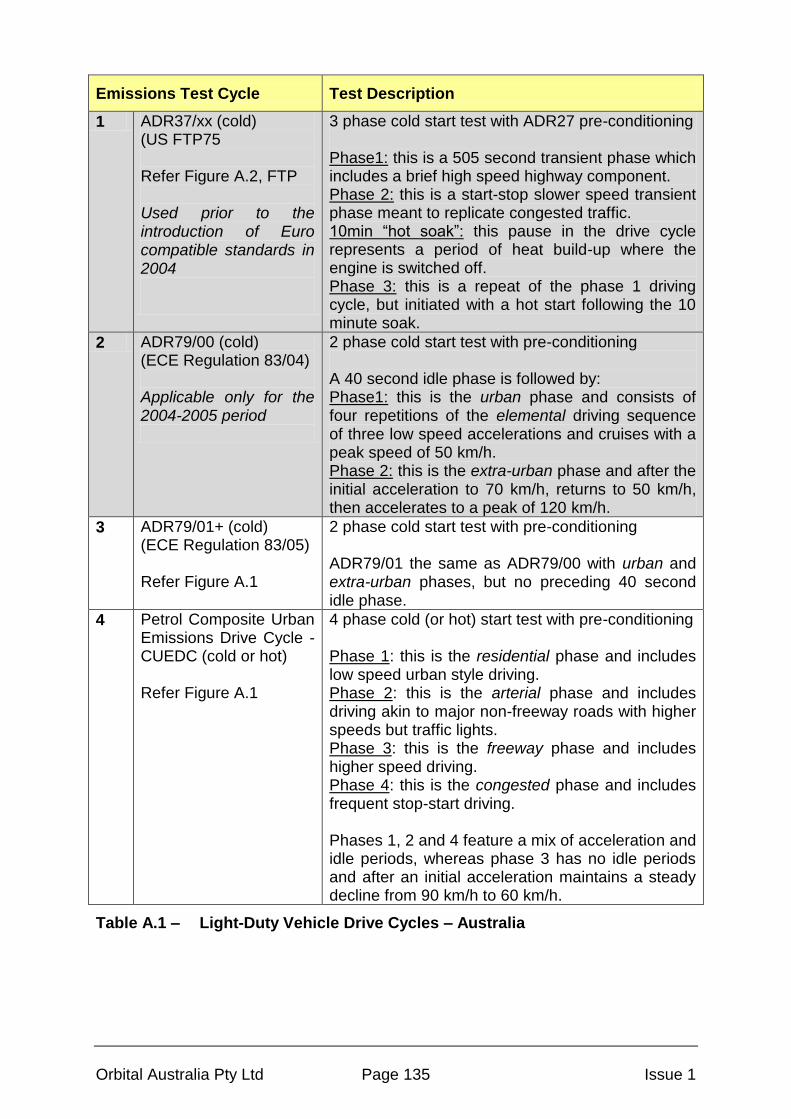
Orbital Australia Pty Ltd Page 135 Issue 1
Emissions Test Cycle Test Description
1 ADR37/xx (cold) (US FTP75 Refer Figure A.2, FTP Used prior to the introduction of Euro compatible standards in 2004
3 phase cold start test with ADR27 pre-conditioning Phase1: this is a 505 second transient phase which includes a brief high speed highway component. Phase 2: this is a start-stop slower speed transient phase meant to replicate congested traffic. 10min “hot soak”: this pause in the drive cycle represents a period of heat build-up where the engine is switched off. Phase 3: this is a repeat of the phase 1 driving cycle, but initiated with a hot start following the 10 minute soak.
2 ADR79/00 (cold) (ECE Regulation 83/04) Applicable only for the 2004-2005 period
2 phase cold start test with pre-conditioning A 40 second idle phase is followed by: Phase1: this is the urban phase and consists of four repetitions of the elemental driving sequence of three low speed accelerations and cruises with a peak speed of 50 km/h. Phase 2: this is the extra-urban phase and after the initial acceleration to 70 km/h, returns to 50 km/h, then accelerates to a peak of 120 km/h.
3 ADR79/01+ (cold) (ECE Regulation 83/05) Refer Figure A.1
2 phase cold start test with pre-conditioning ADR79/01 the same as ADR79/00 with urban and extra-urban phases, but no preceding 40 second idle phase.
4 Petrol Composite Urban Emissions Drive Cycle - CUEDC (cold or hot) Refer Figure A.1
4 phase cold (or hot) start test with pre-conditioning Phase 1: this is the residential phase and includes low speed urban style driving. Phase 2: this is the arterial phase and includes driving akin to major non-freeway roads with higher speeds but traffic lights. Phase 3: this is the freeway phase and includes higher speed driving. Phase 4: this is the congested phase and includes frequent stop-start driving. Phases 1, 2 and 4 feature a mix of acceleration and idle periods, whereas phase 3 has no idle periods and after an initial acceleration maintains a steady decline from 90 km/h to 60 km/h.
Table A.1 – Light-Duty Vehicle Drive Cycles – Australia

Orbital Australia Pty Ltd Page 136 Issue 1
ADR79/01 - Type 1 test
0
20
40
60
80
100
120
140
0 200 400 600 800 1000 1200
Time (secs)
Sp
ee
d (
km
/h)
Phase1 (Urban)
Phase2 (Extra Urban)
Composite Urban Drive Cycle for light duty gasoline vehicles as developed for NISE2
0
10
20
30
40
50
60
70
80
90
100
0 200 400 600 800 1000 1200 1400 1600 1800
Time (secs)
Sp
eed
(km
/h)
Residential
Arterial
Freeway
Congested
Figure A.1 – Light-Duty Vehicle Drive Cycles – Australia
(regulated and real-world)

Orbital Australia Pty Ltd Page 137 Issue 1
City: Represents urban driving, in which a vehicle is started with the engine cold and driven in stop-and-go rush hour traffic. This cycle is also referred to as the LA4 cycle.
Highway: Represents a mixture of rural and Interstate highway driving with a warmed-up engine, typical of longer trips in free-flowing traffic.
High Speed: Represents city and highway driving at higher speeds with more aggressive acceleration and braking.
Figure A.2 – Light-Duty Vehicle Drive Cycles – Subset of US Test Cycles

Orbital Australia Pty Ltd Page 138 Issue 1
APPENDIX B – EUROPEAN AND US FUEL AND EMISSIONS
STANDARDS
1 EUROPEAN FUEL (SULPHUR) AND EXHAUST EMISSIONS
STANDARDS
1.1 Fuel Standards
Table B.1 details the European fuel specification as it relates to fuel sulphur and the timetable for the limits coming into effect.
Item Parameter Grade Amount Date
1 Sulfur ULP, PULP 150 mg/kg 1 January 2000
2 Sulfur ULP, PULP 50 mg/kg 1 January 2005
3 Sulfur ULP, PULP 10 mg/kg 1 January 2009
Source: DIRECTIVE 2003/17/EC OF THE EUROPEAN PARLIAMENT AND OF THE COUNCIL of 3 March 2003 amending Directive 98/70/EC relating to the quality of petrol and diesel fuels
Table B.1 – European Fuel Sulphur Standards
1.2 Euro 4 Exhaust Emissions Standards
Table B.2 shows the exhaust emission limits applicable under Euro 4. These limits are effectively the values used for ADR79/02 regulations in Australia.

Orbital Australia Pty Ltd Page 139 Issue 1
Source: Council Directive 70/220/EEC of 20 March 1970 as amended by DIRECTIVE 98/69/EC OF THE EUROPEAN PARLIAMENT AND OF THE COUNCIL of 13 October 1998.
Table B.2 – European Euro 4 Exhaust Emission Limits
1.3 Euro 5 Exhaust Emissions Standards
Table B.3 shows the exhaust emission limits applicable under Euro 5. These limits are effectively the values used in Australia, although due to a split in the implementation timetable, the requirements are phased in over the ADR79/03 and ADR79/04 regulations.
Source: REGULATION (EC) No 715/2007 OF THE EUROPEAN PARLIAMENT AND OF THE COUNCIL of 20 June 2007 as amended by COMMISSION REGULATION (EC) No 692/2008 of 18 July 2008.
Table B.3 – European Euro 5 Exhaust Emission Limits

Orbital Australia Pty Ltd Page 140 Issue 1
1.4 Euro 6 Exhaust Emissions Standards
Table B.4 shows the exhaust emission limits applicable under Euro 6. These limits are effectively the values used for ADR79/05 regulations in Australia.
Source: REGULATION (EC) No 715/2007 OF THE EUROPEAN PARLIAMENT AND OF THE COUNCIL of 20 June 2007 as amended by COMMISSION REGULATION (EC) No 692/2008 of 18 July 2008.
Table B.4 – European Euro 6 Exhaust Emission Limits
2 UNITED STATES FUEL (SULPHUR) AND EXHAUST EMISSIONS
STANDARDS
2.1 Federal Fuel Standards
Table B.1 details the US fuel specification for the majority of the jurisdictions of the US as it relates to fuel sulphur, including the timetable for the limits coming into effect. Because of the way individual jurisdictions in the US can implement independent and more stringent requirements than these Federal Standards, these are considered the minimum requirements.
Item Parameter Grade
Amount
Average
Amount
Maximum Date
1 Sulfur ULP, PULP 120 mg/kg 300 mg/kg 1 January 2004
2 Sulfur ULP, PULP 30 mg/kg 80 mg/kg 1 January 2006 Source: ENVIRONMENTAL PROTECTION AGENCY 40 CFR Parts 80, 85, and 86 Control of air pollution from new motor vehicles: Tier 2 Motor Vehicle Emissions Standards and Gasoline Sulphur Control Requirements.
Table B.1 – United States Fuel (Sulphur) Standards
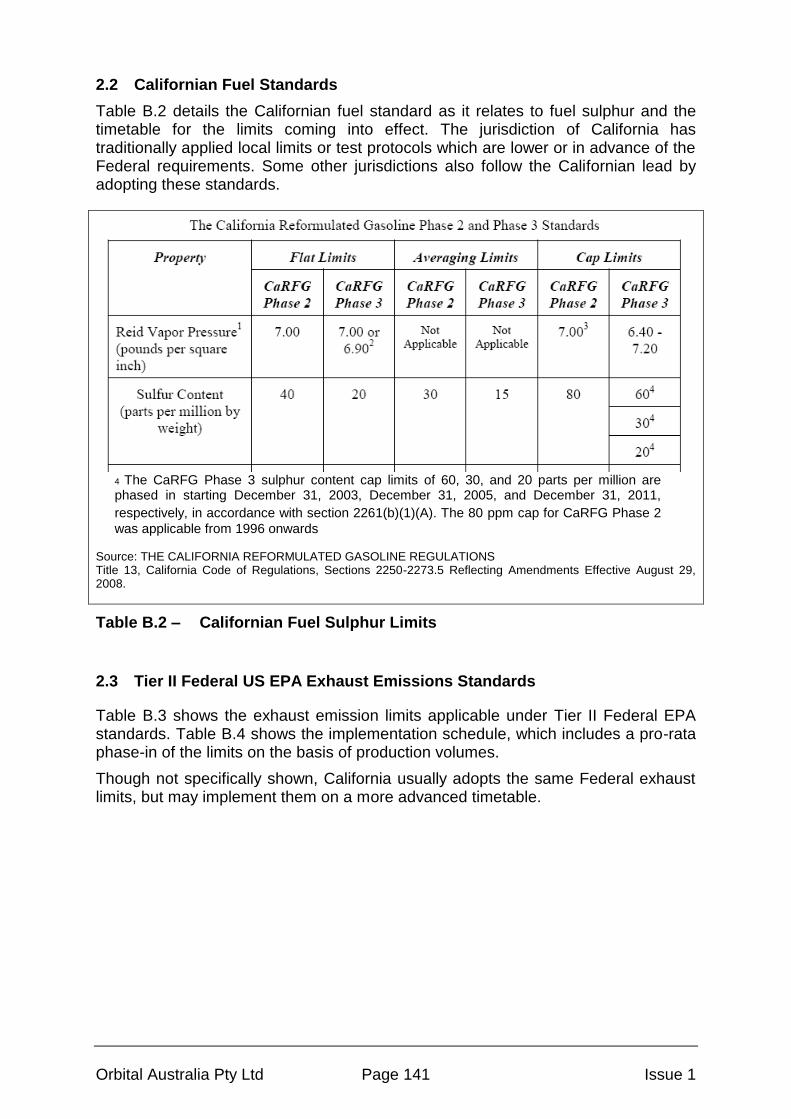
Orbital Australia Pty Ltd Page 141 Issue 1
2.2 Californian Fuel Standards
Table B.2 details the Californian fuel standard as it relates to fuel sulphur and the timetable for the limits coming into effect. The jurisdiction of California has traditionally applied local limits or test protocols which are lower or in advance of the Federal requirements. Some other jurisdictions also follow the Californian lead by adopting these standards.
4 The CaRFG Phase 3 sulphur content cap limits of 60, 30, and 20 parts per million are phased in starting December 31, 2003, December 31, 2005, and December 31, 2011,
respectively, in accordance with section 2261(b)(1)(A). The 80 ppm cap for CaRFG Phase 2
was applicable from 1996 onwards Source: THE CALIFORNIA REFORMULATED GASOLINE REGULATIONS Title 13, California Code of Regulations, Sections 2250-2273.5 Reflecting Amendments Effective August 29, 2008.
Table B.2 – Californian Fuel Sulphur Limits
2.3 Tier II Federal US EPA Exhaust Emissions Standards
Table B.3 shows the exhaust emission limits applicable under Tier II Federal EPA standards. Table B.4 shows the implementation schedule, which includes a pro-rata phase-in of the limits on the basis of production volumes.
Though not specifically shown, California usually adopts the same Federal exhaust limits, but may implement them on a more advanced timetable.
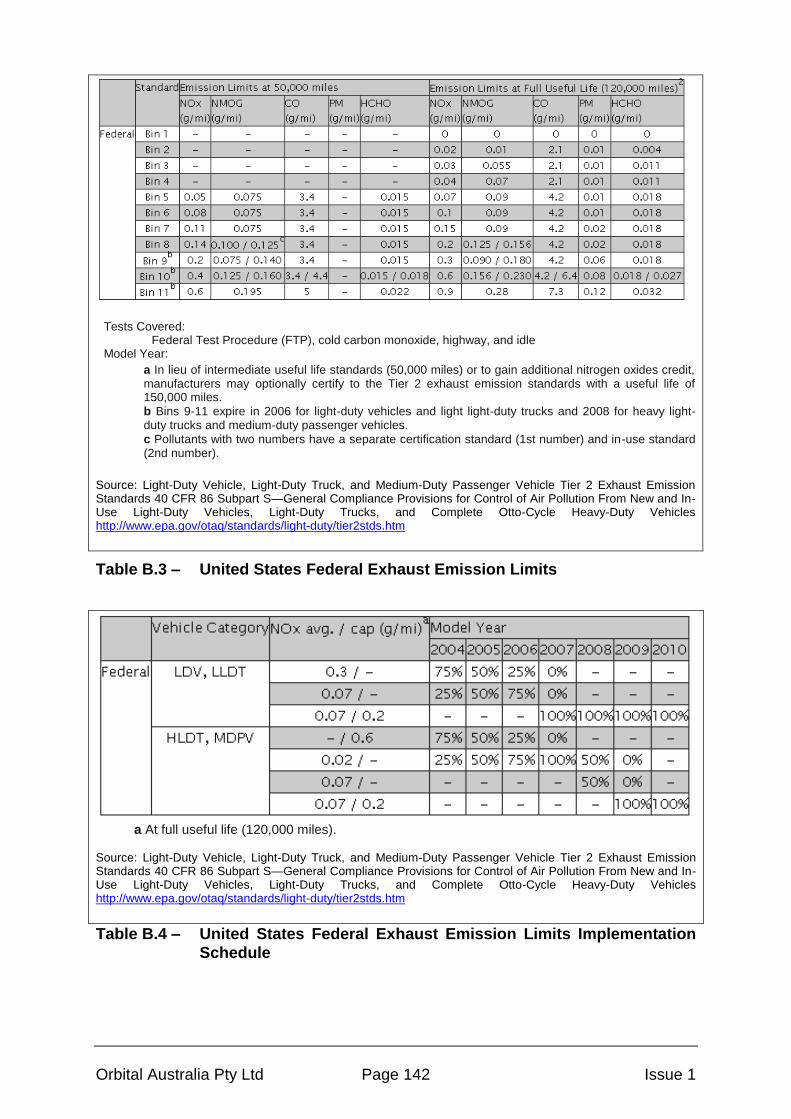
Orbital Australia Pty Ltd Page 142 Issue 1
Tests Covered: Federal Test Procedure (FTP), cold carbon monoxide, highway, and idle Model Year:
a In lieu of intermediate useful life standards (50,000 miles) or to gain additional nitrogen oxides credit, manufacturers may optionally certify to the Tier 2 exhaust emission standards with a useful life of 150,000 miles.
b Bins 9-11 expire in 2006 for light-duty vehicles and light light-duty trucks and 2008 for heavy light-duty trucks and medium-duty passenger vehicles.
c Pollutants with two numbers have a separate certification standard (1st number) and in-use standard (2nd number).
Source: Light-Duty Vehicle, Light-Duty Truck, and Medium-Duty Passenger Vehicle Tier 2 Exhaust Emission Standards 40 CFR 86 Subpart S—General Compliance Provisions for Control of Air Pollution From New and In-Use Light-Duty Vehicles, Light-Duty Trucks, and Complete Otto-Cycle Heavy-Duty Vehicles http://www.epa.gov/otaq/standards/light-duty/tier2stds.htm
Table B.3 – United States Federal Exhaust Emission Limits
a At full useful life (120,000 miles).
Source: Light-Duty Vehicle, Light-Duty Truck, and Medium-Duty Passenger Vehicle Tier 2 Exhaust Emission Standards 40 CFR 86 Subpart S—General Compliance Provisions for Control of Air Pollution From New and In-Use Light-Duty Vehicles, Light-Duty Trucks, and Complete Otto-Cycle Heavy-Duty Vehicles http://www.epa.gov/otaq/standards/light-duty/tier2stds.htm
Table B.4 – United States Federal Exhaust Emission Limits Implementation
Schedule
Orbital Australia Pty Ltd Page 143 Issue 1
APPENDIX C - CERTIFICATION FUEL SPECIFICATION
ADR 79/02 Certification Fuel Specification
Ref: VEHICLE STANDARD (AUSTRALIAN DESIGN RULE 79/02 — EMISSION CONTROL FOR LIGHT VEHICLES) 2005 APPENDIX A
Orbital Australia Pty Ltd Page 144 Issue 1
ADRs 79/03 and 79/04 Certification Fuel Specification


![MARINE ENVIRONMENT PROTECTION COMMITTEE ......2017] and with the European Union’s Sulphur Directive [EU, 2016] regarding marine fuel sulfur limits. According to these regulations,](https://static.fdocuments.in/doc/165x107/60d243f8e104ad58ba02f8b0/marine-environment-protection-committee-2017-and-with-the-european-unionas.jpg)