
REVIEW OF MARITIME TRANSPORT 2011 - UNCTAD …unctad.org/en/docs/rmt2011ch2_en.pdfto the carrier,...
28
UNITED NATIONS CONFERENCE ON TRADE AND DEVELOPMENT REVIEW OF MARITIME TRANSPORT 2011 Report by the UNCTAD secretariat Chapter 2 UNITED NATIONS New York and Geneva, 2011
Transcript of REVIEW OF MARITIME TRANSPORT 2011 - UNCTAD …unctad.org/en/docs/rmt2011ch2_en.pdfto the carrier,...

UNITED NATIONS CONFERENCE ON TRADE AND DEVELOPMENT
REVIEW OF MARITIMETRANSPORT
2011
Report by the UNCTAD secretariat
Chapter 2
UNITED NATIONS
New York and Geneva, 2011
The year 2010 saw record deliveries of new tonnage, 28 per cent higher than in 2009, resulting in an 8.6 per cent growth in the world �eet. The world merchant �eet reached almost 1.4 billion deadweight tons in January 2011, an increase of 120 million dwt over 2010. New deliveries stood at 150 million dwt, against demolitions and other withdrawals from the market of approximately 30 million dwt. Since 2005, the dry bulk �eet has almost doubled, and the containership �eet has nearly tripled. The share of foreign-�agged tonnage reached an estimated 68 per cent in January 2011.
This chapter presents the supply-side dynamics of the world maritime industry. It covers the structure, age pro�le, ownership and registration of the world �eet. The chapter also reviews deliveries, demolitions, and tonnage on order.
CHAPTER 2
STRUCTURE, OWNERSHIP
AND REGISTRATION OF THE WORLD FLEET
2
Review of MaRitiMe tRanspoRt 201136
A. structureoftheworldfleet
1. worldfleetgrowthandprincipal vesseltypes
Long-term trends in vessel types
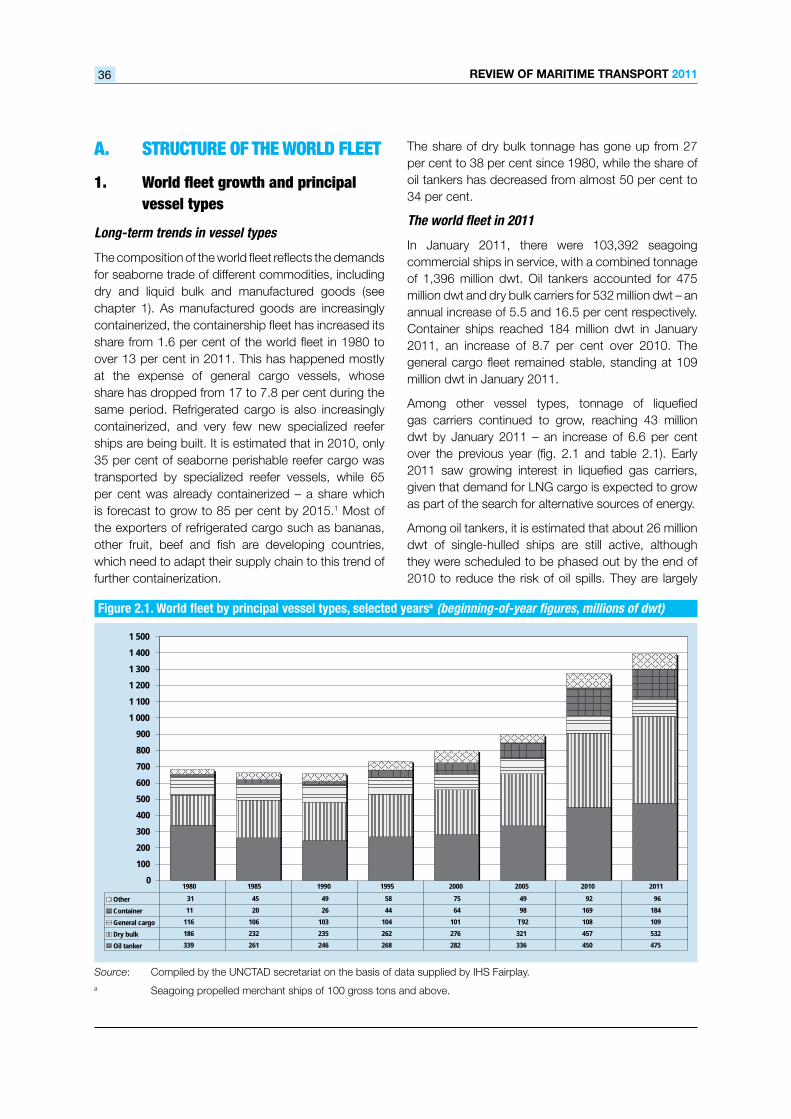
The composition of the world fleet reflects the demands for seaborne trade of different commodities, including dry and liquid bulk and manufactured goods (see chapter 1). As manufactured goods are increasingly containerized, the containership fleet has increased its share from 1.6 per cent of the world fleet in 1980 to over 13 per cent in 2011. This has happened mostly at the expense of general cargo vessels, whose share has dropped from 17 to 7.8 per cent during the same period. Refrigerated cargo is also increasingly containerized, and very few new specialized reefer ships are being built. It is estimated that in 2010, only 35 per cent of seaborne perishable reefer cargo was transported by specialized reefer vessels, while 65 per cent was already containerized – a share which is forecast to grow to 85 per cent by 2015.1 Most of the exporters of refrigerated cargo such as bananas, other fruit, beef and fish are developing countries, which need to adapt their supply chain to this trend of further containerization.
The share of dry bulk tonnage has gone up from 27 per cent to 38 per cent since 1980, while the share of oil tankers has decreased from almost 50 per cent to 34 per cent.
The world fleet in 2011
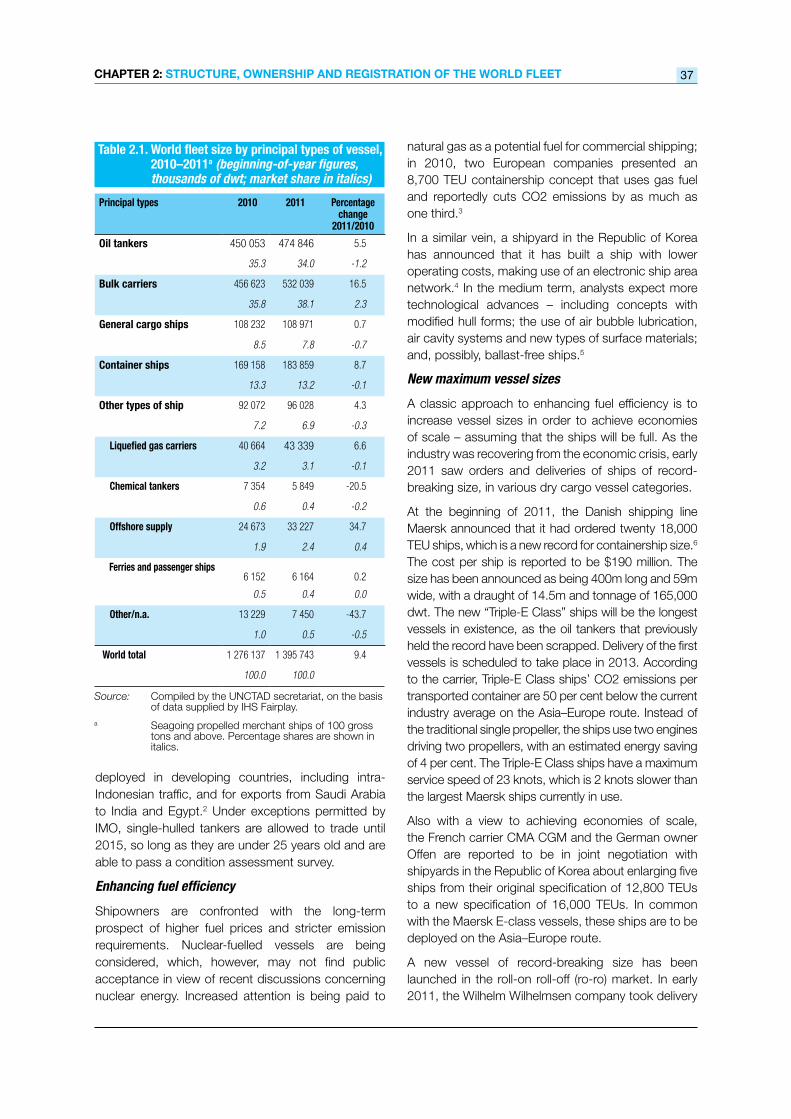
In January 2011, there were 103,392 seagoing commercial ships in service, with a combined tonnage of 1,396 million dwt. Oil tankers accounted for 475 million dwt and dry bulk carriers for 532 million dwt – an annual increase of 5.5 and 16.5 per cent respectively. Container ships reached 184 million dwt in January 2011, an increase of 8.7 per cent over 2010. The general cargo fleet remained stable, standing at 109 million dwt in January 2011.
Among other vessel types, tonnage of liquefied gas carriers continued to grow, reaching 43 million dwt by January 2011 – an increase of 6.6 per cent over the previous year (fig. 2.1 and table 2.1). Early 2011 saw growing interest in liquefied gas carriers, given that demand for LNG cargo is expected to grow as part of the search for alternative sources of energy.
Among oil tankers, it is estimated that about 26 million dwt of single-hulled ships are still active, although they were scheduled to be phased out by the end of 2010 to reduce the risk of oil spills. They are largely
Figure 2.1. World fleet by principal vessel types, selected yearsa (beginning-of-year figures, millions of dwt)
Source: Compiled by the UNCTAD secretariat on the basis of data supplied by IHS Fairplay.a Seagoing propelled merchant ships of 100 gross tons and above.
0
100
200
300
400
500
600
700
800
900
1 000
1 100
1 200
1 300
1 400
1 500
Other 31 45 49 58 75 49 92 96
Container 11 20 26 44 64 98 169 184
General cargo 116 106 103 104 101 T92 108 109
Dry bulk 186 232 235 262 276 321 457 532
Oil tanker 339 261 246 268 282 336 450 475
1980 1985 1990 1995 2000 2005 2010 2011
CHapteR 2: stRUCtURe, owneRsHip anD ReGistRation of tHe woRLD fLeet 37
deployed in developing countries, including intra-Indonesian traffic, and for exports from Saudi Arabia to India and Egypt.2 Under exceptions permitted by IMO, single-hulled tankers are allowed to trade until 2015, so long as they are under 25 years old and are able to pass a condition assessment survey.
Enhancing fuel efficiency
Shipowners are confronted with the long-term prospect of higher fuel prices and stricter emission requirements. Nuclear-fuelled vessels are being considered, which, however, may not find public acceptance in view of recent discussions concerning nuclear energy. Increased attention is being paid to
Table 2.1. World fleet size by principal types of vessel, 2010–2011a (beginning-of-year figures, thousands of dwt; market share in italics)
Principal types 2010 2011 Percentage change
2011/2010
Oil tankers 450 053 474 846 5.5
35.3 34.0 -1.2
Bulk carriers 456 623 532 039 16.5
35.8 38.1 2.3
General cargo ships 108 232 108 971 0.7
8.5 7.8 -0.7
Container ships 169 158 183 859 8.7
13.3 13.2 -0.1
Other types of ship 92 072 96 028 4.3
7.2 6.9 -0.3
Liquefied gas carriers 40 664 43 339 6.6
3.2 3.1 -0.1
Chemical tankers 7 354 5 849 -20.5
0.6 0.4 -0.2
Offshore supply 24 673 33 227 34.7
1.9 2.4 0.4
Ferries and passenger ships 6 152 6 164 0.2
0.5 0.4 0.0
Other/n.a. 13 229 7 450 -43.7
1.0 0.5 -0.5
World total 1 276 137 1 395 743 9.4
100.0 100.0
Source: Compiled by the UNCTAD secretariat, on the basis of data supplied by IHS Fairplay.
a Seagoing propelled merchant ships of 100 gross tons and above. Percentage shares are shown in italics.
natural gas as a potential fuel for commercial shipping; in 2010, two European companies presented an 8,700 TEU containership concept that uses gas fuel and reportedly cuts CO2 emissions by as much as one third.3
In a similar vein, a shipyard in the Republic of Korea has announced that it has built a ship with lower operating costs, making use of an electronic ship area network.4 In the medium term, analysts expect more technological advances – including concepts with modified hull forms; the use of air bubble lubrication, air cavity systems and new types of surface materials; and, possibly, ballast-free ships.5
New maximum vessel sizes
A classic approach to enhancing fuel efficiency is to increase vessel sizes in order to achieve economies of scale – assuming that the ships will be full. As the industry was recovering from the economic crisis, early 2011 saw orders and deliveries of ships of record-breaking size, in various dry cargo vessel categories.
At the beginning of 2011, the Danish shipping line Maersk announced that it had ordered twenty 18,000 TEU ships, which is a new record for containership size.6 The cost per ship is reported to be $190 million. The size has been announced as being 400m long and 59m wide, with a draught of 14.5m and tonnage of 165,000 dwt. The new “Triple-E Class” ships will be the longest vessels in existence, as the oil tankers that previously held the record have been scrapped. Delivery of the first vessels is scheduled to take place in 2013. According to the carrier, Triple-E Class ships’ CO2 emissions per transported container are 50 per cent below the current industry average on the Asia–Europe route. Instead of the traditional single propeller, the ships use two engines driving two propellers, with an estimated energy saving of 4 per cent. The Triple-E Class ships have a maximum service speed of 23 knots, which is 2 knots slower than the largest Maersk ships currently in use.
Also with a view to achieving economies of scale, the French carrier CMA CGM and the German owner Offen are reported to be in joint negotiation with shipyards in the Republic of Korea about enlarging five ships from their original specification of 12,800 TEUs to a new specification of 16,000 TEUs. In common with the Maersk E-class vessels, these ships are to be deployed on the Asia–Europe route.
A new vessel of record-breaking size has been launched in the roll-on roll-off (ro-ro) market. In early 2011, the Wilhelm Wilhelmsen company took delivery
Review of MaRitiMe tRanspoRt 201138
of the first in a series of four 265-metre-long ships built in Japan by Mitsubishi Heavy Industries.
Containerized reefer capacity has increased too. Hamburg Süd took delivery of a 7,100 TEU container ship in December 2010 which has 1,600 slots for reefer containers – this is among the highest reefer capacity on the container ships that are currently available.
The year 2011 also saw delivery of a dry bulk carrier of record-breaking size, built in the Republic of Korea for the Brazilian conglomerate Vale. The Vale Brasil is 365m long, 66m wide, and has a draught of 23m. It has a capacity of 400,000 dwt – almost 10 per cent larger than the previous record holder. The Vale Brasil is the first in a series of ships called “chinamax” or also “valemax”, planned to be deployed by Vale on the Brazil–China route, for iron ore. There are currently 30 chinamax dry bulk carriers on the order books. They are being built by STX and Daewoo Shipbuilding in the Republic of Korea and by Rongsheng in China.7
Are these record vessel sizes in various dry cargo shipping markets economically justified? In the 1970s, shipowners that had invested in record-size oil tankers able to carry 3 million barrels of oil lost most of their investment. As fuel prices unexpectedly fell, energy efficiency became less relevant and traders “preferred the 2m barrel parcel”.8 Could the same happen to those that now invest in huge new container ships, ro-ro vessels or dry bulkers? While it is impossible to foresee future downturns in demand, fuel efficiency will certainly remain on the agenda, and economies of scale will be achieved by, for example, reducing construction and labour costs per TEU. As regards the question of shippers’ preferences for “parcel” sizes, container ships are different from tankers. Each voyage carries the cargo of thousands of traders who use the containerized liner shipping services. Unlike in oil or dry bulk shipping, no single trader would move an 18,000 TEU “parcel” on his own. It is thus unlikely that containership operators would be confronted by a lack of clients as oil tanker owners were in the 1970s.
In the case of Vale’s large dry bulk carriers, the owner of the cargo and the owner of the ship are one and the same company. Again, it appears unlikely that the 1970s oil tanker story of insufficient demand will be repeated, as there is no risk of not finding a “client”.
There are, however, other challenges that arise with ever-increasing vessel sizes. Ports and access channels may need to be dredged, cargo handling equipment needs to be able to cope with ever-higher
volumes and the wider beam, and arrangements need to be in place to move cargo onwards by road, rail, barge, or feeder ships. If the unloading of a container ship takes several days, a consignee may not know if his box will be the first to be delivered or the last. Other vessels are likely to be pushed onto routes that may not yet be able to cater for larger ships, which include ports in many developing countries. There is also the issue of insurability, as “underwriters are worried about the accumulated level of exposures for mega vessels”.9
As the first chinamax dry bulk vessels are being delivered to Vale from Brazil, they are confronted with the challenge of finding ports of call. In early 2011, China had not yet authorized them to enter Chinese ports fully loaded, and an iron ore distribution centre at the Chinese port of Qingdao had reportedly not yet been approved. Vale is considering calling in ports in Malaysia and then transshipping the iron ore from there to China, or entering Qingdao not fully loaded.10
The need to generate enough cargo for ever-larger ships may lead to further consolidation among shipping lines. Recent years have seen relative stability, but the new wave of large container ships entering service may force carriers to either strengthen their operational alliances or to pursue further growth through mergers and acquisitions.
Will container ships get much bigger than 18,000 TEUs? The possible plateau of 18,000 TEUs was already mentioned more than a decade ago, under the name of “malaccamax”, as presented in the year 2000 by Professor Niko Wijnolst of Delft University of Technology. The dimensions of the malaccamax were different, as it had a draught of 21m. This would have required the dredging of the Suez Canal, and is the maximum draught to pass the Malacca Strait. In 2000, an article in Lloyd’s List asked “what could happen if mad shipping companies decide to go down this road” of 18,000 TEU ships “in pursuance of lowest possible costs for the sea leg, with all the present ports furiously dredging to stay connected”.11 With a draught of 14.5m, the Triple-E class vessels will not face restrictions passing the Malacca Strait. Some shipyards in the Republic of Korea have presented designs for ships of up to 22,000 TEUs, which would be longer, but not significantly wider or deeper.12 Although designs exist for malaccamax container ships of up to 35,000 TEUs, the depth and crane outreach in today’s major container ports can only handle ships with a maximum capacity of between
CHapteR 2: stRUCtURe, owneRsHip anD ReGistRation of tHe woRLD fLeet 39
18,000 and 22,000 TEUs. Any further significant growth in vessel sizes would require massive port investments. Probably a plateau has been reached.
Container ships
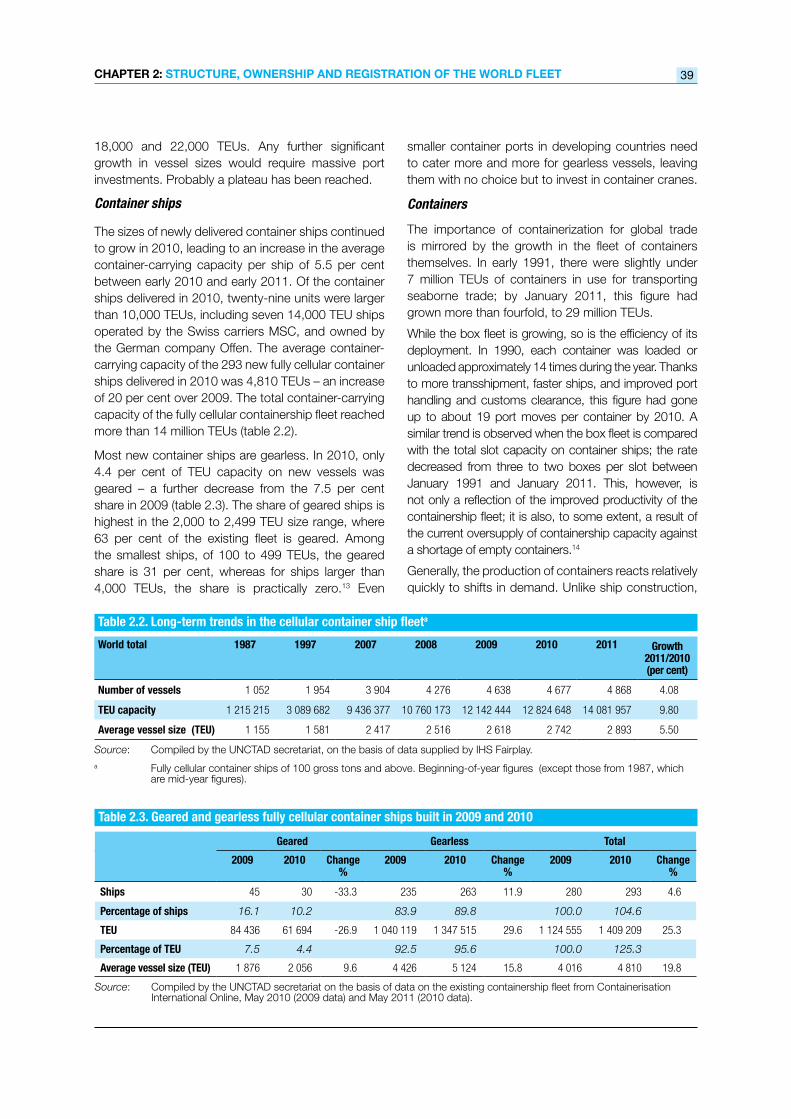
The sizes of newly delivered container ships continued to grow in 2010, leading to an increase in the average container-carrying capacity per ship of 5.5 per cent between early 2010 and early 2011. Of the container ships delivered in 2010, twenty-nine units were larger than 10,000 TEUs, including seven 14,000 TEU ships operated by the Swiss carriers MSC, and owned by the German company Offen. The average container-carrying capacity of the 293 new fully cellular container ships delivered in 2010 was 4,810 TEUs – an increase of 20 per cent over 2009. The total container-carrying capacity of the fully cellular containership fleet reached more than 14 million TEUs (table 2.2).
Most new container ships are gearless. In 2010, only 4.4 per cent of TEU capacity on new vessels was geared – a further decrease from the 7.5 per cent share in 2009 (table 2.3). The share of geared ships is highest in the 2,000 to 2,499 TEU size range, where 63 per cent of the existing fleet is geared. Among the smallest ships, of 100 to 499 TEUs, the geared share is 31 per cent, whereas for ships larger than 4,000 TEUs, the share is practically zero.13 Even
World total 1987 1997 2007 2008 2009 2010 2011 Growth 2011/2010 (per cent)
Number of vessels 1 052 1 954 3 904 4 276 4 638 4 677 4 868 4.08
TEU capacity 1 215 215 3 089 682 9 436 377 10 760 173 12 142 444 12 824 648 14 081 957 9.80
Average vessel size (TEU) 1 155 1 581 2 417 2 516 2 618 2 742 2 893 5.50
Source: Compiled by the UNCTAD secretariat, on the basis of data supplied by IHS Fairplay.a Fully cellular container ships of 100 gross tons and above. Beginning-of-year figures (except those from 1987, which
are mid-year figures).
Table 2.2. Long-term trends in the cellular container ship fleeta
Geared Gearless Total
2009 2010 Change %
2009 2010 Change %
2009 2010 Change %
Ships 45 30 -33.3 235 263 11.9 280 293 4.6
Percentage of ships 16.1 10.2 83.9 89.8 100.0 104.6
TEU 84 436 61 694 -26.9 1 040 119 1 347 515 29.6 1 124 555 1 409 209 25.3
Percentage of TEU 7.5 4.4 92.5 95.6 100.0 125.3
Average vessel size (TEU) 1 876 2 056 9.6 4 426 5 124 15.8 4 016 4 810 19.8
Table 2.3. Geared and gearless fully cellular container ships built in 2009 and 2010
Source: Compiled by the UNCTAD secretariat on the basis of data on the existing containership fleet from Containerisation International Online, May 2010 (2009 data) and May 2011 (2010 data).
smaller container ports in developing countries need to cater more and more for gearless vessels, leaving them with no choice but to invest in container cranes.
Containers
The importance of containerization for global trade is mirrored by the growth in the fleet of containers themselves. In early 1991, there were slightly under 7 million TEUs of containers in use for transporting seaborne trade; by January 2011, this figure had grown more than fourfold, to 29 million TEUs.
While the box fleet is growing, so is the efficiency of its deployment. In 1990, each container was loaded or unloaded approximately 14 times during the year. Thanks to more transshipment, faster ships, and improved port handling and customs clearance, this figure had gone up to about 19 port moves per container by 2010. A similar trend is observed when the box fleet is compared with the total slot capacity on container ships; the rate decreased from three to two boxes per slot between January 1991 and January 2011. This, however, is not only a reflection of the improved productivity of the containership fleet; it is also, to some extent, a result of the current oversupply of containership capacity against a shortage of empty containers.14
Generally, the production of containers reacts relatively quickly to shifts in demand. Unlike ship construction,
Review of MaRitiMe tRanspoRt 201140
where order books usually deal with periods lasting several years, and construction easily takes a year (depending on the vessel type), container factories can increase or decrease production relatively easily, and the period between ordering a new standard container and its delivery can be just three months. Nevertheless, in early 2011, some carriers were expressing concerns about a shortage of containers, after production in 2009 practically came to a standstill, while today’s demand has surged in line with new box ship deliveries and continued slow steaming. The latter further adds to the demand, because containers (empty and full) spend more time at sea. The March 2011 tsunami in Japan reportedly resulted in the loss of as many as 1 million TEUs.15 Carriers have reacted by extending the life of older boxes and by deploying entire ships just to reposition empties. Maersk Line reportedly started manufacturing new containers on its own account, and lines may again impose “peak season surcharges” on shippers.16
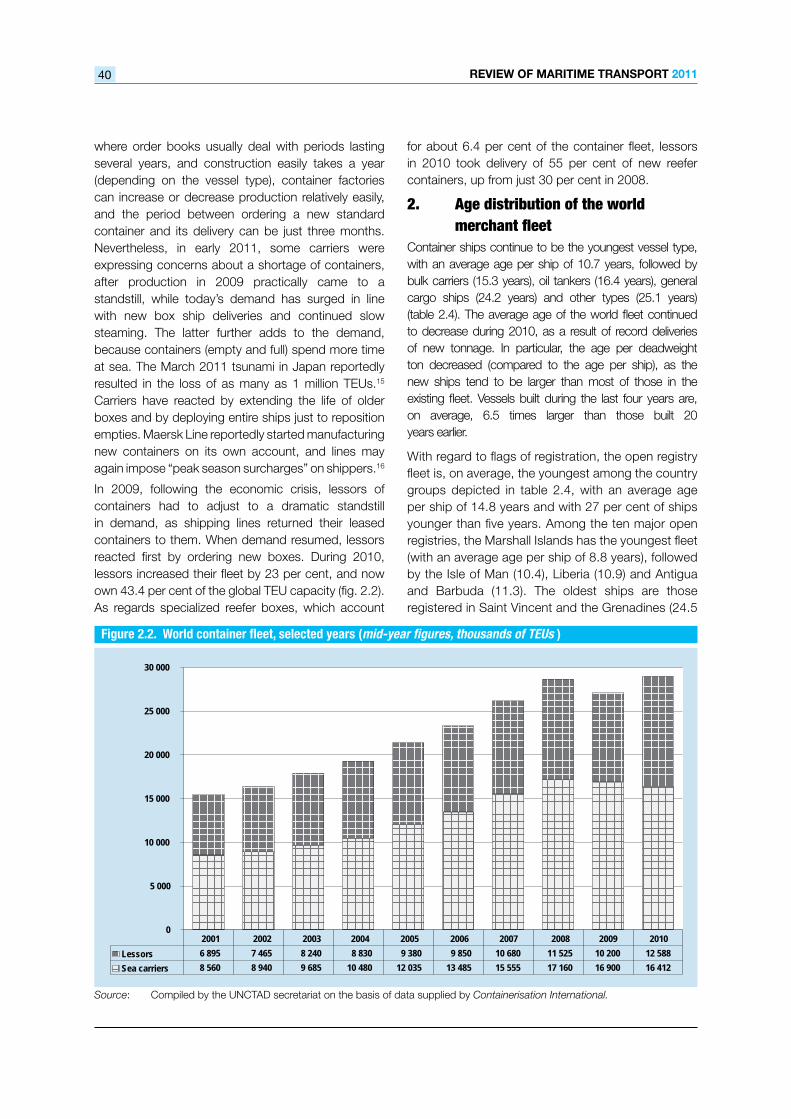
In 2009, following the economic crisis, lessors of containers had to adjust to a dramatic standstill in demand, as shipping lines returned their leased containers to them. When demand resumed, lessors reacted first by ordering new boxes. During 2010, lessors increased their fleet by 23 per cent, and now own 43.4 per cent of the global TEU capacity (fig. 2.2). As regards specialized reefer boxes, which account
for about 6.4 per cent of the container fleet, lessors in 2010 took delivery of 55 per cent of new reefer containers, up from just 30 per cent in 2008.
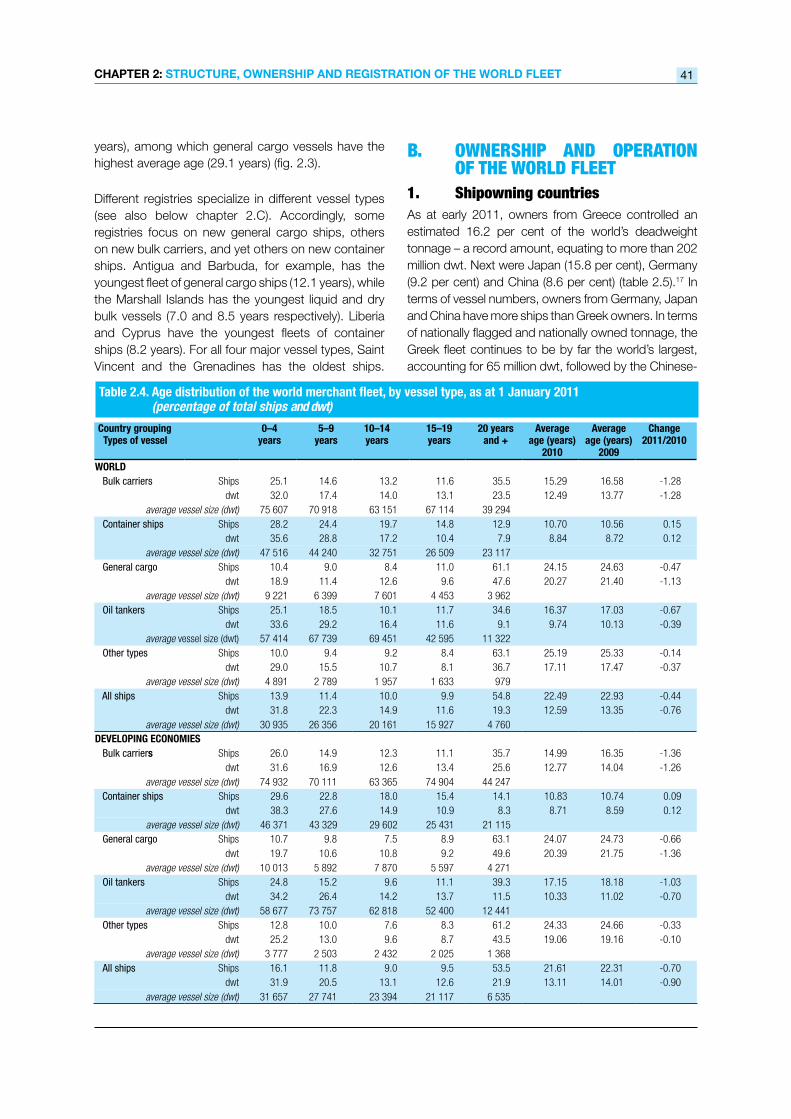
2. Agedistributionoftheworld merchantfleetContainer ships continue to be the youngest vessel type, with an average age per ship of 10.7 years, followed by bulk carriers (15.3 years), oil tankers (16.4 years), general cargo ships (24.2 years) and other types (25.1 years) (table 2.4). The average age of the world fleet continued to decrease during 2010, as a result of record deliveries of new tonnage. In particular, the age per deadweight ton decreased (compared to the age per ship), as the new ships tend to be larger than most of those in the existing fleet. Vessels built during the last four years are, on average, 6.5 times larger than those built 20 years earlier.
With regard to flags of registration, the open registry fleet is, on average, the youngest among the country groups depicted in table 2.4, with an average age per ship of 14.8 years and with 27 per cent of ships younger than five years. Among the ten major open registries, the Marshall Islands has the youngest fleet (with an average age per ship of 8.8 years), followed by the Isle of Man (10.4), Liberia (10.9) and Antigua and Barbuda (11.3). The oldest ships are those registered in Saint Vincent and the Grenadines (24.5
Figure 2.2. World container fleet, selected years (mid-year figures, thousands of TEUs )
Source: Compiled by the UNCTAD secretariat on the basis of data supplied by Containerisation International.
5 000
0
10 000
15 000
20 000
25 000
30 000
Lessors 6 895 7 465 8 240 8 830 9 380 9 850 10 680 11 525 10 200 12 588
Sea carriers 8 560 8 940 9 685 10 480 12 035 13 485 15 555 17 160 16 900 16 412
2001 2002 2003 2004 2005 2006 2007 2008 2009 2010
CHapteR 2: stRUCtURe, owneRsHip anD ReGistRation of tHe woRLD fLeet 41
years), among which general cargo vessels have the highest average age (29.1 years) (fig. 2.3).
Different registries specialize in different vessel types (see also below chapter 2.C). Accordingly, some registries focus on new general cargo ships, others on new bulk carriers, and yet others on new container ships. Antigua and Barbuda, for example, has the youngest fleet of general cargo ships (12.1 years), while the Marshall Islands has the youngest liquid and dry bulk vessels (7.0 and 8.5 years respectively). Liberia and Cyprus have the youngest fleets of container ships (8.2 years). For all four major vessel types, Saint Vincent and the Grenadines has the oldest ships.
.B. owNershIP ANd oPerAtIoN oftheworldfleet1. shipowningcountriesAs at early 2011, owners from Greece controlled an estimated 16.2 per cent of the world’s deadweight tonnage – a record amount, equating to more than 202 million dwt. Next were Japan (15.8 per cent), Germany (9.2 per cent) and China (8.6 per cent) (table 2.5).17 In terms of vessel numbers, owners from Germany, Japan and China have more ships than Greek owners. In terms of nationally flagged and nationally owned tonnage, the Greek fleet continues to be by far the world’s largest, accounting for 65 million dwt, followed by the Chinese-
Country grouping Types of vessel
0–4 years
5–9 years
10–14 years
15–19 years
20 years and +
Average age (years)
2010
Average age (years)
2009
Change 2011/2010
WORLD Bulk carriers Ships 25.1 14.6 13.2 11.6 35.5 15.29 16.58 -1.28
dwt 32.0 17.4 14.0 13.1 23.5 12.49 13.77 -1.28average vessel size (dwt) 75 607 70 918 63 151 67 114 39 294
Container ships Ships 28.2 24.4 19.7 14.8 12.9 10.70 10.56 0.15dwt 35.6 28.8 17.2 10.4 7.9 8.84 8.72 0.12
average vessel size (dwt) 47 516 44 240 32 751 26 509 23 117 General cargo Ships 10.4 9.0 8.4 11.0 61.1 24.15 24.63 -0.47
dwt 18.9 11.4 12.6 9.6 47.6 20.27 21.40 -1.13average vessel size (dwt) 9 221 6 399 7 601 4 453 3 962
Oil tankers Ships 25.1 18.5 10.1 11.7 34.6 16.37 17.03 -0.67dwt 33.6 29.2 16.4 11.6 9.1 9.74 10.13 -0.39
average vessel size (dwt) 57 414 67 739 69 451 42 595 11 322 Other types Ships 10.0 9.4 9.2 8.4 63.1 25.19 25.33 -0.14
dwt 29.0 15.5 10.7 8.1 36.7 17.11 17.47 -0.37average vessel size (dwt) 4 891 2 789 1 957 1 633 979
All ships Ships 13.9 11.4 10.0 9.9 54.8 22.49 22.93 -0.44dwt 31.8 22.3 14.9 11.6 19.3 12.59 13.35 -0.76
average vessel size (dwt) 30 935 26 356 20 161 15 927 4 760DEVELOPING ECONOMIES Bulk carriers Ships 26.0 14.9 12.3 11.1 35.7 14.99 16.35 -1.36
dwt 31.6 16.9 12.6 13.4 25.6 12.77 14.04 -1.26average vessel size (dwt) 74 932 70 111 63 365 74 904 44 247
Container ships Ships 29.6 22.8 18.0 15.4 14.1 10.83 10.74 0.09dwt 38.3 27.6 14.9 10.9 8.3 8.71 8.59 0.12
average vessel size (dwt) 46 371 43 329 29 602 25 431 21 115 General cargo Ships 10.7 9.8 7.5 8.9 63.1 24.07 24.73 -0.66
dwt 19.7 10.6 10.8 9.2 49.6 20.39 21.75 -1.36average vessel size (dwt) 10 013 5 892 7 870 5 597 4 271
Oil tankers Ships 24.8 15.2 9.6 11.1 39.3 17.15 18.18 -1.03dwt 34.2 26.4 14.2 13.7 11.5 10.33 11.02 -0.70
average vessel size (dwt) 58 677 73 757 62 818 52 400 12 441 Other types Ships 12.8 10.0 7.6 8.3 61.2 24.33 24.66 -0.33
dwt 25.2 13.0 9.6 8.7 43.5 19.06 19.16 -0.10average vessel size (dwt) 3 777 2 503 2 432 2 025 1 368
All ships Ships 16.1 11.8 9.0 9.5 53.5 21.61 22.31 -0.70dwt 31.9 20.5 13.1 12.6 21.9 13.11 14.01 -0.90
average vessel size (dwt) 31 657 27 741 23 394 21 117 6 535
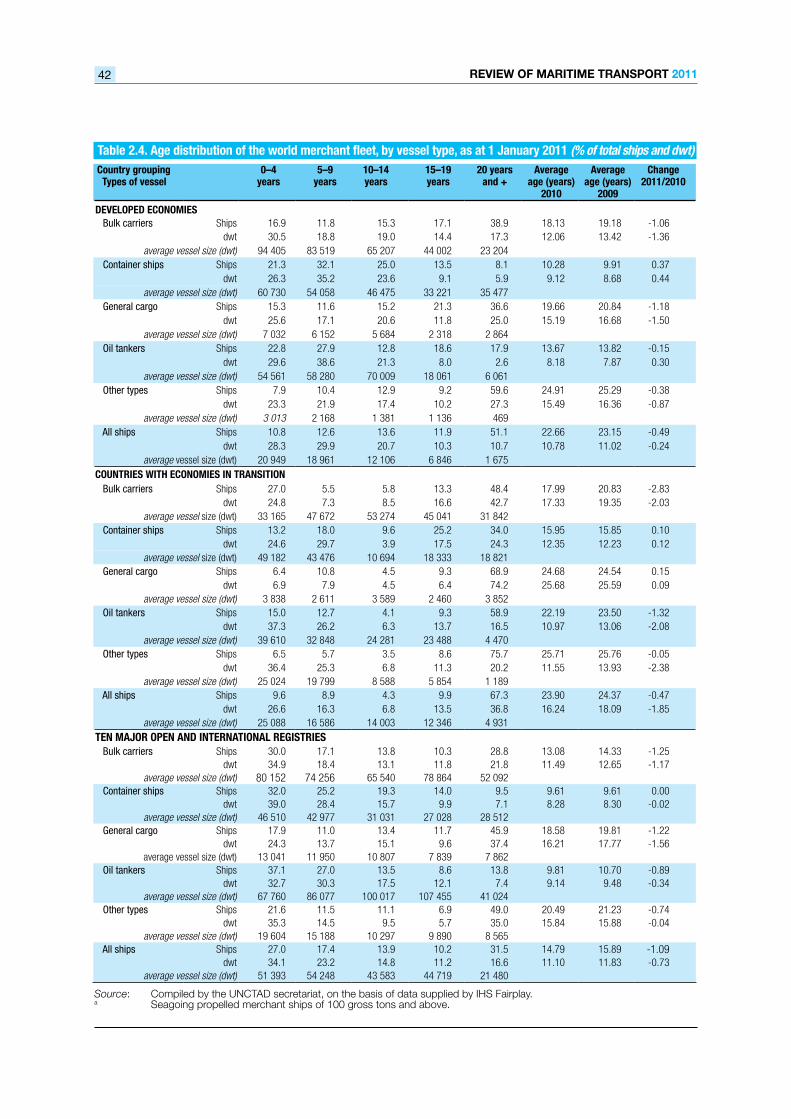
Table 2.4. Age distribution of the world merchant fleet, by vessel type, as at 1 January 2011 (percentage of total ships and dwt)
Review of MaRitiMe tRanspoRt 201142
Country grouping Types of vessel
0–4 years
5–9 years
10–14 years
15–19 years
20 years and +
Average age (years)
2010
Average age (years)
2009
Change 2011/2010
DEVELOPED ECONOMIES Bulk carriers Ships 16.9 11.8 15.3 17.1 38.9 18.13 19.18 -1.06
dwt 30.5 18.8 19.0 14.4 17.3 12.06 13.42 -1.36average vessel size (dwt) 94 405 83 519 65 207 44 002 23 204
Container ships Ships 21.3 32.1 25.0 13.5 8.1 10.28 9.91 0.37dwt 26.3 35.2 23.6 9.1 5.9 9.12 8.68 0.44
average vessel size (dwt) 60 730 54 058 46 475 33 221 35 477 General cargo Ships 15.3 11.6 15.2 21.3 36.6 19.66 20.84 -1.18
dwt 25.6 17.1 20.6 11.8 25.0 15.19 16.68 -1.50average vessel size (dwt) 7 032 6 152 5 684 2 318 2 864
Oil tankers Ships 22.8 27.9 12.8 18.6 17.9 13.67 13.82 -0.15dwt 29.6 38.6 21.3 8.0 2.6 8.18 7.87 0.30
average vessel size (dwt) 54 561 58 280 70 009 18 061 6 061 Other types Ships 7.9 10.4 12.9 9.2 59.6 24.91 25.29 -0.38
dwt 23.3 21.9 17.4 10.2 27.3 15.49 16.36 -0.87average vessel size (dwt) 3 013 2 168 1 381 1 136 469
All ships Ships 10.8 12.6 13.6 11.9 51.1 22.66 23.15 -0.49dwt 28.3 29.9 20.7 10.3 10.7 10.78 11.02 -0.24
average vessel size (dwt) 20 949 18 961 12 106 6 846 1 675COUNTRIES WITH ECONOMIES IN TRANSITION Bulk carriers Ships 27.0 5.5 5.8 13.3 48.4 17.99 20.83 -2.83
dwt 24.8 7.3 8.5 16.6 42.7 17.33 19.35 -2.03average vessel size (dwt) 33 165 47 672 53 274 45 041 31 842
Container ships Ships 13.2 18.0 9.6 25.2 34.0 15.95 15.85 0.10dwt 24.6 29.7 3.9 17.5 24.3 12.35 12.23 0.12
average vessel size (dwt) 49 182 43 476 10 694 18 333 18 821 General cargo Ships 6.4 10.8 4.5 9.3 68.9 24.68 24.54 0.15
dwt 6.9 7.9 4.5 6.4 74.2 25.68 25.59 0.09average vessel size (dwt) 3 838 2 611 3 589 2 460 3 852
Oil tankers Ships 15.0 12.7 4.1 9.3 58.9 22.19 23.50 -1.32dwt 37.3 26.2 6.3 13.7 16.5 10.97 13.06 -2.08
average vessel size (dwt) 39 610 32 848 24 281 23 488 4 470 Other types Ships 6.5 5.7 3.5 8.6 75.7 25.71 25.76 -0.05
dwt 36.4 25.3 6.8 11.3 20.2 11.55 13.93 -2.38average vessel size (dwt) 25 024 19 799 8 588 5 854 1 189
All ships Ships 9.6 8.9 4.3 9.9 67.3 23.90 24.37 -0.47dwt 26.6 16.3 6.8 13.5 36.8 16.24 18.09 -1.85
average vessel size (dwt) 25 088 16 586 14 003 12 346 4 931TEN MAJOR OPEN AND INTERNATIONAL REGISTRIES Bulk carriers Ships 30.0 17.1 13.8 10.3 28.8 13.08 14.33 -1.25
dwt 34.9 18.4 13.1 11.8 21.8 11.49 12.65 -1.17average vessel size (dwt) 80 152 74 256 65 540 78 864 52 092
Container ships Ships 32.0 25.2 19.3 14.0 9.5 9.61 9.61 0.00dwt 39.0 28.4 15.7 9.9 7.1 8.28 8.30 -0.02
average vessel size (dwt) 46 510 42 977 31 031 27 028 28 512 General cargo Ships 17.9 11.0 13.4 11.7 45.9 18.58 19.81 -1.22
dwt 24.3 13.7 15.1 9.6 37.4 16.21 17.77 -1.56average vessel size (dwt) 13 041 11 950 10 807 7 839 7 862
Oil tankers Ships 37.1 27.0 13.5 8.6 13.8 9.81 10.70 -0.89dwt 32.7 30.3 17.5 12.1 7.4 9.14 9.48 -0.34
average vessel size (dwt) 67 760 86 077 100 017 107 455 41 024 Other types Ships 21.6 11.5 11.1 6.9 49.0 20.49 21.23 -0.74
dwt 35.3 14.5 9.5 5.7 35.0 15.84 15.88 -0.04average vessel size (dwt) 19 604 15 188 10 297 9 890 8 565
All ships Ships 27.0 17.4 13.9 10.2 31.5 14.79 15.89 -1.09dwt 34.1 23.2 14.8 11.2 16.6 11.10 11.83 -0.73
average vessel size (dwt) 51 393 54 248 43 583 44 719 21 480
Source: Compiled by the UNCTAD secretariat, on the basis of data supplied by IHS Fairplay.a Seagoing propelled merchant ships of 100 gross tons and above.
Table 2.4. Age distribution of the world merchant fleet, by vessel type, as at 1 January 2011 (% of total ships and dwt)

CHapteR 2: stRUCtURe, owneRsHip anD ReGistRation of tHe woRLD fLeet 43
Figure 2.3. Average age per ship, by vessel type, 10 major open registries (beginning of 2011, in years)
Source: Compiled and calculated by the UNCTAD secretariat on the basis of data supplied by IHS Fairplay.
Country or territory of ownership b
Number of vessels Deadweight tonnage
National flagc
Foreign flag
Total Nationalflagc
Foreign flag
Total Foreign flag as a
percentage of total
Total as a percentage
of world total, 1 Jan.
2011
Greece 758 2 455 3 213 64 659 201 137 728 951 202 388 152 68.05 16.17
Japan 724 3 071 3 795 18 942 573 178 287 143 197 229 716 90.40 15.76
Germany 442 3 356 3 798 17 149 221 97 623 425 114 772 646 85.06 9.17
China 2 044 1 607 3 651 46 207 468 61 762 042 107 969 510 57.20 8.63
Republic of Korea 736 453 1 189 18 135 391 29 317 780 47 453 171 61.78 3.79
United States 971 1 001 1 972 24 363 690 22 011 225 46 374 915 47.46 3.71
Norway 818 1 166 1 984 14 850 693 28 127 239 42 977 932 65.45 3.43
China, Hong Kong SAR 399 313 712 24 102 438 13 080 401 37 182 839 35.18 2.97
Denmark 383 592 975 13 998 073 21 113 253 35 111 326 60.13 2.81
China, Taiwan Province of 97 565 662 4 096 790 28 863 160 32 959 950 87.57 2.63
Singapore 659 362 1 021 18 693 547 12 939 490 31 633 037 40.90 2.53
Bermuda 17 268 285 2 297 441 28 252 207 30 549 648 92.48 2.44
Italy 616 220 836 16 556 782 6 774 107 23 330 889 29.03 1.86
United Kingdom 366 412 778 8 927 892 13 395 899 22 323 791 60.01 1.78
Turkey 551 648 1 199 7 869 898 11 914 688 19 784 586 60.22 1.58
Russian Federation 1 406 485 1 891 5 548 938 13 952 473 19 501 411 71.55 1.56
Canada 210 226 436 2 474 401 16 654 836 19 129 237 87.06 1.53
India 460 74 534 14 679 913 3 445 887 18 125 800 19.01 1.45
Table 2.5. The 35 countries and territories with the largest owned fleets (dwt), as at 1 January 2011a
0
5
10
15
20
25
30
Container 8.9 8.7 21.3 8.2 9.7 8.2 11.0 9.1 11.5 24.5
General cargo 12.1 18.3 18.4 14.1 13.4 15.3 16.5 14.4 20.9 29.1
Dry bulk 9.7 12.2 16.5 12.5 9.3 12.1 13.3 8.5 13.9 28.7
Oil tanker 17.9 9.0 8.7 8.0 7.9 9.5 8.1 7.0 12.6 23.6
All ships 11.3 14.4 13.9 12.2 10.4 10.9 13.2 8.8 17.7 24.5
Antigua and
BarbudaBahamas Bermuda Cyprus
Isle of Man
Liberia MaltaMarshall Islands
PanamaSaint Vincent
and theGrenadines
Review of MaRitiMe tRanspoRt 201144
Source: Compiled by the UNCTAD secretariat on the basis of data supplied by IHS Fairplay.a Vessels of 1,000 GT and above, ranked by deadweight tonnage; excluding the United States Reserve Fleet and the United
States and Canadian Great Lakes fleets (which have a combined tonnage of 5.4 million dwt).b The country of ownership indicates where the true controlling interest (i.e. parent company) of the fleet is located. In several
cases, determining this has required making certain judgements. Thus, for instance, Greece is shown as the country of ownership for vessels owned by a Greek national whose company has representative offices in New York, London and Piraeus, although the owner may be domiciled in the United States.
c Includes vessels flying the national flag but registered in territorial dependencies or associated self-governing territories such as Gibraltar, Guernsey, Isle of Man or Jersey (United Kingdom), and in second registries such as DIS (Denmark), NIS (Norway) or FIS (France). For the United Kingdom, British-flagged vessels are included under the national flag, except for Bermuda.
Country or territory of ownership b
Number of vessels Deadweight tonnage
National flagc
Foreign flag
Total Nationalflagc
Foreign flag
Total Foreign flag as a
percentage of total
Total as a percentage
of world total, 1 Jan.
2011
Malaysia 421 105 526 9 323 448 4 743 829 14 067 277 33.72 1.12
Belgium 91 158 249 6 119 923 6 835 060 12 954 983 52.76 1.04
Iran (Islamic Republic of) 62 80 142 628 381 12 024 439 12 652 820 95.03 1.01
Saudi Arabia 70 105 175 1 745 029 10 675 882 12 420 911 85.95 0.99
Brazil 128 44 172 2 227 804 8 400 258 10 628 062 79.04 0.85
Indonesia 868 85 953 8 203 079 1 757 088 9 960 167 17.64 0.80
Cyprus 129 158 287 4 016 022 5 462 113 9 478 135 57.63 0.76
Netherlands 522 320 842 4 357 102 5 076 376 9 433 478 53.81 0.75
United Arab Emirates 69 354 423 655 296 8 705 135 9 360 431 93.00 0.75
France 177 274 451 3 179 832 5 888 255 9 068 087 64.93 0.72
Viet Nam 476 86 562 4 723 669 2 249 774 6 973 443 32.26 0.56
Sweden 115 186 301 1 161 602 4 481 787 5 643 389 79.42 0.45
Kuwait 35 45 80 2 986 997 2 636 129 5 623 126 46.88 0.45
Isle of Man - 33 33 - 5 456 847 5 456 847 100.00 0.44
Spain 163 226 389 1 508 173 3 482 572 4 990 745 69.78 0.40
Thailand 285 53 338 3 475 509 1 014 469 4 489 978 22.59 0.36
Qatar 46 32 78 878 634 3 315 599 4 194 233 79.05 0.34
Total top 35 countries 15 314 19 618 34 932 378 744 850 817 449 818 1 196 194 668 68.34 95.57
Other owners 2 077 1 838 3 915 20 509 703 34 945 087 55 454 790 63.02 4.43
Total of known country of ownership 17 391 21 456 38 847 399 254 553 852 394 905 1 251 649 458 68.10 100.00
Others, unknown country of ownership 6 815 126 581 435
World total 45 662 1 378 230 893
Table 2.5. The 35 countries and territories with the largest owned fleets (dwt), as at 1 January 2011a (concluded)
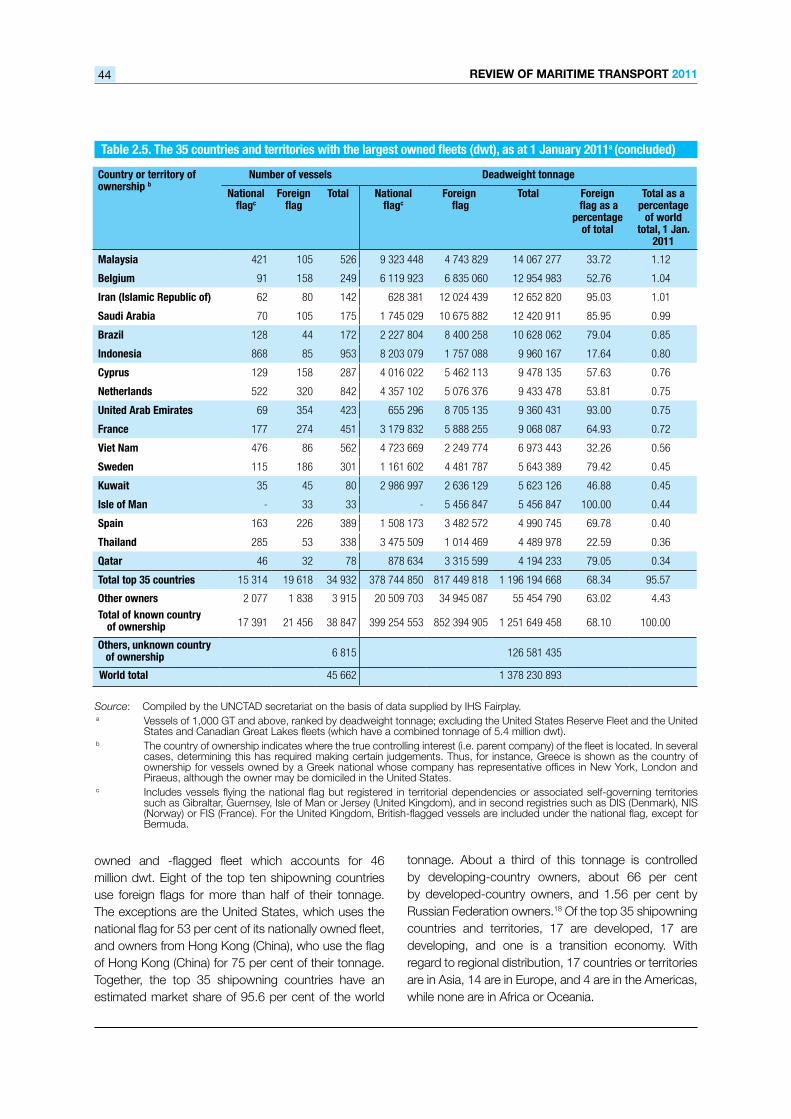
owned and -flagged fleet which accounts for 46 million dwt. Eight of the top ten shipowning countries use foreign flags for more than half of their tonnage. The exceptions are the United States, which uses the national flag for 53 per cent of its nationally owned fleet, and owners from Hong Kong (China), who use the flag of Hong Kong (China) for 75 per cent of their tonnage.Together, the top 35 shipowning countries have an estimated market share of 95.6 per cent of the world
tonnage. About a third of this tonnage is controlled by developing-country owners, about 66 per cent by developed-country owners, and 1.56 per cent by Russian Federation owners.18 Of the top 35 shipowning countries and territories, 17 are developed, 17 are developing, and one is a transition economy. With regard to regional distribution, 17 countries or territories are in Asia, 14 are in Europe, and 4 are in the Americas, while none are in Africa or Oceania.
CHapteR 2: stRUCtURe, owneRsHip anD ReGistRation of tHe woRLD fLeet 45
Ranking Operator Country/territory Number of
vessels
Average vessel size
TEU Share of world
total, TEU
Cumulated share, TEU
Percentage of growth in TEU over
2010
1 Maersk Line Denmark 414 4 398 1 820 816 11.2% 11.2% 4.2%
2 MSC Switzerland 422 4 176 1 762 169 10.8% 22.0% 16.9%
3 CMA CGM Group France 288 3 715 1 069 847 6.6% 28.6% 13.2%
4 Evergreen Line China, Taiwan Province of 162 3 666 593 829 3.7% 32.3% 0.2%
5 APL Singapore 141 4 197 591 736 3.6% 35.9% 12.8%
6 COSCON China 147 3 848 565 728 3.5% 39.4% 14.1%
7 Hapag-Lloyd Group Germany 126 4 446 560 197 3.4% 42.8% 19.1%
8 CSCL China 120 3 841 460 906 2.8% 45.7% 0.8%
9 Hanjin Republic of Korea 98 4 565 447 332 2.8% 48.4% 11.8%
10 CSAV Chile 119 3 217 382 786 2.4% 50.8% 95.4%
11 OOCL China, Hong Kong SAR 85 4 408 374 714 2.3% 53.1% 29.1%
12 MOL Japan 91 3 989 362 998 2.2% 55.3% 4.2%
13 NYK Japan 85 4 152 352 915 2.2% 57.5% -1.9%
14 K Line Japan 84 4 143 347 989 2.1% 59.6% 7.0%
15 Hamburg Sud Germany 98 3 423 335 449 2.1% 61.7% 18.2%
16 Yang Ming China, Taiwan Province of 78 4 137 322 723 2.0% 63.7% 1.7%
17 HMM Republic of Korea 60 4 753 285 183 1.8% 65.4% 9.7%
18 Zim Israel 73 3 857 281 532 1.7% 67.2% 30.5%
19 PIL Singapore 111 2 146 238 241 1.5% 68.6% 36.9%
20 UASC Kuwait 47 3 800 178 599 1.1% 69.7% 1.1%
Total top 20 carriers 2 849 3 979 11 335 689 69.7% 69.7% 12.4%
Others 6 839 719 4 918 299 30.3% 30.3% 1.1%
World containership fleet 9 688 1 678 16 253 988 100.0% 100.0% 8.7%
Table 2.6 . The 20 leading service operators of container ships, 1 January 2011 (number of ships and total shipboard capacity deployed (TEUs))
Source: UNCTAD secretariat, based on Containerisation International Online, Fleet Statistics. Available at www.ci-online.co.uk.
Note: Includes all container-carrying ships. Not fully comparable to tables 2.2. and 2.3 above, which only cover the specialized fully cellular container ships.
As regards flags of registration, 68.3 per cent of the world’s tonnage is foreign-flagged. One of the motivations for shipowners to use a foreign flag is the possibility of employing foreign seafarers. This is of particular interest to companies based in countries with high wage levels – which is more likely to be the case in developed than in developing countries. It is, hence, not surprising that the percentage of foreign registration is higher for developed countries (where approximately 74 per cent of the nationally owned tonnage is foreign-flagged) than it is for developing countries (where about 65 per cent is foreign-flagged) (see also chapter 6 for a more detailed discussion on the participation of developing countries in different shipping businesses). The tonnage of owners from the Russian Federation grew by
23 per cent between 2005 and 2010. The Russian Federation increasingly uses foreign flags, and as a result, the nationally flagged Russian fleet effectively decreased by 20 per cent over the same period.19
2. containershippingoperators
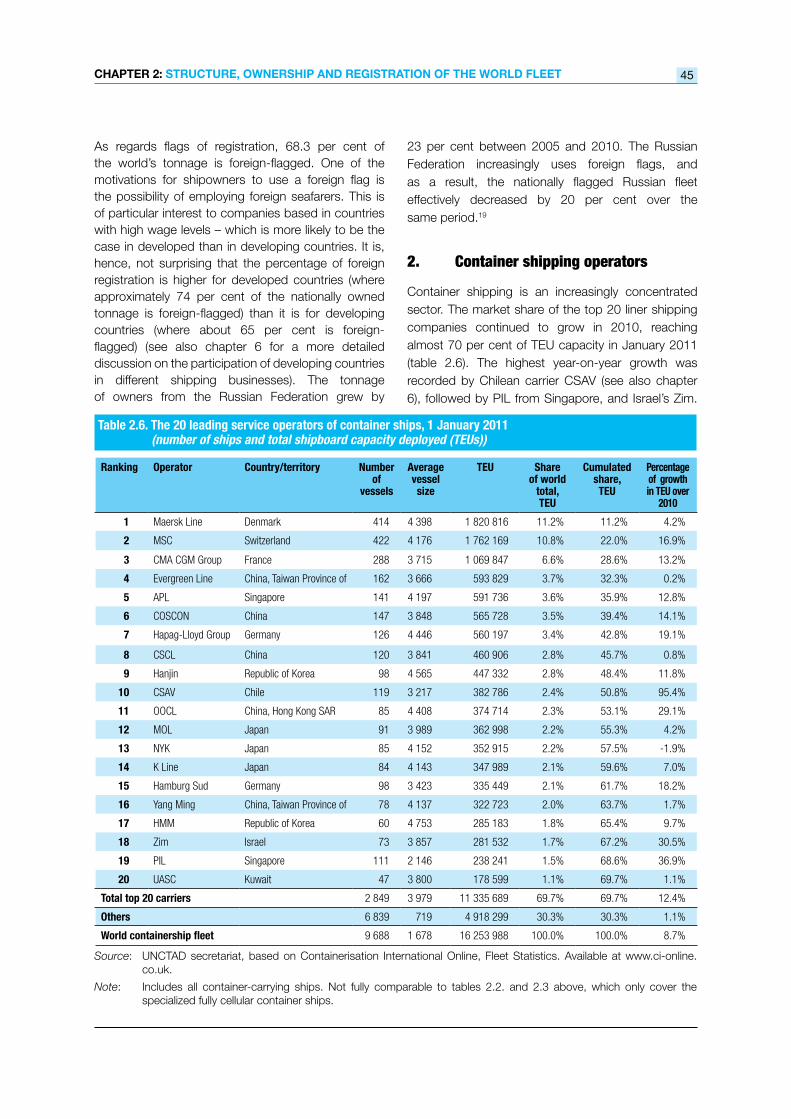
Container shipping is an increasingly concentrated sector. The market share of the top 20 liner shipping companies continued to grow in 2010, reaching almost 70 per cent of TEU capacity in January 2011 (table 2.6). The highest year-on-year growth was recorded by Chilean carrier CSAV (see also chapter 6), followed by PIL from Singapore, and Israel’s Zim.
Review of MaRitiMe tRanspoRt 201146
Maersk Line from Denmark continues to occupy the top position, although the second and third carriers, MSC and CMA CGM, grew three to four times faster during the year, narrowing the gap. In terms of vessel numbers, the Geneva-based carrier MSC was effectively ahead of Maersk.
The top 20 liner companies have remained unchanged, for a second consecutive year since 2009. Asian economies dominate the list, with 14 companies from that region. One of the top 20 carriers is from Latin America, five are from Europe, and none are from Oceania or North America.
c. reGIstrAtIoNofshIPs
1. flagsofregistration
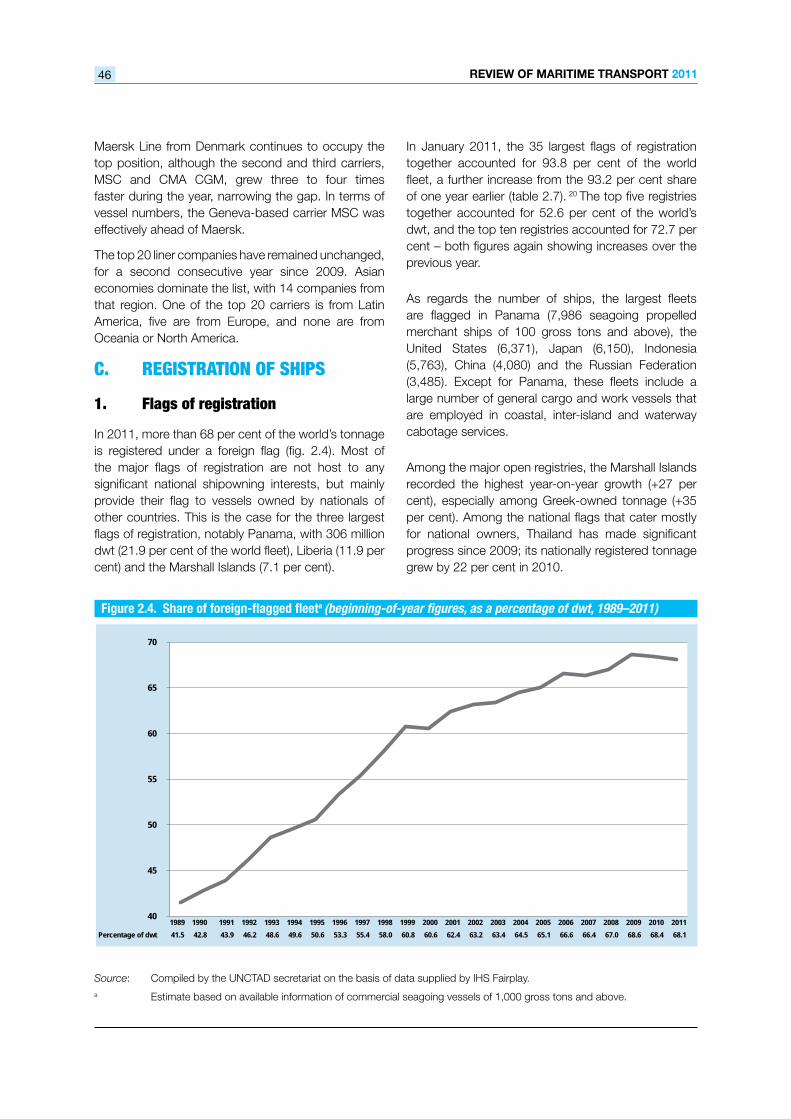
In 2011, more than 68 per cent of the world’s tonnage is registered under a foreign flag (fig. 2.4). Most of the major flags of registration are not host to any significant national shipowning interests, but mainly provide their flag to vessels owned by nationals of other countries. This is the case for the three largest flags of registration, notably Panama, with 306 million dwt (21.9 per cent of the world fleet), Liberia (11.9 per cent) and the Marshall Islands (7.1 per cent).
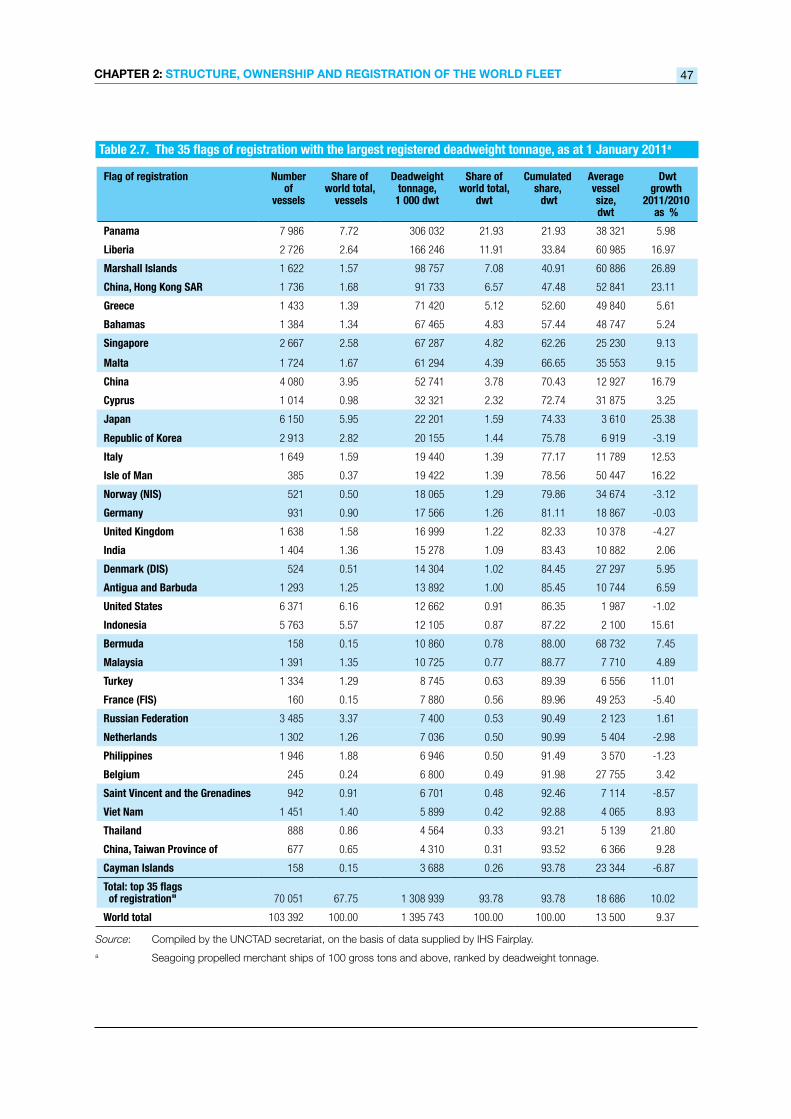
In January 2011, the 35 largest flags of registration together accounted for 93.8 per cent of the world fleet, a further increase from the 93.2 per cent share of one year earlier (table 2.7). 20 The top five registries together accounted for 52.6 per cent of the world’s dwt, and the top ten registries accounted for 72.7 per cent – both figures again showing increases over the previous year.
As regards the number of ships, the largest fleets are flagged in Panama (7,986 seagoing propelled merchant ships of 100 gross tons and above), the United States (6,371), Japan (6,150), Indonesia (5,763), China (4,080) and the Russian Federation (3,485). Except for Panama, these fleets include a large number of general cargo and work vessels that are employed in coastal, inter-island and waterway cabotage services.
Among the major open registries, the Marshall Islands recorded the highest year-on-year growth (+27 per cent), especially among Greek-owned tonnage (+35 per cent). Among the national flags that cater mostly for national owners, Thailand has made significant progress since 2009; its nationally registered tonnage grew by 22 per cent in 2010.
Figure 2.4. Share of foreign-flagged fleeta (beginning-of-year figures, as a percentage of dwt, 1989–2011)
Source: Compiled by the UNCTAD secretariat on the basis of data supplied by IHS Fairplay.a Estimate based on available information of commercial seagoing vessels of 1,000 gross tons and above.
40
45
50
55
60
65
70
Percentage of dwt 41.5 42.8 43.9 46.2 48.6 49.6 50.6 53.3 55.4 58.0 60.8 60.6 62.4 63.2 63.4 64.5 65.1 66.6 66.4 67.0 68.6 68.4 68.1
1989 1990 1991 1992 1993 1994 1995 1996 1997 1998 1999 2000 2001 2002 2003 2004 2005 2006 2007 2008 2009 2010 2011
CHapteR 2: stRUCtURe, owneRsHip anD ReGistRation of tHe woRLD fLeet 47
Table 2.7. The 35 flags of registration with the largest registered deadweight tonnage, as at 1 January 2011a
Flag of registration Number of
vessels
Share of world total,
vessels
Deadweight tonnage, 1 000 dwt
Share of world total,
dwt
Cumulated share, dwt
Average vessel size, dwt
Dwt growth
2011/2010 as %
Panama 7 986 7.72 306 032 21.93 21.93 38 321 5.98
Liberia 2 726 2.64 166 246 11.91 33.84 60 985 16.97
Marshall Islands 1 622 1.57 98 757 7.08 40.91 60 886 26.89
China, Hong Kong SAR 1 736 1.68 91 733 6.57 47.48 52 841 23.11
Greece 1 433 1.39 71 420 5.12 52.60 49 840 5.61
Bahamas 1 384 1.34 67 465 4.83 57.44 48 747 5.24
Singapore 2 667 2.58 67 287 4.82 62.26 25 230 9.13
Malta 1 724 1.67 61 294 4.39 66.65 35 553 9.15
China 4 080 3.95 52 741 3.78 70.43 12 927 16.79
Cyprus 1 014 0.98 32 321 2.32 72.74 31 875 3.25
Japan 6 150 5.95 22 201 1.59 74.33 3 610 25.38
Republic of Korea 2 913 2.82 20 155 1.44 75.78 6 919 -3.19
Italy 1 649 1.59 19 440 1.39 77.17 11 789 12.53
Isle of Man 385 0.37 19 422 1.39 78.56 50 447 16.22
Norway (NIS) 521 0.50 18 065 1.29 79.86 34 674 -3.12
Germany 931 0.90 17 566 1.26 81.11 18 867 -0.03
United Kingdom 1 638 1.58 16 999 1.22 82.33 10 378 -4.27
India 1 404 1.36 15 278 1.09 83.43 10 882 2.06
Denmark (DIS) 524 0.51 14 304 1.02 84.45 27 297 5.95
Antigua and Barbuda 1 293 1.25 13 892 1.00 85.45 10 744 6.59
United States 6 371 6.16 12 662 0.91 86.35 1 987 -1.02
Indonesia 5 763 5.57 12 105 0.87 87.22 2 100 15.61
Bermuda 158 0.15 10 860 0.78 88.00 68 732 7.45
Malaysia 1 391 1.35 10 725 0.77 88.77 7 710 4.89
Turkey 1 334 1.29 8 745 0.63 89.39 6 556 11.01
France (FIS) 160 0.15 7 880 0.56 89.96 49 253 -5.40
Russian Federation 3 485 3.37 7 400 0.53 90.49 2 123 1.61
Netherlands 1 302 1.26 7 036 0.50 90.99 5 404 -2.98
Philippines 1 946 1.88 6 946 0.50 91.49 3 570 -1.23
Belgium 245 0.24 6 800 0.49 91.98 27 755 3.42
Saint Vincent and the Grenadines 942 0.91 6 701 0.48 92.46 7 114 -8.57
Viet Nam 1 451 1.40 5 899 0.42 92.88 4 065 8.93
Thailand 888 0.86 4 564 0.33 93.21 5 139 21.80
China, Taiwan Province of 677 0.65 4 310 0.31 93.52 6 366 9.28
Cayman Islands 158 0.15 3 688 0.26 93.78 23 344 -6.87
Total: top 35 flags of registration" 70 051 67.75 1 308 939 93.78 93.78 18 686 10.02
World total 103 392 100.00 1 395 743 100.00 100.00 13 500 9.37
Source: Compiled by the UNCTAD secretariat, on the basis of data supplied by IHS Fairplay.a Seagoing propelled merchant ships of 100 gross tons and above, ranked by deadweight tonnage.
Review of MaRitiMe tRanspoRt 201148
Table 2.8 . Distribution of dwt capacity of vessel types, by country group of registration, 2011a (percentage change 2011/2010 in italics)
Total fleet
Oil tankers
Bulk carriers
General cargo
Container ships
Other types
World total 100.00 100.00 100.00 100.00 100.00 100.00
Developed countries 16.96 19.42 10.95 17.68 23.98 23.81
-0.94 -0.81 -0.05 -0.16 -2.36 -1.36
Countries with economies
in transition 0.93 0.81 0.41 4.53 0.09 1.96
-0.07 -0.03 -0.03 -0.02 -0.01 -0.10
Developing countries 25.50 23.50 27.17 35.04 20.61 24.67
0.27 0.27 0.17 -0.53 0.80 0.62
of which:
Africa 0.68 0.72 0.35 2.09 0.11 1.78
0.00 -0.01 0.05 0.21 -0.01 -0.13
America 1.64 1.83 1.06 4.18 0.37 3.49
-0.11 -0.04 -0.18 -0.04 0.10 -0.08
Asia 22.80 20.78 25.30 27.97 20.11 18.26
0.44 0.46 0.39 -0.71 0.71 0.61
Oceania 0.38 0.18 0.45 0.80 0.02 1.14
-0.06 -0.14 -0.09 0.02 0.00 0.22
Other, unallocated 0.51 0.24 0.30 2.61 0.13 1.33
0.07 0.02 0.03 0.52 0.02 0.34
10 major open and
international registriesb 56.10 56.03 61.17 40.14 55.18 48.24
0.66 0.55 -0.12 0.19 1.55 0.50
Source: Compiled by the UNCTAD secretariat on the basis of data supplied by IHS Fairplay.a Seagoing propelled merchant ships of 100 gross tons and above.b No clear definition exists of “open and international registries”. UNCTAD has grouped the 10 major open and
international registries to include the 10 largest fleets with more than 90 per cent foreign-controlled tonnage. See annex III or figure 2.5 for the list of registries.
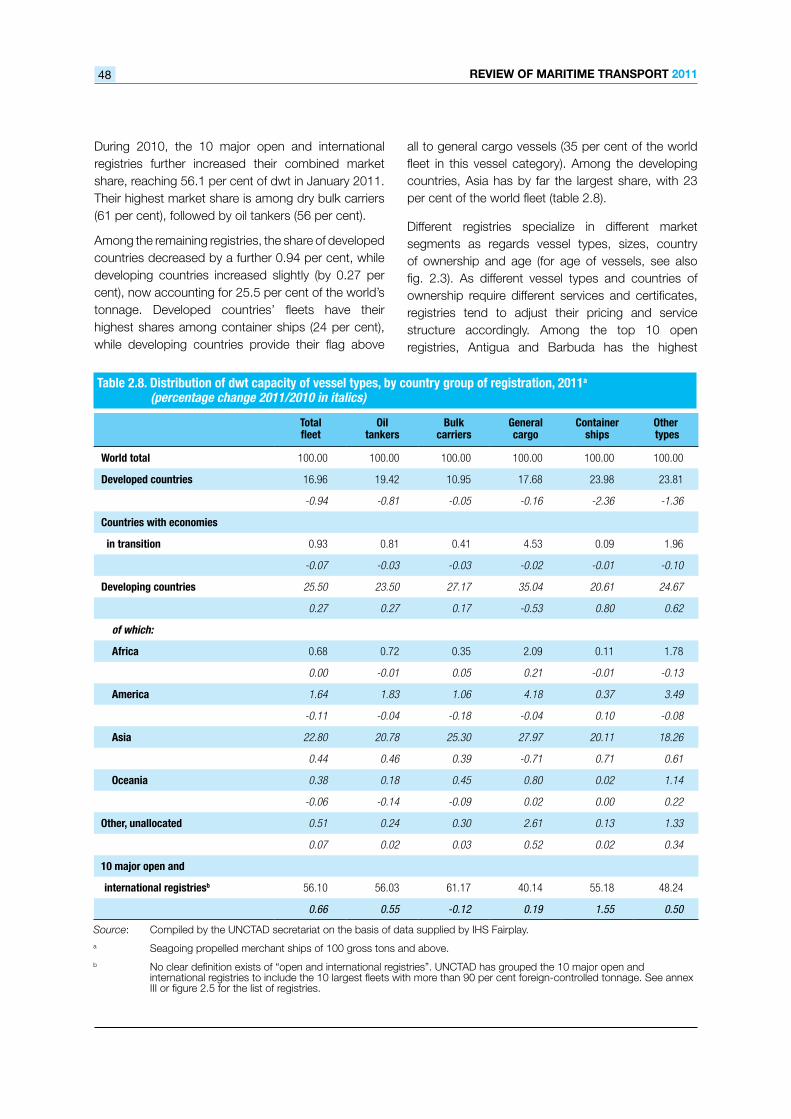
During 2010, the 10 major open and international registries further increased their combined market share, reaching 56.1 per cent of dwt in January 2011. Their highest market share is among dry bulk carriers (61 per cent), followed by oil tankers (56 per cent).
Among the remaining registries, the share of developed countries decreased by a further 0.94 per cent, while developing countries increased slightly (by 0.27 per cent), now accounting for 25.5 per cent of the world’s tonnage. Developed countries’ fleets have their highest shares among container ships (24 per cent), while developing countries provide their flag above
all to general cargo vessels (35 per cent of the world fleet in this vessel category). Among the developing countries, Asia has by far the largest share, with 23 per cent of the world fleet (table 2.8).
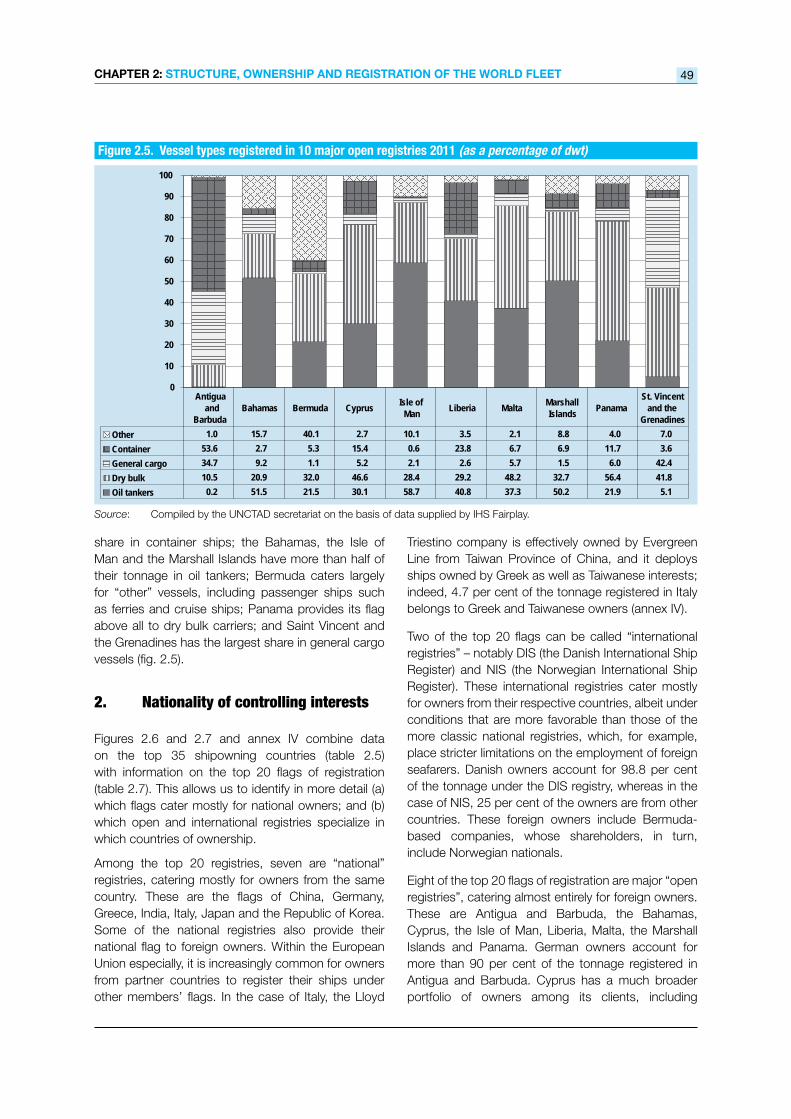
Different registries specialize in different market segments as regards vessel types, sizes, country of ownership and age (for age of vessels, see also fig. 2.3). As different vessel types and countries of ownership require different services and certificates, registries tend to adjust their pricing and service structure accordingly. Among the top 10 open registries, Antigua and Barbuda has the highest
CHapteR 2: stRUCtURe, owneRsHip anD ReGistRation of tHe woRLD fLeet 49
Figure 2.5. Vessel types registered in 10 major open registries 2011 (as a percentage of dwt)
Source: Compiled by the UNCTAD secretariat on the basis of data supplied by IHS Fairplay.
0
10
20
30
40
50
60
70
80
90
100
Other 1.0 15.7 40.1 2.7 10.1 3.5 2.1 8.8 4.0 7.0Container 53.6 2.7 5.3 15.4 0.6 23.8 6.7 6.9 11.7 3.6General cargo 34.7 9.2 1.1 5.2 2.1 2.6 5.7 1.5 6.0 42.4Dry bulk 10.5 20.9 32.0 46.6 28.4 29.2 48.2 32.7 56.4 41.8Oil tankers 0.2 51.5 21.5 30.1 58.7 40.8 37.3 50.2 21.9 5.1
Antigua and
BarbudaBahamas Bermuda Cyprus Isle of
Man Liberia Malta Marshall Islands Panama
St. Vincent and the
Grenadines
share in container ships; the Bahamas, the Isle of Man and the Marshall Islands have more than half of their tonnage in oil tankers; Bermuda caters largely for “other” vessels, including passenger ships such as ferries and cruise ships; Panama provides its flag above all to dry bulk carriers; and Saint Vincent and the Grenadines has the largest share in general cargo vessels (fig. 2.5).
2. Nationalityofcontrollinginterests
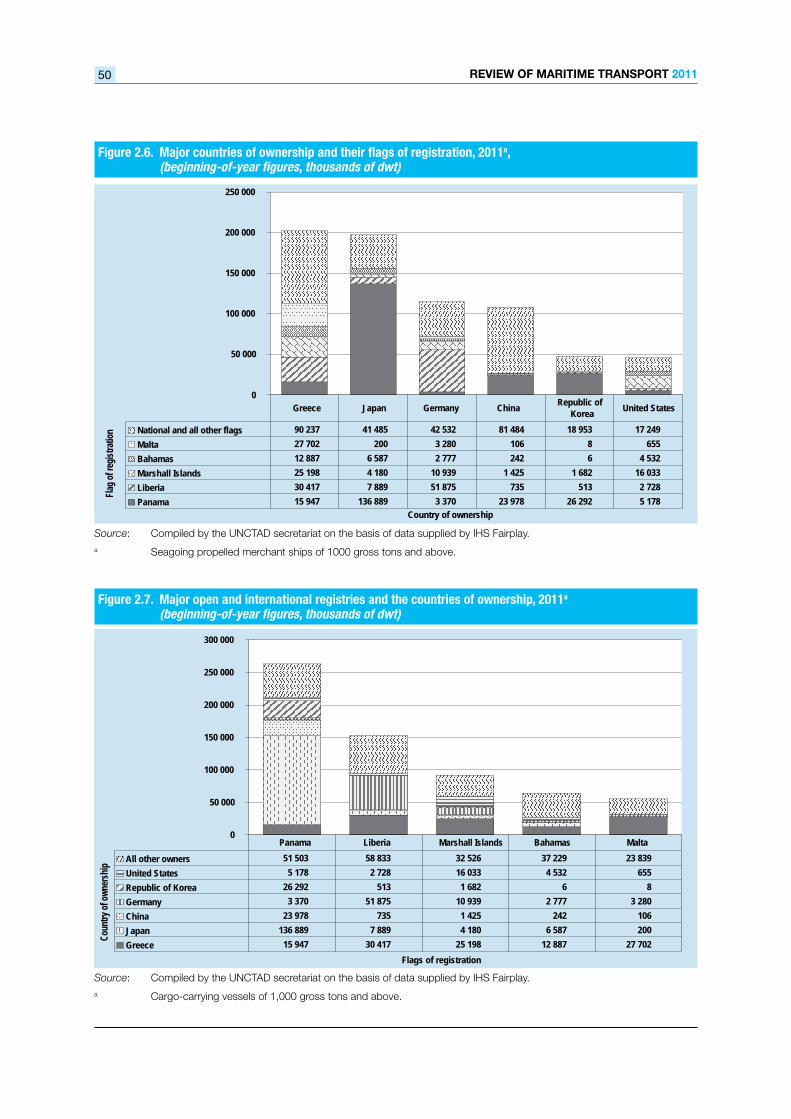
Figures 2.6 and 2.7 and annex IV combine data on the top 35 shipowning countries (table 2.5) with information on the top 20 flags of registration (table 2.7). This allows us to identify in more detail (a) which flags cater mostly for national owners; and (b) which open and international registries specialize in which countries of ownership.
Among the top 20 registries, seven are “national” registries, catering mostly for owners from the same country. These are the flags of China, Germany, Greece, India, Italy, Japan and the Republic of Korea. Some of the national registries also provide their national flag to foreign owners. Within the European Union especially, it is increasingly common for owners from partner countries to register their ships under other members’ flags. In the case of Italy, the Lloyd
Triestino company is effectively owned by Evergreen Line from Taiwan Province of China, and it deploys ships owned by Greek as well as Taiwanese interests; indeed, 4.7 per cent of the tonnage registered in Italy belongs to Greek and Taiwanese owners (annex IV).
Two of the top 20 flags can be called “international registries” – notably DIS (the Danish International Ship Register) and NIS (the Norwegian International Ship Register). These international registries cater mostly for owners from their respective countries, albeit under conditions that are more favorable than those of the more classic national registries, which, for example, place stricter limitations on the employment of foreign seafarers. Danish owners account for 98.8 per cent of the tonnage under the DIS registry, whereas in the case of NIS, 25 per cent of the owners are from other countries. These foreign owners include Bermuda-based companies, whose shareholders, in turn, include Norwegian nationals.
Eight of the top 20 flags of registration are major “open registries”, catering almost entirely for foreign owners. These are Antigua and Barbuda, the Bahamas, Cyprus, the Isle of Man, Liberia, Malta, the Marshall Islands and Panama. German owners account for more than 90 per cent of the tonnage registered in Antigua and Barbuda. Cyprus has a much broader portfolio of owners among its clients, including
Review of MaRitiMe tRanspoRt 201150
Figure 2.6. Major countries of ownership and their flags of registration, 2011a, (beginning-of-year figures, thousands of dwt)
Source: Compiled by the UNCTAD secretariat on the basis of data supplied by IHS Fairplay.a Seagoing propelled merchant ships of 1000 gross tons and above.
50 000
0
100 000
150 000
200 000
250 000
Country of ownership
Flag
of r
egis
tratio
n National and all other flags 90 237 41 485 42 532 81 484 18 953 17 249
Malta 27 702 200 3 280 106 8 655
Bahamas 12 887 6 587 2 777 242 6 4 532
Marshall Islands 25 198 4 180 10 939 1 425 1 682 16 033
Liberia 30 417 7 889 51 875 735 513 2 728
Panama 15 947 136 889 3 370 23 978 26 292 5 178
Greece Japan Germany ChinaRepublic of
KoreaUnited States
Figure 2.7. Major open and international registries and the countries of ownership, 2011a
(beginning-of-year figures, thousands of dwt)
Source: Compiled by the UNCTAD secretariat on the basis of data supplied by IHS Fairplay.a Cargo-carrying vessels of 1,000 gross tons and above.
0
50 000
100 000
150 000
200 000
250 000
300 000
Flags of registration
Coun
try o
f ow
ners
hip
All other owners 51 503 58 833 32 526 37 229 23 839
United States 5 178 2 728 16 033 4 532 655
Republic of Korea 26 292 513 1 682 6 8
Germany 3 370 51 875 10 939 2 777 3 280
China 23 978 735 1 425 242 106
Japan 136 889 7 889 4 180 6 587 200
Greece 15 947 30 417 25 198 12 887 27 702
Panama Liberia Marshall Islands Bahamas Malta
CHapteR 2: stRUCtURe, owneRsHip anD ReGistRation of tHe woRLD fLeet 51
more than 4 million dwt of tonnage registered by Cypriot nationals. The single largest flag/ownership combination in the world fleet is the 137 million dwt of Japanese-owned tonnage registered in Panama; Japanese owners account for 45 per cent of the fleet of the world’s largest registry.
Some registries have historical or other special relations with the countries where the shipowning companies are domiciled. The Marshall Islands, for example, has an agreement with the United States that the United States Coast Guard also acts as coast guard for the Marshall Islands. Liberia has a double tax agreement with Germany, which makes the registry more attractive for an owner who wants to employ German officers. European registries such as Cyprus, the Isle of Man and Malta benefit from the European common market, which allows European-flagged ships to provide certain cabotage services in EU member countries.
Finally, there are three registries among the top 20 flags that include both national owners and a significant share of owners from other countries or territories. These are Hong Kong (China), Singapore, and the United Kingdom. Owners from China and from Hong Kong (China) together account for about three fifths of the tonnage registered in Hong Kong (China), the remainder belonging mostly to owners from Canada, Japan, Norway and the United States. About 28 per cent of Singapore’s nationally registered fleet belongs to owners from Singapore, with the largest foreign fleets owned by nationals of Denmark and Japan. The flag of the United Kingdom (not including the registries of Gibraltar, Guernsey, the Isle of Man and Jersey) is used mostly by owners from other European countries – especially Denmark, France and Germany.
d. shIPBuIldING,deMolItIoN,ANd outlookoNvesselsuPPly
1. deliveriesofnewbuildings
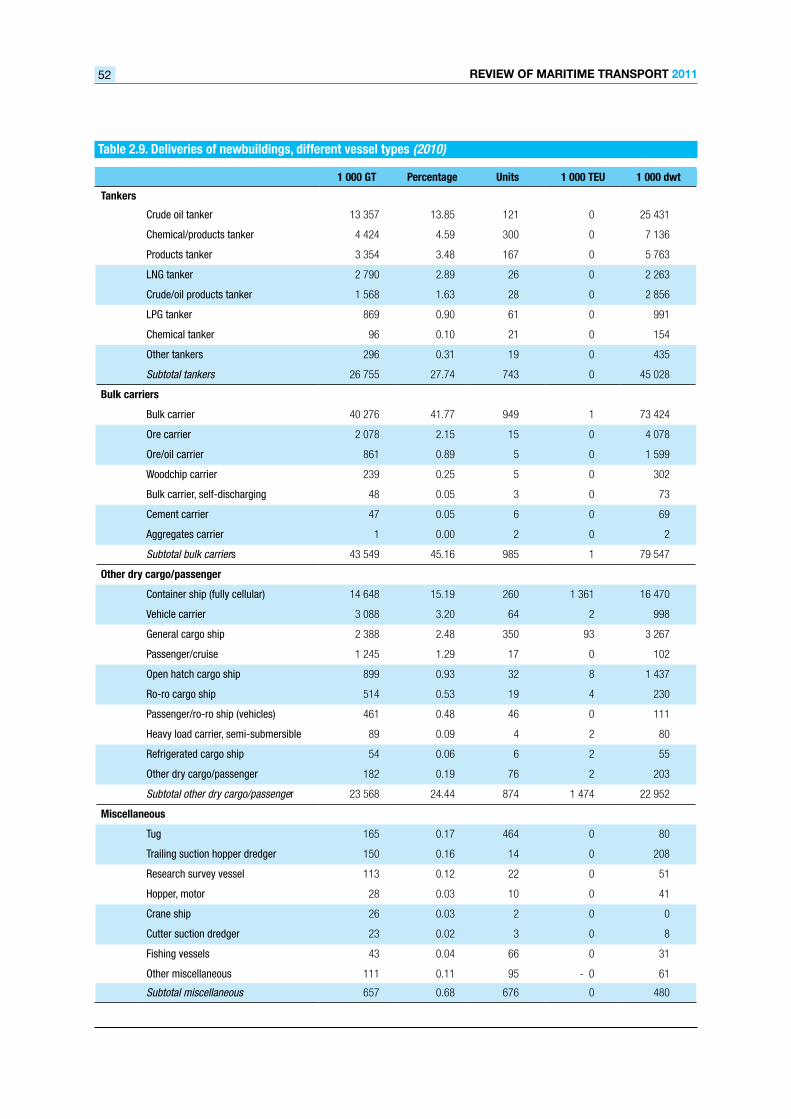
The year 2010 set a new record in the history of shipbuilding, which was the result of vessel orders that had been placed before the 2008 economic crisis. The deliveries recorded amounted to 3,748 ships, with a total gross tonnage of 96,433,000 GT (table 2.9). Although this is a historic record, it is lower than was expected in early 2010, because owners and shipyards continued to defer some
deliveries. In the container sector especially, “non-deliveries” amounted to an estimated 39 per cent of the order book.21
In terms of gross tonnage, 45.2 per cent of the deliveries made in 2010 were of dry bulk carriers, and 27.7 per cent were of tankers. The latter included 467 chemical and products tankers, with a total tonnage of 7.8 million GT. New fully cellular container ships accounted for 15.2 per cent of the gross tonnage delivered in 2010.
Dry bulk carriers have continued to dominate deliveries in 2011, too. During the first quarter of the year, the dry bulk fleet grew by 2.7 per cent, resulting from the delivery of 222 new vessels and the demolition of only 67.22 Containership deliveries in early 2011 included a large number of vessels of 10,000 TEUs and above; monthly deliveries amounted to more than 200,000 TEUs.23
The time lag between ordering a vessel and having it delivered is two to three years. After the peak in the vessel order book in 2008 (see fig. 2.10), 2010 marked a historic peak in vessel deliveries. In terms of deadweight tonnage, deliveries in 2010 amounted to 11.7 per cent of the existing fleet at the beginning of the same year. The previous historic peak was in 1974, when deliveries amounted to approximately 11 per cent of the existing fleet.
The peak in the mid-1970s was followed by a severe slump. Given the lessons from history, and awareness of the upcoming deliveries, it could perhaps be expected that such a slump will not be repeated. In fact, since 2010, the industry has seen resumed vessel ordering in all major markets, although there is no guarantee that this will suffice to cater for the upturn in demand. Already there are warnings that 2013 might see a shortage of oil tankers.24 In the dry bulk and container sectors, however, the voices that are prevailing are those that expect an oversupply of tonnage in the coming years. In both dry sectors, the recent and upcoming record-sized newbuildings pose a further challenge to owners, who will need to find cargo to fill their ships.
For all vessel types, the expansion of yard capacities suggests that shipbuilding countries may build ships beyond the market’s requirements, being more concerned about employment in shipbuilding. In practice, constructing more ships than required amounts to a subsidy on world trade, as this causes a fall in vessel prices, and consequently in freight costs too (see also chapter 3).
Review of MaRitiMe tRanspoRt 201152
1 000 GT Percentage Units 1 000 TEU 1 000 dwt
Tankers
Crude oil tanker 13 357 13.85 121 0 25 431
Chemical/products tanker 4 424 4.59 300 0 7 136
Products tanker 3 354 3.48 167 0 5 763
LNG tanker 2 790 2.89 26 0 2 263
Crude/oil products tanker 1 568 1.63 28 0 2 856
LPG tanker 869 0.90 61 0 991
Chemical tanker 96 0.10 21 0 154
Other tankers 296 0.31 19 0 435
Subtotal tankers 26 755 27.74 743 0 45 028
Bulk carriers
Bulk carrier 40 276 41.77 949 1 73 424
Ore carrier 2 078 2.15 15 0 4 078
Ore/oil carrier 861 0.89 5 0 1 599
Woodchip carrier 239 0.25 5 0 302
Bulk carrier, self-discharging 48 0.05 3 0 73
Cement carrier 47 0.05 6 0 69
Aggregates carrier 1 0.00 2 0 2
Subtotal bulk carriers 43 549 45.16 985 1 79 547
Other dry cargo/passenger
Container ship (fully cellular) 14 648 15.19 260 1 361 16 470
Vehicle carrier 3 088 3.20 64 2 998
General cargo ship 2 388 2.48 350 93 3 267
Passenger/cruise 1 245 1.29 17 0 102
Open hatch cargo ship 899 0.93 32 8 1 437
Ro-ro cargo ship 514 0.53 19 4 230
Passenger/ro-ro ship (vehicles) 461 0.48 46 0 111
Heavy load carrier, semi-submersible 89 0.09 4 2 80
Refrigerated cargo ship 54 0.06 6 2 55
Other dry cargo/passenger 182 0.19 76 2 203
Subtotal other dry cargo/passenger 23 568 24.44 874 1 474 22 952
Miscellaneous
Tug 165 0.17 464 0 80
Trailing suction hopper dredger 150 0.16 14 0 208
Research survey vessel 113 0.12 22 0 51
Hopper, motor 28 0.03 10 0 41
Crane ship 26 0.03 2 0 0
Cutter suction dredger 23 0.02 3 0 8
Fishing vessels 43 0.04 66 0 31
Other miscellaneous 111 0.11 95 - 0 61
Subtotal miscellaneous 657 0.68 676 0 480
Table 2.9 . Deliveries of newbuildings, different vessel types (2010)

CHapteR 2: stRUCtURe, owneRsHip anD ReGistRation of tHe woRLD fLeet 53
Table 2.9 . Deliveries of newbuildings, different vessel types (2010) (concluded)
1 000 GT Percentage Units 1 000 TEU 1 000 dwt
Offshore
Drilling ship 612 0.64 11 0 596
Anchor handling tug supply 538 0.56 235 0 441
Platform supply ship 223 0.23 92 0 265
Offshore support vessel 129 0.13 18 0 88
Pipe layer crane vessel 90 0.09 4 0 38
Offshore tug/supply ship 79 0.08 43 0 74
Diving support vessel 67 0.07 10 0 42
Crew/supply vessel 14 0.01 47 0 8
Other offshore 151 0.16 10 0 186
Subtotal offshore 1 904 1.97 470 0 1 739
Total deliveries in 2010 96 433 100.00 3 748 1 475 149 746
Source: Compiled by the UNCTAD secretariat on the basis of data from IHS Fairplay.
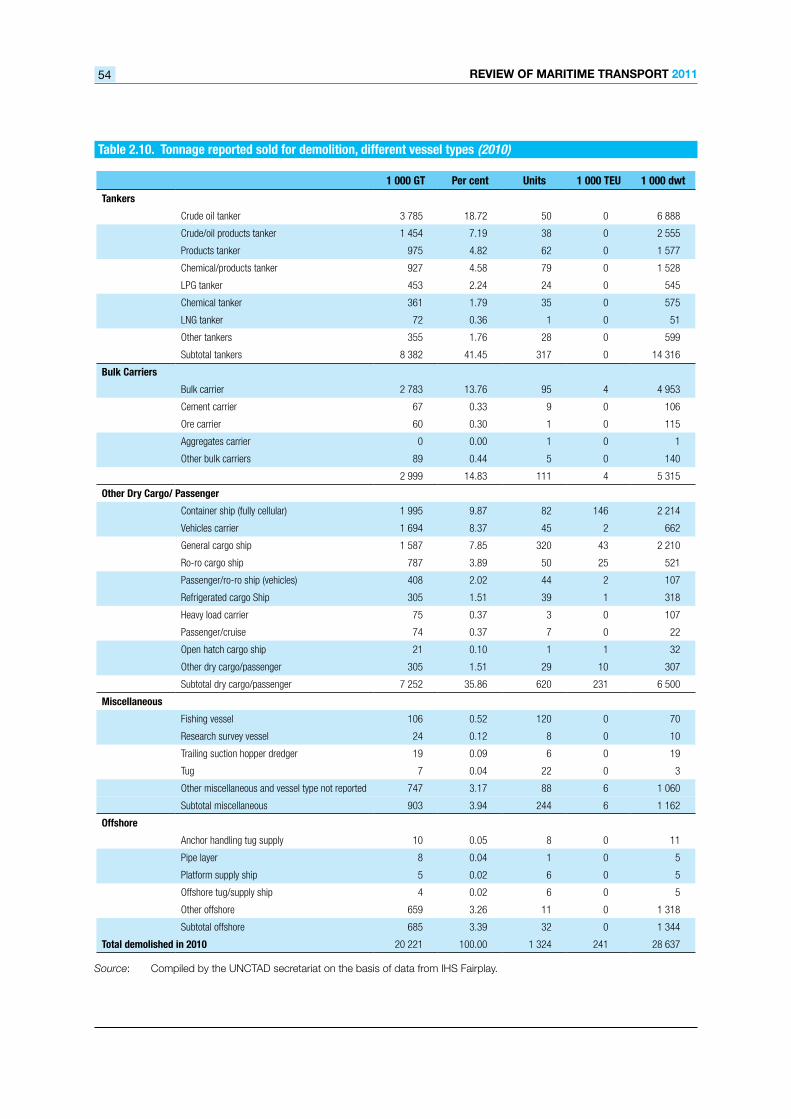
2. demolitionofships
Total ship-recycling activity in 2010 was similar to that in 2009, albeit with a change of vessel types. Demolitions of tankers more than doubled, whereas demolitions of container ships decreased by more than half. Tankers accounted for 41.5 per cent of the gross tonnage demolished in 2010, followed by container and other dry cargo and passenger ships (36 per cent) and dry bulk carriers (15 per cent) (table 2.10).
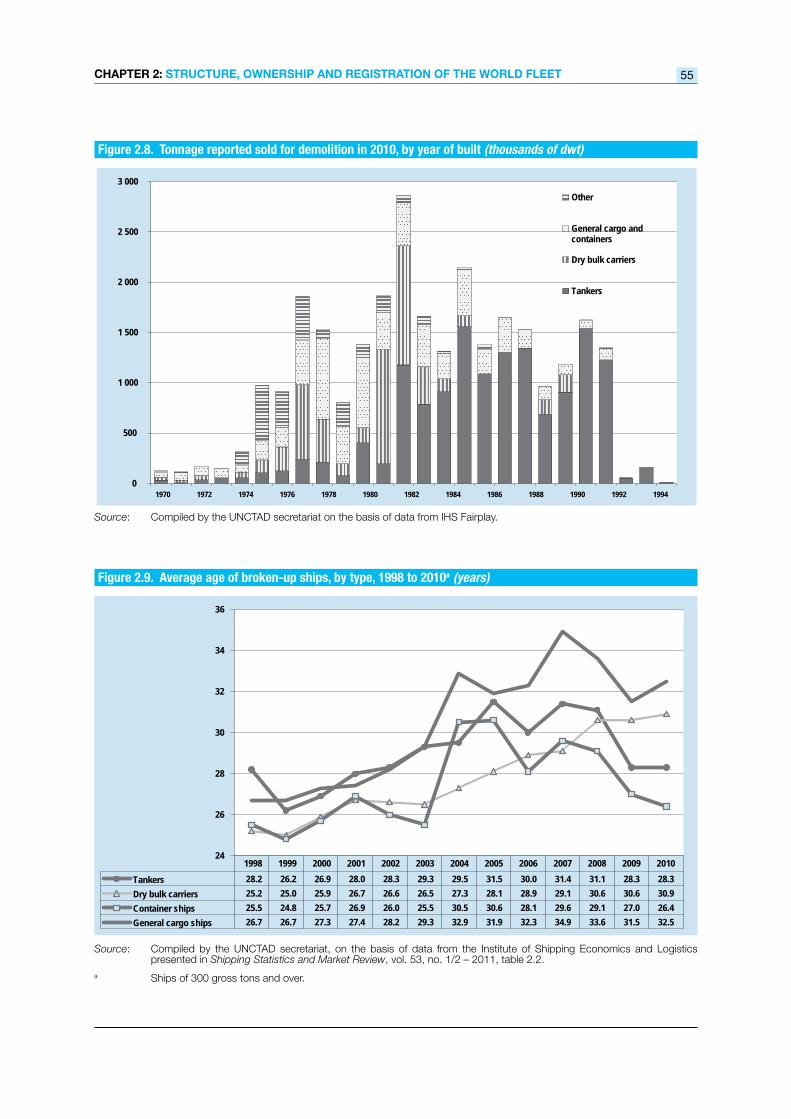
Figure 2.8 illustrates the age profile of the fleet demolished in 2010. Above all, the fleet demolished consisted of oil tankers built in the 1980s and early 1990s, dry bulk vessels built in the early 1980s, and general cargo ships built in the 1970s and 1980s. The trend in the average age of demolished tonnage by vessel type is illustrated in figure 2.9. While the average age went down between 2007 and 2009 during the economic crisis, in 2010 it remained mostly stable. The age differences between vessel types when demolished broadly reflect the age differences of the existing fleet (see also table 2.4).
If we compare cargo-carrying capacity in terms of the number of deadweight tons delivered and demolished, there were 15 times more deliveries of dry bulk tonnage than demolitions. For the remainder of the fleet, the ratio was only 3:1.
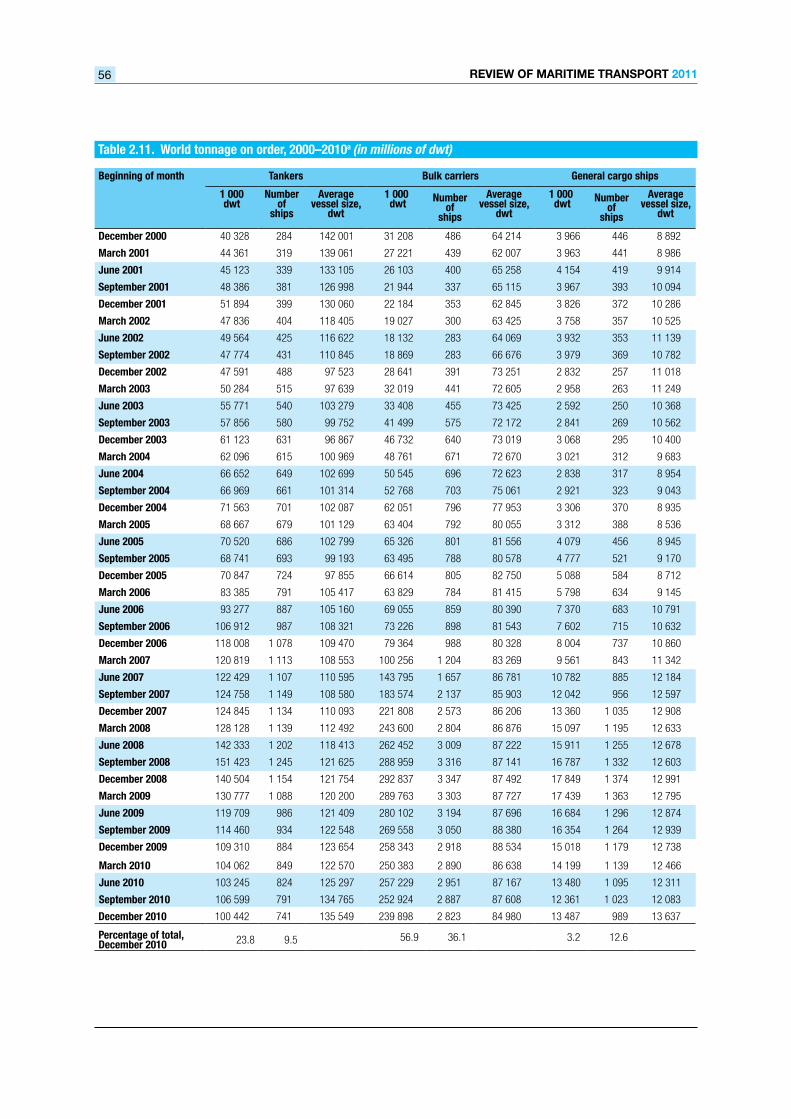
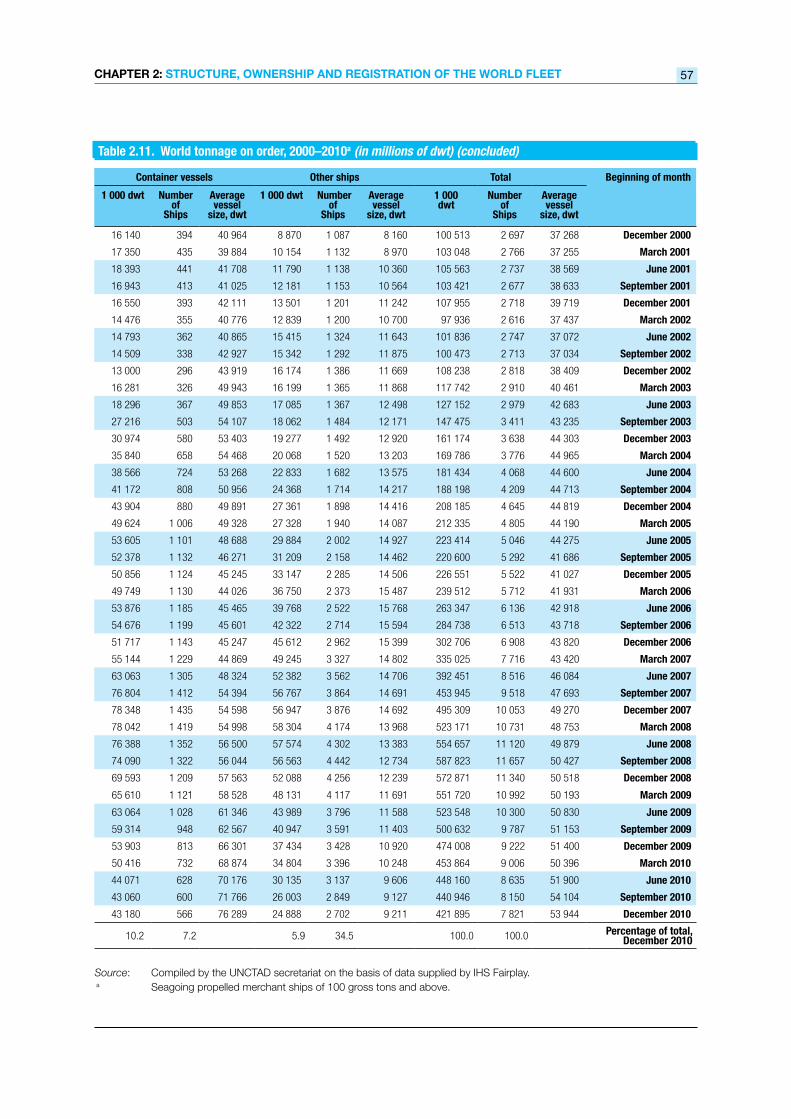
3. tonnageonorder
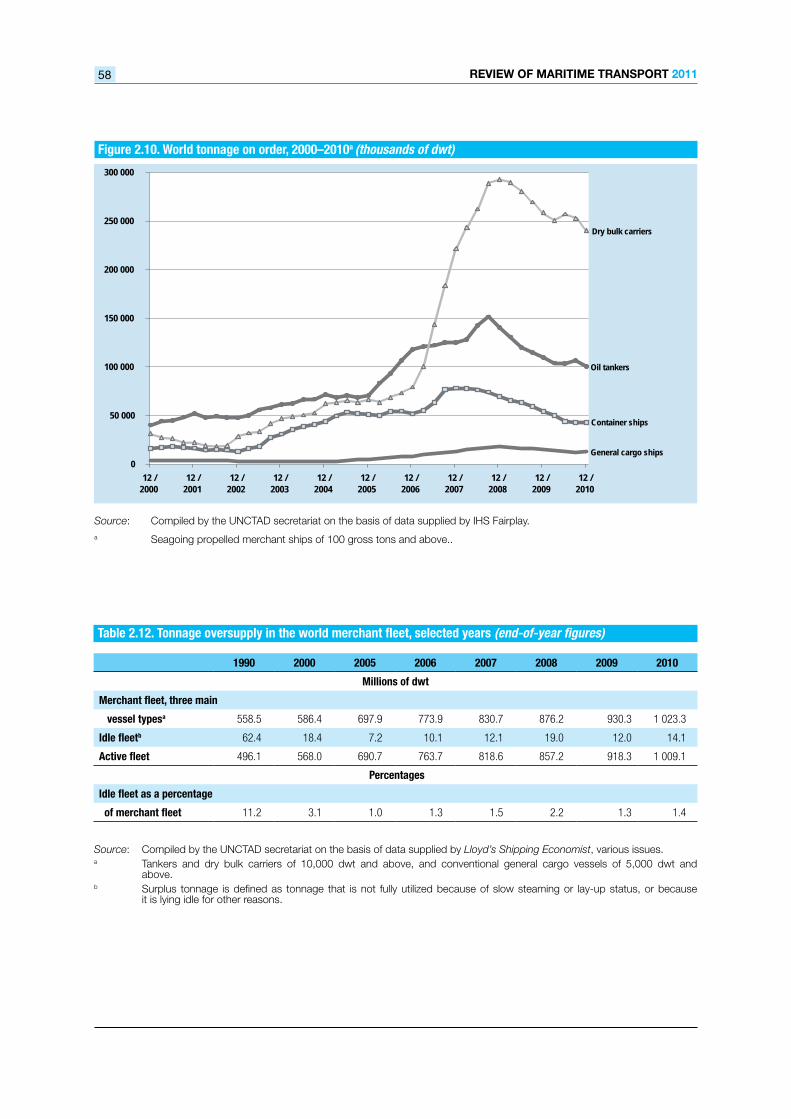
By the end of 2010, the world order book for new ships had been reduced by about 28 per cent since its peak before the 2008 economic crisis, and newbuildings now by far outnumber new vessel orders. Compared to the peak time, the reduction amounted to 45 per cent for container ships, 34 per cent for tankers, and 18 per cent for dry bulk carriers (table 2.11 and fig. 2.10).
As demand has picked up, new orders have resumed. The orders placed with Japanese shipyards as at January 2011 had more than tripled compared to one year earlier.25 End-of-2010 data for China suggest that new orders in Chinese shipyards increased fourfold in the space of one year.26 Many of the new orders are for container ships, with the value of the vessels ordered during the first three months of 2011 reportedly amounting to $7 billion – compared to orders worth $2.8 billion for dry bulk ships and just $0.5 billion for tankers.27
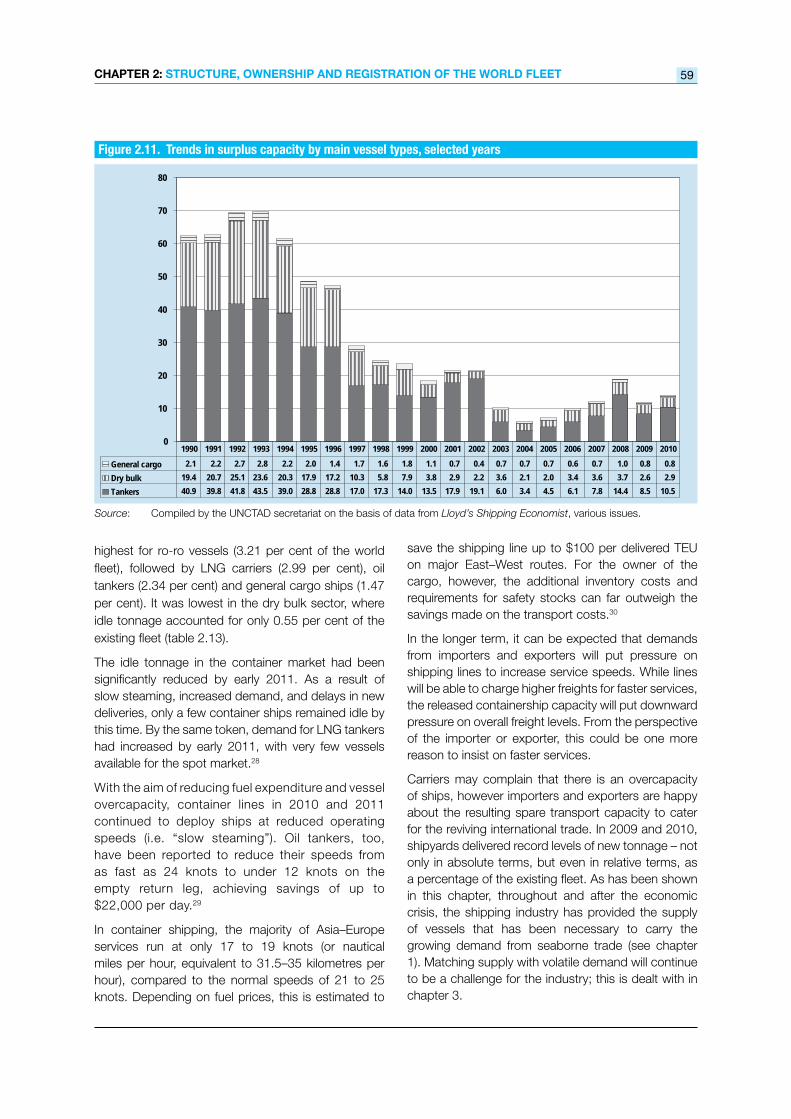
4. surplustonnage
The combined idle tonnage of large tankers, dry bulk carriers and conventional general cargo ships at the end of 2010 stood at 14.1 million dwt, equivalent to 1.4 per cent of the world merchant fleet of these vessel types (table 2.12 and fig. 2.11). The overtonnage was
Review of MaRitiMe tRanspoRt 201154
Table 2.10 . Tonnage reported sold for demolition, different vessel types (2010)
1 000 GT Per cent Units 1 000 TEU 1 000 dwt
Tankers
Crude oil tanker 3 785 18.72 50 0 6 888
Crude/oil products tanker 1 454 7.19 38 0 2 555
Products tanker 975 4.82 62 0 1 577
Chemical/products tanker 927 4.58 79 0 1 528
LPG tanker 453 2.24 24 0 545
Chemical tanker 361 1.79 35 0 575
LNG tanker 72 0.36 1 0 51
Other tankers 355 1.76 28 0 599
Subtotal tankers 8 382 41.45 317 0 14 316
Bulk Carriers
Bulk carrier 2 783 13.76 95 4 4 953
Cement carrier 67 0.33 9 0 106
Ore carrier 60 0.30 1 0 115
Aggregates carrier 0 0.00 1 0 1
Other bulk carriers 89 0.44 5 0 140
2 999 14.83 111 4 5 315
Other Dry Cargo/ Passenger
Container ship (fully cellular) 1 995 9.87 82 146 2 214
Vehicles carrier 1 694 8.37 45 2 662
General cargo ship 1 587 7.85 320 43 2 210
Ro-ro cargo ship 787 3.89 50 25 521
Passenger/ro-ro ship (vehicles) 408 2.02 44 2 107
Refrigerated cargo Ship 305 1.51 39 1 318
Heavy load carrier 75 0.37 3 0 107
Passenger/cruise 74 0.37 7 0 22
Open hatch cargo ship 21 0.10 1 1 32
Other dry cargo/passenger 305 1.51 29 10 307
Subtotal dry cargo/passenger 7 252 35.86 620 231 6 500
Miscellaneous
Fishing vessel 106 0.52 120 0 70
Research survey vessel 24 0.12 8 0 10
Trailing suction hopper dredger 19 0.09 6 0 19
Tug 7 0.04 22 0 3
Other miscellaneous and vessel type not reported 747 3.17 88 6 1 060
Subtotal miscellaneous 903 3.94 244 6 1 162
Offshore
Anchor handling tug supply 10 0.05 8 0 11
Pipe layer 8 0.04 1 0 5
Platform supply ship 5 0.02 6 0 5
Offshore tug/supply ship 4 0.02 6 0 5
Other offshore 659 3.26 11 0 1 318
Subtotal offshore 685 3.39 32 0 1 344
Total demolished in 2010 20 221 100.00 1 324 241 28 637
Source: Compiled by the UNCTAD secretariat on the basis of data from IHS Fairplay.
CHapteR 2: stRUCtURe, owneRsHip anD ReGistRation of tHe woRLD fLeet 55
Figure 2.9. Average age of broken-up ships, by type, 1998 to 2010a (years)
Source: Compiled by the UNCTAD secretariat, on the basis of data from the Institute of Shipping Economics and Logistics presented in Shipping Statistics and Market Review, vol. 53, no. 1/2 – 2011, table 2.2.
a Ships of 300 gross tons and over.
24
26
28
30
32
34
36
Tankers 28.2 26.2 26.9 28.0 28.3 29.3 29.5 31.5 30.0 31.4 31.1 28.3 28.3Dry bulk carriers 25.2 25.0 25.9 26.7 26.6 26.5 27.3 28.1 28.9 29.1 30.6 30.6 30.9Container ships 25.5 24.8 25.7 26.9 26.0 25.5 30.5 30.6 28.1 29.6 29.1 27.0 26.4General cargo ships 26.7 26.7 27.3 27.4 28.2 29.3 32.9 31.9 32.3 34.9 33.6 31.5 32.5
1998 1999 2000 2001 2002 2003 2004 2005 2006 2007 2008 2009 2010
Figure 2.8. Tonnage reported sold for demolition in 2010, by year of built (thousands of dwt)
Source: Compiled by the UNCTAD secretariat on the basis of data from IHS Fairplay.
500
0
1 000
1 500
2 000
2 500
3 000
1970 1972 1974 1976 1978 1980 1982 1984 1986 1988 1990 1992 1994
Other
General cargo andcontainers
Dry bulk carriers
Tankers
Review of MaRitiMe tRanspoRt 201156
Beginning of month Tankers Bulk carriers General cargo ships
1 000 dwt
Number of
ships
Average vessel size,
dwt
1 000 dwt Number
of ships
Average vessel size,
dwt
1 000 dwt Number
of ships
Average vessel size,
dwt
December 2000 40 328 284 142 001 31 208 486 64 214 3 966 446 8 892
March 2001 44 361 319 139 061 27 221 439 62 007 3 963 441 8 986
June 2001 45 123 339 133 105 26 103 400 65 258 4 154 419 9 914
September 2001 48 386 381 126 998 21 944 337 65 115 3 967 393 10 094
December 2001 51 894 399 130 060 22 184 353 62 845 3 826 372 10 286
March 2002 47 836 404 118 405 19 027 300 63 425 3 758 357 10 525
June 2002 49 564 425 116 622 18 132 283 64 069 3 932 353 11 139
September 2002 47 774 431 110 845 18 869 283 66 676 3 979 369 10 782
December 2002 47 591 488 97 523 28 641 391 73 251 2 832 257 11 018
March 2003 50 284 515 97 639 32 019 441 72 605 2 958 263 11 249
June 2003 55 771 540 103 279 33 408 455 73 425 2 592 250 10 368
September 2003 57 856 580 99 752 41 499 575 72 172 2 841 269 10 562
December 2003 61 123 631 96 867 46 732 640 73 019 3 068 295 10 400
March 2004 62 096 615 100 969 48 761 671 72 670 3 021 312 9 683
June 2004 66 652 649 102 699 50 545 696 72 623 2 838 317 8 954
September 2004 66 969 661 101 314 52 768 703 75 061 2 921 323 9 043
December 2004 71 563 701 102 087 62 051 796 77 953 3 306 370 8 935
March 2005 68 667 679 101 129 63 404 792 80 055 3 312 388 8 536
June 2005 70 520 686 102 799 65 326 801 81 556 4 079 456 8 945
September 2005 68 741 693 99 193 63 495 788 80 578 4 777 521 9 170
December 2005 70 847 724 97 855 66 614 805 82 750 5 088 584 8 712
March 2006 83 385 791 105 417 63 829 784 81 415 5 798 634 9 145
June 2006 93 277 887 105 160 69 055 859 80 390 7 370 683 10 791
September 2006 106 912 987 108 321 73 226 898 81 543 7 602 715 10 632
December 2006 118 008 1 078 109 470 79 364 988 80 328 8 004 737 10 860
March 2007 120 819 1 113 108 553 100 256 1 204 83 269 9 561 843 11 342
June 2007 122 429 1 107 110 595 143 795 1 657 86 781 10 782 885 12 184
September 2007 124 758 1 149 108 580 183 574 2 137 85 903 12 042 956 12 597
December 2007 124 845 1 134 110 093 221 808 2 573 86 206 13 360 1 035 12 908
March 2008 128 128 1 139 112 492 243 600 2 804 86 876 15 097 1 195 12 633
June 2008 142 333 1 202 118 413 262 452 3 009 87 222 15 911 1 255 12 678
September 2008 151 423 1 245 121 625 288 959 3 316 87 141 16 787 1 332 12 603
December 2008 140 504 1 154 121 754 292 837 3 347 87 492 17 849 1 374 12 991
March 2009 130 777 1 088 120 200 289 763 3 303 87 727 17 439 1 363 12 795
June 2009 119 709 986 121 409 280 102 3 194 87 696 16 684 1 296 12 874
September 2009 114 460 934 122 548 269 558 3 050 88 380 16 354 1 264 12 939
December 2009 109 310 884 123 654 258 343 2 918 88 534 15 018 1 179 12 738
March 2010 104 062 849 122 570 250 383 2 890 86 638 14 199 1 139 12 466
June 2010 103 245 824 125 297 257 229 2 951 87 167 13 480 1 095 12 311
September 2010 106 599 791 134 765 252 924 2 887 87 608 12 361 1 023 12 083
December 2010 100 442 741 135 549 239 898 2 823 84 980 13 487 989 13 637
Percentage of total, December 2010 23.8 9.5 56.9 36.1 3.2 12.6
Table 2.11. World tonnage on order, 2000–2010a (in millions of dwt)
CHapteR 2: stRUCtURe, owneRsHip anD ReGistRation of tHe woRLD fLeet 57
Container vessels Other ships Total Beginning of month
1 000 dwt Number of
Ships
Average vessel
size, dwt
1 000 dwt Number of
Ships
Average vessel
size, dwt
1 000 dwt
Number of
Ships
Average vessel
size, dwt
16 140 394 40 964 8 870 1 087 8 160 100 513 2 697 37 268 December 2000
17 350 435 39 884 10 154 1 132 8 970 103 048 2 766 37 255 March 2001
18 393 441 41 708 11 790 1 138 10 360 105 563 2 737 38 569 June 2001
16 943 413 41 025 12 181 1 153 10 564 103 421 2 677 38 633 September 2001
16 550 393 42 111 13 501 1 201 11 242 107 955 2 718 39 719 December 2001
14 476 355 40 776 12 839 1 200 10 700 97 936 2 616 37 437 March 2002
14 793 362 40 865 15 415 1 324 11 643 101 836 2 747 37 072 June 2002
14 509 338 42 927 15 342 1 292 11 875 100 473 2 713 37 034 September 2002
13 000 296 43 919 16 174 1 386 11 669 108 238 2 818 38 409 December 2002
16 281 326 49 943 16 199 1 365 11 868 117 742 2 910 40 461 March 2003
18 296 367 49 853 17 085 1 367 12 498 127 152 2 979 42 683 June 2003
27 216 503 54 107 18 062 1 484 12 171 147 475 3 411 43 235 September 2003
30 974 580 53 403 19 277 1 492 12 920 161 174 3 638 44 303 December 2003
35 840 658 54 468 20 068 1 520 13 203 169 786 3 776 44 965 March 2004
38 566 724 53 268 22 833 1 682 13 575 181 434 4 068 44 600 June 2004
41 172 808 50 956 24 368 1 714 14 217 188 198 4 209 44 713 September 2004
43 904 880 49 891 27 361 1 898 14 416 208 185 4 645 44 819 December 2004
49 624 1 006 49 328 27 328 1 940 14 087 212 335 4 805 44 190 March 2005
53 605 1 101 48 688 29 884 2 002 14 927 223 414 5 046 44 275 June 2005
52 378 1 132 46 271 31 209 2 158 14 462 220 600 5 292 41 686 September 2005
50 856 1 124 45 245 33 147 2 285 14 506 226 551 5 522 41 027 December 2005
49 749 1 130 44 026 36 750 2 373 15 487 239 512 5 712 41 931 March 2006
53 876 1 185 45 465 39 768 2 522 15 768 263 347 6 136 42 918 June 2006
54 676 1 199 45 601 42 322 2 714 15 594 284 738 6 513 43 718 September 2006
51 717 1 143 45 247 45 612 2 962 15 399 302 706 6 908 43 820 December 2006
55 144 1 229 44 869 49 245 3 327 14 802 335 025 7 716 43 420 March 2007
63 063 1 305 48 324 52 382 3 562 14 706 392 451 8 516 46 084 June 2007
76 804 1 412 54 394 56 767 3 864 14 691 453 945 9 518 47 693 September 2007
78 348 1 435 54 598 56 947 3 876 14 692 495 309 10 053 49 270 December 2007
78 042 1 419 54 998 58 304 4 174 13 968 523 171 10 731 48 753 March 2008
76 388 1 352 56 500 57 574 4 302 13 383 554 657 11 120 49 879 June 2008
74 090 1 322 56 044 56 563 4 442 12 734 587 823 11 657 50 427 September 2008
69 593 1 209 57 563 52 088 4 256 12 239 572 871 11 340 50 518 December 2008
65 610 1 121 58 528 48 131 4 117 11 691 551 720 10 992 50 193 March 2009
63 064 1 028 61 346 43 989 3 796 11 588 523 548 10 300 50 830 June 2009
59 314 948 62 567 40 947 3 591 11 403 500 632 9 787 51 153 September 2009
53 903 813 66 301 37 434 3 428 10 920 474 008 9 222 51 400 December 2009
50 416 732 68 874 34 804 3 396 10 248 453 864 9 006 50 396 March 2010
44 071 628 70 176 30 135 3 137 9 606 448 160 8 635 51 900 June 2010
43 060 600 71 766 26 003 2 849 9 127 440 946 8 150 54 104 September 2010
43 180 566 76 289 24 888 2 702 9 211 421 895 7 821 53 944 December 2010
10.2 7.2 5.9 34.5 100.0 100.0 Percentage of total, December 2010
Source: Compiled by the UNCTAD secretariat on the basis of data supplied by IHS Fairplay. a Seagoing propelled merchant ships of 100 gross tons and above.
Table 2.11. World tonnage on order, 2000–2010a (thousands of deadweight tons) (concluded)Table 2.11. World tonnage on order, 2000–2010a (in millions of dwt) (concluded)
Review of MaRitiMe tRanspoRt 201158
Figure 2.10. World tonnage on order, 2000–2010a (thousands of dwt)
Source: Compiled by the UNCTAD secretariat on the basis of data supplied by IHS Fairplay.a Seagoing propelled merchant ships of 100 gross tons and above..
Oil tankers
Dry bulk carriers
General cargo ships
Container ships
0
50 000
100 000
150 000
200 000
250 000
300 000
12 /2000
12 /2001
12 /2002
12 /2003
12 /2004
12 /2005
12 /2006
12 /2007
12 /2008
12 /2009
12 /2010
Table 2.12. Tonnage oversupply in the world merchant fleet, selected years (end-of-year figures)
1990 2000 2005 2006 2007 2008 2009 2010
Millions of dwt
Merchant fleet, three main
vessel typesa 558.5 586.4 697.9 773.9 830.7 876.2 930.3 1 023.3
Idle fleetb 62.4 18.4 7.2 10.1 12.1 19.0 12.0 14.1
Active fleet 496.1 568.0 690.7 763.7 818.6 857.2 918.3 1 009.1
Percentages
Idle fleet as a percentage
of merchant fleet 11.2 3.1 1.0 1.3 1.5 2.2 1.3 1.4
Source: Compiled by the UNCTAD secretariat on the basis of data supplied by Lloyd’s Shipping Economist, various issues.a Tankers and dry bulk carriers of 10,000 dwt and above, and conventional general cargo vessels of 5,000 dwt and
above. b Surplus tonnage is defined as tonnage that is not fully utilized because of slow steaming or lay-up status, or because
it is lying idle for other reasons.
CHapteR 2: stRUCtURe, owneRsHip anD ReGistRation of tHe woRLD fLeet 59
Figure 2.11. Trends in surplus capacity by main vessel types, selected years
Source: Compiled by the UNCTAD secretariat on the basis of data from Lloyd’s Shipping Economist, various issues.
0
10
20
30
40
50
60
70
80
General cargo 2.1 2.2 2.7 2.8 2.2 2.0 1.4 1.7 1.6 1.8 1.1 0.7 0.4 0.7 0.7 0.7 0.6 0.7 1.0 0.8 0.8 Dry bulk 19.4 20.7 25.1 23.6 20.3 17.9 17.2 10.3 5.8 7.9 3.8 2.9 2.2 3.6 2.1 2.0 3.4 3.6 3.7 2.6 2.9 Tankers 40.9 39.8 41.8 43.5 39.0 28.8 28.8 17.0 17.3 14.0 13.5 17.9 19.1 6.0 3.4 4.5 6.1 7.8 14.4 8.5 10.5
1990 1991 1992 1993 1994 1995 1996 1997 1998 1999 2000 2001 2002 2003 2004 2005 2006 2007 2008 2009 2010
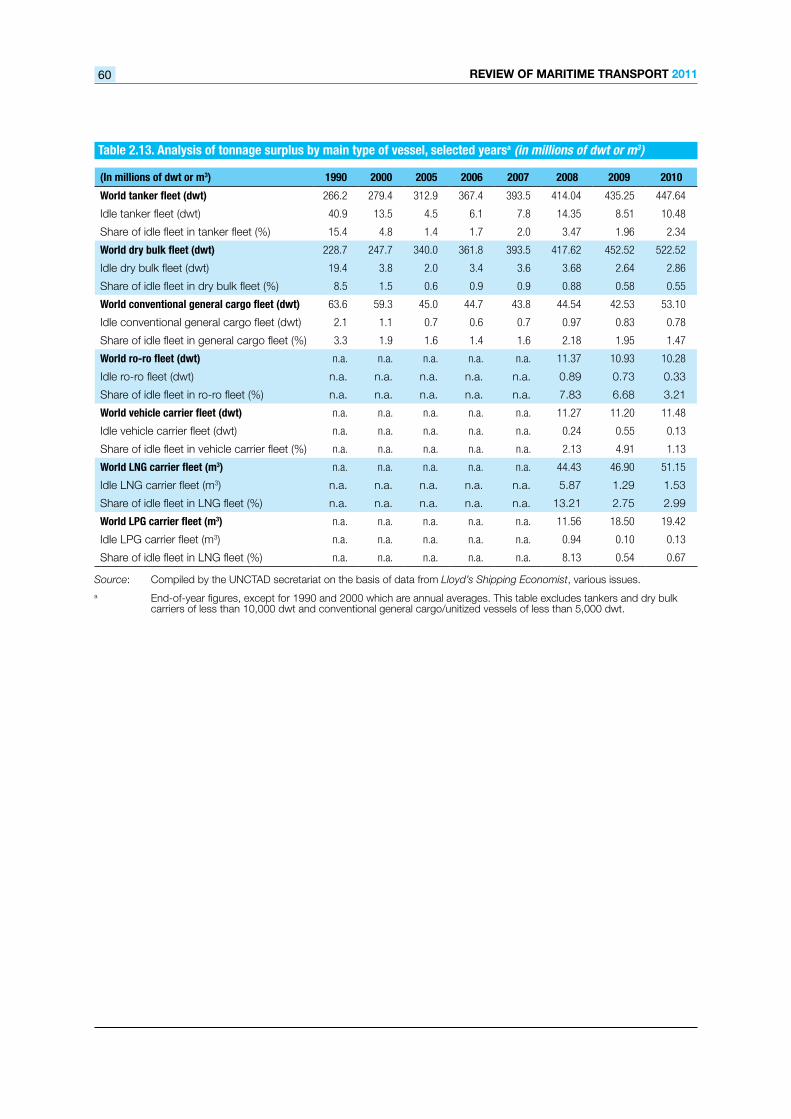
highest for ro-ro vessels (3.21 per cent of the world fleet), followed by LNG carriers (2.99 per cent), oil tankers (2.34 per cent) and general cargo ships (1.47 per cent). It was lowest in the dry bulk sector, where idle tonnage accounted for only 0.55 per cent of the existing fleet (table 2.13).
The idle tonnage in the container market had been significantly reduced by early 2011. As a result of slow steaming, increased demand, and delays in new deliveries, only a few container ships remained idle by this time. By the same token, demand for LNG tankers had increased by early 2011, with very few vessels available for the spot market.28
With the aim of reducing fuel expenditure and vessel overcapacity, container lines in 2010 and 2011 continued to deploy ships at reduced operating speeds (i.e. “slow steaming”). Oil tankers, too, have been reported to reduce their speeds from as fast as 24 knots to under 12 knots on the empty return leg, achieving savings of up to $22,000 per day.29
In container shipping, the majority of Asia–Europe services run at only 17 to 19 knots (or nautical miles per hour, equivalent to 31.5–35 kilometres per hour), compared to the normal speeds of 21 to 25 knots. Depending on fuel prices, this is estimated to
save the shipping line up to $100 per delivered TEU on major East–West routes. For the owner of the cargo, however, the additional inventory costs and requirements for safety stocks can far outweigh the savings made on the transport costs.30
In the longer term, it can be expected that demands from importers and exporters will put pressure on shipping lines to increase service speeds. While lines will be able to charge higher freights for faster services, the released containership capacity will put downward pressure on overall freight levels. From the perspective of the importer or exporter, this could be one more reason to insist on faster services.
Carriers may complain that there is an overcapacity of ships, however importers and exporters are happy about the resulting spare transport capacity to cater for the reviving international trade. In 2009 and 2010, shipyards delivered record levels of new tonnage – not only in absolute terms, but even in relative terms, as a percentage of the existing fleet. As has been shown in this chapter, throughout and after the economic crisis, the shipping industry has provided the supply of vessels that has been necessary to carry the growing demand from seaborne trade (see chapter 1). Matching supply with volatile demand will continue to be a challenge for the industry; this is dealt with in chapter 3.
Review of MaRitiMe tRanspoRt 201160
Table 2.13. Analysis of tonnage surplus by main type of vessel, selected yearsa (in millions of dwt or m3)
Source: Compiled by the UNCTAD secretariat on the basis of data from Lloyd’s Shipping Economist, various issues.a End-of-year figures, except for 1990 and 2000 which are annual averages. This table excludes tankers and dry bulk
carriers of less than 10,000 dwt and conventional general cargo/unitized vessels of less than 5,000 dwt.
(In millions of dwt or m3) 1990 2000 2005 2006 2007 2008 2009 2010
World tanker fleet (dwt) 266.2 279.4 312.9 367.4 393.5 414.04 435.25 447.64
Idle tanker fleet (dwt) 40.9 13.5 4.5 6.1 7.8 14.35 8.51 10.48
Share of idle fleet in tanker fleet (%) 15.4 4.8 1.4 1.7 2.0 3.47 1.96 2.34
World dry bulk fleet (dwt) 228.7 247.7 340.0 361.8 393.5 417.62 452.52 522.52
Idle dry bulk fleet (dwt) 19.4 3.8 2.0 3.4 3.6 3.68 2.64 2.86
Share of idle fleet in dry bulk fleet (%) 8.5 1.5 0.6 0.9 0.9 0.88 0.58 0.55
World conventional general cargo fleet (dwt) 63.6 59.3 45.0 44.7 43.8 44.54 42.53 53.10
Idle conventional general cargo fleet (dwt) 2.1 1.1 0.7 0.6 0.7 0.97 0.83 0.78
Share of idle fleet in general cargo fleet (%) 3.3 1.9 1.6 1.4 1.6 2.18 1.95 1.47
World ro-ro fleet (dwt) n.a. n.a. n.a. n.a. n.a. 11.37 10.93 10.28
Idle ro-ro fleet (dwt) n.a. n.a. n.a. n.a. n.a. 0.89 0.73 0.33
Share of idle fleet in ro-ro fleet (%) n.a. n.a. n.a. n.a. n.a. 7.83 6.68 3.21
World vehicle carrier fleet (dwt) n.a. n.a. n.a. n.a. n.a. 11.27 11.20 11.48
Idle vehicle carrier fleet (dwt) n.a. n.a. n.a. n.a. n.a. 0.24 0.55 0.13
Share of idle fleet in vehicle carrier fleet (%) n.a. n.a. n.a. n.a. n.a. 2.13 4.91 1.13
World LNG carrier fleet (m3) n.a. n.a. n.a. n.a. n.a. 44.43 46.90 51.15
Idle LNG carrier fleet (m3) n.a. n.a. n.a. n.a. n.a. 5.87 1.29 1.53
Share of idle fleet in LNG fleet (%) n.a. n.a. n.a. n.a. n.a. 13.21 2.75 2.99
World LPG carrier fleet (m3) n.a. n.a. n.a. n.a. n.a. 11.56 18.50 19.42
Idle LPG carrier fleet (m3) n.a. n.a. n.a. n.a. n.a. 0.94 0.10 0.13
Share of idle fleet in LNG fleet (%) n.a. n.a. n.a. n.a. n.a. 8.13 0.54 0.67
CHapteR 2: stRUCtURe, owneRsHip anD ReGistRation of tHe woRLD fLeet 61
eNdNotes1 Containerisation International (2011), quoting Sextant Consultancy. April: 43.2 Hellenic Shipping News (2011). 29 January. http://www.hellenicshippingnews.com. Also: Lloyd’s List (2011).
18 March. http://www.lloydslist.com. 3 DNV and MAN Diesel and Turbo (2011). Quantum 9000 two-stroke LNG. Copenhagen.4 Yonhap News (2011). 24 March. http://english.yonhapnews.co.kr.5 DNV (2011). Technology Outlook 2020. http://www.dnv.com/news_events/news/2011/dnvpredictstechnology
uptaketowards2020.asp. Oslo. 6 The nominal capacity may vary if empties are included. According to one estimate, the new Maersk ships could reach
up to 20,000 TEUs. Source: The Motorship (2011), quoting Alphaliner. 25 January. http://www.motorship.com.7 Lloyd’s List (2011). 12 May. http://www.lloydslist.com.8 Stopford M (2011). Super container ships to fall into the ULCC trap? In: Shipping and Finance. February.9 Fairplay (2011). Size matters. London. 2 March. 10 Lloyd’s List (2011). 21 January, 8 March and 9 May. http://www.lloydslist.com. 11 Lloyd’s List (2000). 14 July. http://www.lloydslist.com.12 Seatrade (2011). Issue 2. Colchester. April.13 Clarkson Research Services (2011). Container Intelligence Monthly. London. April.14 UNCTAD calculation based on data provided by Dynamar and Textainer.15 Cargo Systems (2011). 19 May. http://www.cargosystems.net.16 Journal of Commerce (2011). 8 March. http://www.joc.com.17 Information in this section is based on data on commercial seagoing vessels of 1,000 GT and above. 18 Please refer to annex I for the classification of countries.19 Shipping and Finance (2010). Athens. October. 20 Information in this section is based on data on vessels of 100 GT and above (see also annex III.(b), except where the
country of vessel ownership is considered. In the latter case, the data are for vessels of 1,000 GT and above. 21 Containerisation International, www.ci-online.co.uk, 6 April 2011, quoting Trevor Crowe of Clarkson Research Services.22 Hellenic Shipping News, www.hellenicshippingnews.com, 12 April 2011, quoting BIMCO.23 ifw, www.ifw-net.com, May 2011, quoting Alphaliner.24 Fairplay, www.fairplay.co.uk, 17 March 2011.25 Journal of Commerce (2011). 21 February. http://www.joc.com.26 Bloomberg (2011). 6 January. http://www.bloomberg.com.27 Lloyd’s List (2011). 26 April. http://www.lloydslist.com. 28 Lloyd’s List (2011). 8 February. http://www.lloydslist.com.29 Lloyd’s List (2011). 22 February. http://www.lloydslist.com.30 DNV (2010). Container Ship Update. No. 2. Oslo.


![UNCTAD at 50: A Short History [Russian]unctad.org/en/PublicationsLibrary/osg2014d1_ru.pdf · c. Надежды на создание ... ГЛАВА v. НЕОЛИБЕРАЛЬНАЯ](https://static.fdocuments.in/doc/165x107/5a8d7ee97f8b9af27f8c6691/unctad-at-50-a-short-history-russian-.jpg)


