Review of LU and RSSB Safety Risk...
36
ISSUE 01 2136148 Review of LU and RSSB Safety Risk Models a report produced for the Office of Rail Regulation by Tony Taig & Matthew Hunt TTAC Limited February 2012 This report has been produced by TTAC Limited under contract to the Office of Rail Regulation, Agreement reference ORR/ST/11-35. It is not for publication or distribution to any third party without the prior agreement of TTAC Ltd
Transcript of Review of LU and RSSB Safety Risk...
ISSUE 01
2136148
Review of LU and RSSB Safety Risk Models
a report produced for the Office of Rail Regulation
by Tony Taig & Matthew Hunt
TTAC Limited February 2012
This report has been produced by TTAC Limited under contract to the Office of Rail Regulation, Agreement reference ORR/ST/11-35. It is not for publication or distribution to any third party without the prior agreement of
TTAC Ltd

ISSUE 01
Review of LUQRA and RSSB SRM Page 2 of 36 TTAC Report ref u126/ISSUE 01 Tony Taig, 13 February 2012 2136148
Executive Summary This report provides the results of a review of the London Underground (LU) Quantitative Risk Assessment (QRA) and the RSSB Safety Risk Model (SRM) to advise ORR as to the suitability of these models to inform their strategic risk priorities, and the best ways for ORR to use them to this end. It has been carried out by Tony Taig and Matt Hunt of TTAC Ltd between November 2011 and January 2012 with the help of LU and RSSB. The opinions expressed are the authors’ own. Both models combine direct safety performance data with predictive models, evidence and judgment from many other sources to produce a comprehensive current, quantified picture of railway safety risks. They differ in terms of
a) the scope and structure of the events they model (RSSB adopts a wider scope and larger set of events modelled)
b) the nature of the outputs they produce (LU focus on predicted loss of life for passengers and members of the public whilst RSSB include, in addition to this, different injury severities and workforce, and produce headline results in terms of Fatalities and Weighted Injuries or FWI), and
c) the approach to quantifying and updating the models (the RSSB SRM quantifies at system level then breaks out a risk picture for individual routes or operators and is updated in full every 18 months or so; the LU QRA models risks across the network, quantifies at both line and system level, and is updated over a longer period by updating typically a few major events each year).
We conclude that
1. The RSSB SRM and LU QRA provide an invaluable, richer and more robust picture of current railway safety risk than can be obtained by analysis of recent safety performance statistics alone and have in our view played an important part in safety performance improvements on the railway over the past 2 decades or so.
2. The main provisos we have about the models are relatively minor and are a) the LU stepwise approach to quantifying and updating the QRA leads to the potential for relativities between top events to be distorted and is likely in our view to lead to results which err on the side of caution (i.e. consistently tend somewhat to overstate risk), and b) neither model includes in its output any indication of the provenance of or uncertainty in the different risk estimates produced (though RSSB have action to address this in hand).
We recommend that
3. ORR can and should rely on these models to inform their strategic risk priorities, insofar as the models provide a better picture of current railway safety risk than can be obtained by any other means, but

ISSUE 01
Review of LUQRA and RSSB SRM Page 3 of 36 TTAC Report ref u126/ISSUE 01 Tony Taig, 13 February 2012 2136148
4. To determine their strategic risk priorities ORR need also to understand how risk is affected by changes in the railway, by changes in company safety performance, and by ORR’s own activities in influencing safety management. For example, a small risk of train collisions due to low adhesion might be acutely sensitive to the thoroughness and effectiveness of an operator’s arrangements for dealing with leaf fall, which might in turn be amenable to significant ORR opportunity for testing and improvement. The place of such an issue in ORR’s strategic priorities, though, would depend not only on the sensitivity of this component of risk to ORR action, but also on the absolute scale of the risk involved. It is the combination of (current scale of risk) with (sensitivity to ORR influence), rather than either factor alone, which is important in setting ORR’s strategic priorities. The risk models are invaluable tools to help build this type of understanding, (and to help identify appropriate relevant leading indicators), and ORR should work with LU and RSSB to build their capability in these areas.
Tony Taig Matthew Hunt TTAC Ltd February 2012
ISSUE 01
Review of LUQRA and RSSB SRM Page 4 of 36 TTAC Report ref u126/ISSUE 01 Tony Taig, 13 February 2012 2136148
Contents
Executive Summary ......................................................................................................................... 2
1. Introduction .................................................................................................................................. 4
2. Background, Purpose & Scope of the Models ............................................................................. 6 2.1 The Rail Networks ............................................................................................................. 6 2.2 History and Purpose of the Risk Models ............................................................................ 6 2.3 Model Scope and Coverage ................................................................................................ 7
3. Modelling Approach and Event Structure .................................................................................. 10 3.1 Modelling Approach ........................................................................................................ 10 3.2 Event Structure ................................................................................................................. 11 3.3 Assembling the Models and Data ..................................................................................... 13
4. Evidence Base and Model Updating .......................................................................................... 15 4.1 The Evidence/Data Base for the Models .......................................................................... 15 4.2 The Updating Process ....................................................................................................... 15
5. Model Results ............................................................................................................................. 17 5.1 Nature of Model Outputs.................................................................................................. 17 5.2 Model Results ................................................................................................................... 17
6. Use of the Models ...................................................................................................................... 23 6.1 Current Use ...................................................................................................................... 23 6.2 Future Plans ...................................................................................................................... 23
7. Discussion: Use of Risk Models by ORR .................................................................................. 24 7.1 Reliability and Credibility of the Risk Models ................................................................ 24 7.2 Evolution to Further Assist ORR ..................................................................................... 26
8. Conclusions and Recommendations ........................................................................................... 28
Appendix 1: Model Roles/Purpose ................................................................................................ 29 A1.1 LU QRA Model ............................................................................................................. 29 A1.2 RSSB Safety Risk Model Requirements ....................................................................... 31
Appendix 2: Mapping Top Events ................................................................................................. 33
Appendix 3: Mapping of SRM Events for Figure 8 ....................................................................... 35
1. Introduction This is the report of a review for the Office of Rail Regulation (ORR) of the London Underground (LU) and Rail Safety and Standards Board (RSSB) quantitative risk assessment (QRA) models for railway safety risk. It has been carried out by Tony Taig and Matthew Hunt of TTAC Ltd between October 2011 and January 2012.

ISSUE 01
Review of LUQRA and RSSB SRM Page 5 of 36 TTAC Report ref u126/ISSUE 01 Tony Taig, 13 February 2012 2136148
London Underground (LU) and the national rail industry, via the Rail Safety and Standards Board (RSSB) and its predecessors, have developed quantitative risk assessment (QRA) models of railway safety risk for the LU and National Rail networks respectively. The Office of Rail Regulation (ORR) is currently reviewing its regulatory priorities in light, among other factors, of the current and potential future safety risks presented by the railway. A key question for ORR is thus the degree to which they can rely on the LU and RSSB QRA models to provide a picture of current railway safety risks which is fit for purpose in informing the setting of regulatory priorities. To answer this question ORR commissioned this review from TTAC Ltd who are well-informed on both models (having been involved in discussions about the earliest development of the models, having used them extensively over the past decade, and having been involved in parts of the recent updating and development of each) but are independent of any of the parties involved. The review is based on discussions with LU, RSSB and a sample of SRM users, on the documents, presentations and spreadsheet outputs with which they provided us, and on our own broader experience of risk assessment and modelling both inside and outside the rail industry. The review addresses
• The background, purpose and scope of the models (Section 2)
• The modelling approach and event structure (Section 3)
• The processes for updating and planned future development of the models (Section 4)
• The model outputs and uses (Section 5), and
• The use of the models by ORR in informing its strategic risk priorities (Section 6), before
• Providing our conclusions and recommendations (Section 7). We are extremely grateful to LU and RSSB for their openness and assistance in the course of the review and to Railway Group members with whom we discussed the RSSB model in particular. The opinions expressed in this report are our own and do not necessarily represent those of ORR, LU, RSSB or any other party.
ISSUE 01
Review of LUQRA and RSSB SRM Page 6 of 36 TTAC Report ref u126/ISSUE 01 Tony Taig, 13 February 2012 2136148
2. Background, Purpose & Scope of the Models We discuss here
• The main characteristics of the two rail networks, • The history and purpose of the two Safety Risk Models. • The scope and coverage of the models and risk metrics used.
2.1 The Rail Networks The UK national rail network has approximately 10,000 miles of route, 21,000 miles of track and 2,500 stations. Some 23,000 train crew and 4,000 trains run about 20,000 services per weekday. There are around 34 billion passenger miles travelled and 400 thousand tonnes of freight moved daily, and over 1.3 billion passenger journeys per year. The national rail network infrastructure is owned and operated by Network Rail while passenger and freight services and the majority of stations are operated by the privately owned train operating companies (TOCs and FOCs). The London Underground network has approximately 249 miles of route, 532 miles of track and 262 stations (serving 8 other stations). Approximately 18,000 staff and around 550 trains run 4,500 services per day. There are around 1.1 billion passenger journeys and 16.0 billion passenger miles travelled per year. London Underground (LU) is part of Transport for London, the statutory body for delivering transport in London.
2.2 History and Purpose of the Risk Models The LUQRA (Quantitative Risk Assessment) was initially proposed to the LU board in 1989 as part of the response to the King’s Cross fire. The first results were produced in 1992. In the early years of the model a primary requirement of the LU Board was to understand whether there were other important scenarios “below their radar” with the potential for accidents on the scale of that at King’s Cross. The model identified flooding as one such issue, and was used to guide the LU investment programme to reduce that risk. The model has been continually developed ever since and has been used as a primary driver in safety improvement planning. The RSSB SRM (Safety Risk Model) was initially specified in March 1999 after the 1996 Railtrack Safety Case required a three yearly risk review of the national rail network. Version 1 (v1) was published in January 2001 and republished as version 2 (v2) in July 2001 as essentially the same model but with corrections and refinements. When the model was first developed there was intense national debate over train protection strategy, informed by national-level assessment of train accident risks and of the safety benefits (i.e. risk reduction) that different train protection options would deliver. The early focus of the SRM was thus on providing an overall picture of safety risk against which opportunities for safety improvement could be evaluated. When RSSB was formed in 2003 the model was extended to cover a wider range of events in stations and on board trains but its purpose has remained essentially the same. The purpose and objectives of the models are summarised in Figure 1 below. Excerpts from the relevant LU and RSSB documents providing more detail are provided in Appendix 1.

ISSUE 01
Review of LUQRA and RSSB SRM Page 7 of 36 TTAC Report ref u126/ISSUE 01 Tony Taig, 13 February 2012 2136148
2.3 Model Scope and Coverage The scope of the two models is different in terms of the stakeholder groups and range of hazards they cover, as summarised in Figure 2 below.
ORR QRA Review 2© TTAC Ltd, 2012
Figure 1: Models’ Purposes/Objectives
LU(Standard 1-526: “The Assessment and Management of Health, Safety & Environmental Risk”, Issue 3, June 2009)
Assess risks Assess risks of change Identify mitigation
measures Determine ALARP Risk-based improvement
planning Communication
RSSB(Original Railtrack Safety & Standards Directorate Safety Risk Model: Briefing note – Report No. SP-RSK-3.1.3.9)
Understand current risk Improvement planning Guide standards
development Evaluate proposed
changes/ALARP Identify mitigation
measures Understand key risk
contributors Identify & prioritise issues
for audit
Customers/Passengers
Members ofthe Public
Workforce
Suicides
RSSB SRM
LUQRA
Yards, Depots and SidingsTerrorist ActivityLong term health effectsOffices, retail outlets and station toiletsRoadside of stations
Trespassers
Figure 2: Stakeholder and Events Coverage

ISSUE 01
Review of LUQRA and RSSB SRM Page 8 of 36 TTAC Report ref u126/ISSUE 01 Tony Taig, 13 February 2012 2136148
Both models cover passengers and members of the public (including those trespassing on or unauthorised to access railway property). The SRM, but not the LUQRA, includes suicides and workforce casualties. Neither model covers yards, depots and sidings, security threats or long-term health impacts, though information on incidents relevant to all of these is collected by both parties. Another significant difference lies in the detail with which the two models address accident casualties, as illustrated in Figure 3 below.
The LU QRA is focused primarily on fatality risk and this is the only consequence output modelled. An estimate of total weighted fatalities and injuries is obtained when required using a fatality adjustment factor for each “top event” modelled (see below for discussion of top events). This is smaller for hazards such as train accidents where fatal casualties are more likely, and larger for those such as slips and trips in stations where the casualties are dominated by large numbers of more minor injuries. It does not account for injuries resulting from top events not modelled in the QRA (e.g. all the non-fatal hazards modelled in the SRM). The SRM in contrast, perhaps reflecting its early usage and that of its predecessors in cost-benefit assessments where total casualty burden was a primary issue, models six different levels of casualty output as shown in Figure 3. Extensive research has been carried out to establish the relative value people attach to different severities of injury, and has been used to derive weights for each casualty severity. This enables them to be summed to produce an overall measure of “Fatalities and Weighted Injuries” (FWI) which is the often-quoted headline SRM result.
ORR QRA Review 4© TTAC Ltd, 2012
Figure 3: Risk Metrics Modelled
LU QRA Fatalities
+ Simple weighting
factor to adjust for added injury burden
RSSM SRM Fatalities Major injuries Minor injuries
- RIDDOR reportable- non-RIDDOR reportable
Shock/trauma- type 1- type 2and
Fatalities and weighted injuries (weighted sum of all the above)

ISSUE 01
Review of LUQRA and RSSB SRM Page 9 of 36 TTAC Report ref u126/ISSUE 01 Tony Taig, 13 February 2012 2136148
There has been vigorous debate over the years (showing no sign of abating) into the importance that should be attached to more minor injuries relative to serious injury and fatality. The SRM provides a more complete picture of non-fatal injury risks than does the LU model. Proponents of the latter argue that the simplicity of dealing with a single measure, and the strong focus this provides on fatal accidents, outweigh the benefits of the more detailed RSSB approach1. Proponents of the former argue that tracking injuries often provides an additional indicator of low level fatality risk in addition to providing information on non-fatal injuries themselves. LU covers the lower order risks (including all levels of non-fatal injury not covered by the QRA) by extensive workplace risk assessments (covering its employees) and customer risk assessments which are specific to each location on the Underground. These are prepared and updated jointly by the local responsible manager and the staff health and safety representative(s) and specify the local controls on these risks which the manager is directly responsible for implementing, maintaining and improving where reasonably practicable. Managers and H&S reps are trained to do these assessments in a systematic way and the quality of them is assured by LU’s HSE staff. This ensures that these risks are managed ALARP. LU sees no value in modelling these lower order risks in its QRA models. In terms of the hazards they cover, the models are significantly different by virtue of the differences of scope discussed above. Thus for example the LU model does not address non-fatal hazards such as noise and manual handling (whereas the SRM does), and the SRM includes numerous workplace hazard scenarios not included in the LU model. Further differences in terms of hazard coverage are discussed in the following section.
1 Earlier versions of the LU model included non-fatal injuries but the decision was made not to continue this practice.

ISSUE 01
Review of LUQRA and RSSB SRM Page 10 of 36 TTAC Report ref u126/ISSUE 01 Tony Taig, 13 February 2012 2136148
3. Modelling Approach and Event Structure 3.1 Modelling Approach The general approach adopted by both models uses the “bow tie” or “pinch point” approach as illustrated in Figure 4. The hazards to be modelled are reduced to a manageable number of Top Events (e.g. “Passenger train derailment”, “Slips, trips and falls on stairs”). The frequency of each event is estimated using historical data and fault-tree models to help piece together the various contributory events, causes and circumstances which can lead to that top event. The consequences of each event are estimated in terms of a spread of possible outcomes, each characterised in terms of its probability of occurrence should the top event occur, and the number of casualties that would result. Historical data is used to quantify this probability distribution of consequences, in combination with event tree models where appropriate.
The basic idea of this type of model is that it is not necessary to model the consequences of every possible circumstance that can lead to an accident separately, because there are higher level events/circumstances (i.e. “top events”) that can reasonably be expected to have similar consequences regardless of the detailed causes and circumstances that brought them about. Judgment is used in deciding how many “bow tie” models (pairs of fault and event tree models) to use for a particular accident scenario. For example, both the LU and RSSB models for derailment use separate fault/event tree models for derailments at different speeds. Other key circumstances that determine the outcome (e.g. for derailment how far the train moves from the centre of the track, what it encounters when it does so, how many people are on the train) are factored in via the event tree model. There are inevitably some assumptions and approximations made in such an approach when grouping together scenarios that are presumed to have similar consequences but which may differ in points of detail which are more or less significant for accident consequences.
DefinedTop Events
range ofinitiating events,precursors,causes ...
range ofpossiblecasualtyoutcomes
Fault Tree modellingof event FREQUENCY
Event Tree modellingof event CONSEQUENCES
Figure 4: General Model Approach

ISSUE 01
Review of LUQRA and RSSB SRM Page 11 of 36 TTAC Report ref u126/ISSUE 01 Tony Taig, 13 February 2012 2136148
Both models make extensive use of fault and event tree models to estimate the frequencies and consequences of events which are too rare for historical experience and statistics to provide an accurate guide. The models differ slightly as illustrated in Figure 5 below in that while both model risk at system level, the LU QRA quantifies first at system and then at line level (taking into account line-specific factors in the latter) then re-aggregates the line pictures of risk to provide the final whole-system picture. The SRM starts with the whole-system risk picture and then disaggregates this to provide risk pictures for individual routes or TOCs/FOCs. To date RSSB has provided Railway Group (RG) members with a template SRM and instructions on how to populate it for their own segment of the railway. Following much discussion as to whether this involves too great an element of “spoon feeding”, RSSB are now considering producing their own initial versions of the SRM for sub-sets of the railway for issue to relevant RG members for them to review and adapt.
3.2 Event Structure At first glance the sets of top events used in the two models appear quite different. The LUQRA results are presented in terms of 20 top events whereas the RSSB SRM presents results split into 121 top events in the latest (V7) version, divided into train accidents, movement accidents and non-movement accidents. Stripping out all the workforce, suicide and non-fatal hazards mentioned above significantly reduces the number of SRM events, but it is still substantially greater than the LU 20.
Figure 5: System v ComponentsLU QRA RSSB SRM
SystemRisk Picture
System model System model
ComponentRisk Pictures
quantify atsystem then
line level;re-aggregate
to provide
disaggregateto provide

ISSUE 01
Review of LUQRA and RSSB SRM Page 12 of 36 TTAC Report ref u126/ISSUE 01 Tony Taig, 13 February 2012 2136148
In practice, though, the LU set of 20 is a presentation format in which different top events (i.e. events with quite distinct fault and event tree models of causes and effects) are combined under a single heading for presentation purposes. Some of these are self-evident from the event titles (e.g. “Stairs and Assault” clearly combines two quite different sorts of hazard) while others are less obvious (e.g. “Power Failure” includes two main accident scenarios, one involving escalators stopping suddenly and people being thrown down them, the other involving trains being stranded for long periods and casualties arising either from asphyxiation/overheating in an unevacuated train, or from hazards encountered during evacuation via the track). The core of both models in practice covers largely the same train accidents, movement accidents and non-movement accidents, with a handful of genuinely unique event scenarios modelled in each of the models, as illustrated in Figure 6. Appendix 2 provides an approximate mapping from LU to SRM top events for hazards making up the “common ground”. While there are numerous differences in definitions and event boundaries, and some combinations in each model which are very differently represented in the other (e.g. “Stairs and Assaults” in the LU model, or “Slips trips and falls” as one large category in the SRM while stairs, escalators and lifts are all broken out separately in the LU model), the models cover broadly the same range of hazards.
An obvious area to consider in this review is the hazards that are unique to each model, and whether each represents an omission or shortcoming in the other. The main unique hazard events modelled are identified in Figure 6. In each case there are good reasons why one model needs to consider the issue carefully while the other does not:
• The LU Ventilation Hazard scenario involves people trapped in a stranded train being harmed through some combination of asphyxiation/overheating and/or hazards encountered during
ORR QRA Review 7© TTAC Ltd, 2012
Figure 6: Top Events
LU-specific, e.g. Ventilation hazard Arcing Flooding
National Rail-specific, e.g.
Level crossing incidents
Train Accidents (collisions, derailments, fires)
Movement Accidents (e.g. platform-train interface)
Non-movement Accidents (e.g. Falls, slips, trips)
Common to both risk models:
with various differences in grouping & classifications,
PLUS

ISSUE 01
Review of LUQRA and RSSB SRM Page 13 of 36 TTAC Report ref u126/ISSUE 01 Tony Taig, 13 February 2012 2136148
train evacuation. The SRM includes the hazard of people being harmed during authorised access to the track (e.g. in the course of evacuation from a stranded train) but does not include the asphyxiation/overheating component for passengers, as this is considered a much less significant issue for the larger main line trains which are less likely to be stranded in places whence evacuation could realistically be delayed for many hours.
• The LU Arcing hazard involves an arc striking under a train, which can occur on many LU trains whenever two earth faults of opposite polarity are present at the same time in the same electrical power section of the system. This can quickly burn through the floor of a train with potentially very serious consequences for its occupants. There is no potential for this hazard to be replicated on main line trains which have very different underfloor designs.
• The LU Flooding hazard is of major importance for the metropolitan railway in light of its multiple tunnels beneath the Thames and the well-understood risk of flooding in the London area. While there are some sections of tunnels below rivers on the National Rail network these generally are not subject to anything like either a) the same level of flood risk, or b) the same volume of train and passenger use. Thus whilst the SRM does include train accident scenarios involving “running into flooding”, it does not include a major event of inundation in tunnels as does the LU QRA as the risk of such an event is not significant at national level.
• Level crossing incidents are of major importance for National Rail but of no significance for passenger safety on LU as there are no level crossings on those sections of the railway accessed by passengers.
Both organisations have gone to great lengths (e.g. using international as well as UK accident data, and applying “first principles” hazard identification processes as well as historical data) to identify potentially significant hazard scenarios that might not be revealed by their own railway’s experience of accidents and incidents. We are confident that both models have captured all important contributors to risk – it is always possible that there will be rare scenarios that have been omitted from either model, but is extremely unlikely in our view that these might significantly distort the overall modelled picture of safety risk for either system.
3.3 Assembling the Models and Data Both models use large volumes of railway data in the course of their assessments in order to apply historic experience as accurately as possible to predict current performance levels. For example, annual event frequencies will typically be
• derived from historic data,
• normalised per relevant unit of railway activity,
• reviewed to decide whether changes in the railway or its operation might significantly have affected the normalised rate of occurrence of such events, and then
• multiplied back up by today’s relevant volume of railway activity in order to arrive at a best estimate of the frequency of such an event to be anticipated today.
Once all the model inputs have been collected, the models are assembled using specialist fault and event tree modelling software (both currently use the Isograph product) and spreadsheets (the

ISSUE 01
Review of LUQRA and RSSB SRM Page 14 of 36 TTAC Report ref u126/ISSUE 01 Tony Taig, 13 February 2012 2136148
SRM uses Isograph for train accident fault and event tree models and spreadsheet models for movement and non-movement accident scenarios). The fault tree approach ensures that lower level events that might occur several times in different parts of the models (e.g. the likelihood of failing to act appropriately on receiving a given alarm in a control room) are correctly incorporated into the model quantification. In practice many parts of the models (particularly those for movement and non-movement, as opposed to train accidents) are very simple and do not require any specialist software, whereas the more predictive models for rare events (including most train accidents) are more complex. As regards the size of the models, both involve of the order of 3,000 base events or precursors, though the structure at lower levels tends to be somewhat different. The SRM models downward in the fault trees as far as the evidence will allow it to distinguish between different contributory causes. The LU model is developed in consultation with operators and engineers to go down as far as the issues in which they are interested. Thus the LU model contains larger numbers of more detailed lower fault tree events which extend beyond what can be reliably quantified with incident data. Here assumptions are used based on judgement made by experienced and competent engineers. This has not been a problem in the parts of the model with which we have been involved (derailments and collisions in particular) as the models were verified at every level working up the fault trees against the evidence base available. While the assumptions made at lower levels may have been approximate in some cases, there can thus be a good level of confidence that they have not been made in a way which is inconsistent with the evidence available at higher levels (we are not confident that this was necessarily the case with earlier versions of the LU model for these top events). This difference in the ways in which the models use different types of evidence both in their structure and in quantification will be evident again in the discussion on updating and developing the models in the following section.

ISSUE 01
Review of LUQRA and RSSB SRM Page 15 of 36 TTAC Report ref u126/ISSUE 01 Tony Taig, 13 February 2012 2136148
4. Evidence Base and Model Updating 4.1 The Evidence/Data Base for the Models Both models are developed using a combination of actual historic accident and incident experience and operational and engineering judgement as illustrated in Figure 7.
The main evidence base for the SRM is the SMIS database which is the RSSB maintained, industry database of all reported accidents and significant incidents on the National Rail network. Duty holders classify and enter incidents into this database, which is QA-ed by RSSB. Databases are also maintained on various classes of more specific incidents (e.g. SPADs). A key feature of the RSSB evidence base is that SMIS has been specified and evolved over many years in consideration of the needs of the SRM risk model and vice versa. This makes it relatively quick and easy to update the frequency of relevant precursor events in the model. London Underground maintains a similar database of accidents and incidents on the London Underground network which is heavily used, along with other data on specific assets and aspects of operations (e.g. control room and power logs) in quantifying the QRA. A significant difference from RSSB is that in LU the main accident and incident database does not as readily allow incidents to be matched across to their place in the risk model.
4.2 The Updating Process The SRM is updated in full approximately every 18 months, and is now in its 7th version. Because the SRM has been used for tracking the evolution of safety performance over time,
ORR QRA Review 8© TTAC Ltd, 2012
Figure 7: Evidence Base & Updating
LU QRA Data review Fundamental ops/
engineering review Quantification Stepwise process (few
top events per year)
RSSB SRM Direct SMIS/SRM
mapping where practicable
Modelling elsewhere Full update every ~ 18
months
RiskModel
IncidentDatabases
Operational &engineeringjudgment

ISSUE 01
Review of LUQRA and RSSB SRM Page 16 of 36 TTAC Report ref u126/ISSUE 01 Tony Taig, 13 February 2012 2136148
significant effort is made on updating to take into account any substantial changes in the railway that have affected risk (e.g. the introduction of TPWS) and to present results before and after such changes both with and without the effects of the change being included. The full fault and event tree software is used in updating the train accident results, while much of the updating for movement and non-movement accidents is spreadsheet based, linked very directly to SMIS data. The LU QRA is updated in a rolling process whereby a selection of top events is updated typically each year. This reflects the more arduous nature of the process of updating the LU QRA than the SRM – because the data used is not already classified in line with the risk model, a greater degree of re-analysis is often needed to extract the precise precursor information of interest than is the case for the SRM. It is only in the more recent updates of the LUQRA (under the present management of the process) that comprehensive documentation has been introduced and maintained, so the provenance of some of the results of earlier versions is difficult to assess. This more arduous LU process is not without its benefits - sometimes valuable new insights are gained from such re-analysis – but it means that there is potential, particularly in a period such as the past two decades when safety performance has generally been improving, for relativities between top events to become distorted. For example, derailment and collision events were very substantially reviewed and updated in 2008 and reduced in risk by about an order of magnitude as a result. The top event for train fire was not updated, and now looks somewhat large in comparison with those for collision and derailment. Another common feature of updates for both models has been the continuous incorporation of modelling improvements and insights gained from relevant research. These were pioneering models - the first of their type in the world - and it is no surprise that improvements have been introduced over time, though this has on occasion caused confusion in some quarters when comparing the results of successive model versions. RSSB have been particularly careful in the past several updates of the SRM to explain what changes result from changes to the railway, what from changes in safety performance, and what from changes in modelling approach. LU takes a similar approach when releasing new LU QRA models. One final note in comparing the updating processes is that, because the SRM is used for formal tracking of safety progress against HLOS targets, there is a quite formal process for deciding which data will and will not be included when reviewing a particular event. LU can be more flexible in deciding (for example) over what period they will use statistical data for different events. This is illustrated in the next section where results are compared.

ISSUE 01
Review of LUQRA and RSSB SRM Page 17 of 36 TTAC Report ref u126/ISSUE 01 Tony Taig, 13 February 2012 2136148
5. Model Results This section describes first the general nature of the outputs produced by the models, and then presents an overview of current results, how those results have evolved over the lifetimes of the two models, and how the current results compare with recent actual safety performance.
5.1 Nature of Model Outputs Both models have the flexibility to produce risk assessment results in almost any required form including
• top event frequencies and annual risk
• probability/consequence charts of top event outcomes
• f/N curves showing frequencies of events leading to casualties in excess of a given number LU produces a high-level overview of QRA results breaking out risk by line and by top event. Another widely used LU output is the set of fault and event tree charts for each top event, which enable the user to “drill down” and explore the frequencies of events at different levels from top event right down to base events, and to explore the key aspects of event circumstances, situation and response that most influence the casualty outcome. The SRM (and its companion Precursor Incident Model or PIM) are used extensively in preparing parts of the annual safety performance report. A particularly widely used SRM output is the RSSB Risk Profile Bulletin (RPB). This provides a breakdown by top event and by precursor below the top events of
• Event frequencies
• Event overall risk (in FWI per year) and
• Average event consequences for different injury severities and stakeholder groups. Templates are provided to train operators to enable them to generate their own version of the RPB. As discussed above, RSSB is currently considering itself preparing localised versions of the key SRM outputs for distribution to duty holders for them to review and adapt. Both models present their results as point estimates without any accompanying expression of uncertainty or provenance of the information. RSSB has conducted considerable research in this area and intends to introduce some expression of uncertainty in future versions of the model.
5.2 Model Results Headline SRM results are generally presented in terms of FWI risk. For comparison with LU results we have focused on fatality risk only (to be comparable with LU’s “probable lives lost” or PLL metric), and have omitted workforce and suicide risks altogether. We have also excluded trespass fatalities, which are much lower on the Underground than for National Rail. By omitting

ISSUE 01
Review of LUQRA and RSSB SRM Page 18 of 36 TTAC Report ref u126/ISSUE 01 Tony Taig, 13 February 2012 2136148
these and by grouping together various of the SRM top events it is possible to compare the National Rail and LU risk profiles on a similar scale. Figures 8(a) and 8(b) show the results of the current model versions in terms of the top 10 event groups (with exclusions as above) in terms of annual PLL for the LU QRA2 and passenger fatalities for the SRM. The grouping of SRM events used in the figure is shown in Appendix 3.
Figure 9 shows the same information, this time presented in terms of the % of all passenger (or PLL in the LU case) fatality risk deriving from each event type. Significant observations on these figures include
a) The overall risk on LU is generally lower than on National Rail in absolute terms (as would be expected from the larger volume of more diverse operations on National Rail).
b) In relative terms, the platform and platform-train interface (PTI) are the largest risk contributor on each, while slips trips and falls (note for LU these are spread over stairs, escalators and elsewhere) make up the clear second largest contribution in each.
c) As mentioned in the previous section, care needs to be taken interpreting relativities in Figure 8(a) as the LU QRA includes some events that have been recently updated and some that have not.
2Note that PLL for some of these events includes a small contribution from members of the public who are not passengers – for example people outside the railway onto whom a derailed train falls from an embankment.
0.0
0.5
1.0
1.5
2.0
2.5
3.0
3.5
PTI &
Pl
atfo
rm
Inci
dent
s
Stai
rs &
As
saul
ts
Vent
ilatio
n Ha
zard
Trai
n Fi
res
Esca
lato
r In
cide
nts
Dera
ilmen
t
On
Trai
n In
cide
nts
Lift
Fire
s
Pow
er
Failu
re
Floo
ding
Figure 8(a) LU QRA 2011Predicted Loss of Life/year (Note - includes small MOP contribution e.g. for derailments)
Non-movement accidents
Movement accidents
Train accidents
0.0
0.5
1.0
1.5
2.0
2.5
3.0
3.5
PTI &
Pl
atfo
rm
Inci
dent
s
Slip
s, T
rips &
Fa
lls
Dera
ilmen
t
Assa
ult
Elec
tric
al
haza
rd
Auth
oris
ed
psgr
on
trac
k
Trai
n-tr
ain
colli
sion
Leve
l Cr
ossi
ng
Inci
dent
On
Trai
n In
cide
nts
Expl
osio
n/T
oxic
/Oth
er
haza
rd
Figure 8(b) RSSB SRM 2011Passenger fatalities/yr
Non-movement accidents
Movement accidents
Train accidents

ISSUE 01
Review of LUQRA and RSSB SRM Page 19 of 36 TTAC Report ref u126/ISSUE 01 Tony Taig, 13 February 2012 2136148
The left-hand (PTI – platform/train interface) block on the chart illustrates some interesting points of difference between the LU and RSSB approach to quantification. Both use different time periods of data (longer periods for rarer events, shorter for more frequent ones) when quantifying the model. Because the volumes of incidents are generally somewhat smaller on LU3, they generally tend to use longer periods. Moreover, RSSB are more formalised in terms of the data periods they adopt as SRM outputs are used to track performance against the government’s HLOS and thus need to be fairly frequent, up to date and consistent. The PTI part of the LU model was last updated in 2010 at which time there had been no passenger fatalities for over 3 years across the whole of LU. However, LU considered that it was more appropriate to model this risk based on evidence from a longer timeframe. The best estimate of current risk which resulted was about 1.88 passenger fatalities per year. Effectively, this quantification approach discounted an apparently quite significant recent drop in fatal accidents at the PTI at LU system level in preference for using longer-term averages for some components of the risk. We note that there have since been two further years without any PTI or platform fatalities on the Underground, suggesting that the overall estimate of PTI risk at 1.88 PLL/year might now be viewed as somewhat pessimistic4. 3 Both because the volume of train activity is somewhat smaller and because normalised accident rates are on average somewhat lower – see e.g. the LU/mainline railway comparison in the RSSB Annual Safety Performance Report 2010-11 Chart 39. http://www.rssb.co.uk/SPR/REPORTS/Documents/ASPR%202010-11%20Final.pdf 4 The probability of observing zero events in 5 years for an event occurring 1.88x per year on average is just under 0.01%.
0%
5%
10%
15%
20%
25%
30%
35%PT
I &
Plat
form
In
cide
nts
Stai
rs &
As
saul
ts
Vent
ilatio
n Ha
zard
Trai
n Fi
res
Esca
lato
r In
cide
nts
Dera
ilmen
t
On
Trai
n In
cide
nts
Lift
Fire
s
Pow
er
Failu
re
Floo
ding
Figure 9(a) LU QRA 2011% Predicted Loss of Life/year (Note - includes small MOP contribution e.g. for derailments)
Non-movement accidents
Movement accidents
Train accidents
0%
5%
10%
15%
20%
25%
30%
35%
PTI &
Pl
atfo
rm
Inci
dent
s
Slip
s, T
rips &
Fa
lls
Dera
ilmen
t
Assa
ult
Elec
tric
al
haza
rd
Auth
oris
ed
psgr
on
trac
k
Trai
n-tr
ain
colli
sion
Leve
l Cr
ossi
ng
Inci
dent
On
Trai
n In
cide
nts
Expl
osio
n/T
oxic
/Oth
er
haza
rd
Figure 9(b) RSSB SRM 2011% Passenger fatalities/yr
Non-movement accidents
Movement accidents
Train accidents

ISSUE 01
Review of LUQRA and RSSB SRM Page 20 of 36 TTAC Report ref u126/ISSUE 01 Tony Taig, 13 February 2012 2136148
Figure 10 shows how the overall passenger and MOP fatalities estimated by the models have evolved over their lifespan.
The general picture is one of significantly declining risk over time (as reflected in actual fatalities over the same period). Figure 11 shows a similar plot for two particular events, derailment and collision, which usefully illustrate the factors contributing to reducing modelled risk estimates. On the National Rail system, the chart for derailment shows a steady reduction with time. This reflects a real long-term improvement in both the frequency of derailment accidents and their consequences (as less crashworthy rolling stock has been removed from the network) which led to about a 40% reduction in derailment risk from the earliest to the current version of the SRM. The National Rail chart for collision risk shows some larger steps downward between earlier versions of the SRM. These correspond to the removal of Mk 1 rolling stock and the introduction of TPWS during the early years of the century, followed by a more modest gradual improvement thereafter. Here it is a major change in railway systems and hardware – all carefully modelled in the SRM – that has led to lower risk estimates. The LU charts show some early increases in derailment and collision risk during the mid-1990’s, resulting from model updates rather than from any particular change in safety performance, followed by another substantial step in 2008 when the latest major review of collision and derailment risk events took place. This illustrates the potential for the LU model to move in large steps, as the time intervals between major reviews for a given event can be considerable.
0
10
20
30
40
50
60
Estim
ated
Fat
aliti
es p
er ye
ar
Date of Result Publication
Figure 10: Fatalities Comparison - Excluding Suicide, Trespass, Workforce and Non-Passenger train events
LUQRA
RSSB SRM

ISSUE 01
Review of LUQRA and RSSB SRM Page 21 of 36 TTAC Report ref u126/ISSUE 01 Tony Taig, 13 February 2012 2136148
Finally, Figure 12 compares recent risk model estimates of annual expected passenger fatalities (excluding trespass & suicide) with actual fatalities experienced.
Some rough and ready comparisons can be made between the current risk model predictions and the actual experience of recent years (bearing in mind that, as shown in the figure, the predictions
ORR QRA Review 11© TTAC Ltd, 2012
Figure 11: Model Trends & ComparisonsDerailments & Train Collisions – Passenger & MOP fatalities per year
0
0.5
1
1.5
2
2.5
3
3.5
4
4.5
Estim
ated
Fat
aliti
es p
er ye
ar
Date of Result Publication
Passenger train derailmentLUQRA
RSSB SRM
0
0.5
1
1.5
2
2.5
3
3.5
4
4.5
5
Estim
ated
Fat
aliti
es p
er ye
ar
Date of Result Publication
Collision between passenger trainsLUQRA
RSSB SRM
0
2
4
6
8
10
12
14
16
2006/07 2007/08 2008/09 2009/10 2010/11
Ann
ual F
atal
ities
Figure 12: Model vs Actual Annual FatalitiesLU*
National Rail**
LU QRA***
RSSB SRM***
* PLL each year, excluding unauthorised access to track** Passenger fatalities, excl. trespass, suicide, non-passenger train events* **based on model version extant at 31 March of the latter year in each case

ISSUE 01
Review of LUQRA and RSSB SRM Page 22 of 36 TTAC Report ref u126/ISSUE 01 Tony Taig, 13 February 2012 2136148
of the models have been decreasing over this period). The RSSB SRM V7 predicts an average of 10.4 passenger fatalities per year for the events shown in Figure 12, while the 2011 LU QRA predicts 5.7 PLL per year. The actual average number per year as shown in Figure 12 is 6.8 per year for National Rail (34 fatalities in 5 years) and 0.8 per year for LU (4 accidental fatalities in 5 years). We would expect that in most 5-year periods the models would predict a higher than observed number of fatalities, because the models include a contribution from the rare but severe accidents which are less likely to be represented in so short a sample of experience. If we had a lot of 5-year samples, most should be below-average predicted fatalities by either model, while a few (those in which serious accidents occur) should be well above average. For the SRM, the predicted total passenger fatalities per year excluding train accidents (which accounted for zero actual fatalities in this period) is about 8, which compares well with the 6.8 observed and suggests the model is reasonably well-calibrated against experience. For the LU QRA, the predicted total passenger fatalities per year excluding train accidents (of which there again were zero in this period) is about 3.9, which is rather greater than the 0.8 observed. It is a matter for rejoicing that actual fatalities are running at so low a level, but suggests that the LU QRA is building in a greater degree of pessimism than is the RSSB SRM. We suspect this is attributable to some mix of
a) inclusion of top events whose risk models have not been updated for some time, and
b) adoption of longer time periods for the statistical data applied in quantifying the model than tend to be used by RSSB.
Overall, though, we do not regard a factor of 4 or 5 discrepancy between predicted and actual fatalities over a relatively short period as a major reason to distrust the LU model – it has some known inherently pessimistic attributes which need to be borne in mind when using its results, but still in our view offers a substantially richer and more valuable picture of safety risk than does a simple safety performance report based on a few years of recent actual data.

ISSUE 01
Review of LUQRA and RSSB SRM Page 23 of 36 TTAC Report ref u126/ISSUE 01 Tony Taig, 13 February 2012 2136148
6. Use of the Models 6.1 Current Use The use made of the models generally reflects directly their purpose and objectives, as discussed in Section 2 above. Thus both models are used extensively in
a) safety improvement planning (primary means to identify risks most amenable to improvement)
b) evaluating proposed changes to the railway system or its operation (e.g. introduction of new assets, major projects and upgrades, new standards), and
c) in communicating widely among colleagues an informed picture of risks and the main contributors to them.
In RSSB the SRM has an additional important use which does not apply to the LU model. This is to provide a means of monitoring, over time, progress of the railway against the government’s HLOS target. This is in our view quite significant as it constrains RSSB in terms of ensuring consistency of approach. It still is and will always be essential to apply substantial expert judgment in quantifying the SRM, but the scope for RSSB to apply management discretion in order to “flex” its quantification approach (e.g. in deciding the weight to give to a short-term change in safety performance in comparison with longer-term data) is perhaps more limited than is that for LU. The LU QRA is wholly a tool for LU management of safety improvement whereas the SRM also has wider uses. Another obvious comment regarding the use of the risk models in safety improvement planning is that LU, being a single coherent organisation, is better placed to direct the “duty holders” within the organisation to adopt a given risk reduction approach. RSSB has to work with the National Rail duty holders to agree a plan but, except in situations where a significant change is adopted as a new rule or standard across the whole industry, the degree of coherence in implementing that plan is always likely to be less than that in LU – different routes and train operators will have very different ways of doing things and will accordingly tailor any agreed safety improvement initiative to their own organisation.
6.2 Future Plans The LUQRA is intended to continue its cycle of updates with no particular modifications to scope or coverage in the near future, except that it will be extended as and when appropriate to cover any new lines, and will be modified to reflect the impact of major upgrades and projects. The RSSB SRM is currently being extended to cover Yards, Depots and Sidings and to provide an indication of the reliability of and/or uncertainty associated with the risk estimates it produces. Other work streams ongoing within RSSB are exploring new, improved methods of calculating the network risk profile; these are not expected to be usable for some years. This ongoing research is aimed at providing a more accurate and localised picture of risk on the network so that risk mitigation methods can be better targeted to where they will be most effective.

ISSUE 01
Review of LUQRA and RSSB SRM Page 24 of 36 TTAC Report ref u126/ISSUE 01 Tony Taig, 13 February 2012 2136148
7. Discussion: Use of Risk Models by ORR In our brief for this review, ORR asked us to consider particularly
a) how reliable and credible these models are for use by ORR in developing their strategic risk priorities, and
b) how these models could evolve to further assist ORR in identifying and justifying their strategic risk priorities.
We consider these in turn, focusing in the first question on whether the models (or their results) might conceivably provide a picture of risk which is distorted from the truth, and in the second question on what ORR needs in addition to an accurate picture of risks in order to identify, develop and justify its strategic priorities.
7.1 Reliability and Credibility of the Risk Models Various possible reasons have been raised with us in the course of the review why the risk models might conceivably provide a distorted picture of risk, mostly boiling down to one or more of the following concerns:
a) the models might be incomplete - leaving out potentially significant but rare events not previously experienced in the UK
b) the data on which the models are based may be incomplete or inaccurate as a result of imperfect incident recording and reporting and/or data entry
c) the models might be systematically miscalibrated, either consistently over-estimating or consistently under-estimating safety risks
d) differences across different models for different events might make the relativities between events (and thus priorities derived from them) unreliable, and/or
e) the models are inherently backward looking, in that they quantify risk with reference to past events rather than predicting current underlying risk.
To address these in turn: incompleteness is not in our view a significant issue. Yes, there is always a possibility that some very remote scenario has been omitted from the models. But the possibility of this contributing significantly to risk is in our view vanishingly remote. LU and RSSB have carried out extensive trawls of accident and incident experience overseas, and have participated in numerous international comparison studies. Where these have unearthed new events (e.g. the collision of a bus with a train on a level crossing in Hungary), those events have been incorporated into the models with appropriate modelling to derive UK-appropriate estimates of frequencies and consequences. As regards the data and calibration of the models, our view is that the SRM is generally as well-calibrated against actual incident experience as is practicable. It probably still contains some modestly pessimistic estimates of risk as a result of the general tendency, in the face of large uncertainties when modelling severe but rare events, to err on the side of caution. But we would be surprised overall if, over a long period of time, the SRM estimates disagreed significantly with

ISSUE 01
Review of LUQRA and RSSB SRM Page 25 of 36 TTAC Report ref u126/ISSUE 01 Tony Taig, 13 February 2012 2136148
actual casualty experience. The LU model is more likely, in our view, systematically to err on the side of pessimism in its risk estimates because of:
a) the piece-at-a-time nature of its updating process, so that several events are always some years out of step with others (we hope that “a few years out of date” will continue to mean “pessimistic” for many years to come – i.e that safety performance will continue its long-term improvement trend), and
b) the smaller units of railway within which the model is quantified, which increases the areas where LU may tend towards using longer-term incident data.
As regards consistency across different contributors to risk, and thus the reliability of the models as a guide to the relative contributions to risk from different sources, our view is that the RSSB SRM provides a picture that can be relied upon with high confidence. The extent to which individual routes and train operators have used the templates provided by RSSB to develop their own more local pictures of risk is variable but for most routes and operators they will not go too far wrong by relying on the system level risk picture provided by the RPB to give a rough indication of the relative importance of different risk contributors for them. As mentioned above, RSSB are currently considering moving towards providing operators and routes with local versions of the complete SRM. The LUQRA provides a good breakdown by Top Event of system risk, but considerable care needs to be used in comparing risk across top events, because of the model updating approach which means different top events may have risk assessments several years out of step with each other. Over the past 5 years, 10 of LU’s Top Events have been updated. The remaining 10 Top Events, which will be reviewed in coming years, account for less than 20% of LU’s safety risk profile. LU expects that the review of these 10 Top Events will reduce the pessimism in the LU QRA. As regards the models being backward looking, the models do scale up incident rates to take into account the difference between current volumes of railway activity (e.g. passenger journeys) and the volumes that were extant over the period to which the safety data used relates. The general combination used to predict current incident rates is
“Recent normalised rates” x “Current activity volumes”. In our view this provides the most appropriate general basis for making an assessment of current risk (which is what both models aim to provide). We would be uncomfortable if the models tried as a general policy to project forward the likely normalised rates of occurrence of incidents, though we note that RSSB may sometimes make changes to the recently observed rate in cases where there has been a clear trend or where there are other well-evidenced reasons for anticipating change. ORR might be interested to explore sensitivity of risk to different aspects of safety performance improvement, and the sensitivity of that safety performance improvement to ORR’s own activites, as part of their process for prioritising safety issues. Overall, then, with the provisos above as to the stepwise, line-based quantification of the LU model, we consider both models to be reliable and credible for use by ORR in providing a picture of current railway risk. Were ORR to use any other basis for deciding what are the current risks
ISSUE 01
Review of LUQRA and RSSB SRM Page 26 of 36 TTAC Report ref u126/ISSUE 01 Tony Taig, 13 February 2012 2136148
faced by the railway we would be concerned that this would be less reliable (in terms of providing a picture of current railway safety risk) than using the available models. Finally, we spoke to a sample of users of the RSSB SRM in train operators and in Network Rail who confirmed their general high satisfaction that the model provides a reliable and credible basis for understanding risks. Furthermore, we note that railway industries and regulators around the world look with envy at the LU QRA and RSSB SRM. In the absence of such models it is the norm in railways and governments elsewhere in the world that difficult decisions to prioritise risks (e.g. to get “rare but severe” in perspective against “frequent but minor”) take place in an information vacuum. There is a UK tendency in our view to take for granted the massive benefit for railway safety risk management and regulation of having these models available.
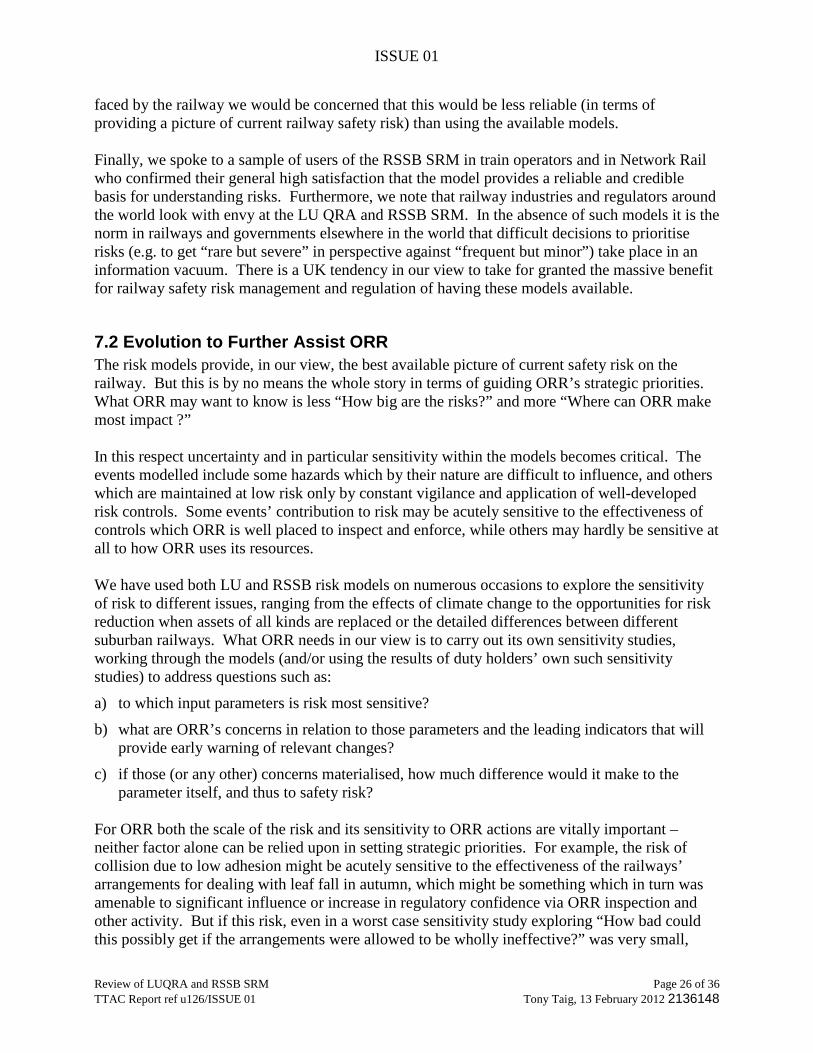
7.2 Evolution to Further Assist ORR The risk models provide, in our view, the best available picture of current safety risk on the railway. But this is by no means the whole story in terms of guiding ORR’s strategic priorities. What ORR may want to know is less “How big are the risks?” and more “Where can ORR make most impact ?” In this respect uncertainty and in particular sensitivity within the models becomes critical. The events modelled include some hazards which by their nature are difficult to influence, and others which are maintained at low risk only by constant vigilance and application of well-developed risk controls. Some events’ contribution to risk may be acutely sensitive to the effectiveness of controls which ORR is well placed to inspect and enforce, while others may hardly be sensitive at all to how ORR uses its resources. We have used both LU and RSSB risk models on numerous occasions to explore the sensitivity of risk to different issues, ranging from the effects of climate change to the opportunities for risk reduction when assets of all kinds are replaced or the detailed differences between different suburban railways. What ORR needs in our view is to carry out its own sensitivity studies, working through the models (and/or using the results of duty holders’ own such sensitivity studies) to address questions such as:
a) to which input parameters is risk most sensitive?
b) what are ORR’s concerns in relation to those parameters and the leading indicators that will provide early warning of relevant changes?
c) if those (or any other) concerns materialised, how much difference would it make to the parameter itself, and thus to safety risk?
For ORR both the scale of the risk and its sensitivity to ORR actions are vitally important – neither factor alone can be relied upon in setting strategic priorities. For example, the risk of collision due to low adhesion might be acutely sensitive to the effectiveness of the railways’ arrangements for dealing with leaf fall in autumn, which might be something which in turn was amenable to significant influence or increase in regulatory confidence via ORR inspection and other activity. But if this risk, even in a worst case sensitivity study exploring “How bad could this possibly get if the arrangements were allowed to be wholly ineffective?” was very small,

ISSUE 01
Review of LUQRA and RSSB SRM Page 27 of 36 TTAC Report ref u126/ISSUE 01 Tony Taig, 13 February 2012 2136148
such ORR actions might not be warranted. Similarly, risks associated with slips, trips and falls in stations might be very substantial, but if they are not particularly sensitive to ORR intervention there would be little point making them a high strategic priority. It is the combination of (scale of the risk) and (sensitivity to ORR actions) together that is relevant for ORR, rather than either factor alone. It would help ORR and others if the model results included some indication of the provenance or uncertainty attached to the model risk estimates. But in our view tailoring the models for ORR’s purposes is less to do with “How should the models evolve to help ORR more?” and more to do with “How should ORR use the models that are already available?” In our view ORR should make their own judgments about risks and priorities, and should have some reasonable capability of their own in evaluating and using these risk models. The skills required are not complex and we have found the models relatively easy to use for this type of purpose. We note that RSSB provide relevant training for their members, and that LU have seconded a member of their risk team to ORR – so assistance in building ORR’s capability is readily to hand.

ISSUE 01
Review of LUQRA and RSSB SRM Page 28 of 36 TTAC Report ref u126/ISSUE 01 Tony Taig, 13 February 2012 2136148
8. Conclusions and Recommendations We conclude that
1. The RSSB SRM and LU QRA provide an invaluable, richer and more robust picture of current railway safety risk than can be obtained by analysis of recent safety performance statistics alone and have in our view played an important part in safety performance improvements on the railway over the past 2 decades or so.
2. The main provisos we have about the models are relatively minor and are a) the LU stepwise approach to quantifying and updating the QRA leads to the potential for relativities between top events to be distorted and is likely in our view to lead to results which err on the side of caution (i.e. consistently tend somewhat to overstate risk), and b) neither model includes in its output any indication of the provenance of or uncertainty in the different risk estimates produced (though RSSB have action to address this in hand).
We recommend that
3. ORR can and should rely on these models to inform their strategic risk priorities, insofar as the models provide a better picture of current railway safety risk than can be obtained by any other means, but
4. To determine their strategic risk priorities ORR need also to understand how risk is affected by changes in the railway, by changes in company safety performance, and by ORR’s own activities in influencing safety management. For example, a small risk of train collisions due to low adhesion might be acutely sensitive to the thoroughness and effectiveness of an operator’s arrangements for dealing with leaf fall, which might in turn be amenable to significant ORR opportunity for testing and improvement. The place of such an issue in ORR’s strategic priorities, though, would depend not only on the sensitivity of this component of risk to ORR action, but also on the absolute scale of the risk involved. It is the combination of (current scale of risk) with (sensitivity to ORR influence), rather than either factor alone, which is important in setting ORR’s strategic priorities. The risk models are invaluable tools to help build this type of understanding, (and to help identify appropriate relevant leading indicators), and ORR should work with LU and RSSB to build their capability in these areas.
Tony Taig Matthew Hunt TTAC Ltd February 2012

ISSUE 01
Review of LUQRA and RSSB SRM Page 29 of 36 TTAC Report ref u126/ISSUE 01 Tony Taig, 13 February 2012 2136148
Appendix 1: Model Roles/Purpose A1.1 LU QRA Model Roles and responsibilities in relation to the LU QRA are defined in the relevant LU Standard for the assessment of risk (ref 1 in main report) in the following terms: “3.5 LU Quantitative Risk Assessment 3.5.1 LU and the PPP Suppliers shall maintain a point of contact for QRA related enquiries.
3.5.2 All concerns in respect of the LU QRA shall be notified to and recorded by LU SQE for consideration in future updates.
3.5.3 LU SQE shall develop and maintain the LU QRA and its associated supporting documentation.
3.5.4 Persons developing and maintaining the LU QRA shall be competent Safety Risk Assessors with additional competence in Fault Tree Analysis, Hazard Identification, Event Tree Analysis and the software used for the LU QRA.
3.5.5 Amendments to the LU QRA shall be developed in consultation with persons experienced in the area being assessed.
3.5.6 Suppliers shall:
a) supply information about changes which may affect the LU QRA,
b) supply sufficient information and resources to permit LU SQE to update the LU QRA,
c) participate in studies required as part of the process for continuous improvement (including e.g. HAZOP and Human Factors studies),
d) supply statistical base event data,
e) supply informed estimates of base event data where no suitable statistical information is available,
f) review draft Fault Trees, Event Trees, Risk Assessment calculations and documentation associated with the LU QRA,
g) utilise risk modelling software compatible with that used for the LU QRA.
3.5.7 For projects affecting the LU QRA, the RAF member representing the company responsible for the change, shall:
a) ensure that LU SQE is informed of such change in advance of the project,
discuss the scope of the proposed revisions of the relevant model of the LU QRA with LU SQE at an early stage of the project and agree a date at which LU will provide the LU QRA to the supplier,
b) provide the revised model(s) of the LU QRA to LU SQE. The revised section(s) of the LU QRA shall be based on the LU QRA version which is current when the project has secured Approval in Principle. The LU QRA model current at this point would be handed

ISSUE 01
Review of LUQRA and RSSB SRM Page 30 of 36 TTAC Report ref u126/ISSUE 01 Tony Taig, 13 February 2012 2136148
over to the supplier. If, in exceptional circumstances, it is proposed by the supplier to provide revised models which are based on a different version of the LU QRA, this must be discussed with LU SQE at the project planning stage and agered at the Risk Assessment Forum. The revised model(s) shall include revised fault and event trees and supporting documentation as laid down in Section 5.2.
3.5.8 LU shall provide suppliers with support on the QRA where appropriate, agreed at the start of the project and reviewed as part of the RAF.
3.5.9 LU shall review and approve proposed amendments to the LU QRA made by a supplier. LU shall be responsible for the integration of revisions to the LU QRA.
3.5.10 Where information is generated, as a result of feasibility or business case studies, which has the potential to enhance or provide greater insight into the LU QRA, this information shall be communicated to other parties through the RAF. 3.6 LU QRA Development Process 3.6.1 The scope for the review of the LU QRA shall be defined, documented and agreed at the RAF.
3.6.2 For each Top Event identified, the following shall be identified and recorded:
a) The main scenarios grouped under each Top Event,
b) The key sequences which would lead to each scenario (including control and mitigating features) using Fault Tree Analysis.
3.6.3 The combination of events that would result in each of the main scenarios giving rise to a Top Event Risk shall be identified and mapped using Fault Tree Analysis, to allow an estimation of the frequency of occurrence of the Top Event Risk to be made. This shall include though not be limited to:
a) equipment failures,
b) procedural failures,
c) human errors,
d) common mode failures, and
e) conditional factors.
3.6.4 Events shall be considered for normal, degraded and emergency operations.
3.6.5 Event Tree Analysis shall be used to map the escalation of events, including failure of the control and mitigation measures that have the potential to lead to the fatality of one or more LU customers or members of the public. (Note: only whole numbers shall be used for these outcomes.) These estimates shall consider the most probable outcome not the worst case.
3.6.6 The level of detail contained within a sequence shall be proportional to the availability of information to be used in the analysis.
3.6.7 The level of risk shall be estimated for each of the main scenarios and top event risks by using statistical base event data, or in its absence, informed estimates to determine the most probable values for:

ISSUE 01
Review of LUQRA and RSSB SRM Page 31 of 36 TTAC Report ref u126/ISSUE 01 Tony Taig, 13 February 2012 2136148
a) Severity of harm (expressed as number of fatalities),
b) The Likelihood that the Top Event Risk may result in that level of harm.
3.6.8 Levels of risk shall be assessed within the definitions of ‘Tolerability’ and ‘ALARP’ as defined by the Cat 1 Standard ‘Safety Decision Making’ and actioned as appropriate.
3.6.9 For each operating line within the LU QRA the relative significance of the risk from each Top Event Risk shall be classified as High, Medium, or Low, with:
a) High: Risk > 1 fatality per year
b) Medium: Risk between .001 and 1 fatalities per year
c) Low: Risk <.001 fatalities per year
3.6.10 The relative significance of the risks shall also be classified at a network level to identify priority areas across the network. At the network level the relative significance of the risk associated with each Top Event shall be classified as:
a) High: Top Event is a dominant contributor to the risk profile (>50%)
b) Medium: Top Event is a significant contributor to the risk profile (>10% and <50%)
c) Low: Top Event is a small contributor to the risk profile (<10%)
3.6.11 All assumptions and calculations used in developing the LU QRA shall be recorded and communicated to LU SQE.
3.6.12 Significant findings, including dominant precursors, single-point failures and dependencies, shall be used to communicate and prioritise risk management and reduction strategies.
3.6.13 Assessment of the risks arising from third party action shall be addressed within the QRA where such actions have the potential for customer or public fatality.
3.6.14 The language and content of reports shall be appropriate for the intended audience.
3.6.15 Reports shall include the elements outlined in section 5.2. ”
A1.2 RSSB Safety Risk Model Requirements The specification for the RSSB SRM was initially recorded in the Project Initiation Document (PID) written for version 1 of the model [The Safety & Standards Directorate Safety Risk Model: Project Initiation Document – Report No. SP-RSK-3.1.3.1]. This document has not been updated since, but the specification has remained roughly the same with slight shifts in focus as the business structure of the national rail network has changed. The Model requirements as specified in the PID were;
1. Provide the risk assessment outputs necessary for the ‘Major Risks in Railtrack Controlled Infrastructure’ section on the Railtrack Railway Safety Case. The SRM outputs should be able to be presented in the categories of train, movement and non-movement accidents. Provide collective risk estimates in terms of Equivalent Fatalities (note - now FWI) per year to enable ALARP assessments to be carried out as part of the safety justification for proposed

ISSUE 01
Review of LUQRA and RSSB SRM Page 32 of 36 TTAC Report ref u126/ISSUE 01 Tony Taig, 13 February 2012 2136148
system changes/modifications and for the provision of new infrastructure investment and rolling stock.
2. Provide risk profiles and risk rankings for hazardous events, individual failure causes and specific fault sequences.
3. Provide ‘individual risk’ estimates for passengers, staff and members of the public as defined in the Railway Group Safety Plan.
4. Provide F-N curves for the consideration of ‘societal risk’.
5. Provide facilities to enable sensitivity analyses ... to be carried out.
6. Provide a ‘controls’ cross referencing system between the SRM and the controls database.
7. Provide a database summarising all the input data, reference data sources and assumptions used within the model.
8. Enable the risk associated with newly identified hazards to be assessed. The current objectives of the SRM are described in an RSSB briefing note [The Safety & Standards Directorate Safety Risk Model: Briefing note – Report No. SP-RSK-3.1.3.9] as being to:
• Provide and understanding of the nature of current risk on the RCI
• Provide the risk assessments which provide part of Railtracks Railway safety case section 2f
• Assist in the development of the long term strategies and priorities for the railway group safety plan that sets 10 year goals, which is reviewed and published annually
• Identify and prioritise the railway group standards, which should be considered for revision in terms of their contribution to risk
• Enable ALARP assessments and Cost Benefit analyses to be carried out (i) to assist in the decision making process regarding the merits of technical changes and modifications and new infrastructure investment and (ii) to assist in the development of safety justifications for proposed changes.
• Assist in identifying additional control measures, which would reduce risk.
• Understand the contribution of a particular item of equipment or failure mode to the overall risk
• Assist in the validation of train and station operator’s railway safety cases
• Assist in the identification and prioritisation of issues for audit
• Assist in the understanding of the risk and risk profiles across the network
• Provide the facilities for undertaking general railway safety research and investigations.
(end of Appendix 1)

ISSUE 01
Review of LUQRA and RSSB SRM Page 33 of 36 TTAC Report ref u126/ISSUE 01 Tony Taig, 13 February 2012 2136148
Appendix 2: Mapping Top Events Note: this table includes events covered in both models and is necessarily approximate as in some cases hazards on one side are subdivided between more than one category on the other. Shaded SRM events are outside the scope of the LU QRA altogether.
(continued overleaf)
LUQRAEvent Title Event Index Event Title
HET-01, 06 Collisions between Passenger Trains
HET-02, 03 Collisions between Passenger and Non-Passenger Trains and 2 Non-Passenger Trains
HET-26 Collision between a failed train and an assisting train
HET-04, 09 Train collision with object/Buffer stops
HET-10 Passenger train collision with road vehicle on level crossing
HET-11 Non-passenger train collision with road vehicle on level crossing
HET-12 Derailment of passenger train
HET-13 Derailment of Non-Passenger Train
HET-17, 18 Fire on passenger train
HET-20 Fire on non-passenger train
HET-21, 22 Train crushed by structural collapse or large object
HEM-29 MOP (non-trespasser) struck/crushed by structural collapse or large object as a result of operations on railway infrastructure
HEN-21, 76 Struck/crushed by structural collapse or large object
HET-23 Explosion on passenger train
HET-24 Explosion on freight train
HEN-04, 05, 49 Exposure to explosion
HEN-01, 02, 03, 48 Exposure to a fire (non train movement)
HEN-27 Workforce scalds or burns due to contact with hot object (not on train)
HEN-33 Workforce affected by fumes/smoke/asphyxiation/drowning
HEN-57 Passenger scalds or burns due to contact with hot object (not on train)
Stairs and Assaults HEN-64, 65, 66 Assault
Escalator Incidents HEN-14, 24, 25, 36, 40, 68
Slip, trip or fall (broad SRM category broken down by stairs, escalators, ramps, platforms in LUQRA)
Lift Incidents HEN-23, 55, 56, 59 Struck by/contact with/trapped in object (spread over other LU hazards too)
RSSB SRM
Collision between trains
Tunnel Fires, Escalator Fires, Station Fires, Lift Fires
Explosion
Structural Failures
Train Fires
Derailment
Collision hazard

ISSUE 01
Review of LUQRA and RSSB SRM Page 34 of 36 TTAC Report ref u126/ISSUE 01 Tony Taig, 13 February 2012 2136148
(end of Appendix 2)
LUQRAEvent Title Event Index Event Title
HEM-05 Train door closes on passenger
HEM-06 Passenger fall between stationary train and platform
HEM-09 Passenger injury while boarding/alighting a train (platform side)
HEM-08 Passenger fall from platform and struck by train
HEM-10 Passenger struck by/contact with moving train while on platform
HEM-16 Workforce injury while boarding/alighting train
HEM-21 Workforce fall between stationary train and platform
HEM-23 Train door closes on workforce
HEM-40 MOP (non-trespasser) struck by / contact with moving train due to being too close to platform edge
HEM-41 MOP (non-trespasser) fall between stationary train and platform
HEM-42 Passenger struck by flying object thrown up by passing train while at station
HEM-43 Train door closes on MOP (non-trespasser)
HEM-01 Passenger injury during evacuation following stopped train (not at a platform)
HEM-02 Passenger fall from train in running
HEM-03 Passenger struck while leaning out of train (train in running)
HEM-07 Passenger fall from train in service onto track (no electric shock nor struck by train)
HEM-13 Train crowding leading to passenger injury
HEM-15 Workforce fall/alighting from moving train
HEM-17 Workforce struck while leaning out of train (train in running)
HEM-38, 39 Injury due to sudden train movement
HEN-62, HEN-63 On-train incident (excluding sudden train movement & assaults)
HEM-22 Workforce fall out of train onto track at station (no electric shock nor struck by train)
Hem-12, HEM-25, HEM-26
MOP (trespasser) struck/crushed by train
HEN-13, 67 Fall from platform onto track (no electric shock nor struck by train)
HEM-44 MOP (trespasser) jump from train in service
HEM-30 MOP (trespasser) fall while on train exterior
HEM-32, HEN-45, 58, 71, 72
Other MOP Incidents
HEN-15, 16, 17 Other station incidents to passengers
HEN 37,38,39,41,42,43
Trespasser electric shock
RSSB SRM
Platform Train Interface and Platform Hazards
On Train Incidents
Unauthorised Access to Track

ISSUE 01
Review of LUQRA and RSSB SRM Page 35 of 36 TTAC Report ref u126/ISSUE 01 Tony Taig, 13 February 2012 2136148
Appendix 3: Mapping of SRM Events for Figure 8
H. E. Code Hazardous event description Figure 8(b) Hazard Category
HET-01Collision between two passenger trains resulting from a: passenger train Cat A SPAD; runaway train; misrouted train; or WSF
Train-train collision
HET-02PCollision between a passenger train and non-passenger train resulting from a: passenger train Cat A SPAD; runaway train; misrouted train; or WSF
Train-train collision
HET-02NPCollision between a non-passenger train and passenger train resulting from a: non-passenger train Cat A SPAD; runaway train; misrouted train; or WSF
Train-train collision
HET-03Collision between two non-passenger trains resulting from a: non-passenger train Cat A SPAD; runaway train; misrouted train; or WSF
Train-train collision
HET-04 Collision of train with object (not resulting in derailment) Collision HazardHET-06 Collision between two passenger trains in station (permissive working) Train-train collisionHET-09 Train collision with buffer stops Collision HazardHET-10 Passenger train collision with road vehicle on level crossing Level Crossing IncidentHET-11 Non-passenger train collision with road vehicle on level crossing Level Crossing IncidentHET-12 Derailment of passenger train DerailmentHET-13 Derailment of non-passenger train DerailmentHET-17 Fire on passenger train Train FireHET-20 Fire on non-passenger train Train FireHET-21 Train crushed by structural collapse or large object (not at a station) Structural CollapseHET-22 Train crushed by structural collapse or large object (at a station) Structural CollapseHET-23 Explosion on passenger train Train FireHET-24 Explosion on freight train Train FireHET-25 Passenger train division (not leading to collision) On Train IncidentsHET-26 Collision between a failed train and an assisting train Train-train collisionHEM-01 Passenger injury during evacuation following stopped train (not at a platform) Authorised psgr on trackHEM-03 Passenger struck while leaning out of train (train in running) On Train IncidentsHEM-05 Train door closes on passenger PTI & Platform IncidentsHEM-06 Passenger fall between stationary train and platform PTI & Platform IncidentsHEM-07 Passenger fall from train in service onto track (no electric shock nor struck by train) On Train IncidentsHEM-08 Passenger fall from platform and struck by train PTI & Platform IncidentsHEM-09 Passenger injury while boarding/alighting a train (platform side) PTI & Platform IncidentsHEM-10 Passenger struck by / contact with moving train while on platform PTI & Platform IncidentsHEM-11 Passenger struck/crushed by train while crossing the track at or near a station on a crossing Authorised psgr on trackHEM-12 MOP (trespasser) struck/crushed by train while on tracks at a station TrespassHEM-14 Workforce (not infrastructure worker) struck/crushed by train WorkforceHEM-15 Workforce fall/alighting from moving train WorkforceHEM-16 Workforce injury while boarding/alighting train WorkforceHEM-17 Workforce struck while leaning out of train (train in running) WorkforceHEM-19 Infrastructure worker struck/crushed by train in motion Workforce
HEM-20Workforce struck by flying object thrown up by passing train (includes objects thrown up by OTM movements outside a possession)
Workforce
HEM-21 Workforce fall between stationary train and platform WorkforceHEM-22 Workforce fall out of train onto track at a station (no electric shock nor struck by train) WorkforceHEM-23 Train door closes on workforce WorkforceHEM-25 MOP (trespasser) struck/crushed by train while on railway infrastructure not at a station TrespassHEM-27 MOP (non-trespasser) pedestrian or cyclist struck/crushed by train on level crossing or footpath crossing Level Crossing IncidentHEM-30 MOP (trespasser) fall while on train exterior TrespassHEM-31 Suicide (or attempted suicide) involving rolling stock in motion SuicideHEM-32 MOP (non-trespasser) outside railway infrastructure struck by object from operations on railway Collision HazardHEM-38 Passenger injury due to sudden train movement On Train IncidentsHEM-39 Workforce injury due to sudden train movement WorkforceHEM-40 MOP (non-trespasser) struck by / contact with moving train due to being too close to platform edge PTI & Platform IncidentsHEM-41 MOP (non-trespasser) fall between stationary train and platform PTI & Platform IncidentsHEM-42 Passenger struck by flying object thrown up by passing train while at a station PTI & Platform IncidentsHEM-43 Train door closes on MOP (non-trespasser) PTI & Platform IncidentsHEM-44 MOP (trespasser) jump from train in service TrespassHEM-50 Witnessing a traumatic event (movement) Workforce

ISSUE 01
Review of LUQRA and RSSB SRM Page 36 of 36 TTAC Report ref u126/ISSUE 01 Tony Taig, 13 February 2012 2136148
(end of App 3)
H. E. Code Hazardous event description Figure 8(b) Hazard Category
HEN-01 Exposure to a fire on railway infrastructure not at a station Fire (not train or station)HEN-02 Exposure to fire on railway infrastructure at a station Station firesHEN-03 Exposure to fire in a station not on railway infrastructure Station firesHEN-04 Exposure to explosion on railway infrastructure Explosion/Toxic/Other hazardHEN-05 Exposure to an explosion at a station Explosion/Toxic/Other hazardHEN-07 Passenger exposure to hazardous substances Explosion/Toxic/Other hazardHEN-08 Passenger observes electrical arcing at a station Electrical hazardHEN-09 Passenger electric shock at a station (OHLE) Electrical hazardHEN-10 Passenger electric shock at a station (conductor rail) Electrical hazardHEN-11 Passenger electric shock at a station (non-traction supplies) Electrical hazardHEN-13 Passenger fall from platform onto track (no electric shock nor struck by train) PTI & Platform IncidentsHEN-14 Passenger slip, trip or fall Slips, Trips & FallsHEN-15 Passenger fall from overbridge at a station Slips, Trips & FallsHEN-16 Passenger fall during an evacuation at a station Slips, Trips & FallsHEN-21 Workforce struck/crushed by structural collapse or large object WorkforceHEN-22 Workforce trapped in machinery WorkforceHEN-23 Workforce struck by / contact with / trapped in object at a station WorkforceHEN-24 Workforce slip, trip or fall <2m WorkforceHEN-25 Workforce slip, trip or fall >2m WorkforceHEN-26 Workforce struck/crushed by non-train vehicle WorkforceHEN-27 Workforce scalds or burns due to contact with hot object (not on train) WorkforceHEN-28 Workforce observes electrical arcing WorkforceHEN-29 Workforce exposure to hazardous substances (including stings, bites and needle injuries) WorkforceHEN-30 Workforce electric shock (conductor rail) WorkforceHEN-31 Workforce electric shock (OHLE) WorkforceHEN-32 Workforce electric shock (non-traction supply) WorkforceHEN-33 Workforce affected by fumes/smoke/asphyxiation/drowning WorkforceHEN-35 Workforce involved in road traffic accident whilst on duty WorkforceHEN-36 MOP (adult trespasser) slip, trip or fall while on railway infrastructure TrespassHEN-37 MOP (adult trespasser) electric shock (OHLE) TrespassHEN-38 MOP (adult trespasser) electric shock (conductor rail) TrespassHEN-39 MOP (adult trespasser) electric shock (non-traction supply) TrespassHEN-40 MOP (child trespasser) slip, trip or fall while on railway infrastructure TrespassHEN-41 MOP (child trespasser) electric shock (OHLE) TrespassHEN-42 MOP (child trespasser) electric shock (conductor rail) TrespassHEN-43 MOP (child trespasser) electric shock (non-traction supply) TrespassHEN-44 MOP (non-trespasser) pedestrian or cyclist/motorcyclist struck/trapped by level crossing equipment Level Crossing IncidentHEN-45 MOP (non-trespasser) fall onto railway infrastructure Slips, Trips & FallsHEN-46 MOP (non-trespasser) pedestrian or cyclist/motorcyclist slip, trip, or fall on level crossing or footpath Level Crossing IncidentHEN-48 MOP (non-trespasser) exposure to fire on railway infrastructure Fire (not train or station)HEN-49 MOP (non-trespasser) exposure to explosion on railway infrastructure Explosion/Toxic/Other hazardHEN-50 MOP (non-trespasser) observes electrical arcing Electrical hazardHEN-51 MOP (non-trespasser) electric shock (OHLE) Electrical hazardHEN-52 MOP (non-trespasser) electric shock (conductor rail) Electrical hazardHEN-53 MOP (non-trespasser) electric shock (non-traction supplies) Electrical hazardHEN-54 MOP (non-trespasser) exposure to hazardous substances on railway infrastructure Explosion/Toxic/Other hazardHEN-55 Passenger struck by / contact with / trapped in object at a station Explosion/Toxic/Other hazardHEN-56 Workforce struck by / contact with / trapped in object not at a station WorkforceHEN-57 Passenger scalds or burns due to contact with hot object (not on train) Explosion/Toxic/Other hazard
HEN-58MOP (non-trespasser) injury from objects/structures (eg bridges, steps, subways) other than in stations whilst on railway infrastructure
Slips, Trips & Falls
HEN-59 MOP (non-trespasser) struck by / contact with / trapped in object at a station Explosion/Toxic/Other hazardHEN-60 Workforce exposure to noise (not on train) Explosion/Toxic/Other hazardHEN-61 Passenger exposure to noise (not on train) Explosion/Toxic/Other hazardHEN-62 Passenger on-train incident (excluding sudden train movement & assaults) On Train IncidentsHEN-63 Workforce on-train incident (excluding sudden train movement & assaults) WorkforceHEN-64 Passenger assault AssaultHEN-65 Workforce assault WorkforceHEN-66 MOP (non-trespasser) assault AssaultHEN-67 MOP (non-trespasser) fall from platform onto track (no electric shock nor struck by train) PTI & Platform IncidentsHEN-68 MOP (non-trespasser) slip, trip or fall in station Slips, Trips & FallsHEN-70 Witnessing a traumatic event (non-movement) WorkforceHEN-71 MOP (adult trespasser) fall/jump onto railway infrastructure TrespassHEN-72 MOP (child trespasser) fall/jump onto railway infrastructure TrespassHEN-73 Passenger manual handling Manual handlingHEN-74 Workforce manual handling Workforce
HEN-75MOP (non-trespasser) pedestrian or cyclist/motorcyclist struck by a road vehicle or involved in a road traffic accident at a level crossing
Level Crossing Incident
HEN-76MOP (non-trespasser) struck/crushed by structural collapse or large object as a result of operations on railway infrastructure
Structural Collapse
HEN-77 Suicide (or attempted suicide) not involving rolling stock in motion SuicideHEN-82 Workforce awkward movement injury WorkforceHEN-83 Passenger awkward movement injury Manual handling