REVIEW OF LITERATURE· - Shodhgangashodhganga.inflibnet.ac.in/bitstream/10603/71890/7/07_chapter...
43
REVIEW OF LITERATURE· 10
-
Upload
phungtuong -
Category
Documents
-
view
219 -
download
3
Transcript of REVIEW OF LITERATURE· - Shodhgangashodhganga.inflibnet.ac.in/bitstream/10603/71890/7/07_chapter...

REVIEW OF LITERATURE·
10

1. GEOCHEMISTRY, DISTRIBUTION & EXPOSURE OF FLUORIDE
Fluorine is the ninth element of the periodic table with atomic weight 18.99.
Elemental fluorine is never found in the free form in nature, as it is the most
electronegative and reactive of all elements10. Fluorine in the environment is
therefore found as fluorides which represent about 0.06-0.09 per cent of the
earth's crust. It is the 13th most abundant element, commonly occurring in
the minerals fluorspar (f1uorite;CaF2), cryolite (Na3 AIFe) and fluorapatite
(3Ca3 (P04h Ca FCb)10. The sources of fluoride include soil, water, air, food,
beverages, dental products and industrial products.
1.1. SOIL
The chief natural source of fluoride in soil is fluorite, which occurs mostly as
an accessory mineral in granite rocks. The fluoride content in soil normally
ranges from 200 to 300 ppm. Since fluorides are retained by soil through strong
association with soil components, fluoride is not readily leached from soil l1.
Nommik observed that fluoride content in soil increases with depth, and only 5 to
10% of the total fluoride in soil is water-soluble12. The rate of fluoride release into
soil also depends on the chemical form, rate of deposition, soil chemistry and
climate. Greater fluoride content is observed in ground water of irrigated lands,
mainly due to alkalinisation2.
11

1.2. WATER
Drinking water is typically the largest single contributor to daily fluoride intake
in human beings13. Fluoride is found in all natural waters at some concentration.
The highest natural water level of fluoride reported is 2800 ppm from the Kenyan
lake Nakuru1. In India, concentrations of 0.1 to 0.3 ppm of fluoride are reported in
rain water14. Surface water concentration generally ranges from 0.01-0.3 ppm.
Seawater typically contains fluoride in the concentration range of 1.2 - 1.5 ppm11
while rivers and lakes generally exhibit concentrations of less than 0.5 ppm. In
groundwater, however, low or high concentrations of fluoride can occur,
depending on the nature of the rocks and the occurrence of fluoride-bearing
minerals. Concentrations in water are limited by fluorite solubility15. For a given
individual, fluoride exposure via drinking-water is determined by the fluoride level
in the water and the daily water consumption (liters per day). Water consumption
increases with temperature, humidity, exercise and state of health, and is
modified by otherfactors including diet16.
1.3. AIR
Due to dust, industrial production of phosphate fertilizers, coal ash from the
burning of coal and volcanic activity, fluorides are widely distributed in the
atmosphere. However, air is typically responsible for only a small fraction of total
fluoride exposure1. In non-industrial areas, the fluoride concentration in air is
12

typically quite low (0.05-1.90 I-Ig m-3 fluoride) 13. In areas where f1uoride
containing coal is burned or phosphate fertilizers are produced and used, the
fluoride concentration in air is elevated leading to increased exposure by the
inhalation route. High levels of atmospheric fluoride occur in some areas of
Morocco and China2. In some provinces of China, fluoride concentrations in
indoor air ranged from 16 to 46 I-Ig m-3 owing to the indoor combustion of high
fluoride coal for cooking, drying and curing food. 16.5 million cases of dental
fluorosis are reported here as a result of coal smoke pollution alone2.
1.4. FOOD AND BEVERAGES
Virtually all foodstuffs contain at least trace amounts of fluoride as it is
ubiquitous in the environment11. Fluoride is entering human food-and-beverage
chain in increasing amounts through the consumption of tea, wheat, spinach,
cabbage and carrots17, The fluoride in these items presumably results from the
use of soil or fertilizer-borne fluoridated water for food and beverage processing.
Tea plants are found having high fluoride uptake and 97% of it gets accumulated
in leaves. The fluoride content of tea leaves is about 1,000 times the soluble
fluoride content of soil 18. Regular-strength preparation of instant tea in distilled
water showed a fluoride concentration of 3.3 ppm 19. Excessive consumption of
black tea has been identified as a causative factor of dental fluorosis4•
13
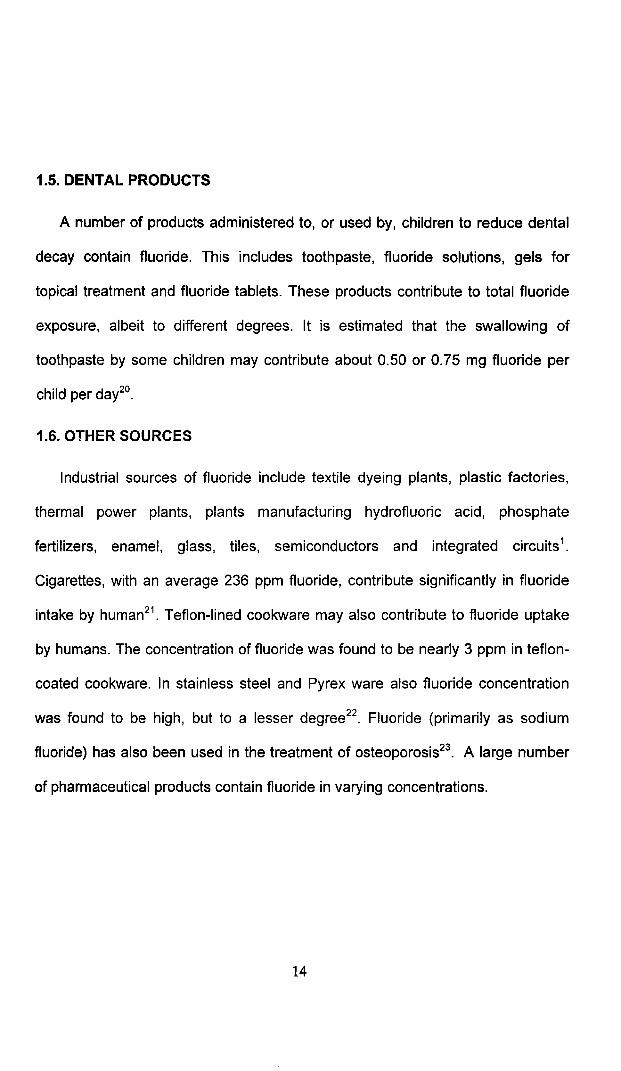
1.5. DENTAL PRODUCTS
A number of products administered to, or used by, children to reduce dental
decay contain fluoride. This includes toothpaste, fluoride solutions, gels for
topical treatment and fluoride tablets. These products contribute to total fluoride
exposure, albeit to different degrees. It is estimated that the swallowing of
toothpaste by some children may contribute about 0.50 or 0.75 mg fluoride per
child per day2°.
1.6. OTHER SOURCES
Industrial sources of fluoride include textile dyeing plants, plastic factories,
thermal power plants, plants manufacturing hydrofluoric acid, phosphate
fertilizers, enamel, glass, tiles, semiconductors and integrated circuits1.
Cigarettes, with an average 236 ppm fluoride, contribute significantly in fluoride
intake by human21. Teflon-lined cookware may also contribute to fluoride uptake
by humans. The concentration of fluoride was found to be nearly 3 ppm in teflon
coated cookware. In stainless steel and Pyrex ware also fluoride concentration
was found to be high, but to a lesser degree22. Fluoride (primarily as sodium
fluoride) has also been used in the treatment of osteoporosis23. A large number
of pharmaceutical products contain fluoride in varying concentrations.
14

2. EFFECTS OF FLUORIDE IN THE HUMAN BODY
2.1. ABSORPTION, DISTRIBUTION AND EXCRETION
Ingested sodium fluoride is rapidly absorbed from the gastrointestinal
tract24. Peak plasma levels were reached 30-60 minutes after the ingestion of
0.5 to 10 mg f1uoride25. The extent of dietary fluoride absorption was greater than
90% in studies with human volunteers. The absorption of fluoride from stomach
is by a passive diffusion process inversely proportional to pH26, but is a rapid
diffusion from small intestine after gastric emptying. The presence of a diet rich in
calcium reduces the fluoride absorption27.
Once absorbed into the blood, fluoride readily distributes throughout the
body. Up to 75% of absorbed fluoride may be deposited in calcified tissues, with
the highest deposition found in children with active bone growth or individuals
consuming fluoridated drinking water. Approximately 99% of total body fluoride is
localized in calcified tissues (Le., bones and teeth), where it is substituted for
hydroxyl ions (OH-) in hydroxy-apatite, forming fluorapatite28.
Many of the factors affecting the uptake and retention of fluoride in bone
also affect fluoride concentrations in teeth, with the exception that tooth enamel
and dentin do not undergo continuous remodelling11. Enamel fluoride
concentrations decrease with distance from the tooth surface and also vary with
location, surface wear, age and degree29.
15
Fluoride does not accumulate in most soft tissue but may enter the
intracellular fluid of soft tissues as hydrogen fluoride28. The concentration of
fluoride in soft tissues is reflected by that in blood. Fluoride is concentrated in
high levels within kidney tubules and has a higher concentration than plasma11.
So, kidney could be a potential target of chronic fluoride toxicity.
The plasma half-life of fluoride in humans ranges from 2 to 11 hours
following single or multiple oral doses of Sodium fluoride (3.0-40 mg fluoridef5.
Fluoride is excreted primarily via the urine, with perspiration, saliva, breast milk
and faeces making smaller contributions to daily body clearance. In adult
humans, approximately 50-75% of an oral dose of fluoride appears in the urine
within 24 hours after ingestion. Under conditions of relatively constant exposure,
urinary excretion correlates well with drinking water fluoride levels and is often
used as an indicator of exposure11. Urinary fluoride clearance increases with
urine pH due to a decrease in the concentration of Hydrogen Fluoride. Numerous
factors (e.g. diet and drugs) can affect urine pH and thus affect fluoride clearance
and retention25.
Fluoride is readily transferred from mother to foetus across the placenta but
poorly transported from plasma to milk30. Fluoride levels of 5-10 IJ gIL have been
m"easured in human milk. Saliva excretes approximately 1% or less of ingested
fluoride and concentration of fluoride in saliva appears to mirror plasma fluoride
16

levels31. Levels of fluoride in sweat are approximately 20% of plasma levels.
Renal excretion of fluoride typically equals 35 to 70% of intake in adults. So,
urine, plasma, or saliva can be used as biomarkers of acute exposure to
f1uoride32.
2.2. ACUTE TOXICITY
In humans, acute ingestion of fluoride can result in nausea, vomiting,
abdominal pain, diarrhoea, fatigue, drowsiness, coma, convulsions, cardiac
arrest and death33. Effects are most severe following ingestion of the more
soluble fluoride salts. The lethal dose of fluoride in the average adult has been
estimated to be 32-64 mg/kg body weight, and deaths in children have been
reported after ingestion of as little as <5-30 mg/kg body weight 11.
2.3. EFFECTS ON TEETH
2.3.1. FLUORIDE AND DENTAL CARIES
Dental caries is an infectious and multifactorial disease, which is
characterized by demineralization of inorganic components of teeth and
dissolution of organic substance of microbial aetiology. Caries is the result of
bacterial growth in unhygienic oral cavity, leading to acid production by
fermentation, which etches away the enamel leaving black spots or cavity on the
tooth. These microorganisms may penetrate the underlying dentin and progress
into the soft pulp tissue. The untreated caries can lead to incapacitating pain,
19

bacterial infection leading to pulpal necrosis, tooth extraction, loss of dental
function, and may even lead to an acute systemic infection. The specific bacteria
streptococcus mutans and lactobacilli in dental plaque are the major etiologic
factors responsible for this disease. The prevalence of these cavities can be
effectively quantified by using the DMFT (number of decayed, missing, or filled
teeth) or DMFS (number of decayed, missing, or filled tooth surfaces) indices
developed by oral epidemiologists34.
2.3.1.1. MECHANISM OF CAR!ES PREVENTION BY FLUORIDE
Most of the epidemiologic research suggests that the actions of fluoride in
preventing dental caries are primarily topical which includes the inhibition of
bacterial activity in dental plaque preventing demineralization and enhancing
remineralization of dental enamel. Enamel and dentin are composed primarily of
mineral crystals of calcium and phosphate, which are embedded in an organic
proteinllipid matrix. Fluoride is taken up by cariogenic bacteria during the
fermentation process, which produce acids. Once fluoride finds its way inside the
bacterial cells, it can interfere and alter the enzyme activity of the bacteria. This
inhibits acid production, thereby reducing the demineralization of dental
mineral35. The calcium ions in saliva are attracted to tooth surface by the already
adsorbed fluoride. Fluoride aids the calcium and phosphate ions to involve in the
chemical reaction that takes place, producing a crystal surface that is much less
18

soluble in acid than the original tooth mineral thereby enhancing
remineralization36. Of late, there is a growing consensus in this view that it is
through interaction with the surface of enamel (topical action) that fluoride in
saliva and dental plaque inhibits the demineralization and promotes the re-
mineralization of dental enamel 11.
2.3.1.2. EFFICACY OF FLUORIDE ON PREVENTION OF DENTAL CARIES
Fluoride is often called a double-edged sword because deficiency of fluoride
intake leads to dental caries while an excess consumption lead'S to dental
fluorosis. This dose-response curve is represented in figure 1.
Fig: 1. Relation between DMF teech (doted line). Severity of dental tlurosls & fluoride concentration of the water (Adpoted from Hodge and Smith ) 1950
10------------------------
t p.'\
'\,3 '\
1 8·'\"'\,'\.~ Severe
I 7-4
", " modente ·a,3Q, " J." ii- "-
0 " mildF.!I , :I~ 5- '\ ......~
'\very mild 0
'\
.r 4-, :I w, ],
If: "-.:i 3.
1. Fluol'osisratoI J.Q
I .
o0.1
Partspcr miUion:Fluoride
19
10
The difference between the desirable dose (to prevent dental caries) and the
toxic dose leading to fluorosis is narrow. The benefits and effects of fluoride in
drinking water has been a matter of scientific debate as many research findings
are contradicting or inconclusive. The debate still continues over how much
fluoride is too much and whether presence of fluoride in drinking water is
necessary or essential in preventing tooth decay.
It has been considered that oral fluoride is an effective means of reducing
dental caries even from 1930s and historically, populations consuming..fluoridated drinking water were found having much lower prevalence of caries
than those consuming non-fluoridated drinking water. Of late, credible evidence
from most of the systematic scientific research substantiates the role of fluoride
in preventing dental caries. It was reported that there is clinically important
reduction in the incidence of dental caries at a natural fluoride concentration of
around 1 ppm37 and that too, in a wide range of 3 to 75 years of age38-40
. WHO
Expert Committee in 1994, after examining the effects of fluoride on dental health
suggested an optimum fluoride level of 1ppm for maximum dental caries
protection41. In 1996, WHO categorized fluoride among 'potentially toxic
elements, some of which may nevertheless have some essential functions at low
levels' and recommended it as a desirable or essential element for humans in
preventing dental caries42. Depending upon the annual average maximum daily
air temperature, WHO, framed permissible limits ranging from 0.5 to 1.2 ppm11.
20

It is reported that due to water fluoridation, the mean DMFT among persons
aged 12 years in the United States declined 68%, from 4.0 in 1966-70 to 1.3 in
1988-9443. Centre for Disease Control and Prevention (CDC) hails water
fluoridation as one of the ten most important public health measures currently
available43, 44, Globally, the population consuming fluoridated drinking water was
estimated as about 210 million in 199441, 350 million in 200445 and around 355
million in 200546. In addition, around 50 million people receive water naturally
fluoridated at a concentration of around 1 ppm46.
McDonagh et al. presented a summary of the best available and most
reliable evidence on the safety and efficacy of water fluoridation through a
systematic review47. This review thoroughly analyzed the researches
investigating the association between fluoride and dental caries between 1969
and 1999. The 'best available evidence' suggests that fluoridation of drinking
water supplies does reduce caries prevalence, both as measured by the
proportion of children who are caries free (an increase of 14.8%) and by the
mean change in DMFT (a decrease of 2.25 teeth). The analysis of cross
sectional random samples published recently in countries that have introduced
fluoridation to monitor the dental effects of fluoride among children aged 5 to15
years also support this observation48. Since fluoride is most effective when
continually present at low levels in saliva and plaque fluid, WH011 recommended
the use of fluoridated mouth rinses for individuals with an elevated risk of dental
21:
caries. Also, fluoridated toothpastes (96% of it contains 1000 to 1500 ppm
fluoride) are found responsible for the gradual decline in the prevalence of dental
caries in most industrialized countries11.
It is equally important and worth mentioning that many scientific researches
fail to support the effectiveness of fluoride in preventing tooth decay49-51. It is
suggested that dental caries in children is a bacterial disorder the intensity of
which varies with several factors viz. nutrition, oral bacteria, oral hygiene,
educational and economic status of parents. Also, large temporal reductions in
tooth decay can mainly be attributed to the dietary patterns and immune status of
populations and that dietary control of caries, without the use of fluoride is
possible as even chewing cheese reduces tooth decay52. It is also observed that
tooth decay is increasing together with increases in sugar and other fermentable
carbohydrates in the diet in several developing countries53. There is more to diet
than sugar, as certain foods which do not contain fluorides like wholegrain
cereals, nuts and diary products may protect against tooth decal4. Since no
disease can be shown to be caused by its deficiency, it is argued that fluoride
cannot be an essential nutrient to humans. Moreover, none of the animal
experiments addressing whether fluorine is an essential element provide strong
evidence that it really is2. It is stated that for humans, the essentiality has not
been demonstrated unequivocally, and no data indicating the minimum nutritional
requirement are available14.
22

Since more than 85% of tooth decay occurs on pits and fissures of the tooth,
where fluoride has always been recognized to be ineffective, it is pointed out that
fluoride acts topically (at the surface of the teeth) and that there is negligible
benefit in actually ingesting it55. Many scientific studies also showed that there is
little or no significant difference in tooth decay in permanent teeth between many
comparable fluoridated and non-fluoridated regions of the world56-59
.
2.3.2. DENTAL FLUOROSIS
Dental fluorosis, an irreversible toxic effect on teeth, is the earliest sign of
fluoride attack visible to the naked eye. Histologically, it presents as a
hypocalcification, while clinically it ranges from barely visible white striations on
the teeth through to gross defects and staining of the enamel60. The exact
mechanisms of dental fluorosis development have not been fully elucidated.
2.3.2.1. HISTORY OF DENTAL FLUOROSIS
Dr. Frederick S. McKay is the first to report the development of an unusual
permanent stain or "mottled enamel" on teeth surface and to initiate research on
its relation with fluoride in drinking water61. Dental fluorosis was first related to
drinking water in 1925, though several more years before it was shown to be
specifically caused by fluoride in drinking water62. Fluorosis as an occupational
disease was identified in 1930 and subsequently, occurrence of skeletal fluorosis
in cryolite miners in Denmark was reported in 193263,
.23

2.3.2.2. FLUORIDE AND DENTAL FLUOROSIS
Most of the recent research has focused on the theory that dental fluorosis
results from a fluoride-induced delay in the hydrolysis and removal of amelogenin
matrix proteins during enamel maturation and subsequent effects on crystal
growth. Amelogenins, the proteins secreted by ameloblasts, inhibit the growth of
enamel crystallites. In the early maturation phase of tooth development,
amelogenins are removed from the enamel matrix by amelogeninases,
dramatically increasing the crystallite growth. This phase of enamel maturation
appears to be most sensitive to elevated fluoride levels64.
The calcium rich constituents of teeth, viz. enamel and dentin, have
strong affinity for fluoride during the formation of teeth. It is also suggested that
fluoride combines with calcium forming calcium fluoroapatite crystals during
mineralization. So, as fluoride accumulates, calcium is lost from the teeth. A
gradual reduction in the calcium content occurs in the f1uorosed teeth from the
'mild to severe' state. Thus, due to fluorides, the teeth become weaker by loosing
calcium ions65. The severely f1uorosed enamel is more porous, pitted, discolored
and is prone to wear and fracture because the well mineralized zone is very
fragile to mechanical stress. Due to gross structural alterations, reduction in
mineral content, impairment of enamel mineralization and morphological
aberrations on the teeth surface, the fluorosed teeth readily gets fractured66.
24

2.3.2.3. PHYSICAL SYMPTOMS OF DENTAL FLUOROSIS
Dental fluorosis occurs in children during the developmental stages when the
teeth are exposed to fluoride. Depending upon the severity of exposure, colour of
teeth may progress from white, yellow, brown to black. Teeth become rough
resulting in a mottled appearance characterized by chalky white patches and
bands of brown pigmentation. Small pits may also be present on the surface of
teeth. In severe cases, teeth may even appear corroded. Such teeth may show a
tendency for wear and even fracture of the enamel.
The discolouration appears away from the gums on the enamel surface and
becomes an integral part of the tooth matrix and as a result, the enamel will lose
its lustre and shine. If the discolouration is along the gums and on the periphery
of the teeth, it is due to other reasons viz. dirty teeth, smoking, tobacco chewing
and coffee or tea stains. Since the enamel lines are laid down in incremental
lines during prenatal and postnatal periods, dental fluorosis is invariably seen as
horizontal lines or bands on the surface of the teeth and never as vertical bands2.
For the same reason, it will be seen in pairs based on developmental pattern and
never alone in a single isolated tooth. While all the teeth may be affected,
mottling is usually best seen on the incisors of the upper jaw1°.Teeth commonly
affected are the incisors and molars of the permanent dentition.
25
2.3.2.4. PSYCHO SOCIAL EFFECTS OF DENTAL FLUOROSIS
Teeth are important components of the facial skeleton. Apart from the
function of mastication of food, teeth add to the aesthetics, phonation and
speech. Dental fluorosis deserves special attention because of its unfavourable
effects on teeth and ultimately on individual's personality. It is hard to smile for a
person with dental fluorosis, though an attractive smile is an important personal
and social asset. An individual with discoloured teeth develops an inferiority
complex, due to distress and anxiety presenting as psycho social problems to
self and family. They will be under the shadow of 'impaired self-image' or Iloss of
self-esteem'. Even from an early age, they are more likely to experience
embarrassment, isolation and discrimination. Such conditions can precipitate
feelings of frustration and anger, which could in turn lead to deep psychological
depression67-72
.
In 1994, a Kenyan survey noted that between 60 and 84% of respondents
viewed dental fluorosis as an important problem because of its unfavorable
effects on an individual's personality67. A Canadian study examined the influence
of fluoride exposure on the wide-spread "aesthetic problems" caused by dental
fluorosis. It acknowledged that forty six percent (nearly half) of the participants
had dental fluorosis. The effect on personal appearance, as defined by the
participants themselves, was more prevalent in the over-11 age group68. The
26

trauma experienced by young people with dental fluorosis is depressingly
apparent in a South African study conducted by the North West Province
Department of Health69: "The psychological effect in terms of the unsightly,
brown-stained teeth has induced the adolescents with fluorosed teeth to demand
that these teeth be extracted and replaced with dentures." American and English
researchers noted that the prevalence of dental fluorosis appears to be on the
increase. "Although in its mild form the condition is not considered to be of
cosmetic significance, the more severe forms can cause great psychological
distress to the affected individual."70. An Australian Health Department study
analyzed society's perceptions of dental fluorosis, based on over 3,000
responses. Lay and professional observers recognized that higher degrees of
fluorosis increasingly embarrass the child. All observers, except the dentists, felt
that the more severe fluorosis indicated neglect on the part of the child71.
Egyptian researchers observed that friends and relatives ridicule the patient by
inferring that these stains are associated with smoking and/or poor oral hygiene.
They noted that such personal remarks lead to severe depression72.
2.3.2.5. EPIDIMIOLOGY OF DENTAL FLUOROSIS
There is a growing body of evidence, which indicates that, the prevalence and
severity of dental fluorosis is increasing in all regions of the world2 as a
consequ~nce of increased fluoride intake through multiple sources. The
27

relationship between prevalence of dental fluorosis and concentration of fluoride
in water is well established and documented11,47. It has been observed that
children and adolescents aged 8-16 years are more susceptible to dental caries
as approximately 80% of absorbed fluoride is retained in young children
compared to 50% in adults73. According to the Indian health survey data of
fluorosis from nine states, the percentage of children between 6-14 years of age
affected by dental fluorosis was in the range of 5-20%. Also, the affected adults,
without any gender difference was 2-30%4.Some studies in India showed 100%
prevalence of dental fluorosis at a fluoride level of 3.4 to 3.8 ppm74,. The
observations by Wang et al are unique as it reported that the development of
dental fluorosis was not affected by the level of arsenic in water. Also, fluoride
was observed exerting dental fluorosis (14%) at 0.2 ppm in drinking water. At a
fluoride concentration of 3.5 ppm, over 90% of children of the age group 8-15
years, developed dental fluorosis, irrespective of arsenic level in the water75.
A significant dose-response relationship between fluoride in water and
prevalence of dental fluorosis was identified by univariate regression analysis
through a systematic review by McDonagh et al. after analyzing 88 studies
(mainly cross-sectional) from 30 countries47. The prevalence of dental fluorosis at
a water fluoride level of 1 ppm was estimated to be 48% in fluoridated areas and
15% in non-fluoridated areas. Limiting consideration to aesthetically important
levels of severity, the prevalence of fluorosis is 12.5% in fluoridated areas and
28

6.3% in non-fluoridated areas. Also, results show that there are relatively large
differences in the prevalence of dental fluorosis at the level of water fluoridation
0.7-1.2 ppm when compared with an area with theoretical low water fluoride
content (0.4 ppm). Increasing the level of water fluoride concentration from 0.4
ppm to a slightly higher figure of 1.0 ppm, would lead to one extra person with
dental fluorosis for every 6 people receiving the new higher level of water
fluoride. The difference between the proportions of population affected with
fluorosis of aesthetic concern at 0.4 ppm compared with 0.7 ppm is considerably
lower than the difference in the proportion comparing 0.4 to 1.0 ppm and 1.2
ppm. Increasing the water fluoride level from 0.4 to 1.0 ppm, would mean that
one additional person for every 22 people would have fluorosis of aesthetic
concern, but with no risk. The level of evidence clearly demonstrated that benefit
of reduction in caries due to fluoride should be, and can only be, considered
together with the increased prevalence of dental fluorosis47. Another finding by
Mcdonagh et al. is that there is no statistically significant difference between
artificially fluoridated and naturally fluoridated water though there is inadequacy
of data to make a detailed comparison.
2.3.2.6. MEASUREMENT OF DENTAL FLUOROSIS
Several indices have been used to describe the clinical appearance of dental
fluorosis. The three principal indices in use today are those developed by Dean
29

[1934f6.77
, Thylsirup and Fejerskove [1978f8, and Horowitz et al [1984f9. A
recent index developed by Pendrys [1990] is Fluorosis Risk Index80. Dental
mottling due to fluoride toxicity can be classified as:
Grade 1- white opacities, faint yellow line;
Grade 2- changes of grade 1+ brown stain;
Grade 3- brown line, pitting and chipped off edges;
Grade 4- brown black and fall of teeth.
Dean's index is popularly accepted as a standard for the assessment of dental
f1uorosis81. Grading of dental fluorosis by Dean's index is as below:
Criteria Description of enamel
NormalSmooth, glossy, pale creamy-white translucent
surface
Questionable A few white flecks or white spots
Very MildSmall opaque, paper white areas covering less than
25% of the tooth surface
MildOpaque white areas covering less than 50% of the
tooth surface
ModerateAll tooth surfaces affected, marked wear as biting
surfaces, brown stain may be present
All tooth surfaces affected, discrete or confluentSevere pitting, wide-spread brown stains, teeth often
appear corroded
30

In order to compare the severity and distribution of dental fluorosis in various
communities, Dean developed an epidemiological index, according to which each
tooth is allotted a score which is given a corresponding weighting:
0- normal
2- very mild
4- moderate
o 1- questionable
1.0 3- mild
3.0 5- severe
0.5
2.0
4.0
On the basis of the number and distribution of the individual scores a
Community Index of Dental Fluorosis (Fei) could be calculated82•
Number of individuals X statistical weight
Total number of individuals examined
Example:
Number of persons Score Sum of statistical weight
50 0 0
25 0.5 12.5
15 1 15
10 2 20
5 3 15
5 4 20
Total-110 82.5
82.5/110 = 0.75
31

Dean stated that "For public health administrative guidance a community
index of dental fluorosis of 0.4 or less is of no concern from the standpoint of
mottled enamel per se; when however, the index rises above 0.6 it begins to
constitute a public health problem warranting increasing consideration" 82 .
2.4. SKELETAL EFFECTS OF FLUORIDE
Skeletal fluorosis is an excessive accumulation of fluoride in bone associated
with increased bone density and outgrowths (exostoses)11, Fluoride incorporated
into bone (Le., as fluorapatite) produces a crystal lattice that undergoes less
resorption (Le., less soluble; more stable) and has an increased compression
strength, but is more brittle and has a decreased tensile strength83. Characteristic
signs and symptoms of skeletal fluorosis range from asymptomatic radiographic
enlargement of spinal trabeculae in the preclinical form to the severe calcification
of ligaments, spine and joint deformities, muscle wasting and neurological
defects observed in crippling skeletal fluorosis. The more severe symptoms tend
to be associated with the vertebral column in the lower, weight-bearing parts of
the body84,
Endemic skeletal fluorosis is known to occur with a range of severity in
several parts of the world, including India, China and northern, eastern, central
and southern Africa. It is primarily associated with the consumption of drinking
water containing elevated levels of fluoride but exposure to additional sources of

fluoride such as burning coal containing high fluoride is also potentially important.
This is compounded by a number of factors which include climate, related to
water consumption, nutritional status and diet, including additional sources of
fluoride and exposure to other substances that modify the absorption of fluoride
into the body85. Evidence from occupational exposure also indicates that
exposure to elevated concentrations of fluoride in the air may also be a cause of
skeletal fluorosis11.
Other than dental fluorosis, skeletal effects were the most studied potential
adverse effect of fluoride. Although there are a large number of epidemiological
studies available, the data are such that it is difficult to determine a clear
exposure-response relationship. One possible feature of fluorosis is bone
fracture, although some studies have reported a protective effect of fluoride on
fracture. In an epidemiological study in China the relationship between fluoride
intake via drinking water and all other sources, and all fractures, followed a U
shaped dose response with higher rates of fracture at very low intakes below
0.34 mg 1-1 and high intakes above 4.32 mg 1-1 (total intake 14 mg per day)86. It
was concluded by the International Programme on Chemical Safety that for a
total intake of 14 mg per day there is a clear excess risk of skeletal adverse
effects and there is suggestive evidence of an increased risk of effects on the
skeleton at total fluoride intakes above about 6 mg per day11.
2.5. OTHER FLUORIDE INDUCED ADVERSE EFFECTS
Apart from teeth and bones, the interaction and involvement of soft tissues,
organs and other systems of the body with fluoride leads to non-skeletal
fluorosis. The skeletal muscles, erythrocytes, gastro-intestinal mucosa,
ligaments, spermatozoa and thyroid glands will be affected or damaged.
Destruction of actin and myosin filaments in the muscle tissues due to fluoride
ultimately leads to depletion of muscle energy. So, it is evident that the skeletal
muscle is directly involved in fluorosis. This is the main reason for muscle
weakness and corresponding loss of muscle energy in fluorosed patients, which
renders them unfit for normal routine activities4.
Of late, numerous epidemiological and experimental studies in many
countries have attempted to address the growing concern related to the
relationship between consumption of drinking water with fluoride and morbidity or
mortality due to cancer. A positive correlation between water fluoridation and
increased cancer risk was first suggested by Yiamouyiannis and Burk8?, but
many subsequent reviews have not accepted these findings88. Positive
correlations were also reported by different studies citing statistically significant
associations between fluoridation index and cancer90-91
. From among these
studies the observation of a dose-response trend in the occurrence of
osteosarcomas in male rats91 deserves special significance as the occurrence of
34

a rare tumor in the tissue in which fluoride is known to accumulate cannot be
casually dismissed. 11
In contrast, ecological studies by Hoover et al92 (including 1,25,000 incident
cancers and 2.3 million cancer deaths, with follow-up for up to 35 years of
fluoridation) and Freni et al93 suggested no correlation between cancer and
fluoridation. The reports from Centre for Disease Control in 1999 concluded that
studies to date have produced no credible evidence of an association between
fluoridated drinking water and an increased risk for cancer43,44. In their
exhaustive systematic review, McDonagh et al.47 analyzed 26 studies looking at
the association of a broad number of cancer incidence with water fluoride
exposure, including 12 studies comparing artificially fluoridated areas with areas
having low natural fluoride level. Using 'the best available evidence,' no
statistically significant association between water fluoridation and cancer
incidence (irrespective of whether is artificially or naturally fluoridated) could be
found out. Also, it was pointed that the reported studies were inadequate on
cancer incidence and mortality reporting using natural source of fluoride. It is
cautioned that studies in this area should be of higher quality which should
address and use appropriate methods to control for confounding factors. The
general conclusion by different reputed organizations including WHO is that 'the
weight of evidence' does not support the hypothesis that fluoride causes cancer
in humans and many of the findings suggesting a correlation suffers from

methodological flaws11,86. Although most of the ecological studies performed in
many countries do not support the hypothesis of an association, their
considerable limitations preclude firm conclusions from being drawn regarding
the carcinogenicity of fluoride in humans11.
The gastrointestinal system is one of the most sensitive systems in the body
to react adversely to fluoride toxicity. Symptoms of gastric irritation, such as
nausea, vomiting, and gastric pain, have been observed shortly after exposure to
fluoride in drinking water94. The early warning signs of fluoride toxicity also
include loss of appetite, gas formation and nagging pain in stomach, chronic
diarrhea, chronic constipation and persistent headache. Unusual fatigue, loss of
muscle power and weakness, excessive thirst and frequent urination, depression,
tingling sensation in fingers and toes, allergic manifestations are also reported.
The irritation of the gastric mucosa is attributed to fluoride forming hydrofluoric
acid in the acidic environment of the stomach95.
Susheela and Jethanandani observed significant reduction in serum
testosterone levels in persons diagnosed with skeletal fluorosis96. Fluoride can
cause pathological changes like lipid peroxidation and DNA damage in human 97
and is also reported to suppress the immune system98. Though some genotoxic
effect cannot be excluded, the overall evidence has not established that fluoride
36

is genotoxic nor allergetic in humans99. The review by McDonaugh et al. also
found no evidence of reproductive toxicity in humans due to fluoride.
2.6. EFFECT OF NUTRITIONAL FACTORS ON FLUOROSIS
The research in India provides ample evidence on the critical role of
malnutrition and poverty on the incidence and severity of fluorosis. Comparison
of dietary adequacy, water fluoride levels, and incidence of skeletal fluorosis in
several villages in India suggest that vitamin C deficiency and poor nutrition play
a major role in fluorosis100. 'Genu valgum' is more predominant in children poorly
nourished with low calcium intake in endemic areas of fluorosis101.
Chen et al. studied the fluoride intake, diet, and health status of children in
two dental fluorosis-afflicted areas in the Province of Jiangxi, China102. Average
body weight of the children approximated that of the national standard. Protein
intake was above the national standard of 0.75 g/kg body weighUday, but the
protein was derived mainly from plant sources. Calcium intake was found to be
insufficient. Based on the diet and fluoride intake of the studied groups, the areas
with a better nutritional status were found to have a lower incidence of dental
fluorosis. The incidence among milk-consuming children was lower than that of
non-milk consuming children.
The enamel and dentin of teeth from individuals in Delhi and Bombay had a
much higher fluoride content than would be expected in view of the low fluoride
3f7

content of water supplies in these communities. The fluoride value of the enamel
and dentin of Boston teeth were in the same low range as has been reported for
the teeth of individuals in other low-fluoride communities in the temperate zone.
Only part of the difference in fluoride content between teeth of Boston individuals
and those of Delhi and Bombay can be explained by the probable higher water
consumption among the Indian citizens. The remainder of the difference would
appear to be due to an additional source of fluoride in diet with sea salt as a
logical possibility or to a higher rate of absorption and utilization of the ingested
fluoride or combination of these two factors103.
Chan JT et al have demonstrated that the incidence of dental fluorosis has
increased during the past decade. Greater availability and use of f1uoride
containing gels, mouth rinses, dentifrices, etc., improper prescribing of fluoride
supplements and ingestion of fluoride dentifrice by some children are some of the
suggested determinants of dental fluorosis. However, based on the increase in
consumption of tea, coffee, and other caffeine-containing beverages by the
children, and the augmentative effect of caffeine on fluoride bioavailability, they
theorized that the rise in incidence of dental fluorosis in North America is mainly
due to the replacement of water intake by caffeine-containing beverages among
the young population104.
38

2.7. GENETIC DETERMINANTS OF FLUOROSIS
Everett et al. hypothesized that genetic determinants influence an individual's
susceptibility or resistance to develop dental fluorosis. They tested this
hypothesis using a mouse model system (continuous eruption of incisors) where
genotype, age, gender, food, housing and drinking water fluoride can be
rigorously controlled. Examination of 12 inbred strains of mice showed
differences in dental fluorosis susceptibility/resistance. The AlJ strain mice is
highly susceptible, with a rapid onset and severe development of dental fluorosis
compared with that in the other strains tested, whereas the129P3/J mouse strain
is least affected, with minimal dental fluorosis. These observations support the
contribution of a genetic component in the pathogenesis of dental fluorosis105.
In a recent study from Russia, the phenotype frequency distributions of
several classical blood genetic markers were analyzed in workers of Siberian
aluminum plants who had occupational fluorosis. Comparison with healthy
workers revealed significant differences in frequencies of several markers in
fluorosis victims. The researchers concluded that Phenotypes B (ABO), D (Rh),
MN (MN), P1 (P), Le a (Lewis), Gc 2-1, Cx (on both hands), Th/I+ (on the left
hand), C3, and C4 (HLA) were associated with higher risk of occupational
fluorosis106.
39
3. FLUOROSIS AND ALTITUDE
Asoku et al. in their study "Risk factors associated with dental fluorosis in
Central Plateau State, Nigeria" explains that the fluorosis prevalence was
significantly associated with altitude. The occurrence of dental fluorosis in Central
Plateau could be because of the high altitude of the area and the fluoride
concentration of the water consumed in the district107.
Pantio et al determined the prevalence and severity of dental fluorosis in
Mexican adolescents. A cross sectional epidemiological study was carried out in
1024 adolescents residing in three naturally fluoridated areas at high altitudes
above sea level. A relationship between fluoride concentration in water in each
community and fluorosis was observed. The high fluorosis prevalence and
severity might possibly be associated with the high altitude of the communities108.
Previous studies have reported higher dental fluorosis prevalence in high
altitude communities than in low altitude communities. This investigation
determined and compared dental fluorosis prevalence in populations of children
living at high and low altitudes in Mexico. The results led to the conclusion that
the difference in fluorosis prevalence in Mexico City and Veracruz could not be
explained by differences in fluoride content of the salt or water samples, self
reported exposure to fluorosis risk factors or estimated fluoride intake109.
40

4. TEMPERATURE AND FLUORIDE INGESTION
According to Galagan et al. the single most important factor determining
the amount of water consumed is the maximum daily temperature in the area
concerned. Roughly, there seems to be an inverse relationship between the
amount of water consumed and the distance from the equator. Failure to make
adjustment in water fluoride level for this factor may result in a higher prevalence
of fluorosis11o. The relationship between fluoride levels, fluorosis and temperature
is depicted in figure 2.
Obj(:""Ctionable fluorosisFluoride removal indicated
•
••
Mean annual temperatures• approximately rOOF• approximately 50°F
1.2
.. 1.Q;-0.=on
~O.o
.:2.....·fo.(:)f---------------------:::::::oo-""'------~°O.4j··I-----~-----_=::::::_"'~--------------
0.7
•: .~------ .
• •
Negative
o 1.6 1.8 20
Figure 2
Relationship between fluoride levels, fluorosis and temperature (USPHS)
41

5. WATER HARDNESS AND FLUOROSIS
Water hardness is the traditional measure of the capacity of water to react
with soap, hard water requiring a considerable amount of soap to produce lather.
Scaling of hot water pipes, boilers, and other household appliances is due to
hard water. Water hardness is caused by dissolved polyvalent metallic ions. In
fresh water, the principal hardness-causing ions are calcium and magnesium; the
ions strontium, iron barium and manganese also contribute111•
Hardness is usually measured by the reaction of the polyvalent metallic
ions present in a water sample with a chelating agent such as EDTA and is
expressed as an equivalent concentration of calcium carbonate. Hardness may
also be estimated by determination of individual concentrations of the
components of hardness, their sum being expressed in terms of an equivalent
quantity of calcium carbonate. The degree of hardness of drinking water has
been classified in terms of its equivalent CaC03 concentration as follows:
Soft 0-60 mg/litre
Medium hard 60-120 mgllitre
Hard 120-180mgllitre
Very hard 180 mgllitre and above
It is generally observed that fluoride containing water is usually soft with
lesser calcium content and with high alkalinity. Fluoride concentration of even
42

less than 1ppm along with high alkalinity of more than 300 mg II was found to be
associated with 10 per cent dental fluorosis in Punjab112.
7. GLOBAL SCENARIO OF FLUOROSIS
GLOBAL FLUORIDE MAP
[] Denial or skeletalfluorosis reported
D No data$OUTHAFRICA
Figure 3. Global Fluoride Map
(WHO Fluoride and arsenic in drinking water 2005)
Fluorosis is endemic in many parts of the world and its severe form, skeletal
• fluorosis have been reported world wide2. Belyakova and Zhavoronkov
suggested that fluorosis might be one of the most widespread of endemic health
43

problems associated with natural geochemistry113. As per the latest statistics,
fluorosis relics as an endemic public health problem in at least 25 nations around
globe. Ground water with high fluoride occurs in large parts of Africa, China, the
Middle East and southern Asia (India and Sri Lanka). One of the best known high
fluoride belts on land extends along the East African Rift from Eritrea to Malawi.
There is another belt from Turkey through Iraq, Iran, Afghanistan, India, northern
Thailand and China. The Americas and Japan have similar belts114.
The intensity of fluorosis problem is very badly felt in the two heavily
populated countries of the world, India and China2. In 1995, one tenth of the
population of China has been exposed to endemic fluorosis. It has been
estimated that over 26 million people in China suffer from dental fluorosis due to
elevated fluoride in their drinking water, with a further 16.5 million cases of dental
fluorosis resulting from coal smoke pollution 115. Wang et al. reported the highest
level of fluoride in well water as 21.5 ppm in the low-lying land of Zhuiger Basin in
the Kuitun area of China in 1997116. High fluoride concentrations in groundwater
are reported from United States of America in the hot springs and geysers in
Yellowstone National Park having 25-50 ppm, deep aquifers of Western US with
5-15 ppm and Southern California Lakeland having 3.6-5.3 ppm117. In Mexico, 5
million people (about 6% of the population) are affected by fluoride in
groundwater107. Throughout Canada, there are a number of communities whose
sources of drinking water contain elevated levels of fluoride (as high as 4.3 ppm)
44
from natural sources. Poland, Finland and the Czech Republic have levels of
fluoride in drinking water as high as 3 ppm. In Ethiopian Rift Valley, fluoride
concentrations in the range of 1.5 to 177 ppm are reported. The other worst
affected areas include the arid parts of northern China (Inner Mongolia), African
countries like Ivory Coast, Senegal, North Algeria, Uganda, Ethiopia, Northern
Mexico and Argentina118.
Nearly 25% of the population in the developing world still does not have
access to safe source of water. The excess fluoride in groundwater adds much to
this tragedy. Tanzania, covering some of the highly fluorotic rift valley areas, is
one of the most severely fluoride affected countries in the world. The water is
found having fluoride concentration in the range of 8.0-12.7 ppm in various
seasons, inducing fluorosis in acute proportions. In many fluorotic areas, people,
children in particular, are facing mobility difficulties due to crippling skeletal
fluorosis119.
INDIAN SCENARIO
Endemic fluorosis remains a challenging and extensively studied national
health problem in India. In 1991, 13 of India's 32 states and territories were
reported to have naturally high concentrations of fluoride in water, but this had
risen to 20 by 20044. The most seriously affected areas are Andhra Pradesh,
Punjab, Haryana, Rajasthan, Gujarat, Tamil Nadu and Uttar Pradesh. The
45

highest concentration observed to date in India is 48 ppm in Rewari District of
Haryana. The high concentrations in groundwater are a result of dissolution of
fluorite, apatite and topaz from the local bedrock. Handa (1975) noted the
general negative correlation between fluoride and calcium concentrations in
Indian groundwater12o.
NO DATA
40 - 70 %
01 - 40 %
OISTRI CTS AFFEC TEO
70-100%
Fluoride Map of India
(Susheela AK: A Treatise on Fluorosis 2nd ed. 2003.)
46

The problem of fluorosis has been known in India for a long time. The
disease, earlier called "mottled enamel" was first reported by Viswanadhan to be
prevalent in human beings in Madras Presidency in 1933121. However Shortt
(1937) was the first to identify the disease as fluorosis in human beings in Nellore
district of Andhra Pradesh122.
According to a study conducted in various places in India, a statistically
significant increase in the prevalence of dental fluorosis was found: (a) with
higher levels of fluoride in drinking water, (b) with rise in age, peak being found at
15 to 19 years of age group, and (c) amongst the bonafide residents of the area.
A significant positive correlation was found between fluoride in drinking water and
community fluorosis index 123.
A study conducted in Delhi reveals the prevalence of skeletal and non
skeletal manifestations of fluorosis in 36 patients investigated at the All India
Institute of Medical Sciences. In the study area covering 1485 sq. km with a
population of 9 million, people consumed water naturally contaminated with
fluoride up to 32.46 ppm 124.
An epidemiological survey carried out by Chakma et al. in a village of Mandla
district of Madhya Pradesh revealed high prevalence of dental fluorosis (74.4%)
and genu valgum (51.1%) among the subjects below 20 years (Genu valgum is
the skeletal deformity leading to nock knee). The fluoride content of the water
47

used from the deep bore wells was ranged from 9.22 to 10.83ppm. The depth of
the bore wells ranged from 37meters to 43meters as per the records of the Public
Health Engineering Department, Mandla125.
Rajasthan is one of the worst affected states in India. More than 50% of
districts are with high fluoride in drinking water. According to a study conducted
by Choubisa et ai, out of 978 children and 1305 adults, 312 (31.9%) and 436
(33.4%) were affected with dental fluorosis with varying grades. Most of the
adults suffered from diffused type ofdental fluorosis. There was not remarkable
difference in the prevalence of fluorosis in both sexes and between children and
adults. The prevalence of dental fluorosis increased proportionately with increase
in fluoride concentration in water. A heterogeneous fluoride distribution in the
range of 0.2 to 5.5 mg/L has been observed in the villages surveyed 126.
A study conducted in school children in Rajura Taluk of Chandrapur district in
Maharashtra showed that the people in that area appear at risk for fluorosis. The
water fluoride level of 20 ppm from the village of Dhoptala is the highest reported
fluoride concentration in drinking water in Maharashtra 127.
Gopalakrishnan et al. estimated that the overall prevalence of dental fluorosis
among children in the age group of 10-15 years in Ambalappuzha Taluk of
Alappuzha District in Kerala was 35.64%. The prevalence was higher in urban
area (55.28%) compared to that in rural area (16.84%) and in girls (39.21%)
48
compared to boys (31.25%). The main risk factor associated with prevalence of
dental fluorosis was high fluoride content in drinking water 9.
Karthikeyan et al had conducted water analysis from 255 villages in the
Krishnagiri revenue block of Tamil Nadu in South India for fluoride and other
water quality parameters. The results of chemical analysis showed that 39
villages of only 3 Panchayaths, namely Mallinayanapalli, Periyamuthur and
Kallukuruki contained water sources having fluoride within the tolerable limits.
The remaining 84.7% had their drinking water sources contaminated with
excessive fluoride. Eleven Panchayats had fluoride in the range between 1
2ppm, seven Panchayats had 2-3ppm, three Panchayats had 3-4ppm and five
had 4-5.1 ppm 128.
Choubisa in his study "Endemic fluorosis in southern Rajasthan, India"
shows that the chronic fluoride intoxication in the form of osteo-dental fluorosis
was investigated in 21 villages of Banswara, Dungarpur and Udaipur districts of
southern Rajasthan, where fluoride concentrations in drinking water range from
1.5 to 4.0ppm. Interestingly, a variable prevalence of fluorosis was observed in
villages having almost the same fluoride concentrations. At 1.5ppm, 21.3, 25.6
and 38.9% of children and 33.3, 36.9 and 44.8% of adults in different villages of
these districts were found to be affected with dental fluorosis. The maximum
prevalence of dental fluorosis is (77.1%) was found in the 17-22 year age group.
49

No significant correlation was found between prevalence figures and gender. At
the 1.5ppm fluoride concentration, 6.1, 6.8, and 9.5% of adults in villages of
Banswara, Udaipur and Dungarpur districts, respectively showed evidence of
skeletal fluorosis129.
Khandare et al. studied the effect of tamarind ingestion on fluoride excretion.
20 healthy boys were included in the study and 18 completed the study. Each
subject consumed 10gm of tamarind daily with lunch for 18 days at a Social
Welfare Boys Hostel in Nalgonda and R R Districts of Andhra Pradesh. Tamarind
intake led to significant increase (p = < 0.001) in the excretion of fluoride in 24
hours urine (4.8±0.22mg/day) as compared to excretion on control diet
(3.5±0.22mg/day). Tamarind intake is likely to help in delaying progression of
fluorosis by enhancing urinary excretion of fluoride130.
Sharma S K had studied the water fluoride content of 9 States in India viz:
Jammu and Kashmir, Himachal Pradesh, Rajasthan, haryana, Bihar, West
Bengal, Chattisgarh, Orissa and Maharashtra. The surface, subsurface and
thermal water sample analysis indicate that fluoride concentration ranging from
<0.2 to 18ppm in the States of Jemmu and Kashmir, <0.2 to 6.5 in Himachal
Pradesh, <1.5ppm in Rajasthan,0.2 to 0.6 in Haryana, 0.35 to 6.0 in
Maharashtra, indicating that except in Haryana, the concentration of fluoride is
very high up to 20ppm. 131
50
Chandrasekhar et al. have assessed the prevalence of dental fluorosis and
its relationship with fluoride levels in drinking water in 12 villages of Davangare
district of Karnataka state in India. The study group consisted of 1131 school
children in the age group of 12 - 15 years. The prevalence of dental fluorosis
ranged from 13.2% to 100% at a water fluoride level of 0.22ppm to 3.41 ppm132.
An investigation was undertaken in six endemic villages of Mundargi Taluk of
Gadag district and two of Hungund Taluk of Bagalkot district to assess the
clinical symptoms of both dental and skeletal fluorosis and in turn to find out the
severity of the disease. Among the 832 subjects (532 and 300 from Mundargi
and Hungund Taluk respectively) surveyed, 328 (61.65%) and 194 (64.67%)
patients exhibited the symptoms of either dental or skeletal or both types of
fluorosis. The fluoride content in drinking water of Mundargi Taluk ranged from 4
to 10.5ppm, while that of Hungund Taluk ranged from 2.04 to 3.2ppm 133.
Tamil Nadu is one of the seven southern states of India having 10 out of the
29 districts affected with fluorosis. A cross sectional study was conducted by the
authors in 13 selected villages of five contiguous north western districts of Tamil
Nadu viz: Vellore, Dharmapuri, Krishanagiri, Salem and Erode to assess the
prevalence of fluorosis adopting stratified random sampling procedure. A total of
8700 individuals including 1745 children in the age group of 5-14 years were
examined. Community bore well formed the major source of drinking water and
51

the mean fluoride content of water was found to be more than the WHO cut of
level of 1.5ppm in seven of the 13 villages. The prevalence of dental fluorosis
was high among the total population in the district of Dharmapuri (36%),
Krishnagiri (24%) and Salem (33%), where the mean fluoride levels were 2.7,2.2
and 1.2ppm respectively. The prevalence of dental fluorosis was still high among
children134 in the above three districts (53%, 43%, and 42% respectively).