REVIEW OF DEDICATED LOW-COST AIRPORT PASSENGER FACILITIES · Review of Dedicated Low-Cost Airport...
43
REVIEW OF DEDICATED LOW-COST AIRPORT PASSENGER FACILITIES FINAL REPORT Prepared for Commission for Aviation Regulation Dublin, Ireland 11 TH MAY, 2007
Transcript of REVIEW OF DEDICATED LOW-COST AIRPORT PASSENGER FACILITIES · Review of Dedicated Low-Cost Airport...

REVIEW OF DEDICATED LOW-COST AIRPORT PASSENGER FACILITIES
FINAL REPORT Prepared for
Commission for Aviation Regulation Dublin, Ireland
11TH MAY, 2007

Review of Dedicated Low-Cost Airport Passenger Facilities, Final Report, 11th May, 2007 i
DOCUMENT CONTROL SHEET
Client: Commission for Aviation Regulation
Project: Review of Dedicated Low-Cost Airport Passenger
Facilities Job No: JC27014A
Title: Final Report
Prepared by Reviewed by Approved by
Name Name Name ORIGINAL
DARRELL SWANSON PETER MACKENZIE-WILLIAMS
ANDY CARLISLE ANDY CARLISLE
Date
12.03.07
Signature
Darrell Swanson Peter Mackenzie-Williams
Signature
Signature
Path and Filename C:\Documents and Settings\TEMP\Local Settings\Temporary Internet Files\OLK1BB\CAR LCC Benchmarking Draft Final Report
03-05-07.doc
Prepared by Reviewed by Approved by
Name Name Name REVISION
PETER MACKENZIE-WILLIAMS ANDY CARLISLE ANDY CARLISLE
Date
04.05.07
Signature
Peter Mackenzie-Williams
Signature
Signature
Path and Filename
Prepared by Reviewed by Approved by
Name Name Name FINAL
DARRELL SWANSON ANDY CARLISLE ANDY CARLISLE
Date
11.05.07
Signature
Darrell Swanson
Signature Signature
Path and Filename
This report, and information or advice which it contains, is provided by Jacobs Consultancy solely for internal use and reliance by its Client in performance of Jacobs
Consultancy 's duties and liabilities under its contract with the Client. Any advice, opinions, or recommendations within this report should be read and relied upon
only in the context of the report as a whole. The advice and opinions in this report are based upon the information made available to Jacobs Consultancy at the date
of this report and on current UK standards, codes, technology and construction practices as at the date of this report. Following final delivery of this report to the
Client, Jacobs Consultancy will have no further obligations or duty to advise the Client on any matters, including development affecting the information or advice
provided in this report. This report has been prepared by Jacobs Consultancy in their professional capacity as Consultants. The contents of the report do not, in any
way, purport to include any manner of legal advice or opinion. This report is prepared in accordance with the terms and conditions of Jacobs Consultancy 's contract
with the Client. Regard should be had to those terms and conditions when considering and/or placing any reliance on this report. Should the Client wish to release
this report to a Third Party for that party's reliance, Jacobs Consultancy may, at its discretion, agree to such release provided that:
(a) Jacobs Consultancy's written agreement is obtained prior to such release, and
(b) By release of the report to the Third Party, that Third Party does not acquire any rights, contractual or otherwise, whatsoever against Jacobs Consultancy
and Jacobs Consultancy, accordingly, assume no duties, liabilities or obligations to that Third Party, and
(c) Jacobs Consultancy accepts no responsibility for any loss or damage incurred by the Client or for any conflict of Jacobs Consultancy's interests arising
out of the Client's release of this report to the Third Party.

Review of Dedicated Low-Cost Airport Passenger Facilities, Final Report, 11th May, 2007 ii
EXECUTIVE SUMMARY
Jacobs Consultancy UK Limited (JC) is pleased to submit this report to the Commission for Aviation
Regulation on a review of the recent development of dedicated ‘low cost’ passenger terminal facilities at
certain airports.
The evolution of the low cost airline has seen these operators seeking to reduce their overall operating
costs through redefining the passenger service and experience provided. The service is based on the basis
delivering a lower fare through a lower frills service to stimulate demand. Given the focus on low fares,
the airlines have therefore sought to minimise their cost base and in many cases operate out of regional
airports where fast turnaround times can be achieved and low airport charges provided. However as the
market has evolved, low cost carriers are increasingly serving main airports and as such are beginning to
exert pressure on their respective airports to reduce operating costs at the airport. Although airports have
adopted incentive mechanisms to promote growth, they are beginning to reflect the changing market base
in the provision of new capacity. As such the concept of dedicated low cost facilities, specifically designed
for certain airlines or class of carriers is beginning to emerge.
The context for the review is the current re-appraisal of airport charges at Dublin Airport and the
impending development of Terminal 2. The Commission wishes to gain a better understanding of what
other airports are doing in terms of providing low cost terminal building facilities for low cost carriers.
The purpose of this report is therefore to review such developments at identified airports to better
understand the design and operating characteristics and the resultant impact on airline charges. As agreed
with the Commission the following airports with dedicated low cost facilities have been identified as the
primary focus of the review:
Marseilles
Budapest International Airport
New York, JFK
Kuala Lumpur
Schiphol International Airport
Frankfurt-Hahn International Airport
The review has found that many of the airports were keen to see the growth of low costs airlines but
recognised that the current facilities provided for traditional or legacy carriers are not appropriate for low
cost airlines if the airport is to maintain competitive charges to continue attracting and supporting LCC
growth on a sustainable basis. The airports have responded by either redeveloping existing facilities (old
cargo buildings or dilapidated terminals) or building new facilities.
Review of Dedicated Low-Cost Airport Passenger Facilities, Final Report, 11th May, 2007 iii
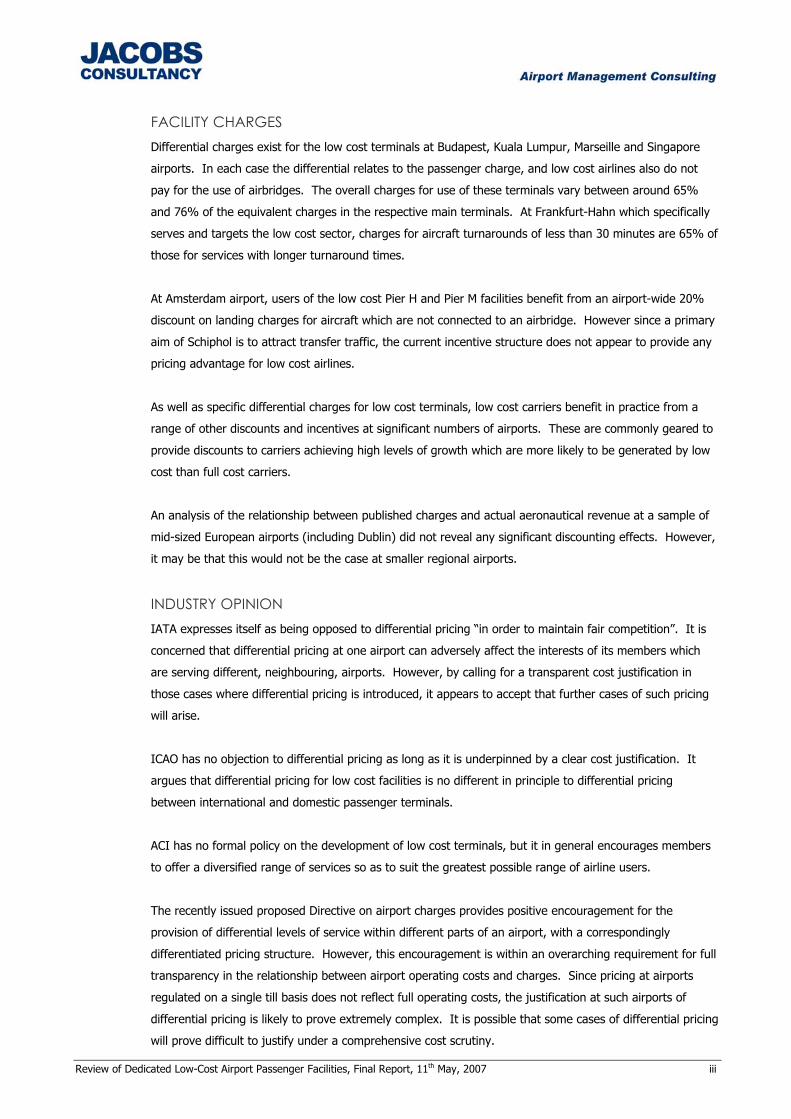
FACILITY CHARGES Differential charges exist for the low cost terminals at Budapest, Kuala Lumpur, Marseille and Singapore
airports. In each case the differential relates to the passenger charge, and low cost airlines also do not
pay for the use of airbridges. The overall charges for use of these terminals vary between around 65%
and 76% of the equivalent charges in the respective main terminals. At Frankfurt-Hahn which specifically
serves and targets the low cost sector, charges for aircraft turnarounds of less than 30 minutes are 65% of
those for services with longer turnaround times.
At Amsterdam airport, users of the low cost Pier H and Pier M facilities benefit from an airport-wide 20%
discount on landing charges for aircraft which are not connected to an airbridge. However since a primary
aim of Schiphol is to attract transfer traffic, the current incentive structure does not appear to provide any
pricing advantage for low cost airlines.
As well as specific differential charges for low cost terminals, low cost carriers benefit in practice from a
range of other discounts and incentives at significant numbers of airports. These are commonly geared to
provide discounts to carriers achieving high levels of growth which are more likely to be generated by low
cost than full cost carriers.
An analysis of the relationship between published charges and actual aeronautical revenue at a sample of
mid-sized European airports (including Dublin) did not reveal any significant discounting effects. However,
it may be that this would not be the case at smaller regional airports.
INDUSTRY OPINION IATA expresses itself as being opposed to differential pricing “in order to maintain fair competition”. It is
concerned that differential pricing at one airport can adversely affect the interests of its members which
are serving different, neighbouring, airports. However, by calling for a transparent cost justification in
those cases where differential pricing is introduced, it appears to accept that further cases of such pricing
will arise.
ICAO has no objection to differential pricing as long as it is underpinned by a clear cost justification. It
argues that differential pricing for low cost facilities is no different in principle to differential pricing
between international and domestic passenger terminals.
ACI has no formal policy on the development of low cost terminals, but it in general encourages members
to offer a diversified range of services so as to suit the greatest possible range of airline users.
The recently issued proposed Directive on airport charges provides positive encouragement for the
provision of differential levels of service within different parts of an airport, with a correspondingly
differentiated pricing structure. However, this encouragement is within an overarching requirement for full
transparency in the relationship between airport operating costs and charges. Since pricing at airports
regulated on a single till basis does not reflect full operating costs, the justification at such airports of
differential pricing is likely to prove extremely complex. It is possible that some cases of differential pricing
will prove difficult to justify under a comprehensive cost scrutiny.

Review of Dedicated Low-Cost Airport Passenger Facilities, Final Report, 11th May, 2007 iv
SUSTAINABILITY The question on the sustainability of dual pricing structures arose because of a number of acrimonious
exchanges between full cost airlines and airports which introduced dual pricing. In practice it appears that
in most cases, as long as there is a clear cost differential, dual pricing for physically separated low cost
terminals will be tolerated by full cost carriers. This position seems likely to be reinforced if the European
Directive is enacted in its current form.
The number of cases of dual pricing is relatively limited. This suggests that airports themselves may be
reluctant to introduce low cost facilities, in the light of the degradation of commercial revenues which is
likely as a result.
Overall, therefore, further cases of differential pricing are unlikely to be subject to serious resistance as
long as there is a clear underlying cost justification. It is unlikely that differentials at the airports where
they already exist will be significantly eroded.
DESIGN AND OPERATING CHARACTERISTICS We have undertaken a review of the design and operating characteristics of the selected airports with
dedicated low cost facilities. It is clear that at the moment there is no single approach.
Some facilities are the result of refurbishment of existing facilities such as at Marseilles and Budapest
whilst others are essentially dedicated facilities for certain carriers such as at Kuala Lumpur. It is of course
the case that if an airport has terminal capacity constraints, the introduction of low cost facilities is a cost-
effective means of increasing capacity which also frees up capacity in the main terminal facility for
traditional airlines. However, if the existing facility is not fully utilised, an airport can serve low cost
carriers to enhance facility utilisation at a low marginal cost. Alternatively if there is strong demand from
full service carriers the ability to redevelop remote or other facilities can sometimes be a more attractive,
cost effective and mutually beneficial option.
It is apparent however that, in general, the facilities provided are designed to operate at a lower level of
passenger service than is typically expected in more traditional facilities. Airports typically design facilities
to operate at Level of Service (LOS) C during the peak, whereas LOS D and E are more typical in the
facilities considered. Indeed Franfurt-Hahn which markets itself as a ‘real’ low cost airport adopts level of
service E for planning and design purposes consistent with the requirements of its primary customer,
Ryanair. The notable exception is the dedicated jetBlue terminal currently being developed at JFK, but the
airline is seeking to extract value through the direct provision and construction of the proposed terminal.
It believes that cost savings can be realised through controlling the design, project management and
financial funding of the terminal rather than compromising level of service. This is consistent with the
jetBlue philosophy and business model.
The table below summarises the basic design and operating characteristics of the airports considered and
the apparent differential in airline charges.

Review of Dedicated Low-Cost Airport Passenger Facilities, Final Report, 11th May, 2007 v
Summary of Low Cost Passenger Facilities and Charges
N.B. We understand that the costs expressed reflect actual construction costs at the time of completion,
see estimated year in brackets.
Abbreviations:
LOS – Level of Service
TPHP – Total Peak Hour Passengers
MPPA – Million Passengers Per Annum
LCC – Low Cost Carrier
DESIGN & OPERATING CHARACTERISTICS AIRPORT FACILITY
DESCRIPTION
CHARGES
AS % OF
MAIN
TERMINAL
COST
€ m
DESIGN
LOS
TPHP DESIGN
MPPA
No.
LCC
GROSS
AREA
m2
MARSEILLE Old Cargo Facility Refurbishment
65% 16.4
(2003)
E 900 3.5 5 7,532
BUDAPEST Terminal 1 Refurbishment
76% 35
(2005)
C – D 720 n/a 8 7,990
KL LCCT
New Terminal
Remote terminal developed for Air Asia
70% 23
(2006)
D/E N/A 10
undergoing
expansion to
15mppa
3-4 35,290
SCHIPHOL
New Pier H&M
Pier off existing terminal. Pax
processed through existing terminal
120% 30
(2005)
D - E 1200 4
(JC estimate)
8 6,150
JFK
jetBlue Terminal
Construction of new terminal focusing on old TWA terminal
N/A 600
(2007
prices)
Designed
for LOS C
at Peak
2340 15 1 58,000
HAHN Current terminal specifically developed for LCC operations
65% for
turnaround
<30 minutes
25
(1993-
2006)
E 2675 5.6 1 main
+ 2
18,500

Review of Dedicated Low-Cost Airport Passenger Facilities, Final Report, 11th May, 2007 vi
CONTENTS
1 INTRODUCTION 2
1.1 Context 2
1.2 Report Structure 2
2 FACILITIES CHARGING AND PRICING SUSTAINABILITY 2
2.1 Facility Charges 2
2.2 Airports with published dual pricing structures 2
2.3 Rebates and Reductions at Other Airports 2
2.4 Marketing support 2
2.5 Pricing Arrangements And Sustainability 2
2.6 The proposed European Directive on airport charges 2
2.7 conclusion on sustainability of dual pricing structures 2
3 DESIGN AND OPERATING CHARACTERISTICS 2
3.1 Marseille Provence mp2 2
3.2 Budapest International Airport 2
3.3 Kuala Lumpur 2
3.4 Schiphol International Airport 2
3.5 John F Kennedy International Airport 2
3.6 Frankfurt-Hahn 2

Review of Dedicated Low-Cost Airport Passenger Facilities, Final Report, 11th May, 2007 Page 1
1 INTRODUCTION
Jacobs Consultancy UK Limited (JC) is pleased to submit this report to the Commission for Aviation
Regulation on a review of the recent development of dedicated ‘low cost’ passenger terminal facilities at
certain airports.
As agreed with the Commission the following airports with dedicated low cost facilities have been
identified as the primary focus of the review:
Marseilles
Budapest International Airport
New York, JFK
Kuala Lumpur
Schiphol International Airport
Frankfurt-Hahn International Airport
While the majority of the review has been conducted from published sources, we acknowledge the help of
BAA in sourcing information for Budapest Airport.
1.1 CONTEXT
The evolution of the low cost airline has seen these operators seeking to reduce their overall operating
costs through redefining the passenger service and experience provided. The service is based on the basis
that their passengers are fundamentally interested in getting to where they want to go at the cheapest
possible price. The reduced fares offered have significantly stimulated demand and created a new low cost
market. Given the focus on low fares, the airlines have therefore sought to minimise their cost base and in
many cases operate out of regional airports where fast turnaround times can be achieved and low airport
charges provided. However as the market has evolved, low cost carriers are increasingly serving main
airports and as such are beginning to exert pressure on their respective airports to reduce operating costs
at the airport. Although airports have adopted incentive mechanisms to promote growth, they are
beginning to reflect the changing market base in the provision of new capacity. As such the concept of
dedicated low cost facilities, specifically designed for certain airlines or class of carriers is beginning to
emerge.
The context for the review is the current re-appraisal of airport charges at Dublin Airport and the
impending development of Terminal 2. Given that the majority of recent and predicted traffic growth is
related to Low Cost Carriers, the Commission wishes to gain a better understanding of what other airports
are doing in terms of providing low cost terminal building facilities for low cost carriers.
The purpose of this report is therefore to review such developments at a identified airports to better
understand both the design and operating characteristics and the resultant impact on airline charges.

Review of Dedicated Low-Cost Airport Passenger Facilities, Final Report, 11th May, 2007 Page 2
The Commission defined the scope of the review as follows, grouped into four areas.
1.1.1 FACILITIES CONTEXT
“A short account setting out how and why such a terminal came to be proposed and developed at that airport.”
1.1.2 DESIGN AND OPERATING CHARACTERISTICS
“A description of the key characteristics of the new facility, compared to other facilities at the airport, to
include: size (pax, sq. meters), IATA level of service (LOS), construction cost, airline users, and perhaps other
characteristics key to the ‘low cost’ character of the terminal;”
1.1.3 FACILITY CHARGES
“A detailed account of the airport charges policy at the ‘low cost’ and other passenger facilities at that airport
and, in particular, a measure of the overall effective price differential on a per-passenger basis between the ‘low
cost’ and other facilities at that airport.”
1.1.4 PRICING ARRANGEMENTS AND SUSTAINABILITY
“An assessment of the sustainability of the resultant airport charges regime: i.e. is there now a ‘settlement’ at
the airport whereby (sets of) airlines have selected which terminal they will use at which LoS and at which level
of charges.”
1.2 REPORT STRUCTURE
As we understand that the emphasis of the scope of work is on the pricing arrangements and
sustainability supported by an understanding of the context and physical characteristics we have organised
the report as follows.
Section 2 of the report contains our report on pricing and sustainability for low cost facilities and Section 3
outlines the rational for the facilities as well as the physical characteristics. This approach allows the
Commission to review the pricing policy for each airport and separately refer to the physical attributes to
provide an appreciation of the facilities provided relative to the pricing structure.

Review of Dedicated Low-Cost Airport Passenger Facilities, Final Report, 11th May, 2007 Page 3
2 FACILITIES CHARGING AND PRICING SUSTAINABILITY
2.1 FACILITY CHARGES
In this section we provide details of charge rates which we have identified as being set differentially for
full cost- and low cost airport facilities, and we make an illustrative comparison of total charges for an
aircraft turnaround under both charge scenarios. We provide details of other available rebates and
reductions from standard published tariffs at a wider selection of airports. We also discuss the overall
effects of discretionary pricing on aeronautical revenues at selected UK and European airports.
2.2 AIRPORTS WITH PUBLISHED DUAL PRICING STRUCTURES
As far as we have been able to determine, there are at present only four airports in the benchmark group
with a clearly defined dual pricing structure for a separate low cost terminal. These are Marseille,
Budapest, Kuala Lumpur, and Singapore. This position has been confirmed by IATA, which monitors
differential pricing by airports closely, as discussed in Section 8.2.2. In addition, service levels at one pier
at Amsterdam airport have been set in a way which is designed to be acceptable to low cost carriers, with
a corresponding price differential. The form and effect of these differentials are discussed below.
2.2.1 MARSEILLE
The low cost mp2 terminal opened in September 2006, having been converted from an existing freight
terminal. It is at present principally used by Ryanair.
Again, the pricing differential relates to the passenger charge, which at €1.30 per passenger represents a
78% discount over the €6.00 charge in the full cost terminal. Prior to the opening of the terminal there
were press reports which suggested that “other charges will be significantly lower as well”, but as far as
we can determine there is no further price differentiation. It is possible that the airport’s management
was deterred from allowing further discounts by voluble pressure from Air France.
However, as at most French airports there is a complex structure of overall charges, with landing charges
enhanced or moderated depending on aircraft noise levels, a separate noise charge, parking and boarding
bridge charges, and passenger charges which are differentiated between domestic, EU and other
international destinations. There is no security charge as such, but there is an airport tax of €6.29 per
passenger which covers various services including security. There is also a separate terminal navigation
charge.
To understand the full impact of dual pricing at all four airports, we have calculated total aeronautical
charges for a turnaround by an Airbus A319 and a Boeing 737-800, two aircraft types commonly used by
low cost carriers. Charges included are for landing, aircraft parking, all passenger related charges and
terminal navigation charges. For our calculation in this case we assume that full cost airlines park for two
hours, attracting a boarding bridge charge throughout that time and a parking charge for the second hour.
Review of Dedicated Low-Cost Airport Passenger Facilities, Final Report, 11th May, 2007 Page 4
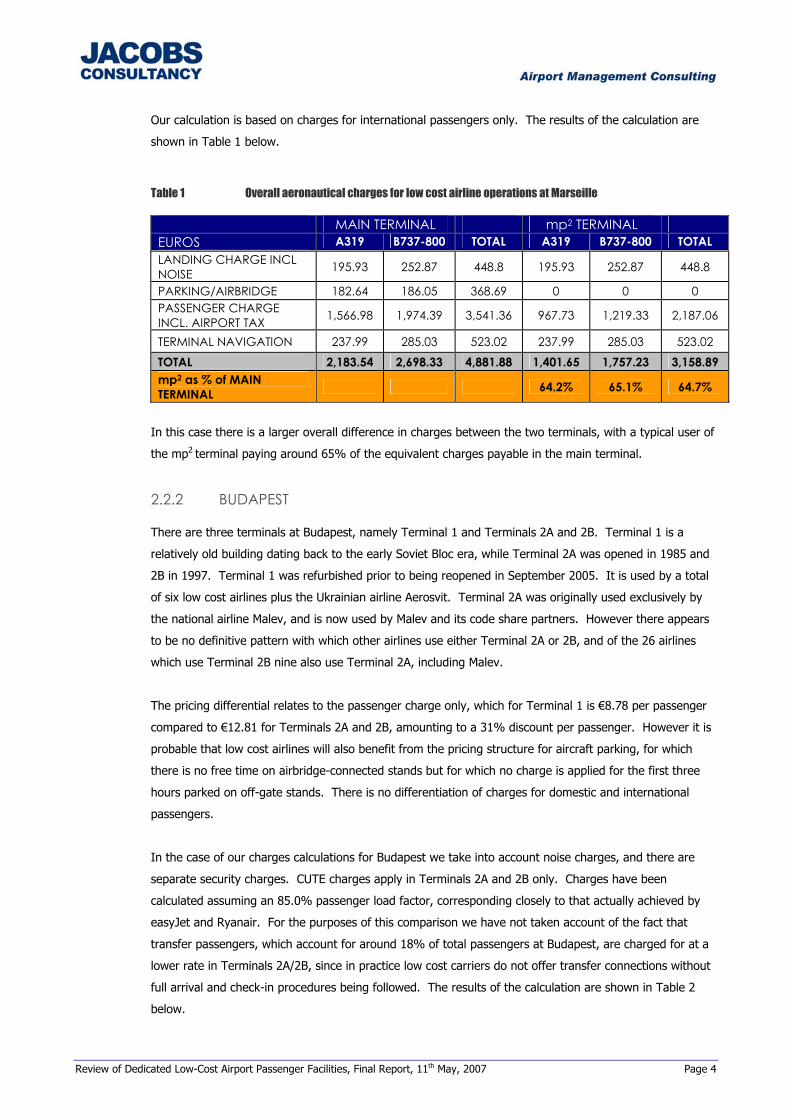
Our calculation is based on charges for international passengers only. The results of the calculation are
shown in Table 1 below.
Table 1 Overall aeronautical charges for low cost airline operations at Marseille
MAIN TERMINAL mp2 TERMINAL EUROS A319 B737-800 TOTAL A319 B737-800 TOTAL LANDING CHARGE INCL NOISE 195.93 252.87 448.8 195.93 252.87 448.8
PARKING/AIRBRIDGE 182.64 186.05 368.69 0 0 0 PASSENGER CHARGE INCL. AIRPORT TAX 1,566.98 1,974.39 3,541.36 967.73 1,219.33 2,187.06
TERMINAL NAVIGATION 237.99 285.03 523.02 237.99 285.03 523.02 TOTAL 2,183.54 2,698.33 4,881.88 1,401.65 1,757.23 3,158.89 mp2 as % of MAIN TERMINAL 64.2% 65.1% 64.7%
In this case there is a larger overall difference in charges between the two terminals, with a typical user of
the mp2 terminal paying around 65% of the equivalent charges payable in the main terminal.
2.2.2 BUDAPEST
There are three terminals at Budapest, namely Terminal 1 and Terminals 2A and 2B. Terminal 1 is a
relatively old building dating back to the early Soviet Bloc era, while Terminal 2A was opened in 1985 and
2B in 1997. Terminal 1 was refurbished prior to being reopened in September 2005. It is used by a total
of six low cost airlines plus the Ukrainian airline Aerosvit. Terminal 2A was originally used exclusively by
the national airline Malev, and is now used by Malev and its code share partners. However there appears
to be no definitive pattern with which other airlines use either Terminal 2A or 2B, and of the 26 airlines
which use Terminal 2B nine also use Terminal 2A, including Malev.
The pricing differential relates to the passenger charge only, which for Terminal 1 is €8.78 per passenger
compared to €12.81 for Terminals 2A and 2B, amounting to a 31% discount per passenger. However it is
probable that low cost airlines will also benefit from the pricing structure for aircraft parking, for which
there is no free time on airbridge-connected stands but for which no charge is applied for the first three
hours parked on off-gate stands. There is no differentiation of charges for domestic and international
passengers.
In the case of our charges calculations for Budapest we take into account noise charges, and there are
separate security charges. CUTE charges apply in Terminals 2A and 2B only. Charges have been
calculated assuming an 85.0% passenger load factor, corresponding closely to that actually achieved by
easyJet and Ryanair. For the purposes of this comparison we have not taken account of the fact that
transfer passengers, which account for around 18% of total passengers at Budapest, are charged for at a
lower rate in Terminals 2A/2B, since in practice low cost carriers do not offer transfer connections without
full arrival and check-in procedures being followed. The results of the calculation are shown in Table 2
below.
Review of Dedicated Low-Cost Airport Passenger Facilities, Final Report, 11th May, 2007 Page 5
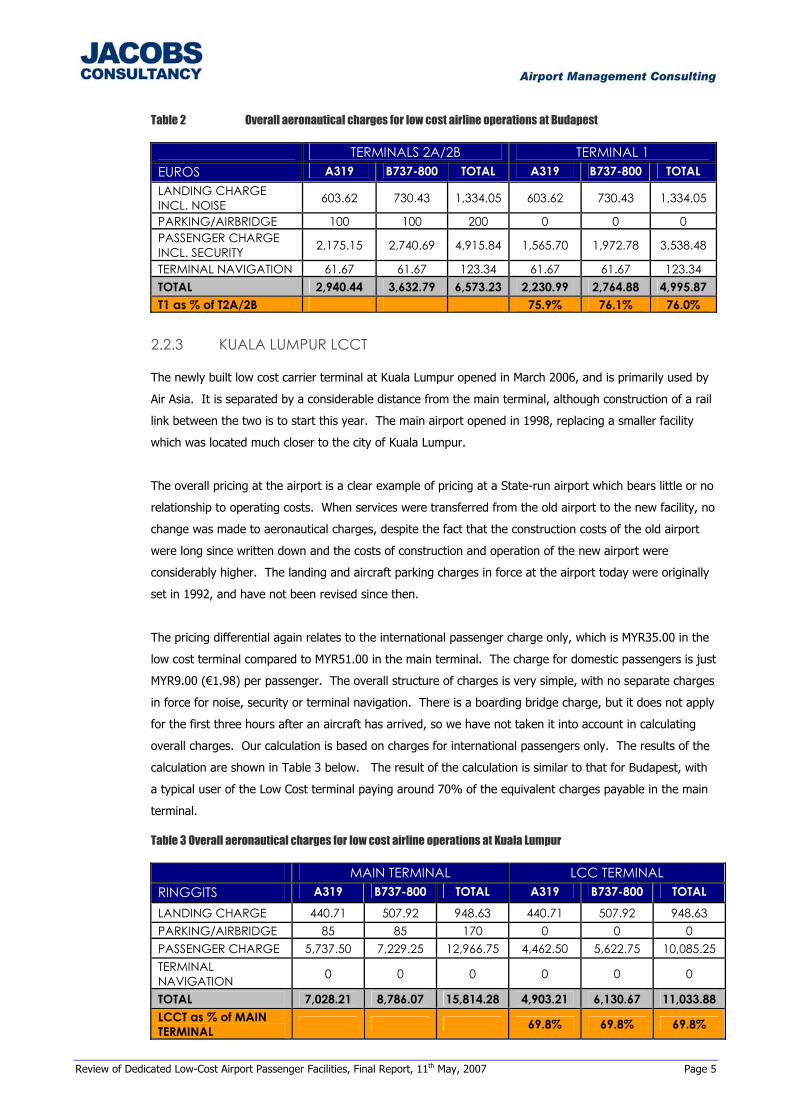
Table 2 Overall aeronautical charges for low cost airline operations at Budapest
TERMINALS 2A/2B TERMINAL 1 EUROS A319 B737-800 TOTAL A319 B737-800 TOTAL LANDING CHARGE INCL. NOISE 603.62 730.43 1,334.05 603.62 730.43 1,334.05
PARKING/AIRBRIDGE 100 100 200 0 0 0 PASSENGER CHARGE INCL. SECURITY 2,175.15 2,740.69 4,915.84 1,565.70 1,972.78 3,538.48
TERMINAL NAVIGATION 61.67 61.67 123.34 61.67 61.67 123.34 TOTAL 2,940.44 3,632.79 6,573.23 2,230.99 2,764.88 4,995.87 T1 as % of T2A/2B 75.9% 76.1% 76.0%
2.2.3 KUALA LUMPUR LCCT
The newly built low cost carrier terminal at Kuala Lumpur opened in March 2006, and is primarily used by
Air Asia. It is separated by a considerable distance from the main terminal, although construction of a rail
link between the two is to start this year. The main airport opened in 1998, replacing a smaller facility
which was located much closer to the city of Kuala Lumpur.
The overall pricing at the airport is a clear example of pricing at a State-run airport which bears little or no
relationship to operating costs. When services were transferred from the old airport to the new facility, no
change was made to aeronautical charges, despite the fact that the construction costs of the old airport
were long since written down and the costs of construction and operation of the new airport were
considerably higher. The landing and aircraft parking charges in force at the airport today were originally
set in 1992, and have not been revised since then.
The pricing differential again relates to the international passenger charge only, which is MYR35.00 in the
low cost terminal compared to MYR51.00 in the main terminal. The charge for domestic passengers is just
MYR9.00 (€1.98) per passenger. The overall structure of charges is very simple, with no separate charges
in force for noise, security or terminal navigation. There is a boarding bridge charge, but it does not apply
for the first three hours after an aircraft has arrived, so we have not taken it into account in calculating
overall charges. Our calculation is based on charges for international passengers only. The results of the
calculation are shown in Table 3 below. The result of the calculation is similar to that for Budapest, with
a typical user of the Low Cost terminal paying around 70% of the equivalent charges payable in the main
terminal.
Table 3 Overall aeronautical charges for low cost airline operations at Kuala Lumpur
MAIN TERMINAL LCC TERMINAL RINGGITS A319 B737-800 TOTAL A319 B737-800 TOTAL
LANDING CHARGE 440.71 507.92 948.63 440.71 507.92 948.63 PARKING/AIRBRIDGE 85 85 170 0 0 0 PASSENGER CHARGE 5,737.50 7,229.25 12,966.75 4,462.50 5,622.75 10,085.25 TERMINAL NAVIGATION 0 0 0 0 0 0
TOTAL 7,028.21 8,786.07 15,814.28 4,903.21 6,130.67 11,033.88 LCCT as % of MAIN TERMINAL 69.8% 69.8% 69.8%

Review of Dedicated Low-Cost Airport Passenger Facilities, Final Report, 11th May, 2007 Page 6
2.2.4 SCHIPHOL
The situation at Amsterdam is somewhat different to that at the four airports with separate low cost
facilities. At Amsterdam one pier (Pier H – now split into Piers H and M to accommodate non-Schengen
and Schengen traffic respectively) of the main terminal has been fitted out with minimal facilities so as to
provide a differentiated service level for low cost carriers. Passengers pass from the passport control area
to Departure Lounge 3, which has full waiting and shopping facilities, before moving to the pre-boarding
area on the ground floor of Pier H. The pier has seven gates but no airbridges, so that passengers walk
direct from the terminal to their aircraft. The facility is intended to allow 20 minute turnarounds, with
average dwell time in the pre-boarding lounge of 10 minutes. The discount amounts to 20% off the
landing charge: this applies not only at Piers H and M but in all cases at the airport where there is no
airbridge connection.
Of the five facilities which we have discussed in this section, this is probably the one which has generated
the most controversy, and the pricing differential is still the subject of disagreement between the airport
and the main carrier KLM. The airport’s publicity states that “Pier H is designed to create space in the
central area of the terminal to accommodate the anticipated growth of Air France-KLM and partners” as
well as to serve the low cost carrier market. KLM only partly accepts that additional space has been
created, on the grounds that some airlines would not want to offer their passengers a lower
quality product and are therefore not willing to leave Pier D for Pier H.
Some unusual factors come into play in the calculation of charges. Amsterdam has differential pricing for
landing charges dependant on whether aircraft are parking on an airbridge or not. We have assumed that
users of the main terminal are charged at the airbridge rate whereas users of Pier H are not. Amsterdam
also has differential pricing for transfer passengers, with substantial discounts of 65.5% for passenger
related charges and 67.8% for security charges. A significant proportion of Amsterdam’s passengers are
transferring (42.1% in 2005) and it seems reasonable to assume that this proportion of passengers using
the main terminal would be eligible for the transfer passenger discounts. On this basis, users of Pier H will
in practice pay more for the overall package of charges than users of the other piers, as shown in Table 4
below.
Table 4 Overall aeronautical charges for low cost airline operations at Amsterdam
MAIN TERMINAL PIER H EUROS A319 B737-800 TOTAL A319 B737-800 TOTAL LANDING CHARGE INCL NOISE 453.9 526.32 980.22 395.02 454.38 849.4
PARKING/AIRBRIDGE 0 0 0 0 0 0 PASSENGER CHARGE INCL. SECURITY CHARGE AND TRANSFER DISCOUNT
1,229.83 1,547.22 2,777.05 1,698.33 2,136.57 3,834.90
TERMINAL NAVIGATION 333.88 415.81 749.69 333.88 415.81 749.69 TOTAL 2,017.61 2,489.35 4,506.96 2,427.23 3,006.76 5,433.99 Pier H as % of MAIN TERMINAL 120.3% 120.8% 120.6%
Review of Dedicated Low-Cost Airport Passenger Facilities, Final Report, 11th May, 2007 Page 7
2.2.5 JFK JETBLUE TERMINAL
The Port Authority of New York who is financing the development of the terminal for jetBlue does not offer
any form of rebate or pricing differential to the airline. The deal that was concluded between the airport
and the airline is outlined below:
The airline would continue to pay its appropriate landing and parking charges
The airlines passengers would continue to pay a departure fee to the Port Authority
The airline will pay a ground rent for the terminal for the 30 year lease period
The airline is responsible for the maintenance and operation of the terminal building
The Port Authority will derive a percentage of the concession fees from sales in the terminal building
The airline will derive the remainder of the concession fees from terminal concessionaires.
2.2.6 FRANKFURT HAHN
A similar calculation has been carried out in respect of Frankfurt Hahn airport. Frankfurt Hahn is owned
and operated by Fraport, the holding company for the main Frankfurt-Main airport. It is a former military
airfield, and it was developed primarily for commercial operations by low cost operators. The airport has a
single passenger terminal, so there is no charge differentiation in respect of different facilities. However,
there is a degree of charge differentiation according to the type and scale of operations:
The landing charge does not apply in the case of aircraft turnarounds which take 30
minutes or less;
The per passenger charge varies on a sliding scale according to the number of
passengers carried through the airport in a year.
The per passenger charge varies between €5.35 for up to 100,000 passengers p.a. to €2.48 for between
2,000,001 and 3 million passengers p.a. There are further discounts on further passenger increments
beyond 3 million passengers. For our calculations we have contrasted the charges which would apply at a
traffic level of 2.5 million passengers, all with a sub-30 minute turnaround, with those which would apply
at a traffic level of 250,000 passengers all of which were subject to a turnaround of over 30 minutes. The
calculated charges are as shown below.
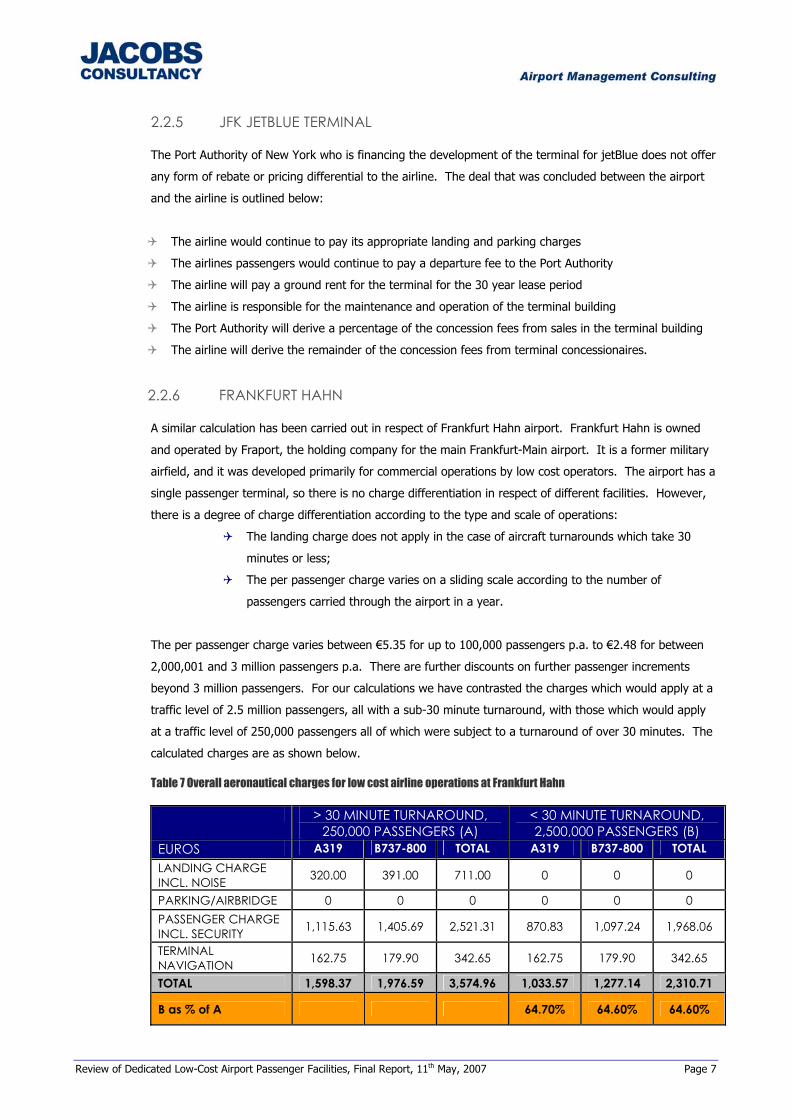
Table 7 Overall aeronautical charges for low cost airline operations at Frankfurt Hahn
> 30 MINUTE TURNAROUND, 250,000 PASSENGERS (A)
< 30 MINUTE TURNAROUND, 2,500,000 PASSENGERS (B)
EUROS A319 B737-800 TOTAL A319 B737-800 TOTAL LANDING CHARGE INCL. NOISE 320.00 391.00 711.00 0 0 0
PARKING/AIRBRIDGE 0 0 0 0 0 0 PASSENGER CHARGE INCL. SECURITY 1,115.63 1,405.69 2,521.31 870.83 1,097.24 1,968.06
TERMINAL NAVIGATION 162.75 179.90 342.65 162.75 179.90 342.65
TOTAL 1,598.37 1,976.59 3,574.96 1,033.57 1,277.14 2,310.71
B as % of A 64.70% 64.60% 64.60%

Review of Dedicated Low-Cost Airport Passenger Facilities, Final Report, 11th May, 2007 Page 8
2.2.7 SINGAPORE
Although not included in the benchmark list, a dedicated low cost facility has been developed at Singapore
and is worthy of review. Singapore opened its newly built Budget terminal in March 2006, within a few
days of that at Kuala Lumpur, reflecting the high level of competition between the two airports.
As in the case of Kuala Lumpur, the airport pricing has been subject to very little change over an extended
period. The landing, parking and boarding bridge charges were all set in 1995, although the landing
charge has been subject to a 15% discount for several years. This discount will remain in place at least
until the end of 2008. The passenger charge for the main terminal has not changed since 1997, and the
security charge is unchanged since 2002.
The discount for use of the budget terminal is a little over half, at SG$7.00 per passenger compared to
SG$15.00 per passenger in the main terminal. The airport website indicates that rental charges for space
within the budget terminal are also around half of those in the main terminal. Apart from the passenger
charge differential, we have assumed that the boarding bridge charge is payable at the main terminal but
not at the budget terminal. The results of our calculation are shown in Table below.
Table 5 Overall aeronautical charges for low cost airline operations at Singapore
MAIN TERMINAL BUDGET TERMINAL SINGAPORE $ A319 B737-800 TOTAL A319 B737-800 TOTAL LANDING CHARGE INCL. NOISE 458.51 572.76 1,031.27 458.51 572.76 1,031.27
PARKING/AIRBRIDGE 85 85 170 0 0 0 PASSENGER CHARGE INCL. SECURITY 2,677.50 3,373.65 6,051.15 1,657.50 2,088.45 3,745.95
TERMINAL NAVIGATION 0 0 0 0 0 0
TOTAL 3,221.01 4,031.41 7,252.42 2,116.01 2,661.21 4,777.22 BUDGET as % of MAIN TERMINAL 65.70% 66.00% 65.90%
In this case the price differential at the budget terminal amounts to around 66% of the charges in the
main terminal. This is very similar to the discount at Marseille but rather more than the discount at the
competing Kuala Lumpur facility. The level of competition at the two airports is apparent from the fact
that, when converted to a common currency, the prices are virtually identical, with Kuala Lumpur being
marginally the more expensive.
2.2.8 AIRPORT CHARGES AT DUBLIN
For comparison purposes we have calculated charges at Dublin on the same basis as for the airports
reviewed earlier in this section. While Dublin does not have a dedicated low cost terminal we can
calculate a small degree of price differentiation, based on the assumption of an aircraft parked for only 30
minutes on a remote stand. The calculated charges are as shown below.
Table 6 Overall aeronautical charges for low cost airline operations at Dublin
AIRBRIDGE, PARKED FOR ONE REMOTE STAND, PARKED FOR

Review of Dedicated Low-Cost Airport Passenger Facilities, Final Report, 11th May, 2007 Page 9
HOUR 30 MINUTES EUROS A319 B737-800 TOTAL A319 B737-800 TOTAL LANDING CHARGE INCL. NOISE 504.00 622.13 1126.13 504.00 622.13 1126.13
PARKING/AIRBRIDGE 80.96 80.96 161.91 12.20 12.20 24.40 PASSENGER CHARGE INCL. SECURITY 830.98 1,047.04 1,878.02 830.98 1,047.04 1,878.02
TERMINAL NAVIGATION 128.00 156.40 284.40 128.00 156.40 284.40
TOTAL 1,543.94 1,906.52 3,450.45 1,475.18 1,837.76 3,312.94 REMOTE STAND as % of AIRBRIDGE 95.50% 96.40% 96.00%
Charges calculated on the same basis for an Airbus A320, an aircraft type commonly used at Dublin, total
€1,708.17 for airbridge use and €1,639.41 for remote stand use.
2.3 REBATES AND REDUCTIONS AT OTHER AIRPORTS
The low cost terminals discussed above are in principle available for use by any airline. In practice,
though, most are designed around the principle of providing minimal facilities and of requiring passengers
to carry out a number of functions themselves, such as loading baggage onto the baggage conveyor.
Because of this lack of amenities full cost airlines are unlikely to use the terminals, since the service level
is not of a standard which they would wish to oblige their passengers to use.
There are a number of other forms of rebates and discounts available to passengers at a number of
airports. These are again available in principle to any airline, and some have been in place for a good
number of years, since before the low cost airline phenomenon gained its current level of strength.
Others have been introduced more recently and appear to be designed so that airports can claim that the
discounts are available to any airline, while in fact low cost airlines are those most likely to be able to take
advantage of the offer. This applies particularly to discounts related to traffic growth or the introduction
of new routes, since in general full cost airlines in Europe are not experiencing significant levels of growth,
particularly in the short haul markets where low cost carriers are concentrated.
We set out below some examples of the offers which are in place in Europe and for which details are
available. The list is not intended to be exhaustive, but to illustrate the variety of offers which are being
made available.
2.3.1 BASLE/MULHOUSE
Incentive plans are on offer for both passenger and cargo services. For passenger services, there is a
New Passenger Service Destination rebate which reduces landing charges for the first twelve months of
operation by 80%, by 50% for the following six months and by 25% for a further six months. The same
rebates are available in the case of the re-introduction of services to destinations to which services had
previously ceased.
More obviously aimed at low cost carriers, there is a rebate on landing charges for existing services based

Review of Dedicated Low-Cost Airport Passenger Facilities, Final Report, 11th May, 2007 Page 10
on the rate of traffic growth. Growth of up to 5% p.a. attracts no rebate, while growth of between 5%
and 20% p.a. attracts a rebate of 10%. There is a sliding scale going up to a 70% rebate for growth of
over 100%.
2.3.2 BIRMINGHAM
Birmingham has a growth incentive scheme which is reportedly designed to reward carriers generating the
highest growth in the form of a rebate, although details of the rates of growth which trigger the rebates
do not appear to be publicised. The scheme runs for four years, starting with a 100% rebate on landing
charges and a 50% rebate on passenger charges. The landing charge rebates reduce by 25% increments
over the course of the four-year period, while the passenger charge rebate reduces in 12.5% increments.
There is also a “promotional fare rebate scheme” which provides marketing support for carriers selling
fares below a certain threshold. Again, no details appear to be published.
2.3.3 MANCHESTER
Manchester offers a comprehensive set of six different forms of incentive, the most significant are:
New route incentive: Operators of new routes are offered a single charge per passenger which
replaces all separate charges. This applies for the first three years of operation in the case of flights
scheduled within the standard operating hours (£3 per passenger rising to £5) and for the first five
years of operation in the case of flights scheduled in off-peak hours (£3 per passenger rising to £7).
For an Airbus A320 aircraft this compares to a normal overall charge of £14.86 per passenger with a
typical load, but for larger aircraft the normal overall per passenger charge would be higher;
Capacity growth incentive: if an airline replaces an aircraft type used on an existing service with a
larger aircraft, landing charges are based on the maximum take-off weight of the smaller aircraft;
Non-stop service incentive: if an airline replaces a multi-stop service with a non-stop service it will pay
landing and air traffic service charges at a discount, for three years, of 40% in the first year falling to
20% in the third year.
2.3.4 PRAGUE
Prague airport offers a 75% discount on landing charges for the first year of operation of a new route and
25% in the second year for aircraft of up to 100 tonnes take-off weight. Higher discounts are available
over three years for operations with larger aircraft. In addition, a 25% discount on landing charges is
available for additional frequencies operated on existing routes.
2.4 MARKETING SUPPORT
Apart from giving publicised (or unpublicised) discounts on standard tariffs, airports commonly provide
marketing support to airlines which have either started, or are considering starting, new routes. This may
take the form of providing data on potential route demand, based on airport passenger surveys or on
other sources of information, to an airline which is considering the introduction of a new route, or
providing assistance with advertising the route once it has been introduced.

Review of Dedicated Low-Cost Airport Passenger Facilities, Final Report, 11th May, 2007 Page 11
The value of these discounts is rarely made public, but it is generally accepted that they have been widely
available for a number of years. A brief internet search found details of marketing assistance being
offered or provided by Athens, Copenhagen, Cork, Dortmund, Dublin, Londonderry, Prague, Shannon and
Stockholm, although it is probable that some level of assistance would be provided by all but the most
congested of airports.
Again, these offers are available to all sectors of the airline industry, but it is most likely that they would
benefit low cost airlines since these are currently much more likely to be introducing new services than
traditional carriers.
2.5 PRICING ARRANGEMENTS AND SUSTAINABILITY
2.5.1 THE ACI VIEW
ACI has no formal policy on the development of low cost terminals. However, in general it encourages
members to offer a diversified range of services so as to suit the greatest possible range of airline users.
It follows from this that it does not object to the development of low cost terminals, although it recognises
that at airports with a large low cost airline presence this could lead to revenue dilution.
2.5.2 THE IATA VIEW
IATA is a very active campaigner on a wide spectrum of issues affecting its members, which are primarily
traditional full cost airlines (there are few low cost airline members of IATA, although Aer Lingus and Air
Berlin are both members). While low cost airlines are very much in the ascendancy, IATA can still rightly
claim to represent the interests of the majority of scheduled airline operations by passenger numbers. As
part of its campaigning activities it has produced a series of position statements, used for lobby purposes
and in its dealings with airports and air traffic service providers among others.
One of these statements relates specifically to Low Cost Facilities and Services. The Position statement is
reproduced in full below.
“There must be no discrimination between different groups of users with regards to charges as supported
by ICAO policies.1
Airports should offer a generic level of low cost facilities and services to all airlines to show their strong
commitment to cost reduction, cost efficiency and continual improvement. It is only acceptable to pay a
premium charge where additional facilities or services, such as aero-bridges and premium lounges, are
specifically requested by and provided to individual airlines. There should be no differential or
discriminatory charging between airport terminal buildings.
IATA will resist any proposal to introduce differential or discriminatory pricing at an airport in order to
1 ICAO Document 9082/7, paragraph 15.

Review of Dedicated Low-Cost Airport Passenger Facilities, Final Report, 11th May, 2007 Page 12
maintain fair competition.
Where differential pricing is nonetheless imposed, there must be transparency of airport costs and charges
so that any differential is limited to the cost of those services (eg boarding bridges, escalators, baggage
belts, etc) where a real differentiation in service is offered. In many areas (eg runway, tarmac, fire and
rescue, security, etc) there is no cost differential involved.
All airlines must be given equal and non-discriminatory access to any low-cost terminals that might be
built”.
IATA’s overall concern is that differential pricing may adversely affect the interests of its members, not
only at the airport where it is introduced but also at other airports within the same catchment area. It
cited as an example the effect of differential charges at the proposed low cost terminal at Geneva (see
below) on IATA members’ services operated out of Basle and Lyon.
2.5.3 OTHER PERSPECTIVES
In order to get a non-aligned view on this subject, we have spoken with a senior representative of ICAO
based in Geneva.
The ICAO position is that airport user charges should be transparent, non-discriminatory and cost-related.
They therefore take the view that, if there is a clear cost justification for lower charges and the terminal is
available to any airline which is prepared to accept the lower service standards inherent in a low cost
facility, then there is no reason why differential pricing should not exist.
ICAO bolsters this position by pointing out that differential pricing exists at many airports where a
domestic terminal is separate from the international terminal, and that this differential can be justified on
the grounds of the lower operating costs of the domestic terminal. There are therefore no grounds for
treating a low cost terminal differently if a cost differential can be demonstrated to exist.
The view was expressed that airports with a significant level of low cost traffic could be expected to be
reluctant to open a low cost facility. The example of Geneva was cited, where the go-ahead for a
proposed low cost facility principally for the use of easyJet has been delayed by a series of challenges by
Air France, with the findings of a judicial review currently being awaited. The situation is that easyJet
accounts for around 40% of total passengers at Geneva, and if this level of traffic was transferred to a
new low cost terminal there would be a serious adverse effect on commercial revenues in the main
terminal.
The conclusion which could be drawn from this may be that perhaps Geneva’s management would prefer
not to go ahead with a low cost terminal, but were forced to initiate the proposal as easyJet is now the
airport’s largest single operator. This conclusion appears to be justified in view of the fact that the latest
version of the airport’s master plan does not include any reference to the low cost terminal proposal. A
growing number of airports are likely to be facing the same pressures.
Review of Dedicated Low-Cost Airport Passenger Facilities, Final Report, 11th May, 2007 Page 13
The overall ICAO position was therefore that cost-related differential pricing which is available to all
carriers is considered acceptable. However, it observes that progress towards the introduction of low cost
terminals is very slow, and slower than might previously have been expected. Resistance by airports for
commercial reasons may be the main reason for this.
2.6 THE PROPOSED EUROPEAN DIRECTIVE ON AIRPORT CHARGES
Shortly after we submitted our proposal to carry out this study to the Commission, the European
Commission issued, on 24 January 2007, a proposed Directive on airport charges. It will enter its
legislative process within the next few weeks, but the process, which allows for changes to be required by
either the European Parliament or the European Council of Transport Ministers, means that the Directive
cannot be expected to be formalised before mid-2008 at the earliest.
The proposed Directive broadly aims to:
make the setting of airport charges within the Community more transparent;
require airports and users to provide forecasts of traffic and infrastructure requirements at airports;
require member States to nominate or establish an independent regulatory authority to ensure that
consultation procedures and quality standards are fully met, and to act as a mediator in cases where
airports and their users are at odds over the introduction of changes to charge levels;
set a framework for a common approach to setting charges within the Community, while leaving the
actual method of implementation open to individual member States.
Article 8 of the proposed Directive deals exclusively with the differentiation of charges, and is reproduced
in full below:
“Member States shall take the necessary measures to allow the airport managing body to vary the quality
and scope of particular airport services, terminals or parts of terminals, with the aim to provide tailored
services or a dedicated terminal or part of a terminal. The level of airport charges may be differentiated
according to the quality and scope of such services.
Member States shall ensure that any airport user wishing to use the tailored services or dedicated
terminal or part of a terminal, shall have access to these services and terminal or part of terminal.
In the case that more users wish to have access to the tailored services and/or a dedicated terminal or part
of terminal than it is possible due to capacity constraints, access shall be determined on the basis of
relevant, objective, transparent and non-discriminatory criteria”.
There appear to be some issues within this framework which will need careful consideration. In some
cases the requirement for full transparency is likely to mean that the process of demonstrating the
underlying justification for price differentials will be extremely complex. There are some in the industry
who question whether all existing differentials could be justified if subject to full transparency.
Review of Dedicated Low-Cost Airport Passenger Facilities, Final Report, 11th May, 2007 Page 14
While the final form of the Directive remains to be seen, it seems clear that the proposed Directive lends
its support to the principle of differential pricing in cases where differential costs can be clearly
demonstrated.
2.7 CONCLUSION ON SUSTAINABILITY OF DUAL PRICING STRUCTURES
The introduction of low cost terminal facilities has resulted in a number of acrimonious exchanges between
airports and their airline users, and in some cases where such facilities have been brought into operation
the issue of dual pricing has meant that the conflict has continued. There are certainly indications that the
efforts of aggrieved airlines have stopped, or at least delayed, the introduction of low cost facilities, with
Geneva probably being the clearest example of this.
Yet although this issue has pitched airports against flag carriers, it is not clear that the introduction of low
cost facilities will always be in the airport’s best interests financially. In this regard the potential loss of
retail revenue may well be more significant than the effect of dual pricing. It is possible to imagine a
situation in which an airport is forced to move towards proposing a low cost facility by the airlines which
would expect to use it, while being concerned rather than enthusiastic about the financial consequences of
doing so.
It is of course the case that if an airport has terminal capacity constraints, the introduction of additional
low cost facilities is a cost-effective means of increasing capacity which also frees up capacity in the main
terminal facility for traditional airlines. However, if the existing facility is not fully utilised, an airport would
look to use existing spare capacity for low cost carriers at a likely low marginal cost rather than provide
dedicated facilities.
The situation is made more complex because the wording of IATA’s statement seems to suggest that, if a
low cost facility is sufficiently differentiated from the main terminal facilities, it would be reluctantly
accepted. As far as we are aware there are no real issues remaining at the four airports discussed in this
report where fully separated low cost facilities have been introduced. IATA’s position is made the more
difficult because, while it calls for non-discriminatory access to low cost facilities, it must realise that most
IATA members would not be interested in using low cost facilities because of the inherently low passenger
service standards.
It would appear that the situation of disagreement which remains at Amsterdam has been caused by the
fact that the low cost facility is attached to, rather than separated from, the main terminal facility. In these
circumstances the flag carrier’s opposition to dual pricing (or perhaps to the extent of the differential) is
understandable, notwithstanding the fact that our analysis suggests that in practice users of the main
terminal facility pay about the same as users of the low cost facility.
Overall, though, the wording of the proposed EU Directive appears to make opposition to fully
differentiated facilities difficult if not impossible to sustain. We would therefore expect that, assuming the
proposal is formalised in its current form, future proposals for fully differentiated facilities would meet no

Review of Dedicated Low-Cost Airport Passenger Facilities, Final Report, 11th May, 2007 Page 15
more than token resistance from flag carriers. However, progress towards the introduction of more
facilities of this kind may continue to be slow as a result of airports’ reluctance to incur the short- to
medium term financial consequences of their introduction.

Review of Dedicated Low-Cost Airport Passenger Facilities, Final Report, 11th May, 2007 Page 17
Table 6 List of LCCs at Marseille
LOW COST CARRIERS
MAIN TERMINAL mp2
Aerlingus • Atlas Blue • Bmibaby • Easyjet • Flybe • Myair • Ryanair • Virgin Express •
The following image is taken from Google Earth with a red square surrounding the cargo facility that was
converted to the Low Cost Terminal. This image was taken prior to the conversion of the facility.
Figure 2 Close up Aerial Image of mp2 , Source: GoogleEarth
Taken from the mrsairport website (www.mrsairport.com), the following image is the access map for the
airport indicating the extended pier finger for access to the aircraft on the parking apron.
MP2 site prior to
construction

Review of Dedicated Low-Cost Airport Passenger Facilities, Final Report, 11th May, 2007 Page 18
Figure 3 Access Map for Marseille
Figure 4 Artists Impression of mp2 (taken from mp2 brochure)
mp2 site

Review of Dedicated Low-Cost Airport Passenger Facilities, Final Report, 11th May, 2007 Page 19
3.1.2 RATIONALE FOR FACILITY
Information on the Marseille airport website states that the evolution of air transport within France and
the greater European Union will be more towards to providing low cost facilities as low cost carriers come
to dominate intra European travel.
The airport has provided the following graph in its literature which illustrates the significant growth in the
low cost sector in France. Marseille state that the growth is such that traffic doubles every 4 years.
Figure 5 French traffic statistics for LCC Source: mrsairport.com
Thus Marseille state that they are taking an innovative approach to providing low cost facilities for low cost
airlines and their passengers by providing suitable terminal facilities which reflect the economics of low
cost airlines.
Marseille was significantly affected by several years of traffic loss which was caused by the introduction of
the TGV to Paris and subsequent traffic loss due to the September 11, 2001 terrorist attacks in the United
States. Based upon this rationality Marseille decided that it would be an appropriate use of a disused
cargo facility to accommodate selected low cost carriers and their passengers.
3.1.3 KEY CHARACTERISTICS
The following table is taken from a range of sources including the airport website and various internet
resources.

Review of Dedicated Low-Cost Airport Passenger Facilities, Final Report, 11th May, 2007 Page 20
Table 7 Marseille mp2 Benchmarking Data
MEASURE METRICS NOTES
GROSS AREA 7,532m2
(JC estimated footprint)
No information was provided regarding the gross area of the terminal facility. An estimate was made through the measure of Google Earth mapping and an approximation of the pier finger. This is a footprint measure and does not include any second or mezzanine level which may exist.
COST €16.4m The cost was in relation to the redevelopment of an existing cargo facility.
AIRLINE USERS 5 Bmibaby, Easyjet, Flyme, Myair, Ryanair
ANNUAL VOLUME 1 mppa 2005
DESIGN CAPACITY 3.5 mppa pax/annum
TPHP 900 Estimated max one way TPHP (6 stands @ 150 pax/aircraft)
NO OF STANDS
6
Information from website would suggest Code C Stands with no passenger bridges. Passenger access to aircraft is achieved by two sets of portable stairs located on the apron. It is not clear if there is a limited number of stairs or if each stand has dedicated passenger stairs.
STAND CODE C Information from website would indicate Code C Stands
CHECK IN DESKS
12
Airlines are required to remove all check in equipment after boarding. One baggage scale per desk. No electronic system for displaying flight but a system for putting a fixed non lighted sign above the desk is provided. Airlines are only assigned 2 desks per flight.
CHECK IN QUEUING SPACE No information available
DESIGN IATA LOS E Information from website states that it is the minimum expected level of service.
SECURITY COMB 3 No drawings available to check but information is provided on their website.
HBS 2
Passengers are required to take their baggage to the HBS post check in as there is no outbound baggage system.
DEP LOUNGES 6
DEP LOUNGE AREA 145 m2 This includes standing and seating area. Using 150 pax/flight @ 90% LF = .97m^2/pax
OUTBOUND BAGGAGE CONVEYER BELT SYS N
There is no outbound baggage conveyer belt system post check in. Passengers are required to take their baggage to the HBS screening machines where it is scanned and separated from the passenger. No information was available on how the outbound baggage is processed beyond the HBS.
ARR BAGGAGE BELT 2
FIDS N Manual display panels managed by the airline
BIDS N No information available.
CUTE N No CUTE system is provided.
CIRCULATION SPACE No other significant information was available.
NOTES Conversion of cargo building
The design of the terminal facility was based upon a no frills approach to passenger comfort. There is no significant investment in air conditioning beyond an air cooling system. Items such as carpet and wood floors were omitted with a preference for polished concrete to reduce costs. Little has been spent on decorative facades or other architectural aspects to increase the aesthetic qualities of the facility.

Review of Dedicated Low-Cost Airport Passenger Facilities, Final Report, 11th May, 2007 Page 21
3.2 BUDAPEST INTERNATIONAL AIRPORT
3.2.1 INTRODUCTION
Budapest Ferihegy International Airport is the primary passenger airport for Budapest Hungary and is
located on the west north west part of the airport. Terminal 1 is currently the low cost airline terminal
and was recently refurbished to meet the needs of the low cost airlines at a cost of some 35 million Euros.
Figure 6 Budapest Ferihegy International Airport Aerial Image, Source: Google Earth
The facility was recently refurbished specifically for the low cost market and currently there are 5 low cost
airlines operating out of the facility. Figure 7 below is a close up aerial image of Terminal 1 showing the
approximate area for aircraft parking immediately outside the terminal building prior to the redevelopment
of the terminal and associated apron.
Terminal 1
Low Cost
Terminal
Review of Dedicated Low-Cost Airport Passenger Facilities, Final Report, 11th May, 2007 Page 16
3 DESIGN AND OPERATING CHARACTERISTICS
This section sets out our review of the physical characteristics of the airports in the benchmark group with
dedicated low cost. All information has been collected through publicly available sources, media reports
and interviews with airport or airline officials.
3.1 MARSEILLE PROVENCE mp2
3.1.1 INTRODUCTION
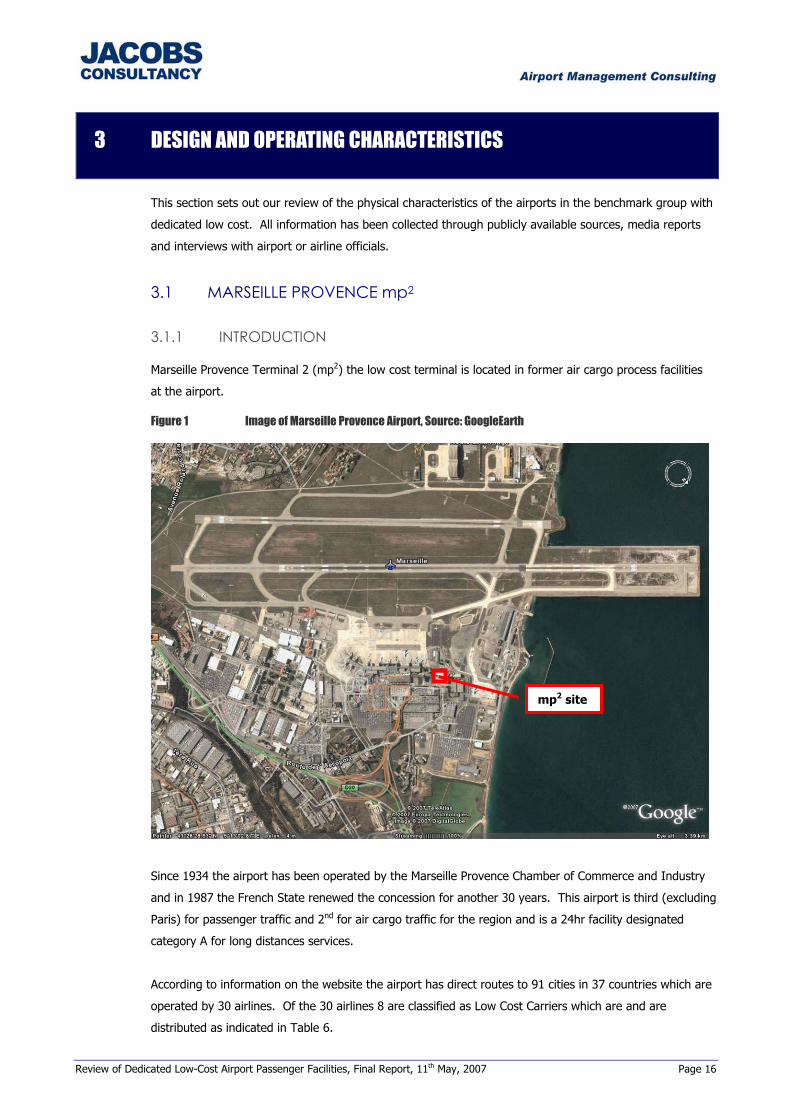
Marseille Provence Terminal 2 (mp2) the low cost terminal is located in former air cargo process facilities
at the airport.
Figure 1 Image of Marseille Provence Airport, Source: GoogleEarth
Since 1934 the airport has been operated by the Marseille Provence Chamber of Commerce and Industry
and in 1987 the French State renewed the concession for another 30 years. This airport is third (excluding
Paris) for passenger traffic and 2nd for air cargo traffic for the region and is a 24hr facility designated
category A for long distances services.
According to information on the website the airport has direct routes to 91 cities in 37 countries which are
operated by 30 airlines. Of the 30 airlines 8 are classified as Low Cost Carriers which are and are
distributed as indicated in Table 6.
mp2 site

Review of Dedicated Low-Cost Airport Passenger Facilities, Final Report, 11th May, 2007 Page 22
Figure 7 Budapest Terminal 1 Aerial Image, Source: Google Earth
3.2.2 RATIONALE FOR FACILITY
In context with the other airport terminals which are being benchmarked in this report, Budapest had an
additional reason for the significant investment in infrastructure. Post September 11, 2001 and EU
accession, the airport was required to update its existing facilities to meet the security requirements of the
EU and to manage the projected growth of traffic at the airport.
As there had been no significant infrastructure development since 1998 with the T2 complex, the
investment of 8.7bn HUF or approximately 35m Euros was a significant investment in airport facilities.
This investment was made up of the refurbishment of Terminal 1 and 5 other projects. The refurbishment
of T1 was chosen as it was an existing underutilised facility that was easily convertible. The projects
included the refurbishment of the parking apron, redevelopment of the small aircraft terminal,
refurbishment of the government official reception facility and various other projects.
Although the €35m redevelopment cannot be solely attributed to Terminal 1 it is speculated that the
majority was for that project. This is supported by the fact that press releases by the airport indicate that
a significant investment was made in the mechanical and electrical systems for the terminal including air
conditioning, new utility links, a new baggage system and investment in the parking aprons.
Figure 8 below is a graph of low cost passenger traffic from the opening of the new facility in September
2005 until December 2006. Unfortunately the data set is not complete as it was reported on the Budapest
website that some airline information was double counted. We have included the data which may be
suspect as it appears to be approximately in line with what would be expected (no significant deviations

Review of Dedicated Low-Cost Airport Passenger Facilities, Final Report, 11th May, 2007 Page 23
and it follows what we perceive to be a reasonable seasonal trend).
Figure 8 Budapest Terminal 1 Passenger Traffic
Budapest Terminal 1 Passenger Traffic
-
50.0
100.0
150.0
200.0
250.0
Sep-05 Oct-05 Nov-05 Dec-05 Jan-06 Feb-06 Mar-06 Apr-06 May-06 Jun-06 Jul-06 Aug-06 Sep-06 Oct-06 Nov-06 Dec-06
Month
Pax
(000
)
Airport Reported Questionable Data
Figure 9 below is a schematic layout of the terminal building with areas marked for the calculation of the
various circulation spaces which is reported in Table 8 below.
Figure 9 Terminal 1 Layout - Source: BAA
3.2.3 KEY CHARACTERISTICS
The following table sets out the physical benchmarking data which was publicly available at the time of
submission of this report. Some information is based upon Jacobs Consultancy calculation and estimation
upon publicly available data and may not necessarily reflect the true existing conditions.

Review of Dedicated Low-Cost Airport Passenger Facilities, Final Report, 11th May, 2007 Page 24
Table 8 Budapest Physical Benchmarking
MEASURE METRICS NOTES
GROSS AREA 7,990 m² Terminal footprint
COST €35 m (8.7bn HUF)
Refurbishment of an existing facility including a small aircraft terminal and government facilities. Refurbishment included items such as full M&E redevelopment, air conditioning and baggage system.
AIRLINE USERS 8
• Easyjet • Sky Europe • Wizzair • Germanwings
• Norwegian • Sterling • Flysnowflake • Jet2.com
ANNUAL VOLUME 2.138 mppa 2006
Arrivals: 1,058,448 Departures: 1,079,968
NO OF STANDS 10 3 stands are within walking distance of the terminal building although all passengers are bussed due to passenger safety reasons.
STAND CODE C
CHECK IN DESKS 19
CHECK IN QUEUING SPACE 290 m²
DESIGN IATA LOS N/A No IATA LOS design was applied during planning.
SECURITY COMB PROVISION 3
TPHP 720 This was limited to 720 pax/hr rather than a design capacity in annual terms
HBS 2
DEP GATES 10
DEP LOUNGE AREA 1,400 m²
SECURITY COMB 3
OUTBOUND BAG BELT SYS Y
ARR BAGGAGE BELT 4
FIDS Y
BIDS Y
CUTE Y
CIRCULATION SPACE
Landside: Departures route - 223 m² Arrivals Concourse - 676 m² Main Terminal - 612 m² Security: - 180 m²
Airside: Departures Lounge - 725 m² Baggage Reclaim - 316 m² Customs - 67 m² Arrivals Route - 151 m²
DESIGN CAPACITY N/A As a refurbishment, design capacity is not relevant
NOTES Terminal 1 was fully refurbished in 2005 for low cost airlines. It was built and opened with a lower aeronautical charging regime in place as compared to Terminal 2
Source: BAA and Jacobs Consultancy

Review of Dedicated Low-Cost Airport Passenger Facilities, Final Report, 11th May, 2007 Page 25
3.3 KUALA LUMPUR
3.3.1 INTRODUCTION
At the end of March of 2006 this Air Asia terminal was opened to traffic after being built by Kuala Lumpur
airport on the south east section of the inner airfield. The terminal is some 35,290 square meters and is
located approximately 20km away from the main terminal building by road. The construction was a fast
track process costing approximate RM 108m or some 23m Euros
Figure 10 below is an image taken from Google Earth showing the relative location of the facility to the
main terminal building at Kuala Lumpur.
Figure 10 Relative Site Location, Source: Google Earth
Again Figure 11 below is an image taken from the KLIA website (http://www.klia.com.my/LCCTerminal/)
for the low cost terminal outlining its approximate location.
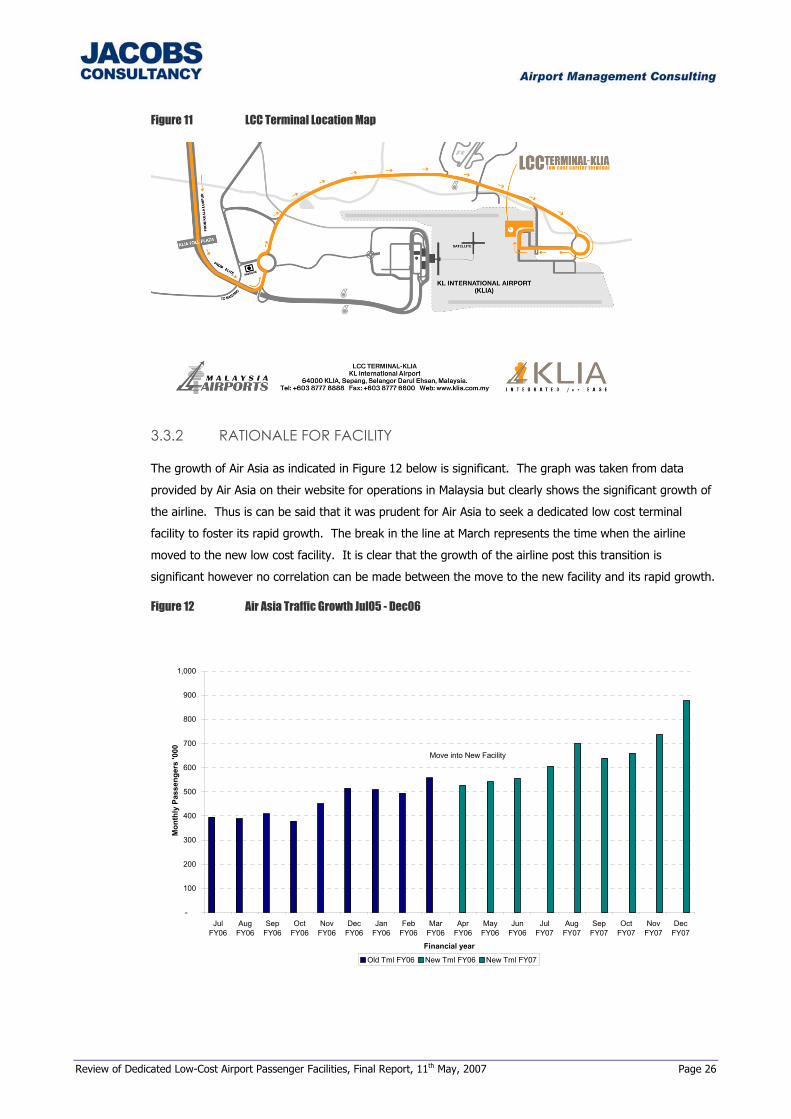
Review of Dedicated Low-Cost Airport Passenger Facilities, Final Report, 11th May, 2007 Page 26
Figure 11 LCC Terminal Location Map
3.3.2 RATIONALE FOR FACILITY
The growth of Air Asia as indicated in Figure 12 below is significant. The graph was taken from data
provided by Air Asia on their website for operations in Malaysia but clearly shows the significant growth of
the airline. Thus is can be said that it was prudent for Air Asia to seek a dedicated low cost terminal
facility to foster its rapid growth. The break in the line at March represents the time when the airline
moved to the new low cost facility. It is clear that the growth of the airline post this transition is
significant however no correlation can be made between the move to the new facility and its rapid growth.
Figure 12 Air Asia Traffic Growth Jul05 - Dec06
-
100
200
300
400
500
600
700
800
900
1,000
JulFY06
AugFY06
SepFY06
OctFY06
NovFY06
DecFY06
JanFY06
FebFY06
MarFY06
AprFY06
MayFY06
JunFY06
JulFY07
AugFY07
SepFY07
OctFY07
NovFY07
DecFY07
Financial year
Mon
thly
Pas
seng
ers
'000
Old Tml FY06 New Tml FY06 New Tml FY07
Move into New Facility
Review of Dedicated Low-Cost Airport Passenger Facilities, Final Report, 11th May, 2007 Page 27
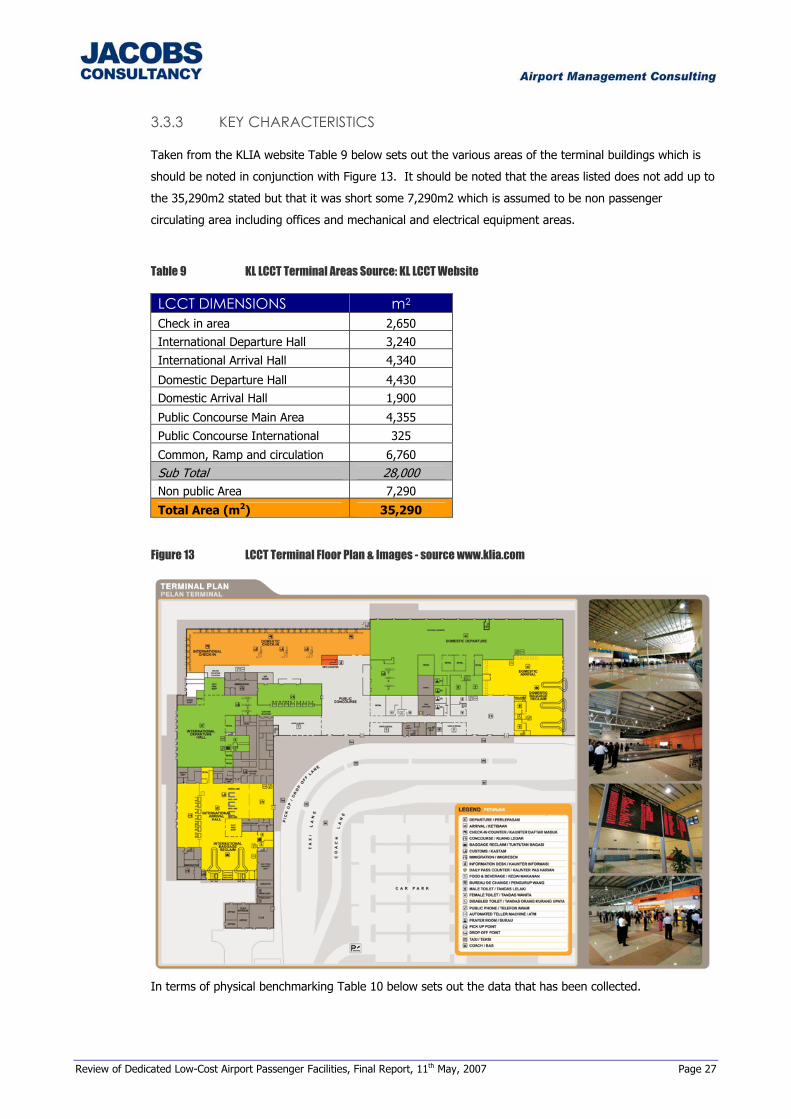
3.3.3 KEY CHARACTERISTICS
Taken from the KLIA website Table 9 below sets out the various areas of the terminal buildings which is
should be noted in conjunction with Figure 13. It should be noted that the areas listed does not add up to
the 35,290m2 stated but that it was short some 7,290m2 which is assumed to be non passenger
circulating area including offices and mechanical and electrical equipment areas.
Table 9 KL LCCT Terminal Areas Source: KL LCCT Website
LCCT DIMENSIONS m2 Check in area 2,650 International Departure Hall 3,240 International Arrival Hall 4,340
Domestic Departure Hall 4,430 Domestic Arrival Hall 1,900
Public Concourse Main Area 4,355 Public Concourse International 325
Common, Ramp and circulation 6,760 Sub Total 28,000 Non public Area 7,290
Total Area (m2) 35,290
Figure 13 LCCT Terminal Floor Plan & Images - source www.klia.com
In terms of physical benchmarking Table 10 below sets out the data that has been collected.

Review of Dedicated Low-Cost Airport Passenger Facilities, Final Report, 11th May, 2007 Page 28
Table 10 KL LCCT Benchmarking Data
MEASURE METRICS NOTES GROSS AREA 35,290m2 Detailed information provided on the LCCT website.
COST 108m RMB Approximately 23m Euros @ 0.216 exchange rate
AIRLINE USERS Air Asia The facility was primarily built for Air Asia. Other minority operators include CeBu Pacific Air, Jet Star, Jet Airway and Tiger is reported to be considering operating out of the new terminal.
ANNUAL VOLUME n/a
DESIGN CAPACITY 10 mppa Information from website suggests that sufficient space is available to increase capacity to 15m. Anecdotal evidence suggests that there are significant operational issues with the terminal building.
TPHP N/A
An estimate of 2,000 passengers (departure) has been made using an average check in time of 2 min per passenger. However, it is most likely that this is constrained by bottlenecks at passenger screening points for entry to the holding lounges.
NO OF STANDS 26
Initially all passengers were required to walk to the aircraft which could take significant time considering the distance to the most remote stand. This also presented problems with passengers getting wet during inclement weather. A solution of providing umbrellas to passengers was soon abandoned due to the risk of them being ingested in aircraft engines. The most recent solution saw the construction of a sheltered passenger walkway.
STAND CODE C We understand that Air Asia is seeking long haul routes to Australia and that they will be modifying some existing stands to cater for Code E aircraft.
CHECK IN DESKS 72 20 counters are for passengers with no hold baggage
CHECK IN QUEUING SPACE 2,650 m2
As per information provided on website. A review of drawing suggests that much of this area is given over to general circulation and pre check-in HBS.
DESIGN IATA LOS N/A Insufficient information available to determine relative level of service. However anecdotal evidence would suggest that at peak times the facility is operating at LOS D/E
SECURITY COMB 3 Domestic 3 International
Drawings on website would indicate that the configuration of the security
comb is similar to what would normally be expected.
HBS 3 Located prior to check in
DEP LOUNGE 2 Domestic and International lounges are provided.
DEP LOUNGE AREA 4,430 DOM, 3,240 INT’L
Drawings on the website indicate the departure halls, but it is intermixed with outbound passenger processing and no clear demarcation is provided to show seating/waiting area.
OUTBOUND BAGGAGE CONVEYER BELT SYS
Nil Baggage is handled manually
ARR BAG BELT 3 DOM 2 INT’L
Drawings on the website indicate that international arriving bags are screened prior to entering terminal. This is suggestive of some form of inbound customs/security screening. No information is provided as to who has paid or who is operating this check.
FIDS Y Reference is made to FIDS and is supported by images on the website. BIDS N/A No information available
CUTE Unknown It is presumed that if Air Asia is the sole operator out of the terminal, then there will be some form of check in system
CIRCULATION SPACE 4,680 m2 Public concourse main area and international. Set out in table above.
NOTES

Review of Dedicated Low-Cost Airport Passenger Facilities, Final Report, 11th May, 2007 Page 29
3.4 SCHIPHOL INTERNATIONAL AIRPORT
3.4.1 INTRODUCTION
Gate H&M is Amsterdam Schiphol Airport’s solution for low cost airlines demanding lower charges for a
more sparse facility. The facility its self comprises a purpose built pier off the main terminal and was built
for approximately 30m Euros.
3.4.2 RATIONALE FOR FACILITY
As with other low cost terminal providers, Schiphol came under pressure from its resident low cost airlines
to provide an appropriate facility to cater to the low cost passenger and airlines. To this end, Schiphol
responded by providing a basic facilities such that it does not even have toilet facilities for passengers
within the gate areas. In addition to this, the facility reportedly only has 8 seats available per aircraft for
passengers while waiting.
The basis of this provision of sparse facilities is that the airport management only call passengers to the
boarding lounge 30min prior to boarding as the facility is only a pier off the main terminal building. This
strategy ensures that passengers spend as much time as possible in the revenue generating section of the
airport terminal.
3.4.3 KEY CHARACTERISTICS
Table 11 below sets out the physical benchmarking data for Gate H with notes providing context
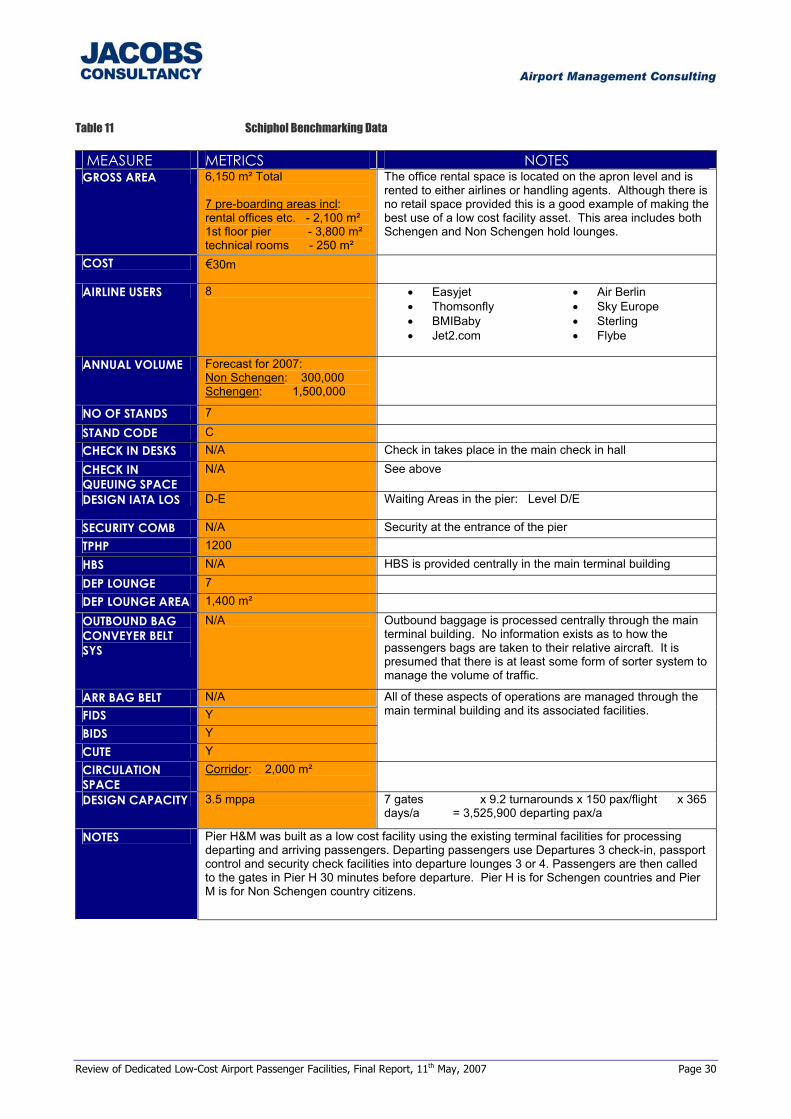
Review of Dedicated Low-Cost Airport Passenger Facilities, Final Report, 11th May, 2007 Page 30
Table 11 Schiphol Benchmarking Data
MEASURE METRICS NOTES GROSS AREA 6,150 m² Total
7 pre-boarding areas incl: rental offices etc. - 2,100 m² 1st floor pier - 3,800 m² technical rooms - 250 m²
The office rental space is located on the apron level and is rented to either airlines or handling agents. Although there is no retail space provided this is a good example of making the best use of a low cost facility asset. This area includes both Schengen and Non Schengen hold lounges.
COST €30m
AIRLINE USERS 8 • Easyjet • Thomsonfly • BMIBaby • Jet2.com
• Air Berlin • Sky Europe • Sterling • Flybe
ANNUAL VOLUME Forecast for 2007: Non Schengen: 300,000 Schengen: 1,500,000
NO OF STANDS 7
STAND CODE C CHECK IN DESKS N/A Check in takes place in the main check in hall
CHECK IN QUEUING SPACE
N/A See above
DESIGN IATA LOS D-E Waiting Areas in the pier: Level D/E
SECURITY COMB N/A Security at the entrance of the pier TPHP 1200 HBS N/A HBS is provided centrally in the main terminal building DEP LOUNGE 7 DEP LOUNGE AREA 1,400 m²
OUTBOUND BAG CONVEYER BELT SYS
N/A Outbound baggage is processed centrally through the main terminal building. No information exists as to how the passengers bags are taken to their relative aircraft. It is presumed that there is at least some form of sorter system to manage the volume of traffic.
ARR BAG BELT N/A FIDS Y BIDS Y CUTE Y
All of these aspects of operations are managed through the main terminal building and its associated facilities.
CIRCULATION SPACE
Corridor: 2,000 m²
DESIGN CAPACITY 3.5 mppa 7 gates x 9.2 turnarounds x 150 pax/flight x 365 days/a = 3,525,900 departing pax/a
NOTES Pier H&M was built as a low cost facility using the existing terminal facilities for processing departing and arriving passengers. Departing passengers use Departures 3 check-in, passport control and security check facilities into departure lounges 3 or 4. Passengers are then called to the gates in Pier H 30 minutes before departure. Pier H is for Schengen countries and Pier M is for Non Schengen country citizens.
Review of Dedicated Low-Cost Airport Passenger Facilities, Final Report, 11th May, 2007 Page 31
3.5 JOHN F KENNEDY INTERNATIONAL AIRPORT
3.5.1 INTRODUCTION
In August of 2004 an agreement was reached between the Port Authority of New York and jetBlue for the
development of a dedicated terminal. Expected to open in 2008, the terminal will have a 58,000 square
meters foot print with 26 contact stands and 800m of approach roads and a hydrant fuelling system.
This new facility is different in its conception from the other facilities in the study in that jetBlue has had
direct involvement in the facilities design. The basic deal that was struck with the Port Authority is that
jetBlue would be responsible for the design, procurement and construction management of the facility.
The Port Authority would be reimbursed for the capital investment over the period of a 30 year lease and
receive regulated charges (passenger, landing fees, ground rent etc) and a portion of terminal
concessionaire fees. jetBlue in turn would receive a proportion of concessionaire fees and be responsible
for the maintenance and operation of the facility.
3.5.2 RATIONALE FOR FACILITY
Taken from interviews and email correspondence the following is understood to be the rationale for the
development of the facility at JFK.
(a) Business Growth Currently jetBlue is located in a facility only covering 28 acres with a maximum of 14 gates for the
operation of their schedule. The new facility is on 72 acres of land and provides sufficient space for 26
gates. This investment allows jetBlue to grow their business to 250 flights per day or approximately 10
turnarounds per gate. It should however be noted that jebBlue’s international operations take place in
another terminal as the new facility is for domestic operations only.
(b) Flexibility of Daily Operations As jetBlue will be the only occupiers of the terminal facility this gives them the scope to manage
operations that best suit their business such as baggage handling and gate assignment.
(c) Control of Facility Quality As jetBlue were controlling the design and fit out of the facility they had direct control over the level of
service that it will provide. The facility was designed such that during the peak hours of operation the
level of service would not fall below IATA level of service C. This therefore means that a off peak periods
the facility will be operating at a higher level of service.
3.5.3 KEY CHARACTERISTICS
It is important to know that the investment of the US$ 800m includes new approach roads, a fuel hydrant
system, a new car park for the authority and foot bridges linking the facility with the airports Skytrain.
Thus without having access to additional cost information it is difficult to determine what the cost of the
terminal facility is on its own.

Review of Dedicated Low-Cost Airport Passenger Facilities, Final Report, 11th May, 2007 Page 32
Table 12 JFK jetBlue Terminal Benchmarking
MEASURE METRICS NOTES GROSS AREA 58,000 m2
COST $800m US The cost included the provision of the approach roads, elevated passenger walkway to the airport SkyTrain, parallel taxiway system and a hydrant fuelling system for all contact stands.
AIRLINE USERS 1 jet Blue is the sole user of the facility
ANNUAL VOLUME 15 mppa Calculation based upon 26 gates turning over 12 times per day with
each aircraft having 150 seats @ 90%LF for 360 days/year
NO OF STANDS 26 There is 26 contact stands with airbridges and one spare gate.
STAND CODE C All stands are designed for A320 with tolerance for Embraer 190s
CHECK IN DESKS 40+40 The layout of the terminal building is such that there are 40 desks on each side of the central security comb
CHECK IN QUEUING SPACE 1,400 m2 Estimated based on drawings provided.
DESIGN IATA LOS C Estimated at Code C or better
SECURITY COMB PROVISION 20 Security comb provision is provided centrally on the departures level
between the check in areas.
TPHP 2340 Estimated based on interview with jetBlue. Calculation based on 25 gates with AC@100 seats @90% occupancy with peak being in the morning
HBS 10 EDS and 5 CTX Full in line HBS with cross redundancy capability
DEP GATES 26 Contact gates designed for A320/EMB190 operations assuming 100 seats at 90% LF. jetBlue have provided 90 seats per gate
DEP GATE AREA 5,100m2 Estimated using images provided gives an average area per gate of 190m2 or 2.1m2 per passenger.
SECURITY COMB 20 There are 20 security combs provided centrally for access airside.
OUTBOUND BAG BELT SYS 10 There are 10 outbound baggage make up areas
ARR BAG BELT 6 The arrivals baggage claim belts are exceptionally large with and estimated 270m of linear claim length.
FIDS Y BIDS Y CUTE Y jetBlue's own paperless ticketing system CIRCULATION SPACE N/A
DESIGN CAPACITY 20m

Review of Dedicated Low-Cost Airport Passenger Facilities, Final Report, 11th May, 2007 Page 33
3.6 FRANKFURT-HAHN
3.6.1 INTRODUCTION
Frankfurt-Hahn Airport (HHN) was originally created in 1953 as a military base for NATO use. In 1993, it
was successfully converted to civilian use, and it has since been operating as the low cost option to the
nearby Frankfurt International Airport (FRA). Civilian conversion and total expansion of the airport is
quoted to have cost a total of €138m to date which we assume includes stands, runway, taxiway and
access development. Comprised in this total figure, is the development of the Main Terminal building,
which was created by combining the former Terminals 1 and 2 at an initial cost of €25m. When it was first
converted, HHN relied heavily on cargo operations. However, since the advent of low cost carriers,
passenger traffic has grown steadily. The most notable increase in traffic took place in 1999, when Ryanair
commenced services. Ryanair has since heavily increased its operations and it currently serves 43
destinations from HHN. Additional routes are served by Iceland Express (1) and Wizz (3).
Figure 14 Frankfurt Hahn Historical and Forecasted Traffic
.
Source: Frankfurt-Hahn website

Review of Dedicated Low-Cost Airport Passenger Facilities, Final Report, 11th May, 2007 Page 34
3.6.2 RATIONAL FOR FACILITY
(a) Geographical position The geographical position of Frankfurt makes HHN an attractive option for airline traffic. Situated in the
centre of Europe, HHN is easily accessible to and from many destinations. Frankfurt is a quick commute
to London, the Benelux, and within easy reach of most other European regions and cities.
(b) Night-Time operations HHN markets itself as the Low-Cost airport in the Frankfurt region, and it has maintained adequately low
and attractive airport charges. In addition, HHN has a 24-hour operating license, which allows it to be
competitive with FRA (that instead has restrictions on night-time flights) without directly threatening its
traffic base.
(c) Future Growth Since 1998 Hahn has invested € 138m in airport infrastructure and in 2004 began a 3,800 m extension of
its runway at a cost of € 37m. It is predicted that another € 240m will be spent between 2006 and 2010
for additional airport improvement projects including additional 747 cargo positions and cargo facilities, a
rapid exit taxiway and additional parallel taxiways. Around € 150m is proposed to be spent on landside
access and road improvements
As part of its near-term capex, HHN plans to build a totally new 50,000 sqm terminal (south) and gate
area which is projected to cost € 54.6m and is due for completion by the end of 2008. The new Terminal
and gates, which will replace the current facility, will have approximately 26 aircraft parking positions and
an equivalent number of gates with a design capacity of 15mppa. It will provide 20,500 m2 of departures
and arrivals terminal processing, plus 20,000 m2 of airside space plus 5,000m2 for commercial
development (such as a hotel) with 5,000m2 for connecting corridors.
Figure 15 The planned, Terminal South
3.6.3
3.6.4
3.6.5
3.6.6

Review of Dedicated Low-Cost Airport Passenger Facilities, Final Report, 11th May, 2007 Page 35
3.6.7 KEY CHARACTERISTICS
Table 13 summarises the benchmarking characteristics collected from publicly available sources and
information provided by Hahn for the existing terminal.
Figure 16 The Existing Terminal at Hahn

Review of Dedicated Low-Cost Airport Passenger Facilities, Final Report, 11th May, 2007 Page 36
Table 13 Frankfurt-Hahn Benchmarking Characteristics – Existing Terminal
MEASURE METRICS NOTES GROSS AREA 18,500 m2 Including office space and baggage. Terminal area only = 13,500 Sqm
COST Total €25 million
€4.40 per Passenger, assumed to include terminal and gates but not associated stands and apron developments
AIRLINE USERS Business + tourism Ryanair, Wizz, Iceland Express
ANNUAL VOLUME 4.2 mppa 2007 figure
NO OF STANDS 16
STAND CODE C/D/E/F 10 Codeletter “C” and 6 Codeletter “D, E, F” as of 05/2007
CHECK IN DESKS 22
CHECK IN QUEUING SPACE 750m2 Terminal A 280 m², Area A-B 150 m², Terminal B 320 m²
DESIGN IATA LOS IATA LEVEL “E”
TPHP 2,675 Design Peak Hour
HBS 3 1 EDT, 1 EDTS, 1 oversize baggage
DEP GATES 12 Gates
DEP GATE AREA 2100m2 + circulation Terminal A 1.200 m² gate area, Terminal B 900 m² gate area + circulate area
SECURITY COMB 11 10 PAX Security Lanes, 1 Personal + Customers Lane
OUTBOUND BAG BELT SYS 1 1 Outbound carousel, capacity max 10 flights/hour
ARR BAG BELT 4 4 Inbound carousel; 3 flights Arrival Terminal A together, 4 flights Arrival Terminal B together
FIDS 12 4 for monitors per arrival area, 8 for departure + wait/circulate area
BIDS No BIDS
CUTE No CUTE
CIRCULATION SPACE
DESIGN CAPACITY 5.6mppa
NOTES
The current baggage claim will be extended in summer 2007 to a capacity of max 14 flights/hour.
HHN will also built a new arrival in winter 2007/08 and change the current arrival to gate area. The new arrival will be on the area of the new terminal that HHN will built in 2008-2010. A new 15mppa capacity 50,000m2 terminal south and gate area is planned to be developed with 26 gates at a cost of €54.6m. It will provide 20,500 m2 of departures and arrivals terminal processing, plus 20,000 m2 of airside space plus 5,000m2 for commercial development (such as a hotel)


![11.[29 40]design and implementation of a low cost digital bus passenger counter](https://static.fdocuments.in/doc/165x107/55890e05d8b42ab5488b4752/1129-40design-and-implementation-of-a-low-cost-digital-bus-passenger-counter.jpg)