Review of BS and AP management schemes - fp7-trend.eu · Review of BS and AP management schemes...
41
Review of BS and AP management schemes Łukasz Budzisz, Fatemeh Ganji, Adam Wolisz TU Berlin, Germany Gianluca Rizzo, IMDEA, Spain (currently with Univ. of App. Sciences of Western Switzerland) Marco Ajmone Marsan, Michela Meo, Yi Zhang, Politecnico di Torino, Italy Alberto Conte, Ivaylo Haratcherev, Alcatel-Lucent Bell Labs, France George Koutitas, Leandros Tassiulas, University of Thessaly, Greece Mario Pickavet Bart Lannoo, Sofie Lambert, Ghent Univ. - iMinds, Belgium
-
Upload
phunghuong -
Category
Documents
-
view
213 -
download
1
Transcript of Review of BS and AP management schemes - fp7-trend.eu · Review of BS and AP management schemes...

Review of BS and AP management schemes
Łukasz Budzisz, Fatemeh Ganji, Adam Wolisz TU Berlin, Germany Gianluca Rizzo, IMDEA, Spain (currently with Univ. of App. Sciences of Western Switzerland) Marco Ajmone Marsan, Michela Meo, Yi Zhang, Politecnico di Torino, Italy Alberto Conte, Ivaylo Haratcherev, Alcatel-Lucent Bell Labs, France George Koutitas, Leandros Tassiulas, University of Thessaly, Greece Mario Pickavet Bart Lannoo, Sofie Lambert, Ghent Univ. - iMinds, Belgium

Energy efficient wireless access networks
n Design approach for wireless access networks: q Obtain maximum performance at full load
n In reality, however: q most of time, the wireless access networks are under low or
medium traffic load q load profile exhibits large variation (close to the users) q BS consumption is little load proportional and consume about
the same at any load
n BS sleep modes are needed n Sleep modes require BS management algorithms
Michela Meo – Politecnico di Torino
Savings between 20-40% can be
achieved

BS/AP management schemes - taxonomy
Michela Meo – Politecnico di Torino
Proposed framework points out: n the most important design aspects n shortcomings and advantages n energy-saving potential

n Flat Network: with single type of BSs, macrocells/microcells only, one operator q Non-overlapping architecture q Overlapping architecture
n Multi-Tier Network: with multiple types of BSs, also multiple technologies q Wi-Fi offloading q Femtocells
n Mobile operator co-operation
Existing BS management schemes
Michela Meo – Politecnico di Torino

Flat network with non-overlapping architecture
Michela Meo – Politecnico di Torino
n If the no. of BS always on is large, a slight increase of the RF output power is enough (if any)
n If the no. of BS always on is small, RF output power increase are needed, as well as titling adjustments
Flat network with non-overlapping architecture
Michela Meo – Politecnico di Torino
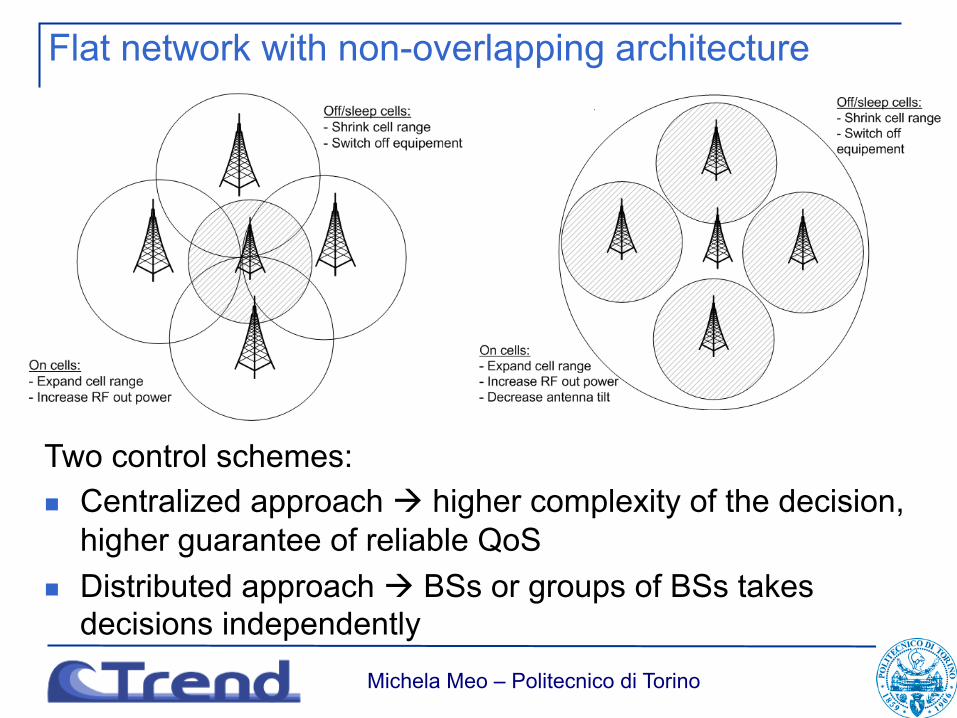
Two control schemes: n Centralized approach à higher complexity of the decision,
higher guarantee of reliable QoS n Distributed approach à BSs or groups of BSs takes
decisions independently

n Micro stations are used to provide the required capacity under the coverage umbrella of macro stations
n Two types of BSs: q Critical stations: usually the macrocell, which cannot be put into sleep
mode, due to coverage issues q Flexible stations: the BS that can be set in sleep mode
n No need to increase the cell ranges or the parameters of the BSs remaining on (low probability of coverage holes)
n Control schemes: n Distributed approach: each flexible BS decides on the state of its operation
(on/off), independently n Pseudo-distributed approach: Flexible stations are assigned to critical
stations, usually under cell overlap criteria
Flat network with overlapping architecture
Source: S. Kokkinogenis and G. Koutitas, “Dynamic and static base station management schemes for cellular networks,” in IEEE Global Communications Conference (GlobeComm ’12), Dec. 2012.
Michela Meo – Politecnico di Torino

n Marco-micro network co-exists and cooperates with other technologies, e.g. femto cell and WiFi
n The main objective is to provide an offloading solution n With WiFi:
n Mobile operators usually do not have the administrative rights to the Wi-Fi APs n Multi-Radio Access Technology (multi-RAT) is needed
n Limitations and constraints for integration with existing BS system q Guarantee that coverage holes do not occur (especially indoor scenarios) q Software and hardware limitations of real equipment (availability of low
power states, transient times)
Multi-tier network
Michela Meo – Politecnico di Torino
Sources: • S. Kokkinogenis and G. Koutitas, “Dynamic and static base station management schemes for cellular networks,” in
IEEE Global Communications Conference (GlobeComm ’12), Dec. 2012. • I. Haratcherev and A. Conte, “Practical energy-saving in 3g femtocells,” in IEEE Green Broadband Access (GBA)
workshop, in conjunction with ICC 2013, Jun. 2013. • I. Haratcherev, M. Fiorito, and C. Balageas, “Low-power sleep mode and out-of-band wake-up for indoor access
points,” in GLOBECOM Workshops, 2009 IEEE, 2009, pp. 1–6.

Network sharing
load
Net
wor
k po
wer
load
BS
pow
er n The low load proportionality of the devices makes the
whole access network little load proportional
Michela Meo – Politecnico di Torino
P = Pconst + f (ρ)
Service provisioning cost is multiplied by the no. of networks
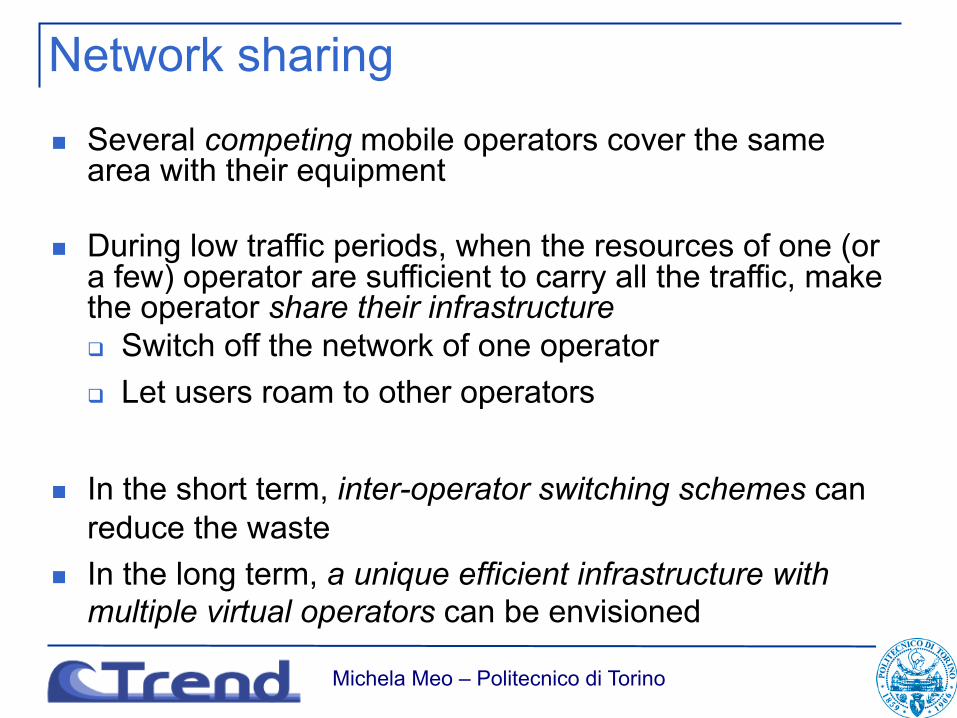
n Several competing mobile operators cover the same area with their equipment
n During low traffic periods, when the resources of one (or a few) operator are sufficient to carry all the traffic, make the operator share their infrastructure q Switch off the network of one operator q Let users roam to other operators
n In the short term, inter-operator switching schemes can reduce the waste
n In the long term, a unique efficient infrastructure with multiple virtual operators can be envisioned
Network sharing
Michela Meo – Politecnico di Torino

Case study: Some European Countries
Country MNOs Market share [%] Subscr. [M]France 3 46 36 19 - 58.2
Germany 4 32 31 21 16 113.6Greece 3 51 28 21 - 15.4Italy 3 38 36 26 - 84.0
Netherlands 3 46 26 28 - 19.0Poland 4 29 29 28 14 47.5
Portugal 3 45 40 15 - 16.4Spain 3 44 34 22 - 51.4
Romania 3 41 32 26 - 24.2Russia 3 37 33 30 - 189.7
Ukraine 3 48 37 15 - 52.3U.K. 3 39 33 28 - 68.5
Table 1: Characteristics of the considered countries: Numberof MNOs offering both 2G and 3G services, market share foreach of the MNOs, total number of subscribers.
3. ENERGY BENEFITS IN EUROPEIn this section, we assess the effectiveness of network sharing interms of achievable energy saving by considering a number of Eu-ropean countries. In particular, we focus on the 12 countries indi-cated in Table ??, which are the countries whose total number ofsubscribers is larger than 15 Millions, according to publicly avail-able data.
For each country we collect approximate data about the number ofsubscribers for each of the active MNOs and the kind of providedservices. We then assume that network sharing is applicable onlyamong the MNOs that offer both 2G and 3G services. Indeed, aMNO offering access to 2G terminals cannot switch off its networkand make the users roam to a purely 3G network. In this case theoperator would probably switch off the 3G network leaving the 2Gaccess network on; however, since we only have aggregated dataabout the total number of subscribers and not the breakdown withrespect to the technology, we make the simplistic assumption thatnetwork sharing is implemented only among MNOs offering ser-vices to both 2G and 3G users.
Interestingly, the considered European countries present quite sim-ilar scenarios. As summarized in Table ??, except for two cases,namely Germany and Poland, all considered countries have 3 MNOsoffering both 2G and 3G services with relatively fair share of mar-ket. The smallest of the 3 MNOs has a share that is usually between20 and 30%, only in the case of Ukraine and Portugal the smallestof the three operators accounts for as low as 15% of the subscribers.Conversely, the largest of the 3 MNOs exceeds 50% of the marketshare only in Greece, where it is about 51%; otherwise, it is be-tween 37% and 48%. The case of Germany, with 4 MNOs, is in-teresting because it presents two dominant operators with about thesame number of subscribers, 36 millions, corresponding to 31% ofthe market, and other two smaller MNOs that share the remainingmarket. In Poland, three operators are about the same size, withalmost 30% of the share each, while the fourth operator accountsfor 14% of the market only. This substantial similarity of the situa-tions is probably due to historical reasons: in most of the Europeancountries similar network evolutions occurred roughly at the sametime.
We compute the energy saving achievable through network sharingfor each of the selected countries, and for both the consumer and
Figure 3: Saving achievable with network sharing in the Euro-pean countries with more than 15M subscribers; business andconsumer profiles, constant and variable cost models.
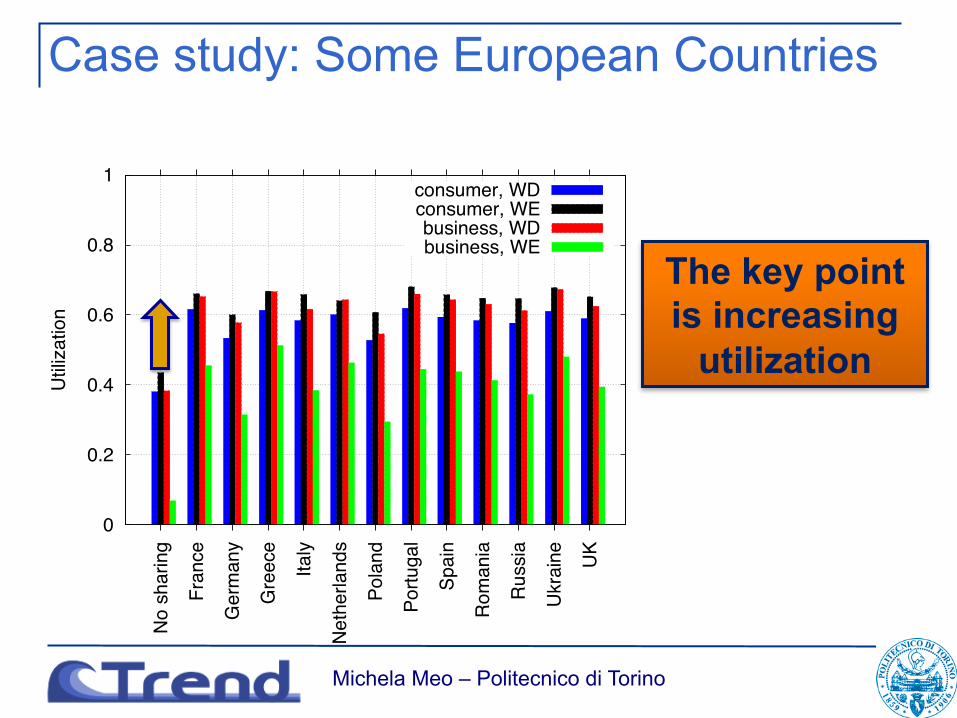
Figure 4: Utilization achievable with network sharing in theEuropean countries with more than 15M subscribers; businessand consumer profiles, week-days and week-ends.
the business traffic profiles shown in Fig. ?? (implicitly assumingthat the traffic profiles in Fig. ?? can be representative of trafficin all considered countries). Given a traffic profile and a country,we consider all the possible switch-off patterns, i.e., all the possi-ble orderings in which the MNOs of that country might switch off.Savings are obtained as described in the previous section, by de-riving switch-off and switch-on instants from (??), and by comput-ing saving from (??). Both the cases of variable and constant costmodels are evaluated. The saving achievable during week-days andweek-ends are properly weighted to get the average weekly saving.
Fig. ?? reports the maximum achievable energy saving, amongthose obtained from different switch-off patterns in a given sce-nario. The savings are really significant, typically larger than 40%:this confirms that network sharing, besides being a viable approach,already feasible with today technology, is very promising in termsof energy consumption reduction.
Observe also from the figure that the business traffic profile leadsto the largest saving. This is due to the profile having particu-larly steep transitions between peak and off-peak, and long peri-ods of very low traffic. Clearly, in reality, large service areas arecharacterized by a mixture of neighborhoods, some mainly withbusiness-like behavior of the users and others with consumer-liketraffic profiles. A switch-off scheme should then be applied byadapting, neighborhood by neighborhood, switching times to thespecific profiles. For example, a MNO that is going to switch-offits access network, might probably start from portions of the net-work in business areas, as soon as traffic drops below some thresh-old; some time later, when traffic drops also in the consumer ar-eas, other portions of the access network would be powered off. Interms of saving, this means that the achievable saving will be in be-tween what can be obtained from a business area and a consumerarea, with actual values depending on the traffic profiles and on theproportions of areas with business-like or consumer-like behavior.In case of some spare capacity, deployed to absorb medium termtraffic growth, some additional saving can be expected. With anoverprovisioning factor 1 + x = 1.2, for example, it is possible toreach savings between 50 and 59% for the consumer profile and be-tween 53 and 63% for the business profile under the constant costmodel. These values are even closer to the maximum theoreticalsaving that would be achieved when one network only has enoughcapacity to carry all the traffic; the maximum theoretical saving isequal to 66% for 3 MNOs, corresponsing to 1 network over threethat is carrying traffic, and it is equal to 75% for 4 MNOs.
A positive side-effect of network sharing is that active resources aremore effectively used than in traditional scenarios without sharing.Indeed, network sharing aims at reducing energy wastage that de-rives from daily periods of over-provisioning by making the avail-able capacity more closely follow the traffic profile. To evaluatethis effect, we compute the daily average utilization of the accessnetwork resources, by dividing the amount of generated traffic by
Michela Meo – Politecnico di Torino

Case study: Some European Countries
0
0.1
0.2
0.3
0.4
0.5
0.6
0.7
0.8
Fran
ce
Ger
man
y
Gre
ece
Italy
Net
herla
nds
Pola
nd
Portu
gal
Spai
n
Rom
ania
Rus
sia
Ukr
aine UK
Rel
ativ
e sa
ving
consumer, constconsumer, var
business, constbusiness, var
Large savings, more than
30%!
Michela Meo – Politecnico di Torino
Source: M. A. Marsan, M. Meo, “Network Sharing and its Energy Benefits: a Study of European Mobile Network Operators”, IEEE Globecom 2013 - Symposium on Selected Areas in Communications, December 2013.
Case study: Some European Countries
0
0.2
0.4
0.6
0.8
1N
o sh
arin
g
Fran
ce
Ger
man
y
Gre
ece
Italy
Net
herla
nds
Pola
nd
Portu
gal
Spai
n
Rom
ania
Rus
sia
Ukr
aine UK
Util
izat
ion
consumer, WDconsumer, WEbusiness, WDbusiness, WE
The key point is increasing
utilization
Michela Meo – Politecnico di Torino
n Game-theory based model q Two MNOs cover the same area and offer the same QoS, but may have
different network planning strategies q Heterogeneous architecture is assumed (different BS types) q Deployment targets peak of the user demand q Binary transitions: all traffic is migrated from one to the other MNO
n The following game (transferrable utilities coalitional game of BS sharing) has been constructed: q MNO 1 has different strategies corresponding to the chosen roaming price q MNO 2 has the choice between roaming or no roaming its traffic q Game objectives: reduce own costs by cooperation, receive fair share of benefits
of total cost reduction
Mobile operator co-operation
On-going work (iMinds, PoliTO, UTH, TUB): conference article “Greening the AirWaves: energy-efficient BS sharing” under preparation.
Michela Meo – Politecnico di Torino

n Power BSs with Renewable Energy Sources q Deploy cellular networks in countries where the power grid does
not exist or is unreliable q Achieve extremely low carbon footprints q Survive natural disasters which damage the power grid
Possible scenarios: 1. New opportunities for the deployments of networks in emerging
regions
Michela Meo – Politecnico di Torino
From energy efficient networking to sustainable networking
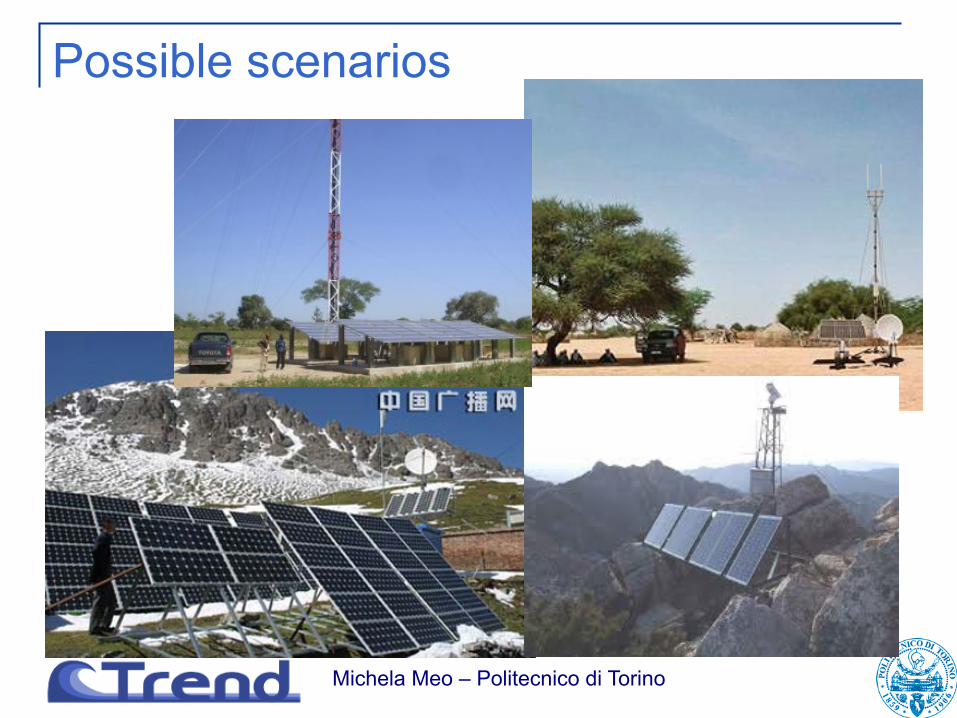
Possible scenarios
Michela Meo – Politecnico di Torino

n Power BSs with Renewable Energy Sources q Deploy cellular networks in countries where the power grid does
not exist or is unreliable q Achieve extremely low carbon footprints q Survive natural disasters which damage the power grid
Possible scenarios: 1. New opportunities for the deployments of networks in emerging
regions 2. New business models (high electricity price, green incentives and
sensitivity)
Michela Meo – Politecnico di Torino
From energy efficient networking to sustainable networking

Dimension PV powering for a BS
n Consider a typical BS q Consumption profile q Traffic profile
n Choose a location n Simulate energy production n Simulate battery charge
and discharge to decide system dimensioning
18
energy need
Michela Meo – Politecnico di Torino

BS consumption
• When needed (no TLC infrastructure) wireless backhauling consumes
additional 200-250W, for a total of 30KWh/day
load
780
1350
0 1
Power [W]
Psleep, 450
load
500
840
0 1
Power [W]
Psleep, 336
Deep sleep Deep sleep
Macro cell with LTE technology, with and without Remote Radio Unit (PA close to antenna)
Michela Meo – Politecnico di Torino
20
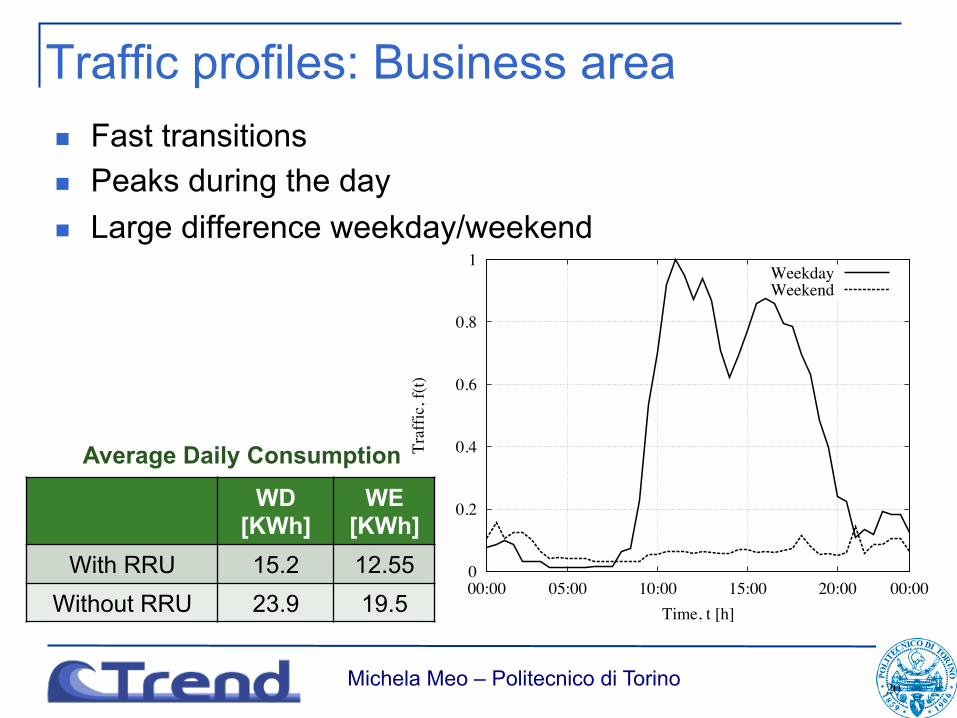
n Fast transitions n Peaks during the day n Large difference weekday/weekend
15
00.20.40.60.810
10
20
30
40
50
60
70
80
90
100
Parameter L
Savin
g [%
]
Upper BoundDouble Switch Off (Max)1/2−2/31/2−3/42/3−3/43/4−8/9
Fig. 4. Double switch-off: network saving versus the parameter L for the synthetic traffic profile.
0
0.2
0.4
0.6
0.8
1
00:00 05:00 10:00 15:00 20:00 00:00
Traf
fic, f
(t)
Time, t [h]
WeekdayWeekend
Fig. 5. Business cell: weekday and weekend traffic profiles.
TABLE ICASE STUDY: SAVINGS WITH DIFFERENT SWITCH-OFF SCHEMES
Switch-off scheme S[%] - Business weekday S[%] - Consumer weekday
Single (8/9) 44.2 49.3Double (5/9)-(8/9) 47.5 51.0Triple (3/9)-(5/9)-(8/9) 48.7 51.3Maximum (Least-Loaded) 50.0 52.0
Traffic profiles: Business area
WD [KWh]
WE [KWh]
With RRU 15.2 12.55 Without RRU 23.9 19.5
Average Daily Consumption
Michela Meo – Politecnico di Torino

21
16
0
0.2
0.4
0.6
0.8
1
00:00 05:00 10:00 15:00 20:00 00:00
Traf
fic, f
(t)
Time, t [h]
WeekdayWeekend
Fig. 6. Consumer cell: weekday and weekend traffic profiles.
11:00 15:00 19:00 23:00 03:0011:00
15:00
19:00
23:00
03:00
τ1
τ 2
−5
0
5
10
15
20
25
30
35
40
1/2−2/31/2−3/42/3−3/43/4−8/9
Fig. 7. Business cell - weekday profile: network saving with double switch-off.
n Slow transitions n Peaks in the evening n Little difference weekday/weekend
Traffic profiles: Consumer
WD [KWh]
WE [KWh]
With RRU 15.5 15.7 Without RRU 23.8 24.7
Average Daily Consumption
Michela Meo – Politecnico di Torino

Three locations
!
H`!!
!Figura 28: Radiazione solare annuale in Europa (Fonte: PVGIS, Institute for Energy - Unione Europea,
2012)
!Figura 29: Radiazione solare annuale in Africa (Fonte: PVGIS, Institute for Energy - Unione Europea, 2012)
!
Torino (4KWh/m2, high
seasonal variance)
Palermo (5.1KWh/m2)
Assuan (6.8KWh/m2, low
seasonal variance)
!
H`!!
!Figura 28: Radiazione solare annuale in Europa (Fonte: PVGIS, Institute for Energy - Unione Europea,
2012)
!Figura 29: Radiazione solare annuale in Africa (Fonte: PVGIS, Institute for Energy - Unione Europea, 2012)
!
Solar radiation
Solar radiation
Michela Meo – Politecnico di Torino

Dimensioning the system
n Dimensioning based on the average of the days of the worst month: look for the system dimension that guarantees min. surplus
!
[H!!
!
Figura 31: Produzione mensile di energia elettrica (Torino)
!
Figura 32 Produzione mensile di energia elettrica (Palermo)
Hour
Pow
er [W
]
!
[X!!
!
Figura 34: Potenza nel giorno di riferimento per Torino
!
Figura 35 : Potenza nel giorno di riferimento per Palermo
Location w/o RRU KWp
w RRU KWp
Torino 20 14 Palermo 16 10 Assuan 8 6
Michela Meo – Politecnico di Torino

Storing energy: Battery dimensioning
!
_X!!
!
Figura 43 Stato di carica delle batterie nell’arco di un anno –Torino – Impianto da 20 kWp
!
Figura 44 Stato di carica delle batterie nel mese peggiore –Torino – Impianto da 20 kWp
Torino
week
Bat
tery
cha
rge
[%]
Energy waste
Low charge (spoils
batteries)
Michela Meo – Politecnico di Torino

Dimensioning the system: Panel area & batteries
Without RRU With RRU Location KWp Area
[m2] No. batt.
KWp Area [m2]
No. batt
Torino 20 98 75 14 68 45 Palermo 16 78 50 10 49 32 Aswan 8 39 30 6 29 16
n Dimension battery so that charge never goes below 30% during the whole year
Results strongly depend on the location
Michela Meo – Politecnico di Torino
Source: Marco Ajmone Marsan, Giuseppina Bucalo, Alfonso Di Caro, Michela Meo, Yi Zhang, Towards Zero Grid Electricity Networking: Powering BSs with Renewable Energy Sources”, IEEE ICC'13 - Workshop on Green Broadband access: energy efficient wireless and wired network solutions, June 2013.

Dimensioning the system: Panel area & batteries
Without RRU With RRU Location KWp Area
[m2] No. batt.
KWp Area [m2]
No. batt
Torino 20 98 75 14 68 45 Palermo 16 78 50 10 49 32 Aswan 8 39 30 6 29 16
n Dimension battery so that charge never goes below 30% during the whole year
Very large! EE technology is needed
Michela Meo – Politecnico di Torino
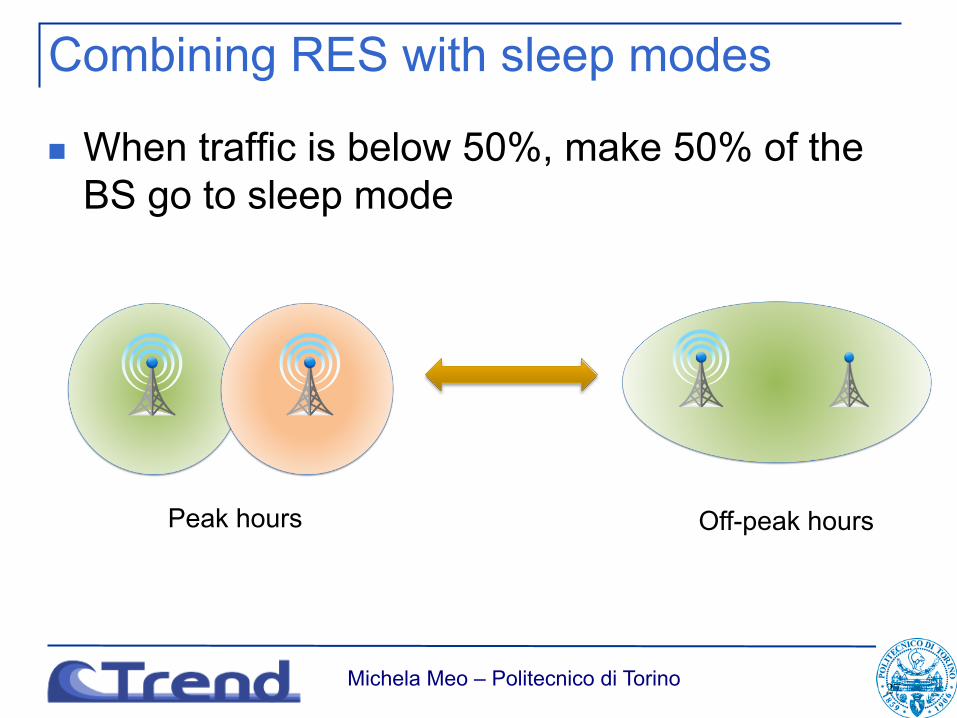
Combining RES with sleep modes
n When traffic is below 50%, make 50% of the BS go to sleep mode
27
!
`[!!
%&'()*+*!,g !-!,1'+313.)&6(*.3!1*2&+()Q!2(!/+33'!
E98 !.*4+206)+.3&
P34!5345&43!2(!2(1(.0(43!1&;;(*413.)3!(!5*./01(!/(!?!5*./(234&)*!&.5:3!0.*!/53.&4(*!(.!50(!0.&!A&/3!/)&)(*.@!5:3!/(!)4*E&!&!;3/)(43!0.&!A&//&!(.)3./()Q!2(!)4&88(5*@!'*//&!3.)4&43!(.!0.*!/)&)*!238(.()*! /+33'!1*23C!T03/)*! (1'+(5&! +*! /'3;.(13.)*!2(!A0*.&!'&4)3!23++F:&42R&43! 5:3!5*1'*.3!+&!A&/3!/)&)(*.@!(.!'&4)(5*+&43!+F&1'+(8(5&)*43!2(!'*)3.6&@!(.!1*2*!2&!)3.343!(!5*./01(!'(S!A&//(C!
T0&.2*! 0.&! A&/3! /)&)(*.! ?! (.! /+33'!1*23! /(! '43/0''*.3! 5:3! (+! )4&88(5*! 2(! 50(! &E43AA3!2*E0)*! 8&4/(! 5&4(5*! /(&! 5*1'+3)&13.)3! /1&+)()*! 2&! 0.F&+)4&! A&/3! /)&)(*.! &! +3(! &2(&53.)3C! ,.!B03/)*! 1*2*! /(! 5*.)(.0&! &! ;&4&.)(43! +&! 5*1'+3)&! 2(/'*.(A(+()Q! 23+! /(/)31&! (.! B0&+/(&/(!1*13.)*C!
T03/)*!/31'+(53!&+;*4()1*!2(!/+33'!1*23!?!4&''43/3.)&)*!(.!Y(;04&!_#C!
!
Figura 62
U&!'*)3.6&!4(5:(3/)&!2&++&!A&/3!/)&)(*.!U9c!(.!/+33'!1*23@!5*13!;(Q!E(/)*!.3+!%&'()*+*!"@!?!5*/)&.)3!3!'&4(!&-!!
! !!" ! !!"# ! !!"##$! K"C"^L !
2*E3!!!"#! ?! (+!.0134*!2(! &.)3..3! 4(53)4&/1())3.)(!.3+! /()*!13.)43! !!!"##$! ?! +&!'*)3.6&!.353//&4(&!'34!*;.0.&!2(!B03/)3!(.!1*2&+()Q!/+33'!1*23C!!
!
`[!!
%&'()*+*!,g !-!,1'+313.)&6(*.3!1*2&+()Q!2(!/+33'!
E98 !.*4+206)+.3&
P34!5345&43!2(!2(1(.0(43!1&;;(*413.)3!(!5*./01(!/(!?!5*./(234&)*!&.5:3!0.*!/53.&4(*!(.!50(!0.&!A&/3!/)&)(*.@!5:3!/(!)4*E&!&!;3/)(43!0.&!A&//&!(.)3./()Q!2(!)4&88(5*@!'*//&!3.)4&43!(.!0.*!/)&)*!238(.()*! /+33'!1*23C!T03/)*! (1'+(5&! +*! /'3;.(13.)*!2(!A0*.&!'&4)3!23++F:&42R&43! 5:3!5*1'*.3!+&!A&/3!/)&)(*.@!(.!'&4)(5*+&43!+F&1'+(8(5&)*43!2(!'*)3.6&@!(.!1*2*!2&!)3.343!(!5*./01(!'(S!A&//(C!
T0&.2*! 0.&! A&/3! /)&)(*.! ?! (.! /+33'!1*23! /(! '43/0''*.3! 5:3! (+! )4&88(5*! 2(! 50(! &E43AA3!2*E0)*! 8&4/(! 5&4(5*! /(&! 5*1'+3)&13.)3! /1&+)()*! 2&! 0.F&+)4&! A&/3! /)&)(*.! &! +3(! &2(&53.)3C! ,.!B03/)*! 1*2*! /(! 5*.)(.0&! &! ;&4&.)(43! +&! 5*1'+3)&! 2(/'*.(A(+()Q! 23+! /(/)31&! (.! B0&+/(&/(!1*13.)*C!
T03/)*!/31'+(53!&+;*4()1*!2(!/+33'!1*23!?!4&''43/3.)&)*!(.!Y(;04&!_#C!
!
Figura 62
U&!'*)3.6&!4(5:(3/)&!2&++&!A&/3!/)&)(*.!U9c!(.!/+33'!1*23@!5*13!;(Q!E(/)*!.3+!%&'()*+*!"@!?!5*/)&.)3!3!'&4(!&-!!
! !!" ! !!"# ! !!"##$! K"C"^L !
2*E3!!!"#! ?! (+!.0134*!2(! &.)3..3! 4(53)4&/1())3.)(!.3+! /()*!13.)43! !!!"##$! ?! +&!'*)3.6&!.353//&4(&!'34!*;.0.&!2(!B03/)3!(.!1*2&+()Q!/+33'!1*23C!!
Peak hours Off-peak hours
Michela Meo – Politecnico di Torino

Use of sleep modes
n While dimensioning of BS always on is basically unchanged, the dimensioning for BS going to sleep mode is much smaller
No sleep With sleep Deep sleep Location Area
[m2] Batt. Area
[m2] Batt. Area
[m2] Batt.
Torino 98 75 78 52 39 27 Palermo 78 50 58 27 29 17 Assuan 39 30 29 18 14 13
Significant improvement!

What about cost?
Area type
BS ISD [m]
Coverage [km2]
Grid only [K€/km2]
RES only [K€/km2]
Dense Urban 500 0.65 39.4 29.5
Urban 1000 2.60 9.8 7.4
Suburban 1732 7.79 3.3 2.5
Rural 4330 48.71 0.5 0.4
RES is cost effective!
Total cost: CAPEX+OPEX in 20 years
Michela Meo – Politecnico di Torino

Hybrid powering: RES & grid
RES is cost effective!
No RES
Only RES
Hybrid
Total cost: CAPEX+OPEX
Michela Meo – Politecnico di Torino
n Higher degree of load proportionality is needed q To adapt to traffic variations
n Load proportionality can be partially achieved through q BS sleep modes (intra-operator approach) q Network sharing (inter-operator approach)
n New promising scenarios with RES powering q Sustainability q Cost reduction q But needs also EE solutions
Conclusions
Michela Meo – Politecnico di Torino

Thank you!
Michela Meo – Politecnico di Torino

Additional slides
Michela Meo – Politecnico di Torino
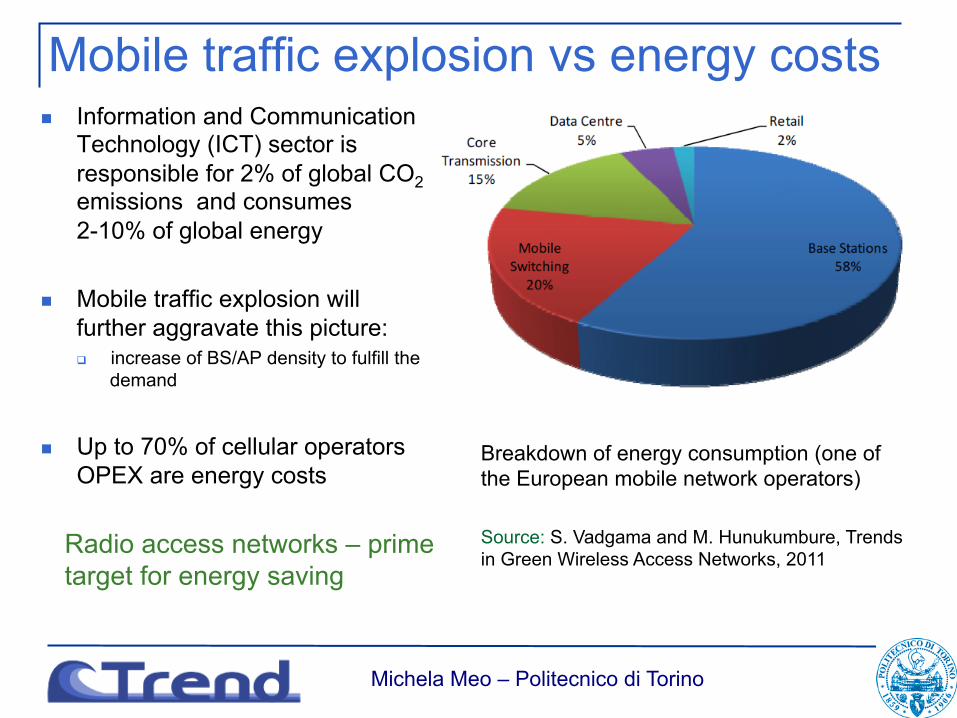
Mobile traffic explosion vs energy costs n Information and Communication
Technology (ICT) sector is responsible for 2% of global CO2 emissions and consumes 2-10% of global energy
n Mobile traffic explosion will further aggravate this picture: q increase of BS/AP density to fulfill the
demand
n Up to 70% of cellular operators OPEX are energy costs
Breakdown of energy consumption (one of the European mobile network operators) Source: S. Vadgama and M. Hunukumbure, Trends in Green Wireless Access Networks, 2011
Radio access networks – prime target for energy saving
Michela Meo – Politecnico di Torino

Components of a Base Station (BS)
Source: EARTH (Energy Aware Radio and network technologies) project, “Energy efficiency analysis of the reference systems, areas of improvements and target breakdown,” 2012.
n Fixed power: cooling, main supply, DC-DC n Load-proportional power: PA, BBU, RF
Michela Meo – Politecnico di Torino
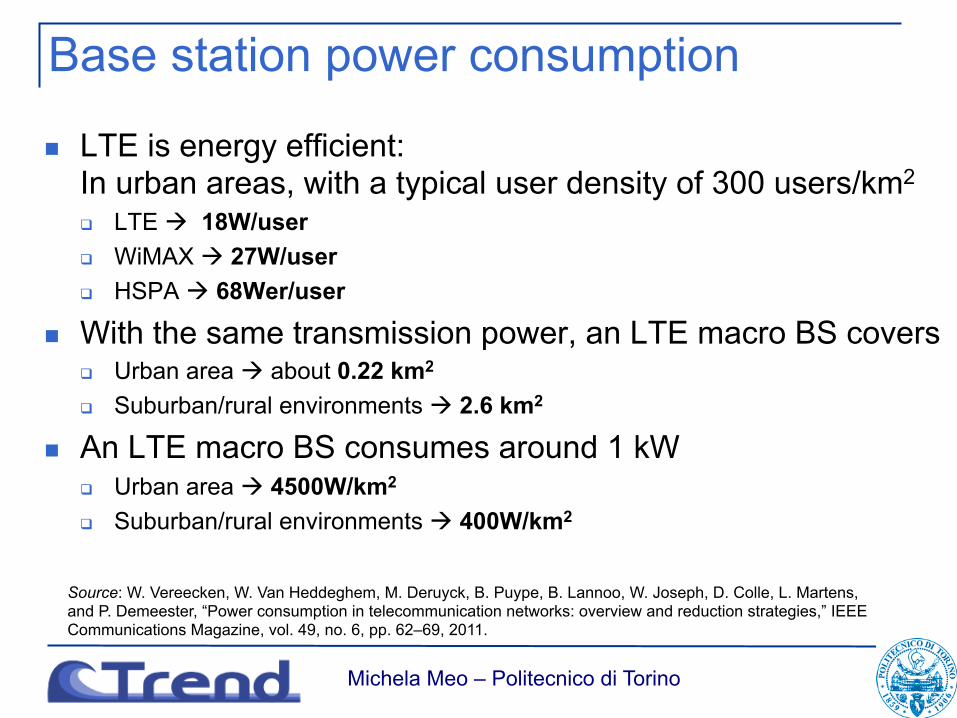
n LTE is energy efficient: In urban areas, with a typical user density of 300 users/km2 q LTE à 18W/user q WiMAX à 27W/user q HSPA à 68Wer/user
n With the same transmission power, an LTE macro BS covers q Urban area à about 0.22 km2
q Suburban/rural environments à 2.6 km2
n An LTE macro BS consumes around 1 kW q Urban area à 4500W/km2 q Suburban/rural environments à 400W/km2
Base station power consumption
Source: W. Vereecken, W. Van Heddeghem, M. Deruyck, B. Puype, B. Lannoo, W. Joseph, D. Colle, L. Martens, and P. Demeester, “Power consumption in telecommunication networks: overview and reduction strategies,” IEEE Communications Magazine, vol. 49, no. 6, pp. 62–69, 2011.
Michela Meo – Politecnico di Torino

Load proportionality and power saving When k-1 BSs out of k can be in sleep mode (ρ<1/k), the power per BS becomes:
n Sleep modes need to be introduced
n Need for BS management algorithms
Normalized power consumption vs. load for different device types: n 10% proportion: the devices today n 50% proportion: the devices under
development n 90% proportion: not realistic with
today technologies
0.1
1
10
100
0.001 0.01 0.1 1
Norm
aliz
ed c
onsu
mpti
on
BS load, !
10% propor.
50% propor.
90% propor.
with sleepno sleep
PS (ρ) =a+ kbρk
+k −1( )Psleep
k
Michela Meo – Politecnico di Torino
n Main obstacles to network sharing: n MNOs are reluctant to allow their subscribers to frequently roam to a
competitor MNOs n QoS provisioning in the visited network (dominant vs small MNOs) n Need for extended roaming and billing procedures
Mobile operator co-operation
Michela Meo – Politecnico di Torino
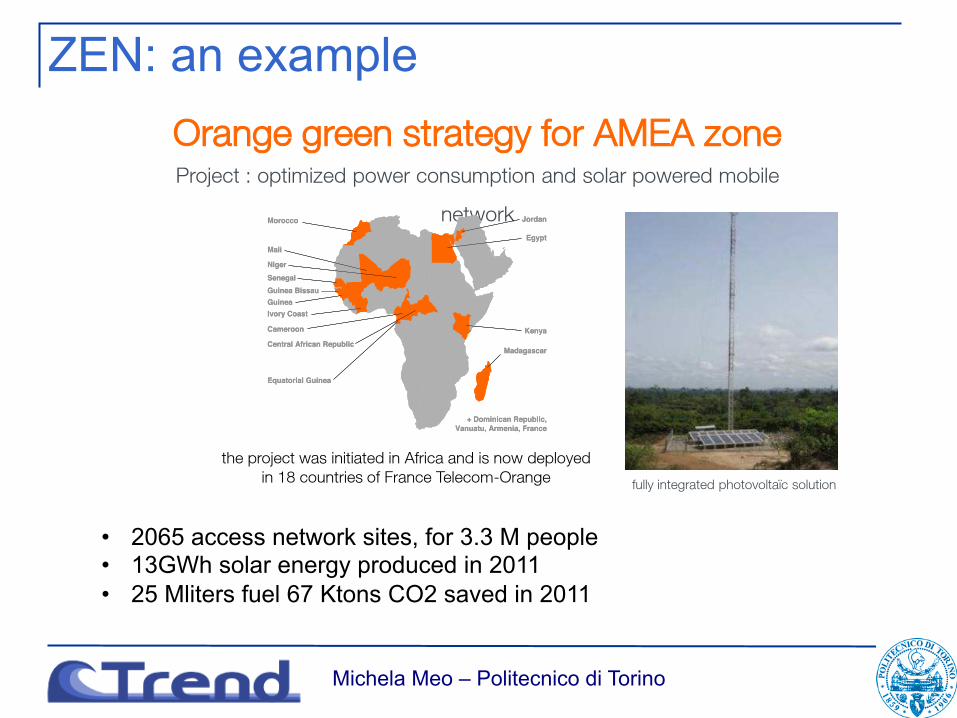
ZEN: an example
fully integrated photovoltaïc solution
optimized and evolutive solution
the project brings local skills
Objectives sustainable rural Telecom network greener solutions enabling Telecom development in bad quality
electric grid or off grid areas,
Social responsability enhanced telecom and digital inclusion with low cost solution positive impact on local economy (guards, maintenance jobs) solar electricity in excess freely provided for local use of populations
(cellular phone recharge, health centre powering, school lighting)
the project was initiated in Africa and is now deployedin 18 countries of France Telecom-Orange
Orange green strategy for AMEA zoneProject : optimized power consumption and solar powered mobile
networkMorocco
Egypt
Jordan
KenyaCameroon
Central African RepublicMadagascar
Niger
Mali
SenegalGuinea BissauGuineaIvory Coast
Equatorial Guinea
+ Dominican Republic,Vanuatu, Armenia, France
Morocco
Egypt
Jordan
KenyaCameroon
Central African RepublicMadagascar
Niger
Mali
SenegalGuinea BissauGuineaIvory Coast
Equatorial Guinea
+ Dominican Republic,Vanuatu, Armenia, France
Main results 2065 integrated solar Radio Access Network sites covering 3.3
million people 13 GWh solar energy produced in 2011 25 million liters fuel and 67000 tons CO2 saved in 2011 quality of service much better than for diesel generators
Innovation strong reduction of power consumption by
selecting high efficiency telecom equipment, no active cooling smart power architecture and management
optimized solar energy solution and less use of Diesel engines sizing and techno-economic tools
© Copyright France Télécom 2012
• 2065 access network sites, for 3.3 M people • 13GWh solar energy produced in 2011 • 25 Mliters fuel 67 Ktons CO2 saved in 2011
Michela Meo – Politecnico di Torino

Dimensioning the PV system
!
[H!!
!
Figura 31: Produzione mensile di energia elettrica (Torino)
!
Figura 32 Produzione mensile di energia elettrica (Palermo)
month
Av. d
aily
pro
duct
ion
[KW
h]
Torino • Larger systems allow for larger production
• Production changes according to seasons, while BS traffic and consumption not
n A system is defined in terms of KWpeak: the achieved production in KW when radiation is 1KW/m2
Michela Meo – Politecnico di Torino

Battery dimensioning !
[H!!
!
Figura 31: Produzione mensile di energia elettrica (Torino)
!
Figura 32 Produzione mensile di energia elettrica (Palermo)
!
[[!!
!
Figura 33 Produzione mensile di energia elettrica (Assuan)
]3.)43! &2! Z//0&.! +&! '4*206(*.3! 2(! 3.34;(&! /(! 1&.)(3.3! B0&/(! 5*/)&.)3! 204&.)3! )0))*!
+F&..*@!&!9*4(.*! +F&.2&13.)*!23++&!504E&!2(!'4*206(*.3!?!2('3.23.)3!1*+)*!2&++3!/)&;(*.(-!/(!
:&!0.!1&//(1*!.3(!13/(!3/)(E(@!2*E3!+&!'4*206(*.3!?!'&4&;*.&A(+3!&++F(1'(&.)*!/()*!&2!Z//0&.@!
3!0.!2354313.)*!2(!'4*206(*.3!1*+)*!1&45&)*!.3(!13/(! (.E34.&+(C! UF(1'(&.)*!2(!P&+341*! /(!
'*.3!5*13!E(&!2(!1366*@!'43/3.)&.2*!0.!&.2&13.)*!&!5&1'&.&!5*13!.3+!5&/*!2(!9*4(.*C!
cF! 0)(+3! 3E(23.6(&43! 5:3@! &++F&013.)&43! 23++3! 2(13./(*.(! 23++F(1'(&.)*! /()*! &! 9*4(.*@!
+F(.54313.)*! 2(! '4*206(*.3! 2(! 3.34;(&! .3++F&..*! 5:3! .3! 5*./3;03! /(! 5*.53.)4&! B0&/(!
)*)&+13.)3! .3(! 13/(! 3/)(E(@! &! 2(88343.6&! 2(! B03++(! (.E34.&+(! 2*E3! /(! *//34E&! 0.! 1*23/)*!
&013.)*!2(! '4*206(*.3C!Z!2(531A43@! &2! 3/31'(*@! *;.(! (.54313.)*!2(! #! dn!&++&! 2(13./(*.3!
23++F(1'(&.)*!5*1'*4)&!0.!&013.)*!2(!3.34;(&!'4*2*))&!2(!/*+(!`X@$!dn:C!M)3//*!2(/5*4/*!E&+3!
'34!P&+341*@!2*E3@! (+!/0223))*! (.54313.)*!2(!2(13./(*.(!23++F(1'(&.)*@!'4*2053!0.!&013.)*!
2(!'4*206(*.3!'&4(!&!"#X!dn:C!
M()0&6(*.3!5*1'+3)&13.)3!2(E34/&!&2!Z//0&.!2*E3@!/31'43!&!2(531A43@!&013.)&.2*!+&!
'*)3.6&!2(!'(55*!2(!#!dn!/(!:&!0.&!'4*206(*.3!1&;;(*43!2(!A3.!#[X!dn:C!!
!
!
month
Av. d
aily
pro
duct
ion
[KW
h]
Torino
Assuan
To absorb variability more batteries are
needed
Michela Meo – Politecnico di Torino