Review of AASHTO Case III Procedures for Intersection...
11
216 TRANSPORTATION RESEARCH RECORD 1280 Review of AASHTO Case III Procedures for Intersection Sight Distance KAY FITZPATRICK AND JOHN M. MASON, JR . Equations to reproduce the 1984 AASHTO Green Book Case 111-B and 111-C passenger car sight distance values are devel- oped. These equations produced values within 8 percent of the Green Book graphical values. Truck performance characteristics were selected on the basis of the information provided in the Green Book. Passenger car characteristics were then replaced with the truck characteristics to determine sight distance values for trucks. Values up to 3,200 ft were calculated. Field obser- vations at intersections indicate that sight distances of such mag- nitude are not required. On the basis of a review of the Green Book procedures, specific recommendations are identified for consideration in future versions of AASHTO geometric design policy. AASHTO's 1984 A Policy on Geometric Design of Highways and Streets (Green Book) (1) states "where traffic on the minor road of an intersection is controlled by stop signs, the driver of the vehicle on the minor road must have sufficient sight distance for a safe departure from the stopped position, even though the approaching vehicle comes in view as the stopped vehicle begins its departure movements." Three basic maneuvers can occur at a stop-controlled intersection: • Travel across the intersecting roadway by clearing traffic on both the left and the right of the crossing vehicle, • Turning left onto the crossing roadway by first clearing traffic on the left and then entering the traffic stream with vehicles from the right, and • Turning right onto the intersecting roadway by entering the traffic stream with vehicles from the left. These maneuvers, shown in Figure 1 [copied from Green Book (1), Figure IX-23), are referred to as Cases III-A, III-B, and III-C. The Green Book (1) provides sight distance values for passenger cars (P) in Cases III-A, 111-B, and 111-C and for single-unit (SU) trucks and tractor-semitrailer trucks (WB-50) for Case III-A (crossing maneuver). However, AASHTO states that the "required sight distances for trucks making left (or right) turns into a cross road will be substan- tially longer than for passenger cars." The Green Book (1) also states that the "relationships for trucks can be derived using appropriate assumptions for vehicle acceleration rates and turning paths." The Green Book (1) lacks specific guid- ance on original assumptions on which vehicle characteristic values should be assumed. K. Fitzpatrick, Texas Transportation Institute, Texas A&M Univer- sity, College Station, Tex. 77843. J. M. Mason, Jr., Pennsylvania Transportation Institute , Pennsylvania State University, Research Building B, University Park, Pa. 16802 . Because details regarding the development of AASHTO Figure IX-27 (Figure 2) are not available, equations are pre- sented that reasonably reproduce the AASHTO Case III-B and 111-C passenger car intersection sight distance (ISD) CASE ID STOP CONTROL _J !Yl __ ·_ d = S -i ght 0 - istonc -e - ---""'" '-·--_-- - - - - - - p_e ___ _ B D -- I- - -_ _- - --- I CASE m-A STOPPED VEHICLE CROSSING A MAJOR HIGHWAY ___ Y''L ...... B 0-- - == --=: - - - - - -·· - ·- - ............. CASE m-e STOPPED VEHICLE TURNING LEFT ONTO TWO LANE MAJOR HIGHWAY ----) jtl - -- . STOPPED VEHICLE TURNING RIGHT ONTO TWO LANE MAJOR HIGHWAY OR RIGHT TURN ON A RED SIGNAL FIGURE 1 Intersection sight distance at at-grade intersections [Green Book (1 ), Figure IX-23] .
Transcript of Review of AASHTO Case III Procedures for Intersection...
216 TRANSPORTATION RESEARCH RECORD 1280
Review of AASHTO Case III Procedures for Intersection Sight Distance
KAY FITZPATRICK AND JOHN M. MASON, JR.
Equations to reproduce the 1984 AASHTO Green Book Case 111-B and 111-C passenger car sight distance values are developed. These equations produced values within 8 percent of the Green Book graphical values. Truck performance characteristics were selected on the basis of the information provided in the Green Book. Passenger car characteristics were then replaced with the truck characteristics to determine sight distance values for trucks. Values up to 3,200 ft were calculated. Field observations at intersections indicate that sight distances of such magnitude are not required . On the basis of a review of the Green Book procedures, specific recommendations are identified for consideration in future versions of AASHTO geometric design policy.
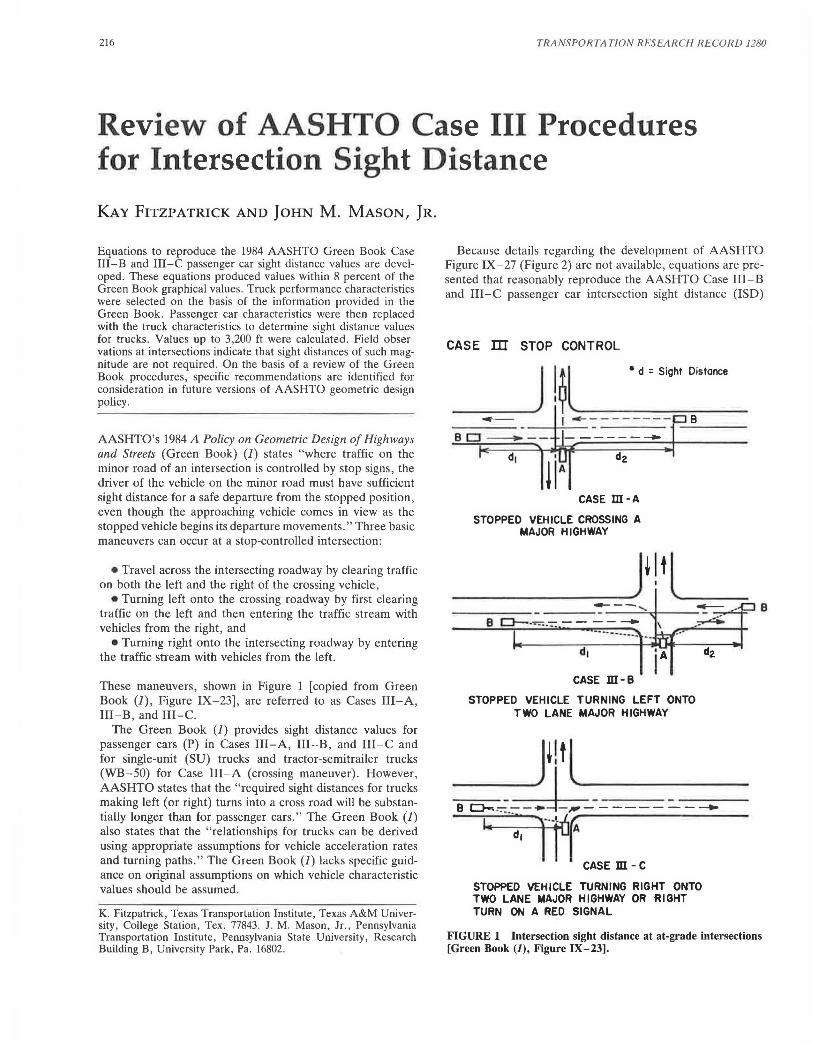
AASHTO's 1984 A Policy on Geometric Design of Highways and Streets (Green Book) (1) states "where traffic on the minor road of an intersection is controlled by stop signs, the driver of the vehicle on the minor road must have sufficient sight distance for a safe departure from the stopped position, even though the approaching vehicle comes in view as the stopped vehicle begins its departure movements." Three basic maneuvers can occur at a stop-controlled intersection:
• Travel across the intersecting roadway by clearing traffic on both the left and the right of the crossing vehicle,
• Turning left onto the crossing roadway by first clearing traffic on the left and then entering the traffic stream with vehicles from the right, and
• Turning right onto the intersecting roadway by entering the traffic stream with vehicles from the left.
These maneuvers, shown in Figure 1 [copied from Green Book (1), Figure IX-23), are referred to as Cases III-A, III-B, and III-C.
The Green Book (1) provides sight distance values for passenger cars (P) in Cases III-A, 111-B, and 111-C and for single-unit (SU) trucks and tractor-semitrailer trucks (WB-50) for Case III-A (crossing maneuver). However, AASHTO states that the "required sight distances for trucks making left (or right) turns into a cross road will be substantially longer than for passenger cars." The Green Book (1) also states that the "relationships for trucks can be derived using appropriate assumptions for vehicle acceleration rates and turning paths." The Green Book (1) lacks specific guidance on original assumptions on which vehicle characteristic values should be assumed.
K. Fitzpatrick, Texas Transportation Institute, Texas A&M University, College Station, Tex. 77843. J. M. Mason, Jr., Pennsylvania Transportation Institute , Pennsylvania State University, Research Building B, University Park, Pa. 16802.
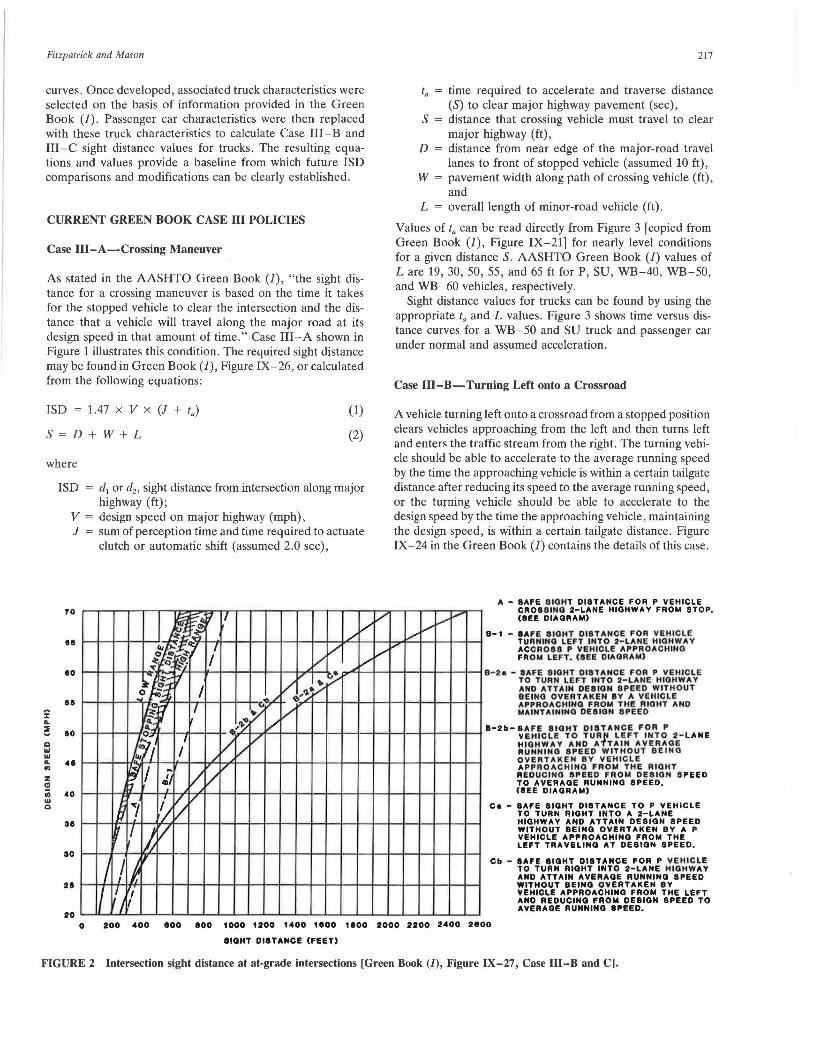
Because details regarding the development of AASHTO Figure IX-27 (Figure 2) are not available, equations are presented that reasonably reproduce the AASHTO Case III-B and 111-C passenger car intersection sight distance (ISD)
CASE ID STOP CONTROL
_J !Yl __ ·_ d = S-ight 0- istonc-e
- ---""'"'-·--_- - - - - - - - p_ e ___ _ B D ~ - - I- - -_ _ - - ---
I
ii~ CASE m-A
STOPPED VEHICLE CROSSING A MAJOR HIGHWAY
___ Y''L ----~-- ......
B 0---==--=: - - - - --··-·--.............
CASE m-e
STOPPED VEHICLE TURNING LEFT ONTO TWO LANE MAJOR HIGHWAY
----)jtl - --. ~~:.-lff ~~~~----
STOPPED VEHICLE TURNING RIGHT ONTO TWO LANE MAJOR HIGHWAY OR RIGHT TURN ON A RED SIGNAL
FIGURE 1 Intersection sight distance at at-grade intersections [Green Book (1), Figure IX-23] .
Fitzpatrick and Mason
curves. Once developed, associated truck characteristics were selected on the basis of information provided in the Green Book (1). Passenger car characteristics were then replaced with these truck characteristics to calculate Case III-B and IIl-C sight distance values for trucks. The resulting equations and values provide a baseline from which future ISD comparisons and modifications can be clearly established .
CURRENT GREEN BOOK CASE III POLICIES
Case III-A-Crossing Maneuver
As stated in the AASHTO Green Book (1), "the sight distance for a crossing maneuver is based on the time it takes for the stopped vehicle to clear the intersection and the distance that a vehicle will travel along the major road at its design speed in that amount of time ." Case III-A shown in Figure 1 illustrates this condition. The required sight distance may be found in Green Book (1), Figure IX-26, or calculated from the following equations:
ISD = 1.47 x V x (J + t.)
S=D + W+L
(1)
(2)
where
% ... ! ca .... .... ... "' z S! "' .... ca
ISD = d1 or d2 , sight distance from intersection along major highway (ft);
V = design speed on major highway (mph), J = sum of perception time and time required to actuate
clutch or automatic shift (assumed 2.0 sec) ,
10
811
eo
115
60
4'
40
311
m 'f 11 • I/ /
~~"'! I /v J ~ et. I v '\" ~;L
~~ljt ,, c.• ....
I v • ;.--
0 ~ 'lo•/ c.~
~,,,.
~ ~ I
~'9"' / y v
~,~
Lt~ I .Iv / I v
~! .. ~ /v I
Qlj I
A I v '/
""/ ~ / v I/ h v v
30
211
20
I I ,,
I / I J I
v
/
217
ta = time required to accelerate and traverse distance (S) to clear major highway pavement (sec),
S = distance that crossing vehicle must travel to clear major highway (ft) ,
D = distance from near edge of the major-road travel lanes to front of stopped vehicle (assumed 10 ft),
W = pavement width along path of crossing vehicle (ft), and
L = overall length of minor-road vehicle (ft).
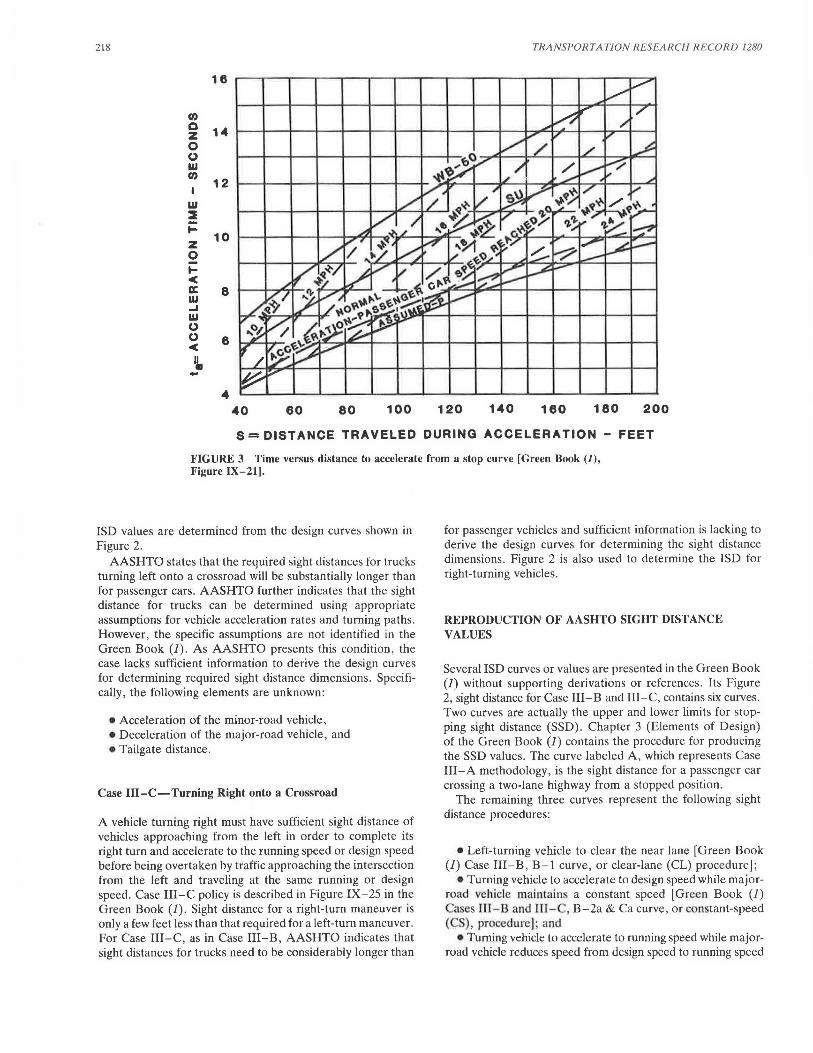
Values oft. can be read directly from Figure 3 [copied from Green Book (1), Figure IX-21] for nearly level conditions for a given distance S. AASHTO Green Book (J) values of Lare 19, 30, 50, 55 , and 65 ft for P, SU, WB-40, WB-50, and WB-60 vehicles , respectively.
Sight distance values for trucks can be found by using the appropriate t. and L values . Figure 3 shows time versus distance curves for a WB-50 and SU truck and passenger car under normal and assumed acceleration.
Case 111-B-Turning Left onto a Crossroad
A vehicle turning left onto a crossroad from a stopped position clears vehicles approaching from the left and then turns left and enters the traffic stream from the right. The turning vehicle should be able to accelerate to the average running speed by the time the approaching vehi~le is within a certain tailgate distance after reducing its speed to the average running speed, or the turning vehicle should be able to accelerate to the design speed by the time the approaching vehicle, maintaining the design speed, is within a certain tailgate distance. Figure IX-24 in the Green Book (J) contains the details of this case .
v ..... / v
v
A - SAFE SIGHT DISTANCE FOR P VEHICLE CROSSING 2-LANE HIGHWAY FROM STOP, (SEE DIAGRAM)
B-1 - SAFE SIGHT DISTANCE FOR VEHICLE TURNING LEFT INTO 2-LANE HIGHWAY ACCROSS P VEHICLE APPROACHING FROM LEFT. (SEE DIAGRAM)
B-2a - SAFE SIGHT DISTANCE FOR P VEHICLE TO TURN LEFT INTO 2-LANE HIGHWAY AND ATTAIN DESIGN SPEED WITHOUT BEING OVERTAKEN BY A VEHICLE APPROACHING FROM THE RIGHT AND MAINTAINING DESIGN SPEED
B-2b-SAFE SIGHT DISTANCE FOR P VEHICLE TO TURtl LE FT INTO 2-LANE HIG HW AY AND A1TAIN AVERAGE RUNNING SPEED WITHOUT BEING OV ERT AKEN BY VEHICLE APPROACHING FROM THE RIGHT REDUCING SPEED FROM DESIGN SPEED TO AVERAGE RUNNING SPEED. (SEE DIAGRAM)
Ca - SAFE SIGHT DISTANCE TO P VEHICLE TO TURN RIGHT INTO A 2-LANE HIGHWAY AND ATTAIN DESIGN SPEED WITHOUT BEING OVERTAKEN BY A P VEHICLE APPROACHING FROM THE LEFT TRAVELING AT DESIGN SPEED.
Cb - SAFE 81GHT DISTANCE FOR P VEHICLE TO TURN RIGHT INTO 2-LANE HIGHWAY AND ATTAIN AVERAGE RUNNING SPEED WITHOUT BEING OVERTAKEN BY VEHICLE APPROACHING FROM THE LEFT AND REDUCING FROM DEBIGN SPEED TO AVERAGE RUNNING SPEED.
0 200 400 soo soo 1000 1200 1400 1800 1800 2000 2200 2400 2800
SIGHT DISTANCE (FEET)
FIGURE 2 Intersection sight distance at at-grade intersections [Green Book (J), Figure IX-27, Case 111-8 and CJ.
218 TRANSPORTATION RESEARCH RECORD 1280
18
C1) Q
14 z 0 (,) w C1)
12
w ~
~ 10 z
0 ~ < a: w 8 ...I w (,) (,) 8 < I~ ..
4 40 80 80 100 120 140 180 180 200
S =DISTANCE TRAVELED DURING ACCELERATION - FEET
FIGURE 3 Time versus distance to accelerate from a stop curve [Green Book (1), Figure IX-21).
ISD values are determined from the design curves shown in Figure 2.
AASHTO states that the required sight distances for trucks turning left onto a crossroad will be substantially longer than for passenger cars. AASHTO further indicates that the sight distance for trucks can be determined using appropriate assumptions for vehicle acceleration rates and turning paths. However , the specific assumptions are not identified in the Green Book (1). As AASHTO presents this condition, the case lacks sufficient information to derive the design curves for determining required sight distance dimensions. Specifically, the following elements are unknown:
• Acceleration of the minor-road vehicle, • Deceleration of the major-road vehicle, and • Tailgate distance .
Case 111-C-Turning Right onto a Crossroad
A vehicle turning right must have sufficient sight distance of vehicles approaching from the left in order to complete its right turn and accelerate to the running speed or design speed before being overtaken by traffic approaching the intersection from the left and traveling at the same running or design speed. Case 111-C policy is described in Figure IX-25 in the Green Book (1). Sight distance for a right-tum maneuver is only a few feet less than that required for a left-turn maneuver. For Case 111-C, as in Case III-B, AASHTO indicates that sight distances for trucks need to be considerably longer than
for passenger vehicles and sufficient information is lacking to derive the design curves for determining the sight distance dimensions. Figure 2 is also used to determine the ISD for right-turning vehicles.
REPRODUCTION OF AASHTO SIGHT DISTANCE VALUES
Several ISD curves or values are presented in the Green Book (1) without supporting derivations or references . Its Figure 2, sight distance for Case III-Band 111-C, contains six curves. Two curves are actually the upper and lower limits for stopping sight distance (SSD). Chapter 3 (Elements of Design) of the Green Book (1) contains the procedure for producing the SSD values. The curve labeled A , which represents Case III-A methodology, is the sight distance for a passenger car crossing a two-lane highway from a stopped position.
The remaining three curves represent the following sight distance procedures:
•Left-turning vehicle to clear the near lane (Green Book (1) Case III-B, B-1 curve, or clear-lane (CL) procedure];
• Turning vehicle to accelerate to design speed while majorroad vehicle maintains a constant speed (Green Book (1)
ases lll - B and lll - B-2a & Ca curve , or con tant-speed ( ), pro edure]; and
• Turning vehicle to accelerate to running speed while majorroad vehicle reduces speed from design speed to running speed
Fitzpatrick and Mason
[Green Book (1) Case III-B and III-C, B-2b & Cb curve, or reduced-speed (RS) procedure].
These three curves lack sufficient information to easily identify ome of the a umed parameter values. Using the informati n that is provid d in the Green Book (1), and making some reasonable assumptions for the missing information, the identified curves were reproduced as presented.
Vehicle Acceleration From a Stopped Position
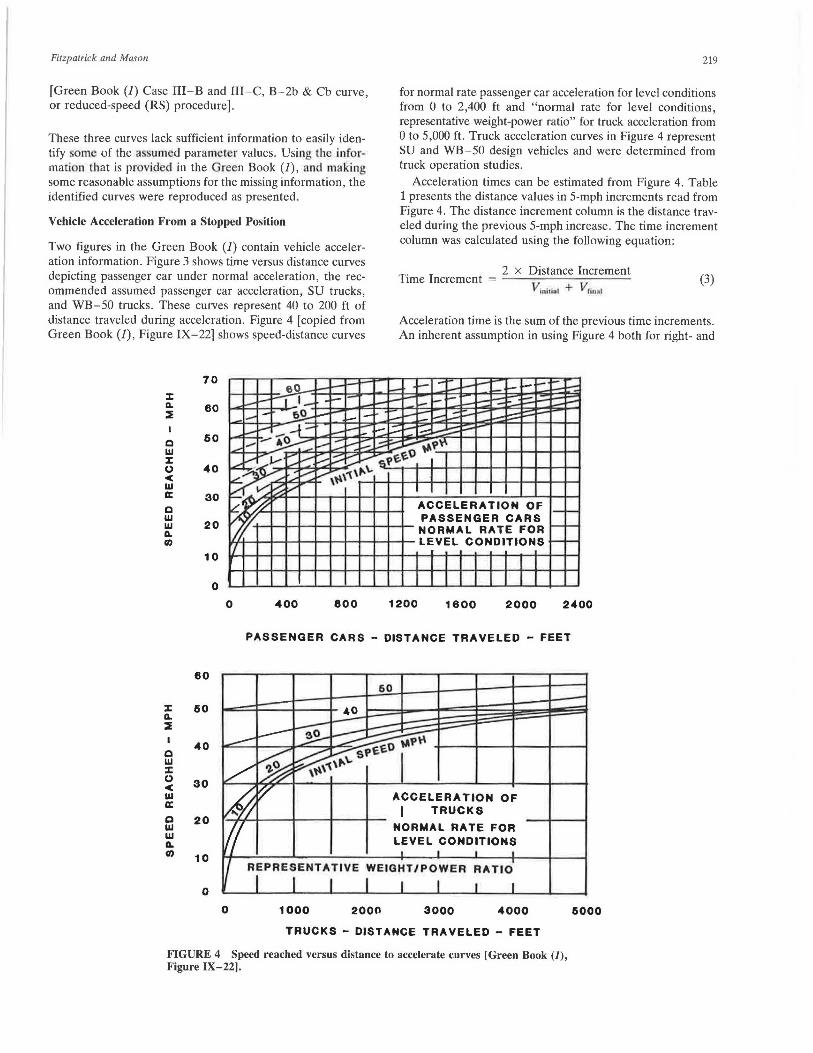
Two figures in the Green Book (1) contain vehicle acceleration information . Figure 3 shows time versus distance curves depicting passenger car under normal acceleration, the recommended assumed passenger car acceleration, SU trucks, and WB-50 trucks. These curves represent 40 to 200 ft of distance traveled during acceleration. Figure 4 [copied from Green Book (1), Figure IX-22] shows speed-distance curves
70 :c Q. 60 ~
60 i.-- .-i--
i..- - I _1 _ • i--L.,..o - - 6~ i-- -1- ._ .......
219
for normal rate passenger car acceleration for level conditions from 0 to 2,400 ft and "normal rate for level conditions, representative weight-power ratio" for truck acceleration from 0 to 5,000 ft. Truck acceleration curves in Figure 4 represent SU and WB-50 design vehicles and were determined from truck operation studies.
Acceleration times can be estimated from Figure 4. Table 1 presents the distance values in 5-mph increments read from Figure 4. The distance increment column is the distance traveled during the previous 5-mph increase. The time increment column was calculated using the following equation:
Time Increment 2 x Distance Increment
(3)
Acceleration time is the sum of the previous time increments. An inherent assumption in using Figure 4 both for right- and
• i-- - L.,..o i- ...- lo- - ,... """': '-- - lo-
i..-- I-,.....
'-- i-- '"-::: -- _,.... ...... [...- i..-
,...... i- i..:: t:- ...-
I 60
i..- i--" -_. - i..-i..-,_ 1-t...-'-:I~~ ~,__ ,._~
Q w ::z:: (,) ofO <( w a: 30 Q w w 20 Q. ff)
10
0
60
::z:: 60 Q.
:I I
40 Q w x (,)
30 <( w a: Q
"' 20
"' Q. 0 10
0
- _:::.. i..-....-t.;:::i:::;~-~,,\'\ --- -~~:~
v~':... L--"" ~,,~~o 1
v ,~,~\~\. ' ~t/ I
~ ·~ Y.P IL ' ACCELERATION OF ·-,.._
~ PASSENGER CARS NORMAL RATE FOR
,__ ..._
LEVEL CONDITIONS ,__ ..._ '/ I • I I
0 400 800 1200 1600 2000 2400
PASSENGER CARS - DISTANCE TRAVELED - FEET
0 1000
60
ACCELERATION OF I TRUCKS
NORMAL RATE FOR LEVEL CONDITIONS
WEIGHT/POW E R RATIO
2000 3000 4000
TRUCKS - DISTANCE TRAVELED - FEET
6000
FIGURE 4 Speed reached versus distance to accelerate curves [Green Book (1), Figure IX-22].
220
TABLE 1 DISTANCE AND TIME VALUES ON THE BASIS OF FIGURE 4
Distance Distance Time Acceleration Speed Traveled* Increment Increment Time (mi/h) (ft) (ft) (sec) (sec)
Pa·ssenger Cars
5 10 10 2.72 2.72 10 30 20 1. 81 4 . 54 15 50 20 1.09 5 . 62 20 125 75 2.92 8.54 25 210 85 2.57 11.11 30 350 140 3.46 14.57 35 550 200 4.19 18.76 40 800 250 4.54 23.29 45 1,075 275 4.40 27.70 50 1,400 325 4.65 32 . 35 55 1,800 400 5 . 18 37.53 60 2,300 500 5 . 92 43.45 65 2,900 600 6.53 49.98 70 3,600 700 7.05 57.03
Trucks
5 so 50 13.61 13.61 10 100 50 4.54 18.14 15 175 75 4 . 08 22 . 22 20 275 100 3.89 26.11 25 450 175 5.29 31.40 30 700 250 6.18 37 . 58 35 1,200 500 10.47 48 . 05 40 1 ,900 700 12.70 60.75 45 3,200 1,300 20.81 81.56 50 5 ,000 1,800 25.78 107 , 34
*Values read from figure 4 .
Q
P-Dn
H = P-Dn -MS-L+R
e -..---~--
- " ISDe-1
~ 0:: 0 z :IE
R
\ \
TRANSPORTATION RESEARCH RECORD 1280
left-turning vehicles is that the acceleration rates for the turn-ing maneuvers are not significantly different.
AASHTO B-1 Curve or Clear Lane (CL)
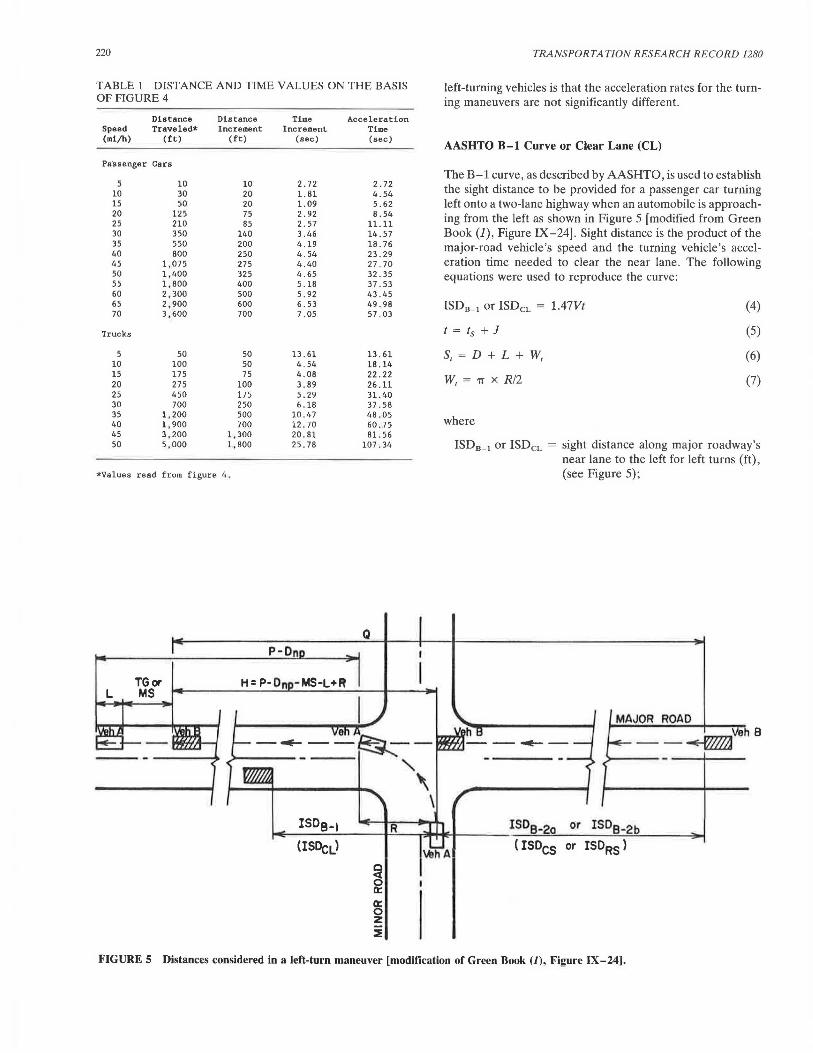
The B-1 curve, as described by AASHTO, is used to establish the sight distance to be provided for a passenger car turning left onto a two-lane highway when an automobile is approach-ing from the left as shown in Figure 5 [modified from Green Book (1), Figure IX-24]. Sight distance is the product of the major-road vehicle's speed and the turning vehicle's accel-eration time needed to clear the near lane. The following equations were used to reproduce the curve:
ISD8 _ 1 or ISDcL = l.47Vt (4)
t = 15 + J (5)
S, = D + L + w, (6)
W, = 1T x R/2 (7)
where
ISD8 _ 1 or ISDcL = sight distance along major roadway's near lane to the left for left turns (ft), (see Figure 5);
MAJOR ROAD
--~eB
ISDa-20 or ISDe-2b
( ISDcs or ISDRS )
FIGURE 5 Distances considered in a left-turn maneuver [modification of Green Book (]), Figure IX-241.
Fitzpatrick and Mason
t = time for stopped minor-road vehicle to initiate turn and clear the near lane (sec);
t5 time required by turning vehicle to accelerate and traverse distance (SJ to clear near lane (sec);
S, distance that turning vehicle must travel to clear near lane (ft);
W, distance traversed along path of turning vehicle (ft);
L = length of minor-road vehicle (ft); and R = radius of turn for minor-road vehicle
(ft).
Data for ts are available from Figure 4 and Table 1. AASHTO Green Book (J) values of R are 40, 50, and 60 ft for the P, SU, and WB-50 vehicles, respectively, for left turns, and 24, 42, and 45 ft, respectively, for right turns.
Values from the Green Book B-1 curve were used to calculate acceleration times (ts)· Assuming perception-reaction time J of 2.0 sec, the ts value averaged 7.4 sec. Using data derived from Figure 4 or Table 1, the distance traveled S, by a passenger car during 7.4 sec i 95 ft. Assuming a vehicle length L of 19 ft and a 10-ft di tance D between edge of travel way and front of the vehicle, the pavement traversed W, along the turning path of the vehicle is 66 ft, which results in a 42-ft radius . Control radius R for a left-turning passenger car from the Green Book (J) is 40 ft. The 42-ft radius is within an acceptable range of an assumed 40-ft radius. As such, the acceleration time (ts) and distance (S,) values used to generate the B-1 curve agree with Figure 4.
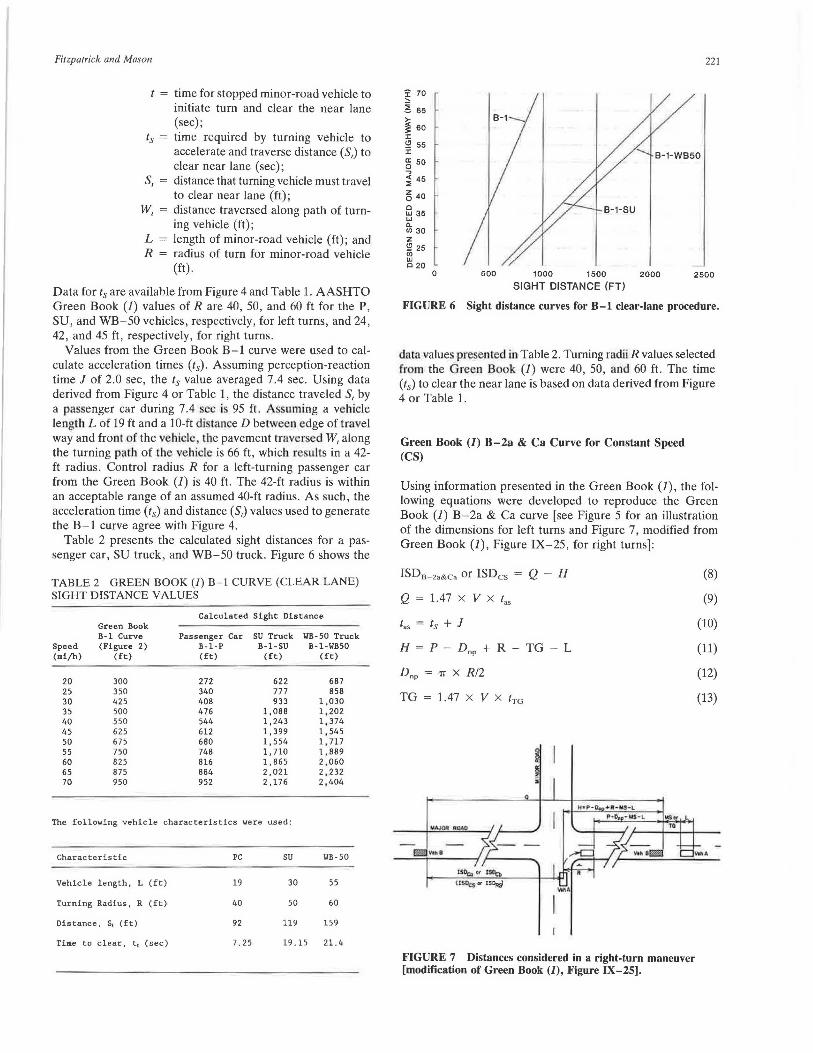
Table 2 presents the calculated sight distances for a passenger car, SU truck, and WB-50 truck. Figure 6 shows the
TABLE 2 GREEN BOOK (I) B-1 CURVE (CLEAR LANE) SIGHT DISTANCE VALUES
Speed (mijh)
20 25 30 35 40 45 50 55 60 65 70
Green Book B-1 Curve (Figure 2)
(ft)
300 350 425 500 550 625 675 750 825 875 950
Calculated Sight Distance
Passenger Car B-1-P (ft)
272 340 408 476 544 612 680 748 816 884 952
SU Truck B-1-SU (ft)
622 777 933
1,088 1,243 1,399 1,554 1,710 1,865 2,021 2,176
WB-50 Truck B-l-WB50
(ft)
687 858
1,030 1,202 1,374 1,545 1, 717 1,889 2,060 2,232 2,404
The following vehicle characteristics were used:
Characteristic PC SU WB - 50
Vehicle length, L (ft) 19 30 55
Turning Radius, R (ft) 40 50 60
Distance, s, (ft) 92 119 159
Time to clear, t 1 (sec) 7.25 19.15 21.4
221
~ 70
~ 65 ),
~ 60 :c ~ 55 :c ~ 50
< 45 :!:
~ 40 0 LU 35 LU <>. (/) 30 z ~ 25 (/) LU 0 20
0 500 1000 1500 2000 2500
SIGHT DISTANCE (FT}
FIGURE 6 Sight distance curves for B-1 clear-lane procedure.
data values presented in Table 2. Turning radii R values selected from the Green Book (J) were 40, 50, and 60 ft. The time (ts) to clear the near lane is based on data derived from Figure 4 or Table 1.
Green Book (J) B-2a & Ca Curve for Constant Speed (CS)
Using information presented in the Green Book (J), the following equations were developed to reproduce the Green Book (J) B-2a & Ca curve [see Figure 5 for an illustration of the dimensions for left turns and Figure 7, modified from Green Book (J), Figure IX-25, for right turns]:
ISDB-2a&Ca or ISDcs = Q - H
Q = 1.47 X V X tas
t.s = ts + J
H = P - D"P + R - TG - L
D"P = TI x R/2
TG = 1.47 x v x tTG
FIGURE 7 Distances considered in a right-turn maneuver [modification of Green Book (1), Figure IX-25).
(8)
(9)
(10)
(11)
(12)
(13)
222
where
ISDB-2a&Ca or ISDcs sight distance along major roadway's far lane to the right for left turns and along near lane to the left for right turns assuming the major-road vehicle maintains constant speed during minor-road vehicle's turning maneuver (ft) (see Figures 5 or 7),
Q distance traveled by major-road vehicle during minor-road vehicle's turning maneuver (ft),
H = major-road vehicle's distance from intersection when at assumed tailgate distance to minor-road vehicle (ft),
time for stopped minor-road vehicle to move into traffic stream and accelerate to design speed (sec),
P = total distance traveled by minorroad vehicle from stopped position to location when design speed is achieved (ft) (data derived from Figure 4 or Table 1),
D"P distance minor-road vehicle traveled during the turning maneuver that is not parallel to major highway (ft),
TG = tailgate distance (ft), and
tTG = tailgate time (sec).
If the major-road vehicle maintains a constant speed during the turn maneuver, the distance Q is constant speed V multiplied by the time for the minor-road vehicle to complete the turn maneuver. Time t., would equal the minor-road driver's perception-reaction time J plus the time t5 from when the vehicle began moving to the time when the turning vehicle reached the same speed as the major-road vehicle. A perception-reaction time value for the turning vehicle driver is not mentioned in the Green Book (1). The 2.0 sec used for the crossing maneuver (Case III-A) was assumed for the turning maneuvers.
The Green Book (1) does not provide information on how to derive tailgate distance TG. Experimenting with different values for TG to provide the closest estimate of the B-2a & Ca curve resulted in a vehicle separation time (tTG) of 1.0 sec. Tailgate distance, measured from the rear of the turning vehicle to the front of the oncoming vehicle, is the product of the speed of the major-road vehicle (V) and the 1.0-sec interval.
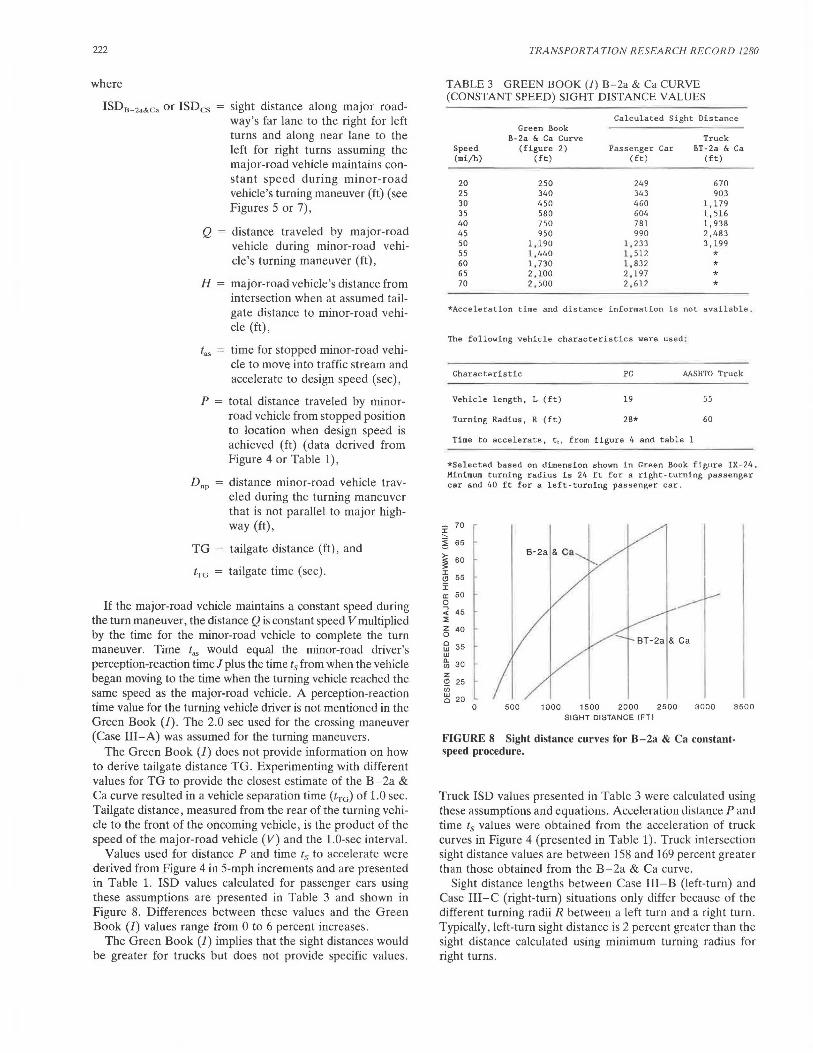
Values used for distance P and time t5 to accelerate were derived from Figure 4 in 5-mph increments and are presented in Table 1. ISD values calculated for passenger cars using these assumptions are presented in Table 3 and shown in Figure 8. Differences between these values and the Green Book (1) values range from 0 to 6 percent increases.
The Green Book (1) implies that the sight distances would be greater for trucks but does not provide specific values.
TRANSPORTATION RESEARCH RECORD 1280
TABLE 3 GREEN BOOK (J) B-2a & Ca CURVE (CONSTANT SPEED) SIGHT DISTANCE VALUES
Calculated Sight Distance Green Book
B-2a & Ca Curve Truck Speed (figure 2) Passenger Car BT-2a & Ca (mi/h) (ft) (ft) (ft)
20 250 249 670 25 340 343 903 30 450 460 1,179 35 580 604 1,516 40 750 781 1,938 45 950 990 2 ,483 so 1,190 1,233 3,199 55 1,440 1 , 512 * 60 1, 730 1,832 * 65 2,100 2,197 * 70 2,500 2,612 *
*Acceleration time and distance information is not available.
The following vehicle characteristics were used :
Characteristic PG AASHTO Truck
Vehicle length, L (ft) 19 55
Turning Radius, R (ft) 28* 60
Time to accelerate, tt, from figure 4 and table 1
*Selected based on dimension shown in Green Book figure IX-24. Minimum turning radius is 24 ft for a right-turning passenger car and 40 ft for a left-turning passenger car.
~ 70
~ 65
~ s:: 60 I
55 ~ I a: 50 s;
45 < ::; z 40 0 0 35 w w g; 30 z (!) 25 u; ~ 20
0 500 1000 1500 2000 2500 3000 3500 SIGHT DISTANCE (FT)
FIGURE 8 Sight distance curves for B-2a & Ca constantspeed procedure.
Truck ISD values presented in Table 3 were calculated using these assumptions and equations. Accderaliun uislam:e P and time t5 values were obtained from the acceleration of truck curves in Figure 4 (presented in Table 1) . Truck intersection sight distance values are between 158 and 169 percent greater than those obtained from the B-2a & Ca curve.
Sight distance lengths between Case III-B (left-tum) and Case III-C (right-turn) situations only differ because of the different turning radii R between a left turn and a right turn. Typically, left-tum sight distance is 2 percent greater than the sight distance calculated using minimum turning radius for right turns.
Fitzpatrick and Mason
Green Book (1) B-2b & Cb, or Reduced-Speed (RS), Curve
The B-2b & Cb curve represents the condition in which the major-road vehicle decelerates during the turning maneuver of a minor-road vehicle (see Figures 5 and 7), which appears to more closely represent actual operations at an intersection. The following equations were developed to reproduce the curve:
ISD8 _ 2b&Cb or ISDRs = Q - H (14)
(15)
(16)
(17)
(18)
(19)
(20)
(21)
(22)
fdee = (2 X Ddee)/(1.47)(Vds + V,,)
H = P - D nr + R - TG - L
Dnr = 'TT x R/2
TG = 1.47 x v,, x (TG
where
ISD 8 _ 2b&Cb or ISDRs = sight distance along major roadway's far lane to the right for left turns and along the near lane to the left for right turns, assuming that major-road vehicle reduces speed from design speed to running speed during minor-road vehicle's turning maneuver (ft) (see Figures 5, 7);
vds design speed of major-road vehicle (mph);
td, time major-road vehicle is at design speed during turning maneuver (sec);
Ddee = distance major-road vehicle traversed during deceleration (ft), data derived from Green Book (J), Figure 11-13;
tdee = time major-road vehicle is decelerating (sec);
V,, = running speed of major-road vehicle (mph);
t,, = time major-road vehicle is at running speed during turning maneuver (sec);
t0 , = acceleration time for the minorroad vehicle to achieve running speed from a stopped position (sec), data derived from Figure 4 or Table 1; and
tr, = perception-reaction time for the major-road driver (assumed to be 2.0 sec).
Tailgate time tTG is assumed to be 1.0 sec.
223
The Green Book (J) does not include a discussion on how to calculate distance Q traversed by the major-road vehicle during the turning vehicle's maneuver. Calculation for this distance is more complex than for the previous situation. Distance Q comprises three segments: distance traveled at design speed, distance traveled while decelerating from design speed to running speed Ddee• and distance traveled at running speed. Time at design speed was assumed to equal the minor-road driver's perception time J plus the major-road driver's perception-reaction time tr" assuming that the major-road driver begins to decelerate when initiation of the minor-road vehicle's turn maneuver is perceived.
Distance to decelerate Ddee is available from Green Book (1), Figure 11-13. Final speed curves of 50, 40, 30, 20, and 0 mph are also available . Reductions to 55 mph or greater can be determined using a comfortable deceleration rate of 3.3 mph/sec as discussed by the ITE (2). Time to decelerate tdec can be calculated from distance to decelerate Ddee using Equation 19. Time spent at running speed t" can then be calculated by subtracting the time at design speed tds and time to decelerate tdee from the turning maneuver time t.
Distance P covered by the minor-road vehicle for this situation is similar to the constant-speed procedure except the vehicle is accelerating to running speed instead of design speed. Tailgate distance TG is based on running speed.
Trial and error was used to estimate the speed reduction of the major-road vehicle used in the Green Book (1). Findings based on these assumptions agreed with the B-2b & Cb curve to within 8 percent. Speed reductions in 5-rnph increments that provided the best agreement with the Green Book (J) curves were
•No speed reduction for design speeds less than 30 mph, • Speed reduction of 5 mph for design speeds between 30
and 65 mph, and • Speed reduction of 10 mph for design speed of 70 mph.
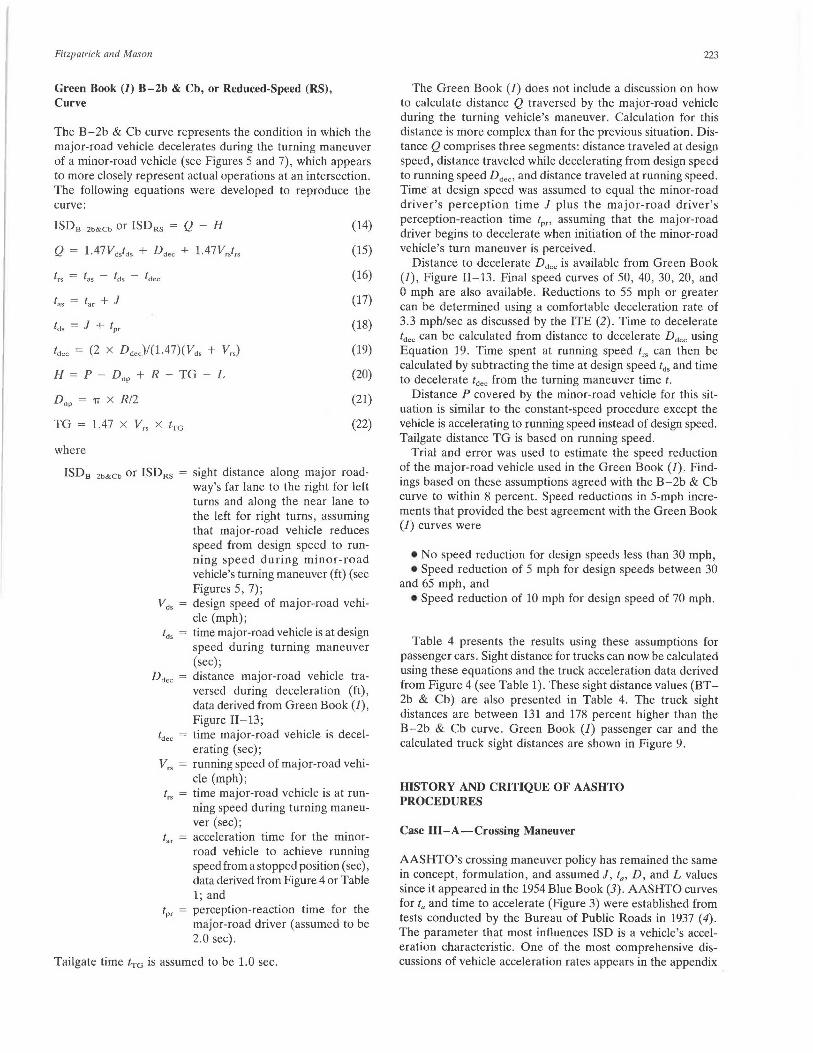
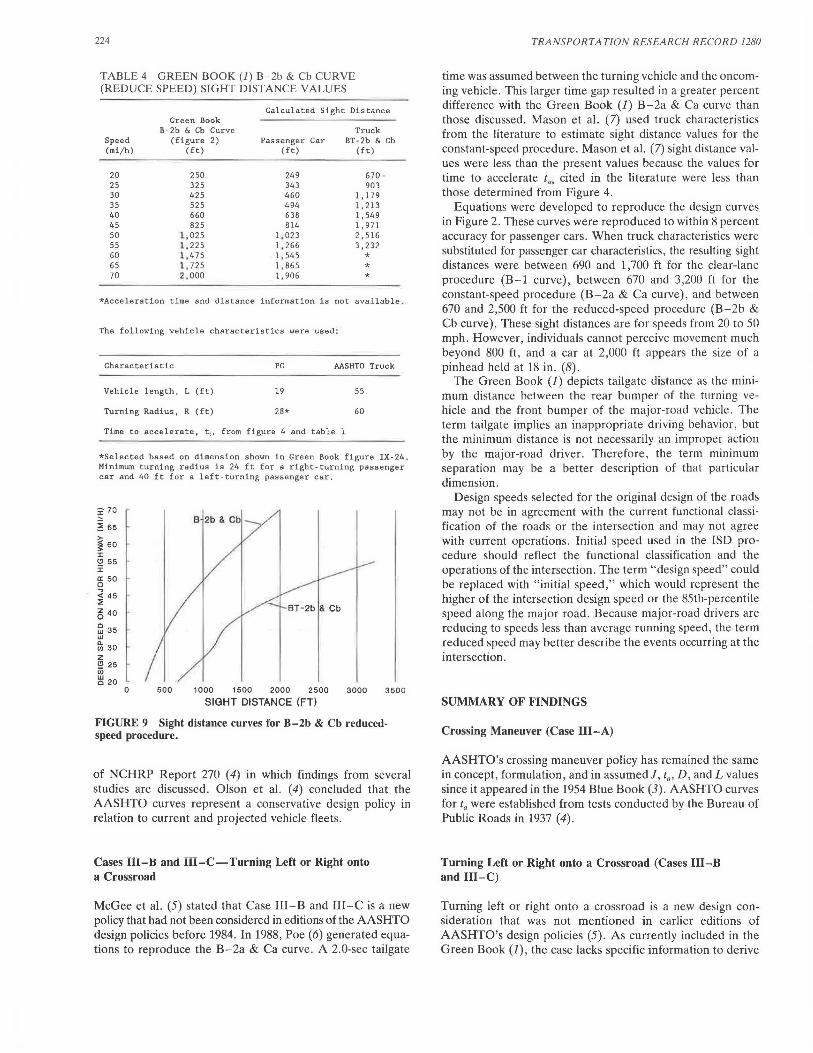
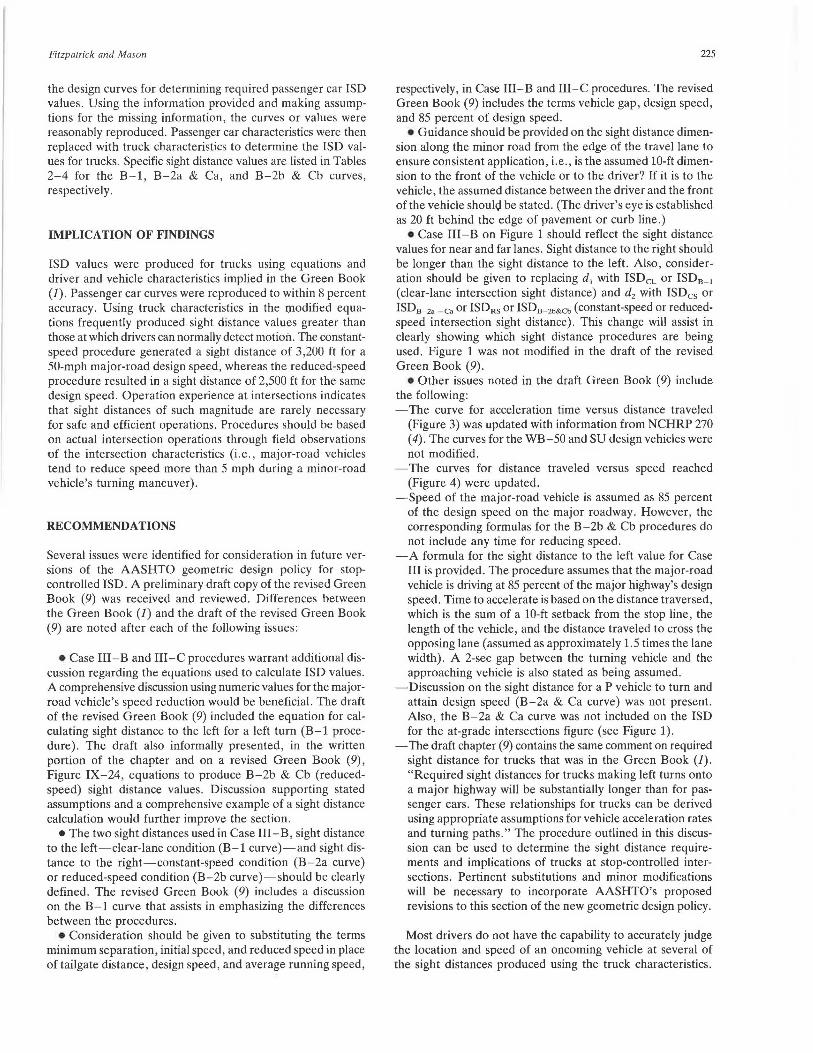
Table 4 presents the results using these assumptions for passenger cars. Sight distance for trucks can now be calculated using these equations and the truck acceleration data derived from Figure 4 (see Table 1). These sight distance values (BT-2b & Cb) are also presented in Table 4. The truck sight distances are between 131 and 178 percent higher than the B-2b & Cb curve. Green Book (1) passenger car and the calculated truck sight distances are shown in Figure 9.
HISTORY AND CRITIQUE OF AASHTO PROCEDURES
Case III-A-Crossing Maneuver
AASHTO's crossing maneuver policy has remained the same in concept, formulation, and assumed J, ta, D, and L values since it appeared in the 1954 Blue Book (3). AASHTO curves for ta and time to accelerate (Figure 3) were established from tests conducted by the Bureau of Public Roads in 1937 ( 4). The parameter that most influences ISD is a vehicle's acceleration characteristic. One of the most comprehensive discussions of vehicle acceleration rates appears in the appendix
224
TABLE 4 GREEN BOOK (1) B-2b & Cb CURVE (REDUCE SPEED) SIGHT DISTANCE VALUES
Calculated Sight Distance Green Book
B-2b & Cb Curve Truck Speed (figure 2) Passenger Car BT-2b & Cb (mi/h) (ft) (ft) (ft)
20 250 249 670 25 325 343 qo1 30 425 460 1,179 35 525 494 1,213 40 660 638 1,549 45 825 814 1, 971 50 l,025 1,023 2,516 55 1,225 1,266 3,232 60 l,475 1,545 * 65 1,725 1,865 * 70 2 ,000 1,906 *
*Acceleration time and distance information is not available .
The following vehicle characteristics were used :
Characteristic PC AASHTO Truck
Vehicle length, L (ft) 19 55
Turning Radius, R (ft) 28* 60
Time to accelerate, tt, from figure 4 and table 1
*Selected based on dimension shown ln Green Book figure IX-24 . Minimum turning radius is 24 ft for a right-turning passenger car and 40 ft for a left-turning passenger car.
~ 70
~ 65 >-~ 60 I (!) 55 :;: a: 50 0 .., < 45 ::;:
~ 40
fil 35 -w g; 30 z (!) 25 iii :g 20
0 500
e 12b & Cb -
1000 1500 2000 2500 3000 3500
SIGHT DISTANCE (FT)
FIGURE 9 Sight distance curves for B-2b & Cb reducedspeed procedure.
of NCHRP Report 270 ( 4) in which findings from several studies are discussed. Olson et al. ( 4) concluded that the AASHTO curves represent a conservative design policy in relation to current and projected vehicle fleets.
Cases 111-B and 111-C-Turning Left or Right onto a Crossroad
McGee et al. (5) stated that Case IIl-B and III-C is a new policy that had not been considered in editions of the AASHTO design policies before 1984. In 1988, Poe (6) generated equations to reproduce the B-2a & Ca curve. A 2.0-sec tailgate
TRANSPORTATION RESEARCH RECORD 1280
time was assumed between the turning vehicle and the oncoming vehicle. This larger time gap resulted in a greater percent difference with the Green Book (J) B-2a & Ca curve than those discussed. Mason et al. (7) used truck characteristics from the literature to estimate sight distance values for the constant-speed procedure. Mason et al. (7) sight distance values were less than the present values because the values for time to accelerate t0 , cited in the literature were less than those determined from Figure 4.
Equations were developed to reproduce the design curves in Figure 2. These curves were reproduced to within 8 percent accuracy for passenger cars. When truck characteristics were substituted for passenger car characteristics, the resulting sight distances were between 690 and 1,700 ft for the clear-lane procedure (B-1 curve), between 670 and 3,200 ft for the constant-speed procedure (B-2a & Ca curve), and between 670 and 2,500 ft for the reduced-speed procedure (B-2b & Cb curve). These sight distances are for speeds from 20 to 50 mph. However , individuals cannot perceive movement much beyond 800 ft, and a car at 2,000 ft appears the size of a pinhead held at 18 in. (8).
The Green Book (J) depicts tailgate distance as the minimum distance hetween the re;ir bumper of the turning vehicle and the front bumper of the major-road vehicle . The term tailgate implies an inappropriate driving behavior, but the minimum distance is not necessarily an improper action by the major-road driver. Therefore, the term mm1mum separation may be a better description of that particular dimension.
Design speeds selected for the original design of the roads may not be in agreement with the current functional classification of the roads or the intersection and may not agree with current operations. Initial speed used in the ISD procedure should reflect the functional classification and the operations of the intersection. The term "design speed" could be replaced with "initial speed," which would represent the higher of the intersection design speed or the 85th-percentile speed along the major road. Because major-road drivers are reducing to speeds less than average running speed, the term reduced speed may better describe the events occurring at the intersection.
SUMMARY OF FINDINGS
Crossing Maneuver (Case III-A)
AASHTO's crossing maneuver policy has remained the same in concept, formulation, and in assumed J, ta, D, and L values since it appeared in the 1954 Blue Book (3). AASHTO curves for 1. were established from tests conducted by the Bureau of Public Roads in 1937 (4).
Turning Left or Right onto a Crossroad (Cases 111-B and III-C)
Turning left or right onto a crossroad is a new design consideration that was not mentioned in earlier editions of AASHTO's design policies (5). As currently included in the Green Book (J), the case lacks specific information to derive
Fitzpatrick and Mason
the design curves for determining required passenger car ISD values. Using the information provided and making assumptions for the missing information, the curves or values were reasonably reproduced . Passenger car characteristics were then replaced with truck characteristics to determine the ISD values for trucks. Specific sight distance values are listed in Tables 2-4 for the B-1, B-2a & Ca, and B-2b & Cb curves, respectively.
IMPLICATION OF FINDINGS
ISD values were produced for trucks using equations and driver and vehicle characteristics implied in the Green Book (1). Passenger car curves were reproduced to within 8 percent accuracy. Using truck characteristics in the rnodified equations frequently produced sight distance values greater than those at which drivers can normally detect motion. The constantspeed procedure generated a sight distance of 3,200 ft for a 50-mph major-road design speed, whereas the reduced-speed procedure resulted in a sight distance of 2,500 ft for the same design speed. Operation experience at intersections indicates that sight distances of such magnitude are rarely necessary for safe and efficient operations. Procedures should be based on actual intersection operations through field observations of the intersection characteristics (i .e., major-road vehicles tend to reduce speed more than 5 mph during a minor-road vehicle's turning maneuver).
RECOMMENDATIONS
Several issues were identified for consideration in future versions of the AASHTO geometric design policy for stopcontrolled ISD. A preliminary draft copy of the revised Green Book (9) was received and reviewed. Differences between the Green Book (1) and the draft of the revised Green Book (9) are noted after each of the following issues:
•Case 111-B and III-C procedures warrant additional discussion regarding the equations used to calculate ISD values. A comprehensive discussion using numeric values for the majorroad vehicle's speed reduction would be beneficial. The draft of the revised Green Book (9) included the equation for calculating sight distance to the left for a left turn (B-1 procedure). The draft also informally presented, in the written portion of the chapter and on a revised Green Book (9), Figure IX-24, equations to produce B-2b & Cb (reducedspeed) sight distance values. Discussion supporting stated assumptions and a comprehensive example of a sight distance calculation would further improve the section.
• The two sight distances used in Case III - B, sight distance to the left-clear-Jane condition (B-1 curve)-and sight distance to the right-constant-speed condition (B-2a curve) or reduced-speed condition (B-2b curve)-should be clearly defined . The revised Green Book (9) includes a discussion on the B-1 curve that assists in emphasizing the differences between the procedures.
• Consideration should be given to substituting the terms minimum separation, initial speed, and reduced speed in place of tailgate distance, design speed, and average running speed,
225
respectively, in Case IIl-B and III-C procedures. The revised Green Book (9) includes the terms vehicle gap, design speed, and 85 percent of design speed.
• Guidance should be provided on the sight distance dimension along the minor road from the edge of the travel Jane to ensure consistent application, i.e., is the assumed 10-ft dimension to the front of the vehicle or to the driver? If it is to the vehicle, the assumed distance between the driver and the front of the vehicle shoulQ be stated. (The driver's eye is established as 20 ft behind the edge of pavement or curb line.)
•Case III-B on Figure 1 should reflect the sight distance values for near and far lanes. Sight distance to the right should be longer than the sight distance to the left. Also, consideration should be given to replacing d1 with ISDcL or ISDB-i (clear-lane intersection sight distance) and d2 with ISDcs or ISDB-ia-ea or ISDRs or ISDB-zb&Ch (constant-speed or reducedspeed intersection sight distance). This change will assist in clearly showing which sight distance procedures are being used. Figure 1 was not modified in the draft of the revised Green Book (9).
• Other issues noted in the draft Green Book (9) include the following: -The curve for acceleration time versus distance traveled
(Figure 3) was updated with information from NCHRP 270 ( 4). The curves for the WB-50 and SU design vehicles were not modified.
-The curves for distance traveled versus speed reached (Figure 4) were updated.
-Speed of the major-road vehicle is assumed as 85 percent of the design speed on the major roadway. However, the corresponding formulas for the B-2b & Cb procedures do not include any time for reducing speed.
-A formula for the sight distance to the left value for Case III is provided. The procedure assumes that the major-road vehicle is driving at 85 percent of the major highway's design speed. Time to accelerate is based on the distance traversed, which is the sum of a 10-ft setback from the stop line, the length of the vehicle, and the distance traveled to cross the opposing lane (assumed as approximately 1.5 times the lane width). A 2-sec gap between the turning vehicle and the approaching vehicle is also stated as being assumed.
- Discussion on the sight distance for a P vehicle to turn and attain design speed (B-2a & Ca curve) was not present. Also, the B-2a & Ca curve was not included on the ISD for the at-grade intersections figure (see Figure 1).
-The draft chapter (9) contains the same comment on required sight distance for trucks that was in the Green Book (1). "Required sight distances for trucks making left turns onto a major highway will be substantially longer than for passenger cars. These relationships for trucks can be derived using appropriate assumptions for vehicle acceleration rates and turning paths." The procedure outlined in this discussion can be used to determine the sight distance requirements and implications of trucks at stop-controlled intersections. Pertinent substitutions and minor modifications will be necessary to incorporate AASHTO's proposed revisions to this section of the new geometric design policy.
Most drivers do not have the capability to accurately judge the location and speed of an oncoming vehicle at several of the sight distances produced using the truck characteristics.
226
Generally speaking, intersections currently operate with sight distances less than those calculated. For practical reasons, ISD procedures should reflect actual field operations. For example, individual parameter values used in the Green Book (J) ISD procedures should represent current and future vehicle and driver characteristics, or both, which can be accomplished by explicitly considering gaps in the major-road traffic that are accepted by minor-road drivers.
ACKNOWLEDGMENT
Portions of the work reported in this paper were part of a project sponsored by FHWA, U.S. Department of Transportation. The authors wish to thank Kevin Slack for his review of the numerous calculations and formulas contained in this paper.
REFERENCES
1. A Policy on Geometric Design of Highways and Streets. AASHTO, Washington, D.C., 1984.
2. W. S. Homburger. Transportation and Traffic Engineering Handbook, 2nd ed., ITE, Washington, D .C., 1982.
TRA NSPORTA TION RESEA RCH RECORD 1280
3. A Policy on Geometric Design of Rural Highways. AASHO, Washington, D.C., 1954.
4. P . L. Olson, D. E. Cleveland, P. S. Fancher, L. P. Kotyniuk, and L. W. Schneider. NCHRP Report 270: Parameters Affecting Stopping Sight Distance. TRB, National Research Council, Washington, D.C., 1984.
5. H. W. McGee, R. S. Rizzo, and B. Tustin. Highway Design and Operations Standards Affected by Vehicle Characteristics. Report FHWA/RD-86/044, FHWA, U.S. Department of Transportation, Dec. 1984.
6. C. Poe. An Investigation of Sight Distance at Intersections. !TE Journal, Dec. 1988.
7. J. M. Mason , K. Fitzpatrick , and D. W. Harwood. Intersection Sight Distance Requirements for Large Trucks. In Transportation Research Record 1208, TRB, National Research Council, Washington, D.C., 1989.
8. C. Tunnard and B. Pushkarev. Man-Made America: Chaos or Control? Yale University Press, New Haven , Conn ., 1963.
9. A Policy on Geometric Design of Highways and Streets, Draft Chapter IX. AASHTO, Washington, D.C., 1989.
The contents of this paper reflect the views of the authors, who are responsible for the facts and the accuracy of the data presented herein. The contents do not necessarily reflect the official views or policies of FHWA or the U.S. Department of Transportation.
Publication of this paper sponsored by Committee on Geometric Design.