Review of 600–2500 kW sized wind turbines and optimization of hub height for maximum wind energy...
11
Renewable and Sustainable Energy Reviews 15 (2011) 3839–3849 Contents lists available at ScienceDirect Renewable and Sustainable Energy Reviews journal homepage: www.elsevier.com/locate/rser Review of 600–2500 kW sized wind turbines and optimization of hub height for maximum wind energy yield realization Md. Mahbub Alam a , Shafiqur Rehman a,b,∗ , Josua P. Meyer a , Luai M. Al-Hadhrami b a Mechanical and Aeronautical Engineering Department, University of Pretoria, Pretoria, South Africa b Center for Engineering Research, Research Institute, King Fahd University for Petroleum and Minerals, Dhahran 31261, Saudi Arabia article info Article history: Received 14 December 2010 Received in revised form 8 April 2011 Accepted 5 July 2011 Available online 6 August 2011 Keywords: Hub-height Optimization Plant capacity factor Saudi Arabia, Wind energy abstract The percent increase in energy production with corresponding increase in hub-height for wind energy conversion system (WECS) from different manufacturers was compared in this study. It was seen that an increase of 10 m in hub-height from 40 to 50 m resulted in an increase of 3.17% in energy production for wind turbines from Nordex, while a change of 3.48% from Vestas, and so on. The overall mean increase in energy production was found to be 2.92% while changing the hub-height from 40 to 50 m. Further increase of 10 m in hub-height from 50 to 60 m, showed an increase of 7.55%, 7.90%, 7.88%, 8.25%, 8.14% and 7.75% for WECS from Nordex, Vestas, DeWind, GE, Bonus and Enercon respectively. The overall mean increase in energy production was found to be 7.91% for this change of hub-height from 50 to 60 m. Similarly, an increase of 3.02% in energy production was obtained for an additional of 10 m increase in hub-height i.e. from 70 to 80 m. On the average the maximum increase in energy production of 7.91% was obtained while changing hub-height from 50 to 60 m. © 2011 Elsevier Ltd. All rights reserved. Contents 1. Introduction ........................................................................................................................................ 3839 2. Energy yield from wind machine .................................................................................................................. 3841 3. Comparison of annual energy yield from WECS ................................................................................................... 3844 4. Effect of hub-height on energy yield .............................................................................................................. 3845 5. Plant capacity factor analysis ...................................................................................................................... 3847 6. Energy yield from wind farms ..................................................................................................................... 3848 7. Conclusions and recommendations ............................................................................................................... 3848 Acknowledgement ................................................................................................................................. 3848 References ......................................................................................................................................... 3848 1. Introduction Power of the wind is a pollution free, clean, inexhaustible, free and renewable source of energy. The continued rapid growth of wind power despite the financial crisis and economic downturn is testament to the inherent attractiveness of the technology, which is clean, reliable and quick to install. Wind power has become the power technology of choice a growing number of countries around the world. According to Global Wind Energy Council [1], the world’s wind power capacity grew by 31% in 2009, adding 37.5 GW to ∗ Corresponding author. Tel.: +966 38603802; fax: +966 38603996. E-mail addresses: [email protected] (Md.M. Alam), [email protected] (S. Rehman), [email protected] (J.P. Meyer), [email protected] (L.M. Al-Hadhrami). bring total installations to 157.9 GW. One third of these additions were made in China, which experienced yet another year of over 100% growth. Newly added capacity of 1270 MW in India and some smaller additions in Japan, South Korea and Taiwan make Asia the biggest regional market for wind energy in 2009, with more than 14 GW of new capacity. However, the US continues to have a comfortable lead in terms of total installed capacity. Against all expectations, the US wind energy market installed nearly 10 GW in 2009, increasing the coun- try’s installed capacity by 39% and bringing the total installed grid-connected capacity to 35 GW. Europe, which has tradition- ally been the world’s largest market for wind energy development, continued to see strong growth, also exceeding expectations. In 2009, 10.5 GW were installed in Europe, led by Spain (2.5 GW) and Germany (1.9 GW). Italy, France and the UK all added more than 1 GW of new wind capacity each. The 158 GW of global wind 1364-0321/$ – see front matter © 2011 Elsevier Ltd. All rights reserved. doi:10.1016/j.rser.2011.07.004
-
Upload
md-mahbub-alam -
Category
Documents
-
view
215 -
download
3
Transcript of Review of 600–2500 kW sized wind turbines and optimization of hub height for maximum wind energy...

Rm
Ma
b
a
ARRAA
KHOPS
C
1
awtiptw
sl
1d
Renewable and Sustainable Energy Reviews 15 (2011) 3839–3849
Contents lists available at ScienceDirect
Renewable and Sustainable Energy Reviews
journa l homepage: www.e lsev ier .com/ locate / rser
eview of 600–2500 kW sized wind turbines and optimization of hub height foraximum wind energy yield realization
d. Mahbub Alama, Shafiqur Rehmana,b,∗, Josua P. Meyera, Luai M. Al-Hadhramib
Mechanical and Aeronautical Engineering Department, University of Pretoria, Pretoria, South AfricaCenter for Engineering Research, Research Institute, King Fahd University for Petroleum and Minerals, Dhahran 31261, Saudi Arabia
r t i c l e i n f o
rticle history:eceived 14 December 2010eceived in revised form 8 April 2011ccepted 5 July 2011vailable online 6 August 2011
a b s t r a c t
The percent increase in energy production with corresponding increase in hub-height for wind energyconversion system (WECS) from different manufacturers was compared in this study. It was seen that anincrease of 10 m in hub-height from 40 to 50 m resulted in an increase of 3.17% in energy production forwind turbines from Nordex, while a change of 3.48% from Vestas, and so on. The overall mean increasein energy production was found to be 2.92% while changing the hub-height from 40 to 50 m. Further
eywords:ub-heightptimizationlant capacity factoraudi Arabia, Wind energy
increase of 10 m in hub-height from 50 to 60 m, showed an increase of 7.55%, 7.90%, 7.88%, 8.25%, 8.14%and 7.75% for WECS from Nordex, Vestas, DeWind, GE, Bonus and Enercon respectively. The overall meanincrease in energy production was found to be 7.91% for this change of hub-height from 50 to 60 m.Similarly, an increase of 3.02% in energy production was obtained for an additional of 10 m increase inhub-height i.e. from 70 to 80 m. On the average the maximum increase in energy production of 7.91%was obtained while changing hub-height from 50 to 60 m.
© 2011 Elsevier Ltd. All rights reserved.
ontents
1. Introduction . . . . . . . . . . . . . . . . . . . . . . . . . . . . . . . . . . . . . . . . . . . . . . . . . . . . . . . . . . . . . . . . . . . . . . . . . . . . . . . . . . . . . . . . . . . . . . . . . . . . . . . . . . . . . . . . . . . . . . . . . . . . . . . . . . . . . . . . 38392. Energy yield from wind machine . . . . . . . . . . . . . . . . . . . . . . . . . . . . . . . . . . . . . . . . . . . . . . . . . . . . . . . . . . . . . . . . . . . . . . . . . . . . . . . . . . . . . . . . . . . . . . . . . . . . . . . . . . . . . . . . . . 38413. Comparison of annual energy yield from WECS. . . . . . . . . . . . . . . . . . . . . . . . . . . . . . . . . . . . . . . . . . . . . . . . . . . . . . . . . . . . . . . . . . . . . . . . . . . . . . . . . . . . . . . . . . . . . . . . . . . 38444. Effect of hub-height on energy yield . . . . . . . . . . . . . . . . . . . . . . . . . . . . . . . . . . . . . . . . . . . . . . . . . . . . . . . . . . . . . . . . . . . . . . . . . . . . . . . . . . . . . . . . . . . . . . . . . . . . . . . . . . . . . . 38455. Plant capacity factor analysis . . . . . . . . . . . . . . . . . . . . . . . . . . . . . . . . . . . . . . . . . . . . . . . . . . . . . . . . . . . . . . . . . . . . . . . . . . . . . . . . . . . . . . . . . . . . . . . . . . . . . . . . . . . . . . . . . . . . . . 38476. Energy yield from wind farms . . . . . . . . . . . . . . . . . . . . . . . . . . . . . . . . . . . . . . . . . . . . . . . . . . . . . . . . . . . . . . . . . . . . . . . . . . . . . . . . . . . . . . . . . . . . . . . . . . . . . . . . . . . . . . . . . . . . . 38487. Conclusions and recommendations . . . . . . . . . . . . . . . . . . . . . . . . . . . . . . . . . . . . . . . . . . . . . . . . . . . . . . . . . . . . . . . . . . . . . . . . . . . . . . . . . . . . . . . . . . . . . . . . . . . . . . . . . . . . . . . 3848
Acknowledgement . . . . . . . . . . . . . . . . . . . . . . . . . . . . . . . . . . . . . . . . . . . . . . . . . . . . . . . . . . . . . . . . . . . . . . . . . . . . . . . . . . . . . . . . . . . . . . . . . . . . . . . . . . . . . . . . . . . . . . . . . . . . . . . . . 3848References . . . . . . . . . . . . . . . . . . . . . . . . . . . . . . . . . . . . . . . . . . . . . . . . . . . . . . . . . . . . . . . . . . . . . . . . . . . . . . . . . . . . . . . . . . . . . . . . . . . . . . . . . . . . . . . . . . . . . . . . . . . . . . . . . . . . . . . . . 3848
. Introduction
Power of the wind is a pollution free, clean, inexhaustible, freend renewable source of energy. The continued rapid growth ofind power despite the financial crisis and economic downturn is
estament to the inherent attractiveness of the technology, which
bring total installations to 157.9 GW. One third of these additionswere made in China, which experienced yet another year of over100% growth. Newly added capacity of 1270 MW in India and somesmaller additions in Japan, South Korea and Taiwan make Asia thebiggest regional market for wind energy in 2009, with more than14 GW of new capacity.
However, the US continues to have a comfortable lead in terms
s clean, reliable and quick to install. Wind power has become theower technology of choice a growing number of countries aroundhe world. According to Global Wind Energy Council [1], the world’sind power capacity grew by 31% in 2009, adding 37.5 GW to∗ Corresponding author. Tel.: +966 38603802; fax: +966 38603996.E-mail addresses: [email protected] (Md.M. Alam),
[email protected] (S. Rehman), [email protected] (J.P. Meyer),[email protected] (L.M. Al-Hadhrami).
364-0321/$ – see front matter © 2011 Elsevier Ltd. All rights reserved.oi:10.1016/j.rser.2011.07.004
of total installed capacity. Against all expectations, the US windenergy market installed nearly 10 GW in 2009, increasing the coun-try’s installed capacity by 39% and bringing the total installedgrid-connected capacity to 35 GW. Europe, which has tradition-ally been the world’s largest market for wind energy development,continued to see strong growth, also exceeding expectations. In
2009, 10.5 GW were installed in Europe, led by Spain (2.5 GW)and Germany (1.9 GW). Italy, France and the UK all added morethan 1 GW of new wind capacity each. The 158 GW of global wind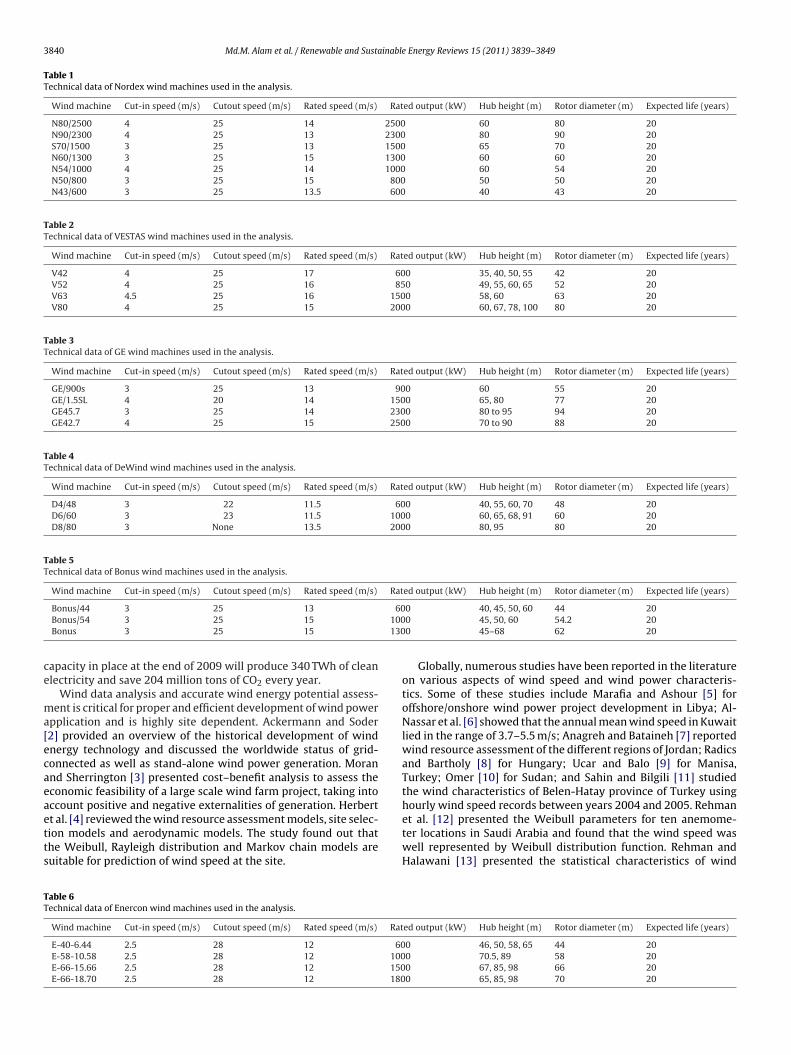
3840 Md.M. Alam et al. / Renewable and Sustainable Energy Reviews 15 (2011) 3839–3849
Table 1Technical data of Nordex wind machines used in the analysis.
Wind machine Cut-in speed (m/s) Cutout speed (m/s) Rated speed (m/s) Rated output (kW) Hub height (m) Rotor diameter (m) Expected life (years)
N80/2500 4 25 14 2500 60 80 20N90/2300 4 25 13 2300 80 90 20S70/1500 3 25 13 1500 65 70 20N60/1300 3 25 15 1300 60 60 20N54/1000 4 25 14 1000 60 54 20N50/800 3 25 15 800 50 50 20N43/600 3 25 13.5 600 40 43 20
Table 2Technical data of VESTAS wind machines used in the analysis.
Wind machine Cut-in speed (m/s) Cutout speed (m/s) Rated speed (m/s) Rated output (kW) Hub height (m) Rotor diameter (m) Expected life (years)
V42 4 25 17 600 35, 40, 50, 55 42 20V52 4 25 16 850 49, 55, 60, 65 52 20V63 4.5 25 16 1500 58, 60 63 20V80 4 25 15 2000 60, 67, 78, 100 80 20
Table 3Technical data of GE wind machines used in the analysis.
Wind machine Cut-in speed (m/s) Cutout speed (m/s) Rated speed (m/s) Rated output (kW) Hub height (m) Rotor diameter (m) Expected life (years)
GE/900s 3 25 13 900 60 55 20GE/1.5SL 4 20 14 1500 65, 80 77 20GE45.7 3 25 14 2300 80 to 95 94 20GE42.7 4 25 15 2500 70 to 90 88 20
Table 4Technical data of DeWind wind machines used in the analysis.
Wind machine Cut-in speed (m/s) Cutout speed (m/s) Rated speed (m/s) Rated output (kW) Hub height (m) Rotor diameter (m) Expected life (years)
D4/48 3 22 11.5 600 40, 55, 60, 70 48 20D6/60 3 23 11.5 1000 60, 65, 68, 91 60 20D8/80 3 None 13.5 2000 80, 95 80 20
Table 5Technical data of Bonus wind machines used in the analysis.
Wind machine Cut-in speed (m/s) Cutout speed (m/s) Rated speed (m/s) Rated output (kW) Hub height (m) Rotor diameter (m) Expected life (years)
60100130
ce
ma[ecaeaetts
TT
Bonus/44 3 25 13Bonus/54 3 25 15Bonus 3 25 15
apacity in place at the end of 2009 will produce 340 TWh of cleanlectricity and save 204 million tons of CO2 every year.
Wind data analysis and accurate wind energy potential assess-ent is critical for proper and efficient development of wind power
pplication and is highly site dependent. Ackermann and Soder2] provided an overview of the historical development of windnergy technology and discussed the worldwide status of grid-onnected as well as stand-alone wind power generation. Morannd Sherrington [3] presented cost–benefit analysis to assess theconomic feasibility of a large scale wind farm project, taking intoccount positive and negative externalities of generation. Herbert
t al. [4] reviewed the wind resource assessment models, site selec-ion models and aerodynamic models. The study found out thathe Weibull, Rayleigh distribution and Markov chain models areuitable for prediction of wind speed at the site.able 6echnical data of Enercon wind machines used in the analysis.
Wind machine Cut-in speed (m/s) Cutout speed (m/s) Rated speed (m/s) Rat
E-40-6.44 2.5 28 12 60E-58-10.58 2.5 28 12 100E-66-15.66 2.5 28 12 150E-66-18.70 2.5 28 12 180
0 40, 45, 50, 60 44 200 45, 50, 60 54.2 200 45–68 62 20
Globally, numerous studies have been reported in the literatureon various aspects of wind speed and wind power characteris-tics. Some of these studies include Marafia and Ashour [5] foroffshore/onshore wind power project development in Libya; Al-Nassar et al. [6] showed that the annual mean wind speed in Kuwaitlied in the range of 3.7–5.5 m/s; Anagreh and Bataineh [7] reportedwind resource assessment of the different regions of Jordan; Radicsand Bartholy [8] for Hungary; Ucar and Balo [9] for Manisa,Turkey; Omer [10] for Sudan; and Sahin and Bilgili [11] studiedthe wind characteristics of Belen-Hatay province of Turkey usinghourly wind speed records between years 2004 and 2005. Rehman
et al. [12] presented the Weibull parameters for ten anemome-ter locations in Saudi Arabia and found that the wind speed waswell represented by Weibull distribution function. Rehman andHalawani [13] presented the statistical characteristics of winded output (kW) Hub height (m) Rotor diameter (m) Expected life (years)
0 46, 50, 58, 65 44 200 70.5, 89 58 200 67, 85, 98 66 200 65, 85, 98 70 20

Md.M. Alam et al. / Renewable and Sustainable Energy Reviews 15 (2011) 3839–3849 3841
Table 7Summary of wind energy production (MWh/year) from single WECS.
Manufacturer Size of wind energy conversion system (WECS-kW)
600 800 850 900 1000 1300 1500 2000 2300 2500
Nordex40 m 1326.0 1717.92 – – 2021.51 2569.90 3988.60 – 5611.64 4776.8250 m 1377.9 1777.54 – – 2068.24 2663.62 4068.64 – 5765.07 4972.9860 m 1477.6 1918.38 – – 2237.79 2880.49 4308.23 – 6210.01 5358.5470 m 1542.6 2004.98 – – 2345.97 3023.97 4458.38 – 6432.01 5630.0780 m 1577.0 2047.26 – – 2413.92 3098.80 4600.79 – 6622.39 5784.47
Vestas40 m 1234.7 – 1977.95 – – – 2952.01 – 4509.22 –50 m 1278.6 – 2037.13 – – – 3071.85 – 4659.07 –60 m 1385.1 – 2186.75 – – – 3325.71 – 5015.48 –70 m 1446.7 – 2271.52 – – – 3483.77 – 5220.91 –80 m 1498.2 – 2341.04 – – – 3591.92 – 5373.40 –
DeWind40 m 1589.6 – – – 2613.85 – – 4815.18 – –50 m 1616.6 – – – 2656.21 – – 4943.31 – –60 m 1741.3 – – – 2870.28 – – 5331.79 – –70 m 1815.6 – – – 2974.39 – – 5530.96 – –80 m 1866.1 – – – 3061.88 – – 5689.26 – –
GE40 m – – – 2176.49 – – 3874.27 – 5817.59 5588.7950 m – – – 2233.86 – – 3969.33 – 5908.69 5786.5360 m – – – 2416.42 – – 4255.13 – 6482.65 6243.8970 m – – – 2512.14 – – 4435.76 – 6564.76 6521.1480 m – – – 2600.71 – – 4578.24 – 6778.03 6703.99
Bonus40 m 1140.4 – – – 2179.16 2822.51 – – – –50 m 1182.4 – – – 2251.62 2913.10 – – – –60 m 1291.7 – – – 2422.52 3133.95 – – – –70 m 1358.4 – – – 2519.08 3257.66 – – – –80 m 1408.2 – – – 2593.25 3356.36 – – – –
Enercon 1800 kW40 m 1402.2 – – – 2394.18 – 3193.42 3745.28 – –50 m 1439.3 – – – 2462.27 – 3318.76 3902.29 – –60 m 1553.6 – – – 2652.54 – 3580.83 4191.63 – –
2728
sfmSA
iepwtisape
tTtwhbnott
70 m 1612.3 – – –80 m 1659.3 – – –
peed and diurnal variation. The autocorrelation coefficients wereound to be matching with the actual diurnal variation of the hourly
ean wind speed for most of the locations used in the study.ome of the other studies include Rehman et al. [14], Rehman andftab [15] and Rehman et al. [16].
The selection of wind machine size will depend on the exist-ng world wide standard sizes, commercial availability, highnergy yield and capacity factor, local adoptability, ease of trans-ortation to the installation site, etc. The choice of a particularind turbine could include the interest of the manufacturer
o providing services, competitive cost, technical support dur-ng installation phase, training of the operation and maintenancetaff, terms and conditions for maintenance of the wind machinesnd the supply of spare parts during project life time, re-owering provision of the plant after the expiry of designed life,tc.
The placement of a right turbine at the right place is very impor-ant and critical from optimal energy production point of view.he other important aspects are its rated power, cut-in-speed,ransportability, life span, capital cost, corrosion resistance, harsheather resistance, etc. Wind turbines are now available in fewundreds of kilowatt to few mega watt rated capacities and areeing used successfully worldwide. A wind machines consists of a
acelle unit, a tower and blades. The nacelle unit is the main unitf the whole assembly and houses the gear box, the cooling sys-em, generator and other control systems. To further understandhe workability and other characteristics of the wind energy con-48.50 – 3735.31 4384.59 – –27.82 – 3836.75 4496.34 – –
version system (WECS) a number of major manufacturers wereidentified, contacted and technical specifications on different sizesof the WECS were obtained.
The Kingdom of Saudi Arabia with vast open land high avail-able winds may be a good candidate for the installation of windelectricity conversion systems. The Kingdom is proud to have 20meteorological data collection stations, which dates back to 1970.So, a wealth of meteorological data is available for the design andplanning of wind energy systems. This study utilizes wind speeddata from many locations and wind turbines from different manu-facturers to estimate the wind energy at different hub heights. Theplacement of a right turbine at the right place is very important andcritical from optimal energy production point of view. The otherimportant aspects are its rated power, cut-in-speed, transporta-bility, life span, capital cost, corrosion resistivity, harsh weatherresistance, etc.
2. Energy yield from wind machine
Energy production from single WECS was obtained from windpower curves of the wind machines and the frequency distributionof number of hours during which the wind remained in certainwind speed intervals. To perform energy calculations several wind
machines with different sizes were chosen on the basis of gener-ally used sizes in wind power sector. According to Bolinger andWiser [17], the average size of utility-scale wind turbines installedin the U.S. was 686 kW in 2000 while it was 327 kW in 1995. In the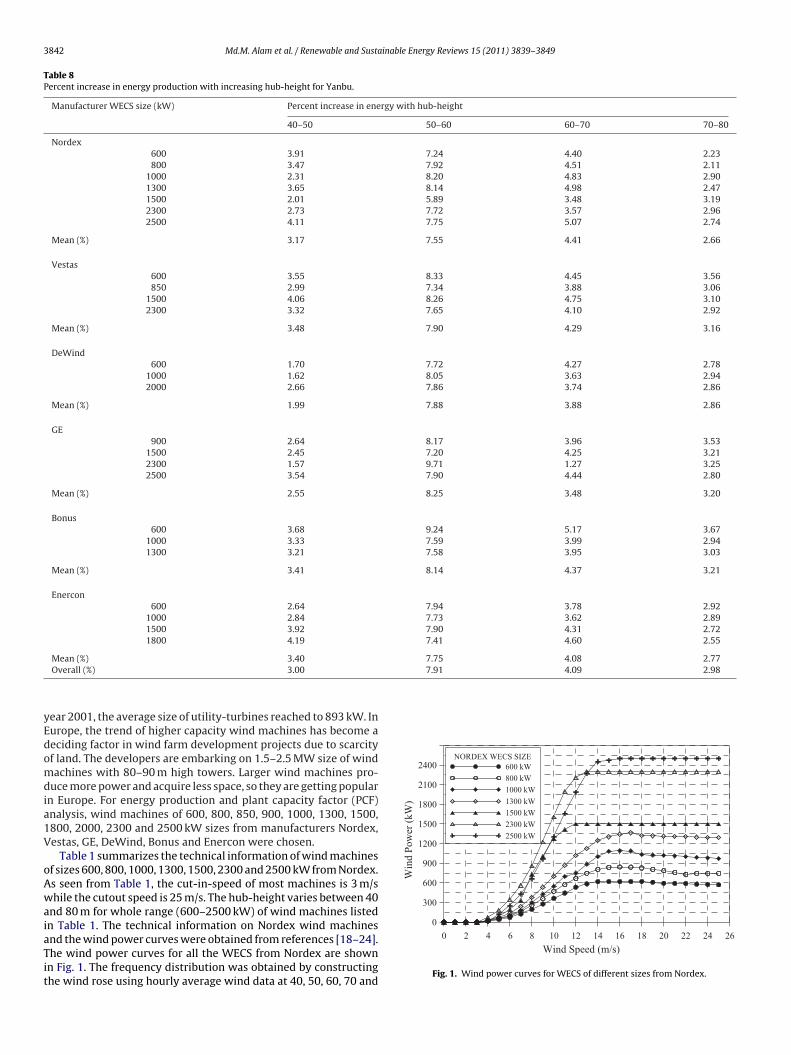
3842 Md.M. Alam et al. / Renewable and Sustainable Energy Reviews 15 (2011) 3839–3849
Table 8Percent increase in energy production with increasing hub-height for Yanbu.
Manufacturer WECS size (kW) Percent increase in energy with hub-height
40–50 50–60 60–70 70–80
Nordex600 3.91 7.24 4.40 2.23800 3.47 7.92 4.51 2.11
1000 2.31 8.20 4.83 2.901300 3.65 8.14 4.98 2.471500 2.01 5.89 3.48 3.192300 2.73 7.72 3.57 2.962500 4.11 7.75 5.07 2.74
Mean (%) 3.17 7.55 4.41 2.66
Vestas600 3.55 8.33 4.45 3.56850 2.99 7.34 3.88 3.06
1500 4.06 8.26 4.75 3.102300 3.32 7.65 4.10 2.92
Mean (%) 3.48 7.90 4.29 3.16
DeWind600 1.70 7.72 4.27 2.78
1000 1.62 8.05 3.63 2.942000 2.66 7.86 3.74 2.86
Mean (%) 1.99 7.88 3.88 2.86
GE900 2.64 8.17 3.96 3.53
1500 2.45 7.20 4.25 3.212300 1.57 9.71 1.27 3.252500 3.54 7.90 4.44 2.80
Mean (%) 2.55 8.25 3.48 3.20
Bonus600 3.68 9.24 5.17 3.67
1000 3.33 7.59 3.99 2.941300 3.21 7.58 3.95 3.03
Mean (%) 3.41 8.14 4.37 3.21
Enercon600 2.64 7.94 3.78 2.92
1000 2.84 7.73 3.62 2.891500 3.92 7.90 4.31 2.721800 4.19 7.41 4.60 2.55
7.75 4.08 2.777.91 4.09 2.98
yEdomdia1V
oAwaiaTit
0
300
600
900
1200
1500
1800
2100
2400
Win
d Po
wer
(kW
)
NORDEX WECS SIZE600 kW800 kW1000 kW1300 kW1500 kW2300 kW2500 kW
Mean (%) 3.40Overall (%) 3.00
ear 2001, the average size of utility-turbines reached to 893 kW. Inurope, the trend of higher capacity wind machines has become aeciding factor in wind farm development projects due to scarcityf land. The developers are embarking on 1.5–2.5 MW size of windachines with 80–90 m high towers. Larger wind machines pro-
uce more power and acquire less space, so they are getting popularn Europe. For energy production and plant capacity factor (PCF)nalysis, wind machines of 600, 800, 850, 900, 1000, 1300, 1500,800, 2000, 2300 and 2500 kW sizes from manufacturers Nordex,estas, GE, DeWind, Bonus and Enercon were chosen.
Table 1 summarizes the technical information of wind machinesf sizes 600, 800, 1000, 1300, 1500, 2300 and 2500 kW from Nordex.s seen from Table 1, the cut-in-speed of most machines is 3 m/shile the cutout speed is 25 m/s. The hub-height varies between 40
nd 80 m for whole range (600–2500 kW) of wind machines listedn Table 1. The technical information on Nordex wind machines
nd the wind power curves were obtained from references [18–24].he wind power curves for all the WECS from Nordex are shownn Fig. 1. The frequency distribution was obtained by constructinghe wind rose using hourly average wind data at 40, 50, 60, 70 and6420 108 12 14 16 18 20 22 24 26Wind Speed (m/s)
Fig. 1. Wind power curves for WECS of different sizes from Nordex.

Md.M. Alam et al. / Renewable and Sustainable Energy Reviews 15 (2011) 3839–3849 3843
Table 9Plant capacity factors for wind machines of different sizes.
Manufacturer Size of wind energy conversion system (WECS-kW)
600 800 850 900 1000 1300 1500 2000 2300 2500
Nordex40 m 25.2 24.5 – – 23.1 22.6 30.4 – 27.9 21.850 m 26.2 25.4 – – 23.6 23.4 31.0 – 28.6 22.760 m 28.1 27.4 – – 25.5 25.3 32.8 – 30.8 24.570 m 29.3 28.6 – – 26.8 26.6 33.9 – 31.9 25.780 m 30.0 29.2 – – 27.6 27.2 35.0 – 32.9 26.4
Vestas40 m 23.5 – 26.6 – – – 22.5 – 25.7 –50 m 24.3 – 27.4 – – – 23.4 – 26.6 –60 m 26.4 – 29.4 – – – 25.3 – 28.6 –70 m 27.5 – 30.5 – – – 26.5 – 29.8 –80 m 28.5 – 31.4 – – – 27.3 – 30.7 –
DeWind40 m 30.2 – – – 29.8 – – 27.5 – –50 m 30.8 – – – 30.3 – – 28.2 – –60 m 33.1 – – – 32.8 – – 30.4 – –70 m 34.5 – – – 34.0 – – 31.6 – –80 m 35.5 – – – 35.0 – – 32.5 – –
GE40 m – – – 27.6 – – 29.5 – 28.9 25.550 m – – – 28.3 – – 30.2 – 29.3 26.460 m – – – 30.6 – – 32.4 – 32.2 28.570 m – – – 31.9 – – 33.8 – 32.6 29.880 m – – – 33.0 – – 34.8 – 33.6 30.6
Bonus40 m 21.7 – – – 24.9 24.8 – – – –50 m 22.5 – – – 25.7 25.6 – – – –60 m 24.6 – – – 27.7 27.5 – – – –
28.829.6
8c
V
70 m 25.8 – – –80 m 26.8 – – –
0 m above the ground level. At these heights the wind speed was
alculated using 1/7th wind power law given below:2 = V1
(Z2
Z1
)˛
Table 10Energy yield (MWh/year) from wind farms of 20, 30 and 40 MW installed capacitie
Note: Green, blue and red colors indicate maximum, second maximum and third m
28.6 – – – –29.5 – – – –
where V1 and V2 are the wind speed corresponding to heights
Z1 and Z2, respectively and is the wind shear exponent and is takenas 1/7. The latitude, longitude and altitude of the data collectionstation were 24.2◦N, 38.1◦E and 1 m above mean sea level (MSL).The hourly averaged data covered a period of 14 years from 1970 tos at Yanbu at 60 m hub-height.
aximum energy production from wind farms of different installed capacities.

3844 Md.M. Alam et al. / Renewable and Sustainable Energy Reviews 15 (2011) 3839–3849
Fig. 2. Wind rose diagram of hourly mean wind speed at 40 m for Yanbu.
6420 108 12 14 16 18 20 22 24 26Wind Speed (m/s)
0200400600800
100012001400160018002000
Win
d Po
wer
(kW
)
VESTAS WECS SIZE600 kW850 kW1500 kW2000 kW
1swuwcDtrasW
Wind Speed (m/s)6420 108 12 14 16 18 20 22 24 26
0200400600800
100012001400160018002000
Win
d Po
wer
(kW
)
DEWIND WECS SIZE600 kW1000 kW2000 kW
Fig. 5. Wind power curves for WECS of different sizes from DeWind.
6420 108 12 14 16 18 20 22 24 26Wind Speed(m/s)
0
200
400
600
800
1000
1200
1400
Win
d Po
wer
(kW
)
BONUS WECS SIZE600 kW1000 kW1300 kW
Fig. 3. Wind power curves for WECS of different sizes from Vestas.
983 with missing data in 1976. The long-term hourly mean windpeed was 2.91 m/s at 10 m above ground level while the maximumas 6.17 m/s. The wind speed was extrapolated to higher altitudesing the equation given earlier. As an example, Fig. 2 shows theind rose diagram for wind speed at 40 m. Similar type of detailed
alculations was also made for wind machines from Vestas, GE,eWind, Bonus and Enercon. The technical information for Ves-
as, GE, DeWind, Bonus and Enercon WECS (Tables 2–6) and theespective wind power curves were obtained from Refs. [25–36]
re shown in Figs. 3–7 and used in this study. The forth comingections are focused on the comparison of energy production fromECS of same sizes but from different manufacturers, the effect
6420 108 12 14 16 18 20 22 24 26Wind Speed (m/s)
0300600900
120015001800210024002700
Win
d Po
wer
(kW
)
GE WECS SIZE900 kW1500 kW2300 kW2500 kW
Fig. 4. Wind power curves for WECS of different sizes from GE.
Fig. 6. Wind power curves for WECS of different sizes from Bonus.
of hub-height on energy production, plant capacity factor analysis,energy production from a wind farm of installed capacity of 20, 30and 40 MW.
3. Comparison of annual energy yield from WECS
The annual wind energy yield (MWh/year), from different WECSis summarized in Table 7. It is observed that the maximum energyof 1589.6 MWh was obtained from DeWind machines while theminimum of 1140.4 MWh from Bonus machine of 600 kW capacityusing wind speed data at 40 m. The second highest producer of windenergy of 1402.2 MWh was Enercon while Nordex stood at thirdplace with 1326.0 MWh of electricity. Similar type of wind energyyield trends were followed at other heights, as observed from thedata in Table 7. The sixth column of Table 2 shows that DeWindmachine of 1000 kW rated power produces the maximum energy
of 2613.85 MWh, Enercon with 2394.18 MWh of energy stood atsecond place and Bonus with 2179.16 MWh energy output at thethird place.6420 108 12 14 16 18 20 22 24 26Wind Speed(m/s)
0200400600800
100012001400160018002000
Win
d Po
wer
(kW
)
ENERCON WECS SIZE600 kW1000 kW1500 kW1800 kW
Fig. 7. Wind power curves for WECS of different sizes from Enercon.
Md.M. Alam et al. / Renewable and Sustainable Energy Reviews 15 (2011) 3839–3849 3845
30 40 50 60 70 80Hub Height (Meters)
0
2000
4000
6000
8000
Ener
gy O
utpu
t (M
Wh)
/yea
r
1326 1378 1478 1543 15771718 1778 1918 2005 2047
2022 2068 2238 2346 24142570 2664 2880 3024 3099
3989 40694308 4458 4601
5612 57656210
6432 6622
4777 49735359
5630 5784
WECS SIZE600 kW800 kW1000 kW1300 kW1500 kW2300 kW2500 kW
rgy y
NtNiGm
4
tdw
Fig. 8. Effect of hub-height on ene
The WECS with rated power of 1300 kW were available fromordex and Bonus, as shown in Table 7, column 7. In this case
he Bonus WECS performed better than the Nordex machine. Theordex machine with 1500 kW rated power produced the max-
mum energy compared to WECS from Vestas, GE and Enercon.E wind machines of rated power 2300 and 2500 kW producedaximum energy compared to others.
. Effect of hub-height on energy yield
In order to study the effect of hub-height on energy produc-ion, the wind power curves for individual wind machines and winduration data in different wind speed bins and at different heightsas used. To obtain the wind duration or wind speed frequency
Fig. 9. Comparison of percent increase in ene
ield from Nordex wind machines.
distribution at different heights, the wind speed data at differentheights was calculated using 1/7 wind power law. For this analy-sis, hourly average values of wind speed for Yanbu were used for aperiod of 14 years between 1970 and 1983. The energy yield fromdifferent WECS at 40, 50, 60, 70 and 80 m hub-heights, tabulatedin Table 7, is shown graphically for wind turbines from Nordex inFig. 8. It is clear that taller towers lead to increased energy yield.
Table 8 summarizes the percent increase in energy productiondue to increase in hub-height for all the WECS from chosen man-ufacturers. This table also includes the mean values of percent
increase in energy yield for each hub-height change. As seen fromFig. 9, a change of hub-height from 40 to 50 m causes an increaseof 3.17% in energy yield from Nordex, while a change of 3.48% fromVestas and so on. The minimum increase of 1.99% was noticed fromrgy yield with increase in hub-height.
3846 Md.M. Alam et al. / Renewable and Sustainable Energy Reviews 15 (2011) 3839–3849
30 40 50 60 70 80Hub Height(Meters)
20
24
28
32
36
Plan
t Cap
acity
Fact
or (%
)
25.2326.22
28.11
29.3530
24.5125.36
27.37
28.6129.21
23.0823.61
25.55
26.7827.56
22.5723.39
25.29
26.5527.21
30.3530.96
32.79
33.9335.01
27.8528.61
30.82
31.9232.87
21.8122.71
24.47
25.7126.41
WECS SIZE600 kW800 kW1000 kW1300 kW1500 kW2300 kW2500 kW
Fig. 10. Effect of hub-height on plant capacity factor for Nordex wind machines.
30 40 50 60 70 8022
24
26
28
30
32
Plan
t Cap
acity
Fac
tor (
%)
23.4924.33
26.35
27.53
28.5
26.5627.36
29.37
30.51
31.44
22.47
23.38
25.31
26.5127.34
25.7426.59
28.63
29.830.67
WECS SIZE600 kW850 kW1500 kW2000 kW
F
Dmt
afa
F
30 40 50 60 70 80Hub Height(Meters)
26
28
30
32
34
36
Ener
gy O
utpu
t (M
Wh/
year
)
27.6128.33
30.65
31.86
32.99
29.4830.21
32.38
33.76
34.84
28.8729.33
32.1832.58
33.64
25.5226.42
28.51
29.7830.61
WECS SIZE900 kW1500 kW2300 kW2500 kW
Hub Height (Meters)
ig. 11. Effect of hub-height on plant capacity factor for Vestas wind machines.
eWind, for a change in hub-height from 40 to 50 m. The overallean increase in energy yield was found to be 2.92% while changing
he hub-height from 40 to 50 m.Further increase of 10 m in hub-height from 50 to 60 m, showed
n increase of 7.55%, 7.90%, 7.88%, 8.25%, 8.14% and 7.75 for WECSrom Nordex, Vestas, DeWind, GE, Bonus and Enercon respectively,s shown in Fig. 9. The maximum increase of 8.25% was obtained
30 40 50 60 70 80Hub Height (Meters)
26
28
30
32
34
36
Cap
acity
Fac
tor (
%)
30.2430.76
33.13
34.54
35.50
29.8430.32
32.76
33.95
34.95
27.4828.22
30.43
31.57
32.47
WECS SIZE600 kW1000 kW2000 kW
ig. 12. Effect of hub-height on plant capacity factor for DeWind wind machines.
Fig. 13. Effect of hub-height on plant capacity factor for GE wind machines.
from GE machines while next higher from Bonus. The overall meanincrease was found to be 7.91% for this change of hub-height from50 to 60 m. An overall mean increase of 4.09% was obtained when
the hub-height was changed form 60 to 70 m. Similarly, an increaseof 3.02% in energy production was obtained for an additional of10 m increase in hub-height i.e. from 70 to 80 m.30 40 50 60 70 80Hub Height (Meters)
20
22
24
26
28
30
Cap
acity
Fact
or 9
%)
21.7022.50
24.58
25.84
26.79
24.8825.70
27.65
28.7629.60
24.7825.58
27.52
28.6129.47
WECS SIZE600 kW1000 kW1300 kW
Fig. 14. Effect of hub-height on plant capacity factor for Bonus wind machines.

Md.M. Alam et al. / Renewable and Sustainable Energy Reviews 15 (2011) 3839–3849 3847
to inc
5
dsvicp1
Fig. 15. Comparison of increase in plant capacity factor due
. Plant capacity factor analysis
The plant capacity factor is a measure of the actual energy pro-uction compared to the rated power of a wind energy conversionystem (WECS). Larger the PCF the better is the wind energy con-ersion system. The PCF generally varies from 25% to 45%. The PCF
s calculated by dividing the actual energy production by the ratedapacity of the WECS and number of hours in a year i.e. 8760. Forlant capacity factor analysis, wind machines of 600, 800, 850, 900,000, 1300, 1500, 2000, 2300 and 2500 kW sizes were chosen fromFig. 16. Number of WECS needed for wind f
rease in hub-height for WECS from different manufacturers.
different manufacturers. The capacity factors calculated for all theWECS under investigation are summarized in Table 9.
While comparing the PCF for 600 kW WECS, the DeWindmachine was found to attain the maximum PCF of 30.2% at 40 mhub-height and the Nordex machine the next highest PCF of 25.2%.The Vestas machine was placed at third place with PCF of 23.5%
while Bonus stood at fourth place with PCF of 21.7%. The DeWindmachine of 1000 kW rated power attained the maximum PCF of29.8% while Bonus with 24.9% and Nordex with 23.1% PCF wereplaced at second and third place, respectively. The Nordex 1500 kWarms of 20, 30 and 40 MW capacities.

3 inabl
mstbn
Frimtfmahwfs26Dtwa
6
mtwimmwdDeuipeoer
7
mfwfmttt
[
[
[
[
[
[
[
[
848 Md.M. Alam et al. / Renewable and Susta
achine performed the best with PCF of 30.4% while GE and Vestastood at second and third place with PCF of 29.5 and 22.5%, respec-ively. The GE wind machine of 2300 kW rated power performedest with PCF of 28.9%, Nordex next best with PCF of 27.9% andext best was the Vestas machine with PCF of 25.7%.
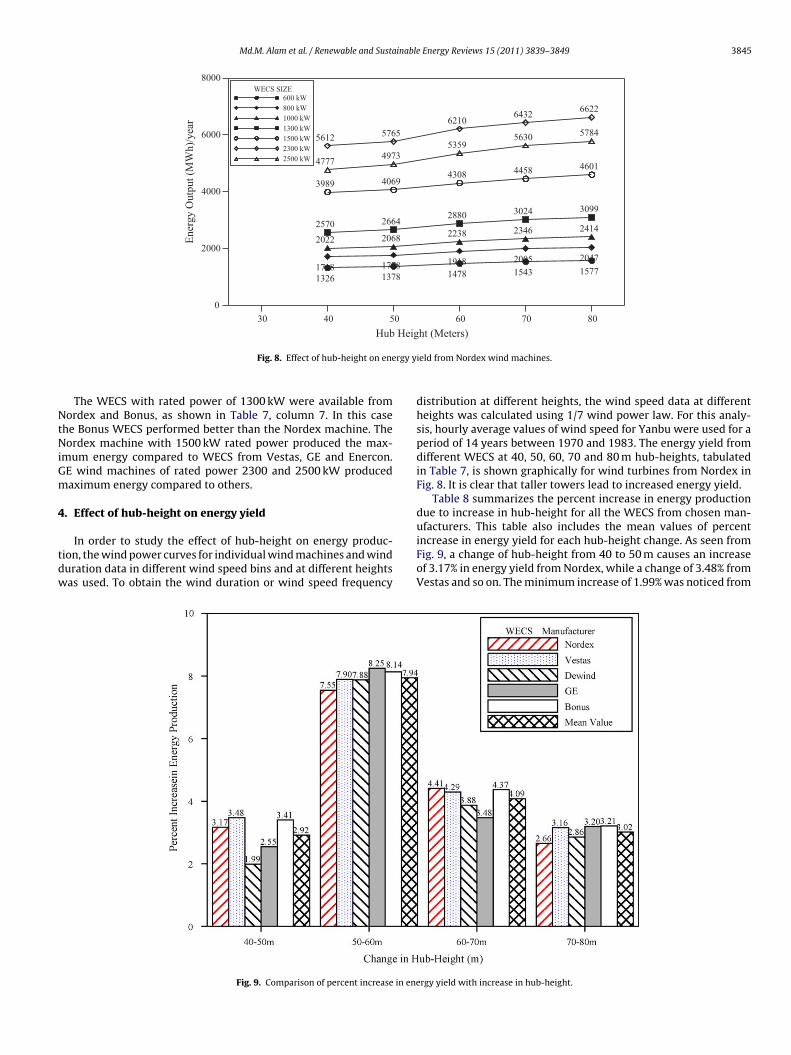
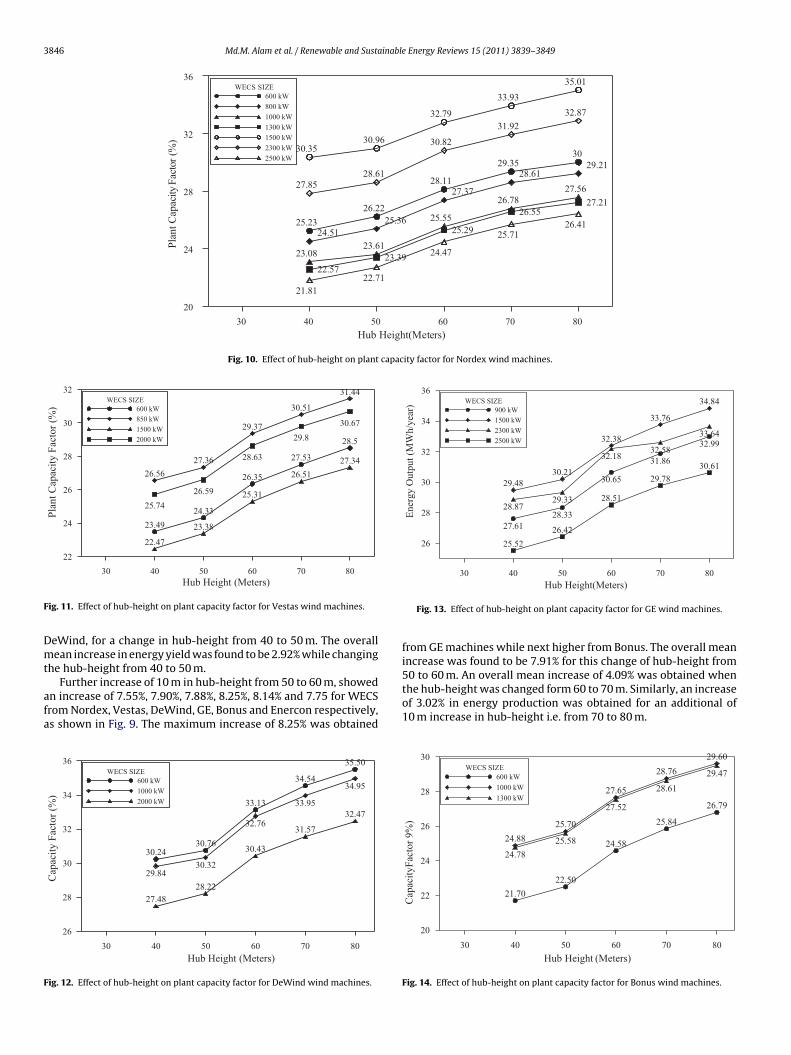
The effect of increase in hub-height on PCF is shown inigs. 10–14 for Nordex, Vestas, DeWind, GE and Bonus machines,espectively. It is clearly understood from these figures that the PCFncreases with height. The change in PCF for WECS from different
anufacturers is also compared in Fig. 15. As seen from Fig. 15,he highest mean change in PCF of 0.85% was observed for WECSrom Vestas while the next highest mean change of 0.81% for Bonus
achines. In this class (40–50 m) of hub-height change, an over-ll mean increase of 0.74% in PCF was noticed. For an increase ofub-height from 50 to 60 m, a maximum mean increase of 2.36%as noticed for GE machines while the mean minimum of 1.93%
or WECS from Nordex. The DeWind machines showed to be theecond best with a mean increase of 2.34% in PCF and Vestas with.0% increase, the third best. In case of increase of hub-height from0 to 70 m, a maximum of 1.25% change in PCF was noticed foreWind machines while a minimum of 1.07% for GE machines. In
his class of hub-height change, an overall of 1.17% increase in PCFas observed. For further increase of hub-height from 70 to 80 m,
n overall of 0.91% increase in PCF was found.
. Energy yield from wind farms
To further study the energy production for WECS from differentanufacturers, wind farms of 20, 30 and 40 MW installed capaci-
ies were analyzed. The numbers of wind machines shown in Fig. 16ere approximated to nearest whole numbers wherever found
n fractions. The energy produced using different sizes of windachines for three wind farms for a hub-height of 60 m is sum-arized in Table 10. It is observed from this table that from 20 MWind farm the maximum energy of 58,344 MWh/year could be pro-uced by 9 of GE machines of 2300 kW rated power at Yanbu. TheeWind machines of 600 kW rated power produced 57,463 MWh oflectricity while 1000 kW rated power WECS, from the same man-facturer, produced 57,406 MWh. For wind farms of 30 and 40 MW
nstalled capacities, WECS of 600 kW rated power from DeWindroduced the maximum electricity of 87,065 and 116,667 MWhach year on an average, respectively. The Nordex wind machinesf 1500 kW rated power produced 86,165 and 116,322 MWh oflectricity from wind farms of 30 and 40 MW installed capacities,espectively.
. Conclusions and recommendations
Based on hub-height effect on energy production, it is recom-ended that a maximum of 60 m of hub-height should be used
or wind farm development. The maximum increase of about 8%as obtained for a change of hub-height from 50 to 60 m while
urther increase in hub-height from 60 to 70 m produced only 4%ore of electricity. The increase in energy production was found
o be only 3% for further increase of 10 m in hub-height. Based onhe energy production from single wind machine, the following ishe rating of different sizes of WECS according to the manufacturer:
WECS Size First Second Third Fourth
600 kW DeWind Enercon Nordex Vestas
1000 kW DeWind Enercon Bonus Nordex1500 kW Nordex GE Enercon Vestas2300 kW GE Nordex Vestas –2500 kW GE Nordex – – [e Energy Reviews 15 (2011) 3839–3849
The plant capacity analysis showed that a maximum increase of2.12% in PCF was found when increasing the hub-height from 50 to60 m. In the case of change of the hub-heights from 40 to 50 and 70to 80 m the increase in PCF was less than 1% and in case of increasefrom 60 to 70 m the increase in PCF was a little more than 1%. Theeffect of hub-height on PCF matches with the hub-height effect onenergy production presented in the previous sub-section. Hence itis recommended to install the wind machines at 60 m hub-heightto obtain the optimal PCF.
Whereas energy yield from wind farms is concerned, 600 kWmachines from DeWind performed the best while Nordex machinesthe next best. Vestas machines were placed at number three whileBonus at number four. The wind machines of 850 kW from Ves-tas and 900 kW from GE produced almost same amount of energyfor all the three sizes of wind farms considered here. The DeWindmachines of 1000 kW size produced the maximum electricity com-pared to wind machines from Nordex and Bonus.
It is recommended that the same exercise must be repeated forwind turbines of multi-mega watt sizes for optimal energy outputin Saudi Arabian wind conditions which will provide a guide linesfor the potential sites having similar type of wind conditions inthe neighboring states. Moreover, for realistic and more accurateestimates of energy and thereof plant capacity factors, wind mea-surements at different heights must be used to facilitate accurateestimation of wind speed at hub-height.
Acknowledgement
The author wishes to acknowledge the support of The ResearchInstitute of King Fahd University of Petroleum and Minerals,Dhahran, Saudi Arabia.
References
[1] Global wind power boom continues despite economic woes. http://www.gwec.net/index.php?id=30&no cache=1&tx ttnews[tt news=247&txttnews[backPid]=4&cHash=1196e940a0] [accessed on 12.02.10].
[2] Ackerman T, Soder L. An overview of wind energy-status 2002. Renewable andSustainable Energy Reviews 2002;6:67–128.
[3] Moran D, Sherrington C. An economic assessment of windfarm power genera-tion in Scotland including externalities. Energy Policy 2007;35:2811–25.
[4] Herbert GMJ, Iniyan S, Sreevalsan E, Rajapandian A. Review of wind energytechnologies. Renewable and Sustainable Energy Reviews 2007;11:1117–45.
[5] Marafia AH, Ashour HA. Economics of off-shore/on-shore wind energy systemsin Qatar. Renewable Energy 2003;28:1953–63.
[6] Al-Nassar W, Alhajraf S, Al-Enizi A, Al-Awadhi L. Potential wind power gener-ation in the state of Kuwait. Renewable Energy 2005;30:2149–61.
[7] Anagreh Y, Bataineh A. Renewable energy potential assessment in Jordan.Renewable and Sustainable Energy Reviews 2011;15(5):2232–9.
[8] Radics K, Bartholy J. Estimating and modelling the wind resource of Hungary.Renewable and Sustainable Energy Reviews 2008;12(3):874–82.
[9] Ucar A, Balo F. A seasonal analysis of wind turbine characteristics and windpower potential in Manisa, Turkey. International Journal of Green Energy2008;5:466–79.
10] Omer AM. On the wind energy resources of Sudan. Renewable and SustainableEnergy Reviews 2008;12(8):2117–39.
11] Sahin B, Bilgili M. Wind characteristics and energy potential in Belen-Hatay,Turkey. International Journal of Green Energy 2009;6(2):157–72.
12] Rehman S, Halawani TO, Husain T. Weibull parameters for wind speed distri-bution in Saudi Arabia. Solar Energy 1994;53(6):473–9.
13] Rehman S, Halawani TO. Statistical characteristics of wind in Saudi Arabia.Renewable Energy 1994;4(8):949–56.
14] Rehman S, Halawani TO, Mohandes M. Wind power cost assessment at twentylocations in the Kingdom of Saudi Arabia. Renewable Energy 2003;28:573–83.
15] Rehman S, Aftab A. Assessment of wind energy potential for coastal locationsof the Kingdom of Saudi Arabia. Energy 2004;29:1105–15.
16] Rehman S, El-Amin I, Ahmad F, Shaahid SM, Al-Shehri AM, Bakhashwain JM.Wind power resource assessment for Rafha, Saudi Arabia. Renewable and Sus-tainable Energy Reviews 2007;11:937–50.
17] Bolinger M, Wiser R. Analysis of utility-scale wind turbines and projects in the
US. 1 Cyclotron Rd., MS 90-4000, Berkeley, CA 94720: Ernest Orlando LawrenceBerkeley National Laboratory, Environmental Energy Technologies Division;August 9, 2002. http://eetd.lbl.gov/ea/ems/reports/47705.pdf.18] Nordex Publication. N80 technical description document. Rev. 5.0; 2001.http://www.nordex-online.com/ e/produkte und service/index.html.

inable
[
[
[
[
[
[
[
[
[
[
[
[
[
[
[
[http://www.bonus.dk/uk/produkter/tekbe 600 spec.html.
[35] Bonus Publication. 1000 kW wind machine technical description.
Md.M. Alam et al. / Renewable and Susta
19] Nordex Publication. N60 technical description document. Rev. 5.0; 2001.http://www.nordex-online.com/ e/produkte und service/index.html.
20] Nordex Publication. N50 technical description document. Rev. 5.0; 2001.http://www.nordex-online.com/ e/produkte und service/index.html.
21] Nordex Publication. N43 technical description document. Rev. 5.0; 2001.http://www.nordex-online.com/ e/produkte und service/index.html.
22] Nordex Publication. S70 technical description document. Rev. 5.0; 2001.http://www.nordex-online.com/ e/online service/download/ dateien/S70 77.pdf.
23] Nordex Publication. N90 technical description document. Rev. 5.0; 2001.http://www.nordex-online.com/pdf/produktbroschueren/n80 en.pdf.
24] Nordex Publication. N54 technical description document. Rev. 5.0; 2001.http://www.nordex-online.com/pdf/produktbroschueren/n54 en.pdf.
25] Vestas Publication. V47 660 kW wind machine technical description.http://www.vestas.com/produkter/V47/v47 UK.html.
26] Vestas Publication. V47 850 kW wind machine technical description.
http://www.vestas.com/produkter/V52/v52 UK.html.27] Vestas Publication. V80 1800 kW wind machine technical description.http://www.vestas.com/produkter/v80/v80 1 8 UK.html.
28] DeWind Publication. D4 600 kW wind machine technical description.http://www.dewind.de/en/downloads/D4-600-100-eng.pdf.
[
Energy Reviews 15 (2011) 3839–3849 3849
29] DeWind Publication. D6 1000 kW wind machine technical description.http://www.dewind.de/en/downloads/D6-1000-100-eng.pdf.
30] DeWind Publication. D8 2000 kW wind machine technical description,http://www.dewind.de/en/downloads/D8-2000-100-eng.pdf.
31] GE Power Systems Publication. 900 kW wind machine technical information.http://www.gepower.com/prod serv/products/wind turbines/en/900kw/index.htm.
32] GE Power Systems Publication. 1500 kW wind machine technical informa-tion. http://www.gepower.com/prod serv/products/wind turbines/en/15mw/index.htm.
33] GE Power Systems Publication. 2300, 2500 and 2700 kW wind machinetechnical information. http://www.gepower.com/prod serv/products/windturbines/en/2xmw/index.htm.
34] Bonus Publication. 600 kW wind machine technical description.
http://www.bonus.dk/uk/produkter/tekbe 1mv spec.html.36] Bonus Publication. 1300 kW wind machine technical description.
http://www.bonus.dk/uk/produkter/tekbe 1300 spec.html.