Review of 2017 Half-Year Results - TodayIRlivewebcast.todayir.com/citic_17ir/ppt.pdf · CITIC...
16
CITIC Limited Review of 2017 Half-Year Results 29 August 2017
Transcript of Review of 2017 Half-Year Results - TodayIRlivewebcast.todayir.com/citic_17ir/ppt.pdf · CITIC...

CITIC Limited
Review of 2017
Half-Year Results29 August 2017

2CITIC Limited
2017 Half-Year Results
1H 2017 1H 2016Increase/(Decrease)
HK$ million Amount %
Continuing operations:
Revenue 198,064 183,974 14,090 8%
Profit before tax 53,740 48,495 5,245 11%
Profit/(Loss) attributable to ordinary
shareholders32,261 20,182 12,079 60%
-Continuing operations 32,261 24,918 7,343 29%
-Discontinued operations - (4,736) 4,736 -
Earnings/(Loss) per share (HK$) 1.11 0.69 0.42 60%
-Continuing operations 1.11 0.85 0.26 29%
-Discontinued operations - (0.16) 0.16 -
Dividend per share (HK$) 0.11 0.10 0.01 10%
3CITIC Limited
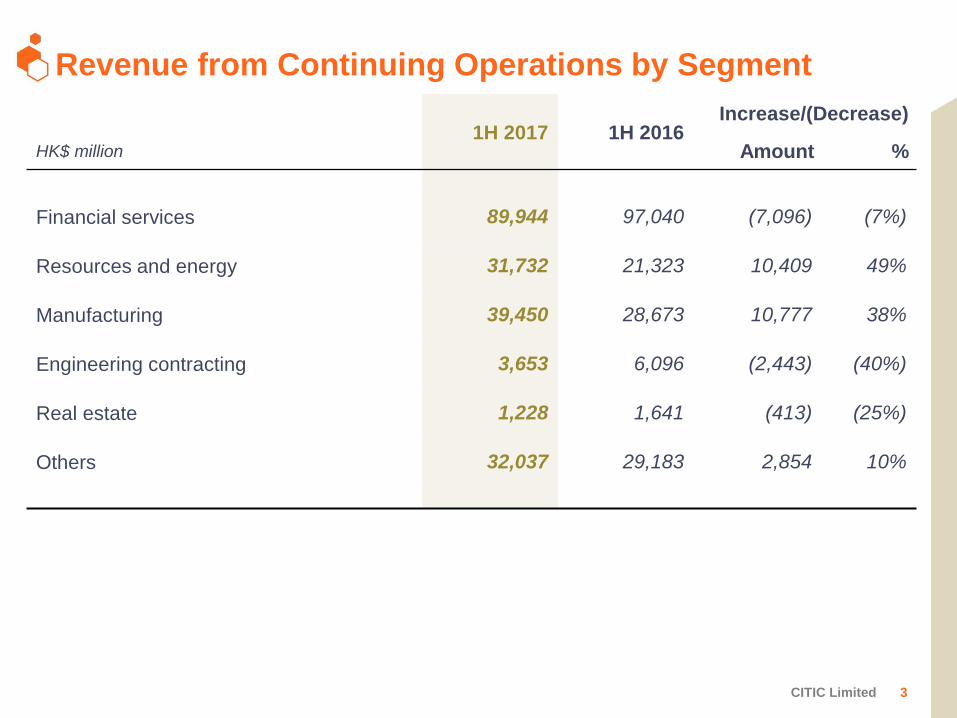
Revenue from Continuing Operations by Segment
1H 2017 1H 2016Increase/(Decrease)
HK$ million Amount %
Financial services 89,944 97,040 (7,096) (7%)
Resources and energy 31,732 21,323 10,409 49%
Manufacturing 39,450 28,673 10,777 38%
Engineering contracting 3,653 6,096 (2,443) (40%)
Real estate 1,228 1,641 (413) (25%)
Others 32,037 29,183 2,854 10%

4CITIC Limited
Profit/(Loss) Attributable to Ordinary Shareholders by Segment
1H 2017 1H 2016Increase/(Decrease)
HK$ million Amount %
Financial services 21,276 21,941 (665) (3%)
Resources and energy (284) 911 (1,195) (131%)
Manufacturing 1,796 1,641 155 9%
Engineering contracting 310 1,060 (750) (71%)
Real estate 5,691 (4,717) 10,408 221%
-Continuing operations 5,691 19 5,672 299x
-Discontinued operations - (4,736) 4,736 -
Others 7,084 2,267 4,817 212%

5CITIC Limited
Financial Position
30/06/2017 31/12/2016Increase/(Decrease)
HK$ million Amount %
Total assets 7,155,425 7,237,995 (82,570) (1%)
Total liabilities 6,413,396 6,542,144 (128,748) (2%)
Incl.: Deposits from customers 3,950,545 4,031,522 (80,977) (2%)
Deposits from banks and
non-bank financial institutions1,010,882 1,097,164 (86,282) (8%)
Debt instruments issued 666,365 543,893 122,472 23%
Bank and other loans 119,845 112,819 7,026 6%
Total ordinary shareholders’ funds 520,585 482,760 37,825 8%
Total ordinary shareholders’ funds and
perpetual capital securities528,458 490,633 37,825 8%

6CITIC Limited
Total Consolidated Debts
30/06/2017 31/12/2016Increase/(Decrease)
HK$ million Amount %
Financial services 546,773 435,543 111,230 26%
Resources and energy 47,146 42,851 4,295 10%
Manufacturing 21,489 19,330 2,159 11%
Engineering contracting 1,522 1,276 246 19%
Real estate 13,523 10,721 2,802 26%
Others 42,373 37,545 4,828 13%
Operations management 135,575 122,686 12,889 11%
Elimination (22,191) (13,240) (8,951) (68%)
Total 786,210 656,712 129,498 20%

7CITIC Limited
Capital Expenditure
1H 2017 1H 2016Increase/(Decrease)
HK$ million Amount %
Financial services 1,027 5,941 (4,914) (83%)
Resources and energy 2,419 2,901 (482) (17%)
Manufacturing 1,798 2,600 (802) (31%)
Engineering contracting 922 154 768 499%
Real estate 869 4,403 (3,534) (80%)
Others 2,904 5,979 (3,075) (51%)
Total 9,939 21,978 (12,039) (55%)

OUR
BUSINESSES

9CITIC Limited
Financial ServicesAs of 30 June Increase/(Decrease)
HK$ million 2017 2016 Amount %
Revenue 89,944 97,040 (7,096) (7%)
Profit attributable to ordinary shareholders 21,276 21,941 (665) (3%)
Assets (compared with 31 Dec 2016) 6,605,963 6,729,902 (123,939) (2%)
Capital expenditure 1,027 5,941 (4,914) (83%)
Contribution from financial services was HK$21.3 billion in 1H17. Excluding the
impact of foreign exchange conversion, profit for the sector grew 2%
CITIC Bank
• Revenue in 1H17 declined 2.1% vs 1H 2016 to RMB76.6 billion due to VAT reform. Excluding
the VAT impact, revenue increased 1.8%. Net profit rose 1.7% to RMB24 billion.
• Due to improved income mix, non-interest income rose 3.6 percentage points to 35.3% of
revenue, offsetting the impact of lower net interest income caused by the narrowing of NIM.
• The NPL ratio decreased 4bps to 1.65% from end 2016, a result of more stringent risk
management and NPL disposal. The credit structure continued to be optimised.
• Total assets declined 4.7% reflecting the bank’s asset-light strategy.

10CITIC Limited
Financial Services (Continued)
CITIC Trust
• Against a tightened regulatory environment, CITIC
Trust continued to outperform its peers.
• As at the end of June, total AUM exceeded RMB2
trillion, again placing CITIC Trust at the top of the
industry.
CITIC Securities
• 1H net profit declined by 6% compared with the same
period last year, mainly due to the drop in trading
volume on the A-share market.
• In investment banking, margin financing and securities
lending, CITIC Securities maintained its No. 1 position
in the industry.
CITIC-Prudential
• Net profit recorded a significant year-on-year growth of
156%, mainly due to higher premium income.
• Continued to optimise the business structure and
distribution channels. All businesses achieved solid
growth.

11CITIC Limited
Resources and EnergyAs of 30 June Increase/(Decrease)
HK$ million 2017 2016 Amount %
Revenue 31,732 21,323 10,409 49%
Profit/(Loss) attributable to ordinary
shareholders(284) 911 (1,195) (131%)
Assets (compared with 31 Dec 2016) 141,921 135,784 6,137 5%
Capital expenditure 2,419 2,901 (482) (17%)
Resources and energy recorded a net loss of HK$284 million primarily due to newly
recorded costs at Sino Iron following its start of commercial operation during 2H16
Crude Oil
• Oil production maintained at a stable level.
• Crude oil business improved remarkably due to growth in sales prices and continuous cost
control.
Sino Iron
• As it entered commercial operation in 2H16, costs associated with Sino Iron have now started
being recorded on the income statement; resulting in higher effective losses than in 1H16.
• 7.53 million wet metric tonnes of magnetite concentrates produced in 1H17.
• Key priorities remain to ramp up production, improve efficiency and lower operating costs.

12CITIC Limited
Manufacturing As of 30 June Increase/(Decrease)
HK$ million 2017 2016 Amount %
Revenue 39,450 28,673 10,777 38%
Profit attributable to ordinary shareholders 1,796 1,641 155 9%
Assets (compared with 31 Dec 2016) 103,684 96,112 7,572 8%
Capital expenditure 1,798 2,600 (802) (31%)
Profit contribution from manufacturing sector rose 9% to HK$1.8 billion, mainly dueto solid performance of the special steel business
CITIC Pacific Special Steel
• Net profit increased 33% in 1H17 compared with 1H16, mainly due to growth in sales volume and
price.
• Continued optimisation in product mix led to a higher proportion of high-end products.
CITIC Heavy Industry
• Net profit in 1H2017 was about the same as in 1H16.
• The special purpose robot and intelligent equipment businesses grew rapidly, becoming new profit
contributors.
CITIC Dicastal
• Net profit in 1H17 declined due to movements in the euro exchange rate .
• As demand in the auto market increased, the aluminium wheels and castings businesses continued to
grow.

13CITIC Limited
Engineering Contracting As of 30 June Increase/(Decrease)
HK$ million 2017 2016 Amount %
Revenue 3,653 6,096 (2,443) (40%)
Profit attributable to ordinary shareholders 310 1,060 (750) (71%)
Assets (compared with 31 Dec 2016) 37,988 36,796 1,192 3%
Capital expenditure 922 154 768 499%
Contribution was HK$310 million, 71% less vs 1H16 as major projects were nearing
completion while new projects are still under early-stage construction and have yet to
contribute to profit
CITIC Construction
• New projects commenced in 1H17 including the Royal
Albert Dock project in the UK and the KK Phase II municipal
infrastructure project in Angola.
• As of 30 June 2017, total value of signed contracts was
RMB200.5 billion, of which RMB739 million was from new
contracts signed in 1H17.
14CITIC Limited
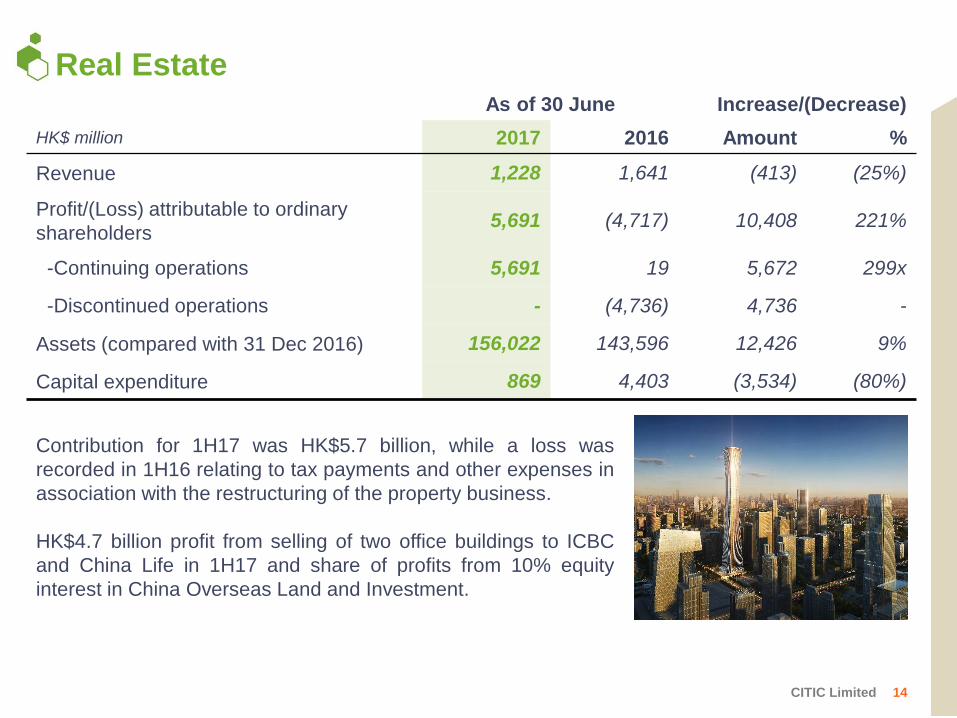
Real EstateAs of 30 June Increase/(Decrease)
HK$ million 2017 2016 Amount %
Revenue 1,228 1,641 (413) (25%)
Profit/(Loss) attributable to ordinary
shareholders5,691 (4,717) 10,408 221%
-Continuing operations 5,691 19 5,672 299x
-Discontinued operations - (4,736) 4,736 -
Assets (compared with 31 Dec 2016) 156,022 143,596 12,426 9%
Capital expenditure 869 4,403 (3,534) (80%)
Contribution for 1H17 was HK$5.7 billion, while a loss was
recorded in 1H16 relating to tax payments and other expenses in
association with the restructuring of the property business.
HK$4.7 billion profit from selling of two office buildings to ICBC
and China Life in 1H17 and share of profits from 10% equity
interest in China Overseas Land and Investment.
15CITIC Limited
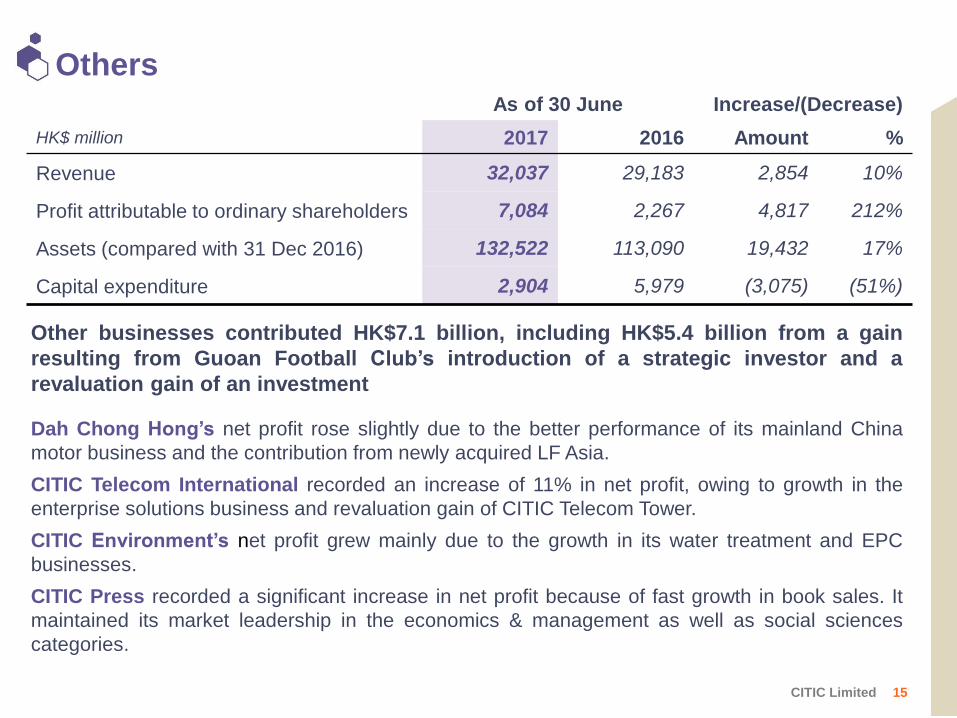
Others As of 30 June Increase/(Decrease)
HK$ million 2017 2016 Amount %
Revenue 32,037 29,183 2,854 10%
Profit attributable to ordinary shareholders 7,084 2,267 4,817 212%
Assets (compared with 31 Dec 2016) 132,522 113,090 19,432 17%
Capital expenditure 2,904 5,979 (3,075) (51%)
Other businesses contributed HK$7.1 billion, including HK$5.4 billion from a gain
resulting from Guoan Football Club’s introduction of a strategic investor and a
revaluation gain of an investment
Dah Chong Hong’s net profit rose slightly due to the better performance of its mainland China
motor business and the contribution from newly acquired LF Asia.
CITIC Telecom International recorded an increase of 11% in net profit, owing to growth in the
enterprise solutions business and revaluation gain of CITIC Telecom Tower.
CITIC Environment’s net profit grew mainly due to the growth in its water treatment and EPC
businesses.
CITIC Press recorded a significant increase in net profit because of fast growth in book sales. It
maintained its market leadership in the economics & management as well as social sciences
categories.

CITIC Limited
Thank YouPotential investors and shareholders of the Company (the “Potential Investors and Shareholders”) are
reminded that information contained in this Presentation comprises extracts of operational data and financial
information of the Group. The information included is solely for the use in this Presentation and certain
information has not been independently verified. No representations or warranties, expressed or implied, are
made as to, and no reliance should be placed on, the fairness, accuracy, completeness or correctness of the
information or opinions presented or contained in this Presentation. Potential Investors and Shareholders
should refer to the 2017 Half-Year Report for the results of the Company which are prepared in accordance
with relevant rules, regulations and accounting standards. The performance and the results of operations of
the Group contained within this Presentation are historical in nature, and past performance is no guarantee of
the future results of the Group. Any forward-looking statements and opinions contained within this Presentation
are based on current plans, estimates and projections, and therefore involve risks and uncertainties.
Actual results may differ materially from expectations discussed in such forward-looking statements and
opinions. The Group, the Directors, employees and agents of the Group assume (a) no obligation to correct or
update the forward-looking statements or opinions contained in this Presentation; and (b) no liability in the
event that any of the forward-looking statements or opinions do not materialise or turn out to be incorrect.
Potential Investors and Shareholders should exercise caution when investing in or dealing in the securities of
the Company.