Review Medicare: --Health care for those over age 65 Medicaid: --Health care for the poor Social...
19
Review • Medicare: --Health care for those over age 65 • Medicaid: --Health care for the poor • Social Security: --pension money for those who retire --unemployment insurance;
-
Upload
madeline-gardner -
Category
Documents
-
view
214 -
download
0
Transcript of Review Medicare: --Health care for those over age 65 Medicaid: --Health care for the poor Social...

Review• Medicare: --Health care for those over age 65
• Medicaid:--Health care for the poor
• Social Security:--pension money for those who retire--unemployment insurance; disability

Growing National DebtShould we be worried?

Federal Deficit Federal DebtLeads to a larger
$15.4 Trillion

Okay, so How Bad is Our
Deficit/Debt in Context?
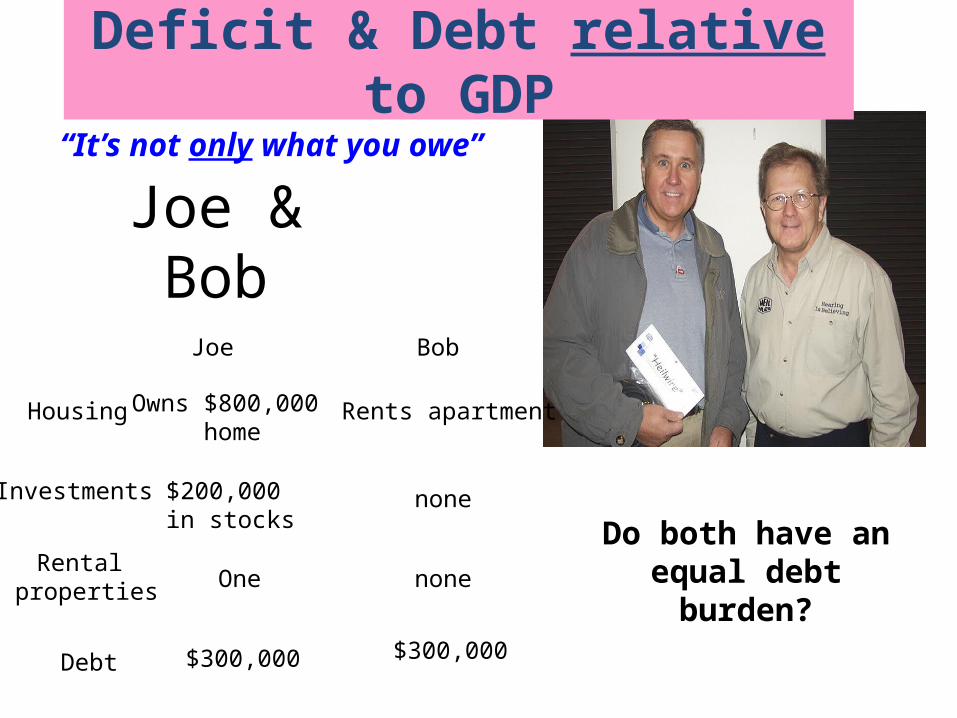
Joe & Bob
“It’s not only what you owe”
Deficit & Debt relative to GDP
Joe Bob
Housing Owns $800,000 home
Rents apartment
Investments $200,000 in stocks
none
Rental properties One none
Debt $300,000 $300,000
Do both have an equal debt burden?

Deficit & Debt relative to GDP
• Current Deficit = $ 0.8 Trillion (2013)
• Current Debt = $17.0 Trillion• Current GDP = $15.9 Trillion
• Deficit as % of GDP = 4.7% of GDP– Two years ago it was at 10%, the highest since World War II
• Debt as % of GDP =107% of GDP

History of DEBT as % of GDP
1) 1946- National debt peaked: 120% of GDP (WWII)
2) 1950-1980- Fell to pre-war levels: 32%
3) 1980-2005- Rose to 70%
4) 2009 76%
5) 2013 107%

NATIONAL DEBT AS % OF GDP
Debt:17.0 Trillion
GDP15.9 Trillion
107 % GDP
.

U.S. Debt in Comparison
• European Union (EU) debt limit of 60%
• France 90% of GDP
• Italy 127% of GDP
• Greece 156% of GDP
• Japan: 211% of GDP(1970: 10% of GDP)

.
Debt as a % of GDP
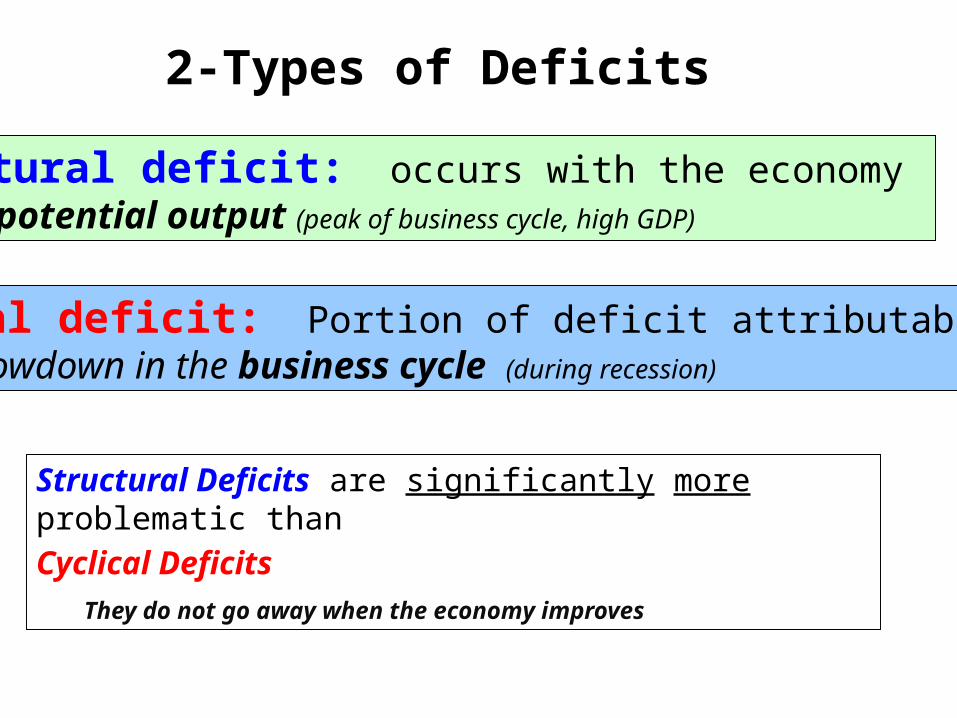
Structural deficit: occurs with the economy at full potential output (peak of business cycle, high GDP)
Cyclical deficit: Portion of deficit attributable to a slowdown in the business cycle (during recession)
2-Types of Deficits
Structural Deficits are significantly more problematic than
Cyclical Deficits
They do not go away when the economy improves
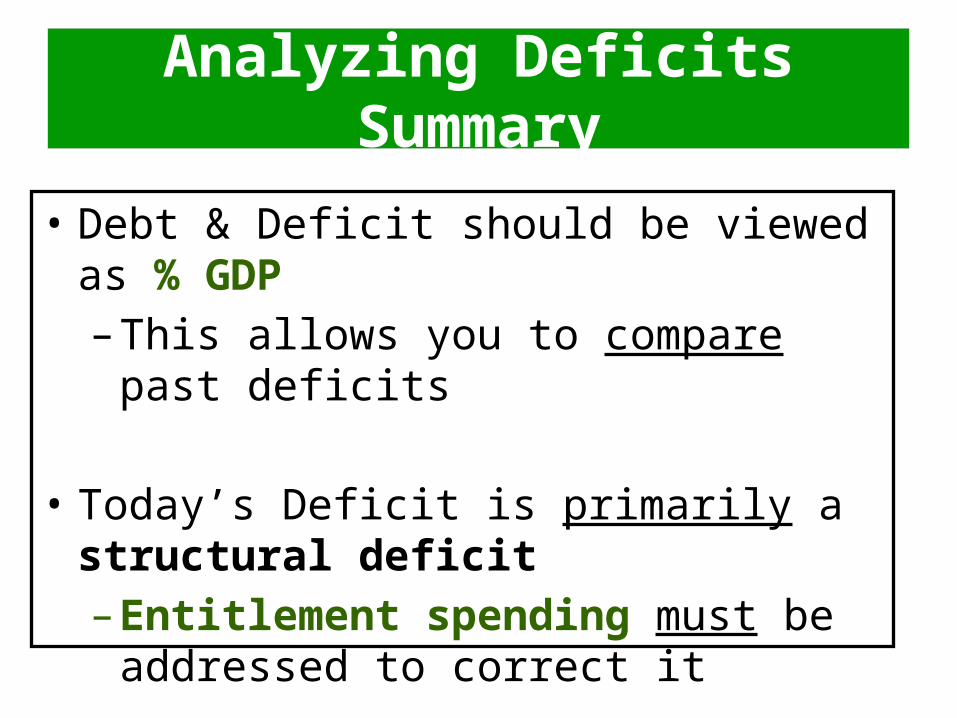
Analyzing Deficits Summary
• Debt & Deficit should be viewed as % GDP– This allows you to compare past deficits
• Today’s Deficit is primarily a structural deficit– Entitlement spending must be addressed to
correct it

Balancing the Budget?“The only real question” is whether adjustments to taxes and spending will come from a “careful and deliberative process” or from a “rapid and painful response to a looming or actual fiscal crisis,” Ben Bernanke Chairmen of Federal Reserve
2010
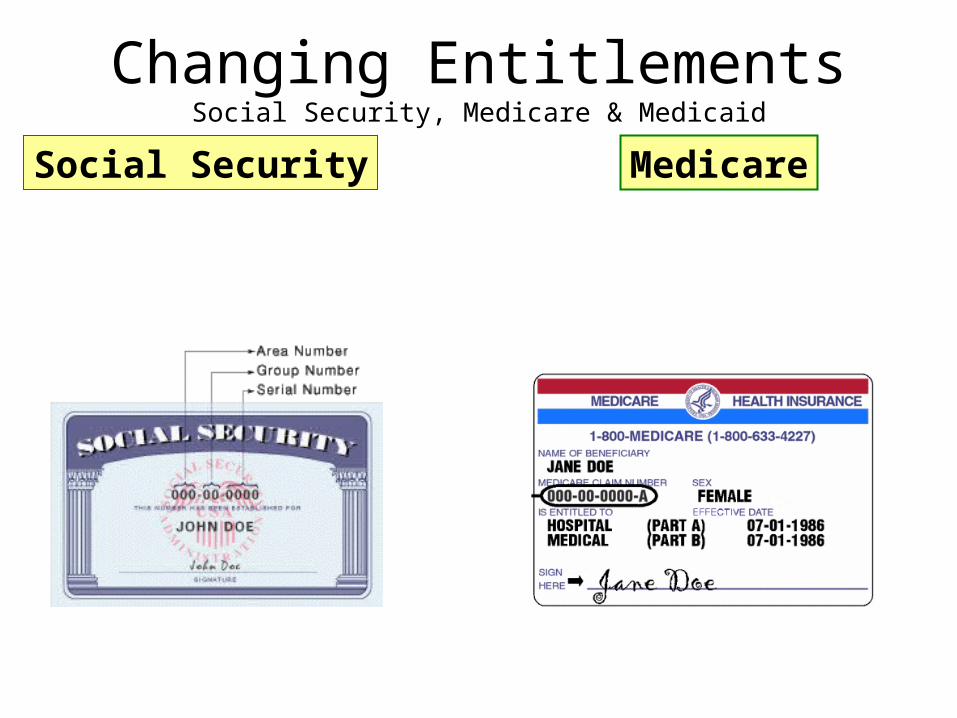
Changing EntitlementsSocial Security, Medicare & Medicaid
Social Security Medicare

Medicare Fraud500 Billion spent per year
50 Billion stolen?


U.S. Debt in Comparison
• Greece 125% of GDP
• Italy 115% of GDP
• European Union (EU) debt limit of 60%
• Japan 180% of GDP– Japanese citizens save money => so they buy Japanese Gov’t Bonds– No crowding out!
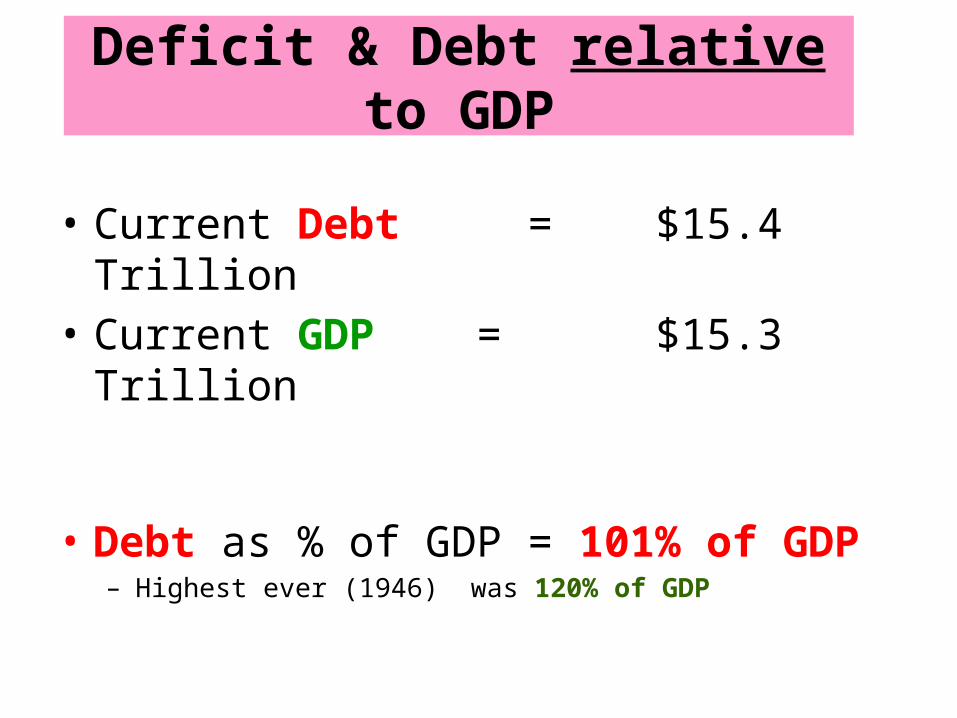
Deficit & Debt relative to GDP
• Current Debt = $15.4 Trillion• Current GDP = $15.3 Trillion
• Debt as % of GDP = 101% of GDP– Highest ever (1946) was 120% of GDP

Analyzing Deficits Summary
• Entitlements make up an ever-increasing percentage of the Federal Budget
• Debt & Deficit should be viewed as % of GDP– This allows you to compare past deficits and to compare
with other countries’ deficits
• The current Federal Deficit is a structural deficit– Just cutting Discretionary Spending will not be enough
to fix the problem– Entitlement spending must be addressed to correct it