
Predicting target-ligand interactions using protein ligand-binding site ...
J. Braz. Chem. Soc., Vol. 17, No. 8, 1501-1515, 2006.Printed in Brazil - ©2006 Sociedade Brasileira de Química
0103 - 5053 $6.00+0.00
Review
*e-mail: [email protected]
A Perspective on Applications of Ligand-Field Analysis: Inspiration fromElectron Paramagnetic Resonance Spectroscopy of Coordination Complexes
of Transition Metal Ions
Joshua Telser
Department of Biological, Chemical and Physical Sciences, Roosevelt University,430, South Michigan Avenue Chicago, IL 60605-1394, USA
Este artigo descreve de maneira um tanto pessoal, o uso da espectroscopia de ressonânciaparamagnética eletrônica (EPR), incluindo EPR de alta freqüência e alto campo (HFEPR) parainvestigar a estrutura eletrônica de complexos de íons de metal de transição. Os parâmetrosHamiltonianos de spin, obtidos a partir de experimentos EPR, matriz g para sistemas com S =1/2e matrizes g e D (zero-field splitting) para sistemas com S > 1/2 fornecem informações sobre osníveis de energia dos orbitais d. Esta informação pode ser combinada com a teoria do campoligante (TCL) para fornecer informações a respeito da estrutura eletrônica global de complexosparamagnéticos de metal de transição. Como tem sido discutido por outros autores a TCL aindase mostra útil para o entendimento quantitativo destes complexos, mesmo com a atualdisponibilidade de métodos computacionais avançados, como a teoria do funcional de densidade(DFT). A discussão é ilustrada por exemplos ao longo da série de transição, com configurações dn.
This paper describes in a somewhat personal way an overview of the use of electronparamagnetic resonance (EPR) spectroscopy, including high-frequency and -field EPR (HFEPR)to unravel the electronic structure of transition metal ion complexes. The spin Hamiltonianparameters obtained from EPR experiments, namely the g matrix for systems with S =1/2 andthe g and D (zero-field splitting) matrices for systems with S > 1/2 provide information on dorbital energy levels. This information can be combined with ligand-field theory (LFT) to provideinformation on the overall electronic structure of the paramagnetic transition metal complex.As has been discussed by others, LFT is still useful in providing such a quantitative understandingof these complexes, even in the day of advanced computational methods, such as densityfunctional theory (DFT). The discussion is illustrated by examples across the dn configuration.
Keywords: coordination chemistry, EPR, ligand-field theory, spectroscopy
1. Introduction
Crystal-field theory has its origins in the work of HansBethe in the 1920’s.1 This work, along with significantadvances by Friedrich Hund and Edward Teller,2 laid thefoundation for the understanding of the electronic structureof transition metal ions and molecules. This monumentalachievement was never recognized by the Nobel Prize,neither in Chemistry nor in Physics, and with the recentdeaths of Hund (in 1997, at age 101), Bethe (in 2005, atage 98) and Teller (in 2003 at age 95), it never will be.Ironically, the impetus for CFT and LFT began withsystems lacking any ligands whatsoever, namely gas phaseatoms and ions.3 The classic text by Condon and Shortley
summarizes this work. It never fails to astound the authorthat this text was written in 1935, a time when the theoriesand experiments so thoroughly analyzed therein were sorecent (the 1963 edition is now recommended).4
The author of this perspective came of age circa 1980,at which time crystal-field theory (CFT) and ligand-fieldtheory (LFT) were well established, but not emphasizedin graduate education in the USA as strongly as inprevious decades. For example, the angular overlapmodel (AOM), developed by Schäffer,5 was nevermentioned in the author’s formal education.Nevertheless, texts such as the monograph by Figgis,now in its updated edition with Hitchman,6 provided thenecessary background. The earlier text by Ballhausen7
was also readily available as well as more specializedtexts such as those by Griffith,8 and by Gerloch.9 In

1502 A Perspective on Applications of Ligand-Field Analysis J. Braz. Chem. Soc.
addition, particularly for formal instructional purposes,there was the classic text on “Chemical Applications ofGroup Theory” by Cotton10 and the very valuablereference on all types of spectroscopy related to inorganicchemistry by Drago.11 In the area of electron para-magnetic resonance (EPR), the monumental text, indeed“Bible”, by Abragam and Bleaney provides extensivetreatments of these theories and their application totransition metal ion EPR. The reprinting of this text byDover Publications12 was a spectacular service to the EPRcommunity. Also very useful for EPR of high-spininorganic systems, albeit mainly of rather exoticmolecules (i.e, matrix isolated metal clusters) is the textby Weltner;13 another Dover publication. More recentlyavailable is the text by Pilbrow, also on transition metalion EPR.14 Numerous texts are available on the EPRtechniques, as opposed to inorganic aspects of EPR, andamong these the more recent text by Weil et al.,15 andthe older text by Gordy,16 are most useful, particularlyfor understanding hyperfine interactions. This list is byno means comprehensive, it merely indicates those textsthat the author has used over the years.
What then is the situation now, more than 25 yearsafter the author began his modest involvement in this area?There has been an explosion in the availability ofcomputing power, in terms of ready access, high speed,enormous memory, and low cost. This hardware advancewould be of little significance were it not for the brilliantinsight and hard programming work of theoreticians, suchas the late Sir John A. Pople and Walter Kohn, whosework was indeed recognized by the Nobel Prize(Chemistry 1998). As a result of the pioneering efforts byPople and many others, it is now possible to perform high-level molecular orbital calculations on reasonably largemolecules in a very short time. Kohn and many othersdeveloped density functional theory (DFT), which is nowthe method of choice for computations involving transitionmetal complexes. Among younger chemists today, FrankNeese in Germany is the leading exemplar of theapplications of DFT to understanding such systems,17,18
and is the author of his own highly developed DFTprogram, ORCA.19 Michael T. Green and Thomas C.Brunold in the USA, and Abhik Ghosh in Norway havealso made significant advances in bioinorganic andinorganic chemistry with use of DFT studies,20-22
particularly in combination with optical spectroscopy aspracticed in the Brunold laboratory.21 As with the bookslisted above, the mention of these workers is not meant inany way to be comprehensive, but merely to provideexamples of those whose work is directly relevant to theauthor’s interests, as well as being of the highest quality.
What then has happened to CFT and LFT is this eraof DFT (and MO) software that can be run in a matterof minutes on a workstation or even microcomputer(PC)? Is there any need for theory that saw its apex inthe 1960’s? As already pointed out in a recent articleby Gatteschi and co-workers in Florence, Italy,23 thereis a place for LFT today. Their basis for this opinion ishigh-field and frequency EPR (HFEPR) studies doneby them in collaboration with Anne-Laure Barra andothers in Grenoble, France.24 Another locus of theseolder theories is the place where they were brought intofull flower, Copenhagen, Denmark. The work by JesperBendix25-27 and Høgni Weihe28 and their co-workers inCopenhagen, together with Philip L. W. Tregenna-Piggott in Switzerland,29-37 represent superb examplesof state-of-the-art experimental (not only HFEPR, butalso optical and vibrational spectroscopy, and mostsignificantly, inelastic neutron scattering (INS)31) andcomputational studies. In particular, Bendix has directlycompared LFT to the current luminary, DFT.26,27 Theauthor fully concurs with that opinion that the oldertheories, CFT and LFT, still have their place inunderstanding the electronic structure of transitionmetal complexes, in particular in rationalizingelectronic absorption/emission spectra. The use of LFTfor rationalizing EPR spectra will be described in theperspective. Concerning the modern, as opposed toclassical approach, the reader is enthusiasticallyreferred to the recent (partially) thematic issue of theJournal of Biological Inorganic Chemistry (JBIC) onthe application of DFT to bioinorganic chemistry, whichincludes insightful articles by Neese38 and by Ghosh,39
among others (Siegbahn40 and Noodleman41). Thesearticles highlight the fact that DFT is not the “be alland end all” in understanding transition metal systems,but that DFT is best primarily for rationalizingmolecular geometry (i.e, a ground state property) andnot as successful with phenomena involvingexcited states.
The balance of this perspective will survey a varietyof transition metal systems, most of which wereencountered during the course of HFEPR studies incollaboration with Jurek (Jerzy) Krzystek and others, andmore recently also Andrew (Andrzej) Ozarowski, all atthe National High Magnetic Field Laboratory inTallahassee, Florida, USA.42 Some cases were alsoencountered as a result of electron nuclear doubleresonance (ENDOR) studies with Brian M. Hoffman andco-workers at Northwestern University in Evanston,Illinois, USA.43 The application of simple LFT inanalyzing these systems will be described.
1503TelserVol. 17, No. 8, 2006
2. Experimental Sets
The complexes used to illustrate EPR spectra were alleither obtained from commercial sources or synthesizedby literature procedures. Experimental conditions aregiven in the figure captions. EPR spectra at 9.0 – 9.7 GHz(X-band) and at 34 – 36 GHz (K
a-band, often, but
erroneously, referred to as Q-band) were recorded onmodified Varian spectrometers at Northwestern University,Evanston, IL, USA. HFEPR spectra were recorded onlocally-constructed spectrometers at the NHMFL,Tallahassee, FL, USA.
All computer programs for EPR simulation (DDPOWH)and ligand field analysis (DSOXF, DDN package) are writtenin FORTRAN (g77) and are available from the author.
3. Results and Discussion
Optical spectroscopy, both absorption and emission,provided the original basis for CFT and LFT. The text byLever is strongly recommended for this area.44 However, EPRsoon came on the scene (in full flower by the early 1950’s)45
and by the 1960’s was a well established technique in termsof applicability towards understanding the electronic structureof transition metal ions and their complexes. In this regard,the texts by Abragam and Bleaney12 and by Griffith,8 bothmentioned above, are most relevant, as is a classic review byMcGarvey.46 The greatest applicability of EPR to transitionmetal systems is to those with only one unpaired electron, S= 1/2, namely, d1,9. The hole formalism allows concurrenttreatment of d10–n configurations with dn. These systems haveonly one free-ion term: 2D, with only 10 microstates: in aweak-field representation these are: |m
l, m
s⟩ = |±2, ±1/2⟩,
|±1, ±1/2⟩, |0, ±1/2⟩; in a strong-field representation, theseare d
xz±, d
yz±, d
xy±, d
x2-y2±, d
z2±. Each of these formalisms will
be used here interchangeably, along with the strong-fieldformalisms, t
2nem (for octahedral, point group O) or emt
2n (for
tetrahedral, point group T), both with 1 ≤ m ≤ 4, 1 ≤ n ≤ 6.In the case of d1,9, there is no fine structure (zero-field
splitting (ZFS), see below) so the main parametersobtainable from the spin Hamiltonian are the principalvalues of the g matrix, directly obtained from an EPRspectrum, with spin Hamiltonian, H = β
e B.g.S, where the
external magnetic field (vector) is B (to conform with SIunits, tesla (T); alternatively (formerly) H, to conformwith cgs units, gauss (G)).47 These components of g containinformation on the ligand-field of the metal ion. Thecontribution of orbital angular momentum to spin angularmomentum shifts the g values away from the free electronvalue, g
e = 2.00. The extent of the shift from g
e (negative
for dn, n < 5 and positive for dn, n > 5) is directly
proportional to the spin-orbit coupling constant. Thisconstant is given by ζ (often as ξ), which is the singleelectron spin-orbit coupling constant, with Hamiltonian,H
SO = Σ
i ζ
i(l
i⋅s
i), or is given as λ, which is the multi-electron
analog, with Hamiltonian, HSO
= λ(L⋅S). For d1,9, therelation between the two is given by λ = ζ/2S, so λ = ζ,but for other dn systems, the scaling by 2S between thetwo constants is valid only for terms with the same spinmultiplicity as the free-ion ground state. The effect of theexternal magnetic field is given by the electronic ZeemanHamiltonian, H
z = β
eΣi B⋅(kl
i + g
es
i), or in a multi-electron
basis set, βeB⋅(kL + g
eS), where k is the Stevens orbital
reduction parameter (which can be anisotropic). The shiftin g values also is inversely proportional to the energyseparation among the various d orbitals, connected viathe spin-orbit coupling operator. The relevant perturbationtheory equations are found in many sources,8,11,12 but forcompleteness are given below for both d1 (e.g., VO2+,tetragonally compressed, d
xy1,) and d9 (e.g., CuII,
tetragonally elongated, dxz,yz
4dxy
2dz2
2dx2-y2
1), respectively:
gz = g
e – 8ζ/(E
x2-y2 – E
xy); g
e + 8ζ/(E
xy – E
x2-y2) (1a, a’)
gx = g
e – 2ζ/(E
xz – E
xy); g
e + 2ζ/(E
xz – E
x2-y2) (1b, b’)
gy = g
e – 2ζ/(E
yz – E
xy); g
e + 2ζ/(E
yz – E
x2-y2) (1c, c’)
The classic example for CuII (3d9) is this ion in atetrapyrrole, where g
|| (g
z) ≈2.20(5) and g (g
xy) ≈2.05(5). In
such a case, the parallel (z) direction is normal to thetetrapyrrole plane (i.e., along the C
4 axis of a porphyrin with
D4h
point group symmetry) and the perpendicular direction(x, y) is in the tetrapyrrole plane. The orientation within thetetrapyrrole plane of g
x,y is not at all obvious due to in-plane
π-bonding effects. The g matrix orientation in d1,9 systemshas been studied by Hitchman and co-workers.48,49
In the case of CuII, hyperfine coupling at g|| (A
||) is also
often observed and the correlation of g|| and A
|| can provide
qualitative information on the donor atoms in the innercoordination sphere of CuII, as shown by Blumberg andPeisach,50 as well as quantitative information on spindistribution, as shown e.g., by Brown and Hoffman forCuTPP (TPP = dianion of 5,10,15,20-tetraphenyl-porphine), which also involved the precise measurementof porphryin 1H and 14N hyperfine coupling by ENDOR.51,52
For illustration, we show in Figure 1 the EPR spectrumrecorded at 35 GHz and 2 K of the complex Cu(OEP)(OEP = dianion of 2,3,7,8,12,13,17,18-octaethylporphine)in 2-methyltetrahydrofuran (2-Me-THF) solution. Thespectrum yields g
|| = 2.182, g⊥ = 2.0378, representative of
the unpaired electron in the dx2-y2
orbital (2B1g
in D4h
point

1504 A Perspective on Applications of Ligand-Field Analysis J. Braz. Chem. Soc.
group symmetry). Hyperfine coupling from both 63,65Cu(I = 3/2, 96.2%, 30.8%, respectively) and the fourequivalent tetrapyrrole 14N ligands (“superhyperfinecoupling” – a distasteful term to be avoided) is alsoobservable. These equatorial ligands are relatively stronglycoupled (A(14N) ≈40 MHz, by EPR simulation; see alsoBrown and Hoffman51) to the equatorial d
x2-y21 spin.
Equations 1 are quite useful for the commonly foundtetragonal geometry, but for other coordination environ-ments, it is useful to employ a full matrix treatment witha strong-field representation and specific orbital energylevels or with a weak-field basis set and the AOM. Thelatter method is achieved with use of the superb programLigfield, written by Jesper Bendix,53 or the lesssophisticated program DDN, by the author. Other highlyregarded and widely programs are AOMX,54 by HeribertAdamsky and CAMMAG,55 by Malcolm Gerloch. The
author has never made use of these himself, however,collaborators Stratemeier and Hitchman have.56 As anexample of this type of calculation for a d9 system, use ofthe program DDN with the following crystal-fieldparameters (in cm–1): Dq = 2500, Ds = 2500, Dt = 2000,which crudely represent porphyrin coordination,57 withspin-orbit coupling constant ζ = -600 cm–1, yields (withan external magnetic field typical for X-band EPR) g
|| =
2.19, g⊥ = 2.05; values in good agreement with thoseobserved for CuII porphyrins.58
Transition metal ions that have other than d1,9 electronicconfigurations represent more complex situations due tothe large number of possible electronic configurations(microstates). In many cases, however, the electronic groundstate is a spin doublet, so that the same spin Hamiltonianapplicable to true S = 1/2 systems can also be employed.The most relevant cases are low-spin (LS) d7 and LS d5.For LS d7, the quartet terms that are lower energy in thefree-ion or high-spin (HS) state are now higher in energyand the doublet terms are lower in energy. As describedelsewhere,14 the g values observed for LS d7 can also provideinformation on the d orbital energies. The relevant equationsfor tetragonally elongated LS d7 (d
xz,yz4d
xy2d
z21; a strong field
representation) are given below:
gz = g
e(2a)
gx = g
e + 6ζ / (E
yz – E
z2) (2b)
gy = g
e + 6ζ /(E
xz – E
z2) (2c)
The best examples of LS d7 are complexes of CoII withstrong-field ligands (e.g., tetrapyrroles, as always) and ofNiIII. The detailed EPR and ENDOR studies by the lateArthur Schweiger and co-workers on CoII tetrapyrroles andcorrins are especially instructive.59,60 Rather than displayinga LS CoII EPR spectrum here (e.g., tetrapyrrole), which iscomplicated by cobalt hyperfine splitting (59Co, I = 7/2,100%), we illustrate the analogous EPR spectrum for LSNiIII. Figure 2 presents the EPR spectrum recorded at 35GHz and 2 K of the complex [Ni(cyclam)]3+ (cyclam =1,4,8,11-tetraazacyclotetradecane) prepared from the NiII
analogue, [Ni(cyclam)]Cl2, in aqueous solution by oxidation
with potassium peroxidisulfate.61 The spectrum yields g|| =
2.0218, g⊥ = 2.220, representative of the unpaired electronin the d
z2 orbital (2A
1g in D
4h point group symmetry; d
x2-y2
orbital unoccupied, LUMO). In contrast to Figure 1, nohyperfine splitting is apparent. Natural abundance nickelcomprises predominantly zero-spin nuclei (the exceptionis 61Ni, I = 3/2, 1.13%), in contrast to both copper and cobalt.In further contrast to Cu(OEP) (Figure 1), the equatorial
Figure 1. EPR spectrum of Cu(OEP) in frozen 2-Me-THF solution (~1mmol L-1): experimental numerical derivative (red, upper trace) and itssimulation (blue, lower trace). Experimental parameters: temperature, 2K; microwave frequency, 35.145 GHz; microwave power, 20 μW; 100kHz modulation amplitude, 0.2 mT; time constant, 128 ms; scan time, 4min. Simulation parameters: S = 1/2; g = [2.0378, 2.0378, 2.182]; A(63Cu)= [114, 114, 630] MHz, A(14N) = [42, 42, 50] MHz; Gaussian single-crystal linewidths = [20, 20, 30] MHz. The hyperfine matrices are as-sumed collinear with the g matrix; A
||(63Cu) is indicated by “goalposts”.

1505TelserVol. 17, No. 8, 2006
nitrogen ligands are only very weakly coupled (A(14N) < 5MHz, estimated by ENDOR; see also van Doorslaer andco-workers59,60 for CoII) to the axial d
z21 spin.
LS d5 is best exemplified by FeIII with strong-fieldligands (e.g., tetrapyrroles yet again, but also with strongaxial ligands), and also by complexes of the other Group 8ions, RuIII 25,62 and OsIII.63 The electronic configuration d5
has the largest number of microstates (252) and the mostcomplicated electronic energy levels for the free-ion.
The LS d5 state (t2
5 configuration) might seem to eludethis complication and be as easily understood as d9 is.This is not so. As recently discussed by Slep and co-workers,63 the best approach for analyzing magnetic orEPR data even for such an S = 1/2 system is by a completeligand-field analysis using the entire d5 basis set.
Nevertheless, it is possible to analyze LS d5 with useof methods analogous to those for simpler S =1/2 systems.Griffith8 describes EPR spectroscopy of LS d5 (p363-366,
12.4.10) and his work is commonly referred to. A morerecent, and in the opinion of this author, the most definitivedescription of the EPR situation that obtains for LS d5 isgiven by McGarvey in two highly readable reviews.64,65
The many pitfalls of extracting electronic configurationfrom the observed g values, such as their assignment tog
x, g
y, g
z, are clearly explained in these papers. We will
reproduce one such set of equations from one ofMcGarvey’s papers, namely for tetragonally distorted LSd5, with the real d orbital basis set. This examplecorresponds most closely to those given above for d1,9 andother cases described below. The g values are as follows:65
gz = 2[A2 – C2 – B2 – 2kBC] (3a)
gx = 2[B2 – A2 – C2 – 2kAC] (3b)
gy = 2[C2 – B2 – A2 – 2kAB] (3c)
where k is the Stevens orbital reduction factor (assumedequal to 1 for the examples below; this factor can effectshifts of observed g from 2.0, even in cubic symmetry),and A, B, C, are the wavefunction coefficients (A2 + B2 +C2 ≡ 1) of the ground state Kramers doublet, ψ
±, as follows:
ψ± = A|d
xz+d
xz–d
yz+d
yz–d
xy±⟩ +
B|dxz
+dxz
–dxy
+dxy
–dyz
−+ ⟩ ±iC|d
yz+d
yz–d
xy+d
xy–d
xz −+ ⟩ (4)
For an octahedral system, A = B = C = , so all ofthe calculated g values equal –2 (note that (g2)1/2 is usuallywhat is experimentally determined, so this negative signis not apparent).
Any distortion from this idealized symmetry, and theEPR situation can rapidly change. The consequences ofequations 3 and 4 are shown graphically in Figure 3, whichdisplays the observed g values (i.e., (g2)1/2) as a functionof the wavefunction coefficient A2 for varying degrees ofrhombic distortion. For a large tetragonal distortion(elongation), the orbital singlet d
xy is highest in energy
and contains the electron “hole”. Thus, A2 ≈ 1, B = C ≈ 0,and the (observed) g values are again equal to 2 (althoughthe actual signs of g
|| and g⊥ are opposite). This situation
corresponds to the rightmost side of Figure 3. For a largecompression, with no rhombic distortion, then the orbitaldoublet d
xzd
yz is highest in energy and contains the hole,
so that: A ≈ 0, B2 = C2 ≈ 1/2, so the calculated g values areg
z = –4, g
x = g
y = 0. This situation corresponds to the
leftmost side of Figure 3. Rhombic splitting (i.e., B2 ≠ C2)can lead to widely divergent g values, as shown in Figure3 for several levels of this effect.
Figure 2. EPR spectrum of [Ni(cyclam)]3+ (chloride anion) in frozen aque-ous solution (~0.5 mmol L-1): experimental numerical derivative (red,upper trace) and its simulation (blue, lower trace). Experimental param-eters: temperature, 2 K; microwave frequency, 34.963 GHz; microwavepower, 20 μW; 100 kHz modulation amplitude, 0.3 mT; time constant,128 ms; scan time, 4 min. Simulation parameters: S = 1/2; g = [2.220,2.220, 2.0218]; Gaussian single-crystal linewidths = [150, 150, 40] MHz.

1506 A Perspective on Applications of Ligand-Field Analysis J. Braz. Chem. Soc.
For an experimental illustration of an approximationof this system, we show in Figure 4 the EPR spectrumrecorded at 35 GHz and 2 K of the complex [Fe(CN)
6]3–
as its tetraphenylphosphonium salt in acetonitrile/toluene(2:1 v/v) solution (compound kindly provided by Prof.Leo Slep, University of Buenos Aires, Argentina). Thespectrum is not easily interpretable as the lines are verybroad and featureless and the lowest g value lies wellbeyond the magnetic field maximum. This is the result ofA2 → 0, which leads to g
x,y → 0, as mentioned above.
EPR at conventional frequencies (X-band (~9 GHz) andK
a-band (35 GHz, commonly, but incorrectly referred to
as Q-band), but at high magnetic fields (as much as 25 T,see below) is potentially very applicable to such systems.For a quantitative example, Griffith gives for [Fe(CN)
6]3–
doped into diamagnetic [Co(CN)6]3–, g
x = 2.35, g
y = 2.10,
gz = 0.915.8 Comparison with Figure 3 shows that this
case roughly corresponds to A2 ≈ 0.52, which gives gz ≈
0.9, with 2.1 < gy < 2.4 and 2.4 < g
x < 2.7 (a better match
could obtain with k < 1, appropriate for the highly covalentFe-CN bonds). The electron hole is thus delocalizedamong the three t
2 orbitals, but primarily in d
xy. This
indicates that the complex is significantly distorted fromoctahedral geometry, which might be the result both ofcrystal packing effects involving the cations (particularlyrelevant for a highly charged complex such as hexacyano-ferrate/cobaltate) and Jahn-Teller distortion of the t
25
manifold. It must be emphasized that the g matrix principalcomponent designations x, y, z are not meant to imply aparticular geometry. Indeed, in a homoleptic complex suchas [Fe(CN)
6]3–, it is not possible to relate these easily to
molecular structure. Even in a heteroleptic LS d5 complex(e.g., [Ru(NH
3)
5L]3+, where L is a variety of imino ligands),
the directions of the g matrix components can be verydifferent from what might be expected based on themolecular structure, as a consequence of π-bonding andother complicated effects.62,64,65
We next turn to transition metal systems that have morethan one unpaired electron and are in HS ground states,in contrast to the LS d7 and d5 cases mentioned above.The first of these is “HS” d8 (the quotation marks becausethe “LS” form is not really appropriate for octahedralsymmetry, but for square planar). In such a system, thecontribution of orbital angular momentum not only shiftsthe g values, but can also remove the zero-field degeneracyof the M
S levels: zero-field splitting (ZFS).66 In its simplest
form, this effect is represented in the spin Hamiltonianby S·D·S (D
y + D
x + D
z ≡ 0), which for S = 1 and D > 0 and
axial (Dy ≡ D
x ≠ D
z; E = 0), gives |S, M
S⟩ = |1, ±1⟩ at D
above |1, 0⟩.12 The application of a magnetic field leads to
Figure 3. Graphical representation of EPR results for a tetragonally dis-torted LS d5 complex. The abscissa gives the wavefunction coefficientfor the electron “hole” in the d
xy orbital (0 ≤ A2 ≤ 1; see equation 6). The
ordinate gives observed g values: gx (blue lines), g
y (red lines), g
z (black
lines), calculated from equations 5. Three different cases of rhombic dis-tortion are given (all subject to A2 + B2 + C2 = 1): B2/C2 = 1.05, 1.40 (bothas solid lines; representing modest rhombic distortion: respectively cor-responding to ~51% and ~58% hole in d
yz when A2 = 0), and 3.0 (dashed
line; representing large rhombic distortion: corresponding to 75% holein d
yz when A2 = 0). The vertical dotted line corresponds approximately to
the wavefunction that yields the g values reported8 for [Fe(CN)6]3– doped
into [Co(CN)6]3–.
Figure 4. EPR spectrum of [Fe(CN)6]3– (tetraphenylphosphonium
cation) in frozen acetonitrile/toluene (2:1 v/v) solution (~1 mmol L-1):experimental spectrum (red trace) and its numerical derivative (violettrace). Experimental parameters: temperature, 2 K; microwave frequency,35.144 GHz; microwave power, 20 μW; 100 kHz modulation amplitude,0.4 mT; time constant, 128 ms; scan time, 4 min. No simulation of thisbroad signal is attempted. The signal has an absorption lineshape due torapid-passage effects.

1507TelserVol. 17, No. 8, 2006
the combination of ZFS with the electronic Zeeman(β
eS·g·B) effect to give an energy level diagram as shown
in Figure 5. The situation in Figure 5 is appropriate wherethe orbital angular momentum contribution is differentalong one molecular principal direction from the othertwo. It is also possible, and indeed quite common, that allthree canonical directions are inequivalent (D
y ≠D
x ≠D
z;
E ≠0) and in that case, there are three zero-field energylevels. Application of a magnetic field gives the energylevel diagram as shown in Figure 6.
It is still possible, however, to have a transition metalS = 1 system in which the effects of orbital angularmomentum are isotropic, so that D = 0 (D
y ≡ D
x ≡ D
z).
Figure 7 presents such a case, namely the X-band EPRspectrum at 77 K for [Ni(NH
3)
6]2+ (here as the chloride
salt in frozen ammonia solution). In this complex, the
ammine ligands are pure σ-donors, in contrast to thecomplicated, anisotropic π-bonding that is found foraqua ligands, which leads to extensive ZFS fornominally octahedral, HS hexaaqua complexes.32-34 Inaddition, the octahedral d8 electronic configuration(3T
1g ground state, t
26e2) has no proclivity towards Jahn-
Teller distortion, in contrast particularly to e.g., d9 (t2
6e3)or LS d7 (t
26e1) (or even four-coordinate d8: e4t
24). Thus,
hexaamminenickelII has a truly octahedral (cubic)environment about the metal ion and a resulting absenceof ZFS. Orbital effects are not wholly absent, as theobserved g value is uniformly shifted to g
iso = 2.126
(> 2.00, for this > half-filled, “hole”, configuration).Use of the program DDN with the appropriate bondingparameter (εσ = 3600 cm–1 for NH
3 in [Ni(NH
3)
6]2+),6
free-ion values for single-electron spin-orbit couplingand Racah interelectronic parameters (respectively,
Figure 5. Energy level diagram for S = 1 system with axial ZFS, D = 10cm–1, as a function of external magnetic field applied along the perpen-dicular (green traces, ⊥ ≡ x, y) and parallel (black traces, || ≡ z) directions.The |S, M
S⟩ states are indicated in the zero-field and high-field cases (left
and right edges, respectively). Arrows indicate the microwave quantumfor X-band (~0.3 cm–1), W-band (~1 cm–1) and 330 GHz (11 cm–1), typi-cal for HFEPR. Only with the last of these is a magnetic dipole allowedtransition possible at an accessible magnetic field.
Figure 6. Energy level diagram for S = 1 system with rhombic ZFS, D =10 cm–1, E = 2 cm–1, as a function of external magnetic field applied alongthe x (blue traces), y (red traces), and z (black traces) directions. The |S,M
S⟩ states are indicated in both the zero-field and high-field cases (left
and right edges, respectively). Arrows indicate the microwave quantumfor X-band (~0.3 cm–1), W-band (~1 cm–1) and 330 GHz (11 cm–1), typi-cal for HFEPR. As in the axial case (Figure 5), only with the last of theseis a magnetic dipole allowed transition possible at an accessible mag-netic field.
Figure 7. EPR spectrum of [Ni(NH3)
6]2+ (chloride anion) in frozen am-
monia solution (saturated solution): experimental (red, upper trace) andits simulation (blue, lower trace). Experimental parameters: temperature,77 K; microwave frequency, 9.095 GHz; microwave power, 20 mW; 100kHz modulation amplitude, 0.5 mT; time constant, 128 ms; scan time, 4min. Simulation parameters: S’ = 1/2, g = 2.153; Lorentzian single-crys-tal linewidths = 250 MHz. To indicate how perfectly isotropic andLorenztian the lineshape is, the experimental and simulated spectra aresuperimposed. Powder [Ni(NH
3)
6]I
2 gives a spectrum at 77 K with g =
2.126 and Lorentzian single-crystal linewidths = 800 MHz.

1508 A Perspective on Applications of Ligand-Field Analysis J. Braz. Chem. Soc.
ζ = -630 cm–1; B = 810 cm–1 (C = 4.7B)6), and anexternal field typical of X-band EPR, yields isotropicg = 2.223. This discrepancy of < 5% could be improvedupon if an orbital reduction factor (k < 1) and/orreduction in ζ, both due to covalency, were introduced.
The calculation of g values in the above case is simplebecause of cubic symmetry that leads to linear fielddependence. When ZFS occurs as a result of lowersymmetry, then the intrinsic g values can be calculatedby combining the spin Hamiltonian matrix with the resultsof a ligand-field analysis, as follows:
gz = [(E
3z – E
2z)2 – (2E)2]1/2/(2βB
z) (5a)
gx = [(E
3x – E
1x)2 – (D + E)2]1/2/(2βB
x) (5b)
gy = [(E
3y – E
1y)2 – (D – E)2]1/2/(2βB
y) (5c)
where the energy levels (eigenvalues) of the lowest spin(spin-orbital, spinor) triplet are designated E
1, E
2, E
3
(in ascending value; these values in zero field are: E1 ≡ 0,
E2 = D – |E| , E
3 = D + |E|, for D > 0), with the letter
subscript indicating a calculation with the externalmagnetic field aligned along the molecular, z, x, or y axes,respectively. Generally, the calculation is done over arange of magnetic field values to find the consensus gvalues that obtain under high field conditions.
NickelII complexes without this especially symmetricalcoordination sphere often exhibit ZFS. If the microwavequantum is too small to resonate with magnetic-dipoleallowed transitions (see Figures 5 and 6), then the complexis “EPR-silent” (at conventional frequencies (ν ≤ 35 GHz)and magnetic fields (B ≤ 1.5 T). However, as seen in Figure7, “HS” NiII is not necessarily “EPR-silent”. Nevertheless,most “HS” NiII complexes have lower than cubicsymmetry, by virtue of heteroleptic ligation and/oranisotropic ligand bonding, and are “EPR-silent” (“EPR-invisible” is perhaps more realistic). The use of highfrequencies (up to 900 GHz, ~30 cm–1), in conjunctionwith resonant high magnetic fields (up to 25 T) allowsobservation of EPR spectra from such “EPR-silent”systems. This technique, HFEPR,23,24 has been applied toa variety of NiII complexes, as recently reviewedelsewhere.42
A quantitative analysis of the spin Hamiltonian(D and g matrices) parameters for a lower symmetry S= 1 system, such as found in “EPR-silent” 6-coordinatecomplexes of VIII (3d2, t
22) requires a complete ligand-
field treatment with use of the AOM and a d2,8 electronicbasis set.67 Tregenna-Piggot and co-workers havebeautifully demonstrated the application of HFEPR
(and other experimental techniques) in conjunction withligand-field theory (AOM) to [V(H
2O)
6]3+,29,30,33,34 and
to another homoleptic VIII complex, [V(urea)6]3+.37 In
these systems, there are only oxygen donor atoms, andthe spin-orbit contribution from these ligands isnegligible.
An analog to a six-coordinate (idealized Oh symmetry)
VIII complex is a four-coordinate NiII complex (idealizedT
d symmetry). Complexes of general formula Ni(PPh
3)
2X
2
(X = Cl, Br, I) have been studied experimentally byHFEPR and magnetic measurements, as well as earlierelectronic absorption studies, and analyzed by the AOMand a d8 electronic basis set.56 However, this method iseffective only when the ligands are relatively light donoratoms (n ≤ 3, e.g., N, O, F-donors, P, S, Cl-donors). Thus,the AOM analysis was truly successful only in charac-terizing the electronic structure of Ni(PPh
3)
2Cl
2.56, 68 If the
same bonding parameters for the PPh3 ligand derived for
the chloride complex is used in the bromide and iodidecomplexes, along with appropriately scaled parametersfor the halo ligands, then the calculated magnitude of Dfor the bromide complex is too large and for the iodidecomplex is too small.58 More important, the sign of D inthe Br and I complexes is opposite that that for Cl, despitethe close similarity in structural and coordinationchemistry among this series. The discrepancy in ZFS isthe consequence of effects of spin-orbit coupling fromthe ligands, which can be dominant for n ≥ 4 donor atoms(As, Se, Br; Te, I-donors). This effect can counteract thatfrom the metal ion, even to point of reversing the sign ofD, as shown for an MnIII complex with iodo ligands,28
Thus for Ni(PPh3)
2Br
2, spin-orbit coupling from Br is
roughly equivalent to that from Ni so that the effective ζfor Ni (which is not physically meaningful) must be verysmall (and the opposite sign) and for Ni(PPh
3)
2I
2, spin-
orbit coupling from I is dominant over that from Ni sothat the effective ζ for Ni must be very large (and also theopposite sign). A more quantitative model for this effectis in progress.69 Lest the reader be dismayed, we note thatmost paramagnetic ions amenable to study by EPR andanalysis by LFT are first row transition ions that haveonly light donor atoms (2s22pn: N, O, F), where the 3dn
basis set is generally sufficient (except for potentiallyradical ligands such as NO). For donor atoms of the nextperiod (3s2 3pn: P, S, Cl), the 3dn basis set is usuallyadequate, but caution is advised. In such systems, the useof DFT at determining spin distribution is admittedly animportant companion to LFT.
The electronic configuration d3,7 can be considered next.By analogy with the above discussion of VIII and NiII, wecan mention 6-coordinate (idealized O
h symmetry) VII

1509TelserVol. 17, No. 8, 2006
(3d3, t2
3) (rather than the better known ion, CrIII) and4-coordinate (idealized T
d symmetry) CoII (HS 3d7, e4t
23),
each of which has a 4A2 ground state. The complex
[V(H2O)
6]2+ has a small ZFS, presumably arising from
anisotropy in the aqua ligands, as described for other high-spin ions by Tregenna-Piggott.30,32-34 In these cases, a trigonalsplitting results, which for VII as a dopant in corundum(Al
2O
3) gives D = –0.16 cm–1.70 Figure 8 displays EPR
spectra for [V(H2O)
6]2+ at multiple frequencies. It is possible,
even at X-band, to observe the outer, broader, fine structuretransitions (⟨±3/2| ↔ ⟨±1/2|), in addition to the sharp, centraltransition (⟨±1/2| ↔ ⟨+– 1/2|). Assuming that only theperpendicular transitions are observed, the separation ofthe outer peaks (~0.5 T ) gives 2|D| ≈ 0.20 cm-1 spectra forfrozen solution [V(H
2O)
6]2+ as in the oxide lattice.
These spin Hamiltonian parameters can be analyzedby second-order perturbation theory to provide infor-mation on the electronic energy levels as follows:12
gz (g
||) = g
e – 8λ/Δ
0(6a)
gx,y
(g⊥) = ge – 8λ/Δ
1(6b)
D = 4λ2(1/Δ1 – 1/Δ
0) (6c)
where λ = ζ/3 (ζ is the single-electron spin-orbit couplingconstant) and Δ
0,1 are the energy separations between the
orbital singlet ground state (4A2g
(4F) in Oh) and the first
excited state orbital triplet (4T2g
(4F) in Oh).71 These equations
give the result that in octahedral symmetry, Δ1 = Δ
0, and
the g value is isotropic, albeit shifted below ge, and there is
no ZFS (D = 0). However, with tetragonal distortion, Δ1 ≠
Δ0, where Δ
0 is the energy separation between the ground
state (4B1g
in D4h
) and the orbital singlet excited state (4B2g
in D4h
) and Δ1 is the energy separation between this ground
state and the orbital doublet excited state (4Eg in D
4h), both
of which originating in the lowest excited orbital tripletstate (4T
2g). This method does not include coupling to the
next highest orbital triplet excited state (4T1g
(4F) in Oh),
which splits into 4A2g
and 4Eg in D
4h. Nor is coupling to
states arising from free-ion 4P and from spin doubletsincluded. With trigonal distortion, coupling from statesderived from 4T
1g(4F) can be significant and an exact
calculation involving all of the states derived from 4F isminimally necessary. Analysis with use of the complete d3
basis set is better still, as is possible with Ligfield or DDN,which also can be used to provide g values (analogous toequations 5, except here there are four energy levels, labeledin ascending order; in zero field, these eigenvalues areE
1,2 = -[D2 + 3E2]1/2, E
3,4 = [D2 + 3E2]1/2):
gz = –(E
2z + E
3z)/(βH
z); g
z = (E
1z + E
4z)/(βH
z) (7a, a’)
gx = −(E
1x + E
3x)/(βH
x); g
x = (E
2x + E
4x)/(βH
x) (7b, b’)
gy = –(E
1y + E
3y)/(βH
y); g
y = (E
2y + E
4y)/(βH
y) (7c, c’)
Note that for the Kramers S = 3/2 system, as opposedto non-Kramers S = 1, there are two equivalent equationsby which each g value component can be calculated. Aplot of E
i versus field dependence is helpful in assigning
eigenvalues, especially when very high fields areemployed and there can be levels crossings.
Tetrahedral CoII presents a related situation and hasbeen much more extensively studied by EPR due to itsrelevance to biological systems.72,73 Conventional EPRspectra of tetrahedral CoII often exhibit very broad lines,as shown in Figure 9, which is of Co(PPh
3)
2Cl
2 in 2-Me-
THF frozen solution at 35 GHz. These systems often havevery large ZFS, so that they are treated as effective (orficticious) S’ = 1/2 systems. From the resulting effectiveg’ values, it is possible to extract the rhombicity (E/D)74
is often indicated and the intrinsic g values, with use ofthe following equations (here defined so that g
x’ < g
y’):
gx’ = g
x [1 + (1 – 3|E/D|)/(1 + 3(E/D)2)1/2] (8a)
gy’ = g
y [1 + (1 + 3|E/D|)/(1 + 3(E/D)2)1/2] (8b)
gz’ = g
z [–1 + (2)/(1 + 3(E/D)2)1/2] (8c)
Figure 8. Multi-frequency EPR spectra of [V(H2O)
6]2+ (sulfate anion) in
frozen aqueous solution recorded at 9 GHz (at 77 K), 195, 280, 320 GHz(all at 5 K).
1510 A Perspective on Applications of Ligand-Field Analysis J. Braz. Chem. Soc.
For a perfectly axial system, g⊥’ = 2gx,y
≈ 4.0 and g||’ =
2gz ≈ 2.0 results, as expected. Although equations 6 comprise
three equations and four unknowns (E/D and the gcomponents), initial use of g
iso = 2.00 – 2.10 allows rapid
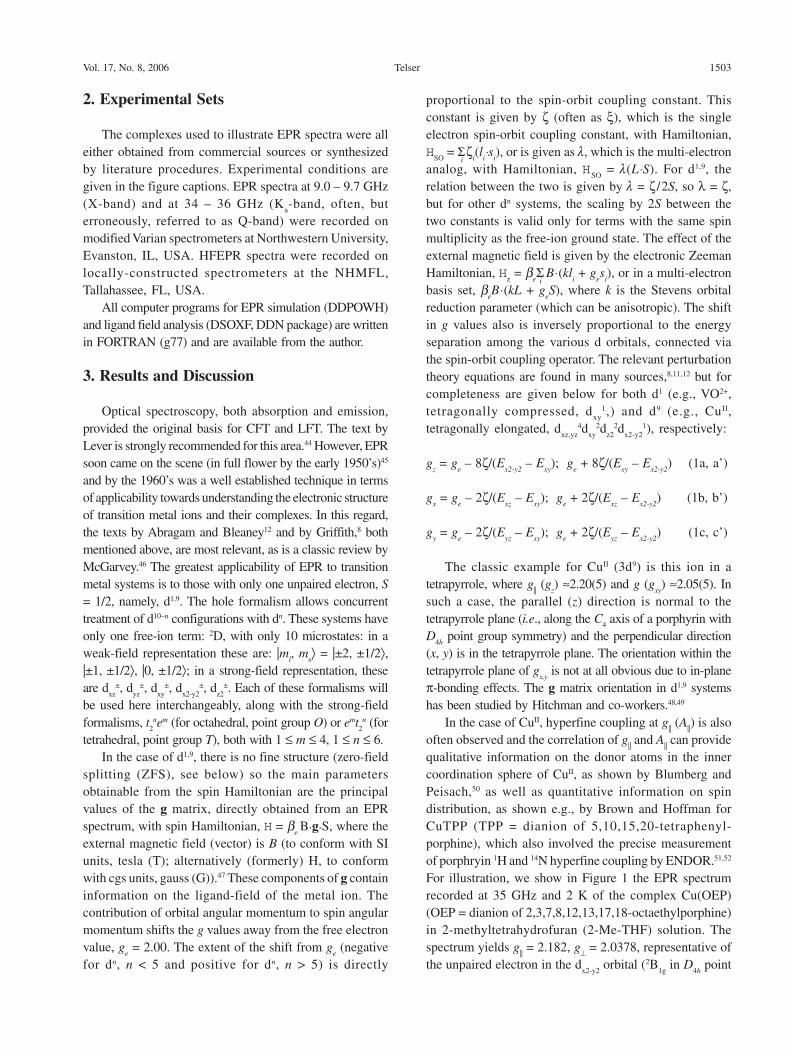
convergence on the appropriate estimate for E/D. This method,however, gives no hint as to the magnitude of D. If magneticallyactive nuclei are suitably hyperfine coupled to the paramagneticcenter, then the magnitude of D can be accurately calculatedfrom the pseudonuclear Zeeman effect,12 as determined byENDOR spectroscopy. An example is the beautiful study byHoffman and co-workers on fluorometmyoglobin,75 in whichthe Larmor (nuclear Zeeman) frequency precisely measuredfor 19F yielded the ZFS of the FeIII ion.76 Absent suitable nuclei,the magnitude of D can be determined by HFEPR or by variabletemperature-variable field magnetic circular dichroism VTVH-MCD.77 In the case of HFEPR, fine structure transitionsbetween the two Kramers doublets (⟨±3/2| ↔ ⟨±1/2|) can bedirectly observed,77 which are at energies much too high forobservation by conventional EPR (often > 10 cm–1).
The author in collaboration with his superb co-workersin Tallahassee and the noted synthetic chemist SwiatoslawTrofimenko, have performed HFEPR studies on a wideseries of trispyrazolylborate complexes of CoII, withgeneral formula TpCoX, where Tp is the monoanionic,N
3 donor “scorpionate” ligand.78 The complexes exhibit
rich electronic absorption and MCD spectra and thecombination of these data and spin Hamiltonianparameters from HFEPR with a ligand-field analysis willprovide a detailed picture of their electronic structure.This analysis is sadly uncompleted at the time of writing.
The next electronic configuration is d4,6, which includessystems studied in the pioneering days, a decade ago, ofthe application of HFEPR to “EPR-silent” systems. Inparticular, a MnIII tris(β-diketonate) complex was thesubject of a complete ligand-field analysis by Barra etal.,79 providing AOM parameters. Many other MnIII
complexes have been studied by HFEPR since then.80-83
The d4 configuration will be illustrated here by CrII.By analogy with the above discussion for d3,
perturbation theory equations are available for d4 (second-order for ZFS parameters; first-order for g values) to relatespin Hamiltonian to electronic energy levels, as follows:12
gz = g
e – 8(λ/Δ)cos2 δ (9a)
gx = g
e – 2(λ/Δ)(cos δ – sin δ)2 (9b)
gy = g
e – 2(λ/Δ)(cos δ + sin δ)2 (9c)
D = –3[(λ2/Δ) + ρ)] cos 2δ (9d)
E = – [(λ2/Δ) + ρ)] sin 2δ; E/D = tan 2δ (9e, e’)
where λ is the spin-orbit coupling parameter of the quintetground term (λ = ζ/4), Δ is the energy separation of theorbital triplet excited state (5T
2g(5D) in O
h) from the orbital
doublet ground state (5Eg(5D) in O
h). These equations do
not explicitly include an axial distortion energy parameter,which removes the orbital degeneracy of 5E
g, to give an
orbital singlet ground state. However, this effect ismodeled by inclusion of the mixing parameter, δ, so thatthis ground state is defined by cos δ|2s⟩ + sin δ|0⟩. Thus,for δ = 0, the ground state is d
xz,yz2d
xy1d
z21 (5B
1g in D
4h) and
for δ = π/2, the ground state is dxz,yz
2dxy
1dx2-y2
1 (5A1g
in D4h
).Concerning the g values, equations 9a - c are similar toEquations 1a - c since for both d4 and d9, there is a hole inthe e set of orbitals (t
23e1 and t
26e1, respectively).
Equations 9 also do not include the effects of spin-orbit coupling to excited triplet states directly. Instead,Equations 9d - e include the effect of spin-spin coupling,
Figure 9. EPR spectrum of Co(PPh3)
2Cl
2 in frozen 2-Me-THF solution
(~2 mmol L-1): experimental numerical derivative (red, upper trace) andits simulation (blue, lower trace). Experimental parameters: temperature,2 K; microwave frequency, 35.367 GHz; microwave power, 2 mW; 100kHz modulation amplitude, 0.4 mT; time constant, 128 ms; scan time, 4min. Simulation parameters: S’ = 1/2; g’ = [5.80, 3.40, 2.15]; Gaussiansingle-crystal linewidths = [4.8, 4.5, 2.0] GHz.
1511TelserVol. 17, No. 8, 2006
given by the parameter, ρ. Spin-spin coupling is a through-space magnetic interaction between electron spins andfor a given 2S+1L term is expressed as:84
HSS
= -ρ[(L · S)2 + ½(L · S) – (1/3)L(L + 1)S(S + 1)] (10)
This spin-spin coupling Hamiltonian, HSS
, can beincluded when a single, multiple-electron, i.e., |L, M
L, S,
MS⟩ basis set, as opposed to a multiple, single-electron,
i.e., ∑|l, ml, s, m
s⟩, basis set is used, for which there is
currently no method for including spin-spin coupling. Theactual amount of true spin-spin coupling in transition metalions is difficult to determine and is usually ignored. Indeed,dating from a statement on p. 330 in Griffith’s book,8 spin-spin coupling has been dismissed as being too small to besignificant (ρ < 0.1 cm–1) and the author has notencountered it in any recent work involving LFT (exceptas mentioned below for CrII). However, the situation hasnow changed. Neese has very recently resurrected spin-spin coupling and modified DFT to include this effectand shown its importance in contributing to ZFS.85 Usingas an example, Mn(acac)
3, Neese showed a contribution
to |D| of ~1 cm–1 from spin-spin coupling and from spin-orbit coupling of ~2 cm–1 (it should be noted theexperimental ZFS was much larger in magnitude, |D| =4.5 cm–1, than any values calculated by DFT, regardlessof effects included). Presumably, the case of HS d4,6 is the“worst” from the point of view of necessitatingconsideration of spin-spin coupling, while d2,8 is the “best”in that it is safest to ignore this aggravating complication.
The |L, ML, S, M
S⟩ basis set was used to analyze HFEPR
data for a classic d4 system, [Cr(H2O)
6]2+, in this case in
frozen aqueous solution.86,87 This work employed theprogram DSOXF, which used only the 5D (L = 2, S = 2)free-ion ground term with multi-electron spin-orbit couplingand electronic Zeeman interaction and a crystal-fieldHamiltonian (operators: O
40, O
44 (tetragonal), O
43 (trigonal),
O20 (axial distortion); parameters: Dq, Ds, Dt7). Use of the
crystal-field parameters determined by electronic absorptionspectroscopy (in cm–1, Dq = 1390, Ds = 1740, Dt = 470)and the free-ion value for spin-orbit coupling (λ = 58 cm–1),yielded a magnitude for D significantly less than observed(–0.77 cm–1 versus –2.20 cm–1, respectively). Thisdiscrepancy results from the failure to include the effectsof spin-orbit coupling to triplet excited states (t
24, 3T
1g in
Oh). These effects can be functionally accounted forinclusion of spin-spin coupling (Equation 10), with ρ = 0.42cm–1, the value reported by Pryce for CrII,84 to yield D =–2.04 cm–1. These effects can also be accounted for byinclusion of an additional term, which depends on the energyseparation between the ground state and the relevant spin
triplet (δ), the additional ZFS is parameterized as D’ = λ2
(–4/δ).57 Far better than this perturbation method is toemploy the later program DDN, with the full, single-electron d4 basis set with free-ion values for single-electronspin-orbit coupling and Racah interelectronic parameters(respectively, ζ = 236 cm–1; B = 810, C = 3565 cm–16) alongwith the above crystal-field parameters to obtain D = -1.97cm–1, a difference of ~10%, which is well within the errorof the assumption involved in the choice of electronicparameters for CrII in this case. The g values can becalculated analogously to equations 5 and 7 as follows,with five energy levels in ascending order (in zero field,these energies are E
1 = –2(D2 + 3E2)1/2, E
2 = –D – 3|E|, E
3 =
–D + 3|E|, E4 = 2D, E
5 = 2(D2 + 3E2)1/2 (D > 0)):
gz = [(E
3z – E
2z)2 – (6E)2]1/2/(2βB
z) (11a)
gx = [(E
4x – E
2x)2 – 9(D + E)2]1/2/(2βB
x) (11b)
gy = [(E
4y – E
2y)2 – 9(D – E)2]1/2/(2βB
y) (11c)
Note that in this more complicated spin system, incontrast to S = 1 and 3/2 (equations 3 and 5, respectively),two of the energy levels (E
1, 5) never give useful
relationships in terms of determining g values. Even moreso than for S = 3/2, for S = 2 it is helpful to plot theeigenvalues as a function of external magnetic field toensure that the correct pairs of energy levels are selected.
The configuration d6 is best represented by theimportant ion FeII and the reader is directed to the recentwork by Tregenna-Piggott and co-workers on this system,88
(and also to their work on CrII 35,36 and MnIII 32) which makeuse of LFT as well a tour de force analysis of the Jahn-Teller effect in such complexes.
The final system to be mentioned briefly is HS d5,exemplified by ions such as MnII and FeIII. Complexes ofthese ions have recently been investigated by HFEPR,including MnII in various coordination complexes89-91 andporphyrinic FeIII.92 Ligand-field analyses were notperformed in these studies, which focused on the detailedEPR experiments. FeIII is of the greatest interest, but inporphyrinic complexes often exhibits large ZFS, due to thehighly tetragonally distorted geometry. In such cases, EPRfrom only the |S, M
S⟩ = |5/2, ±1/2⟩ Kramers doublet is
observed, and the observed g values are gxy
’ (g⊥’) ≈ 6, gz’
(g||’) ≈ 2. This is shown in Figure 10, which presents the 35
GHz EPR spectrum of Fe(TPP)Cl in toluene frozen solution.The information chiefly available from such a spectrum issimply that D >> gβB and that the electronic structure isnearly ideally axial, as expected for the TPP ligand.

1512 A Perspective on Applications of Ligand-Field Analysis J. Braz. Chem. Soc.
If high frequencies are employed, then there is a shiftin g
xy’ due to increased mixing in of excited state Kramers
doublets. This was beautifully shown in a multi-frequency(1 – 285 GHz) EPR study of metmyoglobin (i.e., HS FeIII
in protoporphyrin IX).93 Much more desirable, is the abilityto observe directly transitions among the Kramersdoublets, e.g., |5/2, -1/2⟩ → |5/2, -3/2⟩. Such an observationwas recently made for β-hematin, which is also a HS FeIII
porprhyinic species, by use of frequencies up to 500 GHz.An EPR transition near zero-field directly yielded 2|D| =11.7 cm–1.92 Note also the use of ENDOR spectroscopy todetermine ZFS in HS FeIII heme proteins,75 as mentionedabove.
The application of LFT to HS d5 systems is relativelyuncommon. Notable is the recent work on FeIII in theenzyme superoxide dismutase (SOD).94 Also of interest iswork by Hempel on MnII complexes from thirty years ago,which employed crystal-field parameters,95,96 and the very
detailed and systematic computational study of FeIII (andalso FeII and MnIII) which employed the more flexibleAOM.97 The lack of spin-allowed optical transitions fromthe 6A
(1(g)) (i.e, the totally symmetric representation for the
appropriate point group) ground state of HS d5 and theabsence of first-order spin-orbit coupling in this term meansthat ZFS is often small and g values are close to g
e. Thus
these parameters are difficult to correlate with coordinationenvironment.91 The situation today is conducive to morework of this nature given the number of interesting HS d5
metalloprotein systems (e.g., SOD, and the plethora of hemeproteins), the availability of techniques such as HFEPR toprovide accurate and precise spin Hamiltonian parameters,even for large ZFS,92 and software (e.g., Ligfield) for thenecessary analysis.
As an sample calculation, we can employ the crystal-field parameters estimated for a porphyrin (Dq = 2500, Ds =2500, Dt = 2000 cm–1) combined with Racah and spin-orbitcoupling parameters similar to those given by Bencini etal.97 (B = 900, C = 3600, ζ = 350 cm–1, k = 1). The programDDN with the full d5 basis set gives the effective g values:g’⊥ = 5.98, g’
|| = 2.00, which correspond quite well to those
seen for Fe(TPP)Cl (see Figure 10). The calculated ZFS,D = +3.4 cm–1, is lower in magnitude than is likely the casefor FeIII porphyrins (D ≥ 5 cm–1),92 but the parameters usedhere are a very crude estimate. In contrast to the cases ofrhombic S = 1, 3/2, 2 (equations 5, 7, 11, respectively), theintrinsic g values are not easily calculated for a rhombic S =5/2 system, as the eigenvalues even of the zero-field spinHamiltonian are the very unwieldy roots of cubic equations.However, for an axial system, the zero-field energies aresimply: E
1,2 ≡ 0, E
3,4 = 2D, E
5,6 = 6D (D > 0); alternatively
(1/4)D, (9/4)D, (25/4)D, which is the case for equations 12below. Thus for an axial or only slightly rhombic system,such as found for metalloporphyrins, it is possible to calculatethe intrinsic g values from the field dependence as follows:
gz = (E
2z – E
1z)/(βH
z); g
z = (E
4z – E
3z)/(3βH
x);
gz = (E
6z – E
5z)/(5βH
x) (12a, a’, a”)
gx = -[2(E
1x + E
3x + E
5x) – (35/2)D]/(3βH
x); (12b, b’)
gx = [2(E
2x + E
4x + E
6x) – (35/2)D]/(3βH
x)
Usually for HS d5, the intrinsic g values are very closeto 2.0 and are relatively inconsequential in providingelectronic information.
4. Conclusions
Experimental information on the electronic structure ofparamagnetic transition metal ions is readily available from
Figure 10. EPR spectrum of Fe(TPP)Cl in frozen toluene solution (~1 mmolL-1): experimental (blue traces) and its simulation (red traces). Both therapid-passage (absorption lineshape) and numerical derivative (conven-tional first derivative lineshape) spectra are shown. Experimental param-eters: temperature, 2 K; microwave frequency, 35.382 GHz; microwavepower, 2 mW; 100 kHz modulation amplitude, 0.2 mT; time constant, 128ms; scan time, 4 min. Simulation parameters: S’ = 1/2; g’ = [5.95, 5.95,2.005]; Gaussian single-crystal linewidths = [600, 600, 100] MHz.
1513TelserVol. 17, No. 8, 2006
a wide variety of techniques: optical spectroscopy includingelectronic absorption and emission, magnetic resonanceincluding MCD (a combination of optical and magneticmeasurements), EPR (especially now at high fields andfrequencies), paramagnetic NMR, and other, morespecialized techniques such as INS (limited by access toneutron sources) and Mössbauer effect spectroscopy (limitedby suitable nuclei, notably 57Fe). What can be done to analyzethis potential wealth of information? The latest method is touse DFT, but the older model, LFT, is still useful and hasmany proponents, who are using LFT to make significantinsights into coordination chemistry. DFT is well suited fordescribing the contributions of non-innocent ligands, but stillhas difficulties in quantitatively describing electronic spectraand ZFS. Clearly, one should not “throw out the baby withthe bath water”, but should use both methods in conjunction.Indeed, as the number of unusual example of coordinationchemistry continues to grow, thanks to the efforts ofbiochemists and bioinorganic chemists, as well as to syntheticchemists, the need for straightforward descriptions ofstructure and bonding in such systems that LFT can provideis more important than ever.
Acknowledgments
I would like to thank Prof. Brian M. Hoffman,Northwestern University, for allowing me to play a smallrole in the renaissance of EPR spectroscopy in transitionmetal chemistry that has to a great extent been the resultof his efforts in the area of bioinorganic chemistry. Iwould also like to thank Dr. Peter E. Doan, NorthwesternUniversity, for his help over the years, in particular withthe early stages of developing the program DSOXF. Prof.Bruce R. McGarvey, University of Windsor, Ontario,Canada, has been a constant help to me in areas in whichmy formal education is sorely lacking. Thank to him, Iwas able to make the first steps towards developing theprogram DDN. Dr. Jesper Bendix, Ørsted Institute,University of Copenhagen, Denmark, author of theremarkable program Ligfield, is the person withoutwhose patient assistance the program DDN would neverhave been completed. Lastly, I would like to thank mymany colleagues at the NHMFL, Tallahassee, Florida,in particular Drs. Jurek Krzystek and AndrewOzarowski, who have allowed me to play a small rolein the application of HFEPR to inorganic chemistry. Ialso wish to acknowledge Roosevelt University forfinancial support of this research over the years. Lastly,I thank the SBQ and the organizers of BMIC XIII fortheir superb hospitality and the opportunity to writethis perspective.
Joshua Telser is a Professor atRoosevelt University (ChemistryProgram) in Chicago, USA. HisChemistry background includesNorthwestern University,Evanston-IL as USPHS/NIHPostdoctoral Fellow from 1984to1986. He joint Prof. Brian M.Hoffman as postdoctoral advisorat University of Florida,
Gainesville-FL. He received his Ph.D. in Inorganic Chemistryon December 1984 having as thesis advisor Prof. Russell S.Drago (Deceased) at Cornell University, Ithaca-NY. He hadA.B. in Chemistry (with distinction) on May 1980. He beganhis career as Temporary Research Chemist at PhotonProcesses Group, Amoco Corporation, Naperville-IL from9/86 to 4/88. From 4/88 to 9/90 he was a ResearchInvestigator at Contrast Media Department, Squibb Institutefor Medical Research, New Brunswick-NJ. Then, from 9/90to 9/95 he became Assistant Professor of Chemistry atRoosevelt University, Chicago- IL and from 9/95 at the presentis an Associate Professor of Chemistry in the same University.With a total of around 70 publications, his research interests,in a glance, are Inorganic and Physical Chemistry:Spectroscopic and magnetic properties of transition metalcomplexes; Bioinorganic chemistry and MagneticResonance. He has being invited to seminars andpresentations at conferences and institutions in NorthAmerica, South America, Europe, and Australia. He is amember of ACS and International EPR/ESR Society.
References
1. Bethe, H.; Ann. Phys.-Berlin 1929, 3, 133.
2. In Hungarian his name is Teller Ede; another Hungarian whose
work is important in this area, and did receive the Nobel Prize
(Physics 1963) is Eugene Wigner, Wigner Jenő in Hungarian.
3. Moore, C. E.; Atomic Energy Levels, National Bureau of
Standards: Washington, DC, 1958; vol. III.
4. Condon, E. U.; Shortley, G. H.; The Theory of Atomic Spectra,
Cambridge University Press: Cambridge, UK, 1964.
5. Schäffer, C. E.; Struct. Bond.1968, 5, 68.
6. Figgis, B. N.; Hitchman, M. A.; Ligand Field Theory and its
Applications, Wiley-VCH: New York, 2000.
7. Ballhausen, C. J.; Introduction to Ligand Field Theory,
McGraw-Hill: New York, 1962.
8. Griffith, J. S.; The Theory of Transition-Metal Ions, Cambridge
University Press: Cambridge, UK, 1964.
9. Gerloch, M.; Slade, R. C.; Ligand-Field Parameters, Cambridge
University Press: Cambridge, UK, 1973.

1514 A Perspective on Applications of Ligand-Field Analysis J. Braz. Chem. Soc.
10. Cotton, F. A.; Chemical Applications of Group Theory, 3rd ed.,
Wiley-Interscience: New York, 1990.
11. Drago, R. S.; Physical Methods for Chemists, 2nd ed., Saunders
College Publishing: Ft. Worth, 1992.
12. Abragam, A.; Bleaney, B.; Electron Paramagnetic Resonance
of Transition Ions, Dover Publications: New York, 1986.
13. Weltner Jr., W.; Magnetic Atoms and Molecules, Dover
Publications: New York, 1983.
14. Pilbrow, J. R.; Transition Ion Electron Paramagnetic
Resonance, Clarendon Press: Oxford, 1990.
15. Weil, J. A.; Bolton, J. R.; Wertz, J. E.; Electron Paramagnetic
Resonance: Elementary Theory and Practical Applications,
Wiley: New York, 1994.
16. Gordy, W.; Theory and Applications of Electron Spin
Resonance, Wiley: New York, 1980.
17. Sinnecker, S.; Slep, L. D.; Bill, E.; Neese, F.; Inorg. Chem.
2005, 44, 2245.
18. Sinnecker, S.; Rajendran, A.; Klamt, A.; Diedenhofen, M.;
Neese, F.; J. Phys. Chem. A 2006, 110, 2235.
19. Neese, F.; ORCA, version 2.4.41; MPI Mülheim, Germany,
2005. See the URL: http://ewww.mpi-muelheim.mpg.de/bac/
logins/downloads_en.php
20. Green, M. T.; J. Am. Chem. Soc. 2006, 128, 1902.
21. Jackson, T. A.; Brunold, T. C.; Acc. Chem. Res. 2004, 37, 461.
22. Ghosh, A.; Acc. Chem. Res. 2005, 38, 943.
23. Gatteschi, D.; Sorace, L.; Sessoli, R.; Barra, A.-L.; Appl. Magn.
Reson. 2001, 21, 299.
24. Barra, A.-L.; Brunel, L.-C.; Gatteschi, D.; Pardi, L.; Sessoli,
R.; Acc. Chem. Res. 1998, 31, 460.
25. Bendix, J.; Steenberg, P.; Sotofte, I.; Inorg. Chem. 2003, 42,
4510.
26. Anthon, C.; Bendix, J.; Schäffer, C. E.; Inorg. Chem. 2003, 42,
4088.
27. Anthon, C.; Bendix, J.; Schäffer, C. E.; Inorg. Chem. 2004, 43,
7882.
28. Mossin, S.; Weihe, H.; Barra, A.-L.; J. Am. Chem. Soc. 2002,
124, 8764.
29. Tregenna-Piggott, P. L. W.; Weihe, H.; Bendix, J.; Barra, A.-
L.; Güdel, H.-U.; Inorg. Chem. 1999, 38, 5928.
30. Tregenna-Piggott, P. L. W.; Best, S. P.; Güdel, H.-U.; Weihe,
H.; Wilson, C. C.; J. Solid State Chem. 1999, 145, 460.
31. Basler, R.; Tregenna-Piggott, P. L. W.; Andres, H.; Dobe, C.;
Güdel, H.-U.; Janssen, S.; McIntyre, G. J.; J. Am. Chem. Soc.
2001, 123, 3377.
32. Tregenna-Piggott, P. L. W.; Weihe, H.; Barra, A.-L.; Inorg.
Chem. 2003, 42, 8504.
33. Tregenna-Piggott, P. L. W.; Carver, G.; Inorg. Chem. 2004, 43,
8061.
34. Tregenna-Piggott, P. L. W.; Spichiger, D.; Carver, G.; Frey, B.;
Meier, R.; Weihe, H.; Cowan, J. A.; McIntyre, G. J.; Zahn, G.;
Barra, A.-L.; Inorg. Chem. 2004, 43, 8049.
35. Dobe, C.; Noble, C.; Carver, G.; Tregenna-Piggott, P. L. W.;
McIntyre, G. J.; Barra, A.-L.; Neels, A.; Janssen, S.; Juranyi,
F.; J. Am. Chem. Soc. 2004, 126, 16639.
36. Dobe, C.; Strassle, T.; Juranyi, F.; Tregenna-Piggott, P. L. W.;
Inorg. Chem. 2006, 45, 5066.
37. Beaulac, R.; Tregenna-Piggott, P. L. W.; Barra, A. L.; Weihe,
H.; Luneau, D.; Reber, C.; Inorg. Chem. 2006, 45, 3399.
38. Neese, F.; J. Biol. Inorg. Chem. 2006, 11, 702.
39. Ghosh, A.; J. Biol. Inorg. Chem. 2006, 11, 712.
40. Siegbahn, P. E. M.; J. Biol. Inorg. Chem. 2006, 11, 695.
41. Noodleman, L.; Han, W.-G.; J. Biol. Inorg. Chem. 2006, 11, 674.
42. Krzystek, J.; Ozarowski, A.; Telser, J.; Coord. Chem. Rev. 2006,
250, 2308.
43. Hoffman, B. M.; Acc. Chem. Res. 2003, 36, 522.
44. Lever, A. B. P.; Inorganic Electronic Spectroscopy, 2nd ed.;
Elsevier: Amsterdam, 1984.
45. The discovery of NMR by Felix Bloch and co-workers and
Edward M. Purcell in 1946 was recognized by the Nobel Prize
in Physics in 1952, however, no such recognition for the
discovery of EPR in 1944 by E. Zavoisky in Kazan, USSR was
ever made.
46. McGarvey, B. R.; Transition Metal Chem., Ser. Advan. 1966,
3, 89.
47. The subscript “e” is added to the Bohr magneton, βe = 9.274 ×
10–24 J/T, to distinguish it clearly from the nuclear magneton,
βN = 5.051 × 10⁻²⁷ J/T.
48. Hitchman, M. A.; Olson, C. D.; Belford, R. L.; J. Chem. Phys.
1969, 50, 1195.
49. Hitchman, M. A.; J. Chem. Soc. (A) 1970, 1970, 4.
50. Blumberg, W.; Peisach, J.; Arch. Biochem. Biophys. 1974, 162,
502.
51. Brown, T. G.; Hoffman, B. M.; Mol. Phys. 1980, 39, 1073.
52. See also Abragam and Bleaney,12 Table 7.22 for equations
analogous to 1, including those for hyperfine coupling.
53. Bendix, J.; Brorson, M.; Schäffer, C. E.; Inorg. Chem. 1993,
32, 2838.
54. Adamsky, H.; AOMX, Heinrich-Heine-Universität: Düsseldorf,
Germany, 1994. See the URL: http://www.aomx.de/docs/html/
aomxeh.html.
55. Gerloch, M.; CAMMAG; University of Cambridge: Cambridge,
U.K., 1991.
56. Krzystek, J.; Park, J.-H.; Meisel, M. W.; Hitchman, M. A.;
Stratemeier, H.; Brunel, L.-C.; Telser, J.; Inorg. Chem. 2002,
41, 4478.
57. Krzystek, J.; Telser, J.; Pardi, L. A.; Goldberg, D. P.; Hoffman,
B. M.; Brunel, L.-C.; Inorg. Chem. 1999, 38, 6121.
58. This calculation employed k = 1, but ζ was reduced in
magnitude from the free-ion value, -830 cm-1, due to the
strongly covalent tetrapyrrole ligand.
59. Van Doorslaer, S.; Bachmann, R.; Schweiger, A.; J. Phys. Chem.
A 1999, 103, 5446.
1515TelserVol. 17, No. 8, 2006
60. Van Doorslaer, S.; Jeschke, G.; Epel, B.; Goldfarb, D.; Eichel,
R.-A.; Kräutler, B.; Schweiger, A.; J. Am. Chem. Soc. 2003,
125, 5915.
61. Ligand-based oxidation precludes formation of authentic NiIII
complexes with unsaturated N4 donor sets, such as
tetrapyrroles, in many cases.
62. Rodriguez-Bailey, V. M.; LaChance-Galang, K. J.; Doan, P.
E.; Clarke, M. J.; Inorg. Chem. 1997, 36, 1873.
63. Albores, P.; Slep, L. D.; Baraldo, L. M.; Baggio, R.; Garland,
M. T.; Rentschler, E.; Inorg. Chem. 2006, 45, 2361.
64. McGarvey, B. R.; Coord. Chem. Rev. 1998, 170, 75.
65. McGarvey, B. R.; Quim. Nova 1998, 21, 206.
66. Boca, R.; Coord. Chem. Rev. 2004, 248, 757.
67. Krzystek, J.; Fiedler, A. T.; Sokol, J. J.; Ozarowski, A.; Zvyagin,
S. A.; Brunold, T. C.; Long, J. R.; Brunel, L.-C.; Telser, J.;
Inorg. Chem. 2004, 43, 5645.
68. A re-evaluation here of the earlier analysis56 for [Ni(PPh3)
2Cl
2]
gives the following consensus fit parameters to optical and
HFEPR data (all values in cm-1): εσ(Cl) = 4700(200), επ(Cl) =
2600(100), εσ(P) = 5600(100), επ(P) = -1300(100), B = 520(5),
(C = 4.7B), ζ = 455(5); 72% of the free-ion value. These
parameters match electronic absorption bands for Ni(PPh3)
2Cl
2
to within ~100 cm-1 and D within 0.1 cm-1, with the correct
(positive) sign. For [Ni(PPh3)
2Br
2] and [Ni(PPh
3)
2I
2], the same
parameters as for the chloride are used, except that the relevant
structural data were used along with εσ(Br) = 4200, επ(Br) =
2000 or εσ(I) = 3000, επ(I) = 1000, respectively. If ζ in the
range 400 – 500 cm-1 is used in these two cases, as would be
reasonable, then the calculated |D| for the bromide is too large
and for the iodide is too small. To obtain the correct magnitude,
values of ζ = 280 (44% of the free-ion value) and 630 cm-1
(100%) are needed for the Br and I complex, respectively, but
give the opposite sign of D in both cases (calculated to be
positive as with the Cl complex, but experimentally negative).
69. B. R. McGarvey, personal communication.
70. Laurance, N.; Lambe, J.; Phys. Rev. 1963, 132, 1029.
71. In Abragam and Bleaney,12 these terms are referred to by the Γnotation, which was originally used by Bethe. It is more
enlightening to give the group theory designations (A, B, E, T
(or F)), which are due originally to Robert S. Mulliken.
72. Bencini, A.; Bertini, I.; Canti, G.; Gatteschi, D.; Luchinat, C.;
J. Inorg. Biochem. 1981, 14, 81.
73. Bertini, I.; Luchinat, C.; Piccioli, M.; Methods in Enzymology
2001, 339, 314.
74. The symbol λ is often used to indicate the rhombicity, |E/D|,
however, this can cause confusion with the multi-electron spin-
orbit coupling constant, and is avoided here.
75. Fann, Y.-C.; Ong, J.-L.; Nocek, J. M.; Hoffman, B. M.; J. Am.
Chem. Soc. 1995, 117, 6109.
76. Metmyoglobin has S = 5/2, but there is little mixing of the
highest Kramers doublet, MS = ±5/2, so the case is equivalent
to S = 3/2.
77. Krzystek, J.; Zvyagin, S. A.; Ozarowski, A.; Fiedler, A. T.;
Brunold, T. C.; Telser, J.; J. Am. Chem. Soc. 2004, 126, 2148.
78. Trofimenko, S.; Polyhedron 2004, 23, 197.
79. Barra, A.-L.; Gatteschi, D.; Sessoli, R.; Abbati, G. L.; Cornia,
A.; Fabretti, A. C.; Uytterhoeven, M. G.; Angew. Chem., Int.
Ed. 1997, 36, 2329.
80. Krzystek, J.; Telser, J.; J. Magn. Reson. 2003, 162, 454.
81. Krzystek, J.; Telser, J.; Knapp, M. J.; Hendrickson, D. N.;
Aromí, G.; Christou, G.; Angerhofer, A.; Brunel, L.-C.; Appl.
Magn. Reson. 2001, 23, 571.
82. Limburg, J.; Vrettos, J. S.; Crabtree, R. H.; Brudvig, G. W.; de
Paula, J. C.; Hassan, A.; Barra, A.-L.; Duboc-Toia, C.; Collomb,
M.-N.; Inorg. Chem. 2001, 40, 1698.
83. Mantel, C.; Hassan, A. K.; Pécaut, J.; Deronzier, A.; Collomb,
M.-N.; Duboc-Toia, C.; J. Am. Chem. Soc. 2003, 125, 12337.
84. Pryce, M. H. L.; Phys. Rev. 1950, 80, 1107.
85. Neese, F.; J. Am. Chem. Soc. 2006, 128, 10213.
86. Telser, J.; Pardi, L. A.; Krzystek, J.; Brunel, L.-C.; Inorg. Chem.
1998, 37, 5769.
87. Telser, J.; Pardi, L. A.; Krzystek, J.; Brunel, L.-C.; Inorg. Chem.
2000, 39, 1834.
88. Carver, G.; Dobe, C.; Jensen, T. B.; Tregenna-Piggott, P. L. W.;
Janssen, S.; Bill, E.; McIntyre, G. J.; Barra, A.-L.; Inorg. Chem.
2006, 45, 4695.
89. Lynch, W. B.; Boorse, R. S.; Freed, J. H.; J. Am. Chem. Soc.
1993, 115, 10909.
90. Wood, R. M.; Stucker, D. M.; Jones, L. M.; Lynch, W. B.; Misra,
S. K.; Freed, J. H.; Inorg. Chem. 1999, 38, 5384.
91. Mantel, C.; Baffert, C.; Romero, I.; Deronzier, A.; Pécaut, J.;
Collomb, M.-N.; Duboc, C.; Inorg. Chem. 2004, 43, 6455.
92. Sienkiewicz, A.; Krzystek, J.; Vileno, B.; Chatain, G.; Kosar,
A. J.; Bohle, D. S.; Forro, L.; J. Am. Chem. Soc. 2006, 128,
4534.
93. van Kan, P. J. M.; van der Horst, E.; Reijerse, E. J.; van Bentum,
P. J. M.; Hagen, W. R.; J. Chem. Soc., Faraday Trans. 1998,
94, 2975.
94. Renault, J. P.; Verchere-Beaur, C.; Morgenstern-Badarau, I.;
Yamakura, F.; Gerloch, M.; Inorg. Chem. 2000, 39, 2666.
95. Hempel, J. C.; J. Chem. Phys. 1976, 64, 4307.
96. Hempel, J. C.; Palmer, R. A.; Yang, M. C.-L.; J. Chem. Phys.
1976, 64, 4314.
97. Bencini, A.; Ciofini, I.; Uytterhoeven, M. G.; Inorg. Chim. Acta
1998, 274, 90.
Received: June 28, 2006
Published on the web: November 10, 2006


