Review Fruits and Vegetables Intake and Determinants
43
Transcript of Review Fruits and Vegetables Intake and Determinants


2
Aafke Nijhuis, MSc
Inge D. Brouwer, PhD
Fruits and Vegetables Consumption in Low- and Middle-Income Countries. A
comprehensive review of fruits and vegetables intake and determinants using a food
systems approach
April 2020
Division of Human Nutrition and Health, Wageningen University & Research
Wageningen, The Netherlands

3
Contents List of tables ............................................................................................................................. 4
List of figures ............................................................................................................................ 4
List of abbreviations ................................................................................................................... 5
Summary.................................................................................................................................. 6
Acknowledgements .................................................................................................................... 6
1. Introduction .......................................................................................................................... 7
2. Objective .............................................................................................................................. 8
3. Health and nutrition aspects of fruits and vegetables ................................................................... 9
3.1 Healthy components ........................................................................................................... 9
3.2 Unhealthy components ..................................................................................................... 10
3.3 Diversity ......................................................................................................................... 10
3.4 Safety ............................................................................................................................ 11
3.5 Associated disease and risk ............................................................................................... 11
4. Recommendations worldwide and in LMIC ................................................................................ 13
5. Current consumption patterns worldwide and in LMIC ................................................................ 20
5.1 Quantity ......................................................................................................................... 20
5.2 Quality, diversity, safety ................................................................................................... 22
5.3 Dietary data availability and limitations ............................................................................... 22
6. Determinants of fruits and vegetables consumption in the food system worldwide and in LMIC ........ 24
6.1 Food value chains ............................................................................................................ 24
6.2 Food environment and consumer behaviour ......................................................................... 27
7. Sustainability ....................................................................................................................... 32
8. Implementation and research gaps related to fruits and vegetables consumption worldwide and in
LMIC ...................................................................................................................................... 35
References .............................................................................................................................. 38

4
List of tables Table 1. Recommendations for fruits and vegetables consumption
Table 2. Examples of quantification of recommendation in literature
Table 3. FBDG key messages about fruits and vegetables conveyed by more than 5 countries
List of figures Figure 1. Conceptual framework of food systems for diets and nutrition
Figure 2. Percentage of population meeting WHO fruits and vegetables consumption recommendations,
Figure 3. Prevalence of daily fruits, vegetables and soda intake among school-age children and
adolescents.
Figure 4. Range of reported food loss and waste percentages for fruits and vegetables by supply chain
stage, 2000-2017
Figure 5. Countries ratios of fruits and vegetables availability to WHO minimum recommendation
(400g)
Figure 6. The ANH-FEWG food environment conceptual framework
Figure 7. Fresh fruits and vegetables market share of modern and traditional FVC (Food Value Chain)
retail sales
Figure 8. Environmental effects per serving of food produced
Figure 9. Evolution of exports and imports in real value (1 million USD) by crop category and subregion
over the period 1997-2016
Figure 10. (A) Absolute environmental impacts of average diets for different national income groups per
person. (B) Differences in environmental impacts between average and recommended diets
per person.

5
List of abbreviations ANH Academy Agriculture, Nutrition, and Health Academy
CFS Committee on World Food Security
CHD Coronary heart disease
CVD Cardiovascular disease
DALY Disability-adjusted life year
FAO Food and Agriculture Organisation of the United Nations
FPI Food price index
FV Fruits and vegetables
FBS Food balance sheet
GDD Global dietary database
GDP Gross domestic product
GHG Greenhouse gas
HCES Household Consumption Expenditure Survey
HIC High-income countries
HLPE High Level Panel of Experts on Food Security and Nutrition
INDDEX International Dietary Data Expansion project
IYCF Infant and Young Child Feeding
LMIC Low- and middle-income countries
NCD Non-communicable diseases
NFCS National Food Consumption Survey
WHO World Health Organization

6
Summary Present food systems are not able to provide the foods everyone needs to live a healthy and productive
life, reflected in the too-slowly reducing levels of stunting; the stubbornly high prevalence of
micronutrient deficiencies; and the fast-rising levels of overnutrition and obesity, and diet-related non-
communicable diseases. Low-quality diets are the number one cause of mortality and morbidity
worldwide and the public health burden is particularly high in low- and middle-income countries (LMIC).
The importance of fruits and vegetables (FV) for health has long been recognized, but overall
consumption of fruits and vegetables is below recommended levels.
To understand why this is so, this report investigates the consumption of FV worldwide and especially in
LMIC, using a food systems lens. Guided by the High Level Panel of Experts (HLPE) framework of food
systems and healthy diets, a comprehensive literature review was carried out on the drivers, food system
components and food system outcomes related to FV consumption.
The report starts with a comprehensive review of the known health effects and potential risks of FV
consumption, followed by an overview of recommendations on amounts of FV to be eaten as reflected in
different global guidelines. Specific attention is given to reviewing often relatively non-specific messages
on FV in national food-based dietary guidelines (FBDG) for the limited number of LMIC which have them.
In addition, the report reviews the extent to which people adhere to the recommendations, addressing
the low intake of FV worldwide and especially in LMIC determined by factors related to age, gender,
income, socio-economic status and education, although consumption data are not widely available. Next,
this report addresses the different food system components to understand the bottlenecks in food
systems that need to be addressed to improve intake of FV. These cover the supply of FV in different
regions, the effect of seasonality, and the impact of losses and waste. Results indicate that globally, FV
supply is sufficient for adequate consumption, but not in numerous low-income countries in Asia, the
Pacific and sub-Saharan Africa. The food environment connects the supply with the consumer, and this
report reviews where consumers purchase their FV, primarily still at market-based vendors even where
supermarket penetration is rising. This report also looks into the effects of (seasonal) fluctuation of
prices of FV, with highest impact in LMIC where FV are among the first categories to be dropped from the
diet when prices rise. Economic access to FV is low as a large proportion of the population in low-income
countries cannot afford the recommended five servings of FV per day. Very little is known about factors
that affect accessibility, such as physical distance, mode of transport, time to reach points of sale, the
role of convenience, and information on the importance of FV given in the food environment. Even less is
known about consumer choices and motives, and how beliefs, knowledge and taboos, and food safety
concerns influence consumption of FV in LMIC. Lastly, this report pays attention to the environmental
sustainability impact an increase in FV intake as recommended in guidelines might have in terms of
greenhouse gas emissions, eutrophication and land use for most LMIC.
The report ends with highlighting key research gaps and challenges that need to be addressed to further
the agenda on improving FV intake for health in a sustainable and inclusive way. An annotated
bibliography is given at the end of the report.
Acknowledgements This report is written in the framework of the CGIAR Research Program on Agriculture for Nutrition and
Health (A4NH), and especially for the research flagship Food Systems for Healthier Diets. The support of
Janet Hodur, A4NH, in editing the report to its final stage is highly acknowledged. Also, the support of
Giulia Pastori and Elise Talsma from the Division of Human Nutrition and Health, Wageningen University,
by sharing their experience and knowledge is highly appreciated.

7
1. Introduction Food systems should deliver the food everyone needs to live a healthy and productive life. Yet diet-
related factors have become the number one cause of mortality and morbidity worldwide (Forouzanfar et
al., 2016). The public health burden is particularly high in low-and middle-income countries (LMIC), as
we observe malnutrition in all its forms, including undernutrition, micronutrient deficiencies and
overweight/obesity, which increasingly occur side by side (Pinstrup-Andersen, 2007) in the same
country, community, household, or even individual. Micronutrient deficiencies are among the most
pervasive forms of malnutrition, affecting about two billion people worldwide (WHO, WFP and UNICEF,
2007). Women and children are particularly vulnerable to micronutrient deficiencies and undernutrition
due to higher growth and physiology requirements. However, global trends toward more sedentary
lifestyles and a shift from traditional diets toward a more energy-dense and monotonous diet, known as
the nutrition transition (Popkin, Adair and Ng, 2012a; Khoury et al., 2014), contribute to a growing
burden of largely preventable diet-related non-communicable diseases (NCDs) (Bennett et al., 2018).
A strategy to address micronutrient deficiencies is increased consumption of fruits and vegetables (FV)
(WHO/FAO, 2003a; WHO, 2009). In addition to critical micronutrients, FV provide other health benefits
through intake of phytochemicals and fibre (Mozaffarian, 2016). These properties can help prevent
development of diet-related NCDs. The importance of FV in the diet has long been recognised. This
report investigates consumption of FV, worldwide and especially in LMIC, using a food systems lens as
shown in Figure 1 (De Brauw et al., 2019), based on the Committee on World Food Security’s (CFS) High
Level Panel of Experts on Food Security and Nutrition (HLPE) framework (HLPE, 2017). The HLPE
framework structures food systems into three key dimensions: (1) external drivers that influence the
global food system performance, (2) core food system components that shape the interactions
between food supply and demand, and (3) food system outcomes that indicate how safe, healthy,
sustainable and affordable diets can be reinforced and sustained.
Figure 1. Conceptual framework of food systems for diets and nutrition (De Brauw et al., 2019),
based on the HLPE framework (HLPE, 2017).
Different definitions of FV can be observed. While botanically some vegetables may be considered fruits,
we follow the Food and Agriculture Organization of the United Nations (FAO) definition, which excludes
roots and tubers (potatoes, cassava etc.), legumes, and nuts (WHO/FAO, 2003b).

8
2. Objective The objective of this literature review is to review and analyze current research on FV consumption
worldwide, with a focus on LMIC, using a food systems perspective.
Sub-objectives
1. To review health and nutrition outcomes of FV consumption
2. To review recommendations on FV consumption
3. To review current consumption patterns worldwide, and particularly in LMIC
4. To review food system determinants of FV consumption worldwide and in LMIC
5. To review sustainability of FV in the diet worldwide and in LMIC
6. To identify research gaps related to FV consumption worldwide and in LMIC (on basis of the above)

9
3. Health and nutrition aspects of fruits and vegetables
3.1 Healthy components Fruits and vegetables are nutritional powerhouses: they are rich in micronutrients, fibre and
phytochemicals, and have a low energy content.
Micronutrients
Micronutrients play an important role in the functioning of the human body. Essential micronutrients are
those that cannot be produced by the human body and thus must be ingested through food, with the
exception for vitamin D, which is mainly produced in the body through exposure to the sun.
Micronutrients are categorized as vitamins or minerals, and both are present in FV. It is important to
note that the bioavailability of micronutrients can be influenced by anti-nutrients or interactions with
other micronutrients. Several micronutrients have received attention globally because their intake
remains problematic and adequacy is most difficult to secure without a diverse diet. These include iron,
zinc, vitamin A, folate, and iodine (Development initiatives, 2018).
Vitamin A is delivered through B-carotene as a precursor in orange and yellow FV, as well as green leafy
vegetables. Although vitamin A is also present in animal source foods in the form of the higher-
bioavailable retinol, FV are a particularly important source of vitamin A in LMIC where animal source
foods are not consumed in high quantities. This also holds true for iron: meat is a rich source, but as
consumption is low, dietary iron sources are mostly plant-based, including FV but also cereals and
legumes. Micronutrients also interact with one another in important ways. For example, vitamin C
enables the body to increase iron absorption from plant-based foods by two to three times (Teucher,
Olivares and Cori, 2004). The combined consumption of FV with iron-rich foods can enhance iron status,
as FV are the main source of vitamin C in most diets and iron absorption is especially low in plant-based
diets.
It is important to consider the contribution to micronutrient intake from FV in the local context. The
contribution might be dependent on other sources such as supplementation and fortified products.
Fibre
Fibre is an important component of the diet, aiding digestion. Fibre is found in plant foods, including FV.
A diet low in fibre has been identified as a risk factor for various NCDs and mortality (Liu, Wang and Liu,
2015). Of the global population, 13.8 and 15.0 percent of men and women, respectively, were at risk for
a low-fibre diet in 2015 (Forouzanfar et al., 2016). As the nutrition transition causes a shift away from
whole foods to refined (Popkin, Adair and Ng, 2012b), fibre intake in LMIC might be decreasing. Fruits
and vegetables can play an important role in contributing to the fibre intake, especially in areas were the
nutrition transition is happening. Even though fibre is considered an important nutrient, global and LMIC
data on fibre consumption and the contribution of FV to it are missing.
Phytochemicals
Phytochemicals, also called bioactive compounds, are present in FV. In the strictest sense,
phytochemicals are defined by plant scientists as chemicals produced by plants. However, the term is
generally used by both human nutrition science and plant science to describe chemicals from plants that
may affect human health and wellbeing but are not essential nutrients.
As there are no known effects or symptoms as a consequence of their deficiency, no target intake levels
have been determined (Van Breda and De Kok, 2018).
Even though there are no recommendations, the role of phytochemicals in health is recognised. Much of
the preventive effect of FV on disease is thought to be provided by their complex mixture of
phytochemicals, including the well-documented preventive activities of antioxidants (Rodriguez-Casado,
2016; Van Breda and De Kok, 2018).

10
Processing
Processing FV may decrease their nutritional value by removing fibre and key nutrients (Mozaffarian,
2016), and preparation methods can have significant effects on nutrient content, particularly in LMIC,
where these foods are more likely to be eaten cooked. Vitamins are not heat-resistant and (partly)
degrade after prolonged heating. While minerals are more heat-resistant, they can still leak into cooking
water. Peeling fruits or vegetables will lower the fibre content. Data on cooking and processing habits
and the consequences on the quality of FV in LMIC is lacking and needs further investigation.
3.2 Unhealthy components Although FV are generally a healthy contribution to the diet, some adverse aspects have been reported.
Preservation methods
An association between consumption of canned fruits and an increased risk for cardiovascular disease
(CVD)-related and all-cause mortalities has been found in one study (Aasheim et al., 2015), although the
mechanism of this association is not yet understood. Kim and colleagues report an increased risk for
stomach cancer related to consumption of pickled vegetables (Kim et al., 2010).
Fruit juice
Fruit juice is not included in most food-based dietary guidelines because of its high sugar content and
thus the risk it will contribute to overconsuming sugar and calories. This includes not only juices with
added sugar, but also 100 percent fruit juices because they usually have had fibre removed.
3.3 Diversity
Different species/varieties
Different species of FV provide different nutrients. Nutrient densities are different per species, and even
within species of FV, depending on soil and other growth circumstances (de Valença and Bake, 2016).
While green leafy vegetables and orange-coloured FV are generally high in B-carotene, citrus fruits are
generally high in vitamin C, while berries are known for their antioxidant properties. The vitamin,
mineral, and fibre content for most FV is documented and described in food composition tables. This is,
however, not the case for all phytochemicals, they are hardly included in food composition tables.
Subcategories of FV may have different associations with health outcomes (Yip, Chan and Fielding,
2019). In most epidemiological studies, fruits are seen as one group, as are vegetables, with no
additional subcategories defined. In studies that do subclassify, we see that a higher consumption of
citrus fruits, green leafy vegetables, and B-carotene– and vitamin C–rich FV is associated with a lower
coronary heart disease (CHD) risk (Bhupathiraju et al., 2013). Variety in and of itself, however, was not
associated with CHD (Bhupathiraju et al., 2013). A similar finding from Oude Griep et al. shows,
independent of quantity, variety in FV was related neither to incident CHD nor to incident stroke (Oude
Griep et al., 2012).
Fruits are mostly consumed raw and vegetables mostly cooked. Treatment impacts nutrient retention
and thus health outcomes. Though certain FV might have a comparable nutrient density in the raw form,
cooking will decrease the vegetables’ nutrient content.
Underutilised species
Fruits and vegetables are food groups that contain rich reservoirs of genetic diversity (Jamnadass et al.,
2011), however knowledge on these have been limited as focus has been given to the most
remunerative species such as tomato, onions, peppers, eggplants, okra, watermelon, cabbage and
carrots (Grubben et al., 2014). Specifically, very little is known about the so-called orphan, traditional
varieties, and wild edible species of vegetables and fruits that are mainly maintained by custodian
farmers exclusively for home consumption or for informal trade (Borelli et al., 2020). Availability of these
species are often limited to the specific geographical area where they are found. These often neglected
and underutilized species are marginalized, if not entirely ignored (Padulosi, Thompson and Rudebjer,
2013). However, these species are often referred to as having superior nutrient content (Hunter et al.,
2019). The nutrient content differences among varieties of the same species can be greater than the

11
differences between species, but most research left this varietal level largely unexplored. Food
composition data have largely been limited to an aggregate level, and miss information on significant
compositional differences related to agro-ecological zone, seasonality and genetic diversity (Hunter et al.,
2019), also because the costs of nutritional analysis is high. The contribution of these underutilized and
neglected species to nutrient intake are therefore difficult to assess, and most of these species are not
taken into consideration in national food-based dietary guidelines. Underutilised local species of FV need
further nutritional analysis and attention as they can be rich sources of nutrients.
3.4 Safety
Even though it is hard to think of foods that are more nutritious than FV, adverse health effects have
been reported and can be a reason for consumers to limit their consumption. Although most consumers
worry about contamination through the use of pesticides, insecticides etc., most of the burden of
foodborne disease in LMIC comes from biological hazards and is the result of consumption of fresh
perishable foods such as fruits, vegetables and meat (Grace, 2015), The food safety aspects of FV will be
further explored in this section.
Microbial contamination/Parasites
Contamination of FV in the value chain occurs via various routes, including use of unclean water and
direct contamination through livestock (Schreinemachers, Simmons and Wopereis, 2018). While the
magnitude of foodborne disease caused by FV in LMIC is not fully known, nearly half of foodborne
illnesses in the United States are caused by germs on fresh produce (CDC, no date). One study in
Hyderabad, India, estimates that 29 percent of foodborne diseases come from FV (Sudershan et al.,
2014). Microbial pathogens may cause a burden of 18 million Disability-Adjusted Life Years (DALYs) each
year in LMIC, with foodborne parasites at least the same (Grace, 2015). While the proportion of this
burden caused by consumption of FV is unknown, the contribution is thought to be considerable based on
case studies from the US and Hyderabad (CDC, no date; Sudershan et al., 2014).
Chemicals: Pesticides/herbicides
Pesticide use is common in FV farming. Farmers in some areas, including Southeast Asia, have been
reported to spray excessively (Schreinemachers et al., 2020). The use of pesticides is greater on high-
value crops like vegetables than on low-value crops (not serving as cash-crops), as farmers tend to
spray to protect their investment (Schreinemachers, Simmons and Wopereis, 2018).
Farm workers are especially at risk for short- and long-term health consequences, as they are exposed
excessively and directly. Pesticides cause direct adverse toxic effects like vomiting following high-dose
acute exposure (Bonner and Alavanja, 2017). Epidemiological evidence suggests a relation between
occupational pesticide exposure and different types of cancer (Bonner and Alavanja, 2017).
Consumer risk of exposure is less known, as regulatory monitoring systems in LMIC are limited,
especially for domestic non-export crops. This uncertainty can cause consumers to distrust the safety of
FV, thus limiting their choices and impacting consumption (see paragraph 6.2).
3.5 Associated disease and risk
Although intake of FV has been inversely associated with all kinds of disease, from asthma to cognitive
impairment (Wallace et al., 2019), we focus on diet-related NCDs, obesity, and micronutrient deficiencies
here.
NCDs
Recent evidence shows diets low in vegetables and fruits are among the top four diet-related risk factors
in LMIC for mortality and DALYs (Afshin et al., 2019). The protective effects of FV against overall
mortality (Wang et al., 2014; Aune et al., 2017) and several NCDs (Hu et al., 2014; Wang et al., 2014;
Aune et al., 2017), are shown in multiple meta-analyses, with the strongest link to protection against
CVD (Angelino et al., 2019b; Wallace et al., 2019). It should be noted that most evidence emerges from
high-income countries with some from Asian countries; no epidemiological evidence from Africa or Latin
America was included in any of the reviews studied, which might reduce the generalizability of these

12
findings to LMIC. Considering the high prevalence of micronutrient deficiencies in LMIC and the
mitigating effect of fruits and vegetables consumption, the association between consumption and disease
or all-cause mortality is possibly different in LMIC compared to high-income countries (HIC). It is not
known whether and how the underlying highly prevalent micronutrient deficiencies and undernutrition
may affect the association of fruit and vegetables intake with NCDs, limiting the applicability of the
existing evidence in LMIC. Miller et al. did include LMIC in their study and find a similar protective effect
for FV and mortality (Miller et al., 2017).
Studies show different dose-response relationships for the amount of FV required to be protective for
disease and all-cause mortality. A threshold around five servings of FV per day was observed by Wang
and colleagues, after which the risk of all-cause mortality did not decline further (Wang et al., 2014),
while Aune and colleagues observed reductions in risk up to 800 g/day for all outcomes except cancer
(600 g/day) (Aune et al., 2017). In their meta-analysis review, Yip et al observe clear increases in
protective associations with the first 300g/day of intake, but little further increase thereafter (Yip, Chan
and Fielding, 2019). Increasing the consumption of fruits and/or vegetables to 300g/d could translate to
a 10 to 30 percent decrease in risk for most of the associated burden of diseases (Yip, Chan and Fielding,
2019).
Obesity
Consumption of FV has been suggested as a strategy to prevent obesity. They are rich in fibre, thus
increasing satiety, and have a low energy density. Studies do not provide convincing evidence that
increasing fruits and vegetables intake without combining this approach with efforts to reduce intake of
overall energy or reduce energy requirements results in weight loss (Ledoux, Hingle and Baranowski,
2011; Kaiser et al., 2014; Wallace et al., 2019).
Micronutrient deficiencies/undernutrition
The effects of micronutrient deficiencies in the human body and the related public health burden are well
documented. Two billion people are estimated to suffer from micronutrient deficiencies worldwide (WHO,
WFP and UNICEF, 2007), with pregnant women and children under 5 years of age at the highest risk
(Bailey, West and Black, 2015). The largest health burden of micronutrient deficiencies in LMIC is caused
by deficiencies of vitamin A, iron, zinc, folate and iodine (Micronutrient Initiative, 2009). Evidence from
home-garden interventions shows the impact of increased fruits and vegetables consumption on
micronutrient intake (Ruel, Quisumbing and Balagamwala, 2018). The potential of FV to improve
micronutrient status in LMIC however, needs further study.

13
4. Recommendations worldwide and in LMIC The benefits of FV go beyond a single or mix of nutrients and bioactive substances (WHO/FAO, 2003b),
and cannot be attributed only to certain species. Therefore, recommendations are given as a food
category rather than for the nutrients themselves (WHO/FAO, 2003b).
4.1 Recommendations - Quantity
The World Health Organization (WHO) recommends consumption of 400 grams or more of vegetables
and fruits daily for the general population, with no differentiation between fruits and vegetables
(WHO/FAO, 2003b).
Some global dietary guidelines suggest a higher intake than the broadly-applied 400 grams, like the
environmentally conscious EAT-Lancet diet, recommending 100 to 300g per day for fruits and 200 to 600
grams per day for vegetables for a 2500kcal diet (Willett et al., 2019). The DASH diet, developed
specifically to treat hypertension, advises five to six servings each of vegetables and fruits for a 2600kcal
diet (U.S. Department of Health and Human Services, 2006), resulting in about 692g of fruits and fruit
juices and 345g of vegetables, including a limited amount of potatoes (Karanja et al., 1999). In their
analysis of health risks, Siegel et al (Siegel et al., 2014a) use quantities from Lock et al. which suggest
330g per day for children up to four years of age, 480g per day for those age five to 14 years, and 600g
per day for those 15 years and older (Lock et al., 2004). The Global Burden of Disease defines the range
at 200 to 300g and 290 to 430g per day for fruits and vegetables, respectively (Gakidou et al., 2017). In
Table 1, different recommendations with supporting evidence are shown.

14
Table 1. Recommendations for fruits and vegetables consumption (Pastori and Talsma, 2019)
Initiative Vegetables Fruits Evidence statement in recommendation
American guidelines/ Healthy Eating Index
2.5 cup-equivalents per day Including: All fresh, frozen, canned, and dried options in cooked or raw forms, including vegetables juices. Based on 2000 kcal diet
2 cup-equivalents per day Including: Whole fruits and 100% fruit juice. Whole fruits include fresh, canned, frozen, and dried forms. Since fruit juice has less fibre, at least half of the recommendation should come from whole fruits. Based on 2000 kcal diet
Vegetables are an important source of many nutrients, including dietary fibre potassium, vitamin A, vitamin C, Vitamin K, copper, magnesium, vitamin E, vitamin B6, folate, iron, manganese, thiamin, niacin, and choline. Each of the vegetables subgroups contributes different combinations of nutrients.
DASH diet 3-4 servings per day (1600 kcal) 4-5 servings per day (2000 kcal) 5-6 servings per days (2600 kcal) Serving size: 1 cup raw leafy vegetables 1/2 cup cut-up raw or cooked vegetables 1/2 cup vegetable juice (e.g. broccoli, carrots, collards, green beans, kale, lima beans, potatoes, spinach, squash, sweet potatoes, tomatoes).
4 servings per day (1600 kcal) 4-5 servings per day (2000 kcal) 5-6 servings per day (2600 kcal) Serving size: 1 medium fruit 1/4 cup dried fruits 1/2 cup fresh, frozen, or canned fruit 1/2 cup fruit juice (e.g. apples, apricots, bananas, dates, grapes, oranges, grapefruits, grapefruit juice, mangoes, melons, peaches, pineapples, raisins, strawberries, tangerines)
Major decrease of blood pressure from the combination diet (DASH).
EAT 300 g per day (range 200-600 g/day) Disaggregation: Dark green vegetables 100 g/day, red and orange vegetables 100 g/day, other vegetables 100 g/day Excluding: Potatoes
200 g per day (range 100-300 g/day) FV are an essential source of many micronutrients, including pro-vitamin A for prevention of night blindness. Substantial evidence indicates that FV consumption is also important for prevention of cardiovascular disease; benefit is mostly achieved by consuming about five servings per day, although higher intakes might provide some benefits. High intake of vegetables reduces blood pressure and is associated with reduced risk of type 2 diabetes. Increasing intake of most non-starchy vegetables has been associated with reduced weight gain in long-term follow-up of adults in the USA. High FV consumption is weakly associated with reduced cancer incidence after adjusting for differences in other lifestyle factors such as smoking and BMI
Or five servings of FV per day (most benefit from these foods is probable if a mix is included as suggested).
GBD 290g - 430g per day (fresh, frozen, cooked, canned, or dried vegetables) Excluding:
200g - 300g per day (fresh, frozen, cooked, canned, or dried fruits) Excluding: Fruit juices and salted or pickled fruits).
Risk from a diet low in fruits: Lip and oral cavity cancer, nasopharynx cancer, esophagus cancer, larynx cancer, tracheal, cronchus, and lung cancer, ischemic heart disease, ischemic stroke, diabetes mellitus.

15
Legumes and salted or pickled vegetables, juices, nuts, and seeds, and starchy vegetables such as potatoes or corn. Exposure to diet low in vegetables is defined as average daily consumption of less than 360 g per day of vegetables.
Exposure to a diet low in fruits is defined as average daily consumption of less than 250g per day of fruits.
Risk from a diet low in vegetables: esophageal cancer, ischemic heart disease, ischemic stroke, hemorrhagic stroke.
Healthy Eating Plate
Half of the plate. Aim for color and variety, and remember that potatoes don’t count as vegetables on the Healthy Eating Plate because of their negative impact on blood sugar.
Higher intake of FVs is associated with reduced risk of death from CVD. Especially cruciferous vegetables such as broccoli, cauliflower, cabbage, Brussels sprouts, bok choy, and kale; and citrus fruits such as oranges, lemons, limes, and grapefruits.
Mediterranean diet
>2 serves of every meal (100g) or 6 serves per day
1-2 serves of per meal or 3 serves daily
N/A
Nordic diet
>400 g per day Including: Cabbages >29 g/d, Root vegetables >150 g/d, legumes 30 g/d.
>300 g per day Including: Berries 50-100 g/d,
With increasing intake of fruits or vegetables there is a proportional decrease in the risk of CVD, overweight and obesity, and probably of certain cancers.
WHO ≥ 400g (i.e. five portions) of FVs per day
Excluding: Potatoes, sweet potatoes, cassava and other starchy roots.
Prevention of obesity and weight gain: Convincing evidence high dietary intake of non-starch polysaccharides (NSP). Prevention of type 2 diabetes: Probable evidence that NSP decreases the risk of developing type 2 diabetes. Prevention of CVD: Convincing evidence for CVD (coronary heart disease, stroke, lower blood pressure). Probable evidence for consuming NSP. Prevention of cancer: Probable evidence for following cancers types: oral cavity, esophagus, stomach, colorectal Prevention of osteoporosis: Possible evidence
World Cancer Research Center
Eat a diet high in all types of plant foods including at least five portions or servings (at least 400 grams or 15 ounces in total) of a variety of non-starchy vegetables and fruits every day. Consume a diet that provides at least 30 grams per day of fibre from food sources. If you eat starchy roots and tubers as staple foods, eat non-starchy vegetables, fruis and pulses (legumes) regularly too if possible.
Strong evidence that consumption of foods containing dietary fibre protects against colorectal cancer and against weight gain, overweight and obesity. There is limited evidence that consumption of non-starchy vegetables and fruits, and some of their constituents, reduces the risk of a range of cancers and protects against weight gain, overweight and obesity.

16
17
Other than the DASH diet, none of the renowned recommendations take into account body size or energy
expenditure, nor are there specialised global recommendations for age or gender. Nevertheless, it is not
expected children can eat the same amount as adults, as their overall food intake is lower. It has been
estimated that boys and girls up to age four and those aged five to 14 years consume about 45 percent
and 20 percent less FV than adults aged 30 to 59 years, respectively (Lock et al., 2004).
A complicating factor when considering portion size is that, as vegetables are prepared, moisture loss
can result in weight change. This is especially the case for green leafy vegetables: 100g of spinach
reduces to 77g after cooking, for example (Matthews and Garrison, 1976). Despite this, WHO does not
differentiate between cooked and raw in their recommendations (indicated as ‘as is consumed’), making
it unclear whether the recommendation refers to the amount that goes into a dish raw or the final weight
after cooking. The recommended amount and the differentiation between raw and cooked depends on
the epidemiological evidence that feeds into the recommendation. As studies do not specify the
quantities as cooked/raw or a mix, conclusions on the quantities to be consumed in what form remain
indecisive.
In national dietary guidelines, the 400g WHO recommendation generally translates to five servings of FV.
Another FAO/WHO source suggests 80 gram portions (Lever and Fischer, 2018), although it has been
recognised fruits portions are generally larger than vegetables portions (Agudo, 2005). While national
dietary guidelines should use locally known measures to communicate with their population, scientists
should use uniform measures (grams) for comparability of results across literature. Currently, scientists
use different measures, and inclusion of foods in food groups are not standardised, see Table 2.
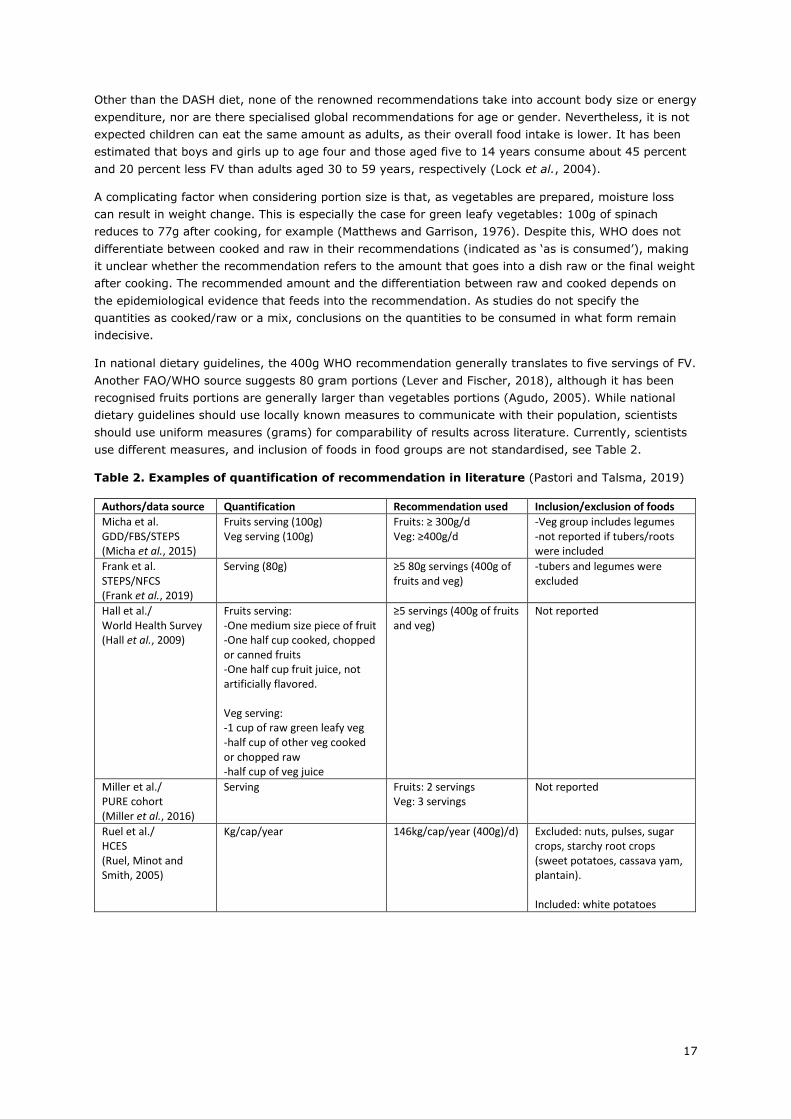
Table 2. Examples of quantification of recommendation in literature (Pastori and Talsma, 2019)
Authors/data source Quantification Recommendation used Inclusion/exclusion of foods
Micha et al. GDD/FBS/STEPS (Micha et al., 2015)
Fruits serving (100g) Veg serving (100g)
Fruits: ≥ 300g/d Veg: ≥400g/d
-Veg group includes legumes -not reported if tubers/roots were included
Frank et al. STEPS/NFCS (Frank et al., 2019)
Serving (80g) ≥5 80g servings (400g of fruits and veg)
-tubers and legumes were excluded
Hall et al./ World Health Survey (Hall et al., 2009)
Fruits serving: -One medium size piece of fruit -One half cup cooked, chopped or canned fruits -One half cup fruit juice, not artificially flavored. Veg serving: -1 cup of raw green leafy veg -half cup of other veg cooked or chopped raw -half cup of veg juice
≥5 servings (400g of fruits and veg)
Not reported
Miller et al./ PURE cohort (Miller et al., 2016)
Serving
Fruits: 2 servings Veg: 3 servings
Not reported
Ruel et al./ HCES (Ruel, Minot and Smith, 2005)
Kg/cap/year 146kg/cap/year (400g)/d)
Excluded: nuts, pulses, sugar crops, starchy root crops (sweet potatoes, cassava yam, plantain). Included: white potatoes

18
Fruits and vegetables in FBDG – overview
Food-based dietary guidelines (FBDG) attempt to translate evidence regarding the relationship between
foods, diet patterns, and health into specific, culturally appropriate, and actionable recommendations
(Herforth et al., 2019). Those guidelines can be used to influence consumer behaviour but can also
inform national nutrition and health policies. Evidence on the utilization of FBDG by the general public,
however, is scarce (Brown et al., 2011), and the effect of FBDG on FV consumption is unstudied to our
knowledge. Where FBDG have existed for a number of years, they have not been shown to be effective
in changing consumer behaviour or helping to reduce the incidence of NCD (Brown et al., 2011).
Nevertheless, even though FBDG may not be the silver bullet in convincing consumers to change their
dietary patterns, they still play an important role in health, nutrition, and agriculture policy and can serve
as a tool of accountability.
Most HIC have FBDG, however they are often absent in LMIC. Developing and updating FBDG is a
strenuous process which requires conducting and tallying results of a representative national food
consumption survey. Without these surveys, promotion of FV consumption through FBDG is not yet
possible in many countries. The number of African countries with FBDG is particularly limited: only seven
out of 54 African countries have FBDG according to FAO (Herforth et al., 2019). Where they do exist,
recommended quantities are not always specified, instead appearing as “Eat vegetables and fruits every
day” (Namibia) or “Eat plenty of fruits and vegetables” (South Africa). A worldwide overview of the key
messages about FV is given in Herforth et al. 2019 (Herforth et al., 2019), shown in Table 3. For some
guidelines, a visual aid helps to visualise the proportion of vegetables and fruits in the diet.
Table 3. FBDG key messages about fruits and vegetables conveyed by more than 5 countries
(Herforth et al., 2019).

19
4.2 Recommendations - Quality
Even though the method of preparation greatly impacts the nutritional quality of FV, WHO dietary
recommendations do not address this variation. In LMIC in Asia and Africa, vegetables are mostly
consumed cooked, while in Europe and the United States, they are eaten raw as well as cooked (Miller et
al., 2017). Current dietary guidelines are mostly based on European and US data, and as a result may
not be appropriate to use in other regions where preparation methods differ (Miller et al., 2017).
Beyond this, however, overcooking vegetables is common in many parts of the world and causes vitamin
and mineral degradation. Although the magnitude and consequences of overcooking are not studied
widely, educating consumers about this fact and changing behavior around cooking habits should be an
important aspect of nutrition programs and guidelines to reduce nutrient loss and improve nutritional
status.
4.3 Recommendations - Diversity
The WHO recommends consuming a sum of 400 grams or more of FV per day; however, because they do
not specify what species of FV to consume (WHO/FAO, 2003b), they inadvertently imply fruits and
vegetables are interchangeable. Some, but not all, national guidelines advise eating a variety of FV.
Although dietary recommendations have many similarities, different countries choose different strategies
to separate fruits and vegetables into groups. Orange FV are high in carotenoids and thus often placed in
a separate group, though many dark green leafy vegetables are also high in carotenoids. While some
countries divide groups on basis of colour, from a nutrient perspective this does not always work well
(Slavin and Lloyd, 2012). For example, vitamin C-rich FV are spread over different botanical categories,
including bell peppers, citrus fruits, and berries.
The most dominant vegetables in the global food economy are the so-called global vegetables: tomatoes,
cucurbits (pumpkin, squash, cucumber, gherkins) and allium (onions, shallots) (Schreinemachers,
Simmons and Wopereis, 2018). While dominant on the global market, these vegetables are not a rich
source of the five micronutrients most lacking in the diet in LMIC. This is also true for fruits: bananas,
melons, and apples are the most produced fruits worldwide (Rabobank, 2018) but are not good sources
of the problem micronutrients.

20
5. Current consumption patterns worldwide and in LMIC
5.1 Quantity Globally, most adults do not meet the WHO recommendations for FV consumption (Hall et al., 2009;
Murphy et al., 2014; Del Gobbo et al., 2015; Micha et al., 2015; Frank et al., 2019), placing them at
higher risk for malnutrition, morbidity, and mortality. Intake of FV is especially low in LMIC where, on
average, 3.61 portions of FV are consumed per day, based on 80g portions (Frank et al., 2019).
Consequently, only 18 percent of consumers in LMIC reach the WHO recommendation of 400g daily
intake (Frank et al., 2019). Similar results are found by Hall et al., with 21 percent of LMIC consuming
less than the five recommended servings (Hall et al., 2009). While some LMIC do come close to the
recommended amount of vegetables with a mean of 2.46 servings, fruits servings remain low, with a
mean daily intake of 1.15 servings (Frank et al., 2019).
Region disaggregated
Comparing LMIC regions, the Middle East and Central Asia come closest to meeting the WHO
recommendations, with 31.2 percent of population on target, compared to only eight percent meeting
the recommendations among adults in Latin America and the Caribbean (Frank et al., 2019), see Figure
2. In most regions, vegetables are consumed in greater amounts than fruits, though exceptions exist,
such as the Caribbean (Micha et al., 2015).
Figure 2. Percentage of population meeting WHO fruits and vegetables consumption recommendations,
(Frank et al., 2019).

21
Gender disaggregated
Intake of FV is mostly similar between men and women, in LMIC (Frank et al., 2019) and worldwide
(Micha et al., 2015), although women generally consumed slightly more fruits (+21.7 g per day) and
vegetables (+15.9 g per day) (Micha et al., 2015). Some regional differences exist, as well, with women
in Latin America and the Caribbean more likely to meet recommendations (Frank et al., 2019).
Income or other demographics disaggregated
Low income is a strong predictor for insufficient FV consumption, on country level in terms of GDP (Frank
et al., 2019) and World Bank class (Miller et al., 2016) as well as at household (Ruel, Minot and Smith,
2005) and individual levels (Hall et al., 2009; Miller et al., 2016; Frank et al., 2019). Amounts consumed
in grams are not reported with disaggregation for wealth quintiles or income levels, but the prevalence of
meeting the WHO recommendation for combined fruits and vegetables intake is only 11.2 percent in the
lowest wealth quintile, while 24.5 percent meet the recommendations in the richest quintile (Frank et al.,
2019).
Education level is also a predictor of achieving recommended consumption levels, with those achieving
secondary education or greater more likely to do so than those with no formal education (Frank et al.,
2019). Generally, it is observed that people with higher socio-economic status consume more FV (Mayén
et al., 2014).
Rural-urban disaggregated
While rural consumers are more likely to be home-producers of FV, urban consumers generally have a
higher income and more access to sale points. Hall et al. find no global association of urbanicity with low
FV consumption, with differences observed in 11 of 52 countries, where urban residents had a higher risk
of low FV consumption in 10 out of 11 countries observed (Hall et al., 2009). The contrary is observed by
Ruel et al. in countries in sub-Saharan Africa, where urban consumers have higher FV intake (Ruel, Minot
and Smith, 2005). This is also observed in the review by Mayen et al. who find that people in urban
areas consume more FV (Mayén et al., 2014). Further study is necessary to understand the patterns of
FV consumption in urban and rural areas in LMIC.
Age disaggregated
Adults
The prevalence of meeting the WHO recommendations in LMIC does not differ significantly across adult
age groups (Frank et al., 2019) though in Latin America and the Caribbean, older people were more
likely to meet recommendations (Frank et al., 2019).
Adolescents
Global data from the Global School-Based Student Health Survey shows a frequency of consumption of
fruits (1.43x/d) and vegetables (1.75x/d) among adolescents, but average intake is likely far below the
minimum amount recommended by the WHO (Beal, Morris and Tumilowicz, 2019). About a third (30.3
percent) of school-aged children do not eat any fruits daily (Development initiatives, 2018), see Figure 3.
Small differences are observed between regions for daily fruits intake (Development initiatives, 2018).
Among adolescent girls, inadequate FV intake is highest in South Asia (Keats et al., 2018). However daily
vegetables intake is highest among adolescent boys and girls in Asia (Development initiatives, 2018).

22
Figure 3. Prevalence of daily fruits, vegetables and soda intake among school-age children
and adolescents. Global Nutrition Report 2018 (Development initiatives, 2018).
Children
Nutritional data of children age six to 24 months are monitored through IYCF (Infant and Young Child
Feeding) indicators. Globally, the food groups of other FV and vitamin A-rich vegetables were consumed
by 20.8 and 41.1 percent, respectively, on the day prior to the survey. Data on amounts consumed are
not available for this age group (White et al., 2017). Global data for consumption of FV in children age
two to 13 years is not available.
Trends
Worldwide, between 1990 and 2010, fruits intake increased modestly 77.0g /d to 81.3g/d (Micha et al.,
2015). Mean vegetables consumption (including legumes) worldwide was stable across this time at
208.8g/day in 2010 (Micha et al., 2015). As income increases, it is anticipated that FV consumption will
also increase, as income is a predictor of intake as noted earlier in this section (5.1). Global demographic
trends such as rising income and rates of urbanization should be studied to predict effects on FV
demand.
5.2 Quality, diversity, safety
Data on the quality of the produce consumed globally and in LMIC is limited, not indicating if the FV
consumed have been peeled, cooked, processed etc. Nutrient content can vary as a result of these
processes, making it difficult to assess intake. Global data on the diversity of FV consumed is also scarce.
Reports from the data sources presented in Section 5.1 do not get specific on species consumed. Safety
of the produce consumed is also not reported. In general, data sources do not elaborate on form of
consumption, focusing on quantity rather than quality, diversity and safety.
5.3 Dietary data availability and limitations
Availability of global datasets containing representative and recent country estimates of dietary intake
data is limited. Although FAO Food Balance sheets are an up-to-date source of information, they measure
availability for consumption rather than actual consumption. They also do not include production of
indigenous FV, making them a poor source of dietary intake data. Household Expenditure surveys like
the LSMS (World Bank) also have limitations, as they are designed to measure expenditure, not
consumption, at the household, rather than individual, level, and generally include a limited number of
food items. More detailed efforts include the 2002-2004 World Health Survey (WHO | World Health
Survey, no date; Hall et al., 2009), but the survey has not been repeated since. The Global Dietary

23
Database (GDD), used for the Global Burden of Disease studies, summarizes data from nationally
representative dietary intake surveys in 266 countries (Tufts University, 2019), being a rich source of
information on FV intake. WHO introduced the STEPwise surveillance which includes consumption of FV
as an indicator of risk factors for NCD (Riley et al., 2016). Although intake data is available from 122
countries (WHO, no date), the planned three- to five-year repetition for surveillance is proving difficult
(Riley et al., 2016), and no recent global data are available. Frank et al analysed STEPwise data from 18
countries, plus 10 nationally representative food consumption surveys (Frank et al., 2019).
As noted earlier, national food surveys are time- and resource-intensive, and generally not conducted on
a regular basis in LMIC. The limited availability of regularly updated data constrains the interpretation
and monitoring possibilities of FV intake globally and in LMIC. The need for better data is underscored in
the Global Nutrition Report (Development initiatives, 2018) which notes one of the five critical steps to
address malnutrition is to prioritize and invest in the data needed and capacity to use it .
Although current data sources have their limitations, new developments are on the way (Development
initiatives, 2018). The Gallup Diet Quality Worldwide project is a module in the Gallup World Poll aimed
at providing comparable global information on adult diets. If successful, the aim is to roll the program
survey out across more than 140 countries by 2021 (Development initiatives, 2018). The International
Dietary Data Expansion (INDDEX) project works on multiple channels to improve metrics and data
(Development initiatives, 2018). Another initiative is Intake, which aims to support the collection and use
of dietary data in LMIC (Development initiatives, 2018).

24
6. Determinants of fruits and vegetables consumption in the food
system worldwide and in LMIC Food consumption is influenced by many factors that range from individual levels of influence to
dimensions of their environment (Wallace et al., 2019). Food systems significantly influence the FV
intake of populations, as they comprise all the processes involved in keeping people fed: growing,
harvesting, packing, processing, transforming, transporting, marketing, consuming and disposing of food
(Global Panel on Agriculture and Food Systems for Nutrition, 2016). Factors causing low FV consumption
are multidimensional and will be unravelled using a food systems perspective in this chapter. We also
investigate factors affecting quality, diversity and safety of FV consumption.
6.1 Food value chains The consumption of FV is determined to a large extent by the supply. The food supply chain impacts not
only the quantity, but also the quality, diversity and safety of FV.
Although home production is thought to be an important source of FV in LMIC, it is unknown what
percentage of produce is sourced from home gardens, or own production. Differences in sources of
acquisition (own production versus sale) are expected for urban and rural consumers, but data here is
lacking.
Quantity
Production/consumption gap
Global supply of FV is estimated to fall 22 percent short of population needs (Siegel et al., 2014b) using
a 600g age-adjusted recommendation (600g/d >15y) (Lock et al., 2004). The situation is worst in low-
income countries, followed by lower-middle income countries, which have a lower supply-to-need ratio
than high-income countries (Siegel et al., 2014b). Mason D’Croz estimates 2015 global per capita daily
supply at 546g, which is above the 400g WHO recommendation (Mason-D’Croz et al., 2019), however
this is not distributed evenly as sub-Saharan Africa and South Asia have a supply of only 206g and 326g,
respectively (Mason-D’Croz et al., 2019).
Loss and waste contribute to a reduction of production efficiency of FV, leading to a reduced supply for
consumption. In 2005, an estimated one-third of all FV produced globally were lost during production,
storage and processing (Kader, 2005). However, new estimates in the State of Food and Agriculture
Report specially devoted to food loss and waste (FAO, 2019) show lower percentages of losses. Overall,
about 14 percent of food produced was lost from farm up to, but not including, the retail stage, varying
from 6 percent in Australia and New Zealand to 21 percent in Central and Southern Asia. Levels of losses
are higher in FV (22 percent) compared to cereals and pulses at all stages in the food supply chain,
especially in situations where storage or processing conditions are inadequate. Losses for FV vary
greatly, especially in sub-Saharan Africa and South Eastern Asia (ranging from five to 50 percent), see
Figure 4 (FAO, 2019). Losses at retail and consumer levels are not included in these estimates but recent
studies suggest that levels of consumer waste in LMIC may be much lower than initially assumed. Figure
4 shows the estimated losses of FV in different regions of the world by supply chain stage (FAO, 2019),
illustrating that losses in lower-income regions are especially high during storage and processing and
packaging in Eastern and South Eastern Asia, and during on-farm post-harvest operations and wholesale
and retail in sub-Saharan Africa. This variation may be partly due to the differences in types of FV that
are produced, but also related to the presence of poor or no packaging; transportation in open
unrefrigerated trucks; being subject to mechanical injury owing to compression, abrasion and rough
handling during handling operations; and transportation, making FV highly vulnerable to deterioration.

25
Figure 4. Range of reported food loss and waste percentages for fruits and vegetables by
supply chain stage, 2000-2017 The number of observations is shown in brackets. The dates, 2000–2017, refer to
when the measurements were taken; however, the date of publication was used if the study dates were not available or were
unclear (FAO, 2019).
Trends
In 2050, the global average FV availability is predicted to vary between 608 to 862 grams per person per
day, depending on different socio-economic scenarios (Mason-D’Croz et al., 2019). Nevertheless,
numerous low-income countries in Asia, the Pacific and sub-Saharan Africa are expected to fail to supply
at least 400g per capita per day in 2050 (Mason-D’Croz et al., 2019). Predicted figures in sub-Saharan
Africa are particularly low and, independent of different socio-economic scenarios, do not meet the 400g
threshold. When taking a 33 percent (high estimate) food waste into account, figures look even less
positive, as only 19 countries would meet the 400g availability threshold in 2050, compared to 60
countries that would fail to meet it (Mason-D’Croz et al., 2019), see Figure 5.
While useful in indicating food supply, the Mason D’Croz and Siegel studies are limited by its use of Food
Balance Sheets (FBS) data, which only consider formal agriculture and do not include home gardens or
the harvesting of wild and indigenous crops (Siegel et al., 2014a; Mason-D’Croz et al., 2019). This may
lead to an underestimation of the FV available for consumption, but Del Gobbo et al. observe an
overestimation of 75 percent for vegetables consumption when comparing FBS data with individual-
based dietary surveys from the Global Dietary Database (Del Gobbo et al., 2015). The supply gap
presented might thus be larger than expected.

26
Figure 5. Countries ratios of fruits and vegetables availability to WHO minimum
recommendation (400g). Copied from Mason D’Croz et al (Mason-D’Croz et al., 2019). SSP= Shared
Socioeconomic Pathway: “SSP 1 is the most optimistic scenario envisioning a more sustainable development pathway with a
global population by 2050 of 8·5 billion people with per-capita gross domestic product (GDP) of US$34 000; SSP 2 is a middle-
of-the-road scenario, where global population grows to 9·2 billion people with per-capita GDP of $25 000; and SSP 3 is the
most pessimistic scenario with global population reaching nearly 10 billion people with a per-capita GDP of $18 000” (Mason-
D’Croz et al., 2019).

27
Quality, Diversity, Safety
Although FV are widely promoted for their micronutrient content, it is unknown how much the current FV
supply contributes to micronutrient adequacy in LMIC. Arsenault et al. assessed adequacy of supplies
through FBS data. Estimates suggest that adequacy of vitamin A and C could be met by increasing
production of crops dense in these nutrients (Arsenault, Hijmans and Brown, 2015). Some micronutrient
gaps, however, would probably have to be met by other means like supplementation (Arsenault, Hijmans
and Brown, 2015).
FV are perishable crops which decrease in quality easily as they travel through the value chain. Different
factors in the value chain have an impact on the quality of FV. While nutrient content in the soil can
already influence the nutrient content in the crop (de Valença and Bake, 2016), choosing which variety to
produce can also make a large difference in terms of nutritional content. Beyond the farm, while HIC
have well-developed cold chains, this is often not the case in LMIC. During storage, transport, and retail,
fresh FV are exposed to heat and bruising, impacting the shelf life and nutritional quality.
6.2 Food environment and consumer behaviour Low FV intake among poorer consumers is thought to be mainly due to a combination of low availability,
access, and acceptance (Global Panel on Agriculture and Food Systems for Nutrition, 2016), and is thus
largely influenced by the food environment. Within the food system, the food environment is the
dimension where the consumer interacts with the food system and its actors. While different definitions
exist, we follow the Agriculture, Nutrition, and Health (ANH) Academy framework as shown in Figure 6
(ANH Academy, 2017), which distinguishes the external and personal domain within the food
environment. In this section, we elaborate on those aspects which impact FV consumption.
Figure 6. The ANH-FEWG food environment conceptual framework (ANH Academy, 2017))
External food environment
Availability
The ANH Academy Food Environment Framework distinguishes between ‘availability’ and ‘accessibility,’
where availability refers to whether or not a vendor or product is present within a given context (ANH
Academy, 2017). As noted under Section 6.1, supply of FV is insufficient to meet WHO recommendations
in LMIC. Next to low availability in terms of quantity, diversity of available FV for sale in LMIC is also

28
observed to be lower than in high-income countries, with rural areas being worse off than urban (Miller
et al., 2016).
Seasonality is an important determinant of availability of FV, as most species are not available for
consumption throughout the whole year in LMIC. Although the impact of seasons on FV availability and
consumption is often assumed, this has not been studied widely across LMIC. Nevertheless, seasonal
availability can be a determinant in nutritional status throughout the year, documented in studies on the
availability of beta carotene-rich foods and vitamin A intake in studies in Burkina Faso, South Africa and
Hawaii (Meldrum et al., 2019). Seasonal scarcity or abundance can also influence food price, discussed
below, and thus consumption. Data on consumers experiencing limited availability of FV and the
association with consumption (quantity, diversity etc) are lacking.
Prices
The proportion of individuals meeting the 400g per day WHO recommendation increases as the country’s
FAO food price index (FPI; indicating greater stability of food prices) declines (Frank et al., 2019). The
impact of food price on FV consumption is estimated to be highest in low-income countries, where a price
increase of 10 percent for FV predicts a reduction in consumption of 7.2 percent, compared to 6.5
percent in middle-income countries and 5.3 percent in high-income countries (Cornelsen et al., 2015).
Food price fluctuations in other food groups could also impact consumption of FV, as household budget is
limited. When food prices go up, fruits, vegetables, and animal source foods are the first foods to be
dropped from the diet, or to be consumed in smaller amounts (Ruel et al., 2010). However, a 10 percent
increase in cereal prices is associated with a small but significant (0.7 percent) increase in FV
consumption in low-income countries (Cornelsen et al., 2015), possibly indicating a likelihood of limited
substitution, which could especially be explained as roots and legumes were included in the group of
vegetables.
Vendor and product properties
Supermarket penetration is increasing worldwide, including in LMIC, yet market-based vendors are still
the primary food source for the majority of people worldwide (Turner et al., 2018). As a result, when
studying food environments in LMIC, it is important to recognise the co-existence of formal and informal
markets as well as non-market-based food sources, such as own production, wild food harvest, and food
transfers including gifts (Turner et al., 2018).
There is strong evidence that despite the rising number of supermarkets worldwide, traditional markets
are notably still the dominant source of FV. As shown in Figure 7, estimates suggest that 90 percent of
FV are sourced in traditional markets in Kenya, Zambia, and Nicaragua (Gómez and Ricketts, 2013).
Even in countries such as Thailand or Mexico, which have higher rates of supermarket penetration, the
primary source for FV remains the traditional market (Gómez and Ricketts, 2013).
Figure 7. Fresh fruits and vegetables market share of modern and traditional FVC (Food Value
Chain) retail sales (Gómez and Ricketts, 2013).

29
Marketing and regulation/ Promotion, advertising and information
Commercial campaigns for FV are not thought to be common in LMIC, although data is lacking. In high-
income countries, FV are underpromoted compared to other (processed) foods in commercial campaigns
(Chandon, 2014). While promotion can have an effect on consumption of foods, the FV sector in LMIC,
usually made up of farmers selling directly to markets, does not possess a marketing budget like
international companies. In the absence of such capacity, national policies can be a tool in LMIC to
provide information on a healthy diet and the consumption of FV. Thirty-one percent of health and
nutrition policies in LMIC include promoting FV consumption as a goal (Lachat et al., 2013). Promotion of
school gardening, home gardening, and urban agriculture are the main actions included to ensure
availability and accessibility of FV in those countries (Lachat et al., 2013). The enforcement of the
policies in the form of promotion is organized by government bodies, e.g. through health counselling or
communication about food-based dietary guidelines. Food-based dietary guidelines are not widely
available in all LMIC, however, as noted earlier in Section 4.1. Health counselling is only available for
limited segments of the population, primarily taking place around pregnancy and childbirth, with limited
opportunity for sharing information on healthy diets (Kavle and Landry, 2018), let alone FV consumption
for the general population.
Personal food environment
Physical access (proximity)
Accessibility factors such as physical distance, mode of transport, and time to reach points of sale are
important factors in the food environment (ANH Academy, 2017), eventually leading to purchase and
consumption. Spatial distribution of small points of sale for vegetables and proximity to them have been
shown to be positive determinants of vegetables intake in the US (Nicholas Bodor et al., no date). Other
studies found price, rather than physical proximity of supermarkets, to be associated with higher FV
intake in the US (Aggarwal et al., 2014). Limited evidence on this subject is available from LMIC, though
physical access might play a different role in LMIC as cold storage facilities (refrigeration and electricity)
and ownership of transport is less common for low-income consumers. In urban areas, shopping outside
the residential area, but closer to the workplace, is common, as has been observed in South African
townships, for example (Ligthelm, 2008). Further research is needed to understand the association
between physical determinants in the personal food environment and FV intake in LMIC, both in urban
and rural areas, where market access and shopping patterns differ.
Markets are not the only way consumers access food in LMIC, however. Street food consumption
provides adults in LMIC 13 to 50 percent of their energy (Steyn et al., 2014). With such a large
proportion of foods consumed outside the home, street foods are an important vehicle for FV
consumption. The proportion of fruits and vegetables consumed out of home is unknown in LMIC,
however, and might differ for urban and rural populations as urbanization is thought to drive out-of-
home consumption (Steyn et al., 2014).
Economic access - Affordability
Income and education are associated with FV consumption, as noted in Section 5.1. Gender, age and
urbanization are not universal predictors of FV consumption in the adult population, although this can
differ from country to country.
As reported throughout many studies, the proportion of household income spent on food is higher for
low-income households than for high-income households. For example, Miller et al. find the percentage
of monthly household income spent on food to be higher in those countries with a lower gross national
income ranking (Miller et al., 2016). Zooming in on the price of vegetables, they found the absolute cost
of one serving of vegetables to be cheapest in low-income countries. In contrast, the absolute cost of
fruits was highest in low-income countries (Miller et al., 2016). However when looking into the cost of
one serving relative to income, it is observed that the cost of a portion of vegetables is 19 times higher
in low-income countries than in high-income countries (Miller et al., 2016). For fruits, the cost is 50

30
times higher. Subsequently, a large proportion (57 percent) of the population in low-income countries
cannot afford the recommended five servings of FV per day (Miller et al., 2016).
Stark differences in affordability of FV are seen between rural and urban communities, especially in low-
income countries, where the cost relative to income and the proportion of those unable to afford five
servings per day is even higher in rural communities (Miller et al., 2016). Similar findings are observed
for the EAT-Lancet diet, which includes large amounts of FV, and is estimated to be unaffordable for
most low-income people worldwide (Hirvonen et al., 2019). The FV food group accounts for the highest
cost (31.2 percent) globally among the foods included in the EAT-Lancet diet (Hirvonen et al., 2019).
Convenience
Low-income consumers in LMIC have a high workload, which limits their time available for food
acquisition and preparation. Women’s time is particularly highly constrained worldwide (Herforth and
Ahmed, 2015). As a result, for some, convenience may be more important than the monetary cost of
food (Herforth and Ahmed, 2015). For example, in urban Nigeria, convenience was a main barrier for
vegetables intake (Raaijmakers et al., 2018), while research in rural Vietnam shows that 75 percent of
the respondents indicated that choices for shopping sites are convenience-driven (Wertheim-Heck,
Spaargaren and Vellema, 2014). How convenience impacts FV acquisition and consumption in LMIC has
not been studied widely and need further study.
Desirability
The interaction between food preferences and the environment in which those preferences are formed is
thought to play a central role in determining food choice (Hawkes et al., 2015). While the key driver for
eating is considered hunger, food choices are not determined solely by physiological or nutritional needs
(EUFIC, 2006). Factors determining food choice include:
• Biological determinants such as hunger, appetite, and taste
• Economic determinants such as cost, income, and availability
• Physical determinants such as access, education, skills (e.g., cooking), and time
• Social determinants such as culture, family, peers, and meal patterns
• Psychological determinants such as mood, stress, and guilt
• Attitudes, beliefs, and knowledge about food
The above list is not exhaustive (EUFIC, 2006), and might especially not give full coverage to the factors
determining food choice in LMIC. While determinants of FV choice have been studied widely in HIC
(Kamphuis et al., 2006; Guillaumie, Godin and Vézina-Im, 2010; Di Noia and Byrd-Bredbenner, 2014),
evidence from LMIC is more scarce (Ruel, Minot and Smith, 2005). As the food environment looks very
different in LMIC compared to HIC, it is necessary to also study determinants in LMIC. We will elaborate
on the social and psychological determinants, as well as attitudes, beliefs, and knowledge, here.
Gender dynamics are thought to play a major role in food choice in LMIC, where women are the main
caretakers and responsible for most of the food preparation. However, decision making around what to
grow, trade, purchase and cook is influenced by other household members, including the (often) male
household head. Moreover, FV preparation in the household does not guarantee all members of the
household are consuming them. Intra-household distribution of food can depend on gender roles and
cause women to eat less or lower-quality food (Harris-Fry et al., 2017; Coates et al., 2018). Gender roles
and intra-household distribution of FV consumption are not known and need to be studied at the local
level to understand these dynamics.
As hunger is the main driver of food choice, many diets in LMIC include a large staple food component,
such as rice. This could cause vegetables and fruits to play a minor role in the diet in LMIC. Vegetables
might even be seen as a condiment and not as a major constituent of a meal, as for example in Nigeria,
tomatoes and onions were considered spices, rather than vegetables (Raaijmakers et al., 2018).
Research on food motives regarding vegetables consumption in urban Nigeria shows motives Health,
Mood, Natural and Weight control to be considered the most important motives in making food choices,
while ethical concern was considered least important (Raaijmakers et al., 2018). More research is needed

31
on how choices are made, including the perception of the role of FV in the diet in LMIC and how this
perception impacts consumption.
Beliefs can encourage or reduce consumption of FV. Food taboos are handed over from one generation to
another, along with other cultural elements (Iradukunda, 2019), and are especially found in LMIC around
pregnancy, lactation and illness. Food taboos around pregnancy can involve limiting consumption of
certain FV (Iradukunda, 2019). Another belief present around FV is the perception of them as a “poor
man’s crop.” This is especially the case for indigenous vegetables, which are sometimes considered a
“low status” food (Keatinge et al., 2015)(Keding et al., 2017). The magnitude of the occurrence of these
beliefs and their impact on (indigenous) FV consumption in LMIC is unknown, but important for future
study.
There are high levels of concern about food safety in LMIC (Grace, 2015). If vegetables regularly contain
pathogens or exceed maximum pesticide residue limits, consumers begin to associate fresh vegetables
with health risks rather than health benefits and reduce consumption (Schreinemachers, Simmons and
Wopereis, 2018). A study in Vietnam shows food safety to be the most important factor in food choice
(Meldrum et al., 2019). Food safety concerns, their relation to actual contamination, and the impact on
FV consumption needs further study in LMIC. Similarly, results from HIC show an association between
knowledge and consumption of FV (Guillaumie, Godin and Vézina-Im, 2010), but reviews from LMIC are
lacking and needed to confirm these findings.

32
7. Sustainability Dietary choices play a major role in human health, but also in environmental sustainability (Clark, Hill
and Tilman, 2018). The amount of vegetables and fruits in the diet and the interchangeability with other
food groups can determine the footprint of the diet. Plant-based foods, including FV, cause fewer adverse
environmental effects than animal source foods across various environmental indicators, see Figure 8
(Willett et al., 2019).
Figure 8. Environmental effects per serving of food produced (Willett et al., 2019). Bars are mean
(SD). CO2=carbon dioxide. Eq=equivalent. O4=phosphate. SO2=sulphur dioxide.
The environmental effects of FV are determined by different aspects in the value chain, including
amongst others input use, heated green houses, and transport. The health and environmental impacts
can collide as FV are grown in greenhouses or imported by air (Michalský and Hooda, 2015).
While LMIC may have lower FV import rates than HIC, they do export increasing amounts of FV (Figure
9) (Feyaerts, Van den Broeck and Maertens, 2020). While this likely has some local environmental
consequences, the global environmental effect of import and export of FV in LMIC is unknown.
Figure 9. Evolution of exports and imports in real value (1 million USD) by crop category and subregion over the period 1997-2016 (Feyaerts, Van den Broeck and Maertens, 2020).

33
Despite favorable weather conditions for FV production in LMIC, the environmental impact of that
production can be higher than in Europe, as shown by Perrin et al., who studied the environmental
impact of urban tomato garden systems in Benin (Perrin et al., 2017). The impacts of urban garden
systems is estimated to be 10 times higher than for tomato production in Europe (Perrin et al., 2017).
Factors contributing to this were fuel consumption for irrigation, organic fertilizer use, and insecticide
application (Perrin et al., 2017). Environmental impacts of FV value chains should be studied in LMIC to
better understand the contributing factors.
Increasing the intake of vegetables, fruits and nuts to national dietary recommendations will likely result
in an increase in greenhouse gas (GHG) emissions, eutrophication and land use for most countries
(Behrens et al., 2017). Figure 10 shows the absolute environmental impacts of average diets for different
national income groups per person (A) and the differences in environmental impacts between average
and recommended diets per person (B) (Behrens et al., 2017). However, if increased FV consumption
replaces other food groups, the net impact can still be significantly lower in comparison with the current
environmental impact. For example, 20 servings of vegetables still have less GHG emissions than one
serving of beef (Tilman and Clark, 2014).
Figure 10. (A) Absolute environmental impacts of average diets for different national income
groups per person. (B) Differences in environmental impacts between average and
recommended diets per person. Net change and change by food group are shown. VFN= Vegetables, Fruits and Nuts
(Behrens et al., 2017). Both panels give GHG and eutrophication emissions in terms of per day and land use in ongoing, yearly
requirement. Land use in Australia has been truncated in both panels for ease of visualization (in A, total Australian land use is
3.3 ha; in B the change is a reduction of 1.0 ha).
To study the sustainability of the diet, and FV in particular, it is important to understand the
environmental impact of different crops. In HIC, a large part of the diet’s environmental impact comes
from animal source foods, but this is not the case in most LMIC. Diets in LMIC have a lower
environmental impact than HIC diets to begin with, and more animal source foods should actually be
consumed to fulfill nutrient requirements (Adesogan et al., 2019). An increase in FV consumption will
likely not lead to a reduction of “high-impact” food groups, as the consumption of those food groups in
LMIC is already low. As diets are changing worldwide due to the nutrition transition, it is important to

34
monitor the sustainability of diets worldwide and in LMIC related to FV consumption. Fruits and
vegetables value chains in LMIC should be studied to understand their environmental impact and how
this can be improved.
Food-based dietary guidelines
As noted in Section 4, FBDGs are an important tool for providing nutritional advice. Only four countries
worldwide mention sustainability factors in their FBDG, and none of them are LMIC (Behrens et al.,
2017). The EAT-Lancet Commission recommends a range of 100 to 300g of fruits and 200 to 600g of
vegetables per day to ensure human health, taking into account the planetary boundaries for food
production to ensure a stable earth system (Willett et al., 2019). These boundaries take the safe
operating space into account to ensure both human health and environmental sustainability (Willett et
al., 2019), and are sufficient to meet recommendations. However, the applicability of this diet has been
questioned as it has been estimated to be unaffordable for LMIC consumers (Hirvonen et al., 2019).
Sustainability aspects should be part of FBDG promotion of FV consumption, but need to take local food
system considerations into account.

35
8. Implementation and research gaps related to fruits and vegetables
consumption worldwide and in LMIC Guided by the High Level Panel of Experts (HLPE) framework of food systems and healthy diets, the
comprehensive literature review resulted in a wealth of information on the fruits and vegetables
consumption worldwide and especially in low- and middle-income countries related to the drivers, food
system components and food system outcomes. This review also showed the implementation and
research gaps that will be highlighted in this section, arranged per chapter.
Chapter 3. Health and Nutrition
1. The magnitude of foodborne disease caused by FV in LMIC is not known across countries. This
relates to Section 6.14 and can limit consumption.
2. Upper threshold based on dose-response relationship for NCD’s ranges from 300-800g. Lack of
clarity exists if “the more the better” holds and if thresholds are applicable in LMIC as evidence
comes from HIC and is based on NCDs rather than micronutrient deficiencies. See also Section
4: Recommendations worldwide and in LMIC.
3. Data on cooking and processing habits and the consequences on the quality of FV in LMIC is
lacking and needs further investigation.
4. Although FV are known to be a rich source of micronutrients, the contribution of this food group
to intake and adequacy of micronutrients in the diet in LMIC is largely unstudied to our
knowledge.
5. Even though fibre is considered an important nutrient, global and LMIC data on fibre
consumption and the contribution of FV to it are missing.
6. Although the health burden of micronutrient deficiencies is studied widely, the contribution of
inadequate FV intake to the health burden of micronutrients deficiencies is unknown to our
knowledge.
7. Considering the high prevalence of micronutrient deficiencies in LMIC and the mitigating effect of
fruits and vegetables consumption, the association between consumption and disease or all-
cause mortality is possibly different in LMIC compared to HIC. It is not known whether and how
the underlying highly prevalent micronutrient deficiencies and undernutrition may affect the
association of FV intake with NCDs on the one hand, and on the other, limiting the applicability
of the existing evidence in LMIC.
Chapter 4. Recommendations worldwide and in LMIC
1. Currently, scientists use different measures, and inclusion of foods in food groups are not
standardised. It is advised to come up with international standards to improve comparability of
the literature in the future.
2. No differentiation between cooked and raw is made in the 400g daily consumption
recommendation by WHO, making it unclear if the recommendation is the amount that goes into
a dish raw or if it is the final weight after cooking. The recommended amount and the
differentiation between raw and cooked depends on the epidemiological evidence that feeds into
the recommendation. As studies do not specify the quantities as cooked, raw, or a mix,
conclusions on the quantities to be consumed remain vague. As current dietary guidelines do not
differentiate between raw and cooked vegetables intake, and guidelines are mostly based on
European and US data, the recommendations might not apply to other regions in the world
(Miller et al., 2017).
3. It is uncertain if we are using the right methods to estimate the recommended quantity of FV as
there are many different recommendations, and evidence from epidemiological studies ranges
from 300-800g/d (see Section 3.5). As the WHO recommendation is from 2003 and refers to
even earlier recommendations (WHO/FAO, 2003b), recent evidence is not included.
Recommendations for different age groups are especially lacking.

36
4. Evidence on the utilization of FBDG by the general public is scarce (Brown et al., 2011), and the
effect of FBDG on FV consumption is unstudied to our knowledge.
5. In Africa, the number of countries with FBDG is particularly limited: only seven out of 54 African
countries have FBDG (Herforth et al., 2019). Efforts should be made to develop FBDGs for every
country.
6. Even though the method of preparation greatly impacts the nutritional quality of FV, WHO
dietary recommendations do not get specific on the form of consumption. Although the
magnitude and consequences of overcooking are not studied widely, changing consumer
behavior around cooking habits should be an important aspect of nutrition programs and
guidelines to decrease nutrient loss and improve nutritional status.
Chapter 5. Current consumption patterns worldwide and in LMIC
1. There is a need for disaggregated FV intake data for wealth quintiles and income levels across
LMIC.
2. Further study is necessary to understand FV consumption patterns in urban and rural areas in
LMIC.
3. Global demographic trends such as rising incomes and rates of urbanization should be further
studied to predict effects on the demand for FV.
4. Global data on consumption of FV in children age two to 13 years does not exist.
5. Data on the quality of produce consumed globally, and particularly in LMIC, is limited. We are
unaware if the FV consumed have been peeled, cooked, processed, etc. Nutrient content can
thus differ depending on local practices, however, we are not in the possession of this
consumption data.
6. Reports from the data sources presented in Section 5.1 do not detail species consumed. This is
important for future interventions and policy.
7. Availability of global datasets containing representative and recent country estimates of dietary
intake data is limited. The limited availability of regularly updated data constrains the
interpretation and monitoring possibilities of FV intake globally, in LMIC and in-country.
8. Underutilised local species of FV need further nutritional analysis and attention as they can be
rich sources of nutrients.
Chapter 6. Determinants of consumption in the food system worldwide and in LMIC
1. No “general” reviews were found on determinants of FV consumption in adults in LMIC.
2. Although home production is thought to be an important source of FV in LMIC, it is unknown, to
our knowledge, what percentage of produce is sourced from home gardens or own production.
Differences in sources of acquisition (own production vs sale) are expected for urban and rural
consumers, but data here is also lacking.
3. It is unknown how much the current supply of FV contributes to micronutrient adequacy in LMIC.
4. During storage, transport, and retail, fresh FV are exposed to heat and bruising, impacting the
shelf life and nutritional quality. High levels of this kind of impact can be an important
determinant of availability.
5. As noted in Section 6.1, the supply of FV in LMIC is insufficient to meet WHO recommendations.
Next to low availability, diversity of FV available for sale is also observed to be lower than in
high-income countries, with rural areas being worse off than urban (Miller et al., 2016).
6. Although the impact of seasons on FV availability and consumption is often assumed, this has
not been studied widely across LMIC to our knowledge.
7. Data on the prevalence of consumers experiencing limited availability of FV and the association
with consumption (quantity, diversity etc.) is unknown.
37
8. The association between physical determinants in the personal food environment and FV intake
in LMIC, both in urban and rural areas where market access and shopping patterns differ, needs
to be studied.
9. The proportion of FV consumed outside the home is unknown and might differ for urban and
rural populations. As out-of-home consumption is common in LMIC, this is an important research
area.
10. How convenience impacts FV acquisition and consumption in LMIC has not been studied widely.
11. While determinants of choice for FV have been studied widely in HIC, evidence from LMIC is
more scarce. As the food environment looks very different in LMIC compared to HIC, it is
necessary to study determinants in LMIC.
12. Gender roles and intra-household distribution of FV consumption need to be studied to
understand these dynamics at the local level.
13. The magnitude and frequency of the occurrence of food taboos and beliefs and impacts on
(indigenous) FV consumption in LMIC is unknown.
14. Food safety concerns, their relation to actual contamination, and the impact on FV consumption
in LMIC needs to be studied. Research is needed on the perception of the role of FV in the diet in
LMIC and how this perception impacts consumption.
15. Results from HIC show an association between knowledge and consumption of FV, but reviews
from LMIC are lacking to confirm these findings in those countries.
Chapter 7. Sustainability
1. The environmental effect of import and export of FV in LMIC is unknown to our knowledge.
2. Environmental impacts of FV value chains in LMIC should be studied to understand the
contributing factors.
3. As diets are changing worldwide due to the nutrition transition, it is important to monitor the
sustainability of diets worldwide, and in LMIC in particular, related to FV consumption.
4. Different FV value chains in LMIC should be studied to understand their environmental impact
and how this can be improved.
5. To study the sustainability of the diet, and FV in particular, it is important to understand the
environmental impact of different crops.
6. Sustainability aspects should be part of FBDG promoting FV but need to take local food system
aspects in LMIC into account.

38
References
Aasheim, E. T. et al. (2015) ‘Tinned Fruit Consumption and Mortality in Three Prospective Cohorts’, PLOS ONE. Edited by A. Bayer, 10(2), p. e0117796. doi: 10.1371/journal.pone.0117796.
Adesogan, A. T. et al. (2019) ‘Animal source foods: Sustainability problem or malnutrition and sustainability solution? Perspective matters’, Global Food Security, (May). doi: 10.1016/j.gfs.2019.100325.
Afshin, A. et al. (2019) ‘Health effects of dietary risks in 195 countries, 1990–2017: a systematic analysis for the Global Burden of Disease Study 2017’, Lancet, 393, pp. 1958–72. doi: 10.1016/S0140-6736(19)30041-8.
Aggarwal, A. et al. (2014) ‘Access to supermarkets and fruit and vegetable consumption’, American Journal of Public Health, 104(5), pp. 917–923. doi: 10.2105/AJPH.2013.301763.
Agudo, A. (2005) Measuring intake of fruit and vegetables. Background paper for the Joint FAO/WHO Workshop on Fruit and Vegetables for Health, 1-3 September 2004, Kobe, Japan.
Angelino, D. et al. (2019a) ‘Fruit and vegetable consumption and health outcomes: an umbrella review of observational studies’, International Journal of Food Sciences and Nutrition. Taylor & Francis, pp. 1–16. doi: 10.1080/09637486.2019.1571021.
Angelino, D. et al. (2019b) ‘Fruit and vegetable consumption and health outcomes: an umbrella review of observational studies’, International Journal of Food Sciences and Nutrition. Taylor & Francis, 70(6), pp. 652–667. doi: 10.1080/09637486.2019.1571021.
ANH Academy (2017) Food Environment working group techincal brief.
Arsenault, J. E., Hijmans, R. J. and Brown, K. H. (2015) ‘Improving nutrition security through agriculture: an analytical framework based on national food balance sheets to estimate nutritional adequacy of food supplies’, Food Security. Springer Netherlands, 7(3), pp. 693–707. doi: 10.1007/s12571-015-0452-y.
Aune, D. et al. (2017) ‘Fruit and vegetable intake and the risk of cardiovascular disease, total cancer and all-cause mortality-a systematic review and dose-response meta-analysis of prospective studies’, International Journal of Epidemiology, 46(3), pp. 1029–1056. doi: 10.1093/ije/dyw319.
Bailey, R. L., West, K. P. and Black, R. E. (2015) ‘The epidemiology of global micronutrient deficiencies’, Annals of Nutrition and Metabolism, 66(suppl 2), pp. 22–33. doi: 10.1159/000371618.
Beal, T., Morris, S. S. and Tumilowicz, A. (2019) ‘Global Patterns of Adolescent Fruit, Vegetable, Carbonated Soft Drink, and Fast-Food Consumption: A Meta-Analysis of Global School-Based Student Health Surveys’, Food and Nutrition Bulletin, 40(4), pp. 444–459. doi: 10.1177/0379572119848287.
Behrens, P. et al. (2017) ‘Evaluating the environmental impacts of dietary recommendations’, Proceedings of the National Academy of Sciences, 114(51), pp. 13412–13417. doi: 10.1073/pnas.1711889114.
Bennett, J. E. et al. (2018) NCD Countdown 2030: worldwide trends in non-communicable disease mortality and progress towards Sustainable Development Goal target 3.4 NCD Countdown 2030 collaborators*, The Lancet. doi: 10.1016/S0140-6736(18)31992-5.
Bhupathiraju, S. N. et al. (2013) ‘Quantity and variety in fruit and vegetable intake and risk of coronary heart disease1-3’, American Journal of Clinical Nutrition, 98(6), pp. 1514–1523. doi: 10.3945/ajcn.113.066381.
Bonner, M. R. and Alavanja, M. C. R. (2017) ‘Pesticides, human health, and food security’, Food and Energy Security, 6(3), pp. 89–93. doi: 10.1002/fes3.112.
Borelli, T. et al. (2020) ‘Local Solutions for Sustainable Food Systems : The Contribution of Orphan Crops and Wild Edible Species’, 10(231), p. 25. doi: 10.3390/agronomy10020231.
De Brauw, A. et al. (2019) ‘Food System Innovations for Healthier Diets in Low and Middle-Income Countries’, (March).
Van Breda, S. G. J. and De Kok, T. M. C. M. (2018) ‘Smart Combinations of Bioactive Compounds in Fruits and Vegetables May Guide New Strategies for Personalized Prevention of Chronic Diseases’, Molecular Nutrition Food Research, 62(1700597). doi: 10.1002/mnfr.201700597.
Brown, K. A. et al. (2011) ‘A review of consumer awareness, understanding and use of food-based dietary guidelines’, British Journal of Nutrition, 106(1), pp. 15–26. doi: 10.1017/S0007114511000250.
CDC (no date) Fruit and Vegetable Safety | Food Safety | CDC. Available at: https://www.cdc.gov/foodsafety/communication/steps-healthy-fruits-veggies.html (Accessed: 14 February 2020).
Chandon, P. (2014) Advertising for fruit and vegetables is globally inexistent, International Fruit and Vegetable

39
Alliance - newslettter. doi: 10.18061/bhac.v3i2.7261.
Clark, M., Hill, J. and Tilman, D. (2018) ‘The Diet, Health, and Environment Trilemma’, Annual Review of Environment and Resources, 43(1), pp. 109–134. doi: 10.1146/annurev-environ-102017-025957.
Coates, J. et al. (2018) ‘Intra-household nutrient inequity in rural Ethiopia’, Food Policy. Pergamon, 81, pp. 82–94. doi: 10.1016/J.FOODPOL.2018.10.006.
Cornelsen, L. et al. (2015) ‘What happens to patterns of food consumption when food prices change? Evidence from a systematic review and meta-analysis of food price elasticities globally’, HEALTH ECONOMICS, 24, pp. 1548–1559. doi: 10.1002/hec.
Development initiatives (2018) Global Nutrition Report 2018.
EUFIC (2006) The Factors That Influence Our Food Choices: (EUFIC). Available at: https://www.eufic.org/en/healthy-living/article/the-determinants-of-food-choice (Accessed: 14 February 2020).
FAO (2019) The State of Food and Agriculture 2019. Rome. Available at: http://www.fao.org/3/ca6030en/ca6030en.pdf.
Feyaerts, H., Van den Broeck, G. and Maertens, M. (2020) ‘Global and local food value chains in Africa: A review’, Agricultural Economics (United Kingdom), 51(1), pp. 143–157. doi: 10.1111/agec.12546.
Forouzanfar, M. H. et al. (2016) ‘Global, regional, and national comparative risk assessment of 79 behavioural, environmental and occupational, and metabolic risks or clusters of risks, 1990–2015: a systematic analysis for the Global Burden of Disease Study 2015’, The Lancet, 388(10053), pp. 1659–1724. doi: 10.1016/S0140-6736(16)31679-8.
Frank, S. M. et al. (2019) ‘Consumption of Fruits and Vegetables Among Individuals 15 Years and Older in 28 Low- and Middle-Income Countries’, The Journal of Nutrition. Oxford University Press, 149(7), pp. 1252–1259. doi: 10.1093/jn/nxz040.
Gakidou, E. et al. (2017) ‘Global, regional, and national comparative risk assessment of 84 behavioural, environmental and occupational, and metabolic risks or clusters of risks, 1990-2016: A systematic analysis for the Global Burden of Disease Study 2016’, The Lancet, 390(10100), pp. 1345–1422. doi: 10.1016/S0140-6736(17)32366-8.
Global Panel on Agriculture and Food Systems for Nutrition. (2016) Food systems and diets.
Del Gobbo, L. C. et al. (2015) ‘Assessing global dietary habits: a comparison of national estimates from the FAO and the Global Dietary Database 1-4’, Am J Clin Nutr, 101, pp. 1038–1084. doi: 10.3945/ajcn.114.087403.
Gómez, M. and Ricketts, K. (2013) ‘Food value chain transformations in developing countries: Selected hypotheses on nutritional implications’, Food Policy. Pergamon, 42, pp. 139–150. doi: 10.1016/J.FOODPOL.2013.06.010.
Grace, D. (2015) ‘Food Safety in Low and Middle Income Countries’, International Journal of Environmental Research and Public Health. Multidisciplinary Digital Publishing Institute, 12(9), pp. 10490–10507. doi:
10.3390/ijerph120910490.
Grubben, G. et al. (2014) ‘Vegetables to combat the Hidden Hunger in Africa’, Chronica Horticultutae, 54(1), pp. 24–32.
Guillaumie, L., Godin, G. and Vézina-Im, L. A. (2010) ‘Psychosocial determinants of fruit and vegetable intake in adult population: A systematic review’, International Journal of Behavioral Nutrition and Physical Activity, 7, pp. 1–12. doi: 10.1186/1479-5868-7-12.
Hall, J. N. et al. (2009) ‘Global Variability in Fruit and Vegetable Consumption’, American Journal of Preventive Medicine. Elsevier, 36(5), pp. 402-409.e5. doi: 10.1016/J.AMEPRE.2009.01.029.
Harris-Fry, H. et al. (2017) ‘Determinants of intra-household food allocation between adults in South Asia – a systematic review’, International Journal for Equity in Health. BioMed Central, 16(1), p. 107. doi: 10.1186/s12939-017-0603-1.
Hawkes, C. et al. (2015) ‘Smart food policies for obesity prevention’, The Lancet. Available at: http://www.sciencedirect.com/science/article/pii/S0140673614617451 (Accessed: 19 February 2015).
Herforth, A. et al. (2019) ‘A Global Review of Food-Based Dietary Guidelines’, Advances in Nutrition. Oxford University Press, 10(4), pp. 590–605. doi: 10.1093/advances/nmy130.
Herforth, A. and Ahmed, S. (2015) ‘The food environment, its effects on dietary consumption, and potential for measurement within agriculture-nutrition interventions’, Food Security, 7(3), pp. 505–520. doi: 10.1007/s12571-015-0455-8.
Hirvonen, K. et al. (2019) ‘Articles Affordability of the EAT – Lancet reference diet : a global analysis’, The

40
Lancet Global Health. The Author(s). Published by Elsevier Ltd. This is an Open Access article under the CC BY 4.0 license, 8(19), pp. 1–8. doi: 10.1016/S2214-109X(19)30447-4.
HLPE (2017) Nutrition and food systems. Available at: www.fao.org/cfs/cfs-hlpe (Accessed: 1 July 2019).
Hu, D. et al. (2014) ‘Fruits and vegetables consumption and risk of stroke: a meta-analysis of prospective cohort studies.’, Stroke, 45(6), pp. 1613–9. doi: 10.1161/STROKEAHA.114.004836.
Hunter, D. et al. (2019) ‘The potential of neglected and underutilized species for improving diets and nutrition’, Planta. Springer Berlin Heidelberg, 250(3), pp. 709–729. doi: 10.1007/s00425-019-03169-4.
Iradukunda, F. (2019) ‘Food taboos during pregnancy’, Health Care for Women International. Taylor & Francis, 0(0), pp. 1–10. doi: 10.1080/07399332.2019.1574799.
Jamnadass, R. H. et al. (2011) ‘Improving livelihoods and nutrition in sub-Saharan Africa through the promotion of indigenous and exotic fruit production in smallholders’ agroforestry systems: a review’, International Forestry Review, 13(3), pp. 338–354. doi: https://doi-org.ezproxy.library.wur.nl/10.1505/146554811798293836.
Kader, A. A. (2005) ‘Increasing food availability by reducing postharvest losses of fresh produce’, Acta Horticulturae, 682, pp. 2169–2176. doi: 10.17660/ActaHortic.2005.682.296.
Kaiser, K. A. et al. (2014) ‘Increased fruit and vegetable intake has no discernible effect on weight loss: a systematic review and meta-analysis 1–4’, American Journal of Clinical Nutrition, 100, pp. 567–76. doi: 10.3945/ajcn.114.090548.1.
Kamphuis, C. B. M. et al. (2006) ‘Environmental determinants of fruit and vegetable consumption among adults: a systematic review.’, The British journal of nutrition, 96(4), pp. 620–35. doi: 10.1079/BJN20061896.
Karanja, N. M. et al. (1999) ‘Descriptive characteristics of the dietary patterns used in the Dietary Approaches to Stop Hypertension Trial. DASH Collaborative Research Group’, Journal of the American Dietetic Association, pp. S19-27. doi: 10.1016/S0002-8223(99)00412-5.
Kavle, J. A. and Landry, M. (2018) ‘Addressing barriers to maternal nutrition in low- and middle-income countries: A review of the evidence and programme implications’, Maternal and Child Nutrition, 14(1), pp. 1–13. doi: 10.1111/mcn.12508.
Keatinge, J. D. H. et al. (2015) ‘Indigenous vegetables worldwide: Their importance and future development’, Acta Horticulturae, 1102(November), pp. 1–20. doi: 10.17660/ActaHortic.2015.1102.1.
Keats, E. C. et al. (2018) ‘The dietary intake and practices of adolescent girls in low-and middle-income countries: A systematic review’, Nutrients, 10(12). doi: 10.3390/nu10121978.
Keding, G. B. et al. (2017) ‘Fruit production and consumption: practices, preferences and attitudes of women in rural western Kenya’, Food Security. Springer Netherlands, 9(3), pp. 453–469. doi: 10.1007/s12571-017-0677-z.
Khoury, C. K. et al. (2014) ‘Increasing homogeneity in global food supplies and the implications for food
security’, Proceedings of the National Academy of Sciences. National Academy of Sciences, 111(11), pp. 4001–4006. doi: 10.1073/PNAS.1313490111.
Kim, H. J. et al. (2010) ‘Fresh and pickled vegetable consumption and gastric cancer in Japanese and Korean populations: A meta-analysis of observational studies’, Cancer Science, 101(2), pp. 508–516. doi: 10.1111/j.1349-7006.2009.01374.x.
Lachat, C. et al. (2013) ‘Diet and Physical Activity for the Prevention of Noncommunicable Diseases in Low- and Middle-Income Countries: A Systematic Policy Review’, PLoS Medicine, 10(6). doi: 10.1371/journal.pmed.1001465.
Ledoux, T. A., Hingle, M. D. and Baranowski, T. (2011) ‘Relationship of fruit and vegetable intake with adiposity: A systematic review’, Obesity Reviews, 12(501), pp. 143–150. doi: 10.1111/j.1467-789X.2010.00786.x.
Lever, J. and Fischer, J. (2018) ‘Fruit and vegetables’, in Kosher and Halal Business Compliance. Routledge, pp. 64–67. doi: 10.4324/9781315159874-13.
Ligthelm, A. (2008) ‘The impact of shopping mall development on small township retailers’, South African Journal of Economic and Management Sciences (SAJEMS), 11(1), pp. 37–53.
Liu, L., Wang, S. and Liu, J. (2015) ‘Fiber consumption and all-cause, cardiovascular, and cancer mortalities: A systematic review and meta-analysis of cohort studies’, Molecular Nutrition and Food Research. Wiley-VCH Verlag, 59(1), pp. 139–146. doi: 10.1002/mnfr.201400449.
Lock, K. et al. (2004) ‘Low fruit and vegetable consumption’, in Comparative Quantification of Health Risks. Global and Regional Burden of Disease Attributable to Selected Major Risk Factors, pp. 597–726. Available at:

41
https://pdfs.semanticscholar.org/6043/313892d3b44d08da7dd49452d762b943f290.pdf?_ga=2.209688082.1016183830.1585748870-2062506870.1585748870.
Mason-D’Croz, D. et al. (2019) ‘Gaps between fruit and vegetable production, demand, and recommended consumption at global and national levels: an integrated modelling study’, The Lancet Planetary Health. The Author(s). Published by Elsevier Ltd. This is an Open Access article under the CC BY 4.0 license, 3(7), pp. e318–e329. doi: 10.1016/S2542-5196(19)30095-6.
Matthews, R. and Garrison, W. (1976) ‘Food Yields Summarized by Different Stages of Preparation’, Journal of Nutrition Education, 8(4), p. 176. doi: 10.1016/S0022-3182(76)80055-6.
Mayén, A.-L. et al. (2014) ‘Socioeconomic determinants of dietary patterns in low- and middle-income countries: a systematic review’, The American Journal of Clinical Nutrition, 100(6), pp. 1520–1531. doi: 10.3945/ajcn.114.089029.
Meldrum, G. et al. (2019) Determinants of fruits and vegetable consumption in low-income neighbourhoods in Hanoi, Vietnam.
Micha, R. et al. (2015) ‘Global, regional and national consumption of major food groups in 1990 and 2010: a systematic analysis including 266 country-specific nutrition surveys worldwide’, BMJ Open, 5(9), p. e008705. doi: 10.1136/bmjopen-2015-008705.
Michalský, M. and Hooda, P. S. (2015) ‘Greenhouse gas emissions of imported and locally produced fruit and vegetable commodities: A quantitative assessment’, Environmental Science & Policy, 48, pp. 32–43. doi: 10.1016/j.envsci.2014.12.018.
Micronutrient Initiative (2009) Investing in the Future: A United Call to Action on Vitamin and Mineral Deficiencies. doi: https://www.who.int/vmnis/publications/investing_in_the_future.pdf.
Miller, V. et al. (2016) ‘Availability, affordability, and consumption of fruits and vegetables in 18 countries across income levels: findings from the Prospective Urban Rural Epidemiology (PURE) study’, The Lancet Global Health, 4(10), pp. e695–e703. doi: 10.1016/S2214-109X(16)30186-3.
Miller, V. et al. (2017) ‘Fruit, vegetable, and legume intake, and cardiovascular disease and deaths in 18 countries (PURE): a prospective cohort study’, The Lancet, 390(10107), pp. 2037–2049. doi: 10.1016/S0140-6736(17)32253-5.
Mozaffarian, D. (2016) ‘Dietary and policy priorities for cardiovascular disease, diabetes, and obesity. A comprehensive review’, Circulation, 133, pp. 187–226. doi: 10.1161/CIRCULATIONAHA.115.018585.
Murphy, M. M. et al. (2014) ‘Global assessment of select phytonutrient intakes by level of fruit and vegetable consumption’, British Journal of Nutrition, 112(6), pp. 1004–1018. doi: 10.1017/S0007114514001937.
Nicholas Bodor, J. et al. (no date) ‘Neighbourhood fruit and vegetable availability and consumption: the role of small food stores in an urban environment’, Public Health Nutrition, 11(4), pp. 413–420. doi: 10.1017/S1368980007000493.
Di Noia, J. and Byrd-Bredbenner, C. (2014) ‘Determinants of fruit and vegetable intake in low-income children and adolescents’, Nutrition Reviews, 72(9), pp. 575–590. doi: 10.1111/nure.12126.
Oude Griep, L. M. et al. (2012) ‘Variety in fruit and vegetable consumption and 10-year incidence of CHD and stroke’, Public Health Nutrition, 15(12), pp. 2280–2286. doi: 10.1017/S1368980012000912.
Padulosi, S., Thompson, J. and Rudebjer, P. (2013) Fighting poverty, hunger and malnutrition with neglected and underutilized Species (NUS): needs, challenges and the way forward. Rome.
Pastori, G. and Talsma, E. (2019) Overview of recommendations for fruit and vegetables intake. Wageningen.
Perrin, A. et al. (2017) ‘The variability of field emissions is critical to assessing the environmental impacts of vegetables: A Benin case-study’, Journal of Cleaner Production, 153, pp. 104–113. doi: 10.1016/j.jclepro.2017.03.159.
Pinstrup-Andersen, P. (2007) ‘Agricultural research and policy for better health and nutrition in developing countries: a food systems approach’, Agricultural Economics. John Wiley & Sons, Ltd (10.1111), 37, pp. 187–198. doi: 10.1111/j.1574-0862.2007.00244.x.
Popkin, B. M., Adair, L. S. and Ng, S. W. (2012a) ‘NOW AND THEN: The Global Nutrition Transition: The Pandemic of Obesity in Developing Countries’, Nutrition reviews, 70(1). doi: 10.1111/j.1753-4887.2011.00456.x.
Popkin, B. M., Adair, L. S. and Ng, S. W. (2012b) ‘NOW AND THEN: The Global Nutrition Transition: The Pandemic of Obesity in Developing Countries’, Nutrition reviews, 70(1). doi: 10.1111/j.1753-4887.2011.00456.x.
Raaijmakers, I. et al. (2018) ‘Drivers of vegetable consumption in urban Nigeria: Food choice motives,

42
knowledge, and self-efficacy’, Sustainability (Switzerland), 10(12), pp. 1–14. doi: 10.3390/su10124771.
Rabobank (2018) ‘World Fruit Map’, Rabobank, p. 2018. Available at: https://services.rabobank.com/publicationservice/download/publication/token/hBd4XYrCzigkX6wYrVP6.
Riley, L. et al. (2016) ‘The world health organization STEPwise approach to noncommunicable disease risk-factor surveillance: Methods, challenges, and opportunities’, American Journal of Public Health, 106(1), pp. 74–78. doi: 10.2105/AJPH.2015.302962.
Rodriguez-Casado, A. (2016) ‘The Health Potential of Fruits and Vegetables Phytochemicals: Notable Examples’, Critical Reviews in Food Science and Nutrition. Taylor & Francis, 56(7), pp. 1097–1107. doi: 10.1080/10408398.2012.755149.
Ruel, M. T. et al. (2010) ‘The Food, Fuel, and Financial Crises Affect the Urban and Rural Poor Disproportionately: A Review of the Evidence’, The Journal of Nutrition, 140(1), pp. 170S-176S. doi: 10.3945/jn.109.110791.
Ruel, M. T., Minot, N. and Smith, L. (2005) ‘Patterns and determinants of fruit and vegetable consumption in sub-Saharan Africa: a multicountry comparison’, in Report of a Joint FAO/WHO Workshop on Fruit and Vegetables for Health, September 1-3, Kobe, Japan (2004). World Health Organization.
Ruel, M. T., Quisumbing, A. R. and Balagamwala, M. (2018) ‘Nutrition-sensitive agriculture: What have we learned so far?’, Global Food Security. Elsevier B.V., 17(January), pp. 128–153. doi: 10.1016/j.gfs.2018.01.002.
Schreinemachers, P. et al. (2020) ‘How much is too much? Quantifying pesticide overuse in vegetable
production in Southeast Asia’, Journal of Cleaner Production, 244, pp. 1–23. doi: 10.1016/j.jclepro.2019.118738.
Schreinemachers, P., Simmons, E. B. and Wopereis, M. C. S. (2018) ‘Tapping the economic and nutritional power of vegetables’. doi: 10.1016/j.gfs.2017.09.005.
Siegel, K. R. et al. (2014a) ‘Do We Produce Enough Fruits and Vegetables to Meet Global Health Need?’, PLoS ONE. Edited by W. L. Araujo. Public Library of Science, 9(8), p. e104059. doi: 10.1371/journal.pone.0104059.
Siegel, K. R. et al. (2014b) ‘Do We Produce Enough Fruits and Vegetables to Meet Global Health Need?’, PLoS ONE. Edited by W. L. Araujo. Public Library of Science, 9(8), p. e104059. doi: 10.1371/journal.pone.0104059.
Slavin, J. L. and Lloyd, B. (2012) ‘Health Benefits Of Fruits and Vegetables’, Advances in Nutrition, 3, pp. 506–516. doi: 10.3945/an.112.002154.506.
Steyn, N. P. et al. (2014) ‘Nutritional contribution of street foods to the diet of people in developing countries: a systematic review’, Public Health Nutrition, 17(6), pp. 1363–1374. doi: 10.1017/S1368980013001158.
Sudershan, R. V. et al. (2014) ‘Foodborne Infections and Intoxications in Hyderabad India’, Epidemiology Research International, 2014, pp. 1–5. doi: 10.1155/2014/942961.
Teucher, B., Olivares, M. and Cori, H. (2004) ‘Enhancers of iron absorption: Ascorbic acid and other organic
acids’, International Journal for Vitamin and Nutrition Research, 74(6), pp. 403–419. doi: 10.1024/0300-9831.74.6.403.
Tilman, D. and Clark, M. (2014) ‘Global diets link environmental sustainability and human health’, Nature. Nature Publishing Group, 515(7528), pp. 518–522. doi: 10.1038/nature13959.
Tufts University (2019) Global Dietary Database. Available at: https://www.globaldietarydatabase.org/ (Accessed: 4 March 2020).
Turner, C. et al. (2018) ‘Concepts and critical perspectives for food environment research: A global framework with implications for action in low- and middle-income countries’, Global Food Security, 18, pp. 93–101. doi: 10.1016/j.gfs.2018.08.003.
U.S. DEPARTMENT OF HEALTH AND HUMAN SERVICES (2006) Lowering Your Blood Pressure With DASH. DASH Eating Plan. doi: 10.1037/e566492010-001.
de Valença, A. W. and Bake, A. (2016) ‘Micronutrient management for improving harvests, human nutrition, and the environment’, p. 21.
Wallace, T. C. et al. (2019) ‘Fruits, vegetables, and health: A comprehensive narrative, umbrella review of the science and recommendations for enhanced public policy to improve intake’, Critical Reviews in Food Science and Nutrition. Taylor & Francis, 0(0), pp. 1–38. doi: 10.1080/10408398.2019.1632258.
Wang, X. et al. (2014) ‘Fruit and vegetable consumption and mortality from all causes, cardiovascular disease, and cancer: Systematic review and dose-response meta-analysis of prospective cohort studies’, BMJ (Online). BMJ Publishing Group, 349. doi: 10.1136/bmj.g4490.

43
Wertheim-Heck, S. C. O., Spaargaren, G. and Vellema, S. (2014) ‘Food safety in everyday life: Shopping for vegetables in a rural city in Vietnam’, Journal of Rural Studies. Elsevier Ltd, 35, pp. 37–48. doi: 10.1016/j.jrurstud.2014.04.002.
White, J. M. et al. (2017) ‘Complementary feeding practices: Current global and regional estimates’, Maternal and Child Nutrition, 13(July), pp. 1–12. doi: 10.1111/mcn.12505.
WHO/FAO (2003a) DIET, NUTRITION AND THE PREVENTION OF CHRONIC DISEASES. Available at: https://apps.who.int/iris/bitstream/handle/10665/42665/WHO_TRS_916.pdf?sequence=1 (Accessed: 20 June 2019).
WHO/FAO (2003b) DIET, NUTRITION AND THE PREVENTION OF CHRONIC DISEASES.
WHO (2009) Global prevalence of vitamin A deficiency in populations at risk 1995-2005 WHO Global Database on Vitamin A Deficiency. Available at: www.who.int/vmnis (Accessed: 20 June 2019).
WHO (no date) NCDs | STEPwise approach to surveillance (STEPS). Available at: https://www.who.int/ncds/surveillance/steps/en/ (Accessed: 10 February 2020).
WHO | World Health Survey (no date). Available at: https://www.who.int/healthinfo/survey/en/ (Accessed: 10 February 2020).
WHO, WFP and UNICEF (2007) Preventing and controlling micronutrient deficiencies in populations affected by an emergency.
Willett, W. et al. (2019) ‘Food in the Anthropocene: the EAT–Lancet Commission on healthy diets from sustainable food systems’, The Lancet, 393(10170), pp. 447–492. doi: 10.1016/S0140-6736(18)31788-4.
Yip, C. S. C., Chan, W. and Fielding, R. (2019) ‘The Associations of Fruit and Vegetable Intakes with Burden of Diseases: A Systematic Review of Meta-Analyses’, Journal of the Academy of Nutrition and Dietetics. Elsevier B.V., 119(3), pp. 464–481. doi: 10.1016/j.jand.2018.11.007.