Review for Analysis and Use of Financial Statements
91
Review for Analysis and Use of Financial Statements
-
Upload
micah-love -
Category
Documents
-
view
32 -
download
4
description
Review for Analysis and Use of Financial Statements. Financial Reporting Mechanics. Learning Outcome Statements (LOS). After completing this session, students should be able to: - PowerPoint PPT Presentation
Transcript of Review for Analysis and Use of Financial Statements

Review for Analysis and Use of
Financial Statements

2
Financial Reporting Mechanics

3
Learning Outcome Statements (LOS)
After completing this session, students should be able to:1. identify the groups (operating, investing and financing
activities) into which business activities are categorized for financial reporting purposes and classify any business activity into the appropriate group.
2. state fundamental principles for preparing financial statements as stated in IAS No.1

4
Categories of Business Activities
Business transactions can be categorized as:
1) Operating activities- the firm’s ordinary business.
2) Investing activities- purchasing, selling and disposing of long-term assets.
3) Financing activities- raising and repaying capital.
5
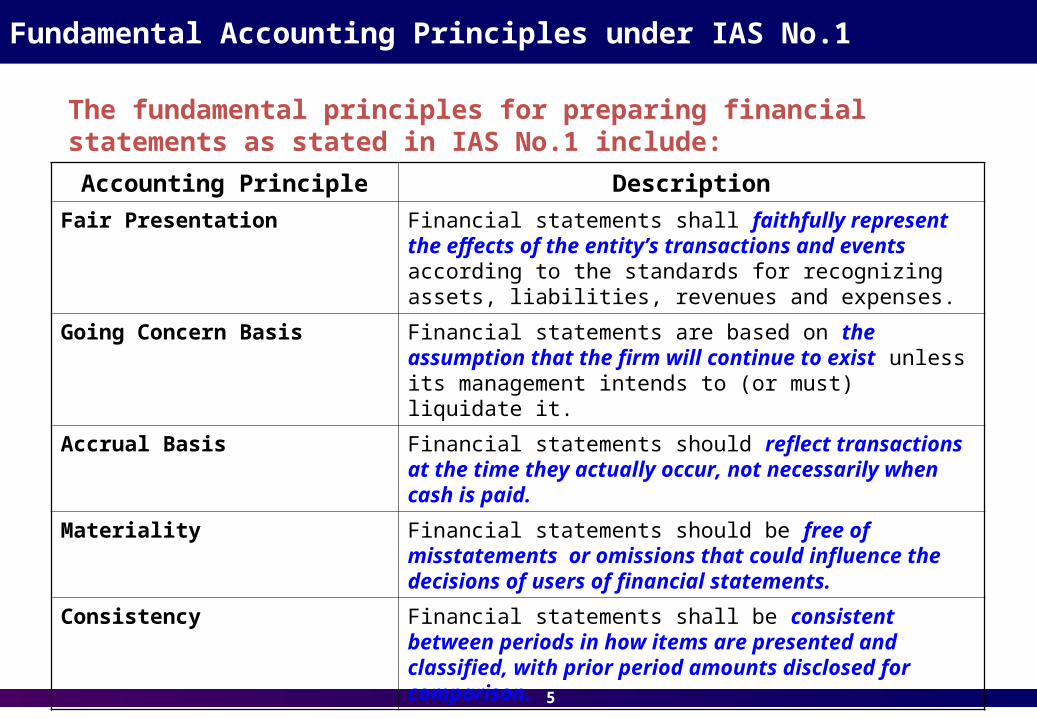
Fundamental Accounting Principles under IAS No.1
Accounting Principle Description
Fair Presentation Financial statements shall faithfully represent the effects of the entity’s transactions and events according to the standards for recognizing assets, liabilities, revenues and expenses.
Going Concern Basis Financial statements are based on the assumption that the firm will continue to exist unless its management intends to (or must) liquidate it.
Accrual Basis Financial statements should reflect transactions at the time they actually occur, not necessarily when cash is paid.
Materiality Financial statements should be free of misstatements or omissions that could influence the decisions of users of financial statements.
Consistency Financial statements shall be consistent between periods in how items are presented and classified, with prior period amounts disclosed for comparison.
The fundamental principles for preparing financial statements as stated in IAS No.1 include:

6
Understanding the Income Statement

7
Learning Outcome Statements (LOS)
After completing this session, students should be able to:
1.explain the general principles of revenue recognition and accrual accounting.
2.discuss the general principle of expense recognition and the implications of expense recognition principles for financial analysis.
8
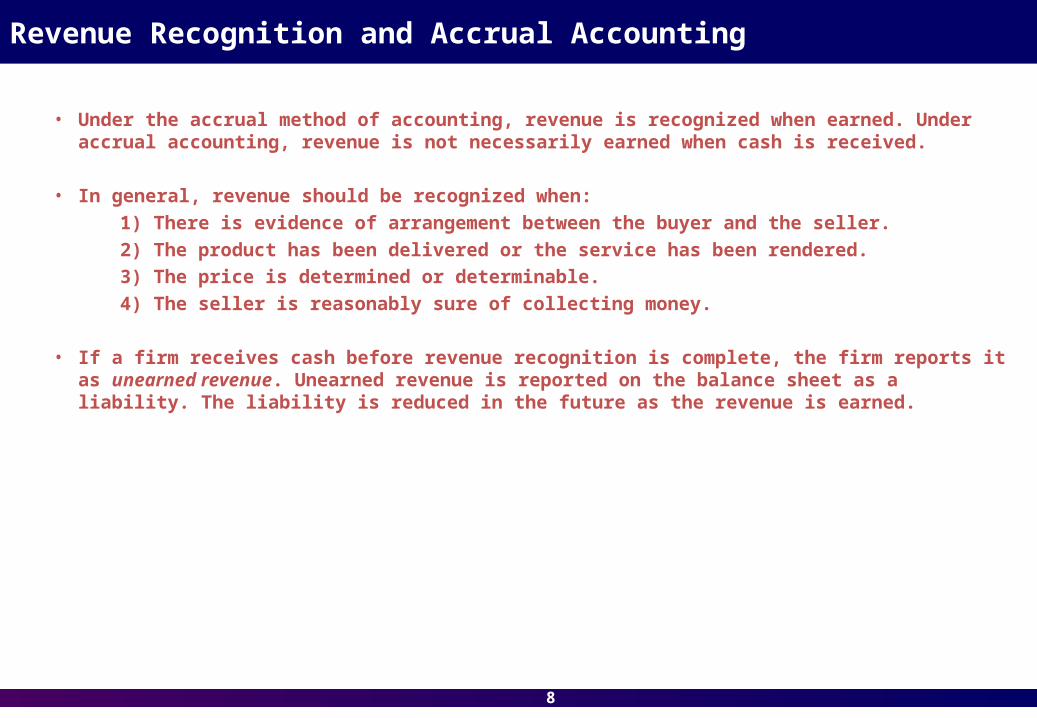
Revenue Recognition and Accrual Accounting
• Under the accrual method of accounting, revenue is recognized when earned. Under accrual accounting, revenue is not necessarily earned when cash is received.
• In general, revenue should be recognized when:
1) There is evidence of arrangement between the buyer and the seller.
2) The product has been delivered or the service has been rendered.
3) The price is determined or determinable.
4) The seller is reasonably sure of collecting money.
• If a firm receives cash before revenue recognition is complete, the firm reports it as unearned revenue. Unearned revenue is reported on the balance sheet as a liability. The liability is reduced in the future as the revenue is earned.

9
Matching Principle and Implications for Financial Analysis
• Under the accrual method of accounting, expense recognition is based on the matching principle.
• Under the matching principle, expenses to generate revenue are recognized in the same period as the revenue.
• Not all expenses can be directly tied to revenue recognition. These costs are known as period costs. Period costs, such as administrative costs, are expensed in the period incurred.
• Like revenue recognition, expense recognition requires a number of estimates. Since estimates are involved, it is possible for firms to delay or accelerate the recognition of expenses. Delayed expense recognition increases current net income and is therefore more aggressive.

10
Understanding the Balance Sheet

11
Learning Outcome Statements (LOS)
After completing this session, students should be able to:
1.illustrate accounting treatment for marketable securities including held-to-maturity securities, trading securities and available-for-sale securities
2.list and explain the components of owners’ equity.

12
Marketable Securities
• Marketable investment securities are classified as either held-to-maturity, trading or available-for-sale.
• Held-to-maturity securities are debt securities acquired with the intent that they will be held to maturity. Held-to-maturity securities are reported on the balance sheet at amortized cost. Subsequent changes in the market value are ignored.
• Trading securities are debt and equity securities acquired with the intent to profit over the near term. They are reported on the balance sheet at fair value. Unrealized gains and losses that are changes in market value before the securities are sold are reported in the income statement.
• Available-for-sale securities are debt and equity securities that are not expected to be held to maturity or traded in the near term. They are reported on the balance sheet at fair value. However, any unrealized gains and losses are not recognized in the income statement but are reported in other comprehensive income as a part of owners’ equity.
• Dividend and interest income and realized gains and losses (actual gains or losses when the securities are sold) are recognized in the income statement for all three classifications of securities.

13
Summary of Investment Security Classifications
Trading Securities
Available-for-Sale Securities
Held-to-Maturity Security
Balance Sheet Fair value Fair value Amortized cost
Income Statement Dividend,
Interest,
Realized gains/losses,
Unrealized gains/losses
Dividend,
Interest,
Realized gains/losses
Interest,
Realized gains/losses

14
Investment Security Classifications: An Example
Triple D Corporation purchased a 6 % bond, at par, for $1,000,000 at the beginning of the year. Interest rates have recently increased and the market value of the bond declined $20,000 Determine the bond’s effect on Triple D’s financial statements under each classification of securities.
Classification of Securities Financial Statement Effects
Held-to-Maturity Securities • The bond is reported on the balance sheet at $1,000,000.
• Interest income of $60,000 ($1,000,000 x 6%) is reported in income statement.
Trading Security • The bond is reported on the balance sheet at $ 980,000.
• Interest income of $60,000 ($1,000,000 x 6%) and unrealized loss of $20,000 is reported in income statement.
Available-for-Sale Security • The bond is reported on the balance sheet at $ 980,000.
• Interest income of $60,000 ($1,000,000 x 6%) is reported in income statement.
• Unrealized loss of $20,000 is reported as a change in owners' equity.
15
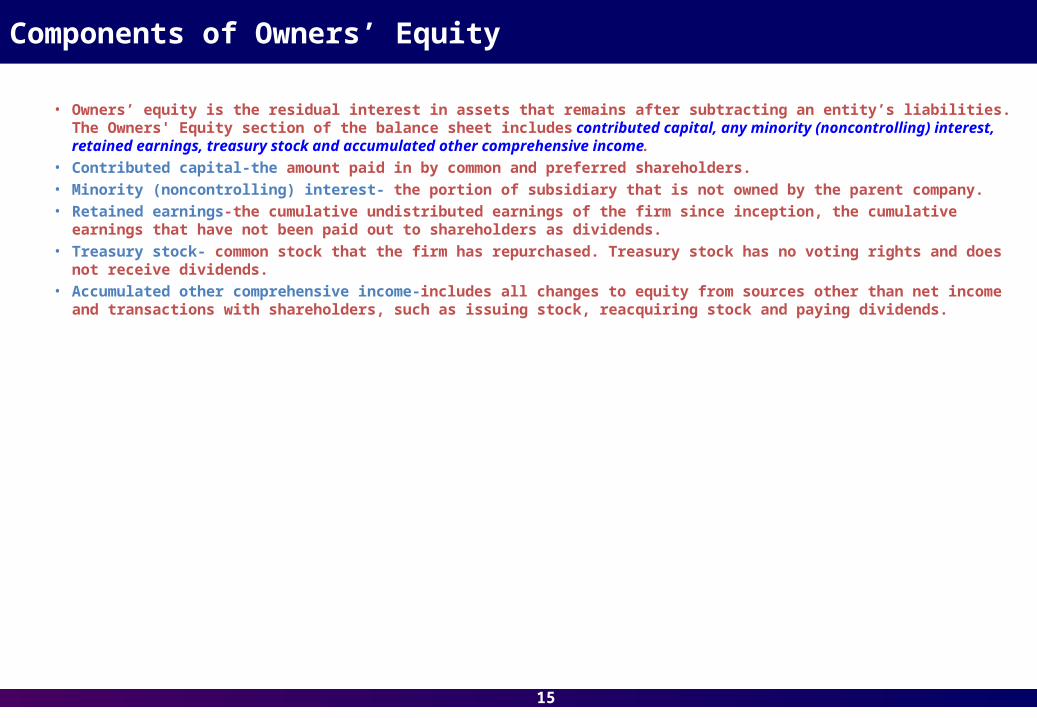
Components of Owners’ Equity
• Owners’ equity is the residual interest in assets that remains after subtracting an entity’s liabilities. The Owners' Equity section of the balance sheet includes contributed capital, any minority (noncontrolling) interest, retained earnings, treasury stock and accumulated other comprehensive income.
• Contributed capital-the amount paid in by common and preferred shareholders.• Minority (noncontrolling) interest- the portion of subsidiary that is not owned by the parent company.• Retained earnings-the cumulative undistributed earnings of the firm since inception, the cumulative earnings that have
not been paid out to shareholders as dividends.• Treasury stock- common stock that the firm has repurchased. Treasury stock has no voting rights and does not receive
dividends.• Accumulated other comprehensive income-includes all changes to equity from sources other than net income and
transactions with shareholders, such as issuing stock, reacquiring stock and paying dividends.

16
Understanding the Cash Flow Statement

17
Learning Outcome Statements (LOS)
After completing this session, students should be able to:
1. compare and contrast cash flows from operating, investing and financing activities.
2. classify cash flow items as relating to cash flows from operating, investing and financing activities, given a description of the items.
3. analyze and interpret a cash flow statement.
4. illustrate the statement of cash flow presentation.

18
Cash Flows from Operating, Investing and Financing Activities
• Items on the cash flow statement come from two sources: 1) income statement items and 2) change in balance sheet accounts.
• A firm’s cash receipts and payments are classified on the cash flow statement as either operating, investing or financing activities.
• Cash flow from operating activities (CFO), sometimes referred to as “cash flow from operations" or “operating cash flow," consists of the inflows and outflows of cash resulting from transactions related to a firm’s normal operation.
• Cash flow from investing activities (CFI) consists of the inflows and outflows of cash resulting from the acquisition or disposal of long-term assets and certain investments.
• Cash flow from financing activities (CFF) consists of the inflows and outflows of cash resulting from transactions affecting the firm’s capital structure.

19
Classification of Cash Flow Items on the Cash Flow Statement
Inflows Outflows
Operating Activities
• Cash collected from customers
• Interest and dividends received
• Cash paid to employees and suppliers
• Cash paid for operating expenses
• Interest paid
• Taxes paid
Investing Activities
• Sale proceeds from fixed assets
• Sale proceeds from debt & equity
investments
• Principal received from loans made to
others
• Acquisition of fixed assets
• Acquisition of debt & equity
investments
• Loans made to others
Financing Activities
• Principal amounts of debt issued
• Proceeds from issuing stock
• Principal paid on debt
• Payments to reacquire stock
• Dividends paid to shareholders

20
Direct and Indirect Methods of Cash Flow Statement
• There are two methods of presenting the cash flow statement: the direct method and the indirect method. • The difference between the two methods relates to the presentation of cash flow from operating activities. The
presentation of cash flows from investing activities and financing activities is exactly the same under both methods.
• Under the direct method, each line item of the accrual-based income statement is converted into cash receipts or cash payments.
• Under the indirect method, net income is converted to operating cash flow by making adjustments for transactions that affect net income but are not cash transactions. The adjustments include eliminating noncash expenses (e.g., depreciation and amortization), nonoperating items (e.g., gains and losses) and changes in balance sheet accounts resulting from accrual accounting events.

21
Direct Method of Presenting Operating Cash Flow
Seagraves Supply Company
Operating Cash Flow-Direct Method
For the Year ended December 31, 20xx
Cash collections from customers $1,000,000
Cash paid to suppliers ($200,000)
Cash paid for operating expenses ($100,000)
Cash paid for interest ($90,000)
Cash paid for taxes ($200,000)
Operating cash flow $410,000
Notice the similarities of the direct method cash flow presentation and an income statement. The direct method begins with cash inflows from customers and then deduct cash outflows for purchases, operating
expenses, interest and taxes.

22
Indirect Method of Presenting Operating Cash Flow
Seagraves Supply Company
Operating Cash Flow-Indirect Method
For the Year ended December 31, 20xx
Net Income $300,000
Adjustments to reconcile net income to cash flow provided by operating activities
Depreciation and Amortization $100,000
Increase in Accounts Receivable ($50,000)
Increase in Inventory ($80,000)
Decrease in Prepaid Expenses $20,000
Increase in Accounts Payable $30,000
Increase in Accrued Liabilities $40,000
Operating Cash Flow $360,000
23
Techniques for Analyzing Financial Statements
24
Learning Outcome Statements (LOS)
After completing this session, students should be able to:
1.describe the limitations of ratio analysis.2.calculate, classify and interpret activity, liquidity,
solvency, and profitability ratios.3.demonstrate the application of and interpret
changes in the component parts of the DuPont analysis (the decomposition of return on equity).
4.calculate the sustainable growth rate for a company.
25
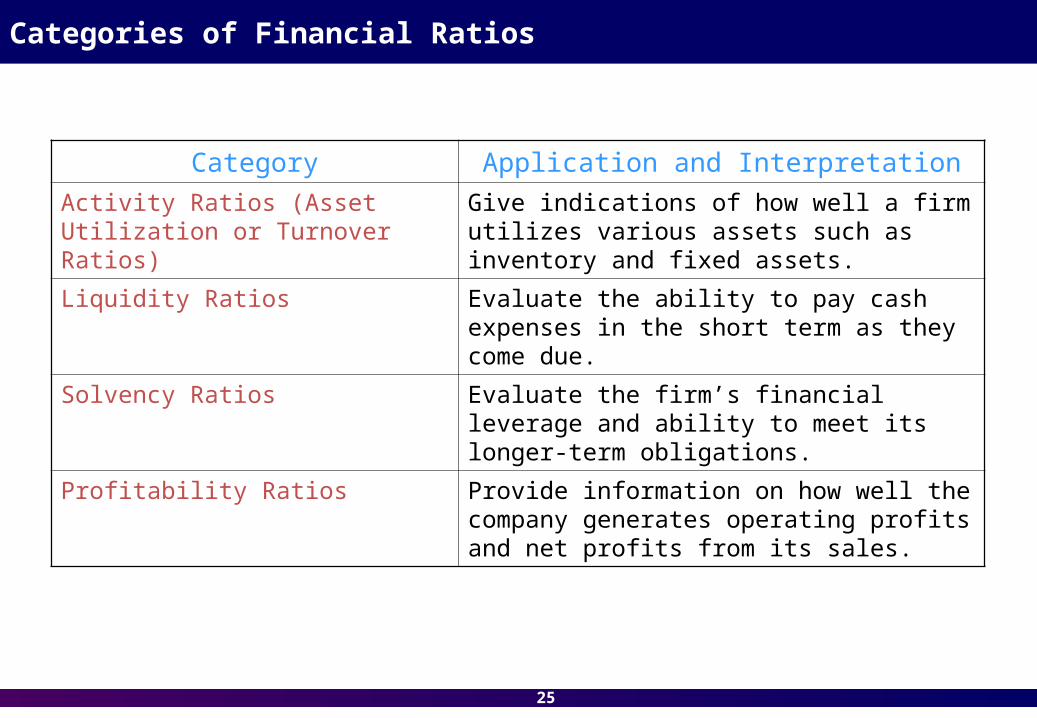
Categories of Financial Ratios
Category Application and Interpretation
Activity Ratios (Asset Utilization or Turnover Ratios)
Give indications of how well a firm utilizes various assets such as inventory and fixed assets.
Liquidity Ratios Evaluate the ability to pay cash expenses in the short term as they come due.
Solvency Ratios Evaluate the firm’s financial leverage and ability to meet its longer-term obligations.
Profitability Ratios Provide information on how well the company generates operating profits and net profits from its sales.

26
Activity Ratios
Ratio Calculation Formula Application
Inventory Turnover (x)
Cost of Goods Sold
Average Inventory
A measure of a firm’s efficiency with respect to its processing and inventory management
Days of Inventory on Hand (days)
365
Inventory Turnover
• A processing period that is too high might mean that too much capital is tied up in inventory and could mean the inventory is obsolete.
• A processing period that is too low might indicate the firm has inadequate stock on hand that could hurt sales.
Payables Turnover (x)
Cost of Goods Sold
Average Trade Payables
A measure of the use of trade credit by a firm
Number of Days of Payables (days)
365
Payables Turnover
A measure of a firm’s average amount of time it takes to pay its bills.

27
Activity Ratios (Cont)
Ratio Calculation Formula Application
Accounts Receivable Turnover (x)
Sales
Average Accounts Receivable
A measure of a firm’s efficiency with respect to its processing and accounts receivable management
Days Sales Outstanding (days)
365
Accounts Receivable Turnover
A measure of a firm’s average amount of time it takes to collect its accounts receivable
Working Capital Turnover (x)
Total Revenue
Average Working Capital
A measure of a firm’s effectiveness to use its working capital to create revenue
Total Assets Turnover (x)
Total Revenue
Average Total Assets
A measure of a firm’s effectiveness to use its total assets to create revenue
Fixed Assets Turnover (x)
Total Revenue
Average Net Fixed Assets
A measure of a firm’s effectiveness to use its fixed assets to create revenue

28
Liquidity Ratios
Ratio Calculation Formula Application
Current Ratio (x) Current Assets
Current Liabilities
The higher the current ratio, the more likely it is that the company will be able to pay its short-term bills.
Quick Ratio (x) Cash+Marketable Securities+Receivables
Current Liabilities
The higher the quick ratio, the more likely it is that the company will be able to pay its short-term bills.
Cash Ratio (x) Cash+Marketable Securities
Current Liabilities
The higher the cash ratio, the more likely it is that the company will be able to pay its short-term bills.
Cash Conversion Cycle (days)
Days Sales Outstanding+ Days of Inventory on Hand-Number of Days of Payables
A measure of a firm’s length of time it takes to turn the firm’s cash investment in inventory back into cash, in the form of collections from the sales of that inventory

29
Solvency Ratios
Ratio Calculation Formula Application
Debt-to-Equity (x) Total Debt
Total Shareholders' Equity
•A measure of the firm’s use of fixed-cost financing sources
•Increases and decreases in this ratio suggest a greater or lesser use of debt as a source of financing
Debt-to-Capital (x) Total Debt
Total Debt+Total Shareholders' Equity
Increases and decreases in this ratio suggest a greater or lesser use of debt as a source of financing
Debt-to-Assets (x) Total Debt
Total Assets
Increases and decreases in this ratio suggest a greater or lesser use of debt as a source of financing
Financial Leverage (x)
Average Total Assets
Average Total Equity
Greater use of debt financing increases financial leverage and, typically, risk to equity holders and bondholders alike.
Interest Coverage (x) Earnings before Interest and Taxes
Interest Payments
A measure of the firm’s ability to pay its interest obligations

30
Profitability Ratios
Ratio Calculation Formula Application
Gross Profit Margin (%)
Gross Profit
Total Sales Revenue
The ratio of gross profit (sales-cost of good sold) to sales revenue
Operating Profit Margin (%)
Operating Profit
Total Sales Revenue
The ratio of operating profit (gross profit-SG&A expenses) to sales revenue
EBIT Margin (%) EBIT
Total Revenue
The ratio of EBIT (total revenue-cost of goods sold-SG&A expenses) to total revenue
EBITDA Margin (%) EBITDA
Total Revenue
The ratio of EBITDA (EBIT+Depreciation+Amortization) to total revenue
Pretax Margin (%) Earnings before Taxes
Total Revenue
The ratio of pretax income to total revenue
Net Profit Margin (%) Net Profit
Total Revenue
The ratio of net income to total revenue

31
Profitability Ratios (Cont)
Ratio Calculation Formula Application
Return on Total Assets (ROA) (%)
Net Income
Average Total Assets
The ratio of net income to average total assets
Return on Total Capital (ROTC) (%)
EBIT
Average Total Capital
The ratio of EBIT to average total capital
Return on Equity (ROE) (%)
Net Income
Average Total Equity
The ratio of net income to average total equity

32
Limitations of Ratio Analysis
• Financial ratios are not useful when viewed in isolation. They are
valid only when compared to those of other firms or to the
company’s historical performance.
• Comparisons with other companies are made more difficult due to
different accounting treatments across firms.
• It is difficult to find comparable industry ratios when analyzing
companies that operate in multiple industries.
• Conclusions cannot be made from viewing one set of ratios. All
ratios must be viewed relative to one another.

33
Decomposition of ROE Using the DuPont Analysis
• The DuPont system of analysis is an approach that can be used to analyze return on equity (ROE).
• The DuPont System can be expressed in the so-called “three-part approach”.
• For the original approach, ROE could be expressed as:
ROE = Net Income
Equity
• We can also expand the ROE formula above into the following formula:
ROE = Net Income X Net Sales X Total Assets
Net Sales Total Assets Total Equity
ROE = Net Profit Margin X Total Assets Turnover X Leverage Ratio
34
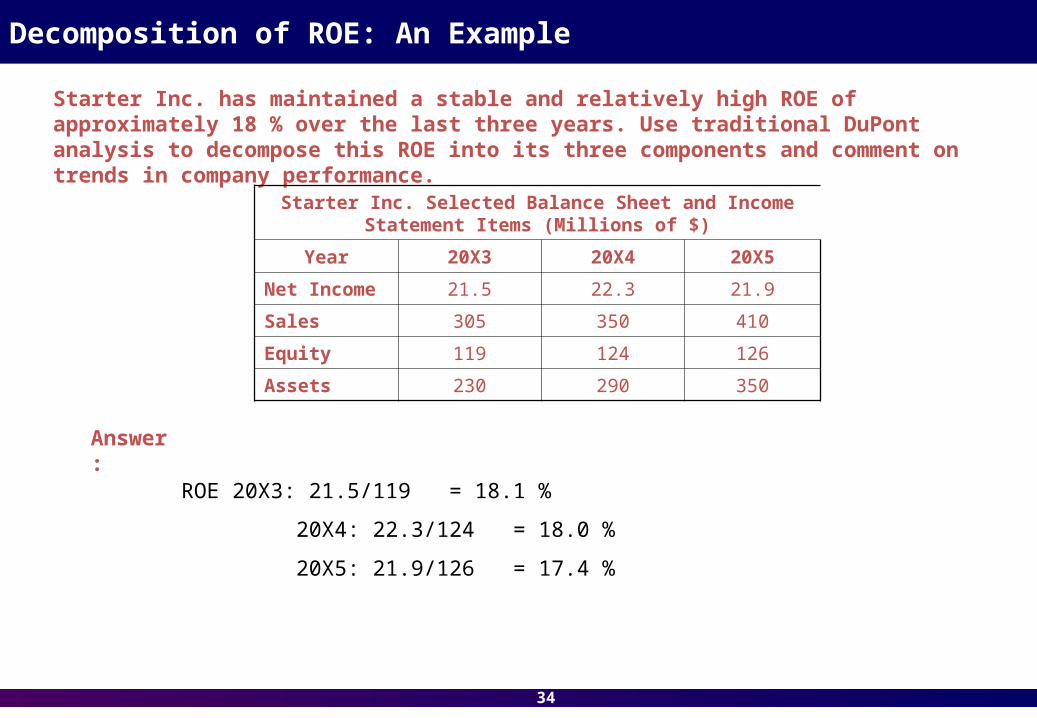
Decomposition of ROE: An Example
Starter Inc. has maintained a stable and relatively high ROE of approximately 18 % over the last three years. Use traditional DuPont analysis to decompose this ROE into its three components and comment on trends in company performance.
Starter Inc. Selected Balance Sheet and Income Statement Items (Millions of $)
Year 20X3 20X4 20X5
Net Income 21.5 22.3 21.9
Sales 305 350 410
Equity 119 124 126
Assets 230 290 350
Answer:
ROE 20X3: 21.5/119 = 18.1 %
20X4: 22.3/124 = 18.0 %
20X5: 21.9/126 = 17.4 %

35
Decomposition of ROE: An Example (Cont)
Starter Inc. Selected Balance Sheet and Income Statement Items (Millions of $)
Year 20X3 20X4 20X5
Net Income 21.5 22.3 21.9
Sales 305 350 410
Equity 119 124 126
Assets 230 290 350
Answer:
ROE 20X3: (21.5/305) x (305/230) x (230/119) = 7.0 % x 1.33 x 1.93 = 18.1 %
20X4: (22.3/350) x (350/290) x (290/124) = 6.4 % x 1.21 x 2.34 = 18.0 %
20X5: (21.9/410) x (410/350) x (350/126) = 5.3 % x 1.17 x 2.78 = 17.4 %
• While the ROE has dropped only slightly, both the total assets turnover and the net profit margin have declined.
• The effects of declining net margins and assets turnover on ROE have been offset by a significant increase in leverage. The company has become more risky due to increased debt financing.
36
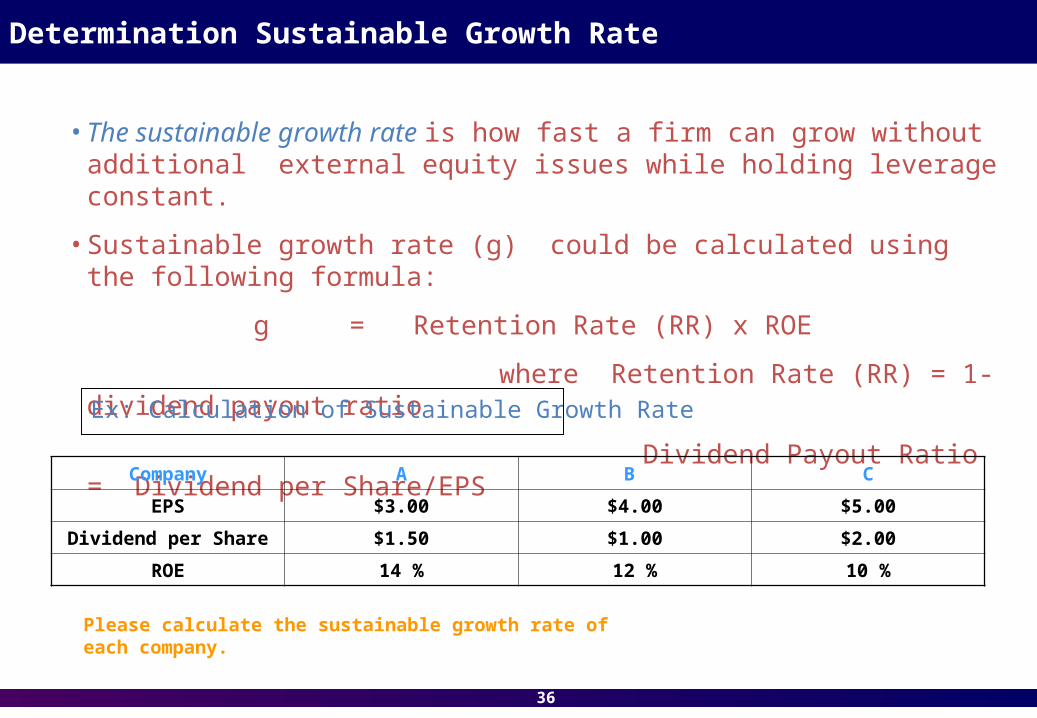
Determination Sustainable Growth Rate
• The sustainable growth rate is how fast a firm can grow without additional external equity issues while holding leverage constant.
• Sustainable growth rate (g) could be calculated using the following formula:
g = Retention Rate (RR) x ROE
where Retention Rate (RR) = 1- dividend payout ratio
Dividend Payout Ratio = Dividend per Share/EPS
Ex: Calculation of Sustainable Growth Rate
Company A B C
EPS $3.00 $4.00 $5.00
Dividend per Share $1.50 $1.00 $2.00
ROE 14 % 12 % 10 %
Please calculate the sustainable growth rate of each company.

37
Determination Sustainable Growth Rate (Cont)
Company A B C
EPS $3.00 $4.00 $5.00
Dividend per Share $1.50 $1.00 $2.00
ROE 14 % 12 % 10 %
RR = 1-dividend payout ratio
RRA = 1- (1.50/3.00) = 1-0.50 = 0.50
RRB = 1- (1.00/4.00) = 1-0.25 = 0.75
RRC = 1- (2.00/5.00) = 1-0.40 = 0.60
g = RR x ROE
gA = 0.50 x 14 % = 7 %
gB = 0.75 x 12 % = 9 %
gC = 0.60 x 10 % = 6 %
38
Intercorporate Investments
39
Learning Outcome Statements (LOS)
After completing this session, students should be able to:1. determine whether a debt security or equity security should be
classified as held to maturity, available for sale or as trading security.
2. compute the effect of debt-security and equity-security classification on financial statements and financial ratios.
3. determine, given various ownership and/or control levels and relevant accounting standards, whether the cost method, the equity method or the consolidation method should be used.
4. compute and compare the effects of using the cost method, the equity method and the consolidation method on a company’s financial statements and financial ratios.
40
Categories of Intercorporate Investments
• Intercorporate investments are categorized as either:
(1) Investments in financial assets (when the investing firm has no
significant control over the operations of the investee firm)
(2) Investments in associates (when the investing firm has significant
influence over the operations of the investee firm, but not control
(3) Business combinations (when the investing firm has control over
the operations of the investee firm).
• Percentage of ownership (or voting control) is typically used to determine the appropriate category for financial reporting purposes.
• However, the ownership percentage is only a guideline. Ultimately, the category is based on the investor’s ability to influence or control the investee.

41
Categories of Financial Assets
• An ownership interest of less than 20 % is usually considered a passive investment. In this case, the investor cannot significantly influence or control the investee.
• Investments in financial assets could be classified as:
1) Held-to-maturity
2) Available-for-sale
3) Held-for-trading• Debt securities held-to-maturity are securities that a company has the positive intent and ability to hold to maturity. These securities are carried
at amortized cost and cannot be sold prior to its maturity except under unusual circumstances. This classification applies only to debt securities. It does not apply to equity investments.
• Debt and equity securities available-for-sale may be sold to address the liquidity and other needs of a company. They are carried at fair market value on the balance sheet.
• Debt and equity trading securities are securities acquired for the purpose of selling them in the near term. They are measured at fair market value and are listed as current assets on the balance sheet.
42
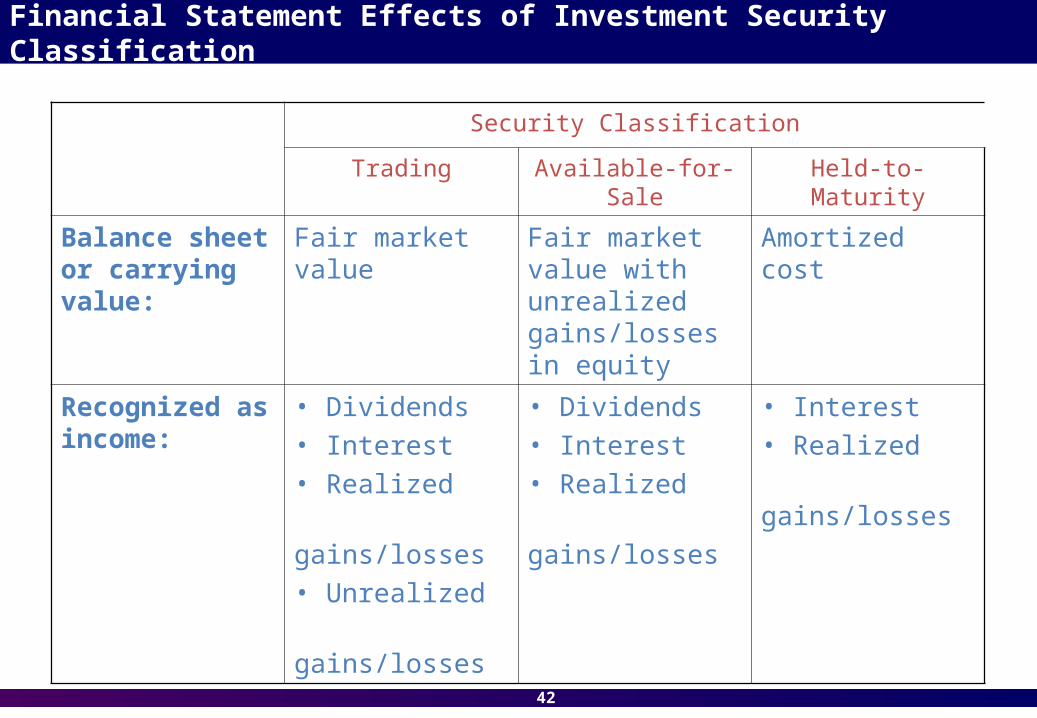
Financial Statement Effects of Investment Security Classification
Security Classification
Trading Available-for-Sale Held-to-Maturity
Balance sheet or carrying value:
Fair market value Fair market value with unrealized gains/losses in equity
Amortized cost
Recognized as income:
• Dividends• Interest• Realized
gains/losses• Unrealized
gains/losses
• Dividends• Interest• Realized
gains/losses
• Interest• Realized
gains/losses

43
Example: Investment in Financial Assets
At the beginning of the year, Midland Corporation purchased a 9 %bond with a fair value of $100,000. The bond was issued for $96,209 to yield 10 %. The coupon payments are made annually at year-end. The fair value of the bond at the end of the year is $98,500.
Determine the impact on Midland’s balance sheet and income statement if the bond investment is classified as held-to-maturity, held-for-trading and available-for-sale.
Held-to-Maturity
• The balance sheet value is based on amortized cost. At year-end, Midland recognizes interest revenue of $9,621 ($96,209 beginning bond investment x 10 % market rate at issuance).
• The interest revenue includes the coupon payment of $9,000 ($100,000 face value x 9 % coupon rate) and the amortized discount of $621 ($9,621 interest revenue-$9,000 coupon payment).
• At year-end, the bond is reported on the balance sheet at $96,830 ($96,209 beginning bond investment +$621 amortized discount).

44
Example: Investment in Financial Assets
Held-for-Trading
• The balance sheet value is based on fair value of $98,500.
• Interest revenue of $9,000 ($100,000 x 9 % coupon rate) is recognized in the income statement.
• An unrealized gain of $2,291 ($98,500 fair value-$96,209 beginning bond investment) is also recognized in the income statement.
Available-for-Sale
• The balance sheet value is based on fair value of $98,500.
• Interest revenue of $9,000 ($100,000 x 9 % coupon rate) is recognized in the income statement.
• An unrealized gain of $2,291 ($98,500 fair value-$96,209 beginning bond investment) is reported in stockholders’ equity as a component of other comprehensive income.
45
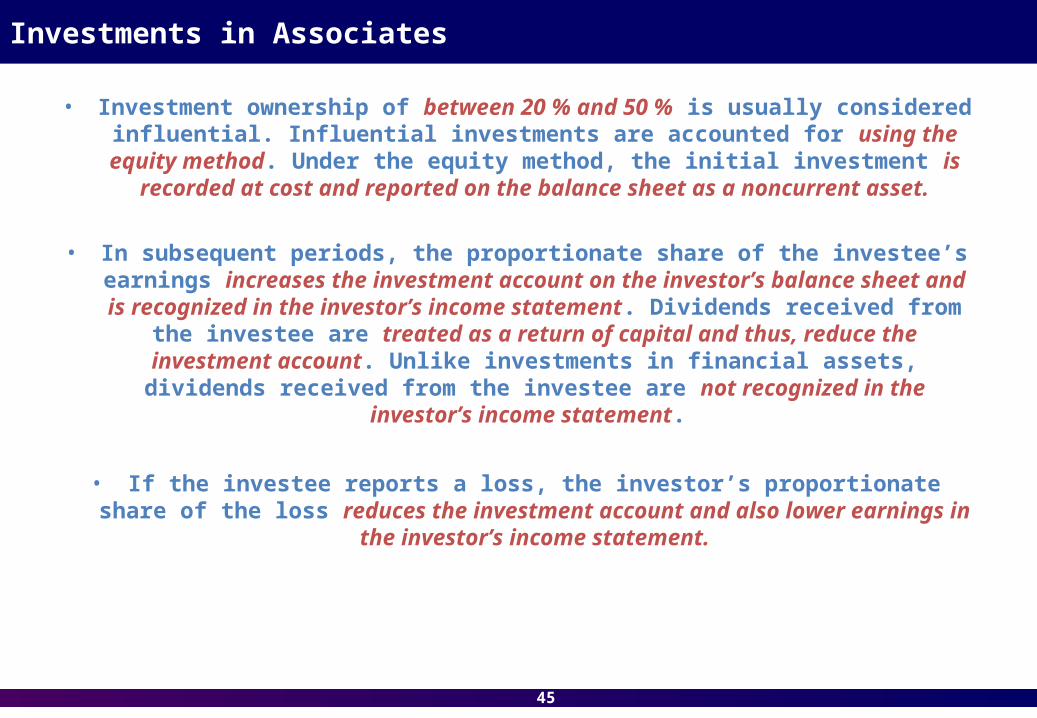
Investments in Associates
• Investment ownership of between 20 % and 50 % is usually considered influential. Influential investments are accounted for using the equity
method. Under the equity method, the initial investment is recorded at cost and reported on the balance sheet as a noncurrent asset.
• In subsequent periods, the proportionate share of the investee’s earnings increases the investment account on the investor’s balance sheet and is
recognized in the investor’s income statement. Dividends received from the investee are treated as a return of capital and thus, reduce the investment
account. Unlike investments in financial assets, dividends received from the investee are not recognized in the investor’s income statement.
• If the investee reports a loss, the investor’s proportionate share of the loss reduces the investment account and also lower earnings in the investor’s
income statement.

46
Example: Implementing the Equity Method
Assume the following:• December 31, 20X5, Company P (the investor) invests $1,000 in return for 30 % of the common
shares of Company S (the investee). • During 20X6. Company S earns $400 and pays dividends of $100.• During 20X7, Company S earns $600 and pays dividends of $150
Calculate the effects of the investment on Company P’s balance sheet, reported income and cash flow for 20X6 and 20X7.
Under the equity method for 20X6, Company P will:
• Recognize $120 ($400 x 30 %) in the income statement from its proportionate share of the net income of Company S.
• Increase its investment account on the balance sheet by $120 to $1,120, reflecting its proportionate share of the net assets of Company S.
• Receive $30 ($100 x 30 %) in cash dividends from Company S and reduce its investment in Company S by that amount to reflect the decline in the net assets of Company S due to the dividend payments.
• At the end of 20X6, the carrying value of Company S on Company P’s balance sheet will be $1,090 ($1,000+$120-$30).
20X6
47
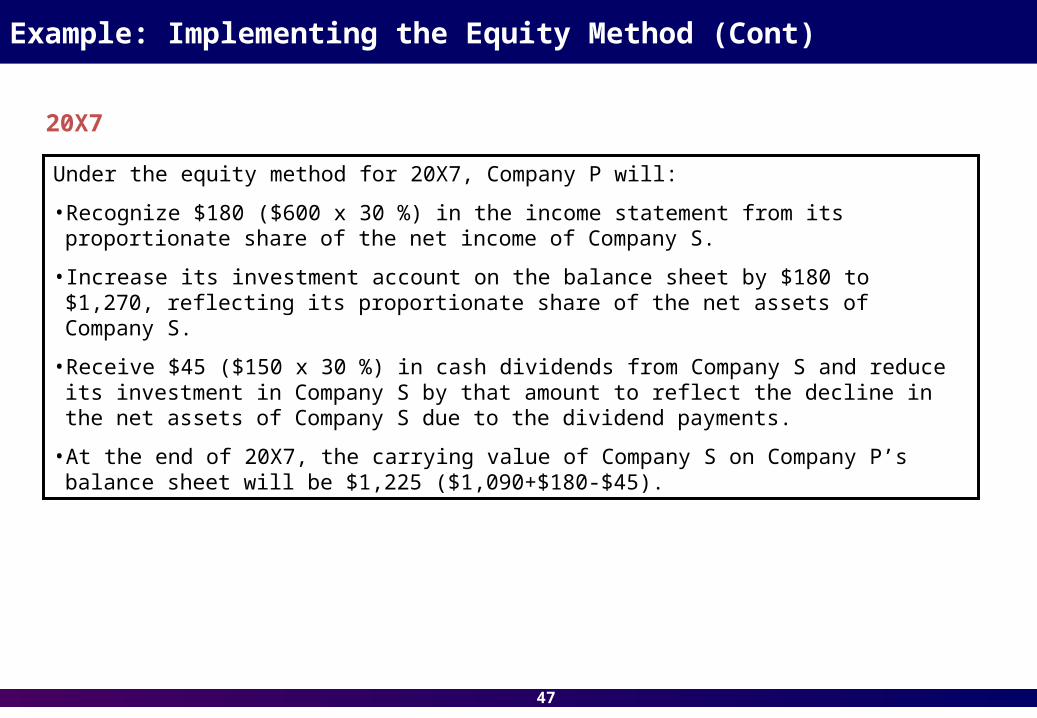
Example: Implementing the Equity Method (Cont)
Under the equity method for 20X7, Company P will:
• Recognize $180 ($600 x 30 %) in the income statement from its proportionate share of the net income of Company S.
• Increase its investment account on the balance sheet by $180 to $1,270, reflecting its proportionate share of the net assets of Company S.
• Receive $45 ($150 x 30 %) in cash dividends from Company S and reduce its investment in Company S by that amount to reflect the decline in the net assets of Company S due to the dividend payments.
• At the end of 20X7, the carrying value of Company S on Company P’s balance sheet will be $1,225 ($1,090+$180-$45).
20X7

48
Consolidated Method
• Direct or indirect ownership of more than 50 % of the voting shares requires the parent to use consolidated reporting.
• Consolidated reporting results in two firms being presented as one economic entity, even though the firms may be separate legal entities.
• All income of the affiliate (less any minority interests) is reported on the parent’s income statement.
• There are two exceptions: (1) if control is temporary or (2) if barriers to control exist such as governmental intervention, bankruptcy, civil order,
or if a nonconvertible currency is involved. These exceptions exist to accommodate situations where the parent cannot use the subsidiaries’
assets or control its actions.
49
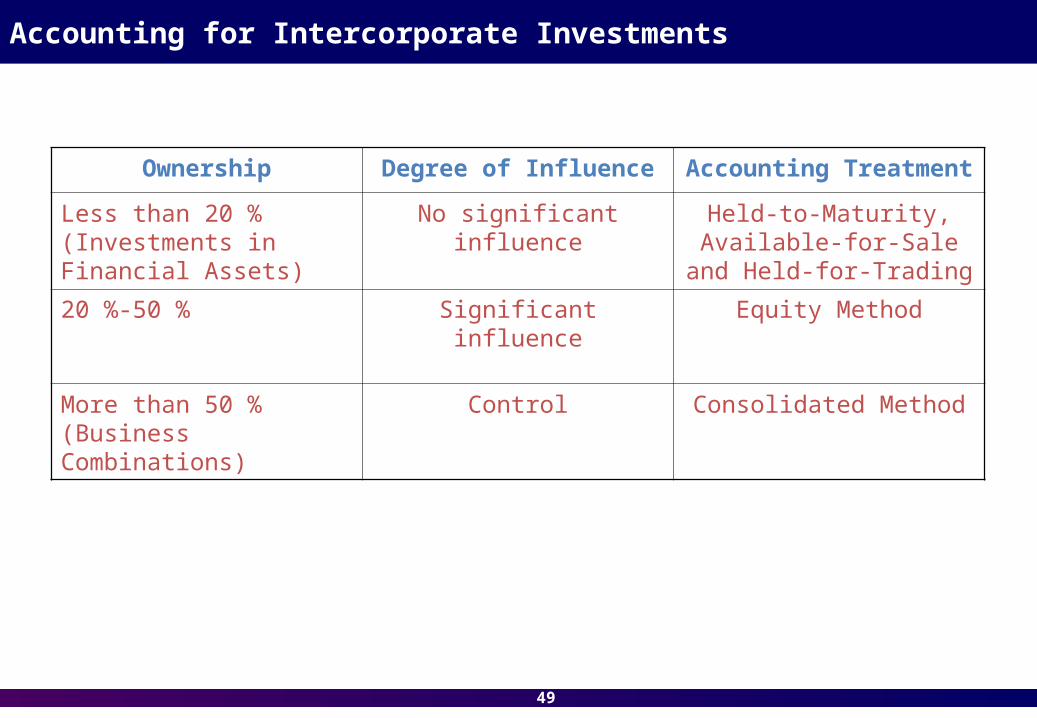
Accounting for Intercorporate Investments
Ownership Degree of Influence Accounting Treatment
Less than 20 % (Investments in Financial Assets)
No significant influence Held-to-Maturity, Available-for-Sale and Held-for-
Trading
20 %-50 % Significant influence Equity Method
More than 50 % (Business Combinations)
Control Consolidated Method
50
Earnings per Share (EPS)
51
Learning Outcome Statements (LOS)
After completing this session, students should be able to:
1. differentiate between a simple capital structure and a complex capital structure.
2. understand the difference between basic EPS and diluted EPS.
3. compute basic EPS given required information.
4. explain the effect of stock dividends on computation of basic EPS.

52
Earnings per share (EPS): What is it?
• Earnings per share (EPS) is one of the most commonly used corporate profitability performance measures for both publicly-traded and non-
publicly traded firms.
• EPS is reported only for shares of common stock.
• A company may have either a simple or complex capital structure.
• A simple capital structure is one that contains no potentially dilutive securities. A simple capital structure contains only common stock,
nonconvertible debt and nonconvertible preferred stock.
• A complex capital structure is one that contains potentially dilutive securities such as options, warrants or convertible securities.

53
Basic EPS
• The basic EPS calculation does not consider the effects of any dilutive securities in the computation of EPS.
• Basic EPS could be computed using the following formula:
Basic EPS = Net Income-Preferred Dividends
Weighted average number of
common shares outstanding
• The current year’s preferred dividends are subtracted from net income as EPS refers to the per-share earnings available to common shareholders. Net income minus preferred dividends is the income available to common stockholders.
• The weighted average number of common shares outstanding is the number of common shares outstanding during the year, weighted by the portion of the year they were outstanding.
54
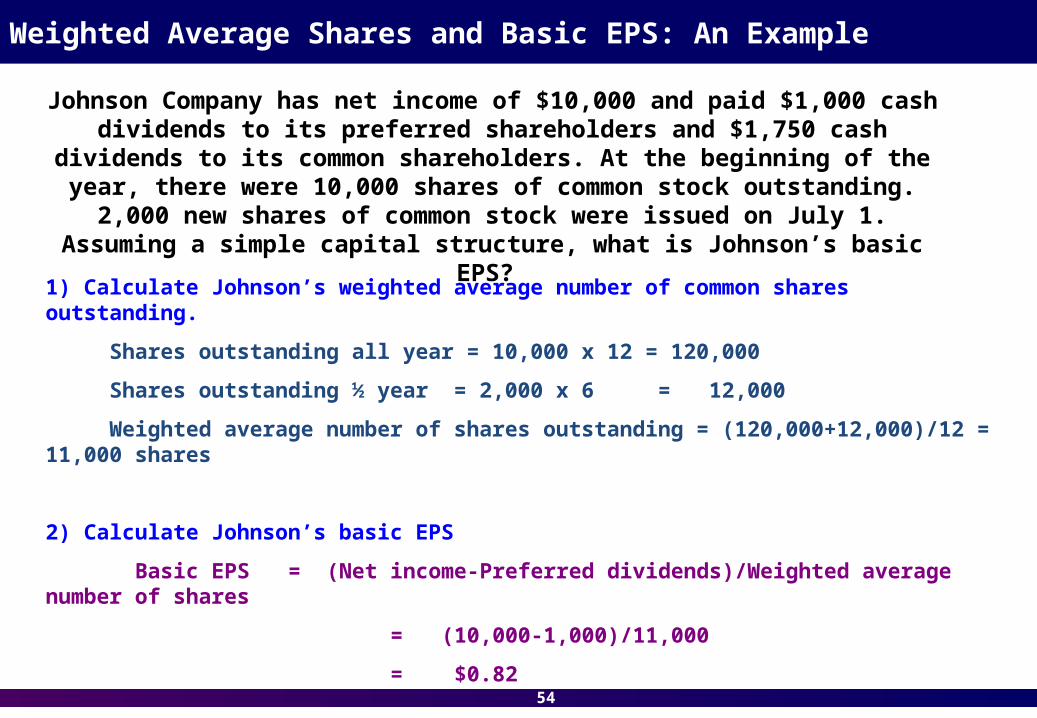
Weighted Average Shares and Basic EPS: An Example
Johnson Company has net income of $10,000 and paid $1,000 cash dividends to its preferred shareholders and $1,750 cash dividends to its common shareholders. At the beginning of the year, there were 10,000 shares of
common stock outstanding. 2,000 new shares of common stock were issued on July 1. Assuming a simple capital structure, what is Johnson’s basic EPS?
1) Calculate Johnson’s weighted average number of common shares outstanding.
Shares outstanding all year = 10,000 x 12 = 120,000
Shares outstanding ½ year = 2,000 x 6 = 12,000
Weighted average number of shares outstanding = (120,000+12,000)/12 = 11,000 shares
2) Calculate Johnson’s basic EPS
Basic EPS = (Net income-Preferred dividends)/Weighted average number of shares
= (10,000-1,000)/11,000
= $0.82

55
Effect of Stock Dividends on Basic EPS
• A stock dividend is the distribution of additional shares to each shareholder in an amount proportion to their current number of
shares. If a 10 % stock dividend is paid, the holder of 100 shares of stock would receive 10 additional shares.
• The important thing to remember is that each shareholder’s proportional ownership in the company is unchanged by a stock
dividend. Each shareholder has more shares but the same percentage of the total shares outstanding.
• A stock dividend is applied to all shares outstanding prior to the dividend and to the beginning-of-period weighted average shares. A
stock dividend adjustment is not applied to any shares issued or repurchased after the dividend date.

56
Effect of Stock Dividends: An Example
During the past year, Johnson Company had net income of $100,000, paid dividends of $50,000 to its preferred shareholders, and paid $30,000 in
dividends to its common shareholders. Johnson Company’s common stock account showed the following:
January 1 Shares issued and outstanding at the beginning of the year
10,000
April 1 New shares issued 4,000
July 1 10 % stock dividend
September 1 Shares repurchased for the treasury 3,000
Compute the weighted average number of common shares outstanding during the year and compute EPS.

57
Effect of Stock Dividends: An Example (Cont)
1) Adjust the number of pre-stock-dividend shares to post-stock-dividend units (to reflect the 10 % stock dividend) by multiplying all share numbers prior to the stock dividend by 1.1. Shares issued or retired after the stock dividend are not affected.
January 1 Initial shares adjusted for the 10 % stock dividend 11,000
(10,000 x1.1)
April 1 New shares issued adjusted for the 10 % stock Dividend
4,400
(4,000 x 1.1)
September 1 Shares of treasury stock repurchased (no adjustment)
-3,000

58
Effect of Stock Dividends: An Example (Cont)
Initial Shares 11,000 x 12 months outstanding 132,000
Issued Shares 4,400 x 9 months outstanding 39,600
Retired Treasury Shares -3,000 x 4 months outstanding -12,000
Total Share-Month 159,600
Average Shares 159,600/12 13,300
2) Compute the weighted average number of post-stock dividend shares.
3) Calculate Johnson’s basic EPS Basic EPS = (Net income-Preferred dividends)/Weighted average number of shares = (100,000-50,000)/13,300 = $3.76

59
Long-Lived Assets

60
Learning Outcome Statements (LOS)
After completing this session, students should be able to:
1.discuss the impact of sales or abandoning of long-lived assets on financial statements.
2.define impairment of long-lived tangible assets and explain what effect such impairment has on a company’s financial statements and ratios.
61
Capitalization of Expenditures v.s. Expensing
• When a firm makes an expenditure, it can either capitalize the cost as an asset on the balance sheet or expense the cost in the income statement, depending
on the nature of the expenditure.
• As a general rule, an expenditure that is expected to provide a future economic benefit over multiple accounting periods is capitalized. However, if the future economic benefit is unlikely or highly uncertain, the expenditure is expensed.
• An expenditure that is capitalized is classified as an investing cash flow. An operating expenditure that is not capitalized is classified as an operating cash
flow.
• The cost of capitalized assets is then allocated to each subsequent income statement over the useful life of the asset as depreciation expense (for tangible
assets) or amortization expense ( for intangible assets with finite lives).

62
Capitalized Interest
• When a firm constructs an asset for its own use, the interest that accrues during the construction period is capitalized as a part of the asset’s cost.
• The objective of capitalizing interest is to accurately measure the cost of the asset and to better match the cost with the revenues generated by
the constructed asset. This treatment is required under IFRS.
• The interest rate used to capitalize interest is based on debt specifically related to the construction of the asset.
• Capitalized interest is not reported in the income statement as interest expense. Once construction interest is capitalized, the interest cost is allocated to the income statement through depreciation expense (if the
asset is held for use), or COGS (if the asset is held for sale).

63
Financial Statement Effects of Capitalizing vs. Expensing
Capitalizing Expensing
Total Assets Higher Lower
Shareholders' Equity Higher Lower
Income Variability Lower Higher
Net Income (first year) Higher Lower
Net Income (subsequent years) Lower Higher
Cash flow from operations Higher Lower
Cash flow from investing Lower Higher
Debt Ratio & Debt-to-Equity Ratio Lower Higher
Interest Coverage Ratio (first year) Higher Lower
Interest Coverage Ratio (later years) Lower Higher

64
Impact of Sales and Abandoning of Long-Lived Assets on Financial Statements
• When a long-lived asset is sold, the difference between the sale proceeds and the carrying (book) value of the asset is reported as a gain or loss in
the income statement. The book value is equal to original cost minus accumulated depreciation, adjusted for any impairment charges.
• If the firm presents its cash flow statement using the indirect method, the gain or loss is removed from net income to compute cash flow from
operations. Selling a long-lived asset is still recognized as an investing cash flow.
• If a long-lived asset is abandoned, the treatment is similar to a sale, except there are no proceeds. In this case, carrying value of the abandoned asset is removed from the balance sheet and a loss of that amount is recognized
in the income statement.

65
Impairment of Long-Lived Tangible Assets
• Long-lived tangible assets that are held for use are tested for impairment when events and circumstances indicate the firm may not be able to recover the carrying value through future use. For example, there may have been a significant decline in the MV of the asset or a significant change in the asset’s physical condition.
• Under the IFRS, impairment accounting involves two steps. In the first step, the asset is tested for impairment by applying a recoverability test. If the asset is
impaired, the second step involves measuring the loss.
• Recoverability Test. An asset is considered impaired if the carrying value (original cost less accumulated depreciation) is greater than the asset’s future
undiscounted cash flows.
• Loss Measurement. If the asset is impaired, the impairment loss is equal to the excess of the carrying value over the fair value of the asset (or the
discounted value of future cash flows if the fair value is not known).

66
Impairment of Long-Lived Tangible Assets: An Example
Information related to equipment owned by Brownfield Company is as follows:- Original cost = $900,000- Accumulated depreciation to date = $100,000- Expected future cash flows = $700,000- Fair value = $580,000
Assume Brownfield will continue to use the equipment in the future. Test the asset for impairment and discuss the result.
Answer1) Carrying value of the asset is $800,000 ($900,000-$100,000). As the carrying
value ($800,000) is greater than the expected future cash flows ($700,000), the equipment is impaired.
2) The impairment loss is equal to $220,000 ($800,000-$580,000). Thus, the carrying value of the equipment on the balance sheet is reduced to $580,000
and a $220,000 impairment loss is recognized in the income statement.

67
Impact of Impairment on Financial Statement and Financial Ratios
• Impairment reduces the carrying value of the asset on the balance sheet and is recognized as a loss in the income statement. Thus, impairment will
result in lower assets and lower equity (retained earnings).
• In the year of impairment, ROA and ROE will decrease as earnings are lower. In subsequent periods, ROA and ROE will increase due to higher earnings and lower assets and equity. Asset turnover will also increase
due to the lower assets.
• An impairment loss has no impact on cash flow. The cash flow occurred when the firm paid for the asset.

68
Inventory

69
Learning Outcome Statements (LOS)
After completing this session, students should be able to:1. compute ending inventory balances and cost of goods sold
using the FIFO and the LIFO methods to account for product inventory and explain the relationship among and the usefulness of inventory and cost of goods sold data provided by the FIFO and LIFO methods when prices are 1) stable, 2) decreasing, or 3)increasing.
2. analyze the financial statements of companies using the different methods on cost of goods sold, inventory balances and other financial statement items and describe the effects of the choice of inventory method on profitability, liquidity, activity and solvency ratios.

70
FIFO and LIFO Cost Flow Methods
•Under the FIFO method, the first item purchased (the oldest inventory) is assumed to be the first item sold.
•The advantage of FIFO is that ending inventory is valued based on the most recent purchases, arguably the best approximation of current
replacement cost.
•FIFO COGS is based on the earliest purchase costs.
•When prices are rising, COGS will be understated compared to current replacement cost, as a result, earnings will be overstated.

71
FIFO and LIFO Cost Flow Methods (Cont)
•Under the LIFO method, the item purchased most recently is assumed to be the first item sold.
•LIFO produces better matching in the income statement as COGS and sales revenue are both measures using recent prices.
•When prices are rising, LIFO COGS will be higher than FIFO COGS, and earnings will be lower. Lower earnings translate into lower income
taxes, which increase cash flow.
•Under LIFO, ending inventory on the balance sheet is valued using the earlier costs. Thus, when prices are rising, LIFO ending inventory is
less than replacement value.
72
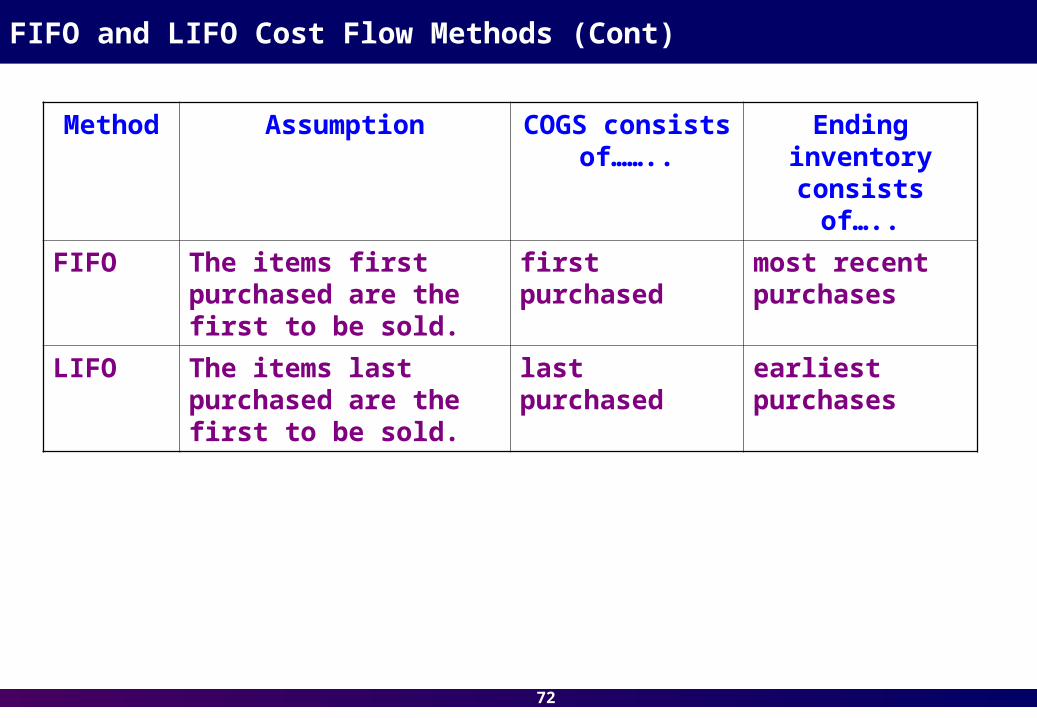
FIFO and LIFO Cost Flow Methods (Cont)
Method Assumption COGS consists of……..
Ending inventory
consists of…..
FIFO The items first purchased are the first to be sold.
first purchased most recent purchases
LIFO The items last purchased are the first to be sold.
last purchased earliest purchases
73
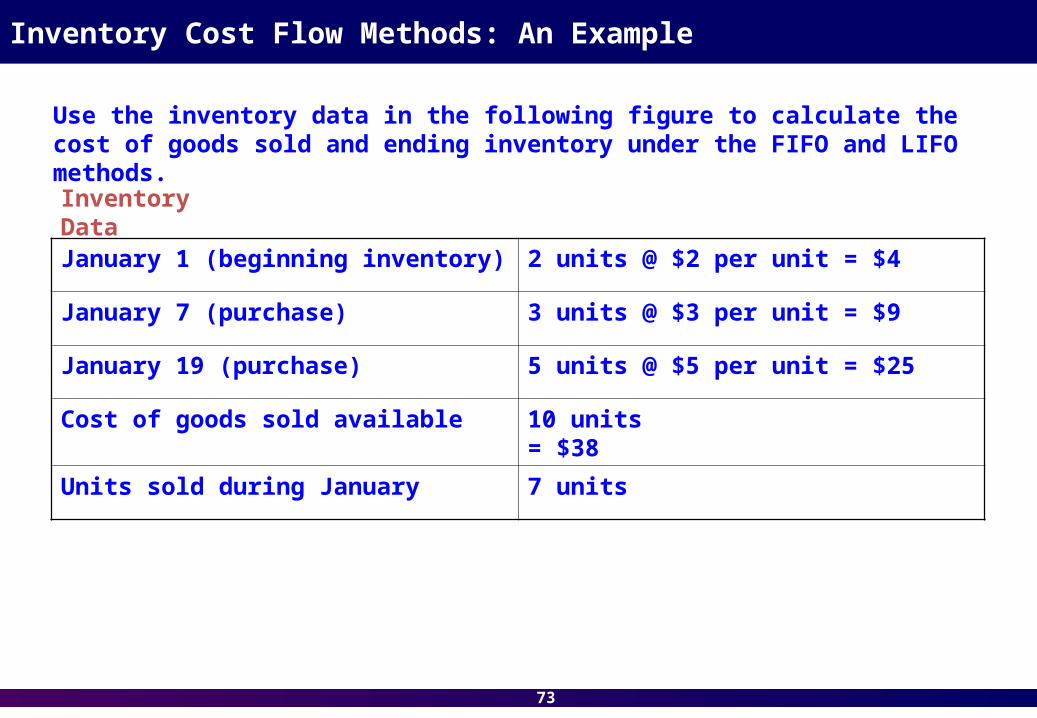
Inventory Cost Flow Methods: An Example
Use the inventory data in the following figure to calculate the cost of goods sold and ending inventory under the FIFO and LIFO methods.
Inventory Data
January 1 (beginning inventory) 2 units @ $2 per unit = $4
January 7 (purchase) 3 units @ $3 per unit = $9
January 19 (purchase) 5 units @ $5 per unit = $25
Cost of goods sold available 10 units = $38
Units sold during January 7 units
74
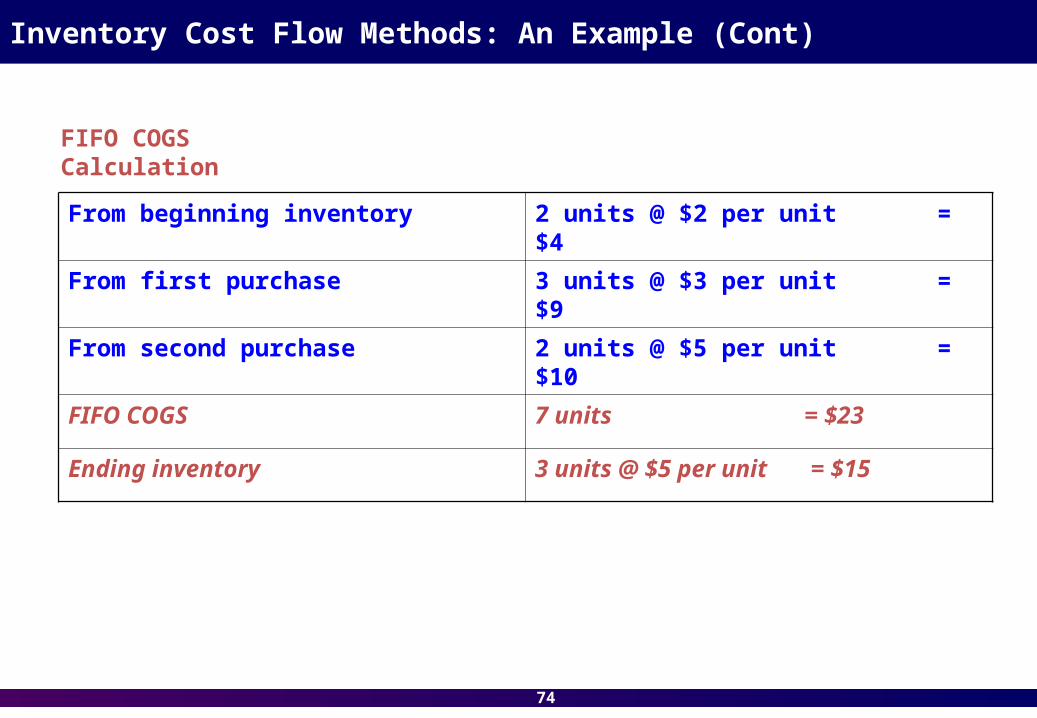
Inventory Cost Flow Methods: An Example (Cont)
FIFO COGS Calculation
From beginning inventory 2 units @ $2 per unit = $4
From first purchase 3 units @ $3 per unit = $9
From second purchase 2 units @ $5 per unit = $10
FIFO COGS 7 units = $23
Ending inventory 3 units @ $5 per unit = $15

75
Inventory Cost Flow Methods: An Example (Cont)
LIFO COGS Calculation
From second purchase 5 units @ $5 per unit = $25
From first purchase 2 units @ $3 per unit = $6
LIFO COGS 7 units = $31
Ending inventory 1 units @ $3 per unit + 2 units @$2 per unit = $7

76
LIFO and FIFO under Different Economic Environments
• In most economic environments, prices are rising. In those cases, inventory levels under the FIFO will be higher than levels under LIFO.
• COGS will be higher under LIFO than COGS under FIFO.
• When prices are stable, both FIFO and LIFO will produce the sane values for inventory and cost of goods sold.
• In periods of rising prices and stable or increasing inventory quantities:
LIFO results in………. FIFO results in…………..
Higher COGS Lower COGS
Lower taxes Higher taxes
Lower net income Higher net income
Lower inventory balances Higher inventory balances
Lower working capital Higher working capital
Higher cash flows (less taxes paid out) Lower cash flows (more taxes paid out)
77
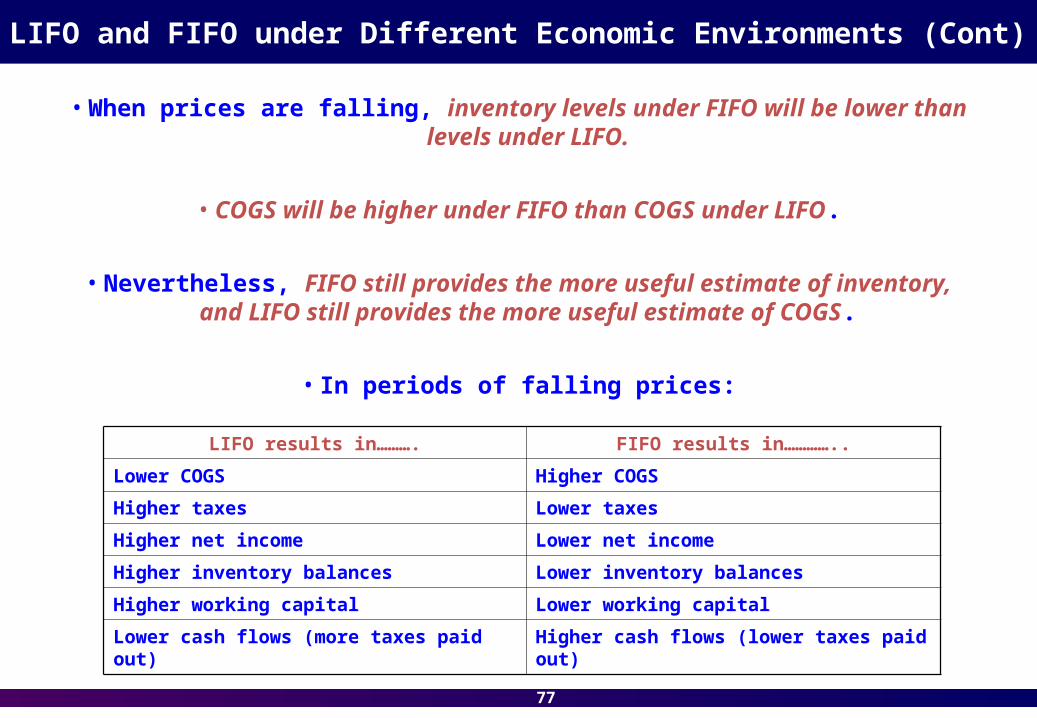
LIFO and FIFO under Different Economic Environments (Cont)
• When prices are falling, inventory levels under FIFO will be lower than levels under LIFO.
• COGS will be higher under FIFO than COGS under LIFO.
• Nevertheless, FIFO still provides the more useful estimate of inventory, and LIFO still provides the more useful estimate of COGS.
• In periods of falling prices:
LIFO results in………. FIFO results in…………..
Lower COGS Higher COGS
Higher taxes Lower taxes
Higher net income Lower net income
Higher inventory balances Lower inventory balances
Higher working capital Lower working capital
Lower cash flows (more taxes paid out) Higher cash flows (lower taxes paid out)

78
LIFO and FIFO and Their Impacts to Financial Ratios
A firm’s choice of inventory cost flow method can have a significant impact on
profitability, liquidity, activity and solvency.
Profitability
As compared to FIFO, LIFO produces higher COGS in the income statement and
will result in lower earnings. Any profitability measure that includes COGS will
be lower under LIFO. Higher COGS under LIFO will result in lower gross,
operating, EBIT and net profit margins compared to FIFO.
Liquidity
As compared to FIFO, LIFO results in a lower inventory value on the balance sheet. Since inventory (a current asset) is lower under LIFO, the current ratio, a popular measure of liquidity, is also lower under LIFO and under FIFO. Working capital (current assets-current liabilities) is also lower under LIFO as well because current assets are lower.
79
LIFO and FIFO and Their Impacts to Financial Ratios (Cont)
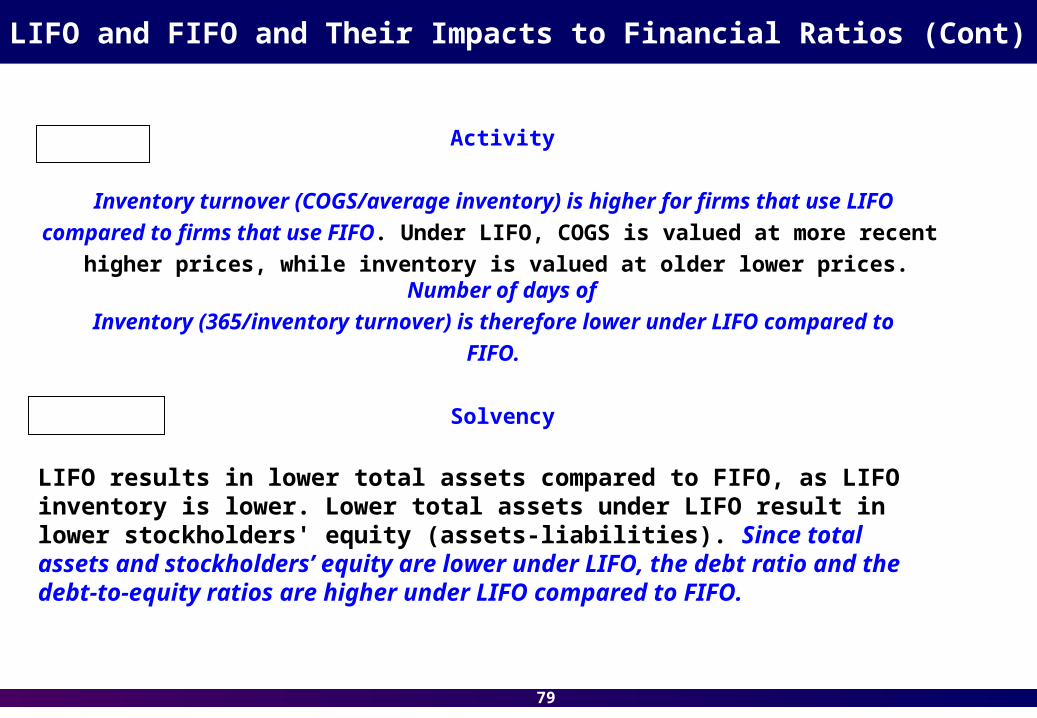
Activity
Inventory turnover (COGS/average inventory) is higher for firms that use LIFO
compared to firms that use FIFO. Under LIFO, COGS is valued at more recent
higher prices, while inventory is valued at older lower prices. Number of days of
Inventory (365/inventory turnover) is therefore lower under LIFO compared to
FIFO.
Solvency
LIFO results in lower total assets compared to FIFO, as LIFO inventory is lower. Lower total assets under LIFO result in lower stockholders' equity (assets-liabilities). Since total assets and stockholders’ equity are lower under LIFO, the debt ratio and the debt-to-equity ratios are higher under LIFO compared to FIFO.

80
Debt and Off-Balance-Sheet Financing

81
Learning Outcome Statements (LOS)
After completing this session, students should be able to:
1.explain key risks associated with bond investment.
2.determine the effects of financial and operating leases on the financial statements and ratios of the lessees.
82
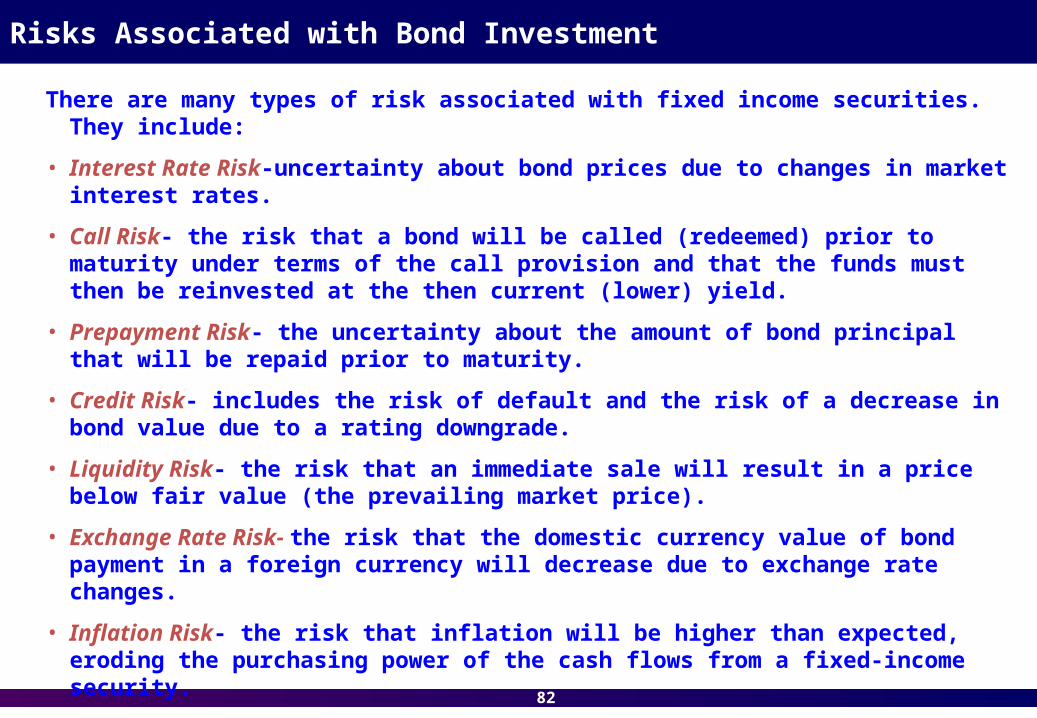
Risks Associated with Bond Investment
There are many types of risk associated with fixed income securities. They include:
• Interest Rate Risk-uncertainty about bond prices due to changes in market interest rates.
• Call Risk- the risk that a bond will be called (redeemed) prior to maturity under terms of the call provision and that the funds must then be reinvested at the then current (lower) yield.
• Prepayment Risk- the uncertainty about the amount of bond principal that will be repaid prior to maturity.
• Credit Risk- includes the risk of default and the risk of a decrease in bond value due to a rating downgrade.
• Liquidity Risk- the risk that an immediate sale will result in a price below fair value (the prevailing market price).
• Exchange Rate Risk- the risk that the domestic currency value of bond payment in a foreign currency will decrease due to exchange rate changes.
• Inflation Risk- the risk that inflation will be higher than expected, eroding the purchasing power of the cash flows from a fixed-income security.
• Event Risk- the risk of decreases in a security’s value from disasters, corporate restructurings or regulatory changes that negatively affect the firm.

83
Lease and Why It Is Important
• A lease is a contractual arrangement whereby the lessor, the owner of the asset, allows the lessee to use the asset for a specified period of time in return for periodic payments.
• Leases are classified as either operating leases or finance leases (capital leases).
• An operating lease is essentially a rental arrangement. No asset or liability is reported by the lessee and the periodic lease payments are simply recognized as rental expense in the income statement.
• A finance lease is, in substance, a purchase of an asset that is financed with debt. Thus, at the inception of the lease, the lessee will add equal amount to both assets and liabilities on the balance sheet. Over the term of the lease, the lessee will recognize depreciation expense on the asset and interest expense on the liability.

84
Benefits of Lease
Leasing can have certain benefits. They include
• Less costly financing. Typically, a lease requires no initial payment. Thus, the lessee conserves cash.
• Reduce risk of obsolescence. At the end of the lease, the asset can be returned to the lessor.
• Less Restrictive Provisions. Leases can provide more flexibility than other forms of financing as the lease agreement can be negotiated to better suit the circumstances of each party.
• Off-Balance-Sheet Financing. Operating leases do not require a liability to be entered on the balance sheet, improving leverage ratios compared to borrowing the funds to purchase the asset.
85
Operating Lease v.s. Finance (Capital) Lease
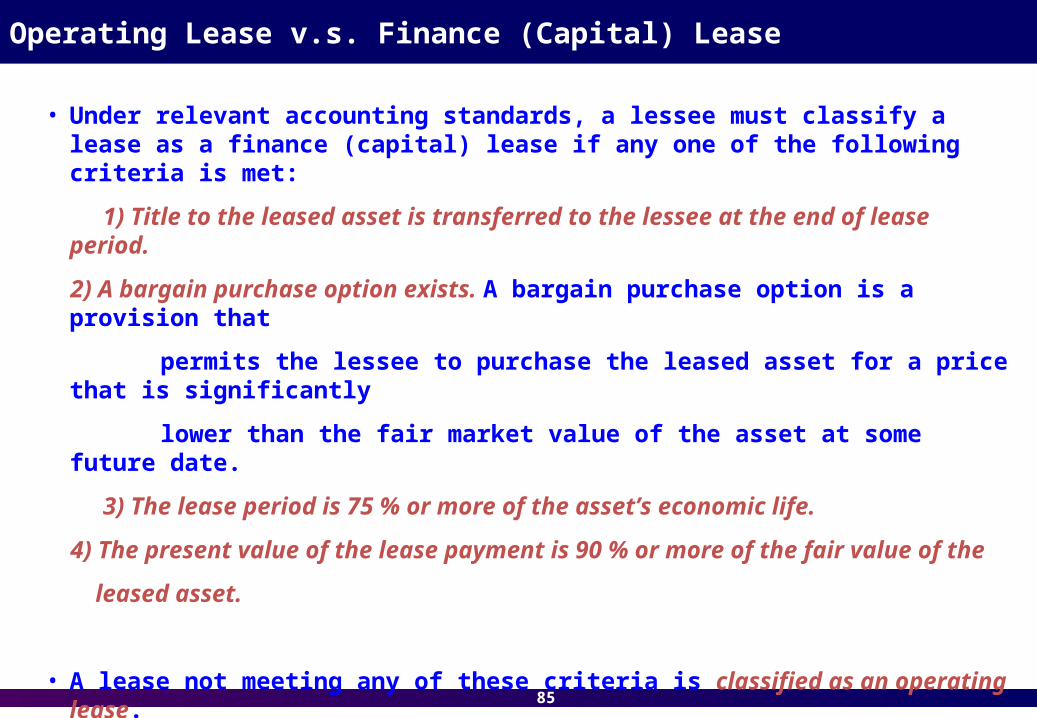
• Under relevant accounting standards, a lessee must classify a lease as a finance (capital) lease if any one of the following criteria is met:
1) Title to the leased asset is transferred to the lessee at the end of lease period.
2) A bargain purchase option exists. A bargain purchase option is a provision that
permits the lessee to purchase the leased asset for a price that is significantly
lower than the fair market value of the asset at some future date.
3) The lease period is 75 % or more of the asset’s economic life.
4) The present value of the lease payment is 90 % or more of the fair value of the
leased asset.
• A lease not meeting any of these criteria is classified as an operating lease.

86
Reporting by the Lessee
• At the inception of the lease, no entry is made. During the term of the lease, rent
expense, equal to the lease payment, is recognized in the lessee’s income statement. In the cash flow statement, the lease payment is reported as an outflow from operating activities.
Operating Lease
Finance Lease
• At the inception of the lease, the present value of future minimum lease payment is recognized as an asset and as a liability on the lessee’s balance sheet.
• Over the term of the lease, the asset is depreciated in the income statement and interest expense is recognized. Interest expense is equal to the lease liability at the begging of the period multiplied by the interest rate implicit in the lease.
87
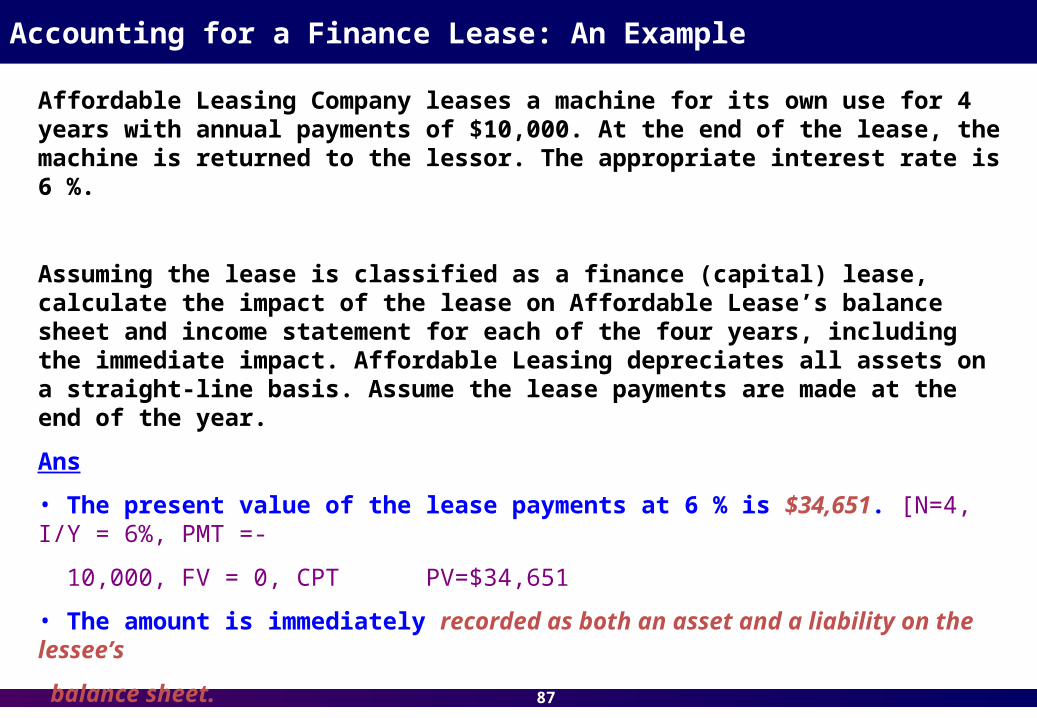
Accounting for a Finance Lease: An Example
Affordable Leasing Company leases a machine for its own use for 4 years with annual payments of $10,000. At the end of the lease, the machine is returned to the lessor. The appropriate interest rate is 6 %.
Assuming the lease is classified as a finance (capital) lease, calculate the impact of the lease on Affordable Lease’s balance sheet and income statement for each of the four years, including the immediate impact. Affordable Leasing depreciates all assets on a straight-line basis. Assume the lease payments are made at the end of the year.
Ans
• The present value of the lease payments at 6 % is $34,651. [N=4, I/Y = 6%, PMT =-
10,000, FV = 0, CPT PV=$34,651
• The amount is immediately recorded as both an asset and a liability on the lessee’s
balance sheet.
• Over the next 4 years, depreciation will be $34,651/4 = $8,663 per year. The book
value of the asset will decline each year by the depreciation expense.
88
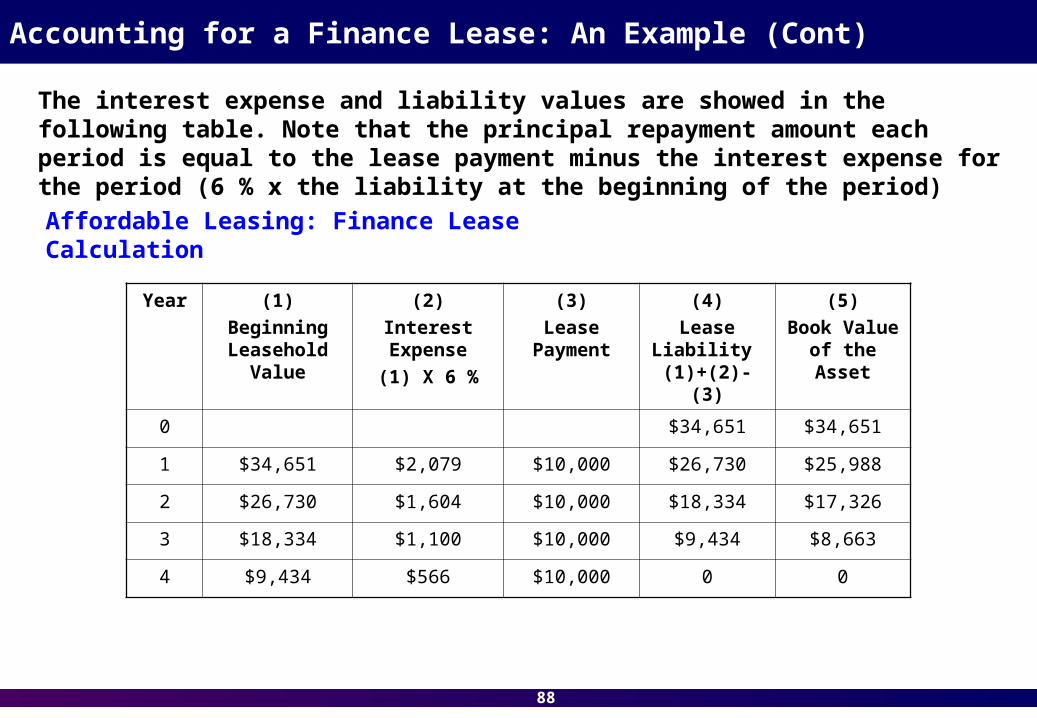
Accounting for a Finance Lease: An Example (Cont)
The interest expense and liability values are showed in the following table. Note that the principal repayment amount each period is equal to the lease payment minus the interest expense for the period (6 % x the liability at the beginning of the period)
Affordable Leasing: Finance Lease Calculation
Year (1)
Beginning Leasehold
Value
(2)
Interest Expense
(1) X 6 %
(3)
Lease Payment
(4)
Lease Liability (1)+(2)-(3)
(5)
Book Value of the Asset
0 $34,651 $34,651
1 $34,651 $2,079 $10,000 $26,730 $25,988
2 $26,730 $1,604 $10,000 $18,334 $17,326
3 $18,334 $1,100 $10,000 $9,434 $8,663
4 $9,434 $566 $10,000 0 0

89
Financial Statement and Ratio Effects of Operating and Financial Leases
• A finance lease results in an asset and a liability. Thus, turnover ratios that use total or fixed assets in their denominator will be lower when a lease is treated as
a finance lease rather than as an operating lease.
• Return on assets will also be lower for finance leases.
• Most importantly, leverage ratios such as debt-to-assets ratio and debt-to-equity ratio will be higher with finance leases due to the recorded liability.
• Since the liability for an operating lease does not appear on the lessee’s balance sheet, operating leases are sometimes referred to as off-balance-sheet financing
activities.
Effects to Balance Sheet

90
Financial Statement and Ratio Effects of Operating and Financial Leases (Cont)
• All else held constant, operating income (EBIT) will be higher for companies that use finance (capital) leases relative to companies that use operating leases. With an operating lease, the entire lease payment is recognized as an operating expense, while for a finance
lease, only the depreciation of the leased asset is treated as an operating expense.
• Let’s assume Affordable Leasing can treat the lease in the previous example as either an operating lease or a finance lease. Table below compares the income statement effects.
Effects to Income Statement
Year
Operating Lease
Finance Lease
Rent Expense Depreciation Interest Finance Lease Expense
1 $10,000 $8,663 $2,079 $10,742
2 $10,000 $8,663 $1,604 $10,267
3 $10,000 $8,663 $1,100 $9,763
4 $10,000 $8,663 $566 $9,229
$40,000 $40,000

91
Ratio Impact of Lease Accounting
Capital Lease Operating Lease
Current Ratio (CA/CL) Lower Higher
Working Capital (CA-CL) Lower Higher
Asset Turnover (Revenue/TA)
Lower Higher
Return on Assets (NI/TA) Lower Higher
Return on Equity (NI/SE) Lower Higher
Debt/Assets Higher Lower
Debt/Equity Higher Lower